PROBABILISTIC SEISMIC HAZARD ASSESSMENT OF …cistup.iisc.ac.in/presentations/Research...
24
1 PROBABILISTIC SEISMIC HAZARD ASSESSMENT OF KARNATAKA STATE Submitted to: CiSTUP Indian Institute of Science Bangalore 560 012 Investigator(s) from IISc: Prof. T. G. Sitharam Professor, Department of Civil Engineering, Indian Institute of Science, Bangalore ‐ 560012 Department of Civil Engineering, Indian Institute of Science, Bangalore 560 012 16, March 2011
Transcript of PROBABILISTIC SEISMIC HAZARD ASSESSMENT OF …cistup.iisc.ac.in/presentations/Research...

1
PROBABILISTIC SEISMIC HAZARD ASSESSMENT OF
KARNATAKA STATE
Submitted to:
CiSTUP Indian Institute of Science
Bangalore 560 012
Investigator(s) from IISc:
Prof. T. G. Sitharam
Professor, Department of Civil Engineering, Indian Institute of Science,
Bangalore ‐ 560012
Department of Civil Engineering, Indian Institute of Science,
Bangalore 560 012
16, March 2011
2
Centre for infrastructure, Sustainable Transport and Urban Planning Indian Institute of Science, Bangalore – 560 012
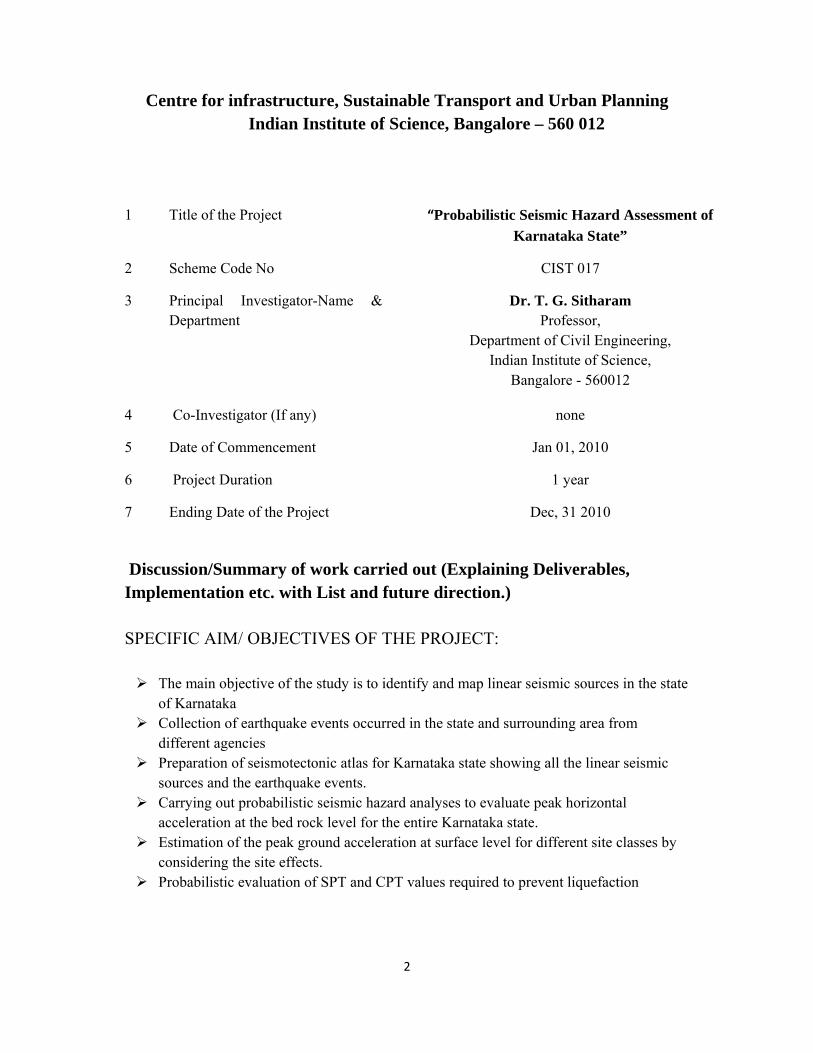
1 Title of the Project “Probabilistic Seismic Hazard Assessment of Karnataka State”
2 Scheme Code No CIST 017
3 Principal Investigator-Name & Department
Dr. T. G. Sitharam Professor,
Department of Civil Engineering, Indian Institute of Science,
Bangalore - 560012
4 Co-Investigator (If any) none
5 Date of Commencement Jan 01, 2010
6 Project Duration 1 year
7 Ending Date of the Project Dec, 31 2010
Discussion/Summary of work carried out (Explaining Deliverables, Implementation etc. with List and future direction.) SPECIFIC AIM/ OBJECTIVES OF THE PROJECT:
The main objective of the study is to identify and map linear seismic sources in the state of Karnataka
Collection of earthquake events occurred in the state and surrounding area from different agencies
Preparation of seismotectonic atlas for Karnataka state showing all the linear seismic sources and the earthquake events.
Carrying out probabilistic seismic hazard analyses to evaluate peak horizontal acceleration at the bed rock level for the entire Karnataka state.
Estimation of the peak ground acceleration at surface level for different site classes by considering the site effects.
Probabilistic evaluation of SPT and CPT values required to prevent liquefaction
3
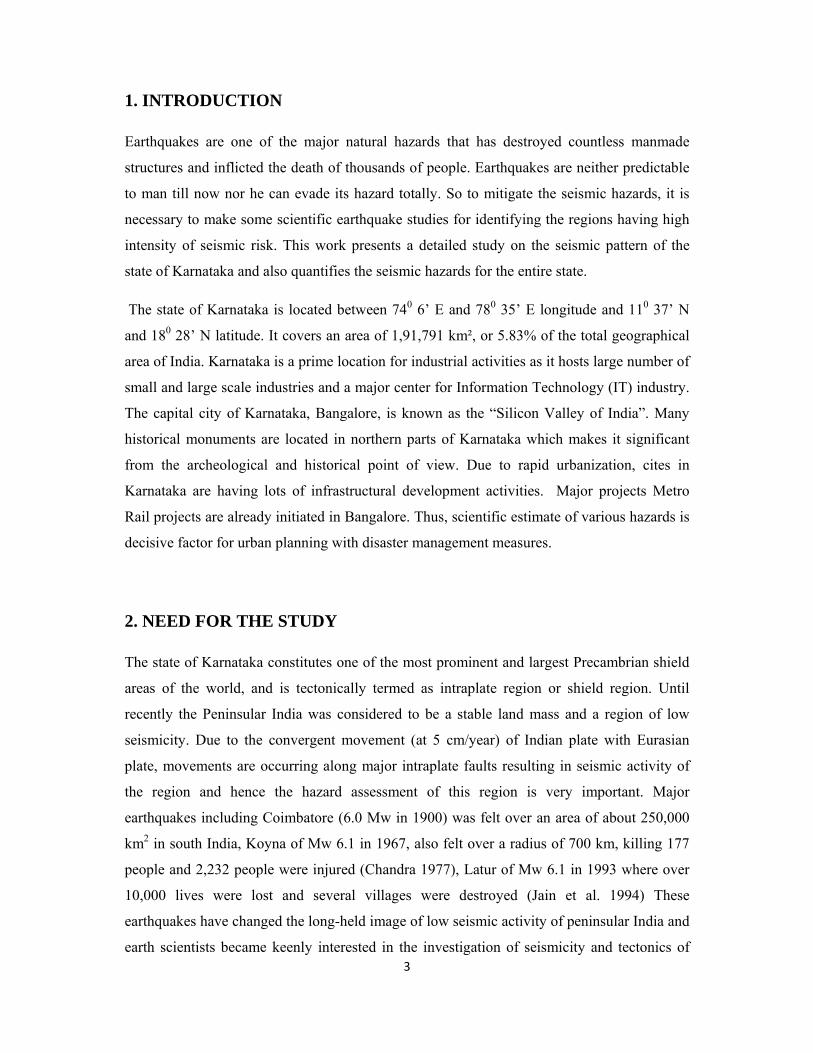
1. INTRODUCTION
Earthquakes are one of the major natural hazards that has destroyed countless manmade
structures and inflicted the death of thousands of people. Earthquakes are neither predictable
to man till now nor he can evade its hazard totally. So to mitigate the seismic hazards, it is
necessary to make some scientific earthquake studies for identifying the regions having high
intensity of seismic risk. This work presents a detailed study on the seismic pattern of the
state of Karnataka and also quantifies the seismic hazards for the entire state.
The state of Karnataka is located between 740 6’ E and 780 35’ E longitude and 110 37’ N
and 180 28’ N latitude. It covers an area of 1,91,791 km², or 5.83% of the total geographical
area of India. Karnataka is a prime location for industrial activities as it hosts large number of
small and large scale industries and a major center for Information Technology (IT) industry.
The capital city of Karnataka, Bangalore, is known as the “Silicon Valley of India”. Many
historical monuments are located in northern parts of Karnataka which makes it significant
from the archeological and historical point of view. Due to rapid urbanization, cites in
Karnataka are having lots of infrastructural development activities. Major projects Metro
Rail projects are already initiated in Bangalore. Thus, scientific estimate of various hazards is
decisive factor for urban planning with disaster management measures.
2. NEED FOR THE STUDY
The state of Karnataka constitutes one of the most prominent and largest Precambrian shield
areas of the world, and is tectonically termed as intraplate region or shield region. Until
recently the Peninsular India was considered to be a stable land mass and a region of low
seismicity. Due to the convergent movement (at 5 cm/year) of Indian plate with Eurasian
plate, movements are occurring along major intraplate faults resulting in seismic activity of
the region and hence the hazard assessment of this region is very important. Major
earthquakes including Coimbatore (6.0 Mw in 1900) was felt over an area of about 250,000
km2 in south India, Koyna of Mw 6.1 in 1967, also felt over a radius of 700 km, killing 177
people and 2,232 people were injured (Chandra 1977), Latur of Mw 6.1 in 1993 where over
10,000 lives were lost and several villages were destroyed (Jain et al. 1994) These
earthquakes have changed the long-held image of low seismic activity of peninsular India and
earth scientists became keenly interested in the investigation of seismicity and tectonics of

4
the region. Studies by Chandra (1977) points that some of these earthquakes were felt over a
much larger area than one would expect earthquakes of equivalent magnitude to be felt in
most other parts of the world. Iyengar et al. (1999) listed out major earthquakes that had
occurred in Peninsular India during Medieval time. From the regional earthquake data of two
decades (1978–1997), obtained from Gauribidanur seismic array, Gangrade et al. (2000) also
showed that seismicity of Indian Peninsular shield is higher than what was expected. Rao
(2000) showed that the increase in intraplate deformation in the lithosphere of the Indian
Peninsular shield and the strain rates for the Indian Shield as a whole is found to be the
second highest in stable continental region (SCR) of the world (the highest being the North
America). More over remote sensing studies by Ramasamy (2006) revealed that the southern
part of the Indian Peninsula is tectonically active due to the northerly to north–northeasterly
directed compressive force related to post collision tectonics. All these studies point to the
fact that Peninsular India, which is otherwise called stable continental region, should no
longer consider as a region of low seismicity. As the Karnataka state forms a part of
Peninsular India, its seismicity should be properly assessed through accurate seismic hazard
analysis and effective mitigation steps need to be taken.
3. SEISMIC HAZARD ANALYSIS METHODOLOGY
Seismic hazard at place refers to the peak ground acceleration (PGA) at that location
produced by single earthquake or contribution from multiple earthquakes of different
probabilities in magnitude and occurrence. Knowing the mass of the structure and the PGA
value at that location, engineers and designers can estimate the inertial force on to that
structure during an earthquake, which can be used for earthquake resistant designing of the
buildings. Seismic hazards for a place can be estimated using two methodologies; they are
Probabilistic Seismic Hazard Analysis (PSHA) and Deterministic Seismic Hazard Analysis
(DSHA). ). DSHA approach is event oriented, considering only a few (or sometimes only
one) earthquakes that are estimated to produce the most severe ground motion at a site.
Knowing the maximum magnitude that can occur at a source and the shortest distance
between that source and the site, the peak ground acceleration (PGA) at that site is estimated
using frequency dependent attenuation relation. Designs based on ground motion estimated
from DSHA will be on conservative side and hence suitable for critical structures like dams,
nuclear power plants etc. On the other hand, PSHA can incorporate the effect of different
5
events, bigger as well as smaller, on the hazard value at the site. Methodically DSHA is
straight forward and simple compared to PSHA where lot of uncertainties need to be
addressed. PSHA can successfully yield the seismic hazard values for various return periods
and helps designer to choose a particular hazard value corresponding to the structure’s life
span.
For evaluating seismic hazard for the state of Karnataka, probabilistic seismic hazard analysis
(PSHA) methodology was employed.
3.1 Steps in PSHA
Major steps in probabilistic seismic hazard analysis are as follows.
a. Preparation of earthquake catalogue for the study area
b. Identification of seismic sources
c. Preparation of seismotectonic atlas
d. Evaluation of regional recurrence relation
e. Performing hazard analysis and evaluation of seismic hazard
a) Preparation of earthquake catalogue for the study area:
In the present study the earthquake catalogue was prepared by extracting data from
different sources like, Indian Meteorological Department (IMD), National Geophysical
Research Institute (NGRI) Hyderabad, Gauribidanur Array- c/o BARC, Indira Gandhi Center
for Atomic Research (IGCAR) Kalpakkam etc and International agencies like United States
Geological Survey (USGS), International Seismological Centre (ISC) UK, Incorporated
Research Institutions for Seismology (IRIS), Northern California Earthquake Data Center
(NCEDC) etc. Earthquake events within 300 km radius from the political boundary of
Karnataka state were collected along with epicentral coordinates, focal depth, magnitude,
date, time, and year of occurrence. All events are converted into moment magnitude scale
(Mw) using suitable relations proposed by Scordilis (2006) and Heaton et al. (1986). The
intensity values were converted using the equation suggested by Reiter (1990).

6
These events are to be declustered so that the resulting data base is free from repetitive
events, foreshocks, aftershocks. After declustring there are about 1678 seismic events in the
study area and out of which 555 events are of magnitude 4 and above. All these events were
georeferenced and superimposed in the Karnataka map and this map was used in the future
studies (Fig.1)
Fig.1 Earthquake events having magnitude 4 and above in the study area
b) Identification of seismic sources:
The tectonic features of the study area like faults and lineaments were mapped from
Seismotectonic atlas (SEISAT, 2000) published by Geological Survey of India (GSI) and also
using satellite data. Sheets in SEISAT representing the features of study area were scanned

7
separately with 300 dpi (dots per inch) resolutions to get high quality digital images and these
were georeferenced using MapInfo Professional Version 6.0. After this, the tectonic features
were carefully picked and superimposed on to a map of study area.
Fig.2 Major faults and lineaments in the study area
In addition to referring Seisomotectonic atlas, the major lineaments (with length more than
100 km) of Karnataka State, South India were mapped using satellite data (Indian Remote
Sensing Satellite (IRS)-1D, Wide Field Sensor (WiFS) and Landsat Multi Spectral Scanner
(MSS)/Thematic Mapper (TM) data) on 1:1 million scale. This map was superimposed on
physical/road network map of Karnataka to eliminate any cultural lineament. The major
lineaments, which have some correlation with the occurrence of earthquakes, were identified
and shown in Fig. 2. All the lineaments / faults which were associated with earthquakes of
magnitude four and above were identified as active seismic sources. About 163 faults in the
study area ranging from 12 km to 531 km in length were identified and mapped

8
c) Preparation of seismotectonic atlas
A map of the study area along with the earthquake events and identified linear seismic
sources are shown in Fig. 3
Fig. 3: Seismotectonic map of south India
9
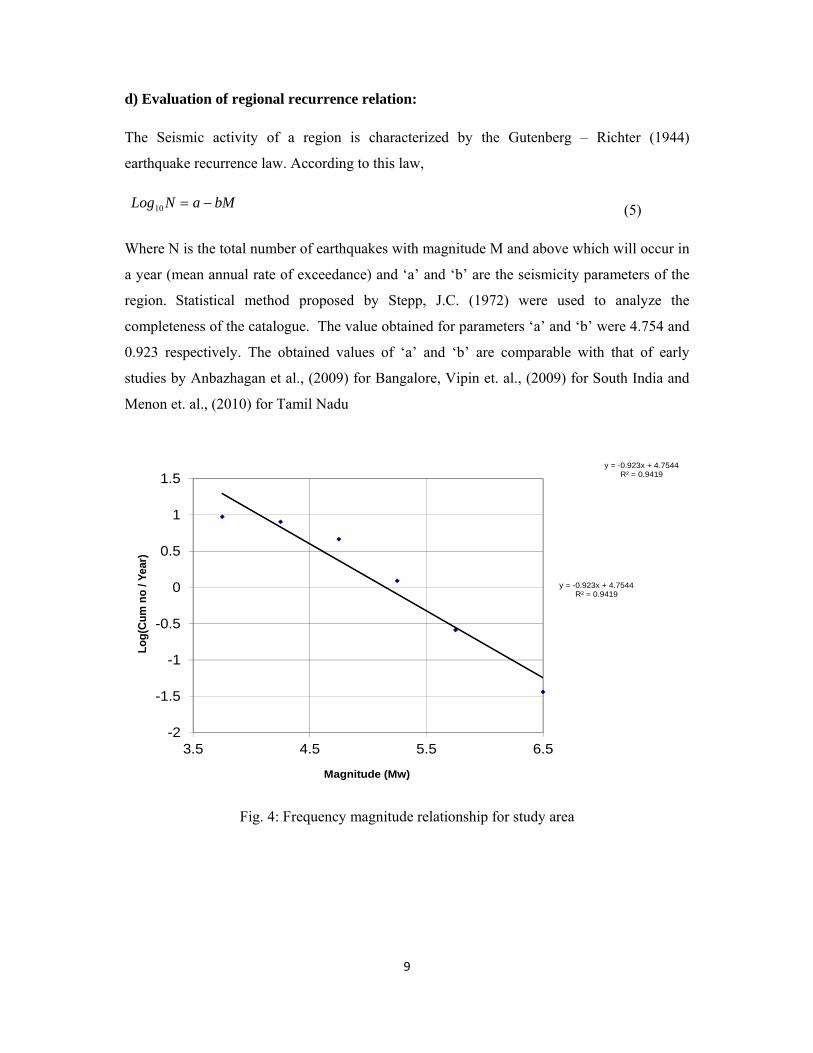
d) Evaluation of regional recurrence relation:
The Seismic activity of a region is characterized by the Gutenberg – Richter (1944)
earthquake recurrence law. According to this law,
bMaNLog −=10 (5)
Where N is the total number of earthquakes with magnitude M and above which will occur in
a year (mean annual rate of exceedance) and ‘a’ and ‘b’ are the seismicity parameters of the
region. Statistical method proposed by Stepp, J.C. (1972) were used to analyze the
completeness of the catalogue. The value obtained for parameters ‘a’ and ‘b’ were 4.754 and
0.923 respectively. The obtained values of ‘a’ and ‘b’ are comparable with that of early
studies by Anbazhagan et al., (2009) for Bangalore, Vipin et. al., (2009) for South India and
Menon et. al., (2010) for Tamil Nadu
y = -0.923x + 4.7544 R² = 0.9419
y = -0.923x + 4.7544 R² = 0.9419
-2
-1.5
-1
-0.5
0
0.5
1
1.5
3.5 4.5 5.5 6.5
Log(
Cum
no
/ Yea
r)
Magnitude (Mw)
Fig. 4: Frequency magnitude relationship for study area

10
e) Evaluation of ground motion:
Probabilistic seismic hazard analysis (PSHA) was initially developed by Cornell (1968).
PSHA also consider the uncertainties associated with time of occurrences of earthquakes and
its location. It also provides a frame work where these uncertainties can be combined
rationally to provide more complete picture of seismic hazard (Kramer 1996). In the
probabilistic approach, effects of all the earthquakes expected to occur at different locations
during a specified life period are considered along with associated uncertainties and
randomness of earthquake occurrences and attenuation of seismic waves with distance.
But PSHA only account for the uncertainties in the parameters of a particular seismic model
and the uncertainties involved in different models may make the selection of a seismic hazard
models difficult for this region. Thus the use of logic tree in PSHA (Fig.5) provides a
convenient framework for explicit treatment of model uncertainty.
Fig 5. Logic tree model employed for the analysis
Two types of seismic sources with equal weightage – linear sources and smoothed gridded
areal sources (Frankel 1995) were considered in the analysis. The hypocentral distance was

11
calculated by considering a focal depth of 15 km. A MATLAB program was developed to
evaluate the peak ground acceleration (PGA) at rock level for the entire state considering a
grid size of 0.05° x 0.05° (5 km X 5 km). The attenuation relations proposed by Toro et al.
(1997), Atkinson and Boore (2006) and Raghukanth and Iyengar (2007) were used in the
analysis with same weightages as in DSHA. Response spectra at rock level for important Tier
II cities and Bangalore in Karnataka were evaluated for 8 different periods of oscillations,
and the results are presented in this report.
4. EFFECT OF LOCAL SITE
The effect of local geology plays a significant role in changing the characteristic of seismic
wave. When earthquake waves when propagates from one medium to other, its properties like
frequency, amplitude, duration, etc. are affected, which is called Local site effect. For a vast
area like Karnataka state, PGA values for the entire study area for different site classes was
evaluated based on nonlinear site amplification technique from the PSHA.
Table 1: Site classification as per NEHRP scheme. (BSSC, 2003)
NHERP site class Description Vs30
A Hard rock > 1500 m/s > 1500 m/s
B Firm and hard rock 760 – 1500 m/s
C Dense soil, soft rock 360 – 760 m/s
D Stiff soil 180 – 360 m/s
E Soft clays, Liquefiable
soil
< 180 m/s
By assuming soil bed rock of the whole region belonging to site classes as per NEHRP based
average shear wave velocity for top 30m (Table 1), the ground motion at surface level for
each site is obtained by multiplying suitable amplification factors (Table 2) suggested for
peninsular India by Raghu Kanth and Iyengar (2007), to the bedrock motion.

12
Table 2: Values for regression coefficients the error term for various site classes (Raghu
Kanth and Iyengar 2007)
Site class a1 a2 ln δs
A 0.00 0.36 0.03
B 0.00 0.49 0.08
C -0.89 0.66 0.23
D -2.61 0.80 0.36
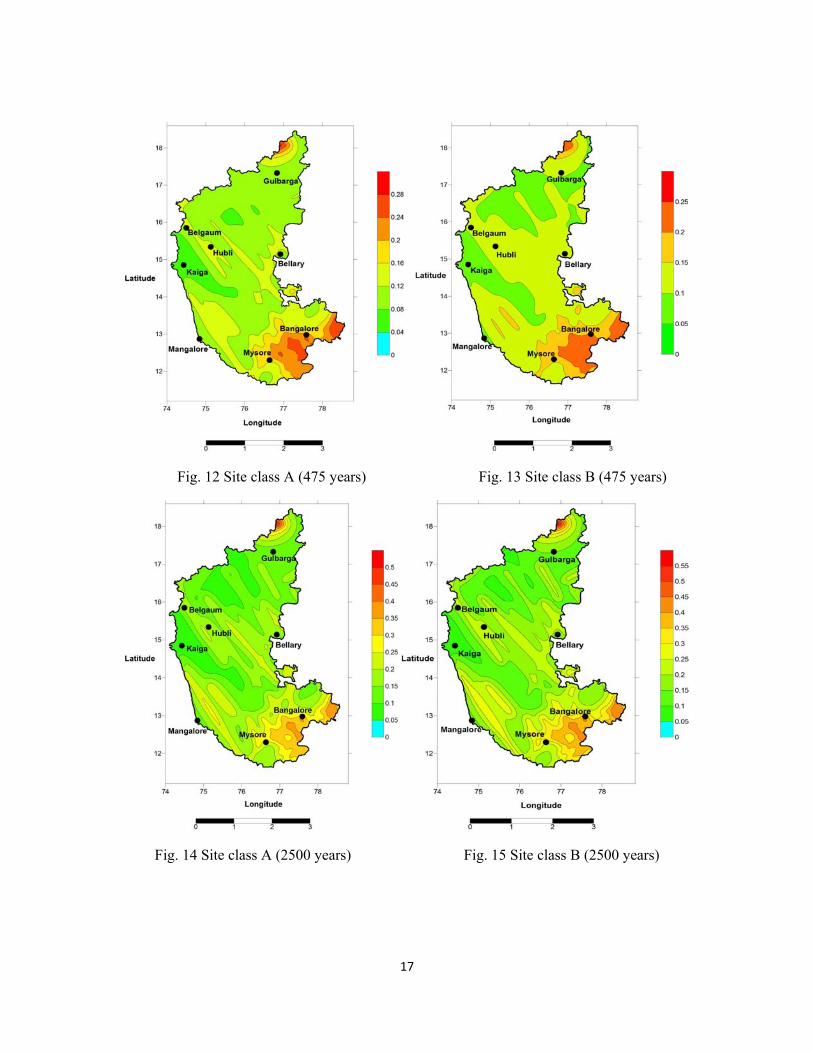
Figures 10 to 17 show the spatial variation of PGA values at ground level for various site
classes for a return period of 475 years and 2500 years.
5. PROBABILISTIC EVALUATION OF SPT AND CPT VALUES REQUIRED TO PREVENT LIQUEFACTION
Liquefaction potential of soil at a particular can be evaluated by laboratory and field testing.
It is very difficult to get an undisturbed soil sample from the field, laboratory testing becomes
uneconomical and unpractical in majority of the cases. Thus field testing is much easier way
of evaluating liquefaction procedure and in India the most popular field testing is standard
penetration test (SPT).
The evaluation of liquefaction potential involves two stages – (i) evaluation of earthquake
loading based on cyclic stress ratio (CSR) and (ii) evaluation of soil strength against
earthquake loading based on cyclic resistance ratio (CRR). Seed and Idriss (1971) suggested
a simplified of evaluating earthquake loading as per equation 1.
CSR = 0 .65(amax/g)(σvo/σ’vo)(rd/MSF) (2)
Where amax – peak ground acceleration (surface level for site class D); σvo and σ’vo – total
effective over burden pressure; rd - depth reduction factor used to account for the flexibility
of the soil and MSF - magnitude scaling factor (for quantifying the effect of earthquake
having magnitude other than Mw = 7.5). A performance based approach suggested by
Karmer and Mayfield (2007) where the contributions from all magnitudes and all acceleration
levels are considered. CRR was estimated in terms of SPT (N) values. The SPT resistance
13
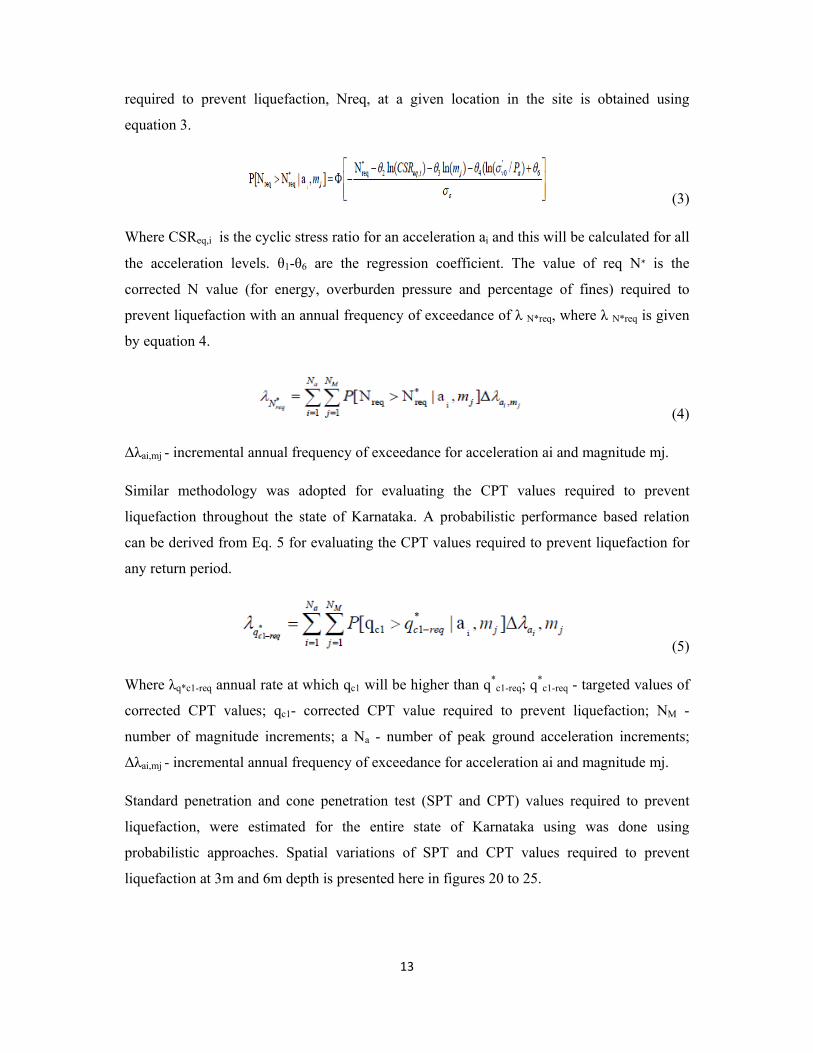
required to prevent liquefaction, Nreq, at a given location in the site is obtained using
equation 3.
(3)
Where CSReq,i is the cyclic stress ratio for an acceleration ai and this will be calculated for all
the acceleration levels. θ1-θ6 are the regression coefficient. The value of req N is the
corrected N value (for energy, overburden pressure and percentage of fines) required to
prevent liquefaction with an annual frequency of exceedance of λ N*req, where λ N*req is given
by equation 4.
(4)
Δλai,mj - incremental annual frequency of exceedance for acceleration ai and magnitude mj.
Similar methodology was adopted for evaluating the CPT values required to prevent
liquefaction throughout the state of Karnataka. A probabilistic performance based relation
can be derived from Eq. 5 for evaluating the CPT values required to prevent liquefaction for
any return period.
(5)
Where λq*c1-req annual rate at which qc1 will be higher than q*c1-req; q*
c1-req - targeted values of
corrected CPT values; qc1- corrected CPT value required to prevent liquefaction; NM -
number of magnitude increments; a Na - number of peak ground acceleration increments;
Δλai,mj - incremental annual frequency of exceedance for acceleration ai and magnitude mj.
Standard penetration and cone penetration test (SPT and CPT) values required to prevent
liquefaction, were estimated for the entire state of Karnataka using was done using
probabilistic approaches. Spatial variations of SPT and CPT values required to prevent
liquefaction at 3m and 6m depth is presented here in figures 20 to 25.
14
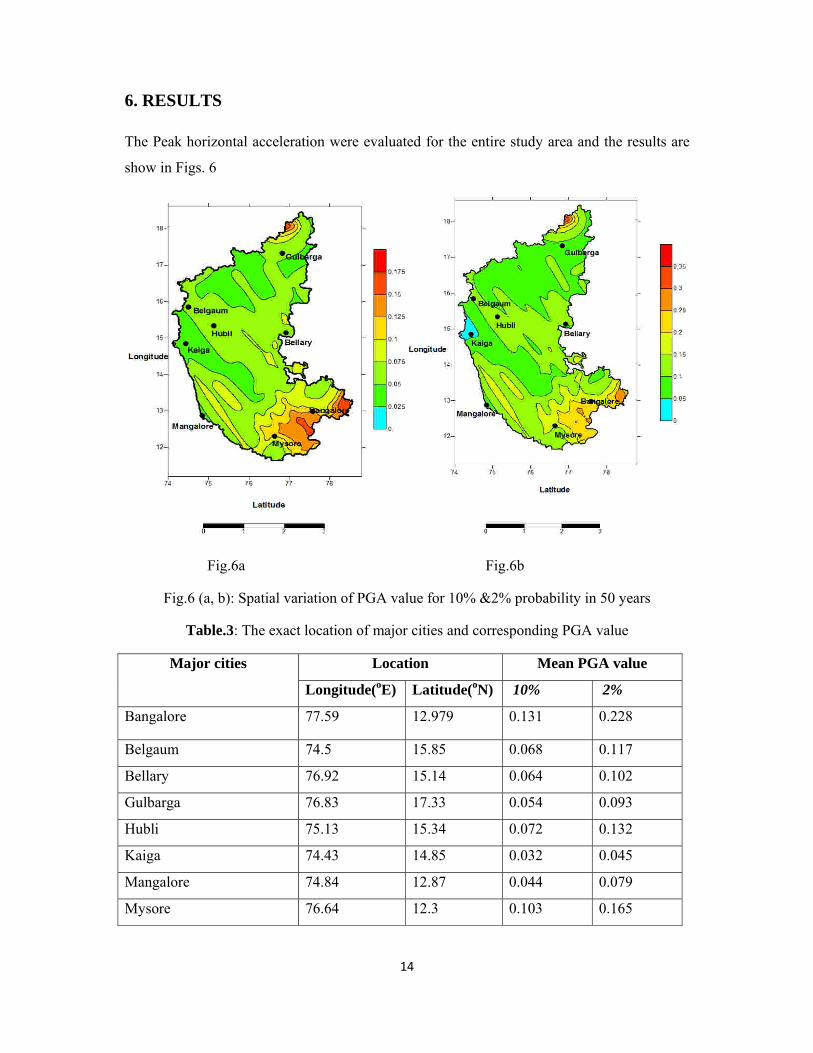
6. RESULTS
The Peak horizontal acceleration were evaluated for the entire study area and the results are
show in Figs. 6
Fig.6a Fig.6b
Fig.6 (a, b): Spatial variation of PGA value for 10% &2% probability in 50 years
Table.3: The exact location of major cities and corresponding PGA value
Major cities Location Mean PGA value
Longitude(oE) Latitude(oN) 10% 2%
Bangalore 77.59 12.979 0.131 0.228
Belgaum 74.5 15.85 0.068 0.117
Bellary 76.92 15.14 0.064 0.102
Gulbarga 76.83 17.33 0.054 0.093
Hubli 75.13 15.34 0.072 0.132
Kaiga 74.43 14.85 0.032 0.045
Mangalore 74.84 12.87 0.044 0.079
Mysore 76.64 12.3 0.103 0.165

15
Fig.7: Response spectrum for important cities in Karnataka (return period 475 years)
Fig.8: Response spectrum for important cities in Karnataka (return period 2500 years)
16
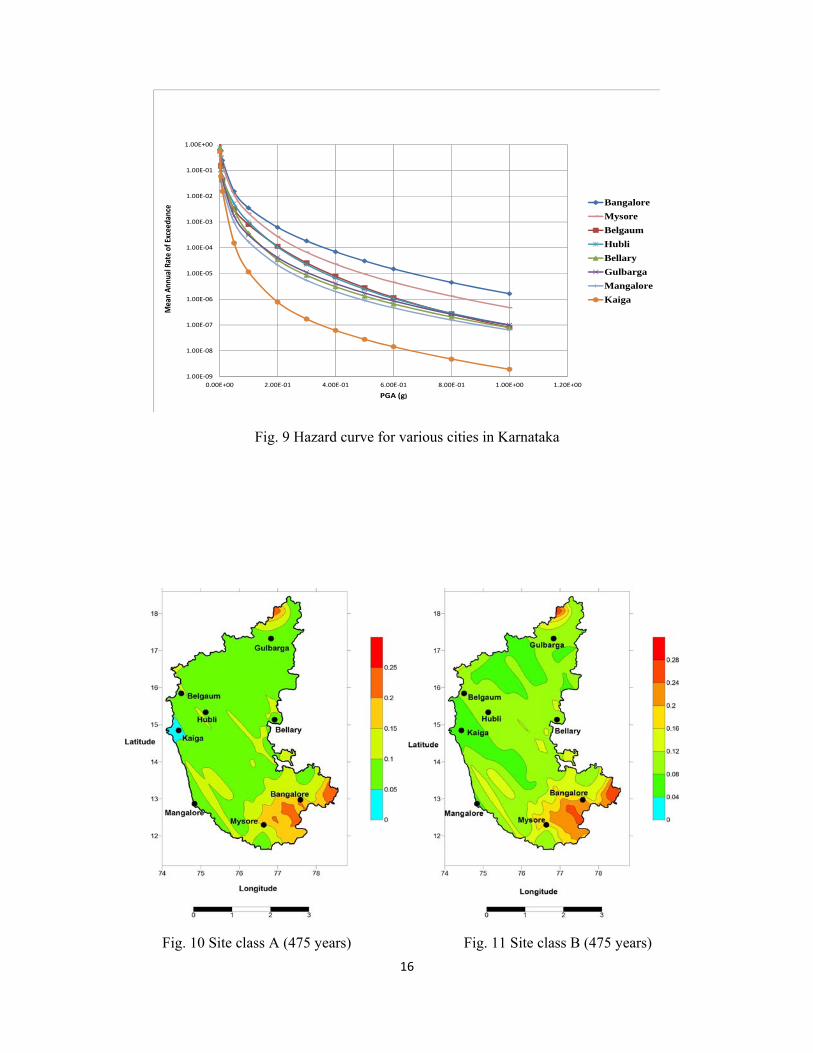
1.00E‐09
1.00E‐08
1.00E‐07
1.00E‐06
1.00E‐05
1.00E‐04
1.00E‐03
1.00E‐02
1.00E‐01
1.00E+00
0.00E+00 2.00E‐01 4.00E‐01 6.00E‐01 8.00E‐01 1.00E+00 1.20E+00
Mean An
nual Rate of Exceeda
nce
PGA (g)
BangaloreMysoreBelgaumHubliBellaryGulbargaMangaloreKaiga
Fig. 9 Hazard curve for various cities in Karnataka
Fig. 10 Site class A (475 years) Fig. 11 Site class B (475 years)
17
Fig. 12 Site class A (475 years) Fig. 13 Site class B (475 years)
Fig. 14 Site class A (2500 years) Fig. 15 Site class B (2500 years)

18
Fig. 16 Site class A (2500 years) Fig. 17 Site class B (2500 years)
Fig. 20 at 3m depth Fig. 21 at 6m depth
SPT values required to prevent liquefaction for a return period of 2500 years

19
Fig. 22 at 3m depth Fig. 23 at 6m depth
CPT values (MPa) required to prevent liquefaction for return period of 475 years
Fig. 24 at 3m depth Fig. 25 at 8m depth
CPT values (MPa) required to prevent liquefaction for a return period of 2500 years

20
7. CONCLUSIONS
Major conclusions from the hazard studies are given below.
Spatial variations of PGA values from probabilistic are shown in this report.
From probabilistic analysis, places in Bidar district have hazard values ranging above
0.14g for a return period of 475 years and 0.3g above for a return period of 2500 years.
Moreover from the site response studies, this region is expected to have a PGA value up to
0.25g for 475 year return period and 0.55g for 2500 year return period. These regions are
very much close to Latur fault that has produced an earthquake of magnitude 6.1 in 1993.
Places between Bangalore and Mysore also found to have significant value of PGA of
above 0.1g and for critical case it can go up to 0.25g also. Hazard at ground level by
considering results from different site classes, can have value 0.25g for 475 year return
period and 0.4g for a return period of 2500 years.
Analysis also shows for Mangalore – Udupi regions, a hazard value up to 0.08g at rock
level for return period of 475 year and can go up to 0.2g for 2500 year return period above.
Hazard at the surface level is expected to have 0.1g to 0.15g for 475 year return period and
0.2g to 0.25g for 2500 year return period.
Hazard analysis also points out interior regions in Karnataka having low hazard value of
around 0.04g for both return periods. Kaiga, which is the location for nuclear power plant
has the least value of hazard, compared other cities. Hence it’s best suited for critical
structures like nuclear structures.
Response spectra of some important cities in Karnataka are also presented. From
probability analysis a hazard curve is also presented for each city in Karnataka. Using this
hazard curve, hazard value for any return period can be estimated.
The PHA values obtained in the present study matches well with the values obtained by
other researchers for different parts of the study area
Liquefaction hazard analysis shows that Bangalore – Mysore region and the Bidar region
has the highest liquefaction. In these regions, SPT value of more than 10 for 475 year
return period and 15 for 2500 year return period is required to prevent liquefaction at 3m

21
and 6m depth. CPT values, to prevent liquefaction in these areas are also high at 3m (9 to
13 MPa) and 6m depth (8 to 11MPa).
Regions near Mangalore – Udupi have moderate liquefaction hazard and required SPT
value of more than 5 for 475 year return period to 10 for 2500 year return period is
required to prevent liquefaction at 3m and 6m depth.
The interior parts of Karnataka have the lowest liquefaction hazard, with required SPT
value of less than 5 for 475 year return period and more than 5 for 2500 year return period
is required to prevent liquefaction at 3m and 6m depth.
8. MAJOR ACIEVEMENTS
Identify and map linear seismic sources in the state of Karnataka is done
Earthquake events occurred in the state and surrounding area from different agencies were collected and compiled
Preparation of seismotectonic atlas for Karnataka state showing all the linear seismic sources and the earthquake events was done
Probabilistic seismic hazard analysis was carried out to evaluate peak horizontal acceleration at the bed rock level for the entire Karnataka state.
Peak ground acceleration at surface level for different site classes by considering the site effects was done using nonlinear site amplification technique
Probabilistic evaluation of SPT and CPT values required to prevent liquefaction for the entire state of Karnataka was done
22
9. REFERENCES 1. Anbazhagan P, Vinod, J S, and Sitharam T G (2009). “Probabilistic seismic hazard
analysis for Bangalore.” Journal of Natural Hazards, 48, 145 - 166.
2. Atkinson, G.M. and Boore, D.M. (2006). “Earthquake Ground-Motion prediction
equations for Eastern North America.” Bulletin of the Seismological Society of America,
96(6), 2181 - 2205.
3. BIS-1893 (2002). “Indian Standard criteria for earthquake resistant design of structures,
Part 1 - General provisions and buildings.” Bureau of Indian Standards, New Delhi.
4. Chandra U (1977). “Earthquakes of Peninsular India--A Seismotectonic Study.” Bulletin
of the Seismological Society of America, 67(5), 1387-1413
5. Cornell CA (1968) Engineering seismic risk analysis; Bulletin of the Seismological
Society of America, 58,1583–1606
6. Frankel A, 1995 Mapping seismic hazard in the Central Eastern United States;
Seismological Research Letters, 66(4), 8 - 21.
7. Gangrade B K and Arora S K 2000 Seismicity of the Indian Peninsular Shield from
regional earthquake data; Pure and Applied Geophysics, 157, 1683 – 1705.
8. Gutenberg B and Richter C F, 1944 Frequency of earthquakes in California; Bulletin of
the Seismological Society of America, 34, 185 - 188.
9. Heaton T H, Tajima T F and Mori A W (1986). “Estimating Ground motions using
recorded accelerograms.” Surveys in Geophysics, 8, 25 - 83.
10. Iyengar R N, Sharama D and Siddiqui J M (1999). “Earthquake History of India in
Medieval Times.” Indian Journal of History of Science, 34(3), 181-237.
11. Jain S.K, Murty C V R, Chandak N, Seeber L and Jain N K (1994). “The September 29,
1993, M6.4 Killari, Maharashtra Earthquake in Central India.” EERI Special Earthquake
Report, EERI Newsletter, 28(1).
12. Kramer S L (1996). “Geotechnical Earthquake Engineering” Pearson Education Pvt.
Ltd, Reprinted 2003, Delhi, India.
13. Kramer, S.L., Mayfield, R.T. (2007). “Return period of soil liquefaction.” Journal of
Geotechnical and Geoenvironmental Engineering, 133(7), 802 -813.
23
14. Menon A, Ornthammarath T, Corigliano M and Lai C G (2010). “Probabilistic Seismic
Hazard Macrozonation of Tamil Nadu in Southern India.” Bulletin of the Seismological
Society of America, 100(3), 1320–1341
15. Raghu Kanth, S.T.G. and Iyengar, R.N. (2007). “Estimation of seismic spectral
acceleration in Peninsular India.” Journal of Earth System Sciences, 116(3), 199 – 214
16. Ramalingeswara Rao B (2000). “Historical seismicity and deformation rates in the
Indian peninsular shield.” Journal of Seismology, 4, 247 – 258.
17. Ramasamy S M (2006). “Remote sensing and active tectonics of South India.”
International Journal of Remote Sensing, Vol. 27, No. 20, 4397–4431
18. Scordilis E M (2006). “Empirical global relations converting Ms and mb to moment
magnitude.” Journal of Seismology, 10, 225 – 236.
19. Seed, H.B. and Idriss, I.M. (1971) “Simplified procedure for evaluating soil liquefaction
potential.” Journal of Soil Mechanics and Foundation, 97, 1249-1273
20. SEISAT (2000). “Seismotectonic Atlas of India.” Geological Survey of India, New
Delhi.
21. Stepp J C (1972). “Analysis of the completeness of the earthquake sample in the Puget
Sound area and its effects on statistical estimates of earthquakes hazard.” Proc. Inter.
Conf. Microzonation for safer construct. Res. Appl., Seattle, Washington, 64(4), 1189 -
1207.
22. Toro, G.N., Abrahamson, N. and Schneider, J. (1997). “Model of strong ground motions
from earthquakes in central and eastern North America: Best estimates and
uncertainties.” Seismological Research Letters, 68, 41 - 57.
23. Vipin K.S (2010). “Assessment of Seismic Hazard with Local Site Effects: Deterministic
and Probabilistic Approaches” PhD Thesis IISc Bangalore.
24. Vipin K. S, Anbazhagan P and Sitharam T. G (2009). “Estimation of peak ground
acceleration and spectral accelerationfor South India with local site effects: probabilistic
approach.” Natural Hazards Earth System Science., 9, 865–878, 2009

24
10. PUBLICATIONS OUT OF THIS WORK
Journal Paper
1. Sitharam T.G., James N., Vipin K.S and Ganesha Raj K (2010). “A Study On
Seismicity And Seismic Hazards For The Karnataka State” Journal of Earth System
and Sciences (manuscript submitted on 20/11/2010)
Conference Papers
1. Sitharam T.G., James N and Vipin K.S (2010). “Seismic Hazard Map for the State of
Karnataka with Local Site Effects: Probabilistic Seismic Hazard Analysis.” 14th
Symposium on Earthquake Engineering 2010 at IIT Roorkee
2. Sitharam T.G., James N and Vipin K.S (2010). “Seismic Hazard Map for the State of
Karnataka with Local Site Effects: Deterministic Seismic Hazard Analysis.” Indian
Geotechnical Conference IIT Bombay
3. James N, Kolathayar S, Vipin K.S and Sitharam T.G (2010). “Seismic Hazard
Scenario of Karnataka State: An Input for Planning of Urban Centers.” Conference on
Infrastructure, Sustainable Transportation And Urban Planning CiSTUP, IISc,
Bangalore.
16 March 2011 11. Signature of the Principal Investigator/Investigator.