Probabilistic Aspects of Fatigue -...
64
Case Studies Professor Darrell F. Socie Department of Mechanical Science and Engineering University of Illinois at Urbana-Champaign © 2003-2012 Darrell Socie, All Rights Reserved Probabilistic Aspects of Fatigue
Transcript of Probabilistic Aspects of Fatigue -...

Case Studies
Professor Darrell F. SocieDepartment of Mechanical Science and Engineering
University of Illinois at Urbana-Champaign
© 2003-2012 Darrell Socie, All Rights Reserved
Probabilistic Aspects of Fatigue

6 Case Studies © 2003-2012 Darrell Socie, University of Illinois at Urbana-Champaign, All Rights Reserved 1 of 62
Probabilistic Aspects of Fatigue
Introduction Basic Probability and Statistics Statistical Techniques Analysis Methods Characterizing VariabilityCase Studies FatigueCalculator.comGlyphWorks

6 Case Studies © 2003-2012 Darrell Socie, University of Illinois at Urbana-Champaign, All Rights Reserved 2 of 62
Case Studies
DARWINSouthwest Research
Bicycle Loading Histories

6 Case Studies © 2003-2012 Darrell Socie, University of Illinois at Urbana-Champaign, All Rights Reserved 3 of 62
A Software Framework for Probabilistic Fatigue Life Assessment
ASTM Symposium on Probabilistic Aspects of Life Prediction
Miami Beach, FloridaNovember 6-7, 2002
R. C. McClung, M. P. Enright, H. R. Millwater*, G. R. Leverant, and S. J. Hudak, Jr.
Southwest Research
Slides 6 – 27 used with permission of of Craig McClung

6 Case Studies © 2003-2012 Darrell Socie, University of Illinois at Urbana-Champaign, All Rights Reserved 4 of 62
Motivation

6 Case Studies © 2003-2012 Darrell Socie, University of Illinois at Urbana-Champaign, All Rights Reserved 5 of 62
UAL Flight 232July 19,1989

6 Case Studies © 2003-2012 Darrell Socie, University of Illinois at Urbana-Champaign, All Rights Reserved 6 of 62
Turbine Disk FailureAnomalies in titanium engine disks
Hard AlphaVery rareCan cause failureNot addressed by safe life methods
Enhanced life management processRequested by FAADeveloped by engine industryProbabilistic damage tolerance methodsSupplement to safe life approach
SwRI and engine industry developed DARWIN with FAA funding

6 Case Studies © 2003-2012 Darrell Socie, University of Illinois at Urbana-Champaign, All Rights Reserved 7 of 62
Probabilistic Damage Tolerance
Probabilistic Fracture Mechanics
Probability of DetectionAnomaly Distribution
Finite Element Stress Analysis
Material Crack Growth Data
NDE Inspection Schedule
Pf vs. Cycles
Risk Contribution Factors

6 Case Studies © 2003-2012 Darrell Socie, University of Illinois at Urbana-Champaign, All Rights Reserved 8 of 62
Zone-Based Risk Assessment
Define zones based on similar stress, inspection, anomaly distribution, lifetime
Total probability of fracture for zone:(probability of having a defect) x (POF given
a defect)Defect probability determined by anomaly
distribution, zone volumePOF assuming a defect computed with
Monte Carlo sampling or advanced methods
POF for disk obtained by summing zone probabilities
As individual zones become smaller (number of zones increases), risk converges down to “exact” answer
1
2 3 4
m
5 6 7

6 Case Studies © 2003-2012 Darrell Socie, University of Illinois at Urbana-Champaign, All Rights Reserved 9 of 62
Fracture Mechanics Model of Zone
m
7
Retrieve stresses along line
Fracture Mechanics Model
hx
hy
x
Y
grad
ient
dire
ctio
n
1
2
3
4
5
Defect
Finite Element Model
(Not to Scale)
6 Case Studies © 2003-2012 Darrell Socie, University of Illinois at Urbana-Champaign, All Rights Reserved 10 of 62
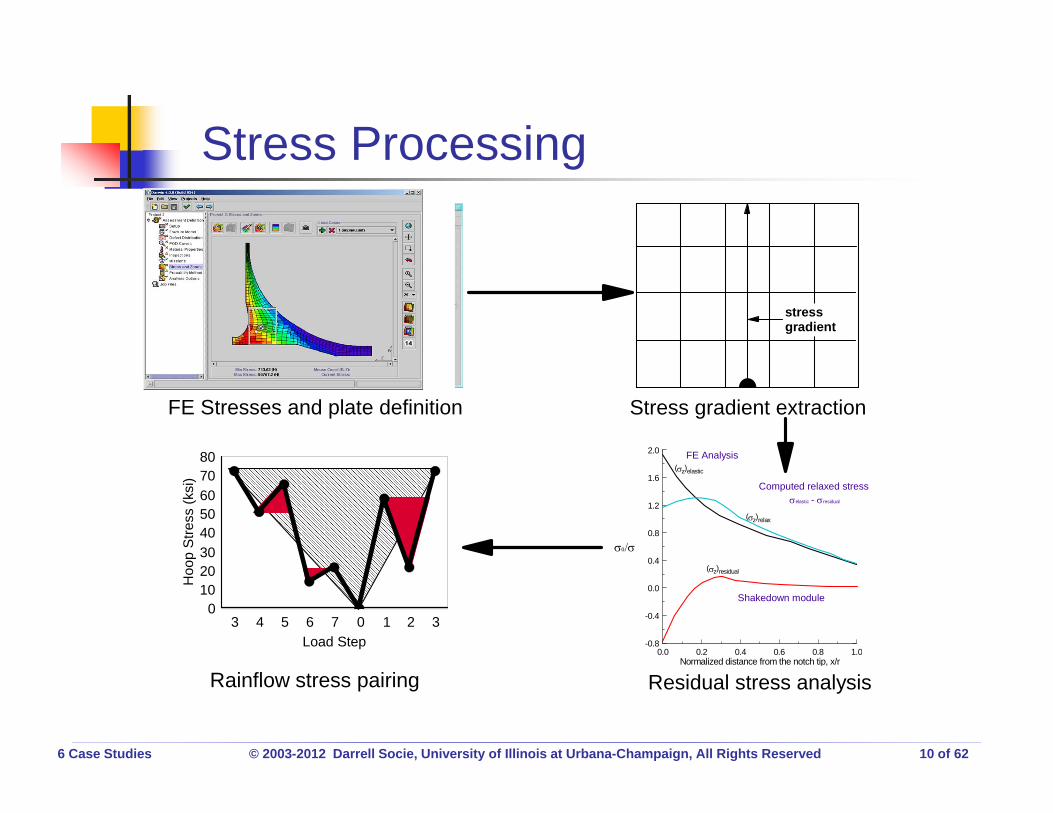
Stress Processing
FE Stresses and plate definition
stress gradient
Stress gradient extraction
FE Analysis
0.0 0.2 0.4 0.6 0.8 1.0Normalized distance from the notch tip, x/r
-0.8
-0.4
0.0
0.4
0.8
1.2
1.6
2.0
/o
(z)relax
(z)residual
(z)elastic
Shakedown module
Computed relaxed stresselastic - residual
Residual stress analysis
3 4 5 6 7 0 1 2 3Load Step
01020304050607080
Hoo
p S
tress
(ksi
)
Rainflow stress pairing

6 Case Studies © 2003-2012 Darrell Socie, University of Illinois at Urbana-Champaign, All Rights Reserved 11 of 62
Anomaly Distribution# of anomalies per volume of material as function of defect size
Library of default anomaly distributions for HA (developed by RISC)
6 Case Studies © 2003-2012 Darrell Socie, University of Illinois at Urbana-Champaign, All Rights Reserved 12 of 62
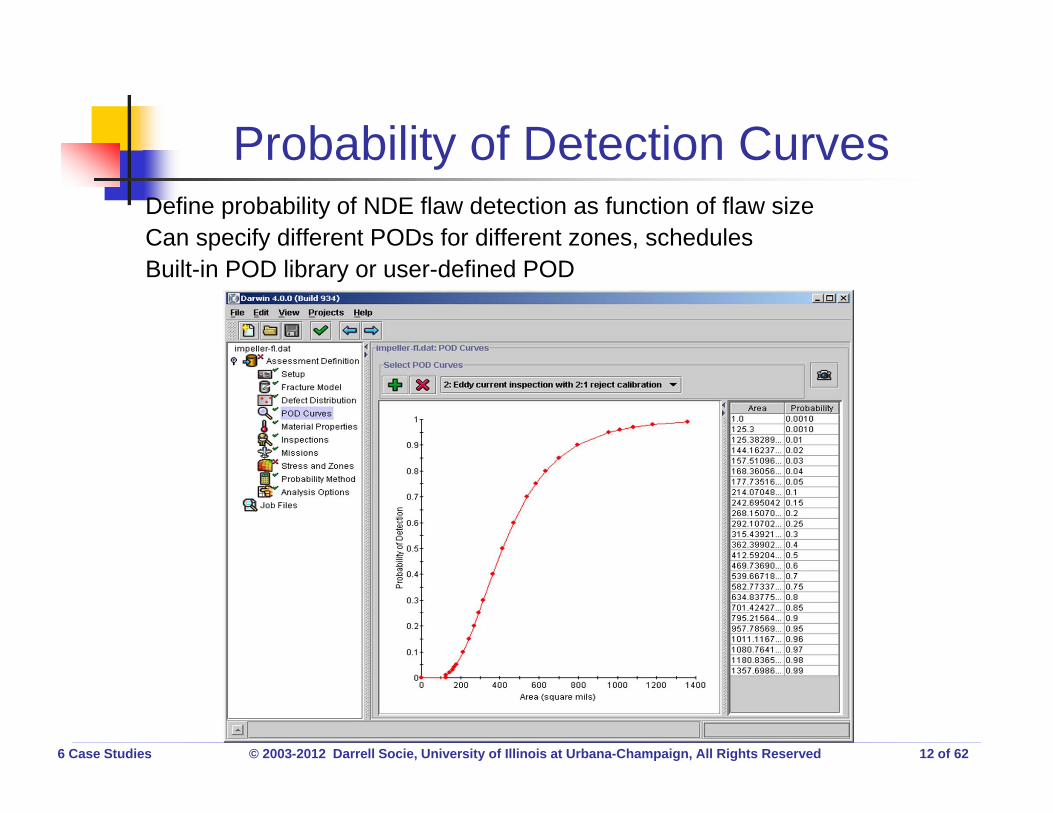
Probability of Detection CurvesDefine probability of NDE flaw detection as function of flaw sizeCan specify different PODs for different zones, schedulesBuilt-in POD library or user-defined POD

6 Case Studies © 2003-2012 Darrell Socie, University of Illinois at Urbana-Champaign, All Rights Reserved 13 of 62
Random Inspection Time“Opportunity Inspections” during on-condition maintenance
Inspection time modeled with Normal distribution or CDF table
6 Case Studies © 2003-2012 Darrell Socie, University of Illinois at Urbana-Champaign, All Rights Reserved 14 of 62
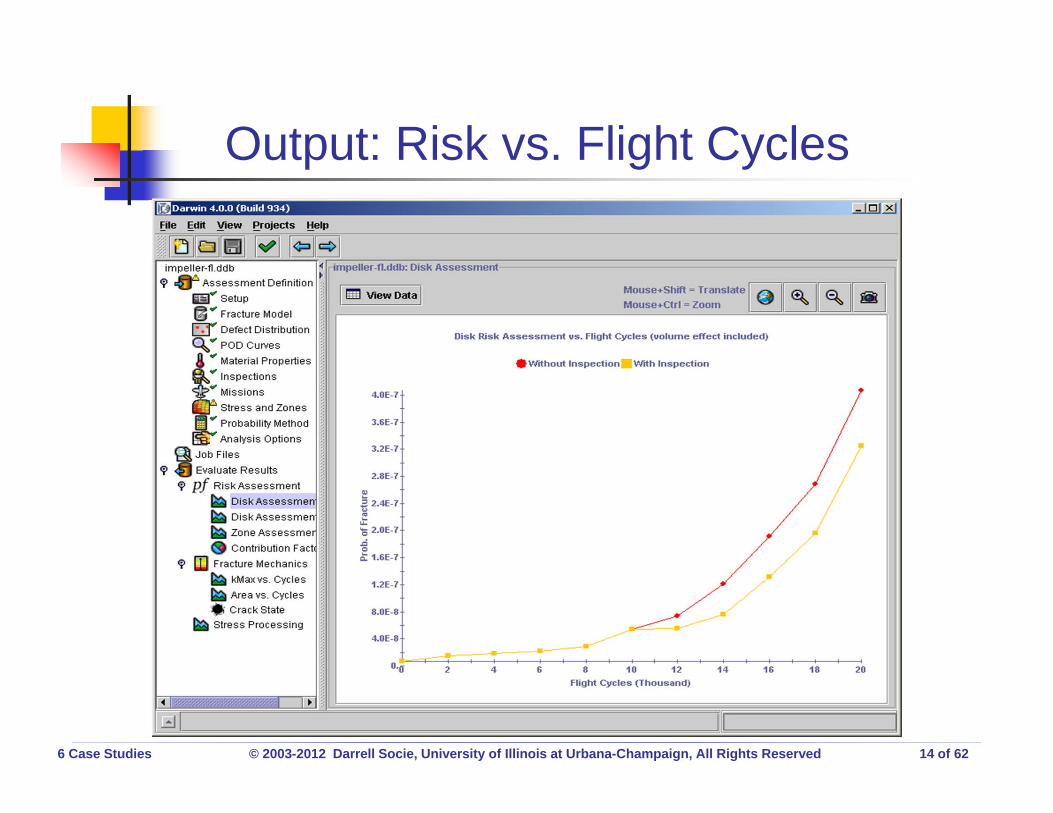
Output: Risk vs. Flight Cycles

6 Case Studies © 2003-2012 Darrell Socie, University of Illinois at Urbana-Champaign, All Rights Reserved 15 of 62
Output: Risk Contribution FactorsIdentify regions of component with highest risk
6 Case Studies © 2003-2012 Darrell Socie, University of Illinois at Urbana-Champaign, All Rights Reserved 16 of 62
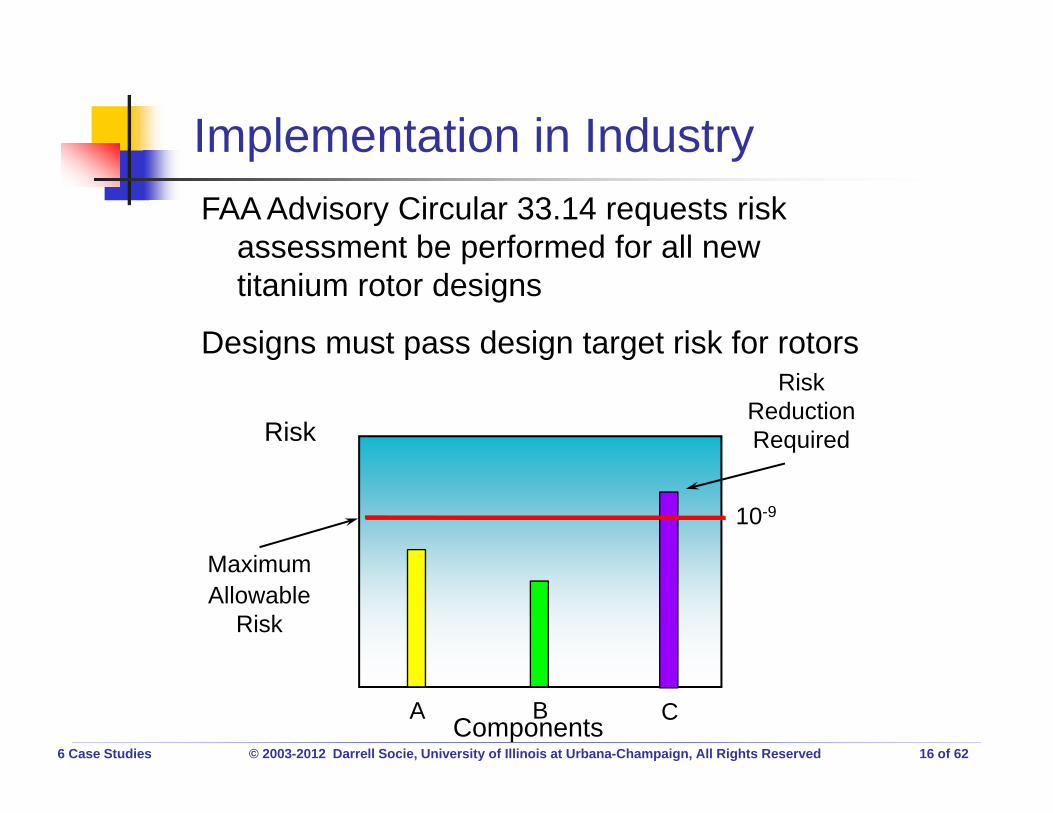
Implementation in IndustryFAA Advisory Circular 33.14 requests risk
assessment be performed for all new titanium rotor designs
Designs must pass design target risk for rotors
Components
Risk
MaximumAllowable
Risk
10-9
RiskReductionRequired
CA B

6 Case Studies © 2003-2012 Darrell Socie, University of Illinois at Urbana-Champaign, All Rights Reserved 17 of 62
Probabilistic Fracture Mechanics
Material Crack Growth Data
Finite Element Stress Analysis
Anomaly Distribution NDE Inspection
Pf vs. Flights
RPM-Stress Transform Crack Initiation
0
4000
8000
12000
0 1000 2000 3000 4000
Load Spectrum Editing
Code Enhancements
Sensor (RPM) Input
0.0
0.1
0.2
0.3
0.4
0.5
0.6
0 5 10 15 20 25 30 35 40
THRESHOLD STRESS RANGE (KSI)PR
OB
AB
ILIT
Y O
F FA
ILU
RE
AT
20,0
00 C
YCLE
S
0
20
40
60
80
100
120
NU
MB
ER O
F C
YCLE
S PE
R M
ISSI
ON
PfCycles Per Mission
DARWIN for Prognosis Studies

6 Case Studies © 2003-2012 Darrell Socie, University of Illinois at Urbana-Champaign, All Rights Reserved 18 of 62
Three Sources of Variability
Anomaly size (initial crack size) FCG properties (life scatter) Mission histories (stress scatter)
6 Case Studies © 2003-2012 Darrell Socie, University of Illinois at Urbana-Champaign, All Rights Reserved 19 of 62
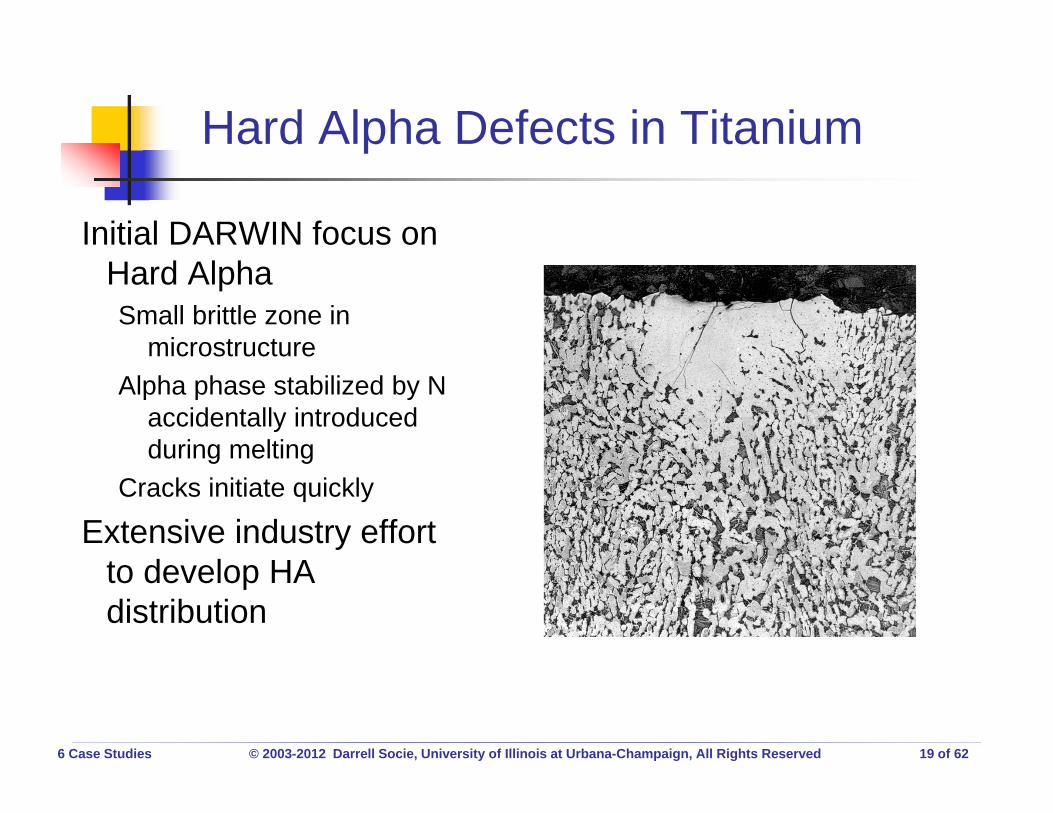
Hard Alpha Defects in Titanium
Initial DARWIN focus on Hard AlphaSmall brittle zone in
microstructureAlpha phase stabilized by N
accidentally introduced during melting
Cracks initiate quickly
Extensive industry effort to develop HA distribution

6 Case Studies © 2003-2012 Darrell Socie, University of Illinois at Urbana-Champaign, All Rights Reserved 20 of 62
Resulting Anomaly DistributionsPost 1995 Triple Melt/Cold Hearth + Vacuum Arc Remelt
1.00E-02
1.00E-01
1.00E+00
1.00E+01
1.00E+02
1.00E+02 1.00E+03 1.00E+04
DEFECT INSPECTION AREA (sq mils)
EXC
EED
ENC
E(p
er m
illio
n po
unds
)
MZ(5-10in Billet)/#1 FBH
MZ(5-10in Billet)/#3 FBH
MZ (12-13in Billet)/#1 FBH
#2/#1 FBH
#2/#2 FBH
#3/#1 FBH
#3/#2 FBH
#3/#3 FBH

6 Case Studies © 2003-2012 Darrell Socie, University of Illinois at Urbana-Champaign, All Rights Reserved 21 of 62
FCG Simulations for AGARD Data
Use individual fits to generate set of a vs. N curves for identical conditions
Characterize resulting scatter in total propagation life
Lognormal distribution appropriate in most cases
N, cycle0 2000 4000 6000 8000
a, c
m
0.0
0.1
0.2
0.3
0.4
0.5
Corner Crack SpecimenKi=18.7 MPam, Kf=56.9 MPam
AGARD

6 Case Studies © 2003-2012 Darrell Socie, University of Illinois at Urbana-Champaign, All Rights Reserved 22 of 62
Engine Usage Variability
Stress/Speed: (RPM)2
Total Cyclic Life (LCF): Nf = Ni + Np
Ni 3-5
Np 3-4
Life/Speed: Nf (RPM)6
Component life is very sensitive to actual usage
0
1000
2000
3000
4000
5000
6000
7000
8000
9000
10000
0 2500 5000 7500 10000 12500TIM E (SEC)
RPM
(Low
Spe
ed S
pool
)
Air Combat Tactics
Air to Ground & Gunnery
Basic Fighter Maneuvers
Intercept
Peace Keeping
Surface to Air Tactics ( hi alt)
Surface to Air Tactics ( lo alt)
Suppression of Enemy Defenses
Cross Country

6 Case Studies © 2003-2012 Darrell Socie, University of Illinois at Urbana-Champaign, All Rights Reserved 23 of 62
Usage Variability
0
1000
2000
3000
4000
5000
6000
7000
8000
9000
10000
0 2500 5000 7500 10000 12500TIME (SEC)
RPM
(Low
Spe
ed S
pool
)
Air Combat Tactics
Air to Ground & Gunnery
Basic Fighter Maneuvers
Intercept
Peace Keeping
Surface to Air Tactics ( hi alt)
Surface to Air Tactics ( lo alt)
Suppression of Enemy Defenses
Cross Country
Surface to Air Tactics ( lo alt)
0
1000
2000
3000
4000
5000
6000
7000
8000
9000
0 2500 5000 7500 10000 12500TIME (SEC)
RPM
(Low
Spe
ed S
pool
)
Peace Keeping
0
1000
2000
3000
4000
5000
6000
7000
8000
9000
0 2500 5000 7500 10000 12500TIM E (S EC)
RPM
(Low
Spe
ed S
pool
)
Components of Usage Variability:
• Mission type
• Mission-to-mission variability
• Mission mixing variability

6 Case Studies © 2003-2012 Darrell Socie, University of Illinois at Urbana-Champaign, All Rights Reserved 24 of 62
0.001
0.01
0.1
1
0 1000 2000 3000 4000 5000 6000 7000 8000
Number of Flight Cycles
Nor
mal
ized
PO
F
Air Combat Tactics
Combat Air Patrol
Air-Ground Weapons Delivery
Air-Air Weapons Delivery
Instrument/Ferry
Initiation and PropagationNo Inspection
Variability in Mission Type
Air-Air Weapons Delivery
Time
RP
M
Air-Ground Weapons Delivery
Time
RP
M

6 Case Studies © 2003-2012 Darrell Socie, University of Illinois at Urbana-Champaign, All Rights Reserved 25 of 62
Web Site: www.darwin.swri.org

6 Case Studies © 2003-2012 Darrell Socie, University of Illinois at Urbana-Champaign, All Rights Reserved 26 of 62
Bicycle
Assess risk in a new design

6 Case Studies © 2003-2012 Darrell Socie, University of Illinois at Urbana-Champaign, All Rights Reserved 27 of 62
Variability / Uncertainty
Fatigue strength of fork Load history variability Load history uncertainty Analysis uncertainty
6 Case Studies © 2003-2012 Darrell Socie, University of Illinois at Urbana-Champaign, All Rights Reserved 28 of 62
100104 105
500
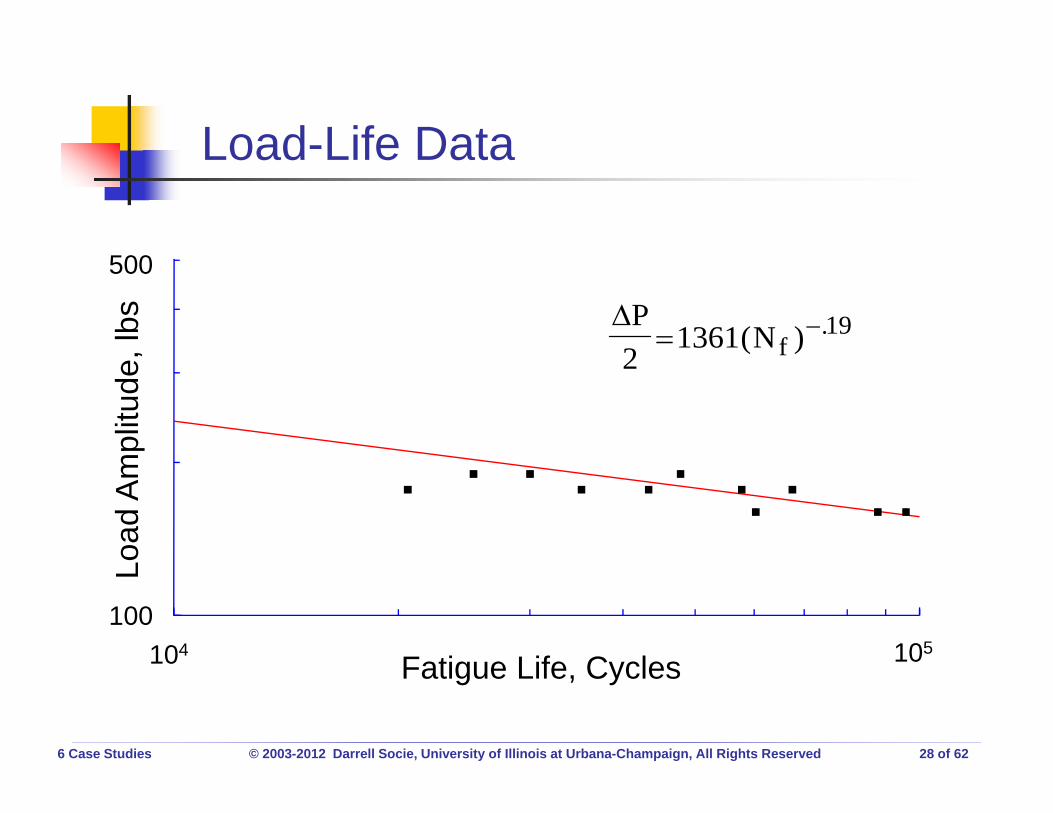
Load-Life Data
PNf2
1361 19 ( ) .
Fatigue Life, Cycles
Load
Am
plitu
de, l
bs
6 Case Studies © 2003-2012 Darrell Socie, University of Illinois at Urbana-Champaign, All Rights Reserved 29 of 62
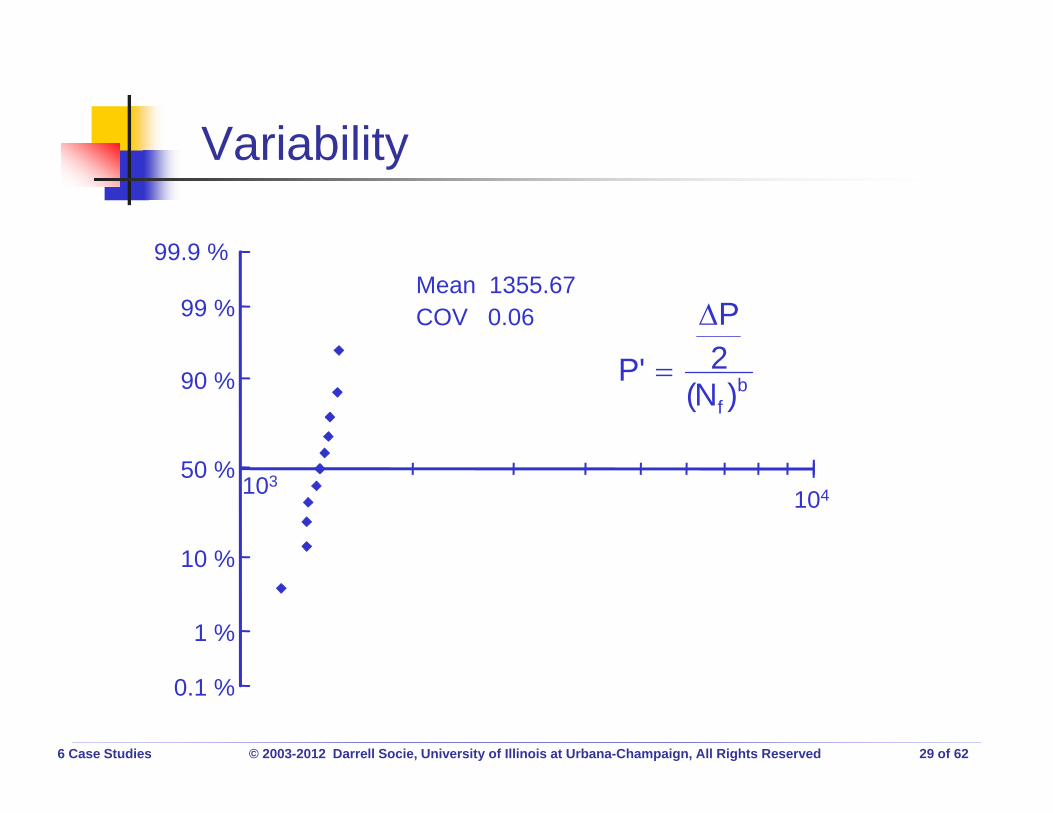
Variability
bf )N(2P
'P
103
99.9 %
99 %
90 %
50 %
10 %
1 %
0.1 %
Mean 1355.67COV 0.06
104

6 Case Studies © 2003-2012 Darrell Socie, University of Illinois at Urbana-Champaign, All Rights Reserved 30 of 62
Loading History
0 1166.51Time (Secs)-250
250
FOR
K B
EN
D (L
BS
)
Typical Loading History

6 Case Studies © 2003-2012 Darrell Socie, University of Illinois at Urbana-Champaign, All Rights Reserved 31 of 62
Rainflow
0
300
150
150
0
1000
coun
ts

6 Case Studies © 2003-2012 Darrell Socie, University of Illinois at Urbana-Champaign, All Rights Reserved 32 of 62
Exceedance Diagram
100
Number Ranges
500
Ran
ge (L
BS
)
Range Pair Plot
101 102 103 104 105
400
300
200
100
0

6 Case Studies © 2003-2012 Darrell Socie, University of Illinois at Urbana-Champaign, All Rights Reserved 33 of 62
Random Variables
Strength LN( 1356 , 0.06 ) Loading History LN( 1 , 0.3 )Estimated from other data
Loading History Uncertainty in MeanCould be “off” by a factor of 2 LN( 1.0 , 0.25 )
Analysis Estimated from other data LN( 1.0 , 1.0 )

6 Case Studies © 2003-2012 Darrell Socie, University of Illinois at Urbana-Champaign, All Rights Reserved 34 of 62
Combined Variability for Loads
n
1i
a2X 1C1CCOV
2i
i
58.0125.013.01COV 2222

6 Case Studies © 2003-2012 Darrell Socie, University of Illinois at Urbana-Champaign, All Rights Reserved 35 of 62
Analysis

6 Case Studies © 2003-2012 Darrell Socie, University of Illinois at Urbana-Champaign, All Rights Reserved 36 of 62
Results
99 %80 %
50 %
10 %
1 %
0.1 %
Ris
k
102 103 105 106
Hours
6 Case Studies © 2003-2012 Darrell Socie, University of Illinois at Urbana-Champaign, All Rights Reserved 37 of 62
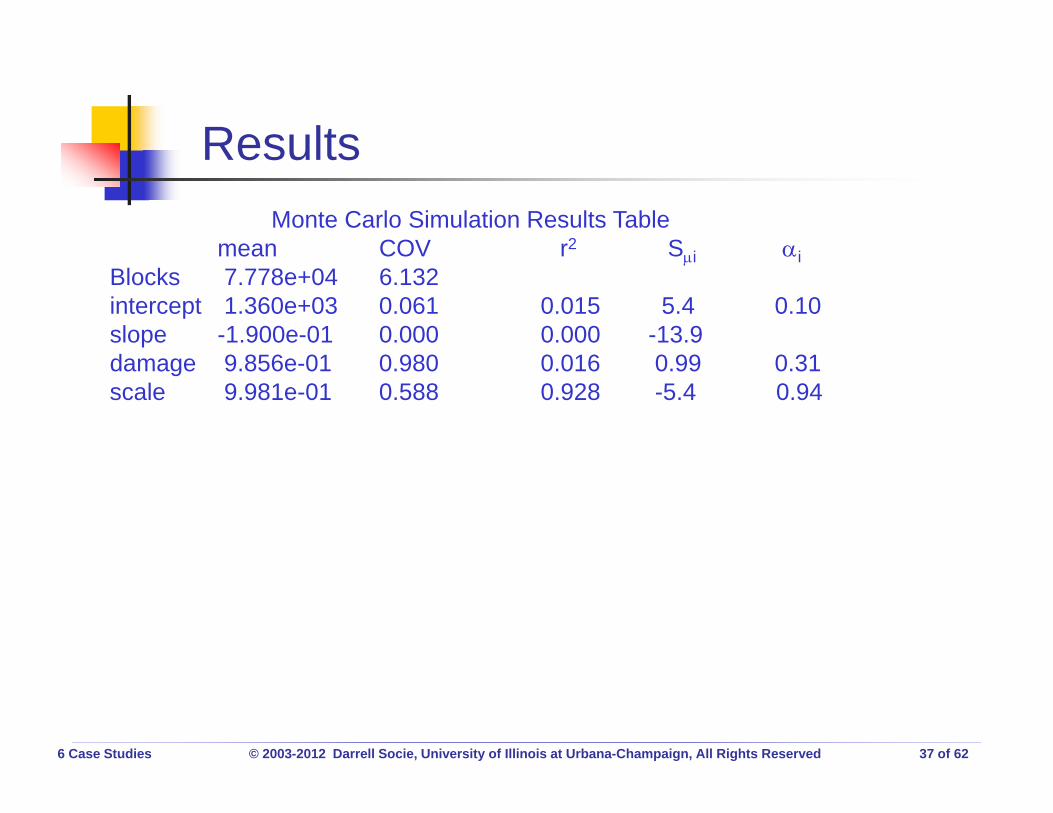
ResultsMonte Carlo Simulation Results Table
mean COV r2 Si iBlocks 7.778e+04 6.132intercept 1.360e+03 0.061 0.015 5.4 0.10slope -1.900e-01 0.000 0.000 -13.9damage 9.856e-01 0.980 0.016 0.99 0.31scale 9.981e-01 0.588 0.928 -5.4 0.94
6 Case Studies © 2003-2012 Darrell Socie, University of Illinois at Urbana-Champaign, All Rights Reserved 38 of 62
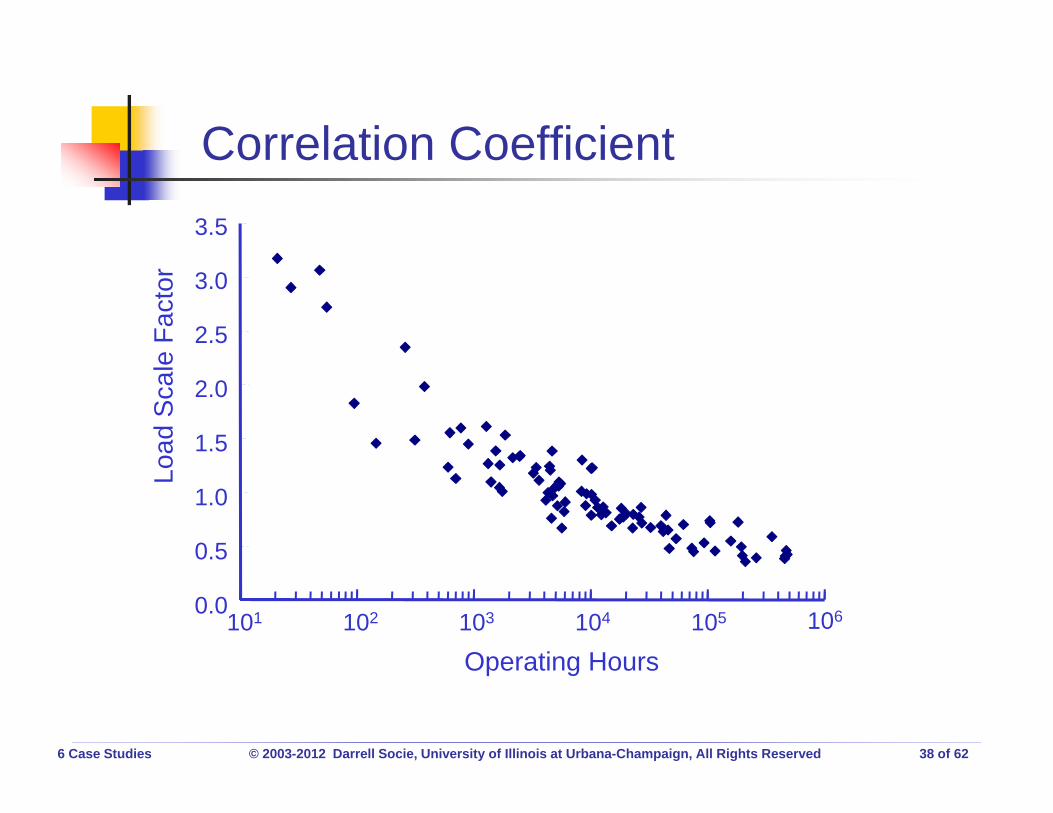
Correlation Coefficient
101 102 103 104 105 106
Operating Hours
0.0
0.5
1.0
1.5
2.0
2.5
Load
Sca
le F
acto
r
3.5
3.0

6 Case Studies © 2003-2012 Darrell Socie, University of Illinois at Urbana-Champaign, All Rights Reserved 39 of 62
Course of Action
Make it strongerRun tests to reduce analysis uncertainty Field tests to reduce loading uncertainty

6 Case Studies © 2003-2012 Darrell Socie, University of Illinois at Urbana-Champaign, All Rights Reserved 40 of 62
Eliminate Mean Uncertainty
99 %80 %
50 %
10 %
1 %
0.1 %
Ris
k
102 103 105 106
Hours

6 Case Studies © 2003-2012 Darrell Socie, University of Illinois at Urbana-Champaign, All Rights Reserved 41 of 62
Service Loading Spectra
-5
5
0
Late
ral F
orce
, kN
Time history
0 1 2 3-3 -2 -1-3
-2
-1
0
1
2
3
To Load, kN
From
Loa
d, k
N
0
1
2
3
4
1 10 100 1000Cumulative Cycles
Load
Ran
ge,k
N
RainflowHistogram
ExceedanceDiagram

6 Case Studies © 2003-2012 Darrell Socie, University of Illinois at Urbana-Champaign, All Rights Reserved 42 of 62
Problem Statement
Given a rainflow histogram for a single user, extrapolate to longer times
Given rainflow histograms for multiple users, extrapolate to more users

6 Case Studies © 2003-2012 Darrell Socie, University of Illinois at Urbana-Champaign, All Rights Reserved 43 of 62
Probability Density
-3
-2
-1
0
1
2
3
0 -1 -2 -33 2 1To Load, kN
From
Loa
d, k
N

6 Case Studies © 2003-2012 Darrell Socie, University of Illinois at Urbana-Champaign, All Rights Reserved 44 of 62
Kernel Smoothing
-3
-2
-1
0
1
2
3Fr
om L
oad,
kN
0 -1 -2 -33 2 1To Load, kN

6 Case Studies © 2003-2012 Darrell Socie, University of Illinois at Urbana-Champaign, All Rights Reserved 45 of 62
Sparse Data
-3
-2
-1
0
1
2
3
From
Loa
d, k
N
0 -1 -2 -33 2 1To Load, kN

6 Case Studies © 2003-2012 Darrell Socie, University of Illinois at Urbana-Champaign, All Rights Reserved 46 of 62
Exceedance Plot of 1 Lap
0
1
2
3
4
1 10 100 1000Cumulative Cycles
Load
Ran
ge,k
N
weibull distribution

6 Case Studies © 2003-2012 Darrell Socie, University of Illinois at Urbana-Champaign, All Rights Reserved 47 of 62
10X Extrapolation
0
1
2
3
4
1 10 100 1000Cumulative Cycles
Load
Ran
ge,k
N6
5

6 Case Studies © 2003-2012 Darrell Socie, University of Illinois at Urbana-Champaign, All Rights Reserved 48 of 62
-3
-2
-1
0
1
2
3
From
Loa
d, k
N
Probability Density
0 -1 -2 -33 2 1To Load, kN

6 Case Studies © 2003-2012 Darrell Socie, University of Illinois at Urbana-Champaign, All Rights Reserved 49 of 62
Results
-3
-2
-1
0
1
2
3
0 -1 -2 -33 2 1To Load, kN
From
Loa
d, k
N
-3
-2
-1
0
1
2
3
From
Loa
d, k
N
Simulation Test Data
0 -1 -2 -33 2 1To Load, kN

6 Case Studies © 2003-2012 Darrell Socie, University of Illinois at Urbana-Champaign, All Rights Reserved 50 of 62
Exceedance Diagram
0
1
2
3
4
5
6
1 10 100 103 104
Cycles
1 Lap (Input Data)
Model Prediction
Actual 10 LapsLoad
Ran
ge,k
N

6 Case Studies © 2003-2012 Darrell Socie, University of Illinois at Urbana-Champaign, All Rights Reserved 51 of 62
Problem Statement
Given a rainflow histogram for a single user, extrapolate to longer times
Given rainflow histograms for multiple users, extropolate to more users

6 Case Studies © 2003-2012 Darrell Socie, University of Illinois at Urbana-Champaign, All Rights Reserved 52 of 62
Extrapolated Data Sets
0.1 1 10 102 103 104
Normalized Life
Airplane
TractorATV
99.9 %
99 %
90 %
50 %
10 %
1 %
0.1 %
6 Case Studies © 2003-2012 Darrell Socie, University of Illinois at Urbana-Champaign, All Rights Reserved 53 of 62
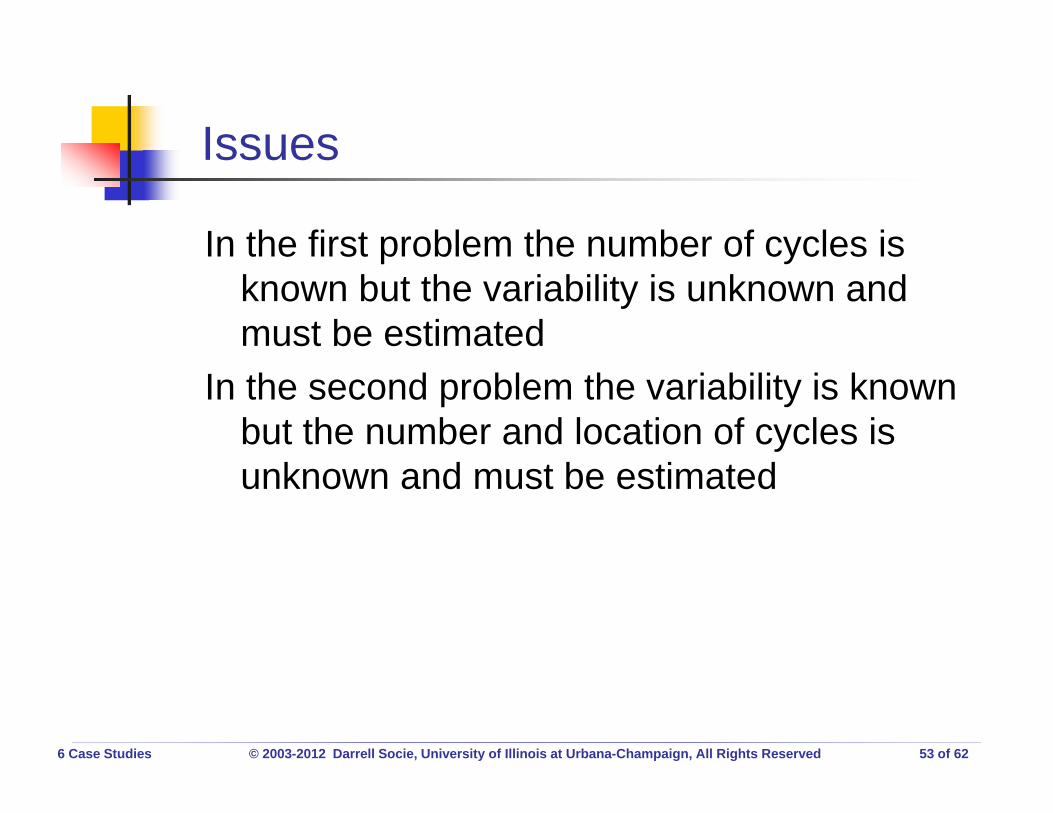
Issues
In the first problem the number of cycles is known but the variability is unknown and must be estimated
In the second problem the variability is known but the number and location of cycles is unknown and must be estimated
6 Case Studies © 2003-2012 Darrell Socie, University of Illinois at Urbana-Champaign, All Rights Reserved 54 of 62
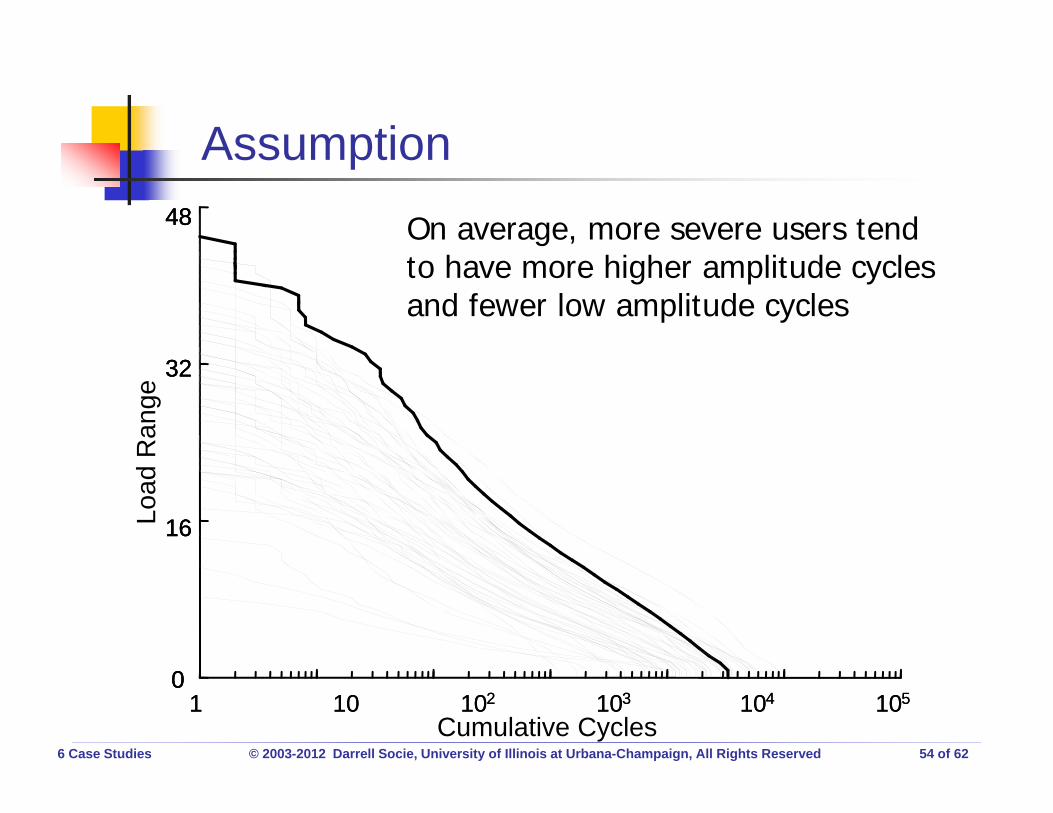
Assumption
0
16
32
48
1 10 102 103 104 105
Cumulative Cycles
Load
Ran
ge
0
16
32
48
0
16
32
48
1 10 102 103 104 105
On average, more severe users tend to have more higher amplitude cycles and fewer low amplitude cycles

6 Case Studies © 2003-2012 Darrell Socie, University of Illinois at Urbana-Champaign, All Rights Reserved 55 of 62
Translation
-3
-2
-1
0
1
2
3Fr
om L
oad,
kN
0 -1 -2 -33 2 1To Load, kN

6 Case Studies © 2003-2012 Darrell Socie, University of Illinois at Urbana-Champaign, All Rights Reserved 56 of 62
Damage Regions
-3
-2
-1
0
1
2
3
From
Loa
d, k
N
0 -1 -2 -33 2 1To Load, kN

6 Case Studies © 2003-2012 Darrell Socie, University of Illinois at Urbana-Champaign, All Rights Reserved 57 of 62
ATV Data - Most Damaging in 19
-3
-2
-1
0
1
2
3
From
Loa
d, k
N
-3
-2
-1
0
1
2
3
From
Loa
d, k
N
Simulation Test Data
0 -1 -2 -33 2 1To Load, kN
0 -1 -2 -33 2 1To Load, kN

6 Case Studies © 2003-2012 Darrell Socie, University of Illinois at Urbana-Champaign, All Rights Reserved 58 of 62
ATV Exceedance
0
1
2
3
4
5
6
1 10 100 103 104
Cycles
Load
Ran
ge, k
N
Actual Data
Simulation

6 Case Studies © 2003-2012 Darrell Socie, University of Illinois at Urbana-Champaign, All Rights Reserved 59 of 62
Airplane Data - Most Damaging in 334
-30
-20
-10
0
10
20
30
0 -10 -20 -3030 20 10To Stress, ksi
From
Stre
ss, k
si
-30
-20
-10
0
10
20
30
From
Stre
ss, k
si
Simulation Test Data
0 -10 -20 -3030 20 10To Stress, ksi

6 Case Studies © 2003-2012 Darrell Socie, University of Illinois at Urbana-Champaign, All Rights Reserved 60 of 62
Airplane Exceedance
0
10
20
30
40
1 10 100 1000Cycles
Stre
ss R
ange
,ksi
Simulation
Actual Data
6 Case Studies © 2003-2012 Darrell Socie, University of Illinois at Urbana-Champaign, All Rights Reserved 61 of 62
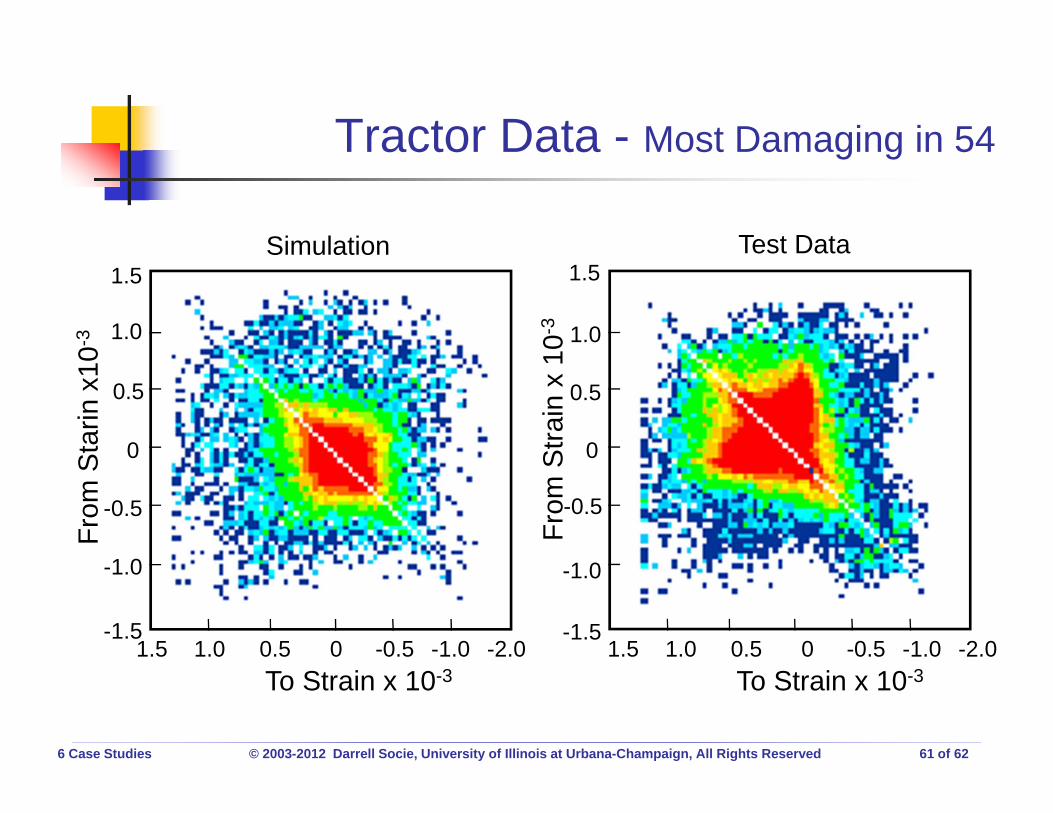
Tractor Data - Most Damaging in 54
-1.5
-1.0
-0.5
0
0.5
1.0
1.5
0 -0.5 -1.0 -2.01.5 1.0 0.5To Strain x 10-3
From
Sta
rin x
10-3
-1.5
-1.0
-0.5
0
0.5
1.0
1.5
From
Stra
in x
10-
3
Simulation Test Data
0 -0.5 -1.0 -2.01.5 1.0 0.5To Strain x 10-3

6 Case Studies © 2003-2012 Darrell Socie, University of Illinois at Urbana-Champaign, All Rights Reserved 62 of 62
Tractor Exceedance
0
1.0
2.0
3.0
1 10 100 103 104 105
Cycles
Stra
in R
ange
x 1
0-3 Simulation
Actual Data

Probabilistic Aspects of Fatigue