Probabilistic Approaches in Valuation - New York...
20
1 Probabilistic Approaches in Valuation Aswath Damodaran
Transcript of Probabilistic Approaches in Valuation - New York...

1
Probabilistic Approaches in Valuation!
Aswath Damodaran

2
Probabilistic Approaches!
The essence of risk that you are unclear about what the outcomes will be from an investment. In the risk adjusted cash flow approach, we make the adjustment by either raising discount rates or lowering cash flows.
In probabilistic approaches, we deal with uncertainty more explicitly by – Asking what if questions about key inputs and looking at the impact on
value (Sensitivity Analysis) – Looking at the cash flows/value under different scenarios for the future
(Scenario Analysis) – Using probability distributions for key inputs, rather than expected values,
and computing value as a distribution as well (Simulations)

3
a. Sensitivity Analysis and What-if Questions…!
The value of an investment or asset will change as we change the values that we use for different variables.
One way of analyzing uncertainty is to check to see how sensitive the value is to changes in key assumptions. While this has become easier and easier to do over time, there are caveats that we would offer.
Caveat 1: When analyzing the effects of changing a variable, we often hold all else constant. In the real world, variables move together.
Caveat 2: The objective in sensitivity analysis is that we make better decisions, not churn out more tables and numbers.

4
1. CON ED- AUGUST 2008
In trailing 12 months, through June 2008Earnings per share = $3.17Dividends per share = $2.32
Why a stable growth dividend discount model?1. Why stable growth: Company is a regulated utility, restricted from investing in new growth markets. Growth is constrained by the fact that the population (and power needs) of its customers in New York are growing at very low rates. Growth rate forever = 2%2. Why equity: Companyʼs debt ratio has been stable at about 70% equity, 30% debt for decades.3. Why dividends: Company has paid out about 97% of its FCFE as dividends over the last five years.
Riskfree rate4.10%10-year T.Bond rate
Beta0.80Beta for regulated power utilities
Equity Risk Premium4.5%Implied Equity Risk Premium - US market in 8/2008
Cost of Equity = 4.1% + 0.8 (4.5%) = 7.70%
Growth rate forever = 2.1%
Value per share today= Expected Dividends per share next year / (Cost of equity - Growth rate)= 2.32 (1.021)/ (.077 - ,021) = $42.30
On August 12, 2008Con Ed was trading at $ 40.76.
Test 2: Is the stable growth rate consistent with fundamentals?Retention Ratio = 27%ROE =Cost of equity = 7.7%Expected growth = 2.1%
Test 3: Is the firmʼs risk and cost of equity consistent with a stable growith firm?Beta of 0.80 is at lower end of the range of stable company betas: 0.8 -1.2
Test 1: Is the firm paying dividends like a stable growth firm?Dividend payout ratio is 73%
5
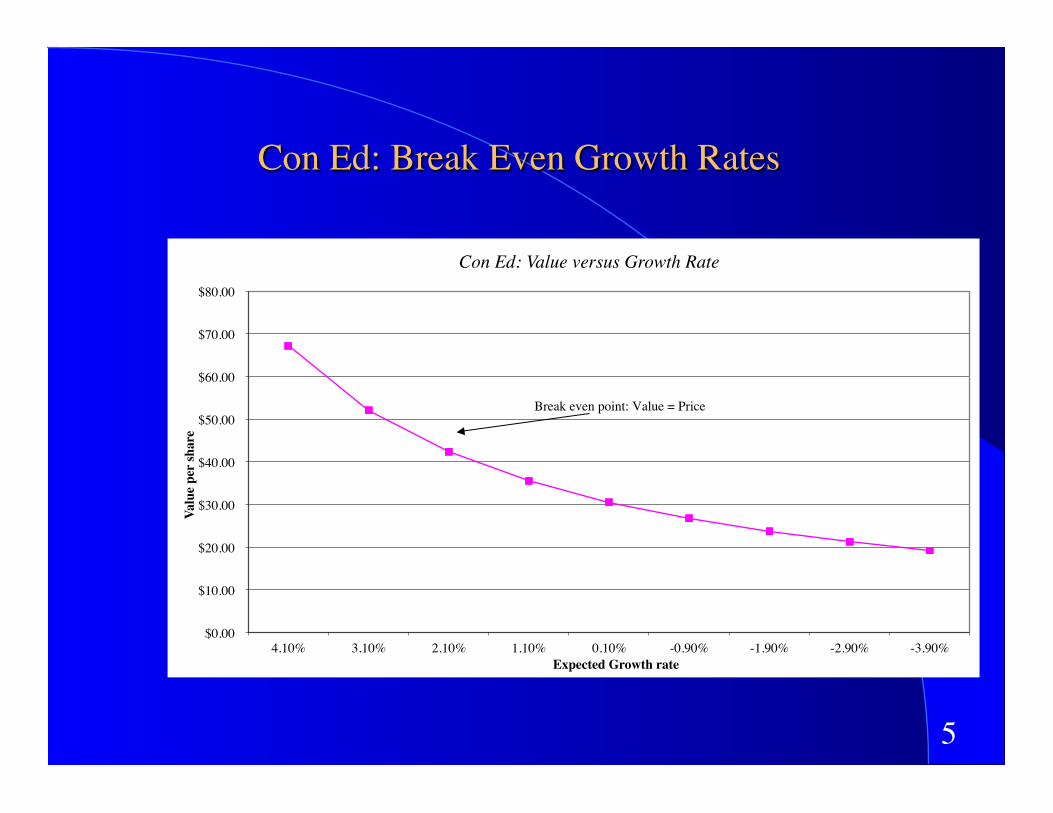
Con Ed: Break Even Growth Rates
$0.00
$10.00
$20.00
$30.00
$40.00
$50.00
$60.00
$70.00
$80.00
4.10% 3.10% 2.10% 1.10% 0.10% -0.90% -1.90% -2.90% -3.90%
Valu
e pe
r sha
re
Expected Growth rate
Con Ed: Value versus Growth Rate
Break even point: Value = Price

6
Fine tuning “what if” analysis!
Don’t double count risk: On any “what if” analysis, you should not be surprised to see low values, if a key variable (growth, risk, cash flows) is set at a more pessimistic level. That, by itself, should not lead you to reject an investment, especially since you have already adjusted for risk in your valuation.
Less is more: Focus on a few key variables in your valuation and ask your what if questions about those variables. If you scatter your attention among dozens of variables, you will lose out on your ultimate objective, which is to determine value.
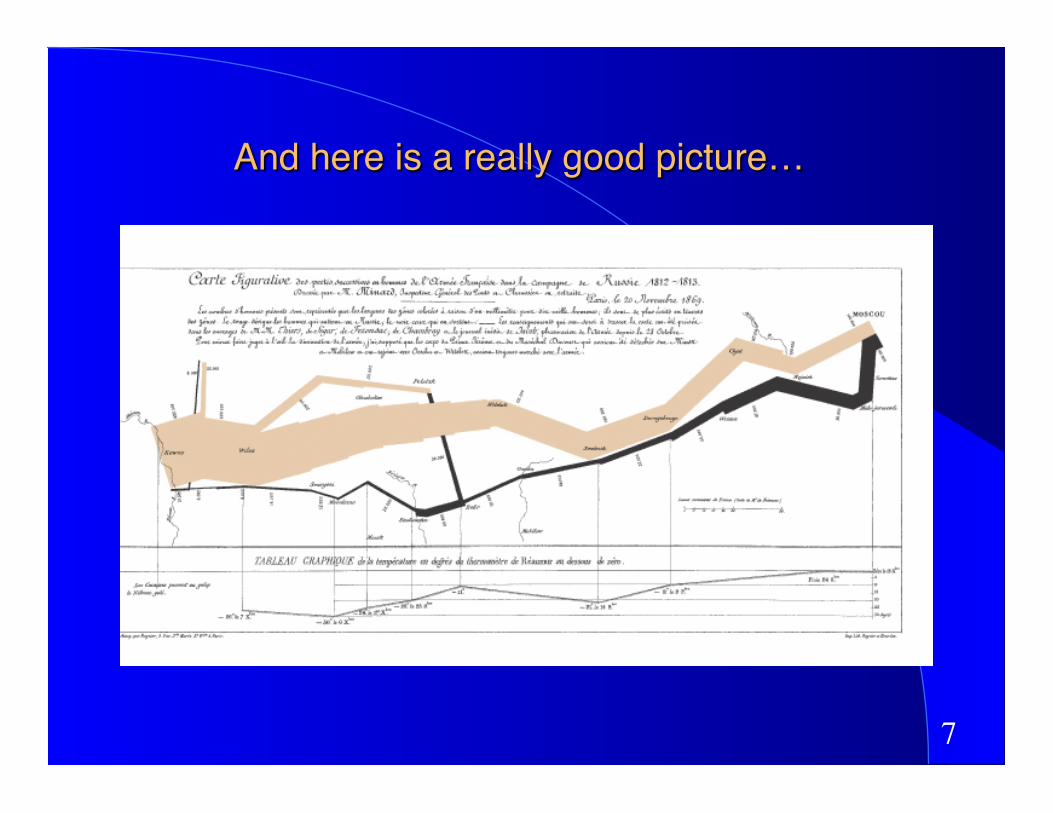
A picture is worth a thousand numbers: If you are asking “what if questions”, try to present your findings in pictures that tell the story rather than dozens of tables.
7
And here is a really good picture…!

8
Margin of Safety & Simulations!
Many value investors swear by the concept of “margin of safety”. Put simply, a margin of safety is a percentage value below the “intrinsic value” that an asset has to be trading at for it to be considered “cheap”. With a 20% margin of safety, for instance, a stock that you have valued at $ 50 will have to be trading at less than $40 (20% below $50) to be considered cheap.
In practice, the margin of safety is usually set at a fixed value and does not vary across time or across stocks. With a Monte Carlo simulation, you may be able to modify the margin of safety to reflect changing risk across stocks and across time.

9
b. Scenario Analysis!
Scenario analysis is best employed when the outcomes of a project are a function of the macro economic environment and/or competitive responses.
There are a couple of ways in which you can structure scenario analysis – Best-case, Worst-case analyses, where you set all the inputs at their most
optimistic and most pessimistic levels – Plausible scenarios: Here, you define what you feel are the most plausible
scenarios (allowing for the interaction across variables) and value the company under these scenarios
10
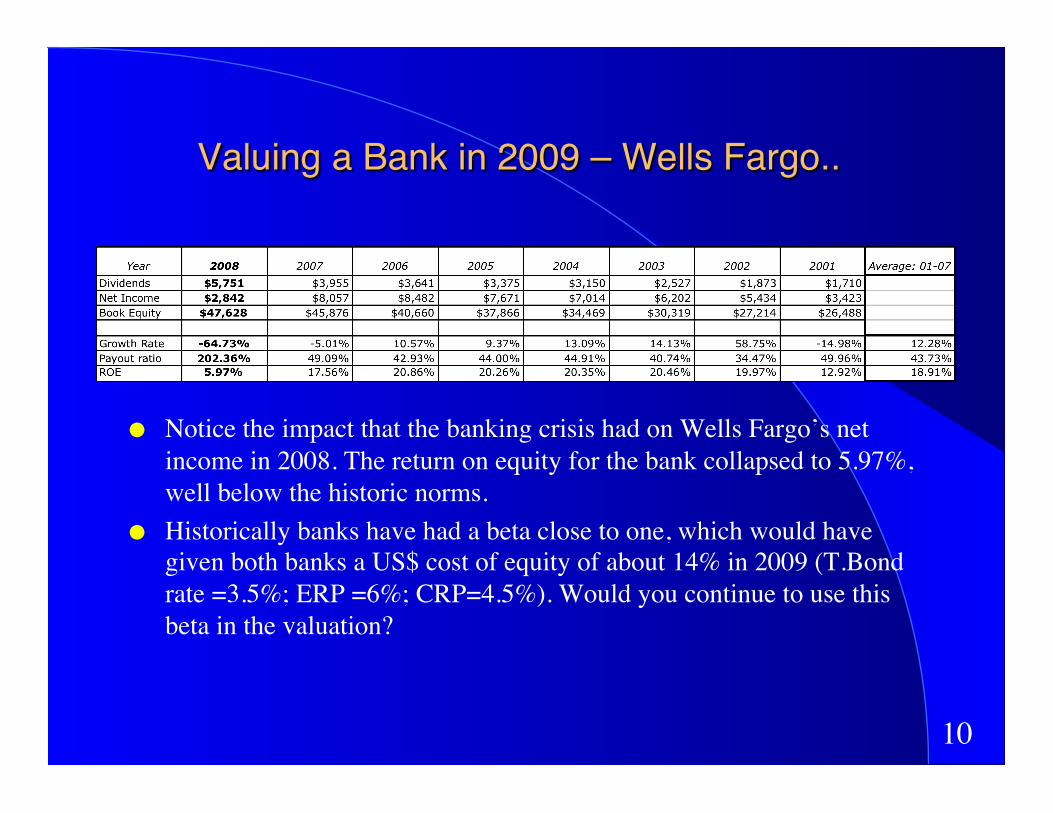
Valuing a Bank in 2009 – Wells Fargo..!
Notice the impact that the banking crisis had on Wells Fargo’s net income in 2008. The return on equity for the bank collapsed to 5.97%, well below the historic norms.
Historically banks have had a beta close to one, which would have given both banks a US$ cost of equity of about 14% in 2009 (T.Bond rate =3.5%; ERP =6%; CRP=4.5%). Would you continue to use this beta in the valuation?

11
When uncertain, keep it simple: The key valuation inputs for Wells Fargo..!
Focus on the key inputs into valuation: the ROE and the cost of equity
Or define value as a function of key scenarios:

12
Decision Trees!
Decision trees are best suited for discrete and sequential risks. A good example is the types of risk you face when investing in a drug company in the US, where any new drug has to pass through a series of FDA tests before approval and commercial success.
Assume that you are valuing a young, drug company that has a promising drug to treat diabetes in the pipeline. The drug, which is still early in the testing process may prove to be a dud, a moderate success at treating only one type of diabetes or become a blockbuster drug that treats both types of diabetes.

13
Drawing the decision tree with outcomes and probabilities..!
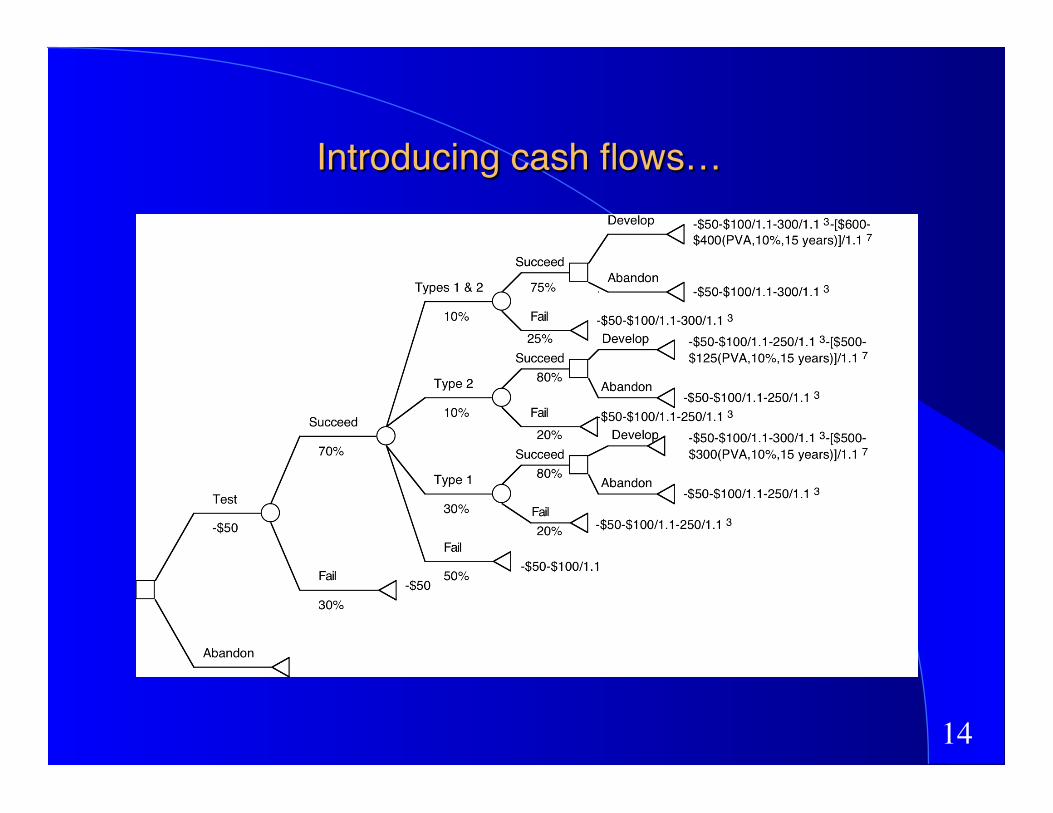
14
Introducing cash flows…!

15
And valuing the company…!

16
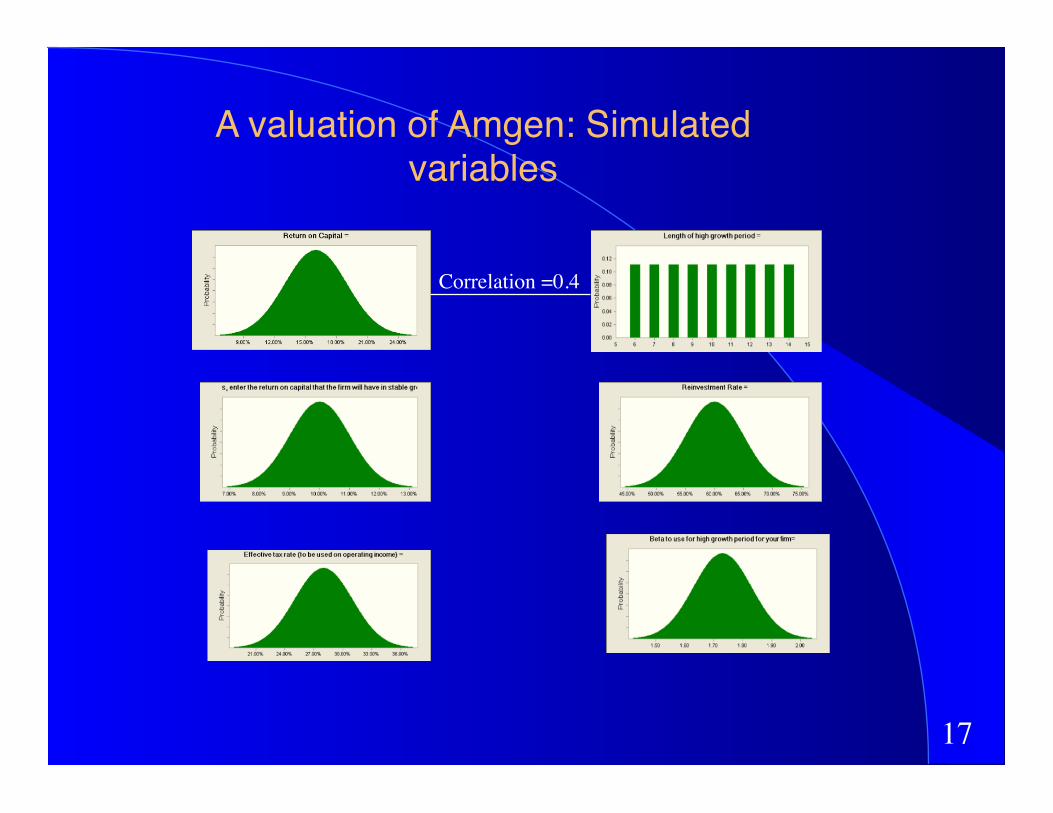
d. Monte Carlo Simulations!
In a simulation, you estimate distributions for some or all of the variables in a valuation, rather than use base case estimated values. Thus, instead of estimating that revenue growth will be 7%, you estimate that revenue growth will be normally distributed with an expected value of 7% and a standard deviation of 3%.
The key to running simulations, therefore, is deriving the distributions for variables, and you can use either: – Historical data: On key macro variables, such as interest rates or
commodity prices, you can draw on a long history to estimate distributions.
– Cross sectional data: On variables such as profit margins, you can look at differences across companies in a sector.
17
Correlation =0.4
A valuation of Amgen: Simulated variables!

18
The Simulated Values of Amgen:���What do I do with this output?

19
Valuing a commodity company - Exxon in Early 2009
Historical data: Exxon Operating Income vs Oil Price
Regressing Exxonʼs operating income against the oil price per barrel from 1985-2008:Operating Income = -6,395 + 911.32 (Average Oil Price) R2 = 90.2%
(2.95) (14.59)Exxon Mobil's operating income increases about $9.11 billion for every $ 10 increase in the price per barrel of oil and 90% of the variation in Exxon's earnings over time comes from movements in oil prices.
Estiimate normalized income based on current oil priceAt the time of the valuation, the oil price was $ 45 a barrel. Exxonʼs operating income based on thisi price isNormalized Operating Income = -6,395 + 911.32 ($45) = $34,614
Estimate return on capital and reinvestment rate based on normalized incomeThis%operating%income%translates%into%a%return%on%capital%of%approximately%21%%and%a%reinvestment%rate%of%9.52%,%based%upon%a%2%%growth%rate.%%Reinvestment%Rate%=%g/%ROC%=%2/21%%=%9.52%
Expected growth in operating incomeSince Exxon Mobile is the largest oil company in the world, we will assume an expected growth of only 2% in perpetuity.
Exxonʼs cost of capitalExxon has been a predominantly equtiy funded company, and is explected to remain so, with a deb ratio of onlly 2.85%: Itʼs cost of equity is 8.35% (based on a beta of 0.90) and its pre-tax cost of debt is 3.75% (given AAA rating). The marginal tax rate is 38%.Cost of capital = 8.35% (.9715) + 3.75% (1-.38) (.0285) = 8.18%.
12
34

20
Exxon Mobil Valuation: Simulation