Proactive Flood and Drought Management · Proactive Flood and Drought Management: A Selection of...
63
Proactive Flood and Drought Management: A Selection of Applied Strategies & Lessons Learned from around the United States American Water Resources Association Policy Committee September 2013
Transcript of Proactive Flood and Drought Management · Proactive Flood and Drought Management: A Selection of...
Proactive Flood and Drought Management: A Selection of Applied Strategies & Lessons Learned
from around the United States
American Water Resources Association Policy Committee September 2013
2
Proactive Flood and Drought Management: A Selection of Applied Strategies and Lessons Learned from around the United States
Author
Lauren Dennis
Editors
Brenda Bateman Wayne Wright Donald Duke
American Water Resources Association Policy Committee 4 West Federal Street, P.O. Box 1626 Middleburg, Virginia 20118-1626 Phone: (540) 687-8390 Facsimile: (540) 687-8395 www.awra.org [email protected] © Copyright 2013
This report was made possible by the Oregon Water Resources Department. Cover photos retrieved from the http://www.flickr.com/creativecommons/. Photo credit: Chehalis River Basin flooding (top) by theritters; dry cropland (bottom) by IRRI images
3
Acknowledgements
Special thanks to AWRA’s Policy Committee, led by Committee Chair Dr. Brenda Bateman and Vice
Chair John Wells; AWRA Past President Dr. Michael Campana; AWRA Immediate Past President William Battaglin; AWRA President Carol Collier; and AWRA Executive Vice President Kenneth Reid. Thanks to Kathy Bowman and Dick Engberg for their assistance in reviewing and editing the overall report; and Jim Kramer, Kurt Rinehart, Becky Bradley, Sonia Harvat, Steven Bereyso, Karen Guz, Neal Fujii, and Paul Kinder for their assistance in reviewing and editing individual case studies. Thanks are also due to Director Phillip C. Ward and the Oregon Water Resources Department for contributing the resources to make this report possible.
About AWRA’s Policy Committee AWRA’s Policy Committee is comprised of water professionals and others with an interest in how public policy shapes our collective management of water resources. It is a diverse committee that includes scientists, educators, policy-makers, and other experts at all stages of their careers.
AWRA Case Studies in Proactive Flood and Drought Management: Table of Contents
4
Table of Contents
Introduction ................................................................................................................................................... 5
Overview of the Case Studies in Proactive Flood Management ................................................................... 8
Chehalis River Basin, WA ........................................................................................................................ 9
Miami Conservancy District (MCD), OH .............................................................................................. 13
Easton, PA .............................................................................................................................................. 19
Nashville, TN.......................................................................................................................................... 23
Overview of the Case Studies in Proactive Drought Management ............................................................. 30
San Antonio Water System, TX ............................................................................................................. 31
The State of Oregon ................................................................................................................................ 37
The State of Hawaii ................................................................................................................................ 40
Lone Chimney Water Association, OK .................................................................................................. 47
Lessons from the Case Studies ................................................................................................................... 50
Final Thoughts ............................................................................................................................................ 55
References ................................................................................................................................................... 56
Additional Resources .................................................................................................................................. 60
Acronyms .................................................................................................................................................... 62
List of Figures Figure 1: Distribution of the Case Studies………………………………………………………………….7 Figure 2: The Chehalis River Basin………………………………………………………………………...9 Figure 3: The Miami Conservancy District Flood Protection System ……………………………………14 Figure 4: City of Easton 100-Year and 500-Year Floodplains……………………………………………20 Figure 5: Criteria Weighting Used for the Evaluation of Alternatives in Nashville Damage Centers……24 Figure 6: Nashville Emergency Response Viewing Engine (NERVE)…………………………………...27 Figure 7: Edwards Aquifer Authority Groundwater Permit Reductions………………………………….31 Figure 8: San Antonio Water Supplies in Drought Conditions by 2030………………………………….33 Figure 9: San Antonio Drought Restrictions by Drought Stage…………………………………………..34 Figure 10: Oregon Surface Water Supply Index………………………………………………………….38 Figure 11: Oregon Surface Water Supply Assessment…………………………………………………...38 Figure 12: Ten Steps of Drought Planning………………………………………………………………..40 Figure 13: City and County of Honolulu Drought Mitigation Strategies…………………………………42 Figure 14: Selected Hawaii Drought Risk Maps………………………………………………………….44 Figure 15: Lone Chimney Lake…………………………………………………………………………...47 Figure 16: Differences between Flood and Drought Challenges and Management………………………54
AWRA Case Studies in Proactive Flood and Drought Management: Introduction
5
Introduction
Background and Purpose of the Report
The United States has endured an increasing trend of extreme weather over the last decade. According to the National Oceanic and Atmospheric Administration, 2012 was a hallmark year for record-breaking extreme weather events across all 50 states (NOAA, 2012). By August 2012, two-thirds of the country was suffering from the worst drought conditions since the 1930s. Severe conditions led the U.S. Department of Agriculture to declare the largest federal drought disaster in history for more than 1,000 counties across 26 states. (Folger, Cody, and Carter, 2012; NOAA, 2012; USDA, 2012). Effects on Midwestern agricultural states were particularly severe, including costly devastation of corn, sorghum, and soybean harvests (NOAA, 2013). In October 2012, Hurricane Sandy ravaged the East Coast, inundating New Jersey and New York City with floodwaters and a record storm surge, causing more than $70 billion in damages—the second-costliest hurricane in the U.S. history (National Hurricane Center, 2013).
However, 2012 only builds on a national history of coping with these water-related disasters. Throughout the 20th century, floods and drought caused more damage and fatalities than any other natural disasters. The 30-year average for annual flood damages is more than $8 billion, with an average 95 deaths per year (National Weather Services, 2012). Similarly, drought impacts total an average $6-8 billion per year, with a significant proportion affecting the agriculture sector (National Drought Mitigation Center, 2010). These damages have sweeping economic and ecological impacts on affected communities and sectors, and as they recover, the assistance they require places a great burden on the national budget.
Research suggests that these trends will carry on into the coming decades. Northern states are projected to become wetter and Southern states are expected to become drier, while heavy precipitation events are anticipated to become more frequent and hurricanes in particular are expected to be more intense on average. The country as a whole is expected to get warmer (four to eleven degrees Fahrenheit warmer on average), exacerbating heat waves and drought conditions (USGCRP, 2009). In addition these trends, our aging infrastructure and increased calls to address ecosystem needs provide opportunities for policy makers to re-think their approach to flood and drought.
Regulatory Context
Historically, separate federal, state, and local agencies have been given responsibilities with very different mandates, authorities, and missions relating to flood or drought management, making coherent flood and drought policy at the watershed level difficult. There is no coordinated, integrated set of assessment and evaluation programs, decision methods, and funding mechanisms that works to prioritize actions that affect water resources objectives of flood control, drought mitigation, water quality protection, ecosystem preservation, and more.
Beginning with the Flood Control Act of 1936 and through the 1960s, many federal projects consisted of massive, multi-purpose water management structures constructed under the authority of U.S. Army Corps of Engineers at the request of state and local entities. Other similar structures were built at the local level without any federal input at all. The proliferation of water control projects at this time was not linked by any effective coordination.
In the 1970s, the country adopted extensive federal-level environmental protection legislation. Some of this legislation, especially the National Environmental Policy Act of 1970, the Clean Water Act (CWA) of 1972, and the Endangered Species Act (ESA) of 1973, created conflict with other water resources management efforts. Meanwhile, decisions about water supply and water resources planning remained
AWRA Case Studies in Proactive Flood and Drought Management: Introduction
6
exclusively the domain of the individual states, creating another layer of administrative and regulatory complexity and conflict. Many of these regulatory conflicts continue today.
Local, state, and federal agencies have begun to recognize that they can broaden or adapt their infrastructure and programs to address multiple water management and environmental protection goals simultaneously. These agencies are working together to overcome obstacles to extent possible, given a myriad of legal, political, hydrological, and other circumstances. Such an approach is gaining momentum across the nation.
The case studies in this collection are both unusual and outstanding in their success at integrating flood control or drought mitigation with other water resources objectives. The agencies responsible for these examples have acted in a proactive manner to address the enormous societal problems droughts or floods inflict in their jurisdictions. These cases each faced specific and widely differing institutional and regulatory barriers and driving forces affecting their water resources management. These case studies provide evidence where multiple agencies and public policy objectives have been combined to devise a proactive flood or drought management program. That is why the following case studies are so valuable; their sponsoring agencies found ways to incorporate multiple goals and address multiple needs in effective, efficient ways.
Rationale for the Report
More than ever, proactive and collaborative management of flood and drought is necessary to prepare for likely events and to keep communities resilient in future disasters. The substantial cost associated with these disasters underscores the need to focus efforts on preparing for and mitigating the impacts of extreme events rather than on relieving damages and rebuilding in the aftermath. Careful planning and preparation for flood and drought events by communities subject to extreme climatic conditions will save money and lives in the long run. In light of the increasing trend of extreme events, and the lack of federal support for focused mitigation efforts, state and local-based efforts are as important as ever to address future water resource challenges.
Report Structure
This report is divided into three sections. First, the introduction describes proactive management and related terms, as well as how case studies were chosen. Next, by examining local efforts, the report features eight case studies—four focused on flood management and mitigation, and four focused on drought management and mitigation. Finally, the report closes with identification of emerging themes and lessons learned from these case studies, and a compendium of additional resources that can be consulted in designing management strategies.
Defining Proactive Management
In the context of flood and drought, the terms mitigation, management and response have nuanced, and often conflicting definitions. Mitigation typically refers to actions and programs intended to moderate or even prevent impacts from flood or drought, while management and response often describe actions taken to alleviate impacts during or after an occurred event. In this report, proactive management is used as an all-inclusive term representing all three when considered in context of planning and preparation for extreme conditions before difficulties associated with flood or drought occurs. As the report illustrates, specific strategies may differ between flood and drought efforts, yet many common strategies and principles are also shared among these water resource challenges.
AWRA Case Studies in Proactive Flood and Drought Management: Introduction
7
AWRA Policy Statements
AWRA has developed a number of policy statements during the past five years, signaling those areas in which further public policy development could greatly improve our ability to manage water in the United States. These policy statements have called for (1) a national water vision and strategy, (2) integrated water resources management, (3) managing water resources within a hydrologic context (i.e. within basin or watershed boundaries), and (4) sustainable funding for water-resource infrastructure. While these topics are intimately relevant to the concept of proactive flood and drought management, they do not specifically address it. The goal of this report is to inform a discussion led by the AWRA's Policy Committee, whose next task is to produce a policy statement affirming the need for proactive flood and drought policy and management.
About the Case Studies
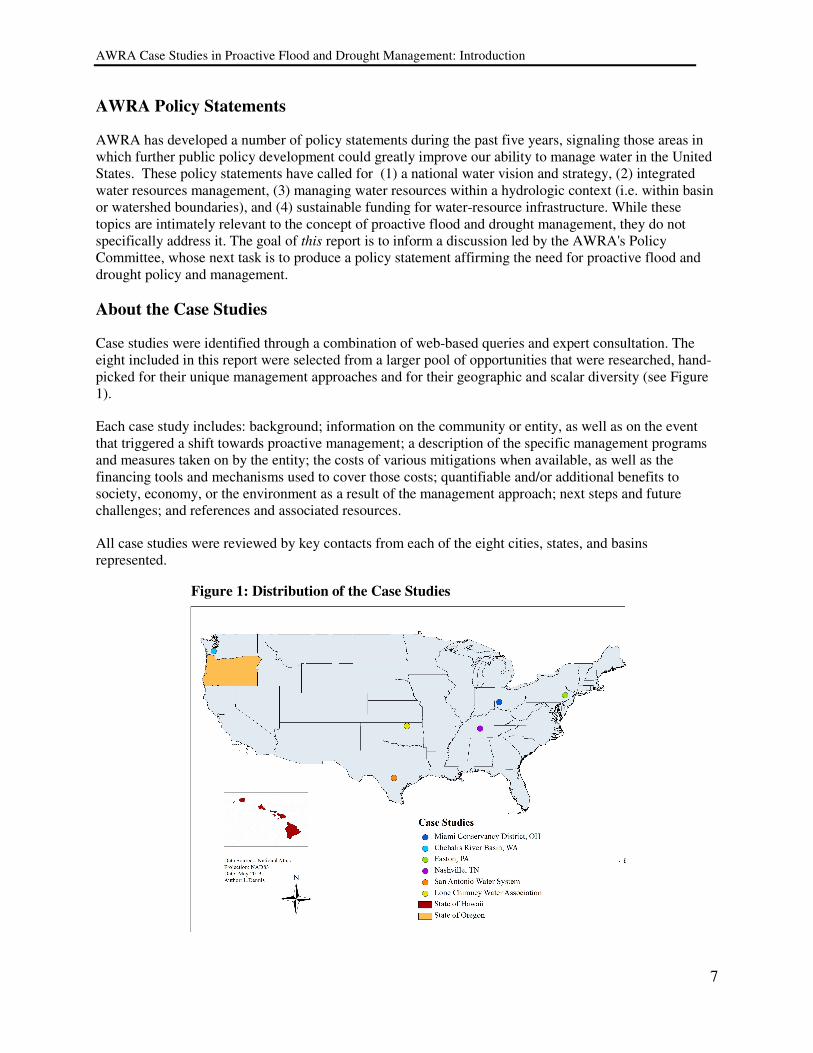
Case studies were identified through a combination of web-based queries and expert consultation. The eight included in this report were selected from a larger pool of opportunities that were researched, hand-picked for their unique management approaches and for their geographic and scalar diversity (see Figure 1).
Each case study includes: background; information on the community or entity, as well as on the event that triggered a shift towards proactive management; a description of the specific management programs and measures taken on by the entity; the costs of various mitigations when available, as well as the financing tools and mechanisms used to cover those costs; quantifiable and/or additional benefits to society, economy, or the environment as a result of the management approach; next steps and future challenges; and references and associated resources.
All case studies were reviewed by key contacts from each of the eight cities, states, and basins represented.
Figure 1: Distribution of the Case Studies
AWRA Case Studies in Proactive Flood Management: Overview
8
Overview of the Case Studies in Proactive Flood Management
Four case studies in proactive flood management are included in this section: The Chehalis River Basin in Washington is an example of a collaborative basin-wide strategy involving a diverse array of stakeholders and jurisdictions. Despite historic conflict over flood mitigation solutions, with help from state mandates and funding, the Governor’s office, and third-party facilitation, these groups were able to agree on recommended mitigation alternatives. The recommended strategy emphasizes the value of simultaneously pursuing large-scale, small-scale, and ecosystem-based projects. The Miami Conservancy District in Ohio is considered a pioneer in regional flood protection. A series of dry dams preserve normal base flows for the Miami Basin, storing waters only during high precipitation events. Extensive preserved floodplain acres have been transformed into waterfront parks for public access. Unlike the other case studies, operation and maintenance costs are funded through local tax assessments. Easton, Pennsylvania is one of the first communities to administer a 500-year flood standard, and has focused on managing the built environment in the floodplain as opposed to pursuing a property buyout program. Its model may be of particular interest to other older and/or high-density communities that have little vacant land and that have industrial or downtown commercial zones vulnerable to flooding. Nashville, Tennessee’s response to a 2010 flood serves as a model for collaborative stakeholder process in the evaluation of localized flood reduction alternatives. While structural strategies are still being assessed, the city has already developed exemplary flood warning systems, expanded its Home Buyout Program to remove floodplain structures, and considered several alternatives to protect critical water infrastructure.
Flood Management Tools Discussed in the Case Studies
• Flood Ordinances and Zoning
• Floodplain Restoration and Riparian Conservation
• Erosion Control • Channel Maintenance
• Levee Setbacks
• Home Buyout Programs • National Flood Insurance Program
Participation
• Data Monitoring
AWRA Case Studies in Proactive Flood Management: Chehalis River Basin, WA
9
Chehalis River Basin, WA
Profile of the Basin and a Punctuated History of Flood Response
The Chehalis River Basin in Washington state (see Figure 2) is a culturally, economically, and ecologically significant region. Culturally, it is home to a diverse array of rural and urban communities—covering an area of three counties, seven cities, and two federally-recognized tribes—as well as varied political ideologies. Economically, Interstate 5 provides a corridor of activity and interstate commerce throughout the larger western Washington region. Ecologically, the river’s mainstem and tributaries provide important fish habitat, used by tribal and non-tribal fishers to catch over 80,000 fish in peak years.
Since 1945, more than 800 feasibility studies exploring different structural mitigation approaches were conducted to address frequent flood events in the basin. Some small-scale projects such as channel straightening and levees were implemented, but no basin-wide solution was pursued or found practical.
After much conflict among government entities and agricultural interests, a design for 11 miles of levees along the Chehalis River (the Twin Cities Project) was authorized—without funding—by Congress in 1980. The plan met heavy opposition from municipalities and organizations. Ultimately, no action was taken at that time to mitigate the region’s flood hazard.
In December 2007, the Chehalis River in the upper half of the basin flooded to a record high, shutting down portions of I-5, devastating homes, farms, and businesses, and creating $938 million in economic damages, $300 million of which was due to the highway closure.
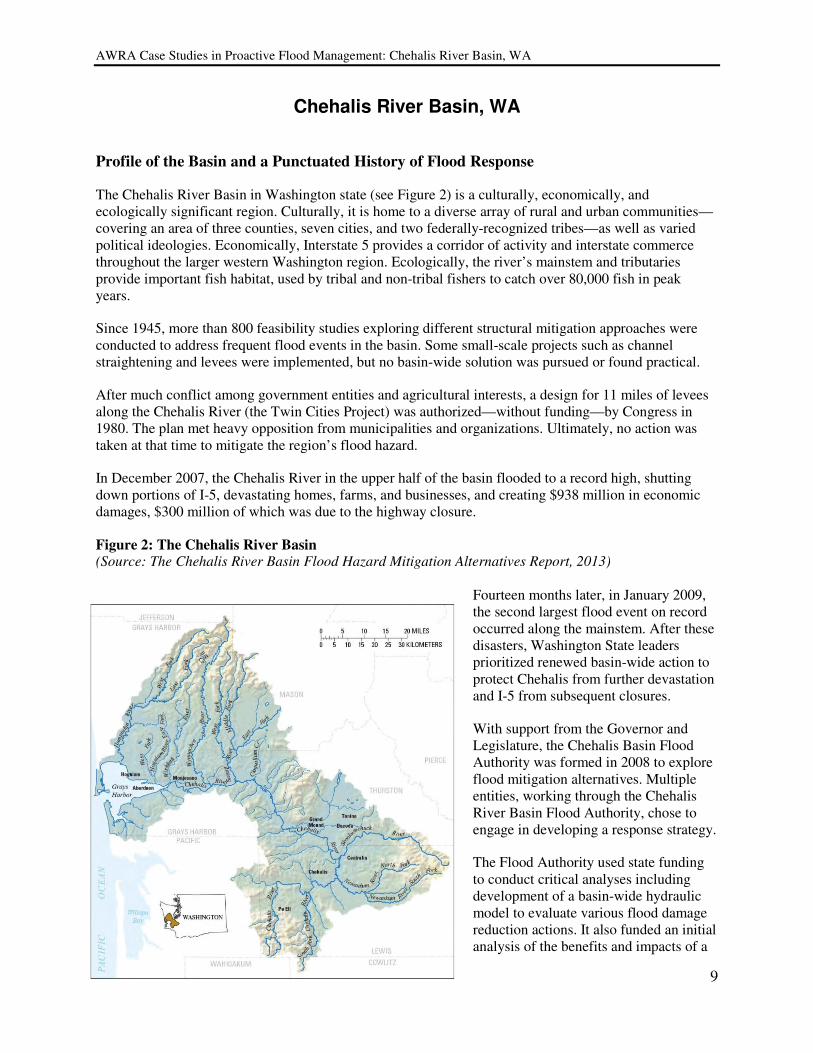
Figure 2: The Chehalis River Basin (Source: The Chehalis River Basin Flood Hazard Mitigation Alternatives Report, 2013)
Fourteen months later, in January 2009, the second largest flood event on record occurred along the mainstem. After these disasters, Washington State leaders prioritized renewed basin-wide action to protect Chehalis from further devastation and I-5 from subsequent closures.
With support from the Governor and Legislature, the Chehalis Basin Flood Authority was formed in 2008 to explore flood mitigation alternatives. Multiple entities, working through the Chehalis River Basin Flood Authority, chose to engage in developing a response strategy.
The Flood Authority used state funding to conduct critical analyses including development of a basin-wide hydraulic model to evaluate various flood damage reduction actions. It also funded an initial analysis of the benefits and impacts of a
AWRA Case Studies in Proactive Flood Management: Chehalis River Basin, WA
10
water retention structure, and hired a Washington non-profit to explore the value of the basin’s ecosystem services (estimated at $11 billion) and to promote more ecosystem-based solutions. Despite these achievements, the Authority struggled to achieve political consensus.
In 2011, Washington’s legislative leaders called for an independent report outlining flood mitigation alternatives. The Governor’s Office contracted the William D. Ruckelshaus Center to assess the situation and manage development of the report. The result was a common understanding among many stakeholders of the effects of flooding and the potential of various project alternatives to reduce flood damage. A work group of six Chehalis Basin leaders was also appointed by the Governor to develop recommendations. Working with an independent facilitator, they assembled a comprehensive, basin-wide, multi-scale suite of recommendations. These were published in the 2012 Chehalis River Basin Flood
Hazard Mitigation Alternatives Report.
Early on, the work group decided that enhancement of aquatic species, particularly salmon runs, needed to be equal to flood damage reduction in the framework of the recommendations. This prioritization was based on the cultural and economic significance of the basin’s natural resources, and also met the need to ensure that projects would enhance natural resources, not just mitigate flood damages.
The framework included determining feasibility of water retention and levees along I-5, constructing projects to protect local infrastructure and restoration of aquatic habitat, creating an aquatic species enhancement plan, supporting local governments to improve land-use management where appropriate, and identifying other smaller scale projects. Though it has broad support, there is not complete consensus among the parties. The recommended strategy in the Chehalis River Basin Flood Hazard Mitigation
Alternatives Report will be implemented in 2013-2015 through state funding and with oversight by the Governor’s policy task force.
Mitigation Alternatives
Flood damage reduction projects under consideration include large- and small-scale capital projects, ecosystem-based projects, land-use management, and flood warning and preparedness, as follows: Large-Scale Capital Projects. Large scale projects affecting a broad geographic area include upper basin water retention and protecting I-5.
• Upper Basin Water Retention. The primary option under consideration is a dam and reservoir to store 80,000 acre-feet of water. Retention infrastructure will include components for fish passage, water quality, and sediment transport. Design and engineering for the first phase of feasibility analysis is estimated to cost $5.6 million. Construction is estimated to cost more than $250 million.
• I-5 Protection. Design and engineering analysis is underway. Options that have been considered include raising the highway with infill, raising it with a viaduct below, and relocating it out of the flood zone. Estimates for these options range from $350 million - $2 billion.
Small-Scale Capital Projects. Recommended small-scale projects with more localized benefits that protect critical infrastructure and private property are estimated to cost more than $10.7 million between 2013-2015. They include:
• Levee Construction. Installing one particular levee will require land acquisition and elevation of homes, but will protect a neighborhood of 60 structures, provide flood storage, and restore the local floodplain.
AWRA Case Studies in Proactive Flood Management: Chehalis River Basin, WA
11
• Water Infrastructure Protection. A dike will protect a wastewater treatment plant, and a flood wall and levee will secure a wellhead and drinking water system.
• Livestock and Farm Equipment Protection. ‘Critter pads’ (elevated livestock flood sanctuaries) and safe evacuation routes will be designed and constructed throughout conservation districts to prevent economic losses and protect public health by reducing animal mortality. Seven pads will cost roughly $1 million.
Ecosystem-Based Projects. Ecosystem-based projects are being pursued to enhance overall conditions, aquatic habitat, and abundance of fish in the Basin, including a basin-wide aquatic species enhancement plan, riparian reconnection and conservation, and erosion control.
• Aquatic Species Enhancement Plan. A work group is developing a basin-wide aquatic species enhancement plan with consultant support and technical staff from Washington State Department of Fish and Wildlife, Chehalis Tribe, and Lewis County PUD. It will include projects and actions to improve the populations of culturally and economically important species such as salmon.
• Floodplain Restoration. Artificial barriers and habitat impediments such as riprap and dikes will continue to be removed along the Satsop River to allow meanders to return. Efforts to stop shoreline erosion, including setting levees back to allow for natural meanders and to keep livestock out of riverbeds will also continue. This project will restore habitat and protect landowners and businesses.
• Riparian Reconnection and Acquisition of Land (riparian, off-channel, and wetland habitats) will provide fish habitat and water retention areas while reducing flood impacts.
• Erosion Control. Vegetated benches and large woody vegetation will offer bank stabilization and fish habitat and will slow floodwater velocities. Invasive species will be removed at specific sites to make way for planted native vegetation.
Land-Use Management. Land-use management strategies will be assessed to determine how to help prevent repetitive losses and to reduce the potential that new development will increase flood damage. A buyout strategy for willing landowners of repetitive loss properties will be developed in consultation with planners from local governments and the Department of Ecology. The buyout strategy has two major phases:
• Addressing Known Repetitive Loss Structures. According to Thurston and Lewis counties, there are 128 structures that would be candidates for elevation or buyout. The Flood Authority estimates the cost of elevating or buying out these structures to be $10-15 million. Elevation costs $30,000-$50,000 per house.
• Addressing Future Vulnerable Structures. The Work Group expects to assess the potential for further improvements and expansion of use of the Federal Emergency Management Agency Community Rating System (CRS) by floodplain jurisdictions. Models will help determine the reduction in damages and costs if all jurisdictions adopted a class 5 or above rating. The Flood Authority has suggested sharing personnel such as certified floodplain managers across planning departments.
Flood Warning and Preparedness. Consultants engaged a variety of public and private groups and evaluated federal and state flood forecasting programs to determine the basin’s flood preparedness. The evaluation resulted in a plan to improve identification of flood threats, agency coordination, and
AWRA Case Studies in Proactive Flood Management: Chehalis River Basin, WA
12
communication with the public. Total estimated costs are not final. Elements include a flood data website and additional observation equipment.
• The Flood Data Website is an internet-based data collection, visualization, and river monitoring tool available to public computers and mobile devices at http://www.chehalisriverflood.com. It shows real time data and flood inundation maps and anticipated flood levels at various forecast river stages.
• Proposed New Observation Equipment includes ten automated rainfall gages, ten new temperature gages, and two new stream gage stations to increase observation networks.
Costs and Financing
A total of $28 million was included for this work in the recommended 2013–2015 state capital budget. To date, the state has issued $4 million in capital bonds to fund development of the recommended strategy and other studies. The mitigation response strategy could cost up to $500 million in total over the coming decades. Total funding will need to involve all levels of government.
Benefits
While implementation of these projects has yet to begin, the strategy promises significant local benefits. These include ecological improvements and fish recovery, plus the economic benefits of avoided damages. Investments are likely to pay great dividends; for example, the cost of constructing a dam could total $245 million, but economic benefits may reach $334 million (net present value).
Next Steps
General next steps to advance the framework are to evaluate and identify best options for large-scale capital projects; conduct comparative analysis of protections offered by smaller-scale solutions versus those provided by large-scale engineered projects; implement projects to improve fish habitat and populations and floodplain function; further revise land-use policies, expand buyout and floodproofing programs; and maintain the effectiveness of flood warning and flood preparedness programs.
The Chehalis Work Group will assess large scale flood reduction efforts compared to a suite of smaller projects such as channel dredging, riparian restoration, forest practices, flood easements on farm lands, road maintenance, removing bridge and constrictions, and removing, protecting and avoiding floodplain development. The two-year budget to develop the suite of smaller projects is estimated around $250,000. This group will continue to oversee implementation of the framework and make further recommendations to the Governor and Legislature.
The Flood Authority will oversee implementation of local, smaller scale capital projects, and the strategy for repetitive loss reduction and land-use management. A technical steering committee will be established to guide technical analyses for the large capital projects and ecological enhancements. Federal, tribal, state agencies and local governments will guide the technical analyses and permit approval.
AWRA Case Studies in Proactive Flood Management: Miami Conservancy District (MCD), OH
13
Miami Conservancy District (MCD), OH
History and Beginnings of the MCD
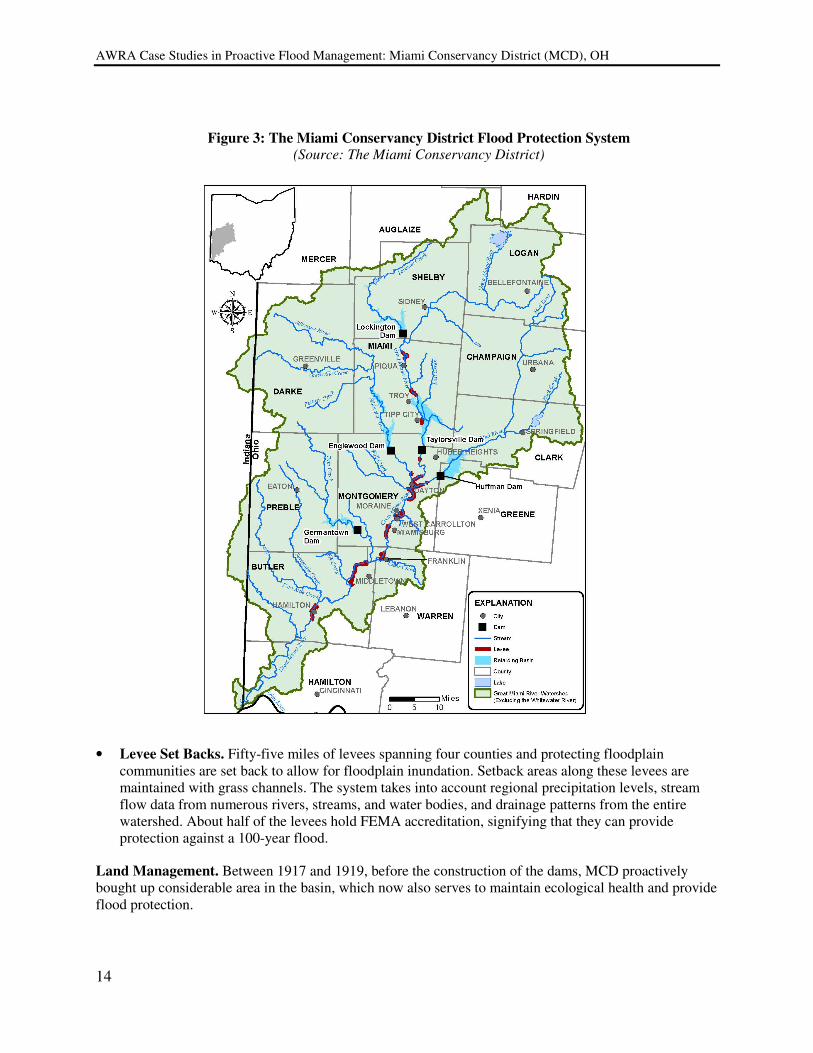
After a series of storms in the spring of 1913, the Great Miami River spilled over into the city of Dayton and neighboring counties of southwest Ohio, killing 360, incurring $2 billion of damages (in 2013 dollars), and resulting in one of the worst natural disasters to ever hit the Midwest. In response, Dayton and the other affected communities sought to pursue a watershed-based approach, but Ohio statute did not authorize a regional, cross-jurisdictional agency like they had in mind. With the help of Governor James Cox, a Dayton resident himself, the Ohio Legislature passed the Conservancy Act of 1914, authorizing regional agencies to provide flood protection within the state. Individual private property owners and businesses from ten counties across the Great Miami River Watershed in southwest Ohio petitioned for a conservancy district and in 1915, the Miami Conservancy District (MCD) was created, with a core mission of providing the Miami River Basin permanent flood protection (see Figure 3 for district boundaries).
The project was entirely implemented with local funding and supervision. Local business leaders’ fundraising efforts collected an astounding total of $2 million for flood protection from more than 20,000 individual donations. Design and construction of the strategy, led by visionary engineer Arthur Morgan, was the nation’s largest public works project to date, yet took only ten years in total to complete. Today, MCD’s system protects tens of thousands of people across 21 municipalities in the greater Dayton area, 48,000 properties in five counties, and more than $5.1 billion worth of buildings and land. Since 1922, the area has been protected from approximately 700 high water events.
A Board of Directors, appointed by local judges, oversees the activities of the district, including the integration of public input. A Board of Consultants, made up of top engineering experts from academia and industry from around the country, reviews data and makes technical recommendations on topics including dam safety, building restrictions, the river corridor, and water resources.
The district is widely considered the first pioneer of regional flood protection, and has served as a model that has been replicated across the country by the Tennessee Valley Authority, locales in Minnesota, Colorado, Michigan, and Florida, and jurisdictions all over the world.
Flood Management Strategies
MCD employs a comprehensive, valley-wide flood control system that honors the hydrology of the watershed while providing a permanent solution to the region’s flood challenges. The system includes:
Structural Components That Support Natural Flow Regimes. While MCD’s strategy includes conventional flood mitigation components such as dams and levees, these components are distinct from others for their innovative designs that allow the Miami River to run in its natural flows and be connected to its floodplain, where in many areas the natural riparian vegetation and habitat remain. The result is healthier ecosystem function.
• Dry Dams. MCD’s system includes five “dry” dams for infrequent water retention events. These dams do not collect water year-round, but rather are sized to allow the passage of no more water than the downstream river channel can safely handle. This allows the river to pursue its natural flow regime and thus greatly reduces environmental impacts. Only in high precipitation conditions, averaging roughly 20 times per year, is excess water retained for slow release.
AWRA Case Studies in Proactive Flood Management: Miami Conservancy District (MCD), OH
14
Figure 3: The Miami Conservancy District Flood Protection System (Source: The Miami Conservancy District)
• Levee Set Backs. Fifty-five miles of levees spanning four counties and protecting floodplain communities are set back to allow for floodplain inundation. Setback areas along these levees are maintained with grass channels. The system takes into account regional precipitation levels, stream flow data from numerous rivers, streams, and water bodies, and drainage patterns from the entire watershed. About half of the levees hold FEMA accreditation, signifying that they can provide protection against a 100-year flood.
Land Management. Between 1917 and 1919, before the construction of the dams, MCD proactively bought up considerable area in the basin, which now also serves to maintain ecological health and provide flood protection.
AWRA Case Studies in Proactive Flood Management: Miami Conservancy District (MCD), OH
15
• Upstream Acquisition and Management. MCD’s 35,650 acres on which it now holds easements, were acquired upstream of the five dams for excess water retention during high precipitation events. These acres are used as parks and farmlands, and more than 90 percent of the land has been sold back with an easement to private landowners or are permitted for use, via:
• Retarding Basin Permits. Issued by MCD for construction structures within the retarding basins behind the dams. Typically, permits are issued for agricultural buildings.
• Storage Compensation Agreement. Issued by MCD when there is a need to place fill material within a retarding basin. Agreements stipulate that an equal amount of material be removed from another part of the basin to compensate for lost storage.
Downstream Management. MCD also owns land along the levees and channels in the cities and manages it via:
• Land-Use Permits. Issued by MCD for long-term or annual use that does not conflict with dam operation, floodplain maintenance, or use of the trail system. Typical uses falling under this permit category include farming, gravel removal, and public infrastructure such as roads and pipelines.
• Temporary Permits. Issued by MCD for short-term or one-time use that does not conflict with dam operation, floodplain maintenance, or use of the trail system. Farming, special events such as festivals, and gravel removal are typical temporary permitted actions. Additionally, agencies and utility companies see open land in urban areas along the rivers as easy paths for water lines, sewers, power lines, etc. Some infrastructure, such as storm sewers that drain to the rivers and sanitary sewers that must flow downstream, have no reasonable alternative than to occupy MCD flood protection land. Utilities regularly request building permits on MCD flood protection lands because it is easier and more cost effective to build there. MCD evaluates the effect on the flood protection infrastructure, property, operations, and maintenance for each request and determines what is acceptable. Acquisitions, easements, and permitting have prevented further development sprawl in areas throughout the basin, maintaining high levels of surface permeability and stormwater filtration.
• Floodplain Preservation. MCD has also worked to protect the floodplain of the retarding basins, and now manages more than 4,500 acres of protected floodplain land with natural riparian habitat. Many of these acres have been protected through partnerships with local park districts and municipal governments. Funds from the Ohio Greenspace Preservation Grant program and other similar programs have been leveraged for floodplain preservation projects.
Channel Maintenance. MCD maintains thirty-five miles of stream channel. Routine maintenance includes mowing; pruning or clearing of trees and brush; removing drift, debris, and trash; filling groundhog holes; removing stones and stumps from areas to be mowed; and maintaining floodgates, floodwalls, and revetments. In addition, 15 field staff maintain channel banks and other lands beyond the dams and levees. The caretakers perform inspections and routine maintenance to ensure the dams, levees, and maintained channels function properly. MCD also conducts routine dredging.
Data Monitoring. MCD manages a Hydrologic Monitoring Program to evaluate the flood protection system and provide publically available data. Daily precipitation data is collected by a network of 47 observers, and 43 stream gauges (25 automated) are managed in partnership with U.S. Geological Survey, the National Weather Service, and the Ohio Emergency Management Agency. During high water events,
AWRA Case Studies in Proactive Flood Management: Miami Conservancy District (MCD), OH
16
field staff provide regular precipitation and river stage readings. The caretakers also take readings at observation wells in and around each dam and along many of the levees to record the fluctuation of groundwater pressure. Caretakers at the dams take readings at relief wells and record the time and duration of relief well flow. These data allow MCD to adjust flood responses during storm events.
Costs and Financing
Initial Funding. Initial costs of the project were $31 million (in 1920 dollars). Two million dollars were raised from donations made by local businesses and private donations; no federal grant or loan programs were available at the time. The $31 million was financed through bonds sold to the local communities, and were repaid, along with the $2 million from donors, by 1949. An identical system today would cost more than $912 million.
Continued Funding through Tax Assessments. Present operating and maintenance costs run approximately $5 million per year. These costs are largely paid for through local tax assessments on some 48,000 private and public property owners protected from flooding by MCD, a funding mechanism that is provided for in the Ohio Revised Code.
Dam Safety Capital Assessments. In addition, in 1999, MCD launched its multi-year Dam Safety Initiative, a capital improvement program to address potential weaknesses in the systems’ dams and levees. The program generates about $1.5 million per year, funded through these capital assessments on the same properties, cities, and counties that pay the flood protection maintenance assessment. With it, MCD has invested $20 million during the last decade in infrastructure upgrades.
Subdistrict Assessments. Additionally, subdistricts were created for specific purposes (water quality, aquifer preservation, river corridor recreation); assessments levied within each subdistrict are legally separate from the flood protection funds and can only be spent on the assigned purposes.
Benefits
In addition to MCD’s primary goal of flood protection, the district provides a suite of environmental, social, and economic benefits to the region. These include:
Environmental Conservation. To mitigate the effects of dam construction, MCD worked with the Ohio Department of Forestry to plant more than 400,000 trees around the dam sites in the 1920s. Overall, the Ohio EPA has determined that the mid section of the Great Miami River mainstem is in full attainment of water quality standards under the Clean Water Act in 95 percent of its sites, as a result of the good riparian habitat in MCD’s floodplains.
Increased Public Recreation and Park Access. In designing the dams and levees, founding Chief Engineer Arthur Morgan envisioned the lands set aside for retention and levees serving as public lands for the valley residents to enjoy. MCD maintains 35 miles of recreation trails along the Miami River. Public parks, bike trails, and urban green spaces like Dayton’s RiverWalk, running along the top of the city’s levee, create public access points to the river. MCD leases (at no cost) parklands to local park districts to manage recreation, conservation, public education, and wetland restoration programs. MCD also partners with the Ohio Department of Transportation and local cities and counties on the maintenance of bike trails.
Enhanced Water Quality Monitoring and Planning. MCD provides water quality monitoring, data analysis, education, and public outreach. MCD works with local cities, counties, and other partners on source water protection programs for both surface and ground water. MCD has also implemented a
AWRA Case Studies in Proactive Flood Management: Miami Conservancy District (MCD), OH
17
surface water quality trading program to fund best management practices on agricultural land that reduce nutrients in the rivers. That program engages local farmers in collaboration with county soil and water conservation districts, the Ohio Farm Bureau, Ohio EPA, Ohio Department of Natural Resources, and USDA Natural Resources Conservation Service.
Economic Vitality. Many of the cities along the Great Miami River are redeveloping the riverfront with technology parks, educational campuses, entertainment districts, and recreation facilities for cycling, kayaking, canoeing, rowing, and more.
Challenges
Aging Infrastructure. MCD's greatest challenge is aging flood protection infrastructure. The original system was constructed more than 90 years ago, and while many components of the system have been rehabilitated or replaced, the majority of the infrastructure is quite old. The flood protection infrastructure was designed and built using the best technology of its day, but advancements in geotechnical engineering, hydraulic engineering, concrete materials technology, construction techniques, and many other factors have changed the way that flood protection infrastructure might be built today. In addition, MCD now has the benefit of long-term precipitation and stream flow data collection that was not available to earlier managers, and the ability to better analyze the data. MCD utilizes these tools to evaluate its current infrastructure, prioritizing rehabilitation and need for upgrades.
Funding. As previously discussed, MCD is dependent on local funding for regular operation and maintenance of the system, as well as for capital improvements for infrastructure rehabilitation and safety improvements. Maintenance and capital reinvestment are critical to the safe and effective operation of the flood protection system and cannot be deferred. With little or no federal or state funding sources for these items, the burden is solely on the property owners, cities, and counties that pay MCD assessments. Factors beyond the district’s control such as the economy, urban deterioration, loss of major manufacturing facilities, and decline in property values all affect MCD's ability to collect the necessary level of funding. MCD has reduced operating costs through greater equipment and task efficiencies, and prioritized projects and spending so that it can achieve as much as possible with the funds that are available. MCD staff also participate in several professional organizations such as the Association of State Dam Safety Officials (ASDSO) and the Association of State Floodplain Managers (ASFPM) that both advocate the establishment of new funding programs for dam and levee safety and floodplain management.
Regulatory Expansion. Many federal, state, and local regulations have been adopted since MCD was organized. Specific regulations that affect MCD include those relating to dam safety (federal and state), levee accreditation (federal), environmental requirements (federal and state), floodplain management (federal and local), and storm water management (federal, state, and local). Federal and state agencies have imposed many rules and compliance requirements with no corresponding funding assistance. MCD believes this trend will continue, and participates in several professional organizations that advocate better coordination and streamlining of regulatory requirements and infrastructure funding.
Environmental Opposition. Conflicting opinions about the MCD flood protection system requires staff to spend significant amounts of time responding to those who want to change their management approach, either by negotiation, by legislation, or even through court action. MCD often receives requests to remove levees for better access to the rivers and to modify dams, echoing the growing anti-structural flood protection movement across the nation that believes dams and levees do more harm than good. These groups advocate more federal restrictions and even removal of flood protection infrastructure. MCD addresses this challenge through public education, highlighting that dam removal is not realistic for all communities, especially when flood protection of riparian communities is the priority.
AWRA Case Studies in Proactive Flood Management: Miami Conservancy District (MCD), OH
18
Next Steps
The MCD will continue implementing its basin-wide strategy through the following goals:
• Maintenance, modernization, and upgraded flood protection infrastructure for maintaining performance and safety. Projects that may be implemented at dams and levees include but are not limited to installation of relief wells, construction of impermeable cutoff walls, repair and replacement of deteriorated concrete, installation of toe berms, and removal of undesirable vegetation.
• Internal planning, staff training, and work with local and state agencies to ensure emergency preparedness. Projects include but are not limited to upgrading hydrologic and hydraulic models, maintaining Emergency Action Plans, and educating emergency response personnel about the flood protection system.
• Implementation and maintenance of nonstructural enhancements to the flood protection system including floodplain preservation, storm water management, and public education and awareness.
AWRA Case Studies in Proactive Flood Management: Easton, PA
19
Easton, PA
History of Development and Flooding in Easton
The City of Easton, Pennsylvania, founded in 1752, is nestled in a four-square mile area between two hills at the confluence of the Lehigh and Delaware Rivers, and Bushkill Creek. As with many older cities across the Eastern United States, Easton's history, economy, and patterns of early settlement were tied directly to the location of these streams.
Most of Easton’s dense and historic downtown still lies in the floodplain. Occasional floods, including a severe one in 1955, led the city to adopt the FEMA minimum 100-year flood standard and to participate in the National Flood Insurance Program. In 2004, 2005, and 2006, however, Easton suffered three consecutive and devastating floods that all exceeded the designated 100-year magnitude.
While the community began rebuilding after the first flood event, residents and city staff began to consider alternative solutions after the second and third. Due to Easton’s high-density development, lack of vacant land onto which floodplain structures could be moved, and a strong ethic for historic preservation, a traditional floodplain property buyout program was not an option.
The City had no comprehensive resource or model to turn to for alternatives. In response, a 38-member committee of city officials and residents was formed that re-evaluated the floodplain regulations, focusing on floodplain management and supporting smarter, flood-prepared buildings. The City’s ultimate objective is to clean up—not reconstruct—after future flood events. Easton has taken a holistic, planning-based approach promoting reuse and rehabilitation of floodplain areas. The approach is intended to be sustainable and environmentally responsible, and to minimize damage and hazards when floodwaters come.
A New Flood Standard and Other Flood Response Strategies
With the focus on managing the built environment, Easton has pursued several notable initiatives, many originating in its Department of Planning, Codes, and Development. These include:
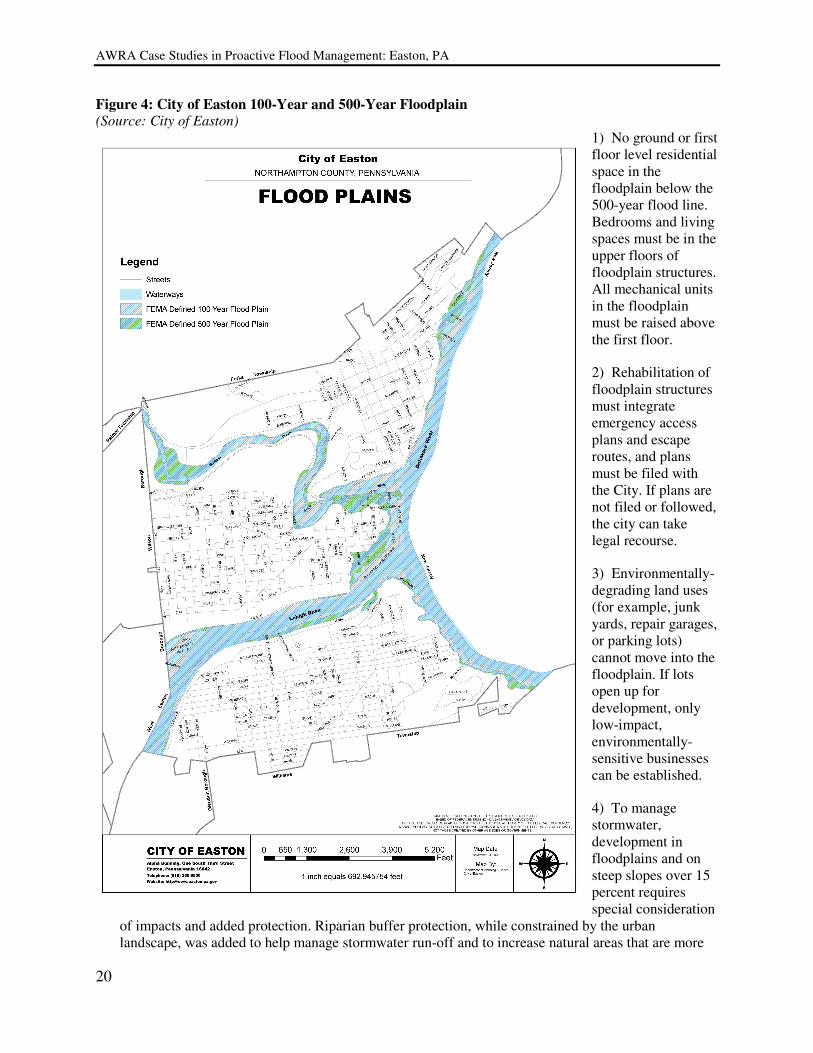
• A 500-Year Flood Standard. In 2007, Easton became the first city in the country to voluntarily expand from FEMA’s recommended 100-year flood standard to a 500-year flood standard. This revision is central to the City’s strategy. Using GIS mapping, Easton’s Planning Department compared flood damages from the 2004-2006 storms to the 100-year and 500-year flood lines (see Figure 4). It became apparent that the 100-year standard and the associated floodplain ordinance provide insufficient protections, and that the scope of damages more resembled 500-year magnitudes. The new 500-year floodplain line is roughly 15-30 feet higher than FEMA’s recommendations. With the new standard in place, Easton is able to regulate a significant portion of the four-square mile municipality, including previously unregulated areas that have shown their vulnerability.
• Revisions to the Municipal Floodplain, Stormwater, and Land-Use Development Ordinances. In 2006, even before the third flood event, Easton rewrote its subdivision, land development, and zoning laws both in and out of the floodplain to protect vulnerable structures and manage stormwater runoff. These revisions were supported by the City’s Planning Commission, City Council, Zoning Hearing Board, Historic Commission District, and Northampton County. They included:
AWRA Case Studies in Proactive Flood Management: Easton, PA
20
Figure 4: City of Easton 100-Year and 500-Year Floodplain (Source: City of Easton)
1) No ground or first floor level residential space in the floodplain below the 500-year flood line. Bedrooms and living spaces must be in the upper floors of floodplain structures. All mechanical units in the floodplain must be raised above the first floor.
2) Rehabilitation of floodplain structures must integrate emergency access plans and escape routes, and plans must be filed with the City. If plans are not filed or followed, the city can take legal recourse.
3) Environmentally-degrading land uses (for example, junk yards, repair garages, or parking lots) cannot move into the floodplain. If lots open up for development, only low-impact, environmentally-sensitive businesses can be established.
4) To manage stormwater, development in floodplains and on steep slopes over 15 percent requires special consideration
of impacts and added protection. Riparian buffer protection, while constrained by the urban landscape, was added to help manage stormwater run-off and to increase natural areas that are more
AWRA Case Studies in Proactive Flood Management: Easton, PA
21
capable of storing water during storm events, and to help improve water quality for fish and aquatic life. These stormwater management and riparian buffer measures were inspired by the bi-county regional Lehigh Valley Planning Commission, which has led initiatives on flood research and written model ordinances.
• Road “Dieting.” As part of stormwater management strategy, Easton has worked to reduce impervious road surfaces. For example, a downtown waterfront four-lane highway was changed to a two-lane road. This reduced impervious surfaces and allowed the City to expand small waterfront parks. In another example, under its campus master plan, Easton’s Lafayette College reduced paved areas and replaced campus roads with green space to help reduce stormwater runoff and improve water quality. A third road-dieting project is being initiated with funding from a Sustainable Communities Grant from the U.S. Department of Housing and Urban Development.
• Park Installation to Prevent Floodplain Development. The City built a new 2.5 mile long linear urban park (the Karl Stirner Arts Trail) along Bushkill Creek to stop housing and commercial development in the floodplain and to connect a new piece of urban space to the Lehigh Valley Greenway, which is a regional trail network running across the width of the state. This linear park helps to protect the creek, increase riparian areas, and manage run-off from a nearby elevated highway.
• Brownfield Reuse and Revitalization. Easton purchased a 14-acre, 14 building former industrial textile mill site in the floodplain along Bushkill Creek. After a public process to determine community priorities, the City decided to rehabilitate the area into a mixed-use cultural district, preserving historic industrial structures that were built to withstand flood. The project creates a significant buffer for Bushkill Creek and is designed to connect to the linear park. Construction is scheduled to begin in 2013.
• Protection of Key Infrastructure. While working to create safer floodplain buildings, Easton built in provisions to allow critical infrastructure to move out of the inundation zone. For example, the City’s Public Works Department now has a mobile unit that can be moved to higher ground to maintain response and service during flood events.
• Involvement in Regional Efforts. Easton holds a seat on the Lehigh Valley Planning Commission board, which leads collaborative regional efforts for flood management along the Lehigh River. The City works also with the Delaware River Basin Commission on bi-state water issues on the Delaware River, and with the Bushkill Stream Conservancy and the Nurture Nature Center.
Costs and Financing
About $400 million was invested in Easton’s floodplain management strategy in the last seven years, including floodplain infrastructure upgrades from the sewer and water authorities. About half of these investments were made with public funds, partly through bond financing. This includes a $9 million grant for floodplain projects from the Governor’s office, the Pennsylvania Legislature, and the Pennsylvania Department of Transportation. Private dollars from gas and electric companies and developers funded rehabilitation of properties and infrastructure upgrades.
Looking beyond floodplain programs, Easton pursues a diverse portfolio of funding and creatively leverages dollars not specific to flood projects to achieve common urban objectives and management goals.
AWRA Case Studies in Proactive Flood Management: Easton, PA
22
Under its new smart transportation policy, the Pennsylvania Department of Transportation provides grants of up to $3 million for road improvement projects that support walkability and multimodal transit. The City of Easton used a grant for road reduction and waterfront park expansion projects in its floodplain.
By partnering with Lehigh Valley Land Recycling Initiative (which conducts environmental remediation of contaminated floodplain lots throughout the region), Easton accessed EPA funding for brownfield remediation.
Benefits
Easton’s floodplain management has made its river corridor a strong environmental, recreational, and economic draw, and the city now enjoys three prosperous riverfronts. Economic revitalization through tourism and transportation opportunities has occurred partly as a result of slowing down traffic with the “road diet” project. Increased urban land preservation, improved access to recreation spaces, flood-proofing of at-risk residential and commercial buildings, and better water quality are among major benefits to the City from its new approach to flood management.
Next Steps
FEMA Flood Map Updates. FEMA is in the process of updating 100-year and 500-year floodplain maps for the City of Easton. Preliminary maps drawn by the agency differ significantly from the damage boundaries that Easton city planners drew after the 2004-2006 storms, and do not accurately convey the risk of flooding if issued, according to city staff. Easton has filed a formal response with FEMA, and is working to resolve the inconsistencies, but may need to hire a consultant to handle the appeal. Whatever delineations FEMA issues, Easton will have to adopt them as its 100- and 500-year floodplain maps.
AWRA Case Studies in Proactive Flood Management: Nashville, TN
23
Nashville, TN
The “1000 Year Flood” and Its Damages
In May 2010, Tennessee experienced unprecedented rainfalls totaling between 10 to 20 inches, a historic two-day precipitation event with a statistical recurrence interval greater than 1,000 years. Floods throughout the Cumberland River Basin, in which Nashville and surrounding Davidson County lie, were too large for the U.S. Army Corps of Engineers flood control dams and reservoirs upstream of city to manage. The storm resulted in 26 flood-related deaths. In addition to loss of life, record flood stages in the Cumberland River and its tributaries led to more than $2 billion in losses, more than 11,000 structures damaged, and 115 road closures including two major interstates (I-24 and I-40). Infrastructure damage was extensive, with significant damage to water and wastewater treatment plants, pump stations, and distribution and collection systems. Many of the city’s main tourist attractions, including several concert halls, incurred millions of dollars in damage. More than 13,000 jobs were temporarily or permanently lost, and an estimated $3.6 billion in commerce was permanently disrupted.
The United Flood Preparedness Plan
As Nashville learned, uncontrolled tributaries can be significant contributors to area-wide flooding. Limited flood mitigation measures on Cumberland River tributaries resulted in much more significant flooding than anticipated. This realization has led the city to consider a more comprehensive, area-wide approach to mitigation. To avoid overlapping efforts, coordinate benefits of combined solutions, and maximize the available resources of all the stakeholders, Nashville Mayor Karl Dean commissioned a study—the United Flood Preparedness Plan (UFPP)—after the 2010 flood to identify and evaluate flood mitigation projects for the Cumberland and its five major tributaries.
The goal of the UFPP is to develop a sustainable flood protection program that improves public safety, protects environmental and cultural resources, and supports economic growth by promoting a unified approach to lowering the damages caused by flooding. Specifically, the plan seeks to identify the locations that would benefit from flood damage reduction projects and to identify and prioritize solutions as funding becomes available. Released in January 2013, the plan took about a year and a half to develop.
Process and Stakeholder Involvement. A driving priority of the UFPP was to collaborate with stakeholders on the development of the plan, engage them in and inform them about the process, and build consensus on final recommendations. The first step was identification of the stakeholder groups and the development of a communications plan. Stakeholders were categorized into three distinct groups: Advisory Committee, Key Stakeholders, and the Public.
The Advisory Committee included representatives from local, state and federal agencies that have funding and/or permitting responsibilities for the implementation of flood damage reduction projects. Key stakeholders included representation from utility providers, elected officials, and active community members including residents affected by the flooding. The public included residential citizens, business owners, and the media.
Several meetings were conducted with each stakeholder group during development of the UFPP. These meetings allowed for sharing of information and gathering of input from stakeholders through a collaborative effort engaging federal, state, and local actors.
AWRA Case Studies in Proactive Flood Management: Nashville, TN
24
Some of those involved were:
• Government Entities. These included the Governor’s office, U.S. Army Corps of Engineers, FEMA, Tennessee Emergency Management Agency, and the Tennessee Department of Environment and Conservation. Neighboring counties were also included in planning.
• Critical Service Providers. These encompassed police, fire, emergency medical services, utilities, transportation, and medical representatives.
• Environmental Groups. Representatives from the Cumberland River Compact and from local watershed associations (the Harpeth River Watershed Association, the Mill Creek Watershed Association, and the Richland Creek Watershed Association) participated.
• Business Community. These involved representatives from the Downtown Partnership, the Chamber of Commerce, and individual businesses.
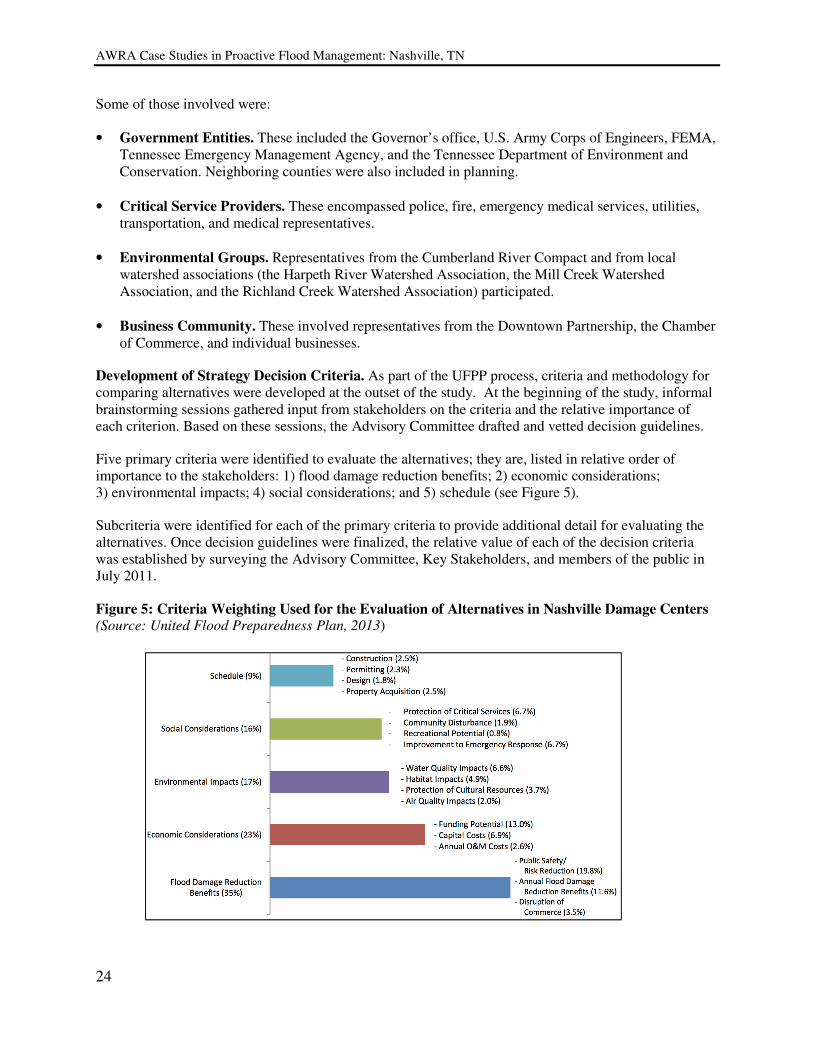
Development of Strategy Decision Criteria. As part of the UFPP process, criteria and methodology for comparing alternatives were developed at the outset of the study. At the beginning of the study, informal brainstorming sessions gathered input from stakeholders on the criteria and the relative importance of each criterion. Based on these sessions, the Advisory Committee drafted and vetted decision guidelines.
Five primary criteria were identified to evaluate the alternatives; they are, listed in relative order of importance to the stakeholders: 1) flood damage reduction benefits; 2) economic considerations; 3) environmental impacts; 4) social considerations; and 5) schedule (see Figure 5).
Subcriteria were identified for each of the primary criteria to provide additional detail for evaluating the alternatives. Once decision guidelines were finalized, the relative value of each of the decision criteria was established by surveying the Advisory Committee, Key Stakeholders, and members of the public in July 2011.
Figure 5: Criteria Weighting Used for the Evaluation of Alternatives in Nashville Damage Centers (Source: United Flood Preparedness Plan, 2013)
AWRA Case Studies in Proactive Flood Management: Nashville, TN
25
Damage Center Identification. Another objective was to identify the areas in Nashville and Davidson County with the potential to suffer the most flood-related damage, and that would benefit most from flood damage reduction measures. To do this, a number of geospatial data sets were prepared and analyzed to indicate locations in the county with the potential for flood damage. Geospatial data showing areas of potential and actual damage were added to a Geographic Information System (GIS) to identify the most concentrated damage.
Initially, areas with the highest potential for damage (within the 500-year floodplain and within the 2010 flood inundation zone) were identified. Areas with high potential that had been the subject of past Metro or U.S. Army Corps of Engineers studies were highlighted. These high potential areas were screened further by adding map layers of actual concentrated property damage during the 2010 flood.
Areas that had high flooding potential and high actual damages were prioritized if any critical infrastructure (facilities, roads, or utilities) or high population or flood fatality statistics fell within the damage area. Sites from across Davidson County that had the highest potential and actual damages and contained the most critical infrastructure were selected as damage centers.
In all, 22 damage centers were identified across the county. Once identified, each damage center was visited to obtain site-specific information and to assess the suitability of flood damage reduction strategies. After a site visit, viable flood damage reduction alternatives were developed for the damage center, and costs of constructing and maintaining the alternative were prepared. Subsequently, the annual benefits derived from the implementation of specific alternatives were also quantified.
Methodology for Choosing Flood Damage Reduction Alternatives
Eleven flood damage reduction alternatives across three categories—flood mitigation, flood protection, and flood control—were considered for each of the 22 damage centers. Flood mitigation alternatives included floodproofing/elevation, acquisition/buyout, flood warning/preparedness, land-use regulations, and stream debris removal. Flood protection alternatives consisted of levees and floodwalls. Flood control alternatives considered were reservoirs, off-channel storage, diversion, bridge improvement, and channel modification.
Alternatives at each damage center were evaluated by comparing damages without alternatives and the relative benefits if they were implemented. The estimated costs and benefits of each scenario were entered into a decision model to identify the highest rated alternative. The value of qualitative and quantitative factors was weighted based on input developed from feedback provided by stakeholders, technical advisors, and the general public. Decision software (Criteria Design Plus) was used to amalgamate stakeholder input and produce final rankings of preferred alternatives for each center. Out of 11 possible, three alternatives on average were chosen as priorities for each damage center.
Current Flood Damage Reduction Strategies
During the first round of public meetings, participants emphasized a strong desire among residents to be provided better notification of pending hazard. Flood warning ranked as one of the best solutions for nearly every damage center. In response to this interest, two flood warning programs—Nashville SAFE (Situational Awareness for Flooding Events) and NERVE (Nashville Emergency Response Viewing Engine)—have been established and implemented to better disseminate information about neighborhood conditions and evacuation options. Nashville’s preexisting Home Buyout Program is currently being expanded, removing vulnerable floodplain structures from harm’s way. Also, alternatives at water and wastewater treatment plants have
AWRA Case Studies in Proactive Flood Management: Nashville, TN
26
been identified to address flood risk to water infrastructure. Another measure in use is the National Flood Insurance Program. Nashville SAFE (Situational Awareness for Flooding Events). One of the many flood response efforts undertaken by Nashville city government following the flood of May 2010 was the creation of a multi-agency, community-wide flood warning system. This system is called the Situational Awareness for Flooding Events, or the Nashville SAFE Program. Primary responsibility for the SAFE program rests with Metro Water Services. The SAFE Program was developed to assist emergency personnel in making prudent decisions in anticipation of and during flood events for public safety. This collaborative effort included the development and maintenance of a flood warning system utilizing GIS tools, numerical models, real-time and forecasted data, communications and coordination among agencies, decision support tools, and targeted response actions. The result is a flood warning system that specifically satisfies the needs of local emergency managers, is well-understood by all, and is cost-effective. Integral to the SAFE program are:
• Watershed Advisory Guides (WAGs) were created for the six primary watersheds in Davidson County. WAGs are reference manuals that combine flood modeling, inundation mapping, and GIS data into watershed-specific flood impact assessments. The WAGs provide Metro Water Services and other city departments with the decision support needed to determine and prioritize flood response actions, including evacuation, closure of bridges and roads, and sandbagging in strategic locations.
• Watershed Advisors. Metro Water Services has selected trained scientists and engineers whose purpose is to analyze current and predicted stream conditions and make recommendations to the City’s Office of Emergency Management during a flood event in an attempt to minimize potential human loss or injury and property damage from flooding. Emergency procedures and standards of practice for Watershed Advisors were developed in order to ensure that Advisors get a full understanding of the interrelationships between data and are able to interpret information, in real time, while collaborating with other agencies. Watershed Advisors are trained through multiple in-service training sessions and table-top exercises.
• Emergency Support Coordination. Metro Water Services provides additional flood warning support and emergency management coordination during activations of the Emergency Operations Center. Staff is stationed at the Emergency Operations Center during flood events to assist in the real-time development of emergency action plans, customized for the imminent flood event.
• Remote Sensing Data. Metro Water Services continues to improve the accuracy and effectiveness of the Nashville SAFE Program through the integration of additional remote sensing data. Currently, remote sensing data at 18 rain gages, river stage data from the Dry Creek Weir, and video collected by mobile webcams are being integrated into the Nashville SAFE Program online mapping tool.
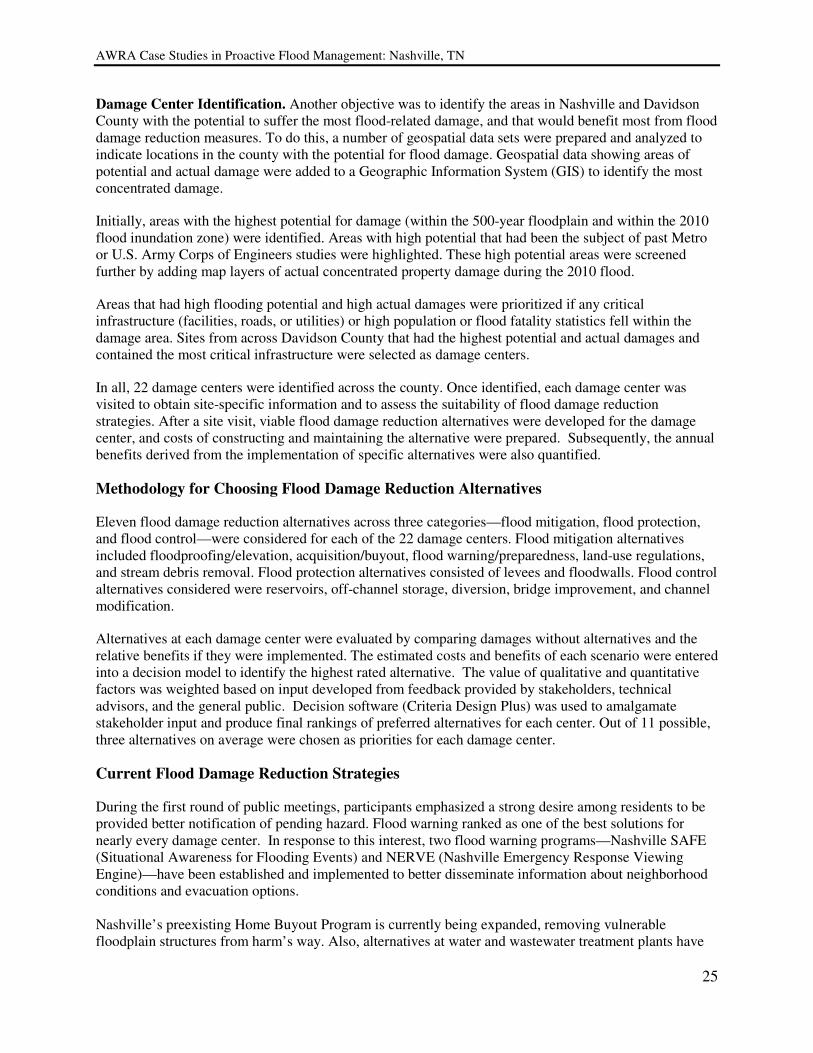
NERVE (Nashville Emergency Response Viewing Engine). In an effort to communicate information from the SAFE Program during a flood event, Metro has developed NERVE (Nashville Emergency Response Viewing Engine), an online interactive mapping site designed to provide timely information about real-time natural or man-made emergencies in Nashville. See a sample page in Figure 6 and NERVE live at http://maps.nashville.gov/NERVE.
NERVE and SAFE represent some of the most advanced flood inundation forecasting and warning systems in the country. Use of these tools for future flooding events will improve public safety and reduce property damage.
AWRA Case Studies in Proactive Flood Management: Nashville, TN
27
Figure 6: Nashville Emergency Response Viewing Engine (NERVE) (Source: United Flood Preparedness Plan, 2013)
As an emergency arises, the web site will provide information about road closures, evacuation areas or routes, shelters, and relief centers. Citizens can use the site to see what is happening around them and to find a path to their destination that avoids closed roads or other obstructions. Local media will also use NERVE as a source for communicating with the public regarding recommended evacuations and road closures.
The Home Buyout Program. Another alternative that rated high for residential damage centers is home buyout and removal from the floodplain. Acquisition of properties that are susceptible to extreme flooding on a frequent basis has been a part of the Metro Nashville flood mitigation strategy for more than 30 years. Prior to the flood of May 2010, Metro Nashville acquired and removed more than 50 residential structures from local floodplains and floodways.
Following the May 2010 flood, this mitigation strategy became more formalized and focused, and is a key component of floodplain management efforts by Metro Water Services. Since 2010, Metro Water Services has identified more than 300 residential structures for acquisition and purchased and removed more than 200 of these structures.
Water Infrastructure (Treatment Plant Mitigation Measures). The May 2010 flood severely damaged two of Nashville’s three wastewater treatment plants and one of the City’s two water treatment plants. A second water treatment plant remained in service throughout the flood but came to within inches of being flooded.
Shortly after the floodwaters receded, Metro Water Services commenced with flood-related response work at all their facilities. FEMA’s Public Acceptance Program helps communities with flood damage to return facilities to their pre-flood condition and improve their resiliency against future flood disasters. As a part of this program, Metro Water Services has submitted Hazard Mitigation Proposals (HMPs) to
AWRA Case Studies in Proactive Flood Management: Nashville, TN
28
FEMA for each of the effected treatment facilities. The HMPs are currently under review and consideration by FEMA.
Proposed mitigation measures for treatment plants include: perimeter floodwalls consisting of a combination of earthen berms, sheet-pipe walls, and flood gates for protection; raised electrical equipment and HVAC ducts; dry floodproofing of structures (e.g. installing concrete barriers around filters, sealing exterior doors); wet floodproofing of structures (e.g. installing submersible pumps); installation of walls and gates around individual buildings; and relocation of facilities above the 500-year flood zone.
National Flood Insurance Program Enrollment. Metro Nashville and Davidson County have participated in the National Flood Insurance Program (NFIP) since 1982. All properties in the county are eligible for flood insurance, although only about one in four flood-susceptible property owners carry it. Each year, Metro Water Services notifies property owners in the 100-year floodplain about the importance of obtaining flood insurance.
Costs and Financing
Flood Warning/Preparedness Programs (NERVE and SAFE). The development and maintenance costs for SAFE, totaling $4.4 million, were divided evenly over the 22 damage centers, equating to $200,000 per damage center and $100,000 per year. This is currently paid for through Metro Water Services Operations and Maintenance funds. Possible sources of continued funding include NOAA/National Weather Service’s Automated Flood Warning System (AFWS) program and the U.S. Geological Survey’s Cooperative Water Program.
Home Buyout Program. Demolition costs for houses were provided by Metro Water Services based on recent data from the Existing Home Buyout Program. The cost of demolition, removal, and revegetation of each site included in the evaluation was $25,000. Acquisitions have been funded via federal, state, and local dollars, however the program is continuing to seek funding for additional buyouts.
• Federal: FEMA supports home buyout through grant programs such as the Hazard Mitigation Grant Program. For qualifying structures, FEMA grants cover 75 percent of the cost of acquisition and removal. This funding is being administered by the Tennessee Emergency Management Agency, the state FEMA office.
• State: The Tennessee Department of Environment and Conservation has several programs (Land and Water Conservation Fund, Natural Resources Trust Fund, Local Parks and Recreation Fund, Recreational Trails Program) to financially assist with removal of floodplain structures.
• Local: Metro Water Services has incorporated funding for the buyout program in its capital improvement plan.
Water Infrastructure Measures. Proposed measures for a total of four facilities are estimated to cost $39.6 million. Approved mitigation projects are funded by federal (75 percent), state (12.5 percent), and local funds (12.5 percent).
Structural Components. The flood damage reduction alternatives evaluated in the UFPP and determined to be worthy of further consideration will be included in a subsequent Feasibility Study led by the U.S. Army Corps of Engineers (USACE). The Feasibility Study is the next step in the federal funding process. The USACE will further evaluate alternatives in the Feasibility Study to determine projects that are cost-effective for recommendation of federal funding for design and construction.
AWRA Case Studies in Proactive Flood Management: Nashville, TN
29
The greatest challenge to Metro Water Services has been learning the FEMA reimbursement processes, and other funding rules and regulations.
Benefits
Increased Recreational Access. Using the Home Buyout Program, about 220 properties (and eight more pending) have been acquired, totaling approximately 104 acres. Thus far, almost seven acres have been turned into a park, and 2.41 acres have been used to establish an urban farm. Much of the remaining property will be utilized as greenways.
Enhanced Use and Understanding of Data. Through implementation of Nashville SAFE, collaboration with various agencies such as the National Weather Service, U.S. Geological Survey, U.S. Army Corps of Engineers, and the Metro Office of Emergency Management has allowed Metro Water Services to understand interrelationships between various types of data available for analysis during a flood event, and to interpret it in real-time. This allows them to provide specific direction to their emergency responders, keep the citizens of Nashville informed about potential flood events, target roadways and bridges to blockade, and direct evacuations of residents in harm’s way.
Next Steps
Structural solutions (i.e. reservoirs, levees, floodwalls, diversions, channel modification, bridge improvements, etc.) were also identified as priority alternatives. These components await evaluation by the U.S. Army Corps of Engineers, which will assess the cost-effectiveness of each project. Projects deemed cost-effective will be recommended for design and construction. By reducing the number of damage center-specific alternatives from 11 to approximately three for each damage center, and by generating cost opinions for the construction, operation, and maintenance of these alternatives, the Unified Flood Preparedness Program has resulted in the acceleration of this planning process. Once funding for the feasibility studies is appropriated, the studies will commence. They should be complete in three years.
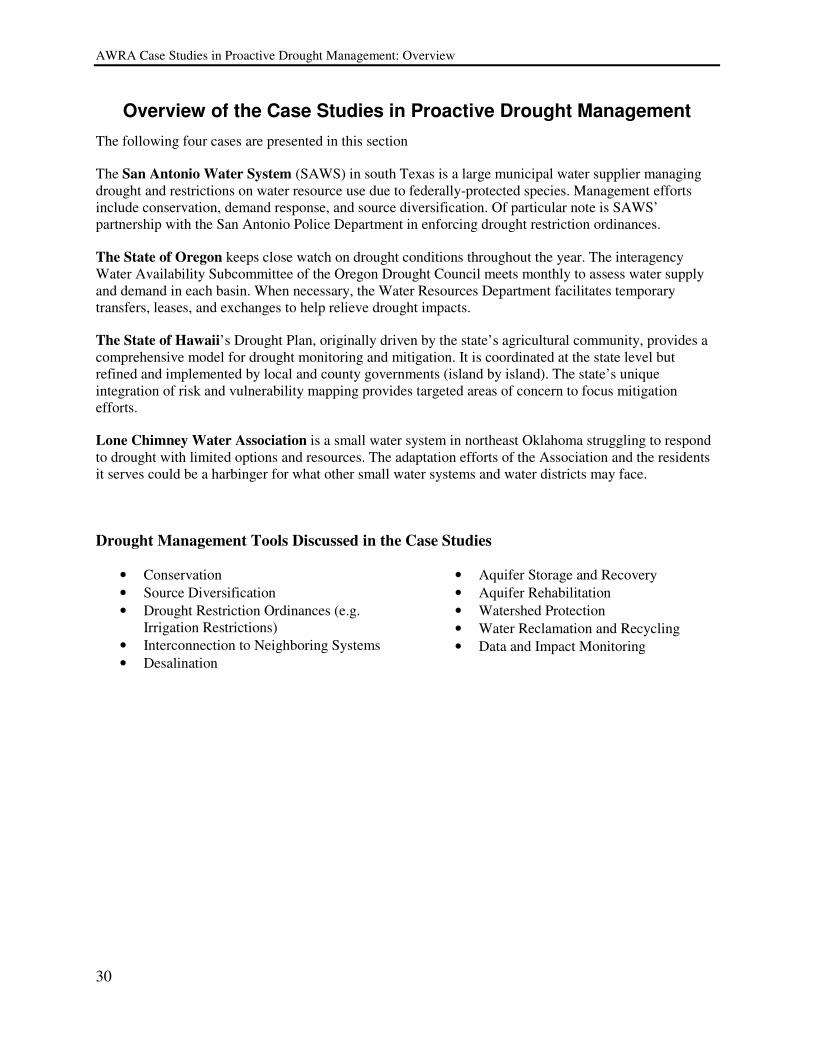
AWRA Case Studies in Proactive Drought Management: Overview
30
Overview of the Case Studies in Proactive Drought Management
The following four cases are presented in this section
The San Antonio Water System (SAWS) in south Texas is a large municipal water supplier managing drought and restrictions on water resource use due to federally-protected species. Management efforts include conservation, demand response, and source diversification. Of particular note is SAWS’ partnership with the San Antonio Police Department in enforcing drought restriction ordinances.
The State of Oregon keeps close watch on drought conditions throughout the year. The interagency Water Availability Subcommittee of the Oregon Drought Council meets monthly to assess water supply and demand in each basin. When necessary, the Water Resources Department facilitates temporary transfers, leases, and exchanges to help relieve drought impacts.
The State of Hawaii’s Drought Plan, originally driven by the state’s agricultural community, provides a comprehensive model for drought monitoring and mitigation. It is coordinated at the state level but refined and implemented by local and county governments (island by island). The state’s unique integration of risk and vulnerability mapping provides targeted areas of concern to focus mitigation efforts.
Lone Chimney Water Association is a small water system in northeast Oklahoma struggling to respond to drought with limited options and resources. The adaptation efforts of the Association and the residents it serves could be a harbinger for what other small water systems and water districts may face.
Drought Management Tools Discussed in the Case Studies
• Conservation
• Source Diversification
• Drought Restriction Ordinances (e.g. Irrigation Restrictions)
• Interconnection to Neighboring Systems
• Desalination
• Aquifer Storage and Recovery
• Aquifer Rehabilitation
• Watershed Protection
• Water Reclamation and Recycling
• Data and Impact Monitoring
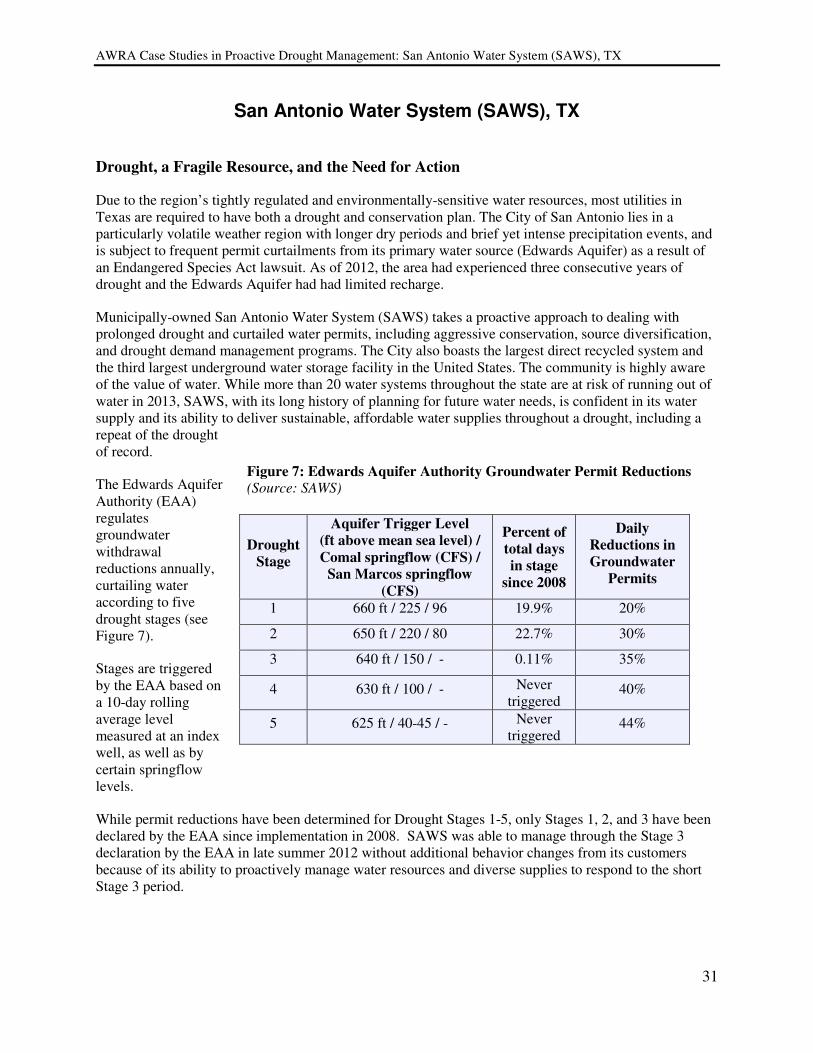
AWRA Case Studies in Proactive Drought Management: San Antonio Water System (SAWS), TX
31
San Antonio Water System (SAWS), TX
Drought, a Fragile Resource, and the Need for Action
Due to the region’s tightly regulated and environmentally-sensitive water resources, most utilities in Texas are required to have both a drought and conservation plan. The City of San Antonio lies in a particularly volatile weather region with longer dry periods and brief yet intense precipitation events, and is subject to frequent permit curtailments from its primary water source (Edwards Aquifer) as a result of an Endangered Species Act lawsuit. As of 2012, the area had experienced three consecutive years of drought and the Edwards Aquifer had had limited recharge.
Municipally-owned San Antonio Water System (SAWS) takes a proactive approach to dealing with prolonged drought and curtailed water permits, including aggressive conservation, source diversification, and drought demand management programs. The City also boasts the largest direct recycled system and the third largest underground water storage facility in the United States. The community is highly aware of the value of water. While more than 20 water systems throughout the state are at risk of running out of water in 2013, SAWS, with its long history of planning for future water needs, is confident in its water supply and its ability to deliver sustainable, affordable water supplies throughout a drought, including a repeat of the drought of record.
The Edwards Aquifer Authority (EAA) regulates groundwater withdrawal reductions annually, curtailing water according to five drought stages (see Figure 7).
Stages are triggered by the EAA based on a 10-day rolling average level measured at an index well, as well as by certain springflow levels.
While permit reductions have been determined for Drought Stages 1-5, only Stages 1, 2, and 3 have been declared by the EAA since implementation in 2008. SAWS was able to manage through the Stage 3 declaration by the EAA in late summer 2012 without additional behavior changes from its customers because of its ability to proactively manage water resources and diverse supplies to respond to the short Stage 3 period.
Figure 7: Edwards Aquifer Authority Groundwater Permit Reductions (Source: SAWS)
Drought
Stage
Aquifer Trigger Level
(ft above mean sea level) /
Comal springflow (CFS) /
San Marcos springflow
(CFS)
Percent of
total days
in stage
since 2008
Daily
Reductions in
Groundwater
Permits
1 660 ft / 225 / 96 19.9% 20%
2 650 ft / 220 / 80 22.7% 30%
3 640 ft / 150 / - 0.11% 35%
4 630 ft / 100 / - Never triggered
40%
5 625 ft / 40-45 / - Never triggered
44%
AWRA Case Studies in Proactive Drought Management: San Antonio Water System (SAWS), TX
32
A Diverse Portfolio of Drought Management Strategies
SAWS pursues a comprehensive portfolio of proactive conservation, drought restrictions enforcement, source diversification, innovative water storage, and internal data-sharing integrated in its drought management and planning. These strategies are articulated in the 2012 Water Management Plan, which was developed in consultation with the City and citizens.
Water Conservation
• Conservation as Supply. SAWS considers water conservation as a water supply, and puts great effort into conservation measures and incentives. As a result, there has been a gradual, voluntary decrease in per capita consumption for residential and commercial users (from 225 gallons per capita in the early 1980s to 143 gallons per capita per day in 2011).
• Non-voluntary Measures. Several non-voluntary conservation measures have been implemented. The SAWS rate structure encourages conservation through higher per-unit rates for users of large volumes of water. (The rates also include revenue specifically for conservation. In 2012, this source generated $10 million.) A water waste ordinance makes waste such as runoff into a gutter or failure to repair a controllable leak illegal. An indoor water appliances ordinance requires faucets and toilets to meet EPA WaterSense Program guidelines in new construction.
• Voluntary Programs and Incentives. SAWS administers an efficient water equipment distribution program, providing up to two free high efficiency residential toilets for homes built before 1992. There are free installation and repair service programs available based on income level.
Another initiative involves retrofits of high efficiency commercial toilets (for toilets from 1992 or earlier). Free installation is available if cost/benefit analysis shows sufficient savings. It also provides high efficiency water fixtures such as showerheads and aerators.
Some changes (such as new reclamation systems, elimination of water intensive processes, and landscape or irrigation changes) are eligible for rebates based on water savings over the life of the change. For example, improvements to commercial irrigation design can earn up to $6,000. SAWS conservation consultants offer assistance in guiding improvements. Improvements to current residential irrigation can earn up to $800. SAWS conservation consultants offer assistance in guiding these improvements. New xeriscaped landscape designs can earn up to $400 in rebates if they meet WaterSaver Landscape requirements (no more than 50 percent of the area may be turf). Pool filter replacements for high-efficiency cartridge filter systems earn up to $250. SAWS also offers rebates on water reclamation systems.
• Education and Outreach on Behavioral Change. SAWS encourages behavioral changes through educational and outreach campaigns. Campaigns addressing indoor water use include WaterSaver Home Checkups, which provide a free water use consultation with a conservation expert. Other efforts focus on landscape irrigation and design using only the necessary amount of water for a landscape, given site conditions and plant material. (In addition, San Antonio Botanical Garden’s WaterSaver Lane installation provides examples of xeriscaping.)
• Face-to-Face Education Events and Workshops serve 100,000 customers a year. They encourage customers to change habits and to use the incentive programs. The face-to-face events are staffed by SAWS employees or partners like the Master Gardeners. In addition, a colorful Conservation E-Newsletter is delivered to 12,000 e-mail inboxes each week. It offers timely landscape irrigation advice, seasonal gardening information, and highlights upcoming education events.
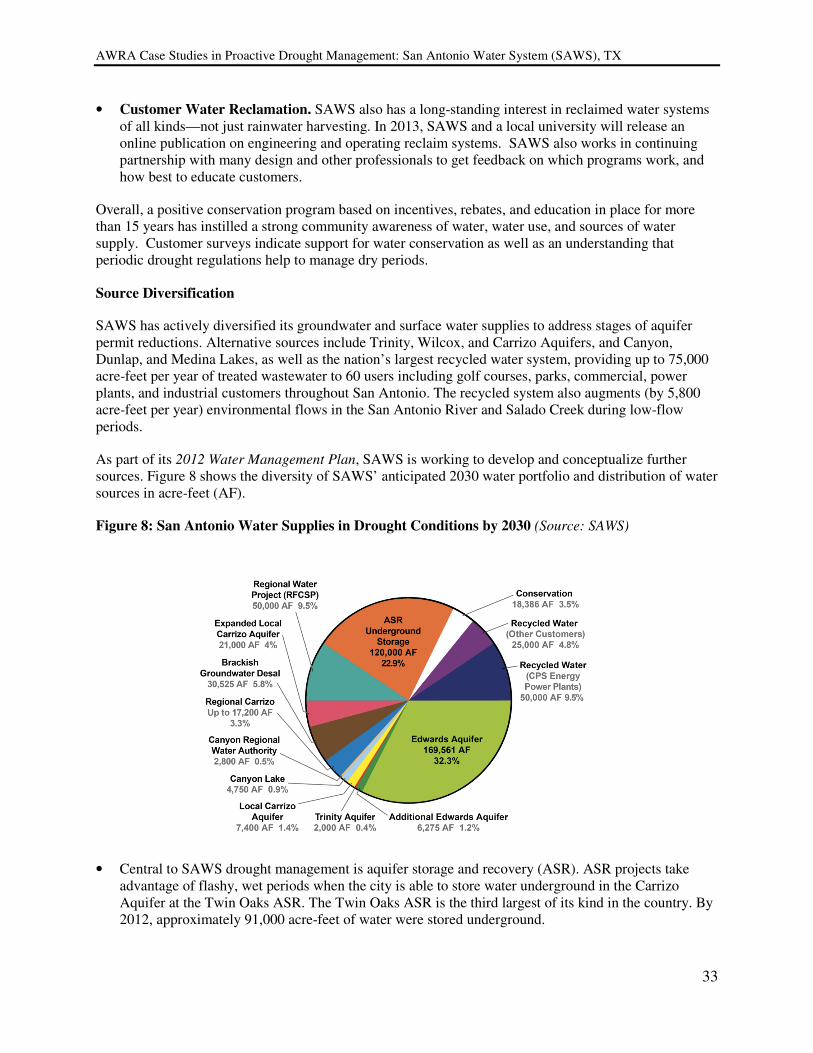
AWRA Case Studies in Proactive Drought Management: San Antonio Water System (SAWS), TX
33
• Customer Water Reclamation. SAWS also has a long-standing interest in reclaimed water systems of all kinds—not just rainwater harvesting. In 2013, SAWS and a local university will release an online publication on engineering and operating reclaim systems. SAWS also works in continuing partnership with many design and other professionals to get feedback on which programs work, and how best to educate customers.
Overall, a positive conservation program based on incentives, rebates, and education in place for more than 15 years has instilled a strong community awareness of water, water use, and sources of water supply. Customer surveys indicate support for water conservation as well as an understanding that periodic drought regulations help to manage dry periods.
Source Diversification
SAWS has actively diversified its groundwater and surface water supplies to address stages of aquifer permit reductions. Alternative sources include Trinity, Wilcox, and Carrizo Aquifers, and Canyon, Dunlap, and Medina Lakes, as well as the nation’s largest recycled water system, providing up to 75,000 acre-feet per year of treated wastewater to 60 users including golf courses, parks, commercial, power plants, and industrial customers throughout San Antonio. The recycled system also augments (by 5,800 acre-feet per year) environmental flows in the San Antonio River and Salado Creek during low-flow periods.
As part of its 2012 Water Management Plan, SAWS is working to develop and conceptualize further sources. Figure 8 shows the diversity of SAWS’ anticipated 2030 water portfolio and distribution of water sources in acre-feet (AF).
Figure 8: San Antonio Water Supplies in Drought Conditions by 2030 (Source: SAWS)
• Central to SAWS drought management is aquifer storage and recovery (ASR). ASR projects take advantage of flashy, wet periods when the city is able to store water underground in the Carrizo Aquifer at the Twin Oaks ASR. The Twin Oaks ASR is the third largest of its kind in the country. By 2012, approximately 91,000 acre-feet of water were stored underground.
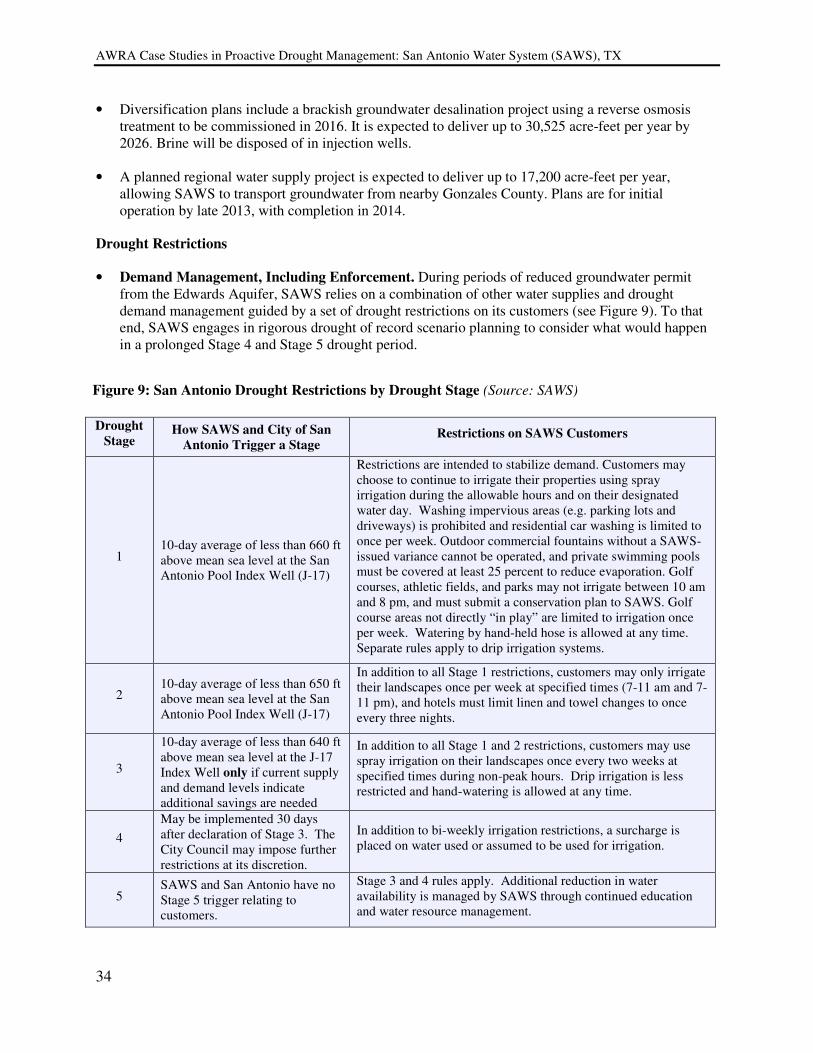
AWRA Case Studies in Proactive Drought Management: San Antonio Water System (SAWS), TX
34
• Diversification plans include a brackish groundwater desalination project using a reverse osmosis treatment to be commissioned in 2016. It is expected to deliver up to 30,525 acre-feet per year by 2026. Brine will be disposed of in injection wells.
• A planned regional water supply project is expected to deliver up to 17,200 acre-feet per year, allowing SAWS to transport groundwater from nearby Gonzales County. Plans are for initial operation by late 2013, with completion in 2014.
Drought Restrictions
• Demand Management, Including Enforcement. During periods of reduced groundwater permit from the Edwards Aquifer, SAWS relies on a combination of other water supplies and drought demand management guided by a set of drought restrictions on its customers (see Figure 9). To that end, SAWS engages in rigorous drought of record scenario planning to consider what would happen in a prolonged Stage 4 and Stage 5 drought period.
Figure 9: San Antonio Drought Restrictions by Drought Stage (Source: SAWS)
Drought
Stage How SAWS and City of San
Antonio Trigger a Stage Restrictions on SAWS Customers
1 10-day average of less than 660 ft above mean sea level at the San Antonio Pool Index Well (J-17)
Restrictions are intended to stabilize demand. Customers may choose to continue to irrigate their properties using spray irrigation during the allowable hours and on their designated water day. Washing impervious areas (e.g. parking lots and driveways) is prohibited and residential car washing is limited to once per week. Outdoor commercial fountains without a SAWS-issued variance cannot be operated, and private swimming pools must be covered at least 25 percent to reduce evaporation. Golf courses, athletic fields, and parks may not irrigate between 10 am and 8 pm, and must submit a conservation plan to SAWS. Golf course areas not directly “in play” are limited to irrigation once per week. Watering by hand-held hose is allowed at any time. Separate rules apply to drip irrigation systems.
2 10-day average of less than 650 ft above mean sea level at the San Antonio Pool Index Well (J-17)
In addition to all Stage 1 restrictions, customers may only irrigate their landscapes once per week at specified times (7-11 am and 7-11 pm), and hotels must limit linen and towel changes to once every three nights.
3
10-day average of less than 640 ft above mean sea level at the J-17 Index Well only if current supply and demand levels indicate additional savings are needed
In addition to all Stage 1 and 2 restrictions, customers may use spray irrigation on their landscapes once every two weeks at specified times during non-peak hours. Drip irrigation is less restricted and hand-watering is allowed at any time.
4
May be implemented 30 days after declaration of Stage 3. The City Council may impose further restrictions at its discretion.
In addition to bi-weekly irrigation restrictions, a surcharge is placed on water used or assumed to be used for irrigation.
5 SAWS and San Antonio have no Stage 5 trigger relating to customers.
Stage 3 and 4 rules apply. Additional reduction in water availability is managed by SAWS through continued education and water resource management.
AWRA Case Studies in Proactive Drought Management: San Antonio Water System (SAWS), TX
35
• Restrictions Are Enforced by the San Antonio Police Department and Municipal Court. This is highly successful in fostering compliance and a strong culture of water awareness. Drought management restrictions are written into city ordinances and enforced by police citations. Fines range from $250 to $1000, with municipal court appearances required for second (or additional) violations.
• Customer Surveys Indicate Strong Public Support for Enforcement Programs. Demand management strategies focus on landscape irrigation.
Aquifer Protection through Land and Habitat Conservation
In 2000, a 1/8-cent sales tax increase was passed (and repeatedly reapproved by voters, most recently in 2010) to fund a land acquisition and conservation easement program for the Edwards Aquifer recharge zone. It has helped place easements with willing landowner-stewards on more than 90,000 acres. In a separate effort begun in 2007, a diverse group of stakeholders concerned with the use and management of the Edwards Aquifer began a collaborative process to resolve long-standing issues associated with aquifer management and the protection of listed species. The Edwards Aquifer Recovery Implementation Program Habitat Conservation Plan brings certainty that the aquifer will be managed in a balanced manner during droughts. This significant conservation achievement was mainly financed by fees charged to municipal and industrial users of the Aquifer.
Internal Communication and Data-Sharing
The SAWS Drought Management Team meets weekly to discuss status, trends, and opportunities associated with drought, distributes up-to-date data and models to staff, and makes recommendations to management about strategic direction and drought stages.
Costs and Financing
Conservation programs are highly competitive with new supply development. In the past, new conservation initiatives had to be priced at $400 or less per acre-foot. Now, however, up to $1,100 per acre-foot is allowed for measures reducing peak demand in summer. Drought demand management costs—including staff salaries and enforcement measures—are consistently under $100 per acre-foot of water savings. In contrast, water supply development projects range in cost from more than $540 to more than $2,650 per acre-foot. Projects of either type are mostly funded by a water supply fee in each SAWS water bill. SAWS also leverages Texas’ Drinking Water State Revolving Loan Program.
Benefits
Efforts by SAWS and the City to address drought have resulted in ecological benefits from protecting important terrestrial and aquatic ecosystems.
Supply benefits from conservation, source diversification, and drought demand management have reduced reliance on Edwards Aquifer by 24 percent in ten years.
Economic growth has also been a benefit, as water for indoor residential, commercial, business, industrial, and institutional uses in San Antonio is not affected by drought management.
Next Steps
The SAWS 2012 Water Management Plan is a roadmap for future strategies and water security through 2040. Embedded in this guide are strategic shifts in focus, including reducing non-revenue water by
AWRA Case Studies in Proactive Drought Management: San Antonio Water System (SAWS), TX
36
analyzing water losses and investment in technology and processes. Focusing on outdoor conservation efforts helps SAWS address its greatest challenge: the increased use of water by new landscape irrigation systems. SAWS is seeking reductions in irrigation use through smarter landscape design and management strategies. The 2012 Water Management Plan’s conservation goals are to provide 16,500 acre-feet of water per year by 2020, and reduce per capita use from 143 to 135 gallons per day. It also calls for diversifying the water portfolio, acquiring 112,500 additional acre-feet of water by 2026 to provide water security through the year 2040, even during a repeat drought of record.
Effectiveness of drought restrictions will also be evaluated. If Stage 3, 4, or 5 drought demand management restrictions are invoked, SAWS will assess their effectiveness at achieving desired demand reduction and water supply protection outcomes.

AWRA Case Studies in Proactive Drought Management: The State of Oregon
37
The State of Oregon
History of Drought in Oregon
State declaration of drought conditions were made in various counties throughout Oregon every year from 2001 through 2005. Conditions in 2001 and 2002 were exacerbated by actions taken by the federal government in the Klamath Basin. During the 2005 drought, the Governor issued declarations for eight counties, all east of the Cascade Mountains, including Baker, Crook, Gilliam, Hood River, Klamath, Morrow, Sherman, and Umatilla counties. During the same time period, the U.S. Department of Agriculture (USDA) issued drought declarations in Coos, Klamath, and Umatilla counties, overlapping two of the Governor’s declarations. The USDA declarations provided access to emergency loans for crop losses. Wheeler County made a county-only declaration. Seven counties saw drought declarations in 2007 and 2010. In 2013, Klamath, Baker, Malheur, and Gilliam counties saw drought declarations.
Protocol for Drought Declarations
The Governor has sole discretion to issue or terminate a drought emergency declaration in any geographical area within the state that is appropriate. County boundaries are generally used in these declarations because of the benefits of working with a recognized local government. Oregon officials have found that the process is most successful if the declaration process follows a consistent series of steps for emergency declarations, where counties make their declarations and then ask for a state declaration based on additional need for assistance. County governments begin the process by working with the state's Emergency Action Coordinator.
There are two types of drought declaration in Oregon:
The first is a pre-emptive declaration by the Governor, triggering a number of drought-related tools to help local communities mitigate the effects of drought. The legal framework for drought mitigation can be found in Oregon Law.
The second is a request for a federal designation, made after the fact, to offset the cost of crop losses that occurred during the drought. When there is crop loss in a farm community, the Governor can request a drought declaration by the U.S. Secretary of Agriculture. Requests for a federal declaration are processed by the Oregon Department of Agriculture and forwarded by the Oregon Drought Council to the Governor’s natural resource office. An economic assessment by the U.S. Department of Agriculture can then determine if the required level of crop loss is met and financial assistance can be provided as compensation.
Oregon Drought Council
Oregon’s Drought Council was established in 1988, specifically to anticipate and plan for drought. It is chaired and facilitated by Oregon Emergency Management. Members of the Council include state agencies, federal agencies, and private organizations. The diverse composition of the Council was designed to ensure full representation of affected interests and jurisdictions. The Drought Council is a standing committee that convenes regularly, holding public meetings during a drought cycle.
The Drought Council is responsible for assessing the impact of drought conditions and for making recommendations to the Governor´s senior advisors. The Council has a subcommittee, called the Water Availability Committee of Oregon, and membership includes technical staff from the Oregon Water Resources Department (chair), Oregon Climate Service, the snow survey section of the Natural Resource
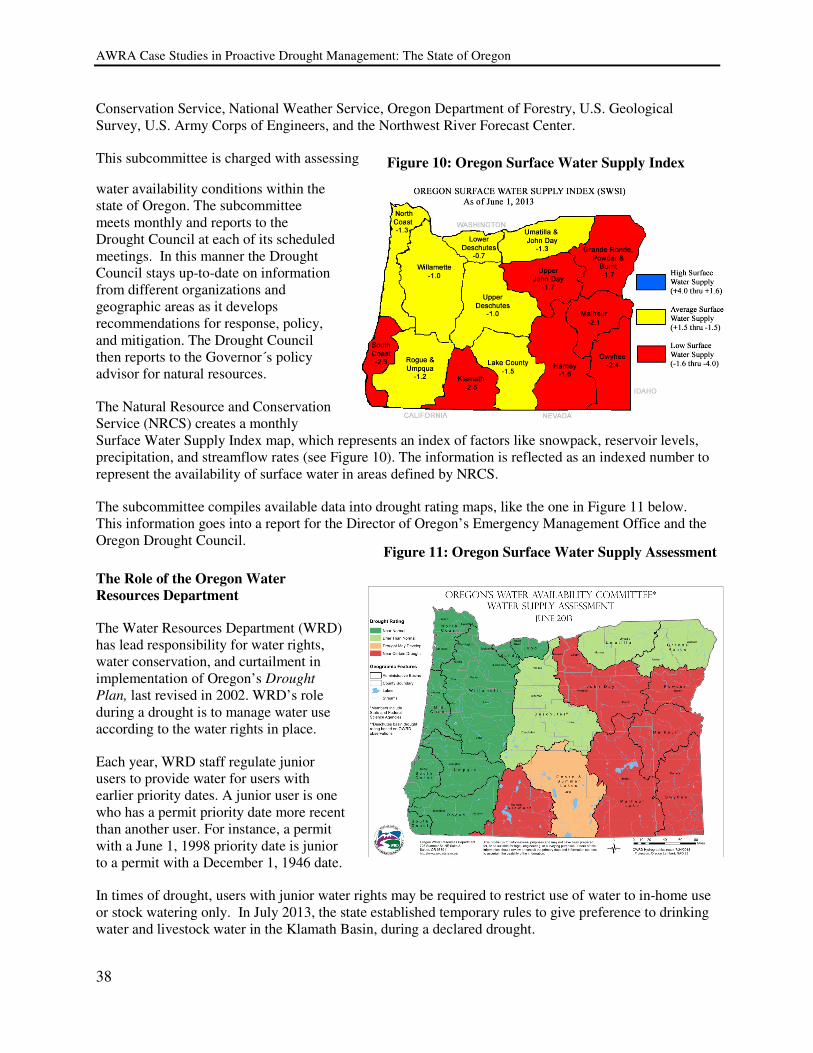
AWRA Case Studies in Proactive Drought Management: The State of Oregon
38
Conservation Service, National Weather Service, Oregon Department of Forestry, U.S. Geological Survey, U.S. Army Corps of Engineers, and the Northwest River Forecast Center.
This subcommittee is charged with assessing
water availability conditions within the state of Oregon. The subcommittee meets monthly and reports to the Drought Council at each of its scheduled meetings. In this manner the Drought Council stays up-to-date on information from different organizations and geographic areas as it develops recommendations for response, policy, and mitigation. The Drought Council then reports to the Governor´s policy advisor for natural resources.
The Natural Resource and Conservation Service (NRCS) creates a monthly Surface Water Supply Index map, which represents an index of factors like snowpack, reservoir levels, precipitation, and streamflow rates (see Figure 10). The information is reflected as an indexed number to represent the availability of surface water in areas defined by NRCS.
The subcommittee compiles available data into drought rating maps, like the one in Figure 11 below. This information goes into a report for the Director of Oregon’s Emergency Management Office and the Oregon Drought Council.
The Role of the Oregon Water
Resources Department
The Water Resources Department (WRD) has lead responsibility for water rights, water conservation, and curtailment in implementation of Oregon’s Drought
Plan, last revised in 2002. WRD’s role during a drought is to manage water use according to the water rights in place.
Each year, WRD staff regulate junior users to provide water for users with earlier priority dates. A junior user is one who has a permit priority date more recent than another user. For instance, a permit with a June 1, 1998 priority date is junior to a permit with a December 1, 1946 date.
In times of drought, users with junior water rights may be required to restrict use of water to in-home use or stock watering only. In July 2013, the state established temporary rules to give preference to drinking water and livestock water in the Klamath Basin, during a declared drought.
Figure 10: Oregon Surface Water Supply Index
Figure 11: Oregon Surface Water Supply Assessment

AWRA Case Studies in Proactive Drought Management: The State of Oregon
39
Where supply is insufficient to satisfy all water rights calling upon the same water source, junior water rights may even be regulated from using water entirely in order to satisfy older water rights.
In counties where the Governor has declared a drought, residents may apply for emergency use permits. The permitting process for these counties is expedited in order to accommodate the use as soon as possible, if there is water available. The permit, however, is only valid for the extent of the drought and no longer than one year. Once the Governor terminates the drought declaration, the emergency permits immediately become invalid. Due to the expedited review of the permits, injury to other users may be found later. In such cases, the emergency use permit may be modified or revoked immediately.
In some years, surface water may be scarce while groundwater is still available. Therefore, new emergency use permits would likely be groundwater permits, and in many cases, drilling a new well would be necessary.
Drought Response Tools Available in Oregon
When the Governor makes a drought declaration, WRD may exercise emergency water rights authority, generally for the duration of the declaration or one year, whichever comes first (unless the declaration is renewed). In those cases, the Water Resources Department may: 1. Issue temporary emergency permits under
an expedited process. The drought permits are limited to replacement of water not available under a permanent water right.
2. Issue temporary transfers, authorizing changes in type of use, place of use, or point of diversion of an existing water right, including “split season” transfers.
3. Issue temporary instream leases to convert all or part of a water right to augment instream flow.
4. Approve special option agreements during drought emergencies. Water used under the
terms of an approved option or agreement may be used at locations, points of diversion, and for beneficial uses other than those described in the water right.
5. Authorize temporary substitution of a supplemental groundwater right for a primary surface water right.
6. Authorize temporary exchange of the source of water allowed under a water right, such as moving from a direct flow right to a stored water source; and
7. Grant preference of use to water rights for human or livestock consumption.
Note: Emergency actions involve a review process that includes an abbreviated public interest determination and a test for injury to existing water rights. There is a specific set of reduced fees for many of these transactions under Oregon Administrative Rules.
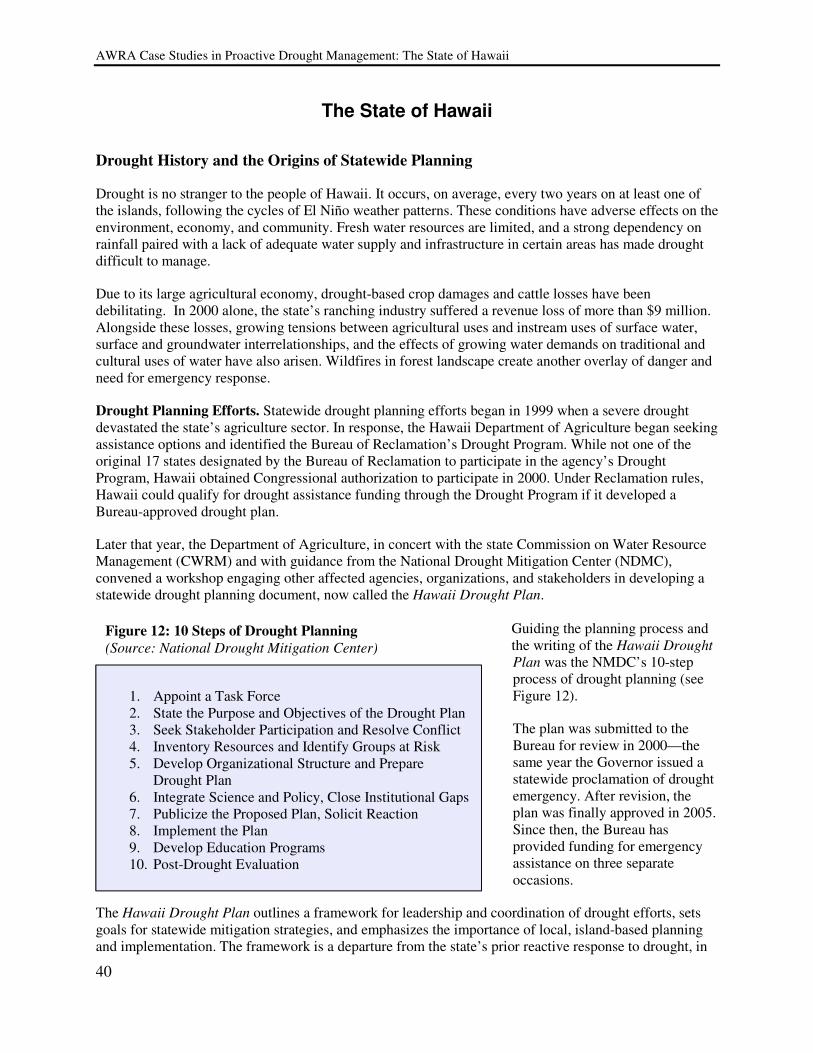
AWRA Case Studies in Proactive Drought Management: The State of Hawaii
40
The State of Hawaii
Drought History and the Origins of Statewide Planning
Drought is no stranger to the people of Hawaii. It occurs, on average, every two years on at least one of the islands, following the cycles of El Niño weather patterns. These conditions have adverse effects on the environment, economy, and community. Fresh water resources are limited, and a strong dependency on rainfall paired with a lack of adequate water supply and infrastructure in certain areas has made drought difficult to manage.
Due to its large agricultural economy, drought-based crop damages and cattle losses have been debilitating. In 2000 alone, the state’s ranching industry suffered a revenue loss of more than $9 million. Alongside these losses, growing tensions between agricultural uses and instream uses of surface water, surface and groundwater interrelationships, and the effects of growing water demands on traditional and cultural uses of water have also arisen. Wildfires in forest landscape create another overlay of danger and need for emergency response.
Drought Planning Efforts. Statewide drought planning efforts began in 1999 when a severe drought devastated the state’s agriculture sector. In response, the Hawaii Department of Agriculture began seeking assistance options and identified the Bureau of Reclamation’s Drought Program. While not one of the original 17 states designated by the Bureau of Reclamation to participate in the agency’s Drought Program, Hawaii obtained Congressional authorization to participate in 2000. Under Reclamation rules, Hawaii could qualify for drought assistance funding through the Drought Program if it developed a Bureau-approved drought plan.
Later that year, the Department of Agriculture, in concert with the state Commission on Water Resource Management (CWRM) and with guidance from the National Drought Mitigation Center (NDMC), convened a workshop engaging other affected agencies, organizations, and stakeholders in developing a statewide drought planning document, now called the Hawaii Drought Plan.
Guiding the planning process and the writing of the Hawaii Drought
Plan was the NMDC’s 10-step process of drought planning (see Figure 12).
The plan was submitted to the Bureau for review in 2000—the same year the Governor issued a statewide proclamation of drought emergency. After revision, the plan was finally approved in 2005. Since then, the Bureau has provided funding for emergency assistance on three separate occasions.
The Hawaii Drought Plan outlines a framework for leadership and coordination of drought efforts, sets goals for statewide mitigation strategies, and emphasizes the importance of local, island-based planning and implementation. The framework is a departure from the state’s prior reactive response to drought, in
Figure 12: 10 Steps of Drought Planning
(Source: National Drought Mitigation Center)
1. Appoint a Task Force 2. State the Purpose and Objectives of the Drought Plan 3. Seek Stakeholder Participation and Resolve Conflict 4. Inventory Resources and Identify Groups at Risk 5. Develop Organizational Structure and Prepare
Drought Plan 6. Integrate Science and Policy, Close Institutional Gaps 7. Publicize the Proposed Plan, Solicit Reaction 8. Implement the Plan 9. Develop Education Programs 10. Post-Drought Evaluation
AWRA Case Studies in Proactive Drought Management: The State of Hawaii
41
which actions were formulated during emergency conditions. Hawaii now coordinates its drought planning efforts with the other federal agencies that administer drought assistance programs and drought monitoring information, including the Federal Emergency Management Agency, Farm Service Agency, Risk Management Agency, Natural Resources Conservation Service, and National Weather Service.
The Hawaii Drought Plan
Purpose of the Plan. The Hawaii Drought Plan serves as a compendium of the drought information in the state. It also identifies both short-term, immediate response actions to address specific, imminent drought impacts and long-term ongoing mitigation actions help prepare for future drought occurrences. Its purpose is to provide a coordinated and consistent framework for integrating actions across federal, state, county, and private sectors. It also serves as a working guide for agencies to develop effective response and mitigation programs within their areas of jurisdiction. It is structured to be a dynamic “living document,” updated on a five-year basis. Key Elements of the Hawaii Drought Plan include:
• A comprehensive rainfall pattern and climate monitoring system to collect data and provide early warning of emerging drought conditions.
• A network of people and organizations who can effectively assess evolving impacts of water shortages on agriculture, recreation, hydropower, municipal and domestic water supplies, wildlife, and other sectors sensitive to reduced rainfall and fluctuations in water supply.
• Clear policies and institutions to reduce short- and long-term drought impacts.
• Local, county-based implementation, grounded in communication and coordination with the state.
How the Drought Plan Works. The Hawaii Drought Plan is sector-based. Leadership in implementation is on an ad-hoc basis dependent on public and private cooperation.
The Hawaii Drought Plan describes three drought impact sectors that are critical to the health and welfare of Hawaii’s people: the Water Supply Sector; the Agriculture and Commerce Sector; and the Environment, Public Health and Safety Sector. These sectors are not mutually exclusive. Impacts in one sector may result in secondary or cumulative impacts in other sectors.
Drought Leadership functions on an ad-hoc volunteer basis, as follows:
• Hawaii Drought Council is the steering committee that oversees the coordination of drought-related activities. It functions within existing agency authorities and responsibilities, and facilitates access to services. It serves as the liaison between various public and private entities involved with drought planning/response and the Office of the Governor, and takes the lead role in intergovernmental drought response coordination and media information releases. It meets semi-annually to assess statewide drought conditions. Council members include the Governor’s Office, co-chairs from the State Departments of Land and Natural Resources and Agriculture, one official from each of the four major counties (Honolulu, Kauai, Maui, and Hawaii), the Hawaii Association of Conservation Districts, the State Department of Defense, Hawaii Farm Bureau, Hawaii Cattleman’s Council, and East Maui Irrigation Company.
• The State Drought Coordinator is responsible for statewide coordination of drought activities and communication between federal, State, and county agencies, stakeholders, and the general public. The high-priority position is part of the Water Resources Committee, but resides within the Commission on Water Resource Management.
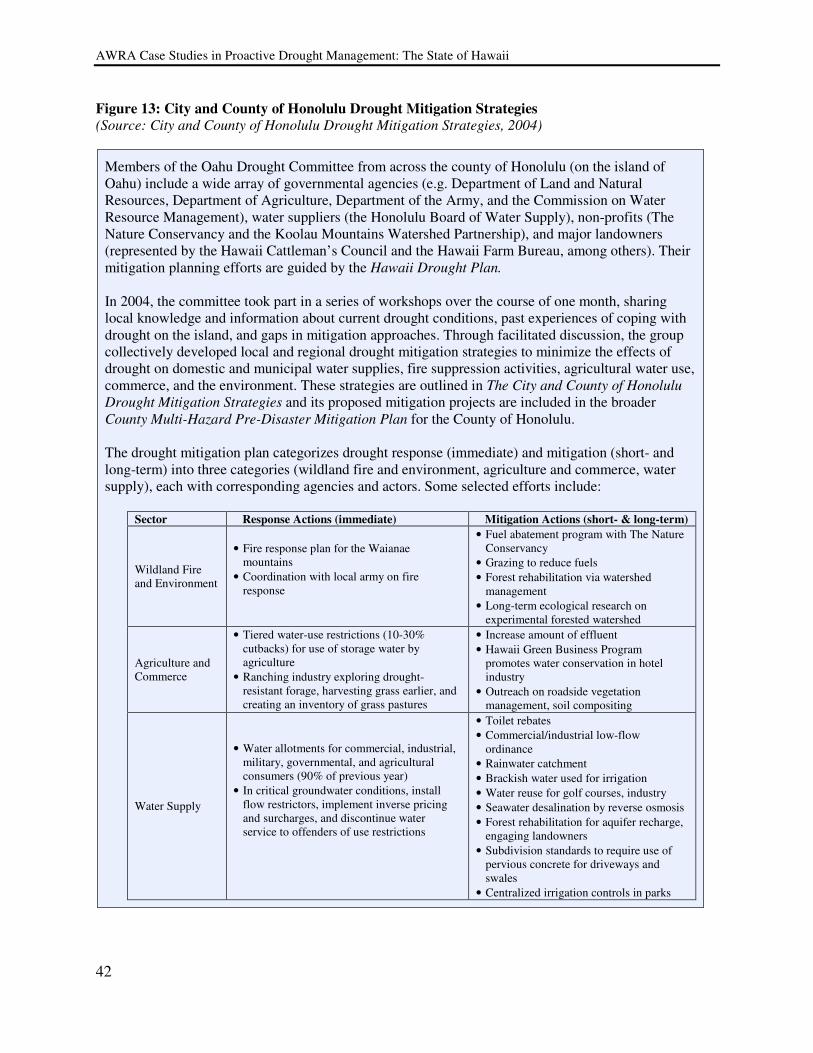
AWRA Case Studies in Proactive Drought Management: The State of Hawaii
42
Figure 13: City and County of Honolulu Drought Mitigation Strategies
(Source: City and County of Honolulu Drought Mitigation Strategies, 2004)
Members of the Oahu Drought Committee from across the county of Honolulu (on the island of Oahu) include a wide array of governmental agencies (e.g. Department of Land and Natural Resources, Department of Agriculture, Department of the Army, and the Commission on Water Resource Management), water suppliers (the Honolulu Board of Water Supply), non-profits (The Nature Conservancy and the Koolau Mountains Watershed Partnership), and major landowners (represented by the Hawaii Cattleman’s Council and the Hawaii Farm Bureau, among others). Their mitigation planning efforts are guided by the Hawaii Drought Plan.
In 2004, the committee took part in a series of workshops over the course of one month, sharing local knowledge and information about current drought conditions, past experiences of coping with drought on the island, and gaps in mitigation approaches. Through facilitated discussion, the group collectively developed local and regional drought mitigation strategies to minimize the effects of drought on domestic and municipal water supplies, fire suppression activities, agricultural water use, commerce, and the environment. These strategies are outlined in The City and County of Honolulu
Drought Mitigation Strategies and its proposed mitigation projects are included in the broader County Multi-Hazard Pre-Disaster Mitigation Plan for the County of Honolulu. The drought mitigation plan categorizes drought response (immediate) and mitigation (short- and long-term) into three categories (wildland fire and environment, agriculture and commerce, water supply), each with corresponding agencies and actors. Some selected efforts include:
Sector Response Actions (immediate) Mitigation Actions (short- & long-term)
Wildland Fire and Environment
• Fire response plan for the Waianae mountains
• Coordination with local army on fire response
• Fuel abatement program with The Nature Conservancy
• Grazing to reduce fuels
• Forest rehabilitation via watershed management
• Long-term ecological research on experimental forested watershed
Agriculture and Commerce
• Tiered water-use restrictions (10-30% cutbacks) for use of storage water by agriculture
• Ranching industry exploring drought-resistant forage, harvesting grass earlier, and creating an inventory of grass pastures
• Increase amount of effluent
• Hawaii Green Business Program promotes water conservation in hotel industry
• Outreach on roadside vegetation management, soil compositing
Water Supply
• Water allotments for commercial, industrial, military, governmental, and agricultural consumers (90% of previous year)
• In critical groundwater conditions, install flow restrictors, implement inverse pricing and surcharges, and discontinue water service to offenders of use restrictions
• Toilet rebates
• Commercial/industrial low-flow ordinance
• Rainwater catchment
• Brackish water used for irrigation
• Water reuse for golf courses, industry
• Seawater desalination by reverse osmosis
• Forest rehabilitation for aquifer recharge, engaging landowners
• Subdivision standards to require use of pervious concrete for driveways and swales
• Centralized irrigation controls in parks
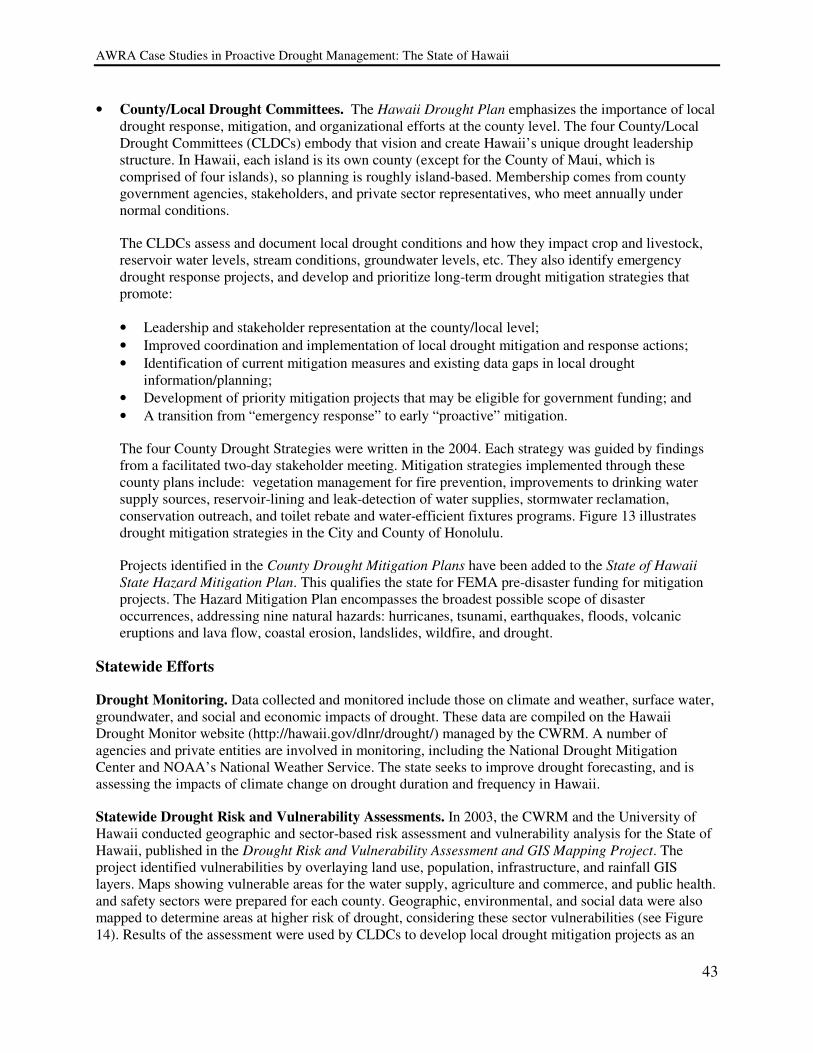
AWRA Case Studies in Proactive Drought Management: The State of Hawaii
43
• County/Local Drought Committees. The Hawaii Drought Plan emphasizes the importance of local drought response, mitigation, and organizational efforts at the county level. The four County/Local Drought Committees (CLDCs) embody that vision and create Hawaii’s unique drought leadership structure. In Hawaii, each island is its own county (except for the County of Maui, which is comprised of four islands), so planning is roughly island-based. Membership comes from county government agencies, stakeholders, and private sector representatives, who meet annually under normal conditions.
The CLDCs assess and document local drought conditions and how they impact crop and livestock, reservoir water levels, stream conditions, groundwater levels, etc. They also identify emergency drought response projects, and develop and prioritize long-term drought mitigation strategies that promote:
• Leadership and stakeholder representation at the county/local level;
• Improved coordination and implementation of local drought mitigation and response actions;
• Identification of current mitigation measures and existing data gaps in local drought information/planning;
• Development of priority mitigation projects that may be eligible for government funding; and
• A transition from “emergency response” to early “proactive” mitigation.
The four County Drought Strategies were written in the 2004. Each strategy was guided by findings from a facilitated two-day stakeholder meeting. Mitigation strategies implemented through these county plans include: vegetation management for fire prevention, improvements to drinking water supply sources, reservoir-lining and leak-detection of water supplies, stormwater reclamation, conservation outreach, and toilet rebate and water-efficient fixtures programs. Figure 13 illustrates drought mitigation strategies in the City and County of Honolulu.
Projects identified in the County Drought Mitigation Plans have been added to the State of Hawaii
State Hazard Mitigation Plan. This qualifies the state for FEMA pre-disaster funding for mitigation projects. The Hazard Mitigation Plan encompasses the broadest possible scope of disaster occurrences, addressing nine natural hazards: hurricanes, tsunami, earthquakes, floods, volcanic eruptions and lava flow, coastal erosion, landslides, wildfire, and drought.
Statewide Efforts
Drought Monitoring. Data collected and monitored include those on climate and weather, surface water, groundwater, and social and economic impacts of drought. These data are compiled on the Hawaii Drought Monitor website (http://hawaii.gov/dlnr/drought/) managed by the CWRM. A number of agencies and private entities are involved in monitoring, including the National Drought Mitigation Center and NOAA’s National Weather Service. The state seeks to improve drought forecasting, and is assessing the impacts of climate change on drought duration and frequency in Hawaii.
Statewide Drought Risk and Vulnerability Assessments. In 2003, the CWRM and the University of Hawaii conducted geographic and sector-based risk assessment and vulnerability analysis for the State of Hawaii, published in the Drought Risk and Vulnerability Assessment and GIS Mapping Project. The project identified vulnerabilities by overlaying land use, population, infrastructure, and rainfall GIS layers. Maps showing vulnerable areas for the water supply, agriculture and commerce, and public health. and safety sectors were prepared for each county. Geographic, environmental, and social data were also mapped to determine areas at higher risk of drought, considering these sector vulnerabilities (see Figure 14). Results of the assessment were used by CLDCs to develop local drought mitigation projects as an
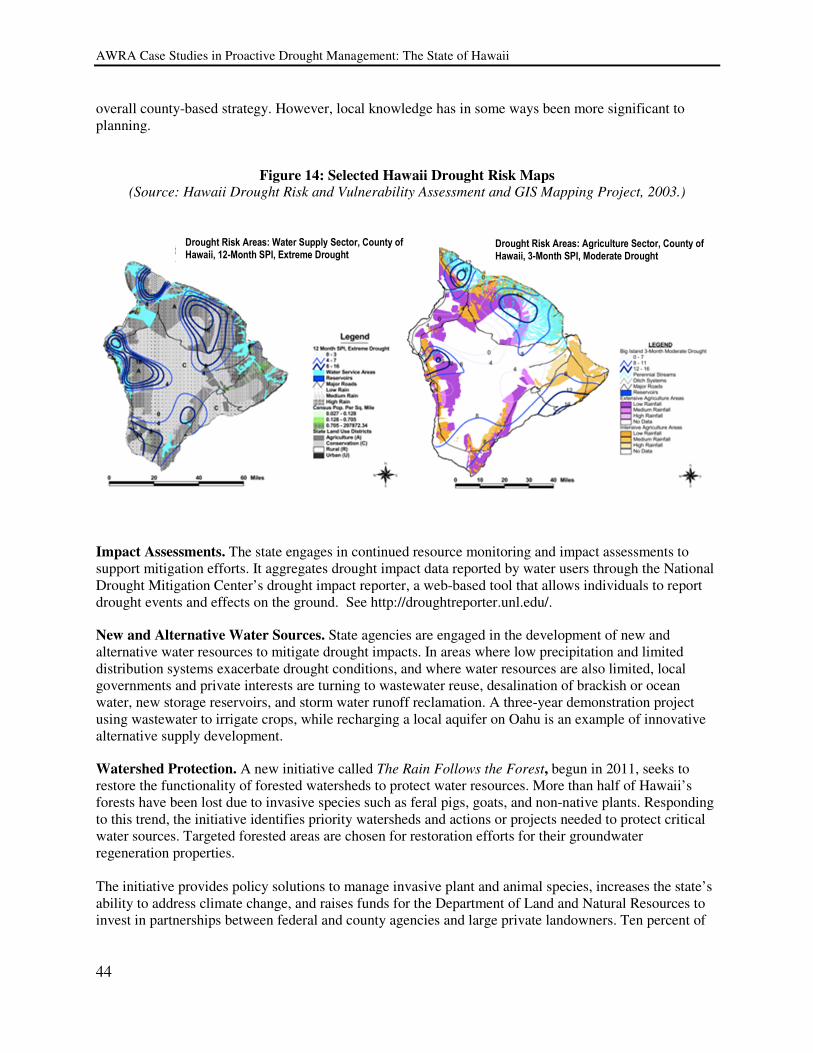
AWRA Case Studies in Proactive Drought Management: The State of Hawaii
44
overall county-based strategy. However, local knowledge has in some ways been more significant to planning.
Figure 14: Selected Hawaii Drought Risk Maps (Source: Hawaii Drought Risk and Vulnerability Assessment and GIS Mapping Project, 2003.)
Impact Assessments. The state engages in continued resource monitoring and impact assessments to support mitigation efforts. It aggregates drought impact data reported by water users through the National Drought Mitigation Center’s drought impact reporter, a web-based tool that allows individuals to report drought events and effects on the ground. See http://droughtreporter.unl.edu/.
New and Alternative Water Sources. State agencies are engaged in the development of new and alternative water resources to mitigate drought impacts. In areas where low precipitation and limited distribution systems exacerbate drought conditions, and where water resources are also limited, local governments and private interests are turning to wastewater reuse, desalination of brackish or ocean water, new storage reservoirs, and storm water runoff reclamation. A three-year demonstration project using wastewater to irrigate crops, while recharging a local aquifer on Oahu is an example of innovative alternative supply development.
Watershed Protection. A new initiative called The Rain Follows the Forest, begun in 2011, seeks to restore the functionality of forested watersheds to protect water resources. More than half of Hawaii’s forests have been lost due to invasive species such as feral pigs, goats, and non-native plants. Responding to this trend, the initiative identifies priority watersheds and actions or projects needed to protect critical water sources. Targeted forested areas are chosen for restoration efforts for their groundwater regeneration properties. The initiative provides policy solutions to manage invasive plant and animal species, increases the state’s ability to address climate change, and raises funds for the Department of Land and Natural Resources to invest in partnerships between federal and county agencies and large private landowners. Ten percent of
Drought Risk Areas: Water Supply Sector, County of Hawaii, 12-Month SPI, Extreme Drought
Drought Risk Areas: Agriculture Sector, County of Hawaii, 3-Month SPI, Moderate Drought
AWRA Case Studies in Proactive Drought Management: The State of Hawaii
45
targeted watersheds are now protected. The Department hopes to double protected areas over the next decade, while creating more than 150 local jobs.
Water Conservation. Water conservation efforts typically occur at the local level. For example, county water departments have existing water conservation programs targeting their customer base and local plumbing codes require low-flow fixtures for new construction and renovation. The State Department of Agriculture can also impose water conservation restrictions on irrigation systems. The Commission on Water Resource Management’s recent Hawaii Water Conservation Plan covers municipal, military, and golf course uses. Early implementation goals are utility water audit training and improved metering of agricultural water use.
Costs and Financing
• Developing county-based drought mitigation plans cost roughly $50,000 (mostly for contracted facilitation), funded by FEMA’s Pre-Disaster Mitigation Planning Grant Program.
• Implementation of mitigation strategies was funded by state appropriations in 2007. Each county received a million dollars for place-based drought mitigation activities.
• The Rain Follows the Forest Program costs about eleven million dollars a year.
• Watershed protection and restoration funding is pursued by the State’s Watershed Partnership Program and Invasive Species Council, and funded by public and private grants.
• Emergency Drought Assistance from the Bureau of Reclamation under the Reclamation States Emergency Drought Relief Act of 1991 has paid for resources such as emergency stock water tanks for cattle farmers, emergency well pumps, and technical and planning assistance. (The Act is now expired.)
• A FEMA Pre-Disaster Mitigation grant of $75,000 paid to develop the Statewide Drought Risk and Vulnerability Assessment and GIS Mapping analysis.
• A FEMA 1640 Hazard Mitigation Grant Program funded Big Island wildland fire mitigation projects.
• The USDA designated all four counties as primary disaster areas due to drought, making farmers eligible for low interest emergency loans from USDA’s Farm Service Agency.
Benefits of the Hawaii Drought Plan
Collaborative Framework. The Hawaii Drought Plan provides a collaborative framework to address statewide water issues and to support watershed-scale management of agriculture, recreation, water supply, and forestry sectors. Proactive planning allows swifter, more effective drought response.
Securing Funds. One clear outcome of having county-level drought plans with concrete mitigation plans in place was acquisition of state funding. Without the drought plans, there would not have been million-dollar appropriations for drought projects in each county. The plans have public support, and have garnered success in securing federal funding.
AWRA Case Studies in Proactive Drought Management: The State of Hawaii
46
Synergy among Stakeholders. State and county drought plans provide a new rallying point for stakeholders and agencies to share ideas, collaborate on projects, and to network during non-emergency conditions.
Challenges
Maintaining Momentum. Continued successful implementation of the recommended statewide plan provisions will remain a key challenge to the Hawaii Drought Council, its member agencies, and stakeholders. Success will ultimately be measured by the ability of the consortium of diverse interests to function as a team to achieve the goals and objectives of successful mitigation of drought impacts. Regular annual meetings among the Drought Council and CLDCs maintain momentum in planning and mitigation projects during non-drought years.
Tracking Drought Impacts. One specific challenge is the limited availability of information on drought impacts on water use sectors. Use of social media may be one tool used in the future to better solicit and record water user data and gain a more sophisticated understanding of how drought patterns influence Hawaiian economy and society.
Next Steps
Update Approaches with the Release of New Climate Data. In 2012, as part of the National Climate Assessment, the Pacific Island Regional Climate Assessment was released. More than 100 scientists collaborated on this report, which includes improved assessments of climate change impacts and estimates of precipitation and temperature trends over the coming decades in Hawaii and the U.S.-Affiliated Pacific Islands. The Hawaii Drought Council, the CLDCs, and others in the drought leadership framework will use these new models to fine-tune mitigation strategies and prepare for drought conditions with greater confidence.
Integrating Climate Adaptation Policy. In July 2012, Hawaii Governor Neil Abercrombie signed Senate Bill 2745, which sets a framework for considering adaption efforts in state and county budgetary, land use, and decision-making processes. This landmark legislation has made Hawaii one of the few states in the nation to adopt a statewide climate adaptation policy, and will have an impact on drought mitigation actions and planning efforts.
Improving Coordination between Drought and Non-Drought Initiatives. Integrating both drought and non-drought initiatives is a goal of Hawaii’s drought leadership. Most capital improvement projects are too expensive for one entity or organization to construct. Hawaii is therefore looking to improve coordination between drought stakeholders and other government and interest groups pooling resources to plan projects that benefit all. As one example, programs to increase the state’s food security and biofuels portfolio also have interests in addressing the drought impacts to the agriculture sector.
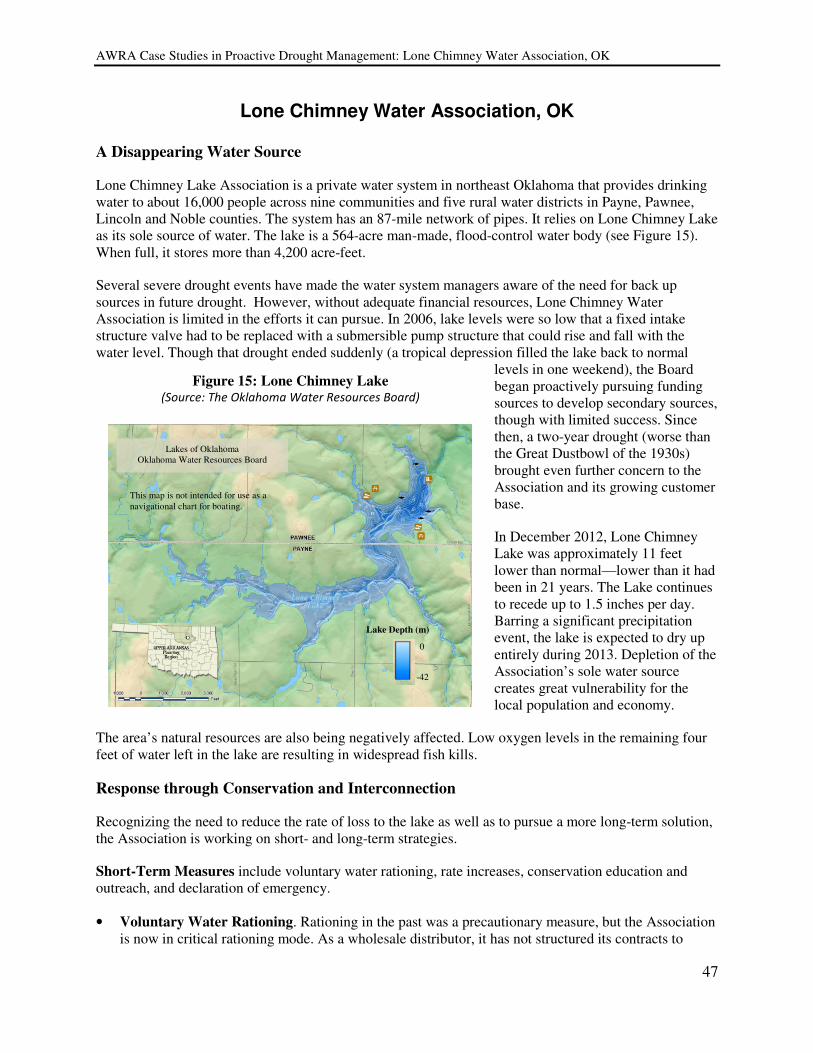
AWRA Case Studies in Proactive Drought Management: Lone Chimney Water Association, OK
47
Lone Chimney Water Association, OK
A Disappearing Water Source
Lone Chimney Lake Association is a private water system in northeast Oklahoma that provides drinking water to about 16,000 people across nine communities and five rural water districts in Payne, Pawnee, Lincoln and Noble counties. The system has an 87-mile network of pipes. It relies on Lone Chimney Lake as its sole source of water. The lake is a 564-acre man-made, flood-control water body (see Figure 15). When full, it stores more than 4,200 acre-feet.
Several severe drought events have made the water system managers aware of the need for back up sources in future drought. However, without adequate financial resources, Lone Chimney Water Association is limited in the efforts it can pursue. In 2006, lake levels were so low that a fixed intake structure valve had to be replaced with a submersible pump structure that could rise and fall with the water level. Though that drought ended suddenly (a tropical depression filled the lake back to normal
levels in one weekend), the Board began proactively pursuing funding sources to develop secondary sources, though with limited success. Since then, a two-year drought (worse than the Great Dustbowl of the 1930s) brought even further concern to the Association and its growing customer base.
In December 2012, Lone Chimney Lake was approximately 11 feet lower than normal—lower than it had been in 21 years. The Lake continues to recede up to 1.5 inches per day. Barring a significant precipitation event, the lake is expected to dry up entirely during 2013. Depletion of the Association’s sole water source creates great vulnerability for the local population and economy.
The area’s natural resources are also being negatively affected. Low oxygen levels in the remaining four feet of water left in the lake are resulting in widespread fish kills.
Response through Conservation and Interconnection
Recognizing the need to reduce the rate of loss to the lake as well as to pursue a more long-term solution, the Association is working on short- and long-term strategies.
Short-Term Measures include voluntary water rationing, rate increases, conservation education and outreach, and declaration of emergency.
• Voluntary Water Rationing. Rationing in the past was a precautionary measure, but the Association is now in critical rationing mode. As a wholesale distributor, it has not structured its contracts to
Figure 15: Lone Chimney Lake (Source: The Oklahoma Water Resources Board)
Lakes of Oklahoma Oklahoma Water Resources Board
Lake Depth (m)
This map is not intended for use as a
navigational chart for boating.
0
-42
AWRA Case Studies in Proactive Drought Management: Lone Chimney Water Association, OK
48
allow the issuance of water-rationing mandates in the same way retail distributers can. Instead, the Association can only ask for voluntary cutbacks. As such, it has asked all of its rural water districts (particularly those with other water sources) to reduce demand by 40-50 percent. About half of the Lone Chimney Water Association’s 12 customers have access to additional supplies, and thus water demand for the system has dropped by about half.
• Rate Increases and Outcomes. Over the past few months, all Association customers have been charged three times the normal water rates for use above a certain threshold. As a result, customers have cut back use by about 35 percent by taking shorter showers, washing clothes less frequently, and placing bricks in toilet recharge chambers. Some ranchers in the area have resorted to selling cattle.
• Conservation Education and Outreach. The Association uses billing inserts and direct communication to educate customers about household conservation measures.
• Declaration of Emergency. In January 2013 when the lake reached dangerously low levels, Payne County declared an emergency, triggering access to state funding.
Long-Term Measures include interconnecting with a neighboring system and diversifying water resources.
• Interconnection with a Neighboring System. A $3.35 million project is under construction to connect to nearby Stillwater’s system, 12 miles away, and its water source of Kaw Lake, considered the most stable reservoir in northeast Oklahoma. A 30-year contract between Lone Chimney Water Association and the Stillwater Utilities Authority will govern water sharing between the two systems. Under it, the Association will purchase at least 2 million gallons per month and pay $85,000 annually to Stillwater.
• Diversifying Water Sources. All entities in the Association’s service area are pursuing backup supplies. The city of Glencoe, for example, is considering increasing its reliance on groundwater wells. Individual ranchers, worried that lack of water will endanger their cattle, are beginning to dig their own wells.
Costs and Financing
The greatest challenge to Lone Chimney Lake Association was the lack of funding opportunities, making it nearly impossible to pursue proactive drought mitigation through the development of additional water supplies. As demand decreases with water conservation, the Association’s revenue decreases as well, exacerbating already difficult financial circumstances.
Obtaining Outside Funding Is a Challenge. Lone Chimney Water Association has pursued federal funding with limited success. For example, FEMA can only provide assistance (i.e. trucking in water) when no further water can be pumped from the lake. Additionally, having received a USDA-Rural Development loan at its inception, the Association sought another for drought response after the 2006 drought. Although eligibility conditions stipulated by the agency were met, funding was not available.
A similar story exists for state funding. Only when Payne County Commissioners issued an emergency declaration in January 2013 was the Association able to leverage support from Oklahoma Water Resources Board to address the most recent drought.
AWRA Case Studies in Proactive Drought Management: Lone Chimney Water Association, OK
49
The Association turned to other options with better success. In Spring 2013, the Association (through Pawnee County) was granted a $350,000 Community Development Block Grant administered by U.S. Department of Housing and Urban Development. It will help pay for plant upgrades required by the Oklahoma Department of Environmental Quality as a result of the Stillwater interconnection. An intake valve replaced after the 2006 drought cost roughly $119,000 to install and was funded through $100,000 in emergency drought funding from the Oklahoma Water Resources Board (OWRB) and nearly $19,000 in local funding. The Stillwater interconnection project costs roughly $3.35 million and is funded by a Drinking Water State Revolving Fund loan, provided through OWRB. That loan will be retired over 30 years, and is secured by a lien on water receipts. Projects implemented with emergency drought response dollars put the Association on the path to better drought preparation.
Next Steps
The next major step is to finish the interconnection project to Stillwater and implement the first few years of the contract. The Association will also continue to pursue and develop additional water sources to increase the redundancy of its supply. This may include a satellite lake and new wells to access the region’s groundwater.
AWRA Case Studies in Proactive Flood and Drought Management: Lessons from the Case Studies
50
Lessons from the Case Studies
The case studies presented in this report describe how a few selected communities, basins, and states across the United States have taken action to implement proactive flood and drought management. This section summarizes key findings and lessons, and identifies some overarching themes common to these highly successful among these case studies. Some key differences can be seen between flood and drought as water resource challenges, and some other factors emerge as common features of these proactive programs for floods and droughts.
Overarching Themes from the Case Studies
Despite contrasting water resource challenges, the flood and drought case studies share several common themes that inform our understanding of the nature and design of proactive management:
Driven by Disaster. Drastic floods or droughts of record were among the driving forces in all eight case studies. The aftermath of disaster in all these cases appears to have created sufficient public and institutional willpower to lead agencies to design and implement proactive approaches in order to mitigate future impacts. The momentum of recovery and public concern was leveraged to develop better strategies and plans. These case studies used that critical window to reevaluate and revamp flood and drought management, not merely to reconstruct a preexisting urban system or water network.
Comprehensive Approaches. These case studies feature the use of conventional approaches, such as dams and levees for flood control and water-use restrictions for drought mitigation. By including science and best practices in hydrology, geomorphology, land-use management, etc., these cases achieved greater effectiveness. Capital projects such as storage reservoirs and regional water supply networks continue to be effective and important in many of the case studies, especially when applied strategically to specific parts of a system. As one example, the Chehalis River Basin integrates large-scale capital projects, dams, and an Interstate relocation, with smaller capital projects such as localized levees and levee setbacks to protect sensitive regions and infrastructure. It combines these with targeted buyout programs to change land uses in areas prone to flooding. The Miami Conservancy District, San Antonio Water System, and state of Hawaii are other case studies that embody a multi-prong approach.
Creativity and Innovation in Institutions. These case studies avoided single-solution, reactive flood and drought planning by extending their efforts beyond existing, conventional institutions and regulatory authority. For example, the City of Easton has chosen to extend building and land-use restrictions beyond the 100-year flood plain specified as a national minimum. At the Miami Conservancy District, the desired basin-scale design effort was accomplished by creating a conservancy that required new state-level authorizing legislation. The San Antonio Water System found it lacked personnel and resources for community outreach, and therefore developed an agreement to engage the local police department to assist in identifying enforcement cases.
Multiple Benefits, Multiple Funding Sources. These case studies have leveraged the requirements and infrastructure of many related water and environmental objectives into effective flood and drought mitigation. Driving forces that address water quality, economic development, recreational facilities, hazard mitigation, and others can dovetail with flood and drought programs. Meeting multiple objectives with a single project often increases cost, but can also eliminate the need for separate projects that would otherwise be needed.
All eight of these case studies incorporate ecosystem-restoration programs in one form or another. When thoughtfully designed and operated, these not only improve natural habitat and natural capacity for
AWRA Case Studies in Proactive Flood and Drought Management: Lessons from the Case Studies
51
resilience, but also eliminate river walls that disconnect the community from its waterbody, and absorb peak flows into natural systems to contribute to flood and drought mitigation. For example, the Miami Conservancy District manages more than 4,500 acres of protected floodplain land, in cooperation with municipal governments and local park districts and funded by the Ohio Greenspace Preservation Grant Program. In this and other cases, state legislatures have been willing to contribute funding for waterfront state parks and other recreational facilities, and this has most impact when the land dedicated to open space also replaces existing (or prohibits new, residential or commercial) land uses. Several case studies have applied funding from FEMA’s Repetitive Loss program to strategically acquire properties and convert floodplain land uses to recreational or ecosystem purposes. Others have used FEMA response funding to design reconstruction in such a way so that new infrastructure is at reduced flood risk.
Regional Coordination. Regional partnerships provide coordination, streamlining, and idea-sharing of management and mitigation efforts. Water managers know that flood and drought are substantially more challenging to address if management efforts are only being implemented in an isolated portion of a basin or aquifer system. The State of Hawaii, the Chehalis River Basin, and the Miami Conservancy District case studies particularly embody this notion. For the Lone Chimney Water Association, regional partnership with its neighboring water system is central to its drought response and management.
Ecosystem-Based Efforts. The case studies also point to an ever-growing trend towards integrating non-infrastructural, ecosystem-based approaches as part of a diverse, multi-prong and multi-scale management portfolio. In contrast to structural solutions, these approaches seek to accommodate the natural hydrology of the region they are implemented in. All four flood case studies incorporate floodplain reconnection to mitigate flood impacts, and Hawaii and San Antonio provide examples of habitat conservation pursued for the purpose of aquifer recharge. San Antonio also illustrates how drought management can be driven in part by environmental regulations protecting endangered species.
Multi-Stakeholder Engagement. Alongside the multi-scale approach, these case studies also engage a diverse set of stakeholders. Comprehensive management requires the coordination of local, state, and federal agencies, as well as the input of often competing interest groups. An equitable and thoughtful process is critically important in multi-stakeholder coordination and outreach, as is apparent in the Chehalis River Basin, Nashville, and Hawaii case studies.
Recommended Strategies from the Case Studies
Specific strategies in how to enable, design, and implement proactive flood and drought management efforts also emerged from the case studies.
Enabling Proactive Management
• Solicit Support from Politicians. In nearly every case study, high profile political figures—state legislators, governors, and city mayors—were involved in supporting and prioritizing flood or drought recovery and management. Engaging politicians enhances access to funding and resources. As one example, in the case of the Chehalis River Basin, leadership from the Governor, the Governor’s Office, and state legislature led to the formation of the Flood Authority, the engagement of the Ruckelshaus Center, and the development of the recommended strategy.
• Engage the Local Business Community. Local business leaders can play an important role in flood and drought recovery and management. In the case of the Miami Conservancy District, support from Dayton business leaders was critical in expediting legislative action and fundraising efforts. In Nashville, business leaders brought a valuable perspective to the flood planning process. In Oregon and Hawaii, business leaders participate in statewide drought councils.
AWRA Case Studies in Proactive Flood and Drought Management: Lessons from the Case Studies
52
• Partner with State, Federal, and Regional Entities. The case studies illustrate the importance of coordination with state and federal agencies that can provide resources, technical assistance, and expertise. As one example, Hawaii was able to collaborate and secure resources and assistance from the Bureau of Reclamation, NOAA, and FEMA, as well as the Western Governors’ Association on drought issues. This assistance was critical in designing and implementing its current drought strategy. The importance of staying connected to regional and federal partners, particularly NOAA for access to climate data, has further been echoed by a 2013 survey among western state water resource decision makers (Western Governor’s Association, 2013)
• Seek Assistance and Ideas from Research Centers. The research and academic communities provide opportunities to leverage expertise and resources. Case studies that employed this strategy include the Chehalis River Basin, which used the Ruckelshaus Center to help the stakeholder process, and the State of Hawaii, which leveraged the expertise of National Drought Mitigation Center to guide drought plan development.
• Use Third-Party Facilitators. As the Chehalis River Basin demonstrates, creating a facilitated process and structure to reach agreement on management priorities can be critical, especially when conflict is present. Political differences and strained relationships created challenges in the management strategy development process, but support from a third-party facilitator has highlighted the stakeholders’ shared vision for the future of the basin. While it can take a long time, a facilitated collaborative process should be pursued to address strategic gridlock and competing interests.
• If Needed, Create New Authorities. Current legal constructs may not adequately support management strategies. In the case of the Miami Conservancy District, leaders worked with the state legislature to enact new laws creating the authority for a regional, cross-jurisdictional management districts.
• Dedicate Staff. Devoting staff to long-term proactive management programs ensures that projects and programs will be carried through. Easton assigned city staff to work on floodplain management in day-to-day tasks.
• Pursue Diverse and Alternative Funding Sources. For nearly all of the case studies, a combination of local, state, and federal funds were leveraged to pay for implementation. Some funds were obtained from seemingly unrelated sources. For example, Easton obtained federal and state transportation dollars with underlying urban or environmental goals that also supported floodplain management projects. The Lone Chimney Water Association was able to obtain a Community Development Block Grant through one of its customers.
Organizing Stakeholder Feedback and Outreach
• Assemble a Representative Body. Soliciting input from the public at large is important, but can also be an overwhelming task. To address this challenge, a multi-stakeholder, representative task force or council can be convened for the design and implementation phases of management strategies. This strategy is embodied in nearly all of the case studies.
• Communicate with Local, State, and Federal Partners Early and Often. In Oregon, to ensure that no partners are surprised by a drought declaration, frequent communication is key to successful drought coordination. The development of a drought tool kit, provided to and understood by water users and local communities well in advance of a drought declaration, helps to eliminate uncertainty and panic in the midst of drought. In Hawaii, meetings held on an annual basis convene the four
AWRA Case Studies in Proactive Flood and Drought Management: Lessons from the Case Studies
53
County Local Drought Committees, to maintain communication among stakeholders. Participants have taken the opportunity to network with each other, learn about each other’s efforts, and identify projects where they can partner.
• Create Online Tools for Public Education and Outreach. Online resources are increasingly being used to disseminate information to residents of flood and drought prone regions. In the nearly all of the case studies, online websites display up-to-date water resource conditions, engaging the public in water resource awareness and empowering individuals to make personal and behavioral changes. In the case of Hawaii, water users can also report drought impacts online, informing future management strategies.
• Station Staff in the Field. Distributing monitoring and implementation efforts across a management effort is essential in many case studies. For example, in addition to its online resources, Oregon makes technical staff available in the basin to handle questions when communities need help.
Designing Strategies
• Base Management Strategies on Data. Several case studies highlighted the importance of building proactive management strategies on a foundation of scientific data. Robust analysis of flood or drought impacts and of hydrologic patterns is used to target management efforts. For example, San Antonio Water System bases its management decisions on strong hydrologic and system demand data.
• Integrate Spatial Analysis. GIS and remote sensing can be powerful tools for identifying areas of impact and targeting specific management efforts. Several case studies used mapping to analyze flood damages (such as Easton and Nashville) and drought vulnerability (such as Hawaii). In Easton, spatial analysis of damage led the city to adopt a 500-year flood standard.
• Manage through Local Ordinances. Both flood and drought case studies utilized municipal ordinances and zoning to institutionalize floodplain regulations and drought restrictions, as seen with Easton and San Antonio. This approach makes management outcomes more reliable through enforcement.
• Plan for the Unexpected. The experienced staff and Board of the Lone Chimney Water Association never imagined a drought as severe as the one experienced in Northeast Oklahoma in 2012-2013. Scenario planning can help water managers anticipate appropriate actions for magnitudes of flood or drought that have not yet occurred. For example, while it has not yet experienced a Stage 5 drought, San Antonio Water System has determined several measures that it can take alleviate and manage such conditions.
Continuing Efforts
• Evaluate and Update Your Strategy Regularly. Built into the San Antonio Water System model are scheduled reevaluations of programs and drought restrictions. SAWS updates the Water Management Plan every three to five years, building off of new data, and views each successive drought and drought stage as an opportunity to learn and improve upon the strategies. The Hawaii
Drought Plan is also scheduled for an update every five years.
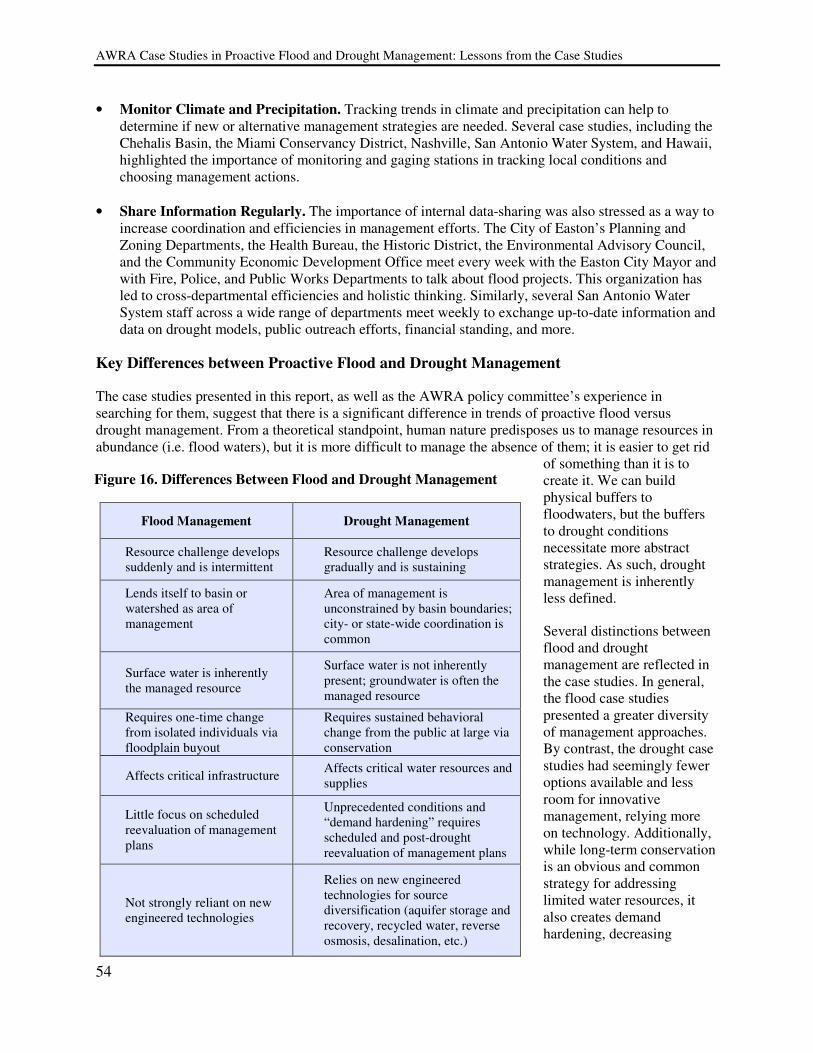
AWRA Case Studies in Proactive Flood and Drought Management: Lessons from the Case Studies
54
• Monitor Climate and Precipitation. Tracking trends in climate and precipitation can help to determine if new or alternative management strategies are needed. Several case studies, including the Chehalis Basin, the Miami Conservancy District, Nashville, San Antonio Water System, and Hawaii, highlighted the importance of monitoring and gaging stations in tracking local conditions and choosing management actions.
• Share Information Regularly. The importance of internal data-sharing was also stressed as a way to increase coordination and efficiencies in management efforts. The City of Easton’s Planning and Zoning Departments, the Health Bureau, the Historic District, the Environmental Advisory Council, and the Community Economic Development Office meet every week with the Easton City Mayor and with Fire, Police, and Public Works Departments to talk about flood projects. This organization has led to cross-departmental efficiencies and holistic thinking. Similarly, several San Antonio Water System staff across a wide range of departments meet weekly to exchange up-to-date information and data on drought models, public outreach efforts, financial standing, and more.
Key Differences between Proactive Flood and Drought Management
The case studies presented in this report, as well as the AWRA policy committee’s experience in searching for them, suggest that there is a significant difference in trends of proactive flood versus drought management. From a theoretical standpoint, human nature predisposes us to manage resources in abundance (i.e. flood waters), but it is more difficult to manage the absence of them; it is easier to get rid
of something than it is to create it. We can build physical buffers to floodwaters, but the buffers to drought conditions necessitate more abstract strategies. As such, drought management is inherently less defined.
Several distinctions between flood and drought management are reflected in the case studies. In general, the flood case studies presented a greater diversity of management approaches. By contrast, the drought case studies had seemingly fewer options available and less room for innovative management, relying more on technology. Additionally, while long-term conservation is an obvious and common strategy for addressing limited water resources, it also creates demand hardening, decreasing
Flood Management Drought Management
Resource challenge develops suddenly and is intermittent
Resource challenge develops gradually and is sustaining
Lends itself to basin or watershed as area of management
Area of management is unconstrained by basin boundaries; city- or state-wide coordination is common
Surface water is inherently the managed resource
Surface water is not inherently present; groundwater is often the managed resource
Requires one-time change from isolated individuals via floodplain buyout
Requires sustained behavioral change from the public at large via conservation
Affects critical infrastructure Affects critical water resources and supplies
Little focus on scheduled reevaluation of management plans
Unprecedented conditions and “demand hardening” requires scheduled and post-drought reevaluation of management plans
Not strongly reliant on new engineered technologies
Relies on new engineered technologies for source diversification (aquifer storage and recovery, recycled water, reverse osmosis, desalination, etc.)
Figure 16. Differences Between Flood and Drought Management

AWRA Case Studies in Proactive Flood and Drought Management: Final Thoughts
55
demands to levels that reduce flexibility and options during a drought. See Figure 16 for further distinctions.
Final Thoughts
Our planet is changing. Time, ecological processes, demographics, and climate all factor into the rate and magnitude of that change. Natural resources are becoming scarce and depleted. Demand and need for clean reliable water is ever increasing, while conflict between built and natural landscapes will escalate. Wise management of this precious and finite resource is a paramount priority for current and future generations, and the kinds of solutions we have applied in the past too often solve one kind of problem, while exacerbating others, or focusing on retroactive action despite the need for preemptive mitigation of flood or drought damages. Resolving multiple problems in a proactive manner may require creative strategies in the face of restrictive policies and regulations. These case studies showcase a sample of strategies that creatively achieve multiple management goals. Challenges now and to come will continue to stretch our creativity, query our sense of right and wrong, stimulate our unique ability to solve problems and derive a balance between conflicting interests. Flood and drought issues transcend every part of the United States, yet the case studies presented in this report exemplify some of the most innovative water resource management activities to date within the country. A concerted effort from citizens, professionals, and elected officials, working together, will generate the best options for a sustainable future. The AWRA Policy Committee truly hopes this report sparks interest, creative thought, action, and new approaches to addressing our water resource challenges.
AWRA Case Studies in Proactive Flood and Drought Management: References
56
References
Introduction
Association of State Floodplain Managers. (2012). “Flood Insurance Affordability.” Available at:
http://www.floods.org/ace-files/documentlibrary/2012_NFIP_Reform/ASFPM_recommendations_on_BW-12_affordability_26April2013.pdf.
Below, R. et al. (2007). Drought related disasters: A global assessment. Journal of Environment and
Development 16, 328-344, 328. Black, Peter E., 2012. “The U.S. Flood Control Program at 75: Environmental Issues.” JAWRA v 48 n 2,
April 2012, p 244-255. Blake, E.S., Kimberlain, T.B., Berg, R.J., Cangialosi, J.P., & J.L Beven II. (2013). “Tropical Cyclone
Report: Hurricane Sandy.” National Hurricane Center. Available at: www.nhc.noaa.gov/data/tcr/AL182012_Sandy.pdf.
Folger, P., Cody, B, and Carter, N. (2012). “Drought in the United States: Causes and Issues for Congress.” Congressional Research Service 7-5700, RL34580.
National Drought Mitigation Center. (2010). Website: Estimating the Impacts of Complex Climatic Events. Available at: http://drought.unl.edu/AboutUs/CurrentResearch/EstimatingtheImpactsofComplexClimaticEvents.aspx.
National Drought Policy Commission. (2000). Preparing for Drought in the 21st Century. Washington,
D.C. Available at: http://govinfo.library.unt.edu/drought/finalreport/fullreport/pdf/reportfull.pdf. National Oceanic and Atmospheric Administration (NOAA), National Climatic Data Center (NCDC). US
Records 2012 website at: www.ncdc.noaa.gov/extremes/records/monthly/maxt/2012/01/00?sts%5b%5d=US#records_look_up.
NOAA, National Climatic Data Center (NCDC). (2013) Drought – January 2013 Report. Available at: http://www.ncdc.noaa.gov/sotc/drought/2013/1#national-overview.
National Weather Service. Hydrologic Information Center - Flood Loss Data website. Available at: http://www.nws.noaa.gov/hic/.
O’Neill, Karen (2006). Rivers by Design: State Power and the Origins of U.S. Flood Control. Durham, NC: Duke University Press.
United States Army Corps of Engineers (2013). “Levee Safety Program: USACE Program Levees.” http://www.usace.army.mil/Missions/CivilWorks/LeveeSafetyProgram/USACEProgramLevees.aspx
U.S. Department of Agriculture (USDA). (11 Jul 2012). Press Conferences with Secretary Tom Vilsack on Improvements to Disaster Assistance. Available at: www.usda.gov/wps/portal/usda/usdamediafb?contentid=2012/07/0231.xml&printable=true&contentidonl.
United States Global Change Research Program (USGCRP). (2009). Global Climate Change Impacts in
the United States. Thomas R. Karl, Jerry M. Melillo, and Thomas C. Peterson (eds.). Cambridge University Press, New York, NY, USA. Available at: http://globalchange.gov/what-we-do/assessment/previous-assessments/global-climate-change-impacts-in-the-us-2009.
U.S. Geological Survey. (2000). “Significant Floods in the United States During the 20th Century.” By Charles Perry. Available at: http://ks.water.usgs.gov/pubs/fact-sheets/fs.024-00.html.
Wohl, Ellen (2004). Disconnected Rivers: Linking Rivers to Landscapes. New Haven: Yale University Press.
.
AWRA Case Studies in Proactive Flood and Drought Management: References
57
Proactive Flood Management Case Studies
Chehalis River Basin, WA
Jim Kramer, Chehalis Basin Project Manager for William D. Ruckelshaus Center. Personal
communications. (2013). Chehalis River Basin Flood Damage Reduction – Governor’s 2013-2015 Capital Budget
Recommendations. (December 2012). Available at: http://lewiscountywa.gov/communitydevelopment/chehalis-river-basin-flood-authority.
Chehalis Basin Flood Hazard Mitigation Alternatives Report. (December 2012). The William D.
Ruckelshaus Center. Available at: http://pcc.wsu.edu/projects/documents/ChehalisReport_12-19-12_Finalreducedfilesize.pdf.
Chehalis River Basin Flood Warning System (January 2013). Chehalis River Basin Flood Authority.
Draft Strategic Program for Floodproofing and Buyouts (October 2012). Chehalis River Basin Flood
Authority. Available at: http://lewiscountywa.gov/communitydevelopment/chehalis-river-basin-flood-authority.
Miami Conservancy District, OH
Kurt Rinehart, MCD Chief Engineer. Personal communications. (2013). Miami Conservancy District website. http://www.miamiconservancy.org/ Miami Conservancy District Strategic Plan 2011-2016. Available at:
http://www.miamiconservancy.org/resources/documents/2011StrategicPlanforhandoutonepagenologo.pdf.
Easton, PA
Becky Bradley, City of Easton Codes and Planning Department. Personal communications. (2013). City of Easton Comprehensive Plan. Available at: http://www.easton-pa.gov/planning/compplan.pdf. City of Easton City Ordinances. Available at: http://www.easton-pa.gov/ordinances.html.
Nashville, TN
Sonia Harvat, City of Nashville Metro Water, Public Outreach Coordinator. Personal communications.
(2013). Much language for this report was excerpted from The Unified Flood Preparedness Plan. (January
2013). Metro Water Services. Prepared by Barge Waggoner Sumner & Cannon, Inc. Available at:_www.nashville.gov/Portals/0/SiteContent/WaterServices/docs/reports/UFPP%20Final%20report.pdf.
Proactive Drought Management Case Studies
San Antonio Water System, TX
Karen Guz, Director of Conservation, San Antonio Water System. Personal communications (2013). The Edwards Aquifer website at www.edwardsaquifer.net. Edwards Aquifer Recovery Implementation Program Habitat Conservation Plan. (November 2012).
www.eahcp.org/index.php/documents_publications/habitat_conservation_plan_and_appendics San Antonio Water System website. Available at: www.saws.org.
AWRA Case Studies in Proactive Flood and Drought Management: References
58
SAWS 2012 Water Management Plan. Available at: www.saws.org/your_water/waterresources/2012_WMP/download.cfm.
The Conservation Registry website (for information on the San Antonio Source Water Protection Program). Available at http://www.conservationregistry.org/projects/17189.
State of Oregon
National Resources Conservation Service, U.S. Department of Agriculture. Surface Water Supply
Index for Oregon. Available at: http://www.or.nrcs.usda.gov/Snow/watersupply/swsi.html. State of Oregon. Drought Mitigation Rules. Available at:
http://www.oregon.gov/owrd/wr/docs/div19-temp_drought_rules.pdf. State of Oregon. Drought Plan. Available at:
http://seca.unl.edu/web_archive/StateDroughtPlans/DroughtPlans/OR_2002.pdf. Water Availability Committee of Oregon. Available at:
http://www.oregon.gov/owrd/pages/wr/drought_waco.aspx.
State of Hawaii
Neal Fujii, Hawaii State Drought Coordinator. Personal communications. (2013). City and County of Honolulu Drought Mitigation Strategies. (2004). Available at:
http://hawaii.gov/dlnr/drought/preparedness/OahuDroughtMitigationStrategies.pdf. Climate Change Law and Policy in Hawaii Briefing Sheet (2012). Center for Island Climate
Adaptation and Policy, University of Hawaii Sea Grant College Program. Available at: http://www.pacificrisa.org/wp-content/uploads/2012/06/ICAP-Climate-Change-Law-Policy-in-Hawaii-briefing-sheet.pdf.
Hawaii Drought Monitor. Available at: http://hawaii.gov/dlnr/drought/. Hawaii Drought Plan. (Updated February 2005). Available at:
http://hawaii.gov/dlnr/drought/preparedness/HDP2b.pdf. Hawaii Drought Risk and Vulnerability Assessment and GIS Mapping Project. (2003). Available at:
http://hawaii.gov/dlnr/cwrm/planning/drva2003.pdf. The Rain Follows the Forest: A Plan to Replenish Hawaii’s Source of Water. (November 2011).
Available at: http://hawaii.gov/dlnr/chair/pio/nr/2011/The-Rain-Follows-the-Forest.pdf.
Lone Chimney Water Association, OK
Paul Kinder, Manager, Lone Chimney Water Association. Personal communications. (2013). Mark Porter, City of Glencoe Water Superintendent (Payne County). Personal communications.
(2013). “Lone Chimney Lake in danger of drying up.” By John Filonow. Stillwater News Press. December
28, 2012. “Pawnee County Water Supply On Verge Of Drying Up” by Craig Day. News on 6. December 19,
2012. Available at: http://www.newson6.com/story/20386807/pawnee-water-supply-on-verge-of-running-dry?source=related.
“Oklahoma Watch: Drought continues to parch Lone Chimney Water District.” By Ron Jackson, Jr. March 24, 2013. The Oklahoman. Available at: http://newsok.com/oklahoma-watch-drought-continues-to-parch-lone-chimney-water-district/article/3770949.
“Loan approved for water association to build pipeline from Stillwater to Lone Chimney.” September 21, 2012. By Chris Day. Stillwater News Press. Available at:

AWRA Case Studies in Proactive Flood and Drought Management: References
59
http://www.stwnewspress.com/local/x403277141/Loan-approved-for-water-association-to-build-pipeline-from-Stillwater-to-Lone-Chimney.
Lessons from the Case Studies Drought Preparation and Response in Western States. (Western Governors’ Association, 2013). Available
at: https://www.westgov.org.
AWRA Case Studies in Proactive Flood and Drought Management: Additional Resources
60
Additional Resources
Flood Management
Organizations
Association of State Floodplain Managers
Website: http://www.floods.org/ Phone: (608) 828-3000
Floodplain Management Association
Website: http://www.floodplain.org/ Phone: (916) 231-2134
Reports, Models, and Case Studies No Adverse Impact Floodplain Management Community Case Studies. (Association of State Floodplain
Managers, 2004). Available at: http://www.floods.org/PDF/NAI_Case_Studies.pdf. The Lehigh Valley Planning Commission’s Model Floodplain Ordinances.
Available at: http://www.lvpc.org/pdf/modelFloodplainOrdinance.pdf. Floodplain Management and the Endangered Species Act: A Model Ordinance. (FEMA, 2010). Available
at: http://www.fema.gov/pdf/about/regions/regionx/draft_nfip_esa_ordinance.pdf. Model Bylaw Effectively Managing Coastal Floodplain Development. (Sea Grant, 2009). Available at:
http://www.floods.org/ace-files/documentlibrary/State_Local%20Resources%20and%20Tools/Best%20Practices/Sea_Grant_Coastal_Floodplain_Bylaw_Model_12_14_09.pdf.
Integrated Flood Management Concept Paper. (United Nations Associated Program on Flood
Management, World Meteorological Organization, 2009). Available at: http://www.unwater.org/downloads/concept_paper_e.pdf.
AWRA Case Studies in Proactive Flood and Drought Management: Additional Resources
61
Drought Management
Organizations and Agencies
National Drought Mitigation Center
Website: http://drought.unl.edu/ Phone: (402) 472–6707
American Planning Association, Drought Mitigation Project
Website: http://www.planning.org/research/drought/?print=true. National Integrated Drought Information System
Website: http://www.drought.gov/drought/ Reports, Models, and Case Studies
Drought Preparation and Response in Western States. (Western Governors’ Association, 2013). Available
at: https://www.westgov.org. Drought Ready Communities: A Guide to Community Drought Preparedness (National Drought
Mitigation Center, 2011). Available at: http://drought.unl.edu/portals/0/docs/DRC_Guide.pdf. Managing Water for Drought: A National Study of Water Management During Drought
(U.S. Army Corps of Engineers, 1994). Available at: http://www.iwr.usace.army.mil/docs/iwrreports/94nds8.pdf.
Managing Drought: A Roadmap for Change in the United States (The Geological Society of America,
2007). Available at: http://geosociety.org/meetings/06drought/roadmap.pdf.
AWRA Case Studies in Proactive Flood and Drought Management: Acronyms
62
Acronyms
AF: acre-feet AFWS: Automated Flood Warning System, operated by the National Weather Service and National Oceanic and Atmospheric Administration. ASDSO: Association of State Dam Safety Officials ASFPM: Association of State Floodplain Managers ASR: Aquifer storage and recovery AWRA: American Water Resources Association CFS: cubic feet per second CLDC: County/Local Drought Committees (see the State of Hawaii case study) CRS: Community Rating System, administered by Federal Emergency Management Agency CWRM: Commission on Water Resource Management (see the State of Hawaii case study) CWA: Clean Water Act EAA: Edwards Aquifer Authority EPA: U.S. Environmental Protection Agency
ESA: Endangered Species Act FEMA: Federal Emergency Management Agency GIS: Geographic Information Systems HMPs: Hazard Mitigation Proposals
HVAC: Heating, ventilation, and air conditioning. MCD: Miami Conservancy District in Southwest Ohio NDMC: National Drought Mitigation Center NERVE: Nashville Emergency Response Viewing Engine (see the Nashville, Tennessee case study) NFIP: National Flood Insurance Program NRCS: Natural Resources Conservation Service NWS: The National Weather Service
NOAA: National Oceanic and Atmospheric Administration
OWRB: Oklahoma Water Resources Board (see the Lone Chimney Water Association case study) SAFE: Situational Awareness for Flooding Events (see the Nashville, Tennessee case study) SAWS: San Antonio Water System TEMA: Tennessee Emergency Management Agency (see the Nashville, Tennessee case study) UFPP: United Flood Preparedness Plan (see the Nashville, Tennessee case study) USACE: U.S. Army Corps of Engineers USDA: U.S. Department of Agriculture WAGs: Watershed Advisory Guides (see the Nashville, Tennessee case study) WRD: Water Resources Department (see the state of Oregon case study)

This page is intentionally left blank.