UNCW Training and Resource Review Lt. James Watkins UNCW Police Department.

North Carolina International Terminal
P R O F O R M A B U S I N E S S P L A N
March 15, 2008
Prepared for North Carolina State Ports Authority
Prepared by
CH2M HILL


Pro Forma Business Plan
iii Copyright 2008 by CH2M HILL Inc.
Reproduction and distribution in whole or in part beyond the intended scope of the contract without the written consent of CH2M HILL Inc. is prohibited.
Contents Acronyms and Abbreviations ..................................................................................................................v 1.0 Introduction and Background..................................................................................................... 1 2.0 Findings.......................................................................................................................................... 1
2.1 Opportunity Assessment ................................................................................................ 2 2.2 Competitive Position Assessment ................................................................................. 4 2.3 Revenue Projection .......................................................................................................... 6 2.4 Operation and Maintenance Cost Projection ............................................................... 8 2.5 Pro Forma Economic Model ........................................................................................... 8
2.5.1 Capital Costs........................................................................................................ 9 2.5.2 Assumed Box Rate and Demand Growth ..................................................... 10 2.5.3 Concession Length............................................................................................ 11
2.6 Low-Peaking Operating Scenario................................................................................ 11 2.7 High-Peaking Operating Scenario............................................................................... 12
3.0 Report ........................................................................................................................................... 12 4.0 Conclusion ................................................................................................................................... 12 Tables
1 Capital Cost Summary, Low-Peaking Cost Analysis ............................................................. 8 2 Approximate Terminal Development Cost of Construction by Phases................................ 9 3 Low-Peaking Scenario Assumptions ...................................................................................... 10 Figures
1 Container Traffic Market Projections (2005 – 2030), U.S. East Coast and Gulf Coast ......... 3 2 A Comparison of Projected Container Traffic vs. Anticipated Terminal Capacity (2005 – 2030), U.S. East Coast and Gulf Coast .......................................................................... 4 3 Projected Container Traffic, North Carolina International Terminal, Years 2017 – 2045 ... 5 4 Comparison of Terminal Handling Charges (Box Rates)........................................................ 6 5 A Comparison of Operating Expenses as a Percentage of Revenue...................................... 7 6 Approximate Concession Tariff to Port based on Box Rate.................................................... 9 Appendixes
A Pro Forma Business Plan Report B Summary of Infrastructure Study and Cost Estimate C Drawings D Glossary


Pro Forma Business Plan
v Copyright 2008 by CH2M HILL Inc.
Reproduction and distribution in whole or in part beyond the intended scope of the contract without the written consent of CH2M HILL Inc. is prohibited.
Acronyms and Abbreviations
AAPA American Association of Port Authorities AASHTO American Association of State Highway and Transportation Officials ACI American Concrete Institute ACS Access Control System ADA Americans with Disabilities Act ADM Archer Daniels Midland AGV Automated Guided Vehicle ARMG Automated Rail-Mounted Gantry Crane ASD Allowable Stress Design AWWA American Water Works Association BMP Best Management Practice CAGR Compound Annual Growth Rate CCTV Closed Circuit Television CO-HM Commercial Heavy Manufacturing CTP Comprehensive Transportation Plan CY Container Yard DA Drivers Assistance DL Dead Load DOT Department of Transportation DTM Digital Terrain Model DWT Dead Weight Tonnage E&D Elderly and Disabled EA Environmental Assessment EA Each E-IRR Equity Internal Rate of Return EIS Environmental Impact Statement EM Engineering Manual (U.S. Army Corps of Engineers) EMC Electric Membership Corporation FEU Forty-foot Equivalent Unit FGS Forty-foot Ground Slot fps Foot per Second GDP Gross Domestic Product GIS Geographic Information System gpd Gallons per Day gpm Gallons per Minute HCM Highway Capacity Manual HS20 Highway Specification 20 ICW Inside Crane Width IY Intermodal Yard (also called Intermodal Rail Yard) IRR Internal Rate of Return

Pro Forma Business Plan
vi Copyright 2008 by CH2M HILL Inc.
Reproduction and distribution in whole or in part beyond the intended scope of the contract without the written consent of CH2M HILL Inc. is prohibited.
JOC Journal of Commerce KV Kilovolt LL Live Load LOA Length Over All LOS Level of Service LT Long Ton LS Lump Sum M&R Maintenance and Repair MHW Mean High Water MLW Mean Low Water MLLW Mean Lower Low Water MOTSU Military Ocean Terminal, Sunny Point mph Miles per Hour MSL Mean Sea Level NAVD North American Vertical Datum NC North Carolina NCAC North Carolina Administrative Code NC-CREWS North Carolina Coastal Region Evaluation of Wetland Significance NCDOT North Carolina Department of Transportation NFPA National Fire Protection Association NGVD National Geodetic Vertical Datum NOAA National Oceanic and Atmospheric Administration NTP Notice to Proceed O&M Operation and Maintenance OCR Optical Character Recognition ODMDS Ocean Dredged Material Disposal Site OPEX Operating Expenses PF Power Factor PIANC Permanent International Association of Navigation Congresses PIDAS Perimeter Intrusion, Detection, Assessment System P-IRR Project Internal Rate of Return PPP Public-Private Partnership, also referred to as a P3 psf Pounds per Square Foot psig Pounds per Square Inch Gauge PTZ Pan Tilt Zoom ROW Right of Way RMS Root Mean Square RPM Radiation Portal Monitor RPZ Reduced Pressure Zone RTG Rubber-Tired Gantry SF Square feet

Pro Forma Business Plan
vii Copyright 2008 by CH2M HILL Inc.
Reproduction and distribution in whole or in part beyond the intended scope of the contract without the written consent of CH2M HILL Inc. is prohibited.
SMS Security Management System STS Ship-to-Shore TEU Twenty–foot Equivalent Unit TGS Twenty-foot Ground Slot TIP Transportation Improvement Program TL Total Load TOR Top of Rail TOS Terminal Operating System TSS Total Suspended Solids TWIC Transportation Worker Identification Credential UFC Unified Facilities Criteria ULCS Ultra Large Container Ship UNCTAD United Nations Conference on Trade and Development USACE United States Army Corps of Engineers WRDA96 Water Resources Development Act of 1996 yd3 Cubic Yard


1 Copyright 2008 by CH2M HILL Inc.
Reproduction and distribution in whole or in part beyond the intended scope of the contract without the written consent of CH2M HILL Inc. is prohibited.
Pro Forma Business Plan
1.0 Introduction and Background The North Carolina State Ports Authority (the Authority) is exploring an opportunity to develop approximately 600 acres of property as a new container terminal. The project, currently known as the North Carolina International Terminal, is envisioned as a 3 million twenty–foot equivalent unit (TEU) annual capacity facility, serving the international shipping needs of the State of North Carolina and the hinterlands of the eastern United States.
As part of the ongoing project development, the Authority conducted studies to provide a preliminary characterization of the North Carolina International Terminal concept, its development program, and economic viability. From these studies, a business model was developed which resulted in this Pro Forma Business Plan.
A pro forma document, such as this, is intended solely as a presentation of conceptualized data or information, where certain values or concepts are hypothetical or tentative. The pro forma evaluation is a tool used as an approximate evaluation prior to having actual data.
The primary tool developed to convey the study, analysis, and findings of the economic viability of the North Carolina International Terminal is contained in a report (see Appendix A) in PowerPoint format. This document is intended to supplement the report in Appendix A as a means of providing summary information in an alternative format.
As a subcomponent of the business evaluation, a study was undertaken to provide structure to the project definition and to support the Pro Forma Business Plan with conceptual approxima-tions of cost and schedule. The study developed conceptual plans solely for the purpose of approximating the size, configuration, and location of port facilities and infrastructure elements as a tool from which estimates of cost and schedule became input data to the economic business evaluation.
Simultaneously, the elements of the business model were also developed. These business elements included market studies, opportunity assessments, competitive positioning assess-ments, and revenue and expense projections. All of the elements studied were then integrated to develop the business model and evaluate the viability of the North Carolina International Terminal concept. The steps undertaken and the resulting economic evaluation are the subject of this document.
The basic business premise being evaluated in this document is that the Authority will create a concession opportunity sufficiently attractive for an investor to commit funds, build, and operate the proposed terminal facility for an extended period.
2.0 Findings The Pro Forma Business Plan focuses on providing preliminary answers to four key questions:
1. Does a new container terminal in North Carolina make economic sense from the perspectives of the various stakeholders?
2. What are the factors that make a new container terminal necessary and attractive?
Pro Forma Business Plan
2 Copyright 2008 by CH2M HILL Inc.
Reproduction and distribution in whole or in part beyond the intended scope of the contract without the written consent of CH2M HILL Inc. is prohibited.
3. What competitive advantage can be created for a new container terminal in North Carolina?
4. Under what organizational conditions can benefits be maximized?
The Pro Forma Business Plan is organized into five key elements:
Opportunity Assessment – Identifies and quantifies the future addressable market for waterborne container traffic which may be captured by the port, and determines the market need for additional system capacity to meet the needs of the addressable market.
Competitive Position Assessment – Provides an understanding of the competitive environment within which the port must market, provides a marketing strategy to create a sustainable competitive advantage, and provides a future container demand projection for the port.
Revenue Projection – Identifies and evaluates the key revenue opportunities for the port as a sustainable enterprise.
Operating and Maintenance Cost Projection – Identifies and quantifies representative operating and maintenance (O&M) cost parameters for U.S. East Coast container terminals, and describes a conceptual operating model for the North Carolina International Terminal.
Pro Forma Economic Model – Provides a computational assessment of the economic viability of the North Carolina International Terminal enterprise, identifies major gaps or economic barriers to project success, and determines those elements which would most improve the economic fundamentals of the project.
The findings for each of the five major elements of the Pro Forma Business Plan are summarized below.
2.1 Opportunity Assessment The North Carolina International Terminal will operate within the U.S. East Coast market, providing opportunity to potentially capture market share from North Atlantic, South Atlantic, and Gulf Coast ports. In practice, targeted market opportunities would need to be assessed as the project matures. However, for planning purposes, an econometric evaluation has been conducted to frame the opportunity.
Three scenarios have been considered: a Low Case, a Base Case, and a High Case.
Under the Low Case, an econometrically driven projection was developed, taking into account population growth for the region, U.S. gross domestic product (GDP) growth, and other economic factors.
The Low Case projection considers negative pressures on market factors such as slowing off-shoring, decelerating consumption rates, and slowing container penetration. A nominal percentage (10 percent) of future trans-Pacific traffic is assumed to be diverted to U.S. East and Gulf Coast ports, due to service reliability issues and potential capacity constraints. This case results in an estimated 4.3 percent compound annual growth rate (CAGR) for the period 2005 through 2030.
Under the Base Case, historically observed U.S. container growth rates have been considered for the U.S. East and Gulf Coasts. Industry trends observed include: continued diversion of

Pro Forma Business Plan
historically West Coast traffic to the U.S. East and Gulf Coasts and increases in trans-Atlantic traffic through the Suez Canal. This case results in an estimated 6.3 percent CAGR over the period 2005 through 2030.
Under the High Case, the potential impact of higher container volumes transiting the Panama Canal is considered. This case follows the 6.3 percent CAGR rate of the Base Case, with a higher 8.3 percent growth rate between 2014 and 2020, reflecting the opportunity to divert more cargo from the U.S. West Coast to the East Coast following expansion of the canal. Growth is then assumed to return to 6.3 percent CAGR from 2020 to 2030.
3 Copyright 2008 by CH2M HILL Inc.
Reproduction and distribution in whole or in part beyond the intended scope of the contract without the written consent of CH2M HILL Inc. is prohibited.
Figure 11 presents a graphical depiction of the Low, Base, and High Case container traffic market projections for the U.S. East and Gulf Coasts. The data suggest container traffic would grow from approximately 20 million TEUs (2005) to between 54 and 94 million TEUs by the year 2030.
Competing ports along the U.S. East Coast are responding to the projected traffic increases, and investments in capacity are anticipated within the foreseeable future. Large capacity improvements are expected at the Port of Virginia, the Port of Charleston, the Port of Savannah, and the Jacksonville Port Authority. With the addition of the new APM Terminals, Virginia, anticipated improvements would essentially double the existing capacity of container operations within these four regions from approximately 10.2 million TEUs (2006) to approximately 19.9 million TEUs. An additional 1.5 million TEUs may be developed at Jasper County, SC; however, this future program is yet undefined.
Figure 1
0
10
20
30
40
50
60
70
80
90
100
2005
2006
2007
E
2008
E
2009
E
2010
E
2011
E
2012
E
2013
E
2014
E
2015
E
2016
E
2017
E
2018
E
2019
E
2020
E
2021
E
2022
E
2023
E
2024
E
2025
E
2026
E
2027
E
2028
E
2029
E
2030
E
Low Case Base Case High Case 2021E - 'E' denotes 'Estimated'
Thro
ughp
ut D
eman
d(M
illio
ns o
f TEU
)
CAGR 4.3%
CAGR 6.3%
Container Traffic Market Projections (2005 – 2030)U.S. East Coast and Gulf Coast
(Million TEU)High Case (CAGR 6.3%) with 8.3% growth from
2014 to 2020Expanded Panama
Canal Opens
Given the Base Case growth projection, the required U.S. East and Gulf Coast capacity is 80 million TEUs by the year 2030. Under this scenario, the projected shortfall in capacity along the East and Gulf Coasts exceeds 40 million TEUs (see Figure 2). It is for this very large, unsatisfied demand the North Carolina International Terminal is being proposed. Specifically, demand would start to exceed capacity between the years 2014 and 2019, assuming no signifi-cant, unaccounted for productivity improvements are implemented at any of the competing port facilities.
While considered to be a robust opportunity, any market entry strategy for the North Carolina International Terminal should take into account the amount of the unmet demand and project execution timeframe.
1 On Figures 1 and 2, the letter “E” beside the year designation indicates “estimated.” All figures are presented in full-size format in the report in Appendix A.

Pro Forma Business Plan
4
Figure 2
A Comparison of Projected Container Traffic vs. Anticipated Terminal Capacity (2005 – 2030)
U.S. East Coast and Gulf Coast (M TEU)
0
10
20
30
40
50
60
70
80
90
2005
2006
2007
E
2008
E
2009
E
2010
E
2011
E
2012
E
2013
E
2014
E
2015
E
2016
E
2017
E
2018
E
2019
E
2020
E
2021
E
2022
E
2023
E
2024
E
2025
E
2026
E
2027
E
2028
E
2029
E
2030
E
0
10
20
30
40
50
60
70
80
90
Low Case Container ForecastBase Case Container ForecastHigh Case Container ForecastAvailable Container Terminal Capacity (U.S. East & Gulf Coast)Maximum available capacity at year 2030, with identified Competing Ports at 6,000 TEU/Acre productivity
Source: Global Insight, Low Case ProjectionCH2M HILL Analysis
Note: Assumes no productivity improvements above 6,000 TEU/Storage AcreAssessment of capacity versus demand only – does not imply a construction timeline
Window of Capacity Shortage
Thro
ughp
ut D
eman
d(M
TEU
) Capacity
(M TEU
)A Comparison of Projected Container Traffic vs. Anticipated Terminal Capacity
(2005 – 2030)U.S. East Coast and Gulf Coast (M TEU)
Savannah Built-out
Craney Island Ph-1 Complete - Ongoing Build-out
Jacksonville Built-outCharleston Built-outAPMT Built-out
2021E - 'E' denotes 'Estimated'
2.2 Competitive Position Assessment Competitiveness for a port facility must consider the strategic needs of the three port customers: steamship lines, land-side carriers, and cargo. For the North Carolina International Terminal, competitiveness issues center around six strategic marketing elements designed to deliver a competitive value proposition. The six strategic marketing elements include:
Deep Water – The North Carolina International Terminal’s competitor ports are positioning to accommodate the physical requirements of the fleet of large vessels planned for deployment on major trade lanes. Such vessels would require approximately -52.5 feet (ft) of operating draft and would serve the Asian export terminals already providing such water depths. Many ports along the U.S. coast are planning for channel depths of between -48 ft and -52.5 ft. Additionally, the Panama Canal expansion project includes dredging to a planned depth of -51.0 ft plus over-dredge. Consequently, a marketing strategy should include planned water depth of up to -52.5 ft. Start of operations could utilize the existing channel depth of -42 ft; however, the deepening program should be underway, with project completion planned within a fairly short time following startup.
High Rail Volume – The North Carolina International Terminal’s competitor ports are providing and expanding intermodal rail capability at their facilities. These facilities are being expanded on-terminal to provide a more competitive advantage than off-terminal facilities. Rail capability expands the hinterland service opportunities for a port facility and decreases roadway truck traffic. The North Carolina International Terminal’s geographic position, relative to major consumption zones, indicates a high volume rail strategy would improve the
Copyright 2008 by CH2M HILL Inc. Reproduction and distribution in whole or in part beyond the intended scope of the contract without the written consent of
CH2M HILL Inc. is prohibited.

Pro Forma Business Plan
5 Copyright 2008 by CH2M HILL Inc.
Reproduction and distribution in whole or in part beyond the intended scope of the contract without the written consent of CH2M HILL Inc. is prohibited.
competitiveness of the facility. System improvements are anticipated on the CSX rail network to enable capture of potential competitive advantage for both CSX and North Carolina International Terminal. For planning purposes, the North Carolina International Terminal’s target rail traffic represents 50 percent of its projected container traffic.
Good Highway Access – Recent U.S. East Coast trends include significant investment in distribution centers to support supply chain requirements. Good unimpeded highway access is necessary to complete the logistics chain. The North Carolina International Terminal’s location, proximity to large tracts of developable land, and ability to serve a growing North Carolina population base provide an opportunity to establish a unique value proposition focused on the supply of goods to regional distribution centers. Efficient highway access is a key enabler.
High Productivity – A container terminal, designed for high productivity at both the berth and the gates, would cater to the strategic needs of both the steamship lines and land-side carriers. Today’s opportunity would be to leverage the best available technology, processes, and practices to implement a container terminal catering to future needs.
State of the Art – Competitiveness may be tied to the long-term flexibility and effectiveness of the facility to meet the needs of multiple stakeholders while serving its customers. Areas to consider and evaluate for possible implementation of state-of-the art facility elements include terminal and supply chain security, environmental stewardship, total cost of ownership, stakeholder issues, and deployed technology. Such a marketing strategy would focus on reducing risks associated with long-term operating costs and potential re-capitalization of assets.
Cost-Competitive Services – Fundamentally, the North Carolina International Terminal must provide services at a rate which is competitive with alternatives. Analysis of the value chain with regard to key competitors indicates the North Carolina International Terminal can be cost-competitive in many markets, served by both truck and intermodal rail.
Pro Forma Business Plan
6
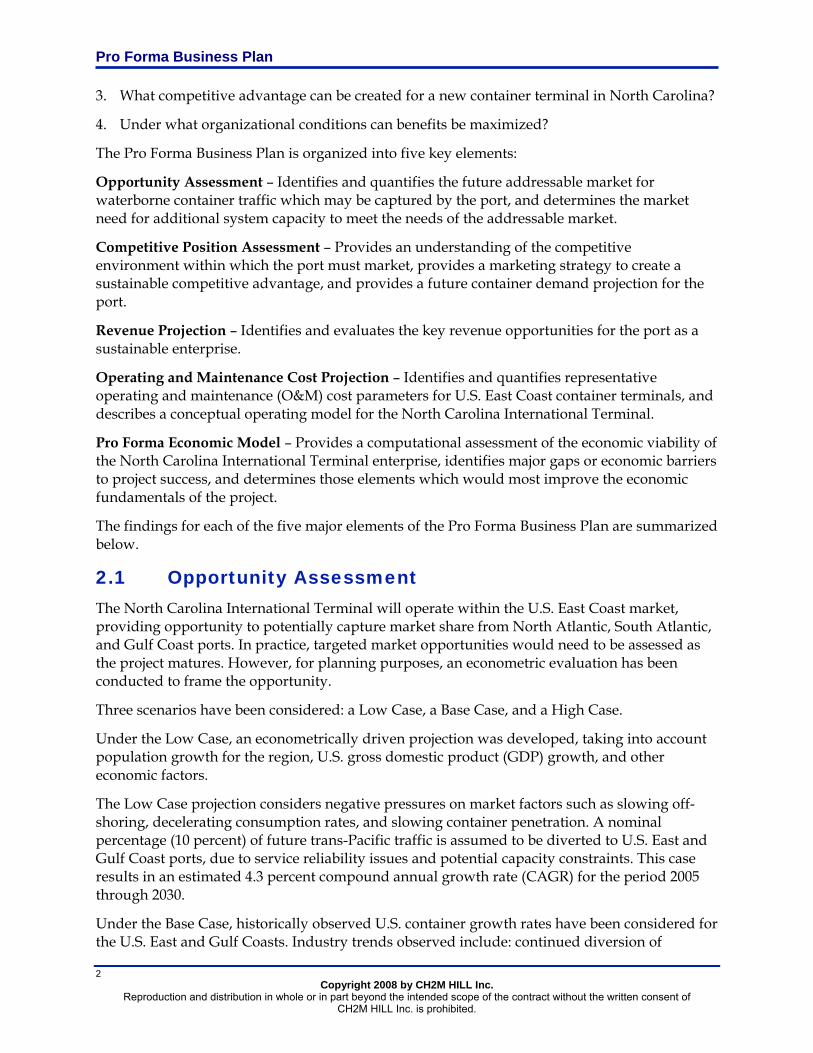
The projected container traffic for the North Carolina International Terminal considers implementation of the above strategic marketing objectives. Figure 3 presents two scenarios for the North Carolina International Terminal projected container traffic, assuming a start of
operations at year 2017, effective market penetration, and capture of market share from competing ports. The projection indicates, under the marketing strategy assumptions presented above, the terminal could reach its operational capacity of 3 million TEUs within the first 10 years of operation. While alternative marketing strategies may ultimately be considered and deployed, for planning purposes this six-point marketing strategy (and resulting projection) has been utilized as the basis for the economic model used in the Pro Forma Business Plan.
2.3 Revenue Projection Revenue projections are based upon the projected container traffic curve for the North Carolina International Terminal and a range of market-based box rates for container handling services.
The container traffic projection is based on the North Carolina International Terminal initially capturing a market share of 3 percent of the East Coast containerized trade volume, and growing to 6.75 percent market share by 2030. Within 10 years, the estimated throughput of the port facility would be 3 million TEUs.
Copyright 2008 by CH2M HILL Inc. Reproduction and distribution in whole or in part beyond the intended scope of the contract without the written consent of
CH2M HILL Inc. is prohibited.
Figure 3
Source: Global Insight, CH2M HILL Analysis
Thro
ughp
ut D
eman
d(M
TEU
)
CAGR 4.3%
0
1
2
3
4
5
6
7
2015
2016
2017
2018
2019
2020
2021
2022
2023
2024
2025
2026
2027
2028
2029
2030
2031
2032
2033
2034
2035
2036
2037
2038
2039
2040
2041
2042
2043
2044
2045
Base Case Hinterland Strategy
`
With Off-Terminal Rail
Projected Container TrafficNorth Carolina International Terminal
Years 2017 - 2045(M TEU)
Estimated Footprint CapacityWith On-Terminal Rail
2017 - 2021
CAGR 17.0%
2021 - 2030
CAGR 8.6%
2030 - 2045
CAGR 4.0%
Start to Capacity
CAGR 11.3%

Pro Forma Business Plan
The range of box rates considered in the revenue projection is based upon observed rates at U.S. East Coast ports (Figure 4) and consideration of the North Carolina International Terminal’s future competitiveness relative to each of the ports surveyed. The low end of the range is the Port of Wilmington, North Carolina, at $150 per move, and the upper end of the range is approximately $300 per move for the Port Authority of New York & New Jersey. Although Wilmington, North Carolina is in close proximity to the North Carolina International Terminal, the $150 rate was not considered to be commensurate with the service and scale of operations which the North Carolina International Terminal would provide. The relatively low rate at the Port of Wilmington, North Carolina is representative of the current system-wide capacity surplus (as illustrated previously in Figure 2), geography, scale of operations, and land-side access. The upper end of $300 per move is a function of costly labor, constrained operations, and significant local demand. A range of $200-$250 (2007 $) is considered to be more consistent and competitive with rates observed from the Port of Virginia and container operations at Charleston and Savannah. These facilities offer similar scales of services, provide intermodal facilities, and are in relatively close proximity. The start of North Carolina International Terminal operations would also coincide with projected capacity constraints along the U.S. East Coast, providing opportunities to command higher rates.
Figure 4
$0
$50
$100
$150
$200
$250
$300
New
Yor
k&
New
Jers
ey
Virg
inia
Cha
rlest
on
Sava
nnah
Wilm
ingt
on
Comparison of Terminal Handling Charges (Box Rates) at Competing Ports
Source: Port Financial Statements, CH2M HILL Analysis
Selecting a single rate is complicated by local market conditions. Rates may be negotiated on a volume basis with some carriers. To account for uncertainty, a range of rates ($150-$275) per box was considered in the analysis.
Growth of the box rate is forecast at a conservative rate of 2.5 percent annually until terminal capacity is reached, after which a more aggressive 4 percent growth rate is used. This higher rate reflects an environment where capacity is estimated to be outstripped by demand in the U.S.
Because terminal charges account for only approximately 5 percent of the supply chain costs to transport a container from Asia to major U.S. inland rail destinations, cost-competitiveness at the terminal level is one of several components taken into account in the decision to use one terminal over another. Other factors, such as the rail connectivity and reliability, also play a significant role in supply chain competitiveness.
7 Copyright 2008 by CH2M HILL Inc.
Reproduction and distribution in whole or in part beyond the intended scope of the contract without the written consent of CH2M HILL Inc. is prohibited.

Pro Forma Business Plan
8
2.4 Operation and Maintenance Cost Projection To develop an estimate of O&M costs, two factors were considered:
1. Current costs at operating facilities in the U.S.
2. Costs reflecting the assumed operating model.
Costs at operating terminals were investigated and found to, typically, range from 65 percent to 80 percent of revenue. Figure 5 illustrates total operating expenses at select East Coast competitor terminals, along with average ratios from East Coast and West Coast terminals. In all cases, the major cost driver is labor, which can constitute two-thirds of annual terminal costs. Based on the characteristics of the facilities surveyed, the lower end of the range of costs was considered more appropriate for the North Carolina International Terminal given that it would be a modern and highly efficient terminal in an attractive labor cost environment.
Copyright 2008 by CH2M HILL Inc. Reproduction and distribution in whole or in part beyond the intended scope of the contract without the written consent of
CH2M HILL Inc. is prohibited.
The assumed operating model provides opportunities for lower operating costs than observed at existing terminals through the use of automated equipment. These systems have significantly lower labor requirements, are faster than standard equipment, and are energy-efficient. Further detail is provided in Appendix B.
To approximate operating profit, a conservative estimate for O&M costs of 62 percent of revenue in the first year was selected. This ratio is modeled to decline over the period of the concession to 50 percent of revenue. This reduction accounts for improvements in operations and the growth of revenue once the terminal is steadily operating at capacity with increased box rates.
Figure 5
A Comparison of Operating Expenses as a Percentage of Revenue
0%
20%
40%
60%
80%
100%
Savannah Virginia (VIT) Charleston East Coast West Coast
Operating expenses
Source: Port Financial Statements, CH2M HILL Analysis
2.5 Pro Forma Economic Model A pro forma economic model was developed to analyze the long-term economic viability of the North Carolina International Terminal under a range of input assumptions. The analysis assumes the terminal would be developed, operated, and financed under a concession model for a fixed term. To evaluate viability, the economic model was developed to incorporate industry-observed capital structures, market rates for debt, and private equity investment targets. A basic criterion of commercial viability was whether the project could return a project internal rate of return (P-IRR) of greater than 10 percent.
Under a concession model, the port would maintain ownership of the underlying asset (land), and receive a combination of lease payments and tariffs in exchange for granting the concessionaire the rights to operate the terminal for a fixed term. The tariff could include a structure providing for a percentage of gross revenues or upfront premium payments. The potential value of lease/tariffs would be determined by the revenue potential and capital costs.

Pro Forma Business Plan
9 Copyright 2008 by CH2M HILL Inc.
Reproduction and distribution in whole or in part beyond the intended scope of the contract without the written consent of CH2M HILL Inc. is prohibited.
At the conclusion of the concession, the concessionaire would hand over ownership of the operating terminal’s real assets to the Authority.
Under a greenfield concession model, where the concessionaire would be expected to bear the entire risk of capital development and container volumes, the Pro Forma Business Plan assumes financial institutions would require the private sector concessionaire to invest its own equity to fund approximately 1/3 of the capital cost and to secure debt financing for the remaining 2/3 of the costs. Under this scenario, the private sector would likely seek a market-based internal rate of return on equity (E-IRR) on the order of 15 percent and a project break-even timeline of approximately 7 to 10 years.
These analyses reveal the key input variables to be used to determine the attractiveness of the terminal development investment. The key parameters are capital costs, assumed box rate and demand growth, and concession length.
2.5.1 Capital Costs
As a subcomponent of the business evaluation, a study was undertaken to provide structure to the project definition and to support the Pro Forma Business Plan with conceptual approximations of cost and schedule. The study developed conceptual plans solely for the purpose of approximating the size, configuration, and location of port facilities and infrastructure elements as a tool from which estimates of cost and schedule became input data to the economic business evaluation. A summary of this study is included in Appendix B.
The terminal was analyzed under both a Low-Peaking scenario and a High-Peaking scenario (see Sections 2.6 and 2.7).
A summary of the capital costs, in 2007 dollars, resulting from the Low-Peaking scenario is contained in Table 1.
TABLE 1 Capital Cost Summary, Low-Peaking Cost Analysis Component Approximate Cost Responsibility of Authority or State of North Carolina Environmental and Permitting Cost. $60,000,000 Terminal Development Cost (Subject of public-private partnership). $1,383,400,000 Non-Federal Share of Channel Deepening Cost (50%). $265,800,000
Subtotal of Authority Costs $1,709,200,000 Responsibility of Other Parties Total Roadway Improvements Costs. $181,500,000 Total Railroad Improvements Costs. $127,400,000 Federal Share of Channel Deepening Cost (50%). $265,800,000
Subtotal of Other Party Costs $574,700,000 Total Project Development Cost $2,283,900,000
This Low-Peaking cost is used as the base capital cost throughout the Pro Forma Business Plan because the Low-Peaking scenario is more typical of the automated operations proposed for this facility.

Pro Forma Business Plan
10
The economic analysis looked at operating cash flows with a three-phased terminal construction program. The first phase of construction is called the Minimum Build-out scenario and assumes the port terminal will become operational when two of the four berths are constructed. Each of the remaining two phases are defined by the construction of one of the two remaining berths. Development would be assumed to proceed in phases as demand warrants. After the third phase of construction, the Maximum Build-out would be achieved.
TABLE 2 Approximate Terminal Development Cost of Construction by Phases Construction Phase Approximate Cost
Phase 1 – Minimum Build-Out; two berths completed.
$983,000,000
Phase 2 – Completes the third of four berths.
$200,000,000
Phase 3 – Maximum Build-Out – all four berths completed.
$200,000,000
Total Constructed Cost $1,383,000,000
The approximated costs associated with each of the phases of construction of the terminal are shown in Table 2.
Assuming there is an economic case to develop the Minimum Build-out scenario, the completion of the full development would increase revenue at a lower cost. Approximately 70 percent of the costs are assumed to be incurred prior to opening day to create a fully functional terminal and intermodal facility. The remaining 30 percent would be spread out over the next 6 years as capacity is required.
2.5.2 Assumed Box Rate and Demand Growth
Comparative box rates are discussed in more detail in Section 2.3, and demand growth approximations are evaluated in Section 2.1. Generally, box rates above $200 are considered reasonable and are required to meet market investment targets based on a projected container traffic growth of approximately 11.3 percent CAGR from start of operations to full capacity (Figure 3). Box rates above $250 per box are considered non-competitive when compared to box rates at competing ports, at this time. The range of box rates used in the economic analysis is from $150 - $275 per box, as shown in Figure 6, to provide a broad comparison through the entire range.
Figure 6
Approximate Concession Tariff to Port based on Box Rate
0
200
400
600
800
1000
125 150 175 200 225 250 275
Box Rate ($)
PV o
f Tar
iff to
Por
t in
2007
($
mill
ions
)
25 yr term 30 yr term 35 yr term 50 yr term
Based on 10% discount rate to start of operations, 3% rate to 2007Tariff scenarios based on achieving 10% IRR and equity IRR>12%Provided for illustrative purposes - commercially acceptable terms will vary
Copyright 2008 by CH2M HILL Inc. Reproduction and distribution in whole or in part beyond the intended scope of the contract without the written consent of
CH2M HILL Inc. is prohibited.

Pro Forma Business Plan
11 Copyright 2008 by CH2M HILL Inc.
Reproduction and distribution in whole or in part beyond the intended scope of the contract without the written consent of CH2M HILL Inc. is prohibited.
2.5.3 Concession Length
A wide range of terminal concession lengths have been observed around the world. For analysis purposes, a range of lengths between 25 and 50 years has been considered (see Figure 6). The lower end of the range (25 years) would be considered a minimum for an investment of this magnitude. Concession lengths are driven by the required investment, market response, and Authority objectives. For reference, a similar-scale terminal under procurement in Vancouver, British Columbia is currently positioned as a 60-year concession.
2.6 Low-Peaking Operating Scenario The Low-Peaking scenario assumptions used to assess the economic viability of the terminal construction and operations are presented in Table 3. The scenario includes only those terminal development costs that would be anticipated to be borne by a private terminal developer/ operator and assumes a Public-Private Partnership (PPP) concession approach.
TABLE 3 Low-Peaking Scenario Assumptions
Project Timing Concession and project start. 2014 Operations start (Phase 1). 2017
Concession operating term.
25-50 years
Inflation and Discount Rate Revenue and operating cost escalation. 2.5% Discount rate (Port Tariff payment). 10%
Capital cost escalation.
2.5%, however, can vary significantly.
Capital Cost and Construction Schedule Phase 1 (2014 start). $976 M Phase 2/Phase 3
(2018/2021 start). $407 M
Revenue Projected Container Traffic. 0.9 –3.0 M TEUs Box rate range
analyzed. $150 - $275
Operating Costs Operating Costs as a percentage of revenue.
62% (declining to 50%)
Lease/Tariff to port. Annual payment+ % of revenue.
Financing Bond rate. 7% Bond totals. Approximately $890 M Minimum debt service coverage ratio. 1.2x Term. 25 + years.
Equity Expected return. >15% Equity invested. Approximately $547 M.
The capital cost for terminal development of the Low-Peaking operating scenario is $1.383 billion. Analyses indicate the terminal would be economically viable from a P-IRR perspective, and be able to return a tariff to the Port at box rates exceeding $200 for a 35-year concession (Figure 6). Longer concession terms and higher box rates would improve the economics of the project. The Low-Peaking scenario is the basis for the economic analysis provided in this Pro Forma Business Plan.

Pro Forma Business Plan
12 Copyright 2008 by CH2M HILL Inc.
Reproduction and distribution in whole or in part beyond the intended scope of the contract without the written consent of CH2M HILL Inc. is prohibited.
2.7 High-Peaking Operating Scenario The High-Peaking operating scenario has a capital cost of $1.582 billion. For the higher capital cost High-Peaking scenario to be viable, a concession term of at least 35 years combined with a box rate of approximately $225 would be required.
3.0 Report A report has been prepared to more fully describe the economic analysis completed and the results of this study (see Appendix A).
4.0 Conclusion A primary objective of the Pro Forma Business Plan was to assess the economic viability of the proposed North Carolina International Terminal. Economic analysis has revealed that developing and operating the container terminal meets basic economic viability based on the P-IRR criterion of 10 percent. Other cost components required to develop the project include early project development costs, navigation channel improvements, and rail and highway upgrades. These costs are outlined in this document but have differing responsible stakeholders and have not been included in the economic evaluation of the terminal operations.
The Pro Forma Business Plan economic viability was assessed by answering the four key questions posed in Section 2.0:
1. Does a new container terminal in North Carolina make economic sense from the perspectives of the various stakeholders?
Analysis of estimated U.S. demand growth and estimated increases in container terminal capacity supply suggests that the U.S. East and Gulf Coasts will meet a capacity shortfall between 2014 and 2019. Introducing the North Carolina International Terminal could immediately capture market share of over 0.9 M TEUs of the addressable market and grow to meet the terminal’s estimated capacity of 3 M TEUs within approximately 10 years. Economic modeling suggests that project revenues under these volumes are sufficient to fund construction of the terminal and provide a return on investment.
Informal market discussions with operators and developers suggest they both recognize the need for additional capacity and recognize the North Carolina International Terminal site as the only available large greenfield site along the U.S. East Coast to develop a new terminal.
2. What are the factors which make a new container terminal necessary and attractive?
As stated above, a comparison of available and planned container terminal capacity along the U.S. East and Gulf Coasts suggests demand will exceed capacity as early as the year 2014. The forecast capacity shortage provides an attractive entry opportunity for the project. The project location has favorable market characteristics, including its close proximity to fast growing population centers.
Based on estimated future market share, the project has robust revenue growth potential and presents an estimated cash flow profile capable of returning value back to operator, developer, and the Authority.

Pro Forma Business Plan
13 Copyright 2008 by CH2M HILL Inc.
Reproduction and distribution in whole or in part beyond the intended scope of the contract without the written consent of CH2M HILL Inc. is prohibited.
3. What competitive advantage can be created for a new container terminal in North Carolina?
An external competitive analysis suggests the North Carolina International Terminal could go to market with a cost-competitive strategy. The assessment also identified six key strategic elements that would make the North Carolina International Terminal competitive and attractive:
I. Deep water (-52.5 feet draft) to accommodate the growing fleet of large ships.
II. High intermodal rail split focused on deep hinterland markets (markets greater than 500 miles from the terminal location).
III. Good highway access to meet development needs of distribution centers.
IV. High productivity to minimize shippers’ costs of operating large ships.
V. State-of-the-Art facility with technologically advanced operations, providing environmental sustainability, advanced port and supply chain security, and lowest total cost of ownership characteristics.
VI. Cost-Competitive Service delivering required customer services at a total supply chain cost that is competitive with other ports and gateways.
4. Under what organizational conditions can benefits be maximized?
The terminal could be developed by the Authority (Option 1), a private terminal operating company through a PPP (Option 2), or through a joint venture approach (Option 3). While all approaches are potentially viable, for assessment purposes a PPP was modeled, in which a private terminal operator is responsible for financing the terminal construction. Results indicate that a PPP could be utilized to develop the project, while providing returns to the investor(s) and the Authority. Alternative financing and/or organizational structures may further improve the economics and will be evaluated in future studies.
Using a PPP approach has the following potential attributes:
• Requires the lowest public investment from the Authority.
• Provides the lowest exposure to market risk for the Authority.
• Provides guaranteed positive cash flows to the Authority from the start of operations.
• Provides the most rigorous test of return requirements.
• Results of Option 2 can be transferred to either Option 1 or Option 3, should the economics and risk profiles prove attractive to the Authority for further public investment.
• Fits with observed investment practices of industry investors.
• Provides the greatest opportunity for expediency.
• Provides economic impacts commensurate with development by the Authority.


Appendix A
Pro Forma Business Plan Report


1
North Carolina International Terminal Business Sustainability Pro Forma Business Plan
Report
Wilmington, NCMarch 15, 2008
Copyright 2008 by CH2M HILL Inc. Reproduction and distribution in whole or in part beyond the intended scope of the contract
without the written consent of CH2M HILL Inc. is prohibited.

2
Executive Summary
North Carolina State Ports Authority (the Authority) is exploring an opportunity to develop approximately 600-acres of property as a new container terminal, currently known as North Carolina International Terminal (the Project)
The Authority requested CH2M HILL conduct two studies and prepare two key deliverables to assist in characterizing the Project concept, its development program, and business case. The two deliverables are:
– Planning Assumptions
– Pro Forma Business Plan
The Pro Forma Business Plan consists of five key parts– Opportunity Assessment
– Competitive Position Assessment
– Revenue Projection
– Operating and Maintenance (O&M) Cost Projection
– Pro Forma Economic Model
3
Executive Summary
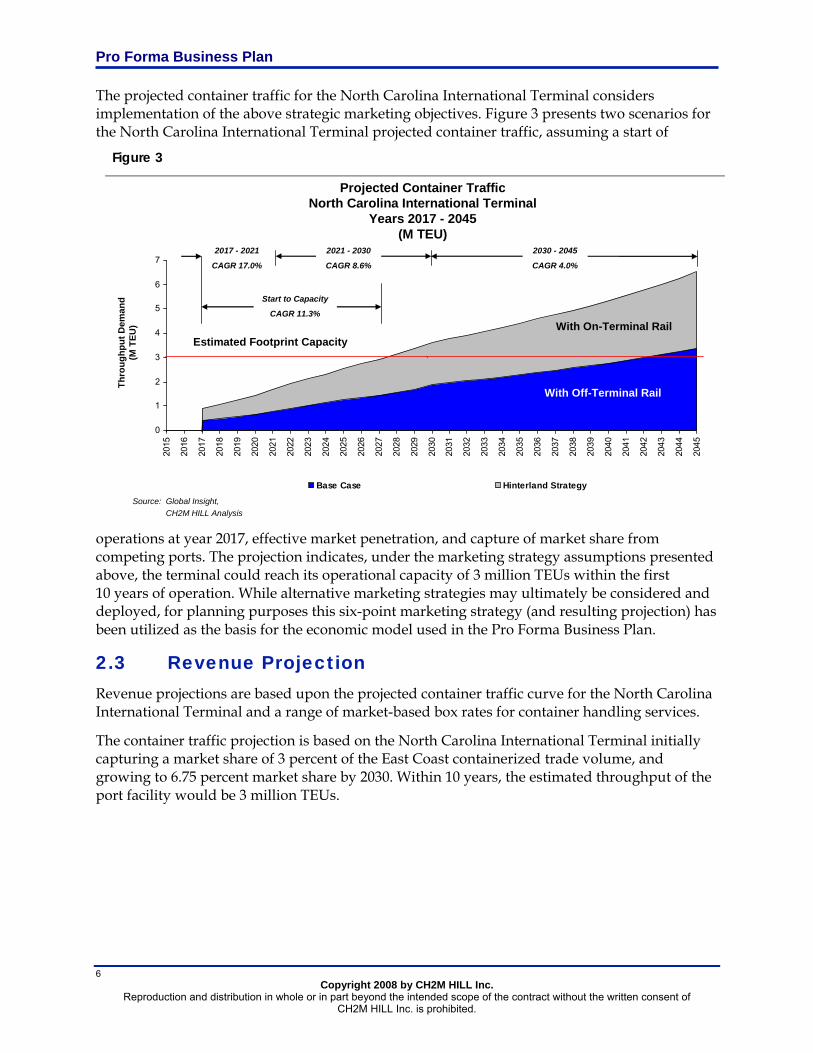
Container traffic along the US East and Gulf Coasts is expected to grow from an approximate current volume of 20 million Twenty–foot Equivalent Units (TEUs) to between 54 and 94 million TEUs, by the year 2030
– A Base Case forecast projection indicates an approximately 6.3% compound annual growth rate (CAGR)
– Econometrically, potential market risk factors indicate a Low Case forecast scenario of 4.3% CAGR
– Combined with the Panama Canal expansion project, capture of U.S. West Coast cargo could provide growth of up to 8.3% CAGR, over the period 2014 through 2020, and 6.3% CAGR thereafter
A comparison of available and planned container terminal capacity along the US East and Gulf Coasts indicates that demand will exceed capacity as early as the year 2014
– The most significant capacity shortfall will be experienced at North Atlantic ports
– South Atlantic ports are investing heavily to capture the opportunity
Year 2017 presents an opportunity to commence Project operations, as major projects are completed at competing ports, and demand continues to outpace supply

4
Executive Summary
A go-to-market strategy for the Project should encompass six key strategic elements
– Deep water (-52.5 feet draft) to accommodate container vessels up to 12,000 TEU
– High Intermodal Rail split – focused on deep hinterland markets
– Good highway access – focused on meeting development needs of distribution centers
– High productivity – focused on accommodating the turnaround time and cost control requirements of the large container vessels
– State of the Art facility – focused on deploying technologically advanced operations, providing environmental sustainability, advanced port and supply chain security, and lowest total cost of ownership characteristics
– Cost Competitive Service – delivering required customer services at a total supply chain cost that is competitive with other ports and gateways
Utilizing the proposed marketing strategy, the volume projection for container traffic approaches the “footprint capacity” of 3 million TEUs within the first 10 years of operations
5
Executive Summary
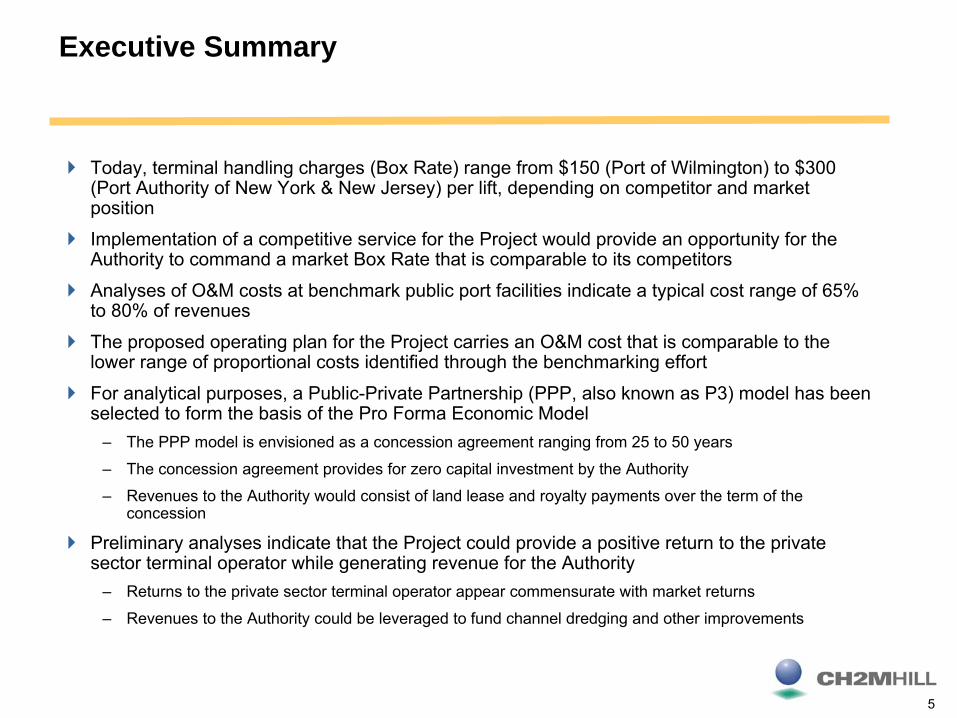
Today, terminal handling charges (Box Rate) range from $150 (Port of Wilmington) to $300 (Port Authority of New York & New Jersey) per lift, depending on competitor and market position
Implementation of a competitive service for the Project would provide an opportunity for the Authority to command a market Box Rate that is comparable to its competitors
Analyses of O&M costs at benchmark public port facilities indicate a typical cost range of 65% to 80% of revenues
The proposed operating plan for the Project carries an O&M cost that is comparable to the lower range of proportional costs identified through the benchmarking effort
For analytical purposes, a Public-Private Partnership (PPP, also known as P3) model has been selected to form the basis of the Pro Forma Economic Model
– The PPP model is envisioned as a concession agreement ranging from 25 to 50 years
– The concession agreement provides for zero capital investment by the Authority
– Revenues to the Authority would consist of land lease and royalty payments over the term of the concession
Preliminary analyses indicate that the Project could provide a positive return to the private sector terminal operator while generating revenue for the Authority
– Returns to the private sector terminal operator appear commensurate with market returns
– Revenues to the Authority could be leveraged to fund channel dredging and other improvements

6
Introduction
Opportunity Assessment
Competitive Position Assessment
Revenue Projection
O&M Cost Projection
Pro Forma Economic Model
Conclusions / Recommendations
Appendix
Contents

7
North Carolina State Ports Authority is exploring the economic viability of a new 600-acre container terminal
The Authority has acquired approximately 600 acres of property along the Cape Fear River for the purpose of developing a new ocean freight container terminal, herein referred to as the North Carolina International Terminal (the Project)
The Project development program is currently in its early stages and is focused on a preliminary assessment of viability and potential gaps
The Authority requested CH2M HILL conduct two studies and prepare two key deliverables to assist in characterizing the Project concept, its development program, and business case. The two deliverables are:
– Planning Assumptions
– Pro Forma Business Plan
The Pro Forma Business Plan provides a preliminary assessment of the business case for the Project, focused on development of a Pro Forma Economic Model

8
The Pro Forma Economic Model is the first part of a multi- phased Business Sustainability Framework
Pro Forma Business Plan
Strategic Financing Planning
Model
Economic Benefits Analysis
Public-Private Investor
Feasibility
Ongoing Support
• Opportunity Assessment
• Competitive Position Assessment
• Revenues / Costs• Pro-Forma
Economic Model
• Financing Policies Workshop
• Financing Alternatives
• Scenario analysis
• Direct, Indirect, Induced Benefits
• State Tax / Public Cash Flows from Operations
• Performed by University
• Document Project Characteristics
• Describe Nature of Opportunity
• Information Memorandum
• Provide Bridge Funding Support
• Federal Grant Funding
• Competing Port Funding Report
• Initial cargo volume, revenue & operating expense Projections
• Capital costs (from others)
• Value Proposition• Economic Viability
• Determination of most preferred financing strategy
• Segmentation of financing requirements by sector
• Requirements for P3 approach
• Review / Support of 3rd party product development
• Compilation of report findings for port use
• Select process to attract investors
• Educate investors on details of proposed project
• Initiate investor bidding process
• Assist the Authority in securing bridge financing
• Identify and research Federal funding opportunities
• Segment competing port financing strategies
Business Sustainability Framework Phase IIA Phase IIB Future Work
9
What are the factors that make a new
container terminal necessary and
attractive?
What are the factors that make a new
container terminal necessary and
attractive?
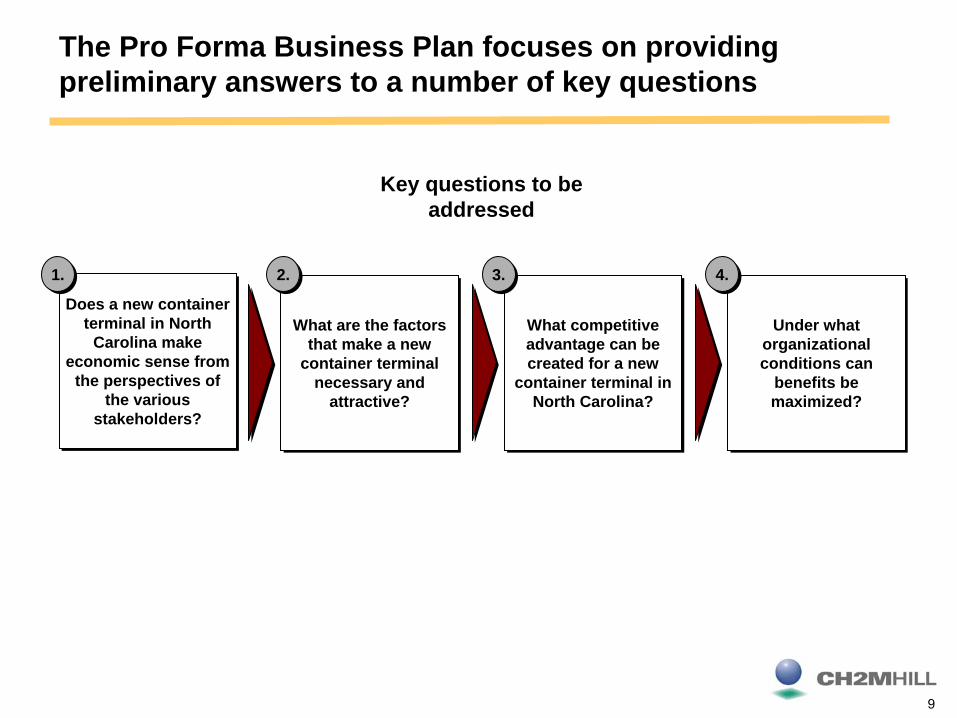
The Pro Forma Business Plan focuses on providing preliminary answers to a number of key questions
Key questions to be addressed
Does a new container terminal in North
Carolina make economic sense from
the perspectives of the various
stakeholders?
Does a new container terminal in North
Carolina make economic sense from
the perspectives of the various
stakeholders?
1.1.
What competitive advantage can be created for a new
container terminal in North Carolina?
What competitive advantage can be created for a new
container terminal in North Carolina?
2.2. 3.3.
Under what organizational conditions can
benefits be maximized?
Under what organizational conditions can
benefits be maximized?
4.4.

10
As a framework, the Pro Forma Business Plan consists of five key interrelated elements
Define Addressable
Market(s)
Define Addressable
Market(s)
Marketing Strategy Canvas
Marketing Strategy Canvas
Segment / Project
Revenues
Segment / Project
Revenues
Economic Model
Economic Model
Benchmark O&M Costs Benchmark O&M Costs
Capital Requirements
Capital Requirements
Volume Projection(s)
Volume Projection(s)
Opportunity Assessment Opportunity Assessment
Competitive Position
Assessment
Competitive Position
Assessment
Revenue Projection Revenue
Projection
O&M Cost Projection O&M Cost Projection
Pro – Forma Economic
Model
Pro – Forma Economic
Model
Profile Competitive Advantages
Profile Competitive Advantages
Service Characteristic
Demands
Service Characteristic
Demands
Benchmark Rates
Benchmark Rates
Preliminary Operating
Plan
Preliminary Operating
PlanProject O&M
Costs Project O&M
Costs
Investment / Sensitivity Analysis
Investment / Sensitivity Analysis
Define Enterprise Structure
Define Enterprise Structure
Segment Investment
Requirements
Segment Investment
Requirements
Define Value Proposition
Define Value Proposition
Key Deliverables

11
Execution of this work plan consisted of approximately 16 weeks
Phas e Project Task
J Aug Sept Oct Nov
1 2 3 4 5 6 7 8 9 10 11 12 13 14 15 16
1
Opportunity Assessment– Define addressable market– Service demand characteristics– Volume projection
2Competitive Position Assessment
– Profile competitive advantages– Marketing strategy canvas– Define value proposition
3Revenue Projection
– Benchmark rates– Segment / Project revenues
4
O & M Cost Projection– Preliminary operating plan– Benchmark O & M costs– Project O & M costs
5
Pro Forma Economic Model– Capital requirements– Define enterprise structure– Segment investment requirements– Economic model– Investment / sensitivity analysis
Team Meetings
11/1
5/20
07 –
Dra
ft Fi
nal
Rep
ort
Draft Report 10/31/2007
Kickoff 07/23/2007

12
Introduction
Opportunity Assessment
Competitive Position Assessment
Revenue Projection
O&M Cost Projection
Pro Forma Economic Model
Conclusions / Recommendations
Appendix
Contents
13
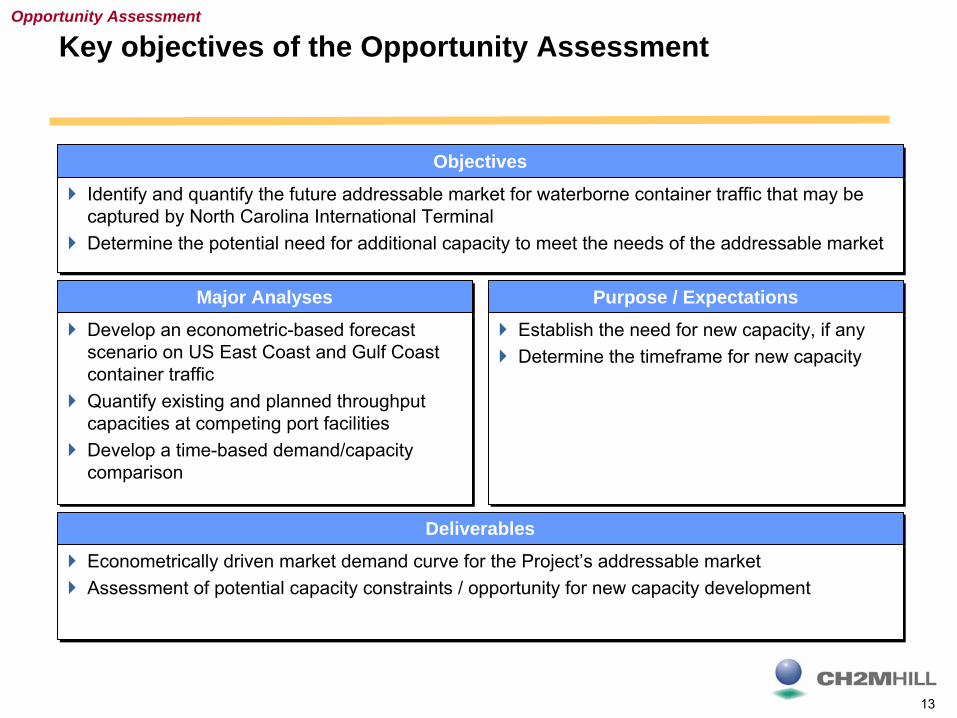
Key objectives of the Opportunity AssessmentOpportunity Assessment
ObjectivesObjectives
Identify and quantify the future addressable market for waterborne container traffic that may be captured by North Carolina International TerminalDetermine the potential need for additional capacity to meet the needs of the addressable market
Identify and quantify the future addressable market for waterborne container traffic that may be captured by North Carolina International TerminalDetermine the potential need for additional capacity to meet the needs of the addressable market
Major AnalysesMajor Analyses
Develop an econometric-based forecast scenario on US East Coast and Gulf Coast container trafficQuantify existing and planned throughput capacities at competing port facilitiesDevelop a time-based demand/capacity comparison
Develop an econometric-based forecast scenario on US East Coast and Gulf Coast container trafficQuantify existing and planned throughput capacities at competing port facilitiesDevelop a time-based demand/capacity comparison
Purpose / ExpectationsPurpose / Expectations
Establish the need for new capacity, if anyDetermine the timeframe for new capacityEstablish the need for new capacity, if anyDetermine the timeframe for new capacity
DeliverablesDeliverables
Econometrically driven market demand curve for the Project’s addressable marketAssessment of potential capacity constraints / opportunity for new capacity developmentEconometrically driven market demand curve for the Project’s addressable marketAssessment of potential capacity constraints / opportunity for new capacity development

14
The market forecast considers three growth scenarios for the Addressable Market (U.S. East and Gulf Coast Ports)
Low Case
Base Case
High Case
National growth rates are lower than historical averages, negatively impacting upside potential for East Coast and Gulf Coast portsAssumes tempered market response to macro events, such as the Panama Canal expansion project
National growth rates are lower than historical averages, negatively impacting upside potential for East Coast and Gulf Coast portsAssumes tempered market response to macro events, such as the Panama Canal expansion project
East Coast and Gulf Coast container traffic grows at rates that are commensurate with historically observed growth rates for North America, as a wholeAssumes measurable traffic is diverted from West Coast ports, resulting in consistent market share, going forward
East Coast and Gulf Coast container traffic grows at rates that are commensurate with historically observed growth rates for North America, as a wholeAssumes measurable traffic is diverted from West Coast ports, resulting in consistent market share, going forward
East Coast and Gulf Coast container traffic grows at rates that are above average for historically observed North American growth rates for the period 2014 - 2020Assumes West Coast congestion and impact of Panama Canal expansion project drive further increases in traffic diversion over the Base Case, for the period 2014 - 2020
East Coast and Gulf Coast container traffic grows at rates that are above average for historically observed North American growth rates for the period 2014 - 2020Assumes West Coast congestion and impact of Panama Canal expansion project drive further increases in traffic diversion over the Base Case, for the period 2014 - 2020
Growth Scenario Premise
Opportunity Assessment

15
Base Case: On average, the growth rate for North American container traffic is twice GDP growth
-2.00%
0.00%
2.00%
4.00%
6.00%
8.00%
10.00%
12.00%
14.00%
16.00%
1997 1998 1999 2000 2001 2002 2003 2004 2005 2006
Year
Year
ove
r Yea
r Gro
wth
(%)
GDP Grow thN.A. Container Grow thGDP AverageN.A. Container Grow th (Average)
Historical Growth RatesNorth American Container Traffic vs. GDP
(1997 – 2006)
Average container growth rate (6.3%)
Average GDP growth rate (3.12%)
ObservationsObservations
As an economic indicator, container traffic growth tends to correlate with GDP growth
Over the past 10-year period, GDP growth has averaged approximately 3.12%, year over year
While highly volatile, U.S. container traffic has averaged approximately 6.3% year over year growth
For planning over long terms, container growth rates that are approximately twice GDP growth rates is an industry rule of thumb (for North America)
Thus, for the Base Case, container traffic is assumed to grow at 6.3% CAGR, for U.S. East and Gulf Coast ports
Opportunity Assessment
Source: Bureau of Economic AnalysisClarksons Research ServicesCH2M HILL Analysis

16
Low Case: Recognition that a variety of econometric factors can impact historic trends and future events
ObservationsObservations
Econometrically driven, and assumes historical regional trends as a baseIncorporates lower than average National growth rate (4.9%) for containerized cargo due to potential market risks– Decelerating consumption rates– Slowing container penetration– Slowing off-shoring rates of manufacturingAssumes marginal diversion of traffic to East Coast ports through Panama Canal all-water services (10% diversion)Assumes West Coast port congestion challenges are largely mitigated over timeAssumes trade imbalance at East Coast ports, coupled with potential Panama Canal tariffs, will temper diversion potentialResults in a long-term regional growth rate that is commensurate with historical rates for the region (4.3% CAGR)
Econometrically driven, and assumes historical regional trends as a baseIncorporates lower than average National growth rate (4.9%) for containerized cargo due to potential market risks– Decelerating consumption rates– Slowing container penetration– Slowing off-shoring rates of manufacturingAssumes marginal diversion of traffic to East Coast ports through Panama Canal all-water services (10% diversion)Assumes West Coast port congestion challenges are largely mitigated over timeAssumes trade imbalance at East Coast ports, coupled with potential Panama Canal tariffs, will temper diversion potentialResults in a long-term regional growth rate that is commensurate with historical rates for the region (4.3% CAGR)
South Atlantic Ports
North Atlantic Ports
0
10000
20000
30000
2005 2030
0
10000
20000
30000
2005 2030
Gulf Ports
0
10000
20000
30000
2005 2030
Empties Exports Imports
Legend
Source: Global InsightCH2M HILL Analysis
2.9 X
3.2 X
2.0 X
Opportunity Assessment
‘000
’s T
EU
‘000
’s T
EU‘0
00’s
TEU

17
High Case: The Panama Canal expansion project and West Coast capacity constraints drive future volumes
ObservationsObservations
Demand at the Ports of Los Angeles and Long Beach is forecast to triple from 15 million TEU (2007) to 45 million TEU (2030)
While expansion plans are in place, environmental considerations have hampered expansion projects over the recent past
Labor unions have successfully slowed deployment of step-function productivity improvements, such as automation
Mainline rail services to Midwest and East Coast markets experience reliability problems
U.S. East Coast ports are experiencing above-average (double digit) growth today, as a result of carrier responses to West Coast constraints
Expansion of the Panama Canal (2014) will open the door for all-water transit of up to 12,000 TEU vessels, allowing carriers to re-design their services
Potential exists for sustained above-average growth for U.S. East Coast ports as carriers re-consider their deployment strategies
Nominally, East Coast diversion of as much as 50% of the forecast 30 million TEU increase for the Ports of Los Angeles and Long Beach would result in an additional 2% CAGR over the Base Case
Results in High Case growth rate of 8.3% CAGR for the period 2014 through 2020, and returning to Base Case growth rate thereafter.
Opportunity Assessment

18
By 2030, U.S. East and Gulf Coast container traffic is projected to increase by as much as a factor of four
0
10
20
30
40
50
60
70
80
90
100
2005
2006
2007
E
2008
E
2009
E
2010
E
2011
E
2012
E
2013
E
2014
E
2015
E
2016
E
2017
E
2018
E
2019
E
2020
E
2021
E
2022
E
2023
E
2024
E
2025
E
2026
E
2027
E
2028
E
2029
E
2030
E
Low Case Base Case High Case 2021E - 'E' denotes 'Estimated'
Source: Global Insight, Low Case ProjectionCH2M HILL, Base Case and High Case ProjectionCH2M HILL Analysis
Opportunity AssessmentTh
roug
hput
Dem
and
(M T
EU)
CAGR 4.3%
CAGR 6.3%
Container Traffic Market Projections (2005 – 2030)U.S. East Coast and Gulf Coast
(M TEU)High Case (CAGR 6.3%) with 8.3% growth from
2014 to 2020Expanded Panama
Canal Opens

19
Many of the ports meeting that projected demand have significant capacity improvement programs in place
Opportunity Assessment
Competing Port
Current Capacity1
(M TEU)
Future Capacity1
(M TEU)Major Project
Future Terminal &
StorageAreas2
(Acres)
Resultant Productivity
TEU / Storage
Acre
Capacity at 6,000 TEU /
Storage Acre
Project Status
Virginia Port Authority 2.4 5.4
Craney Island Marine
Terminal
175011003 4,909 6.6 Engineering underway
APMT Virginia 2.5 2.5
APMT Virginia
Terminal
575460
5,435 2.76 Berths complete50% of backlands complete
Port of Charleston 2.0 3.8
Charleston Naval
Complex
675540
7,037 3.24 Project underway
Port of Savannah 2.4 6.5
Garden City Terminal
densification
1200960
6,770 5.76 Project underway
Jasper County 0 TBD Joint Port
Authority1200TBD
TBD TBDJoint Project Office NamedFeasibility Study PlannedOutcome uncertain
Jacksonville Port Authority
0.9 1.7 Expansion320256
6,640 1.54 Signed contractProject underway
Total 10.2 19.9 19.9
Source: 1As reported publicly by Port Authority / Terminal OperatorCH2M HILL Analysis
Notes: 2Estimated at 80% of Total Future Terminal Areas3VPA’s NIT facility is a multi-purpose facility. Approximately 50% of terminal is utilized for general cargo.

20
System-wide, projected container traffic is expected to exceed capacity between the years 2014 and 2019
Opportunity Assessment
A Comparison of Projected Container Traffic vs. Anticipated Terminal Capacity (2005 – 2030)
U.S. East Coast and Gulf Coast (M TEU)
0
10
20
30
40
50
60
70
80
90
2005
2006
2007
E
2008
E
2009
E
2010
E
2011
E
2012
E
2013
E
2014
E
2015
E
2016
E
2017
E
2018
E
2019
E
2020
E
2021
E
2022
E
2023
E
2024
E
2025
E
2026
E
2027
E
2028
E
2029
E
2030
E
0
10
20
30
40
50
60
70
80
90
Low Case Container ForecastBase Case Container ForecastHigh Case Container ForecastAvailable Container Terminal Capacity (U.S. East & Gulf Coast)Maximum available capacity at year 2030, with identified Competing Ports at 6,000 TEU/Acre productivity
Source: Global Insight, Low Case ProjectionCH2M HILL Analysis
Note: Assumes no productivity improvements above 6,000 TEU/Storage AcreAssessment of capacity versus demand only – does not imply a construction timeline
Window of Capacity Shortage
Thro
ughp
ut D
eman
d(M
TEU
) Capacity
(M TEU
)
A Comparison of Projected Container Traffic vs. Anticipated Terminal Capacity (2005 – 2030)
U.S. East Coast and Gulf Coast (M TEU)
Savannah Built-out
Craney Island Ph-1 Complete - Ongoing Build-out
Jacksonville Built-outCharleston Built-outAPMT Built-out
2021E - 'E' denotes 'Estimated'

21
The interaction of multiple variables complicates the forecasting of capacity shortfall
When capacity is tight, increases in pricing will enable higher marginal cost capacity increases (e.g. improvements that do not make sense today)Capacity can be increased through operational efficiency improvements
– Labor– Technology– Equipment
As the West Coast nears capacity, fluctuations in the split between Panama vs. land-bridge are likelyShipping economics are complex:
– A greater shift to all-water Panama routing will require more vessels (or larger vessels to maintain same volumes)
Some ports are constrained by mainline rail, others are constrained by intermodal yard issuesPower of West Coast labor unions may influence the rate of capacity increases
Opportunity Assessment
22
-10-8-6-4-20246
2006
2007
E
2008
E
2009
E
2010
E
2011
E
2012
E
2013
E
2014
E
2015
E
2016
E
2017
E
2018
E
2019
E
2020
E
2021
E
2022
E
2023
E
2024
E
2025
E
2026
E
2027
E
2028
E
2029
E
2030
E
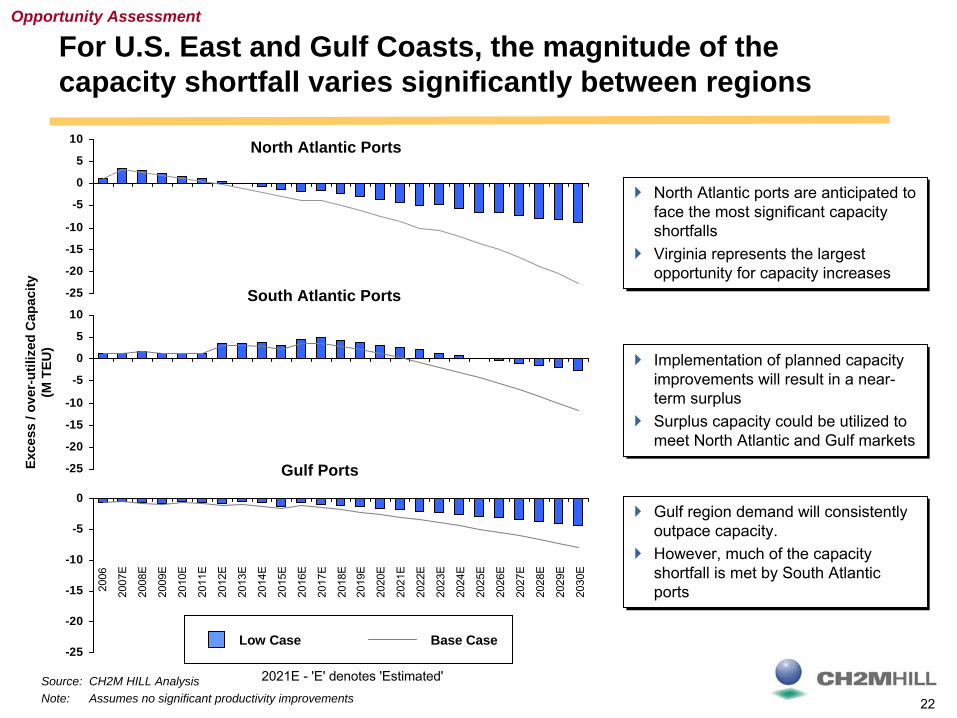
For U.S. East and Gulf Coasts, the magnitude of the capacity shortfall varies significantly between regions
-25
-20
-15
-10
-5
0
Gulf Ports-25
-20
-15
-10
-5
0
5
10South Atlantic Ports-25
-20
-15
-10
-5
0
5
10 North Atlantic Ports
Exce
ss /
over
-util
ized
Cap
acity
(M T
EU)
Source: CH2M HILL AnalysisNote: Assumes no significant productivity improvements
North Atlantic ports are anticipated to face the most significant capacity shortfallsVirginia represents the largest opportunity for capacity increases
North Atlantic ports are anticipated to face the most significant capacity shortfallsVirginia represents the largest opportunity for capacity increases
Implementation of planned capacity improvements will result in a near-term surplusSurplus capacity could be utilized to meet North Atlantic and Gulf markets
Implementation of planned capacity improvements will result in a near-term surplusSurplus capacity could be utilized to meet North Atlantic and Gulf markets
Gulf region demand will consistently outpace capacity.However, much of the capacity shortfall is met by South Atlantic ports
Gulf region demand will consistently outpace capacity.However, much of the capacity shortfall is met by South Atlantic ports
Opportunity Assessment
Low Case Base Case
2021E - 'E' denotes 'Estimated'

23
North Carolina International Terminal could be considered as centrally located, with opportunity to serve multiple markets
Strategically, North Carolina International Terminal could be considered both a North Atlantic and South Atlantic Port facility, simultaneously
The near-term future for North Atlantic ports points to a need for capacity that could be filled by North Carolina International Terminal
The estimated timing for start of operations at North Carolina International Terminal fits well with the projected timing of capacity shortfall
Marketing as a South Atlantic Port would place North Carolina International Terminal in a potentially fierce price war over the near term
As a potential first-call port, North Carolina International Terminal could enjoy traffic serving multiple markets, provided a focused marketing plan is deployed
A focused marketing strategy could place North Carolina International Terminal in a prime position that is more than just filling the gap
Opportunity Assessment

24
Introduction
Opportunity Assessment
Competitive Position Assessment
Revenue Projection
O&M Cost Projection
Pro Forma Economic Model
Conclusions / Recommendations
Appendix
Contents

25
Key objectives of the competitive position assessmentCompetitive Position Assessment
ObjectivesObjectives
Provide an understanding of the competitive environment within which the Project must marketDetermine a marketing strategy that will create sustainable competitive advantageApply marketing strategy to addressable market, and determine demand projection for the Project
Provide an understanding of the competitive environment within which the Project must marketDetermine a marketing strategy that will create sustainable competitive advantageApply marketing strategy to addressable market, and determine demand projection for the Project
Major AnalysesMajor Analyses
Identify and profile major competitorsCharacterize key market differentiatorsIdentify key enablers to competitiveness
Identify and profile major competitorsCharacterize key market differentiatorsIdentify key enablers to competitiveness
Purpose / ExpectationsPurpose / Expectations
Identify a go-to-market strategy to form the basis of the demand projection for the ProjectIdentify a go-to-market strategy to form the basis of the demand projection for the Project
DeliverablesDeliverables
Competitive Position AssessmentDemand projection for the ProjectCompetitive Position AssessmentDemand projection for the Project

26
While opportunity exists, a targeted marketing strategy is required to forecast volume and revenue for the Project
Container traffic is characterized as a discretionary cargo, subject to potential shifts between competing gateways due to cost or service characteristics
Consequently, a targeted marketing strategy is required to identify competitive advantages that could be exploited to capture a sustainable share of the market over the long term
The marketing strategy presented herein is based on research, industry experience, and interviews with industry participants, potential stakeholders, and customers (see Appendix)
Without a targeted marketing strategy, the Pro Forma Business Plan would be based on a “Build it and they will come strategy," and subject to competitor moves
The Pro Forma Business Plan is based on only one strategy – Other strategies and resulting investment requirements may exist
Six key elements have been identified – While central to the proposed strategy, alternatives to each element may exist
The marketing strategy, herein, and resultant Pro Forma Business Plan will be continuously updated as the Project continues to mature
Competitive Position Assessment

27
A competitive value proposition can be created if the marketing strategy meets the customer requirements
The end-to-end transportation supply chain costs must be
competitive with other alternatives
The end-to-end transportation supply chain costs must be
competitive with other alternatives
Deep Water
High Rail
Volume
Good Highway Access
High Productivity
State of the Art
Cost Competitive
Service
Deep water will be necessary to attract large vessels and large
volumes
Deep water will be necessary to attract large vessels and large
volumes
Geographically, no one competing port has a significant competitive advantage to deep
hinterland markets
Geographically, no one competing port has a significant competitive advantage to deep
hinterland markets
Congestion-free highway access maintains a cost-
competitive truck haul to local markets
Congestion-free highway access maintains a cost-
competitive truck haul to local markets
Future facility demands will likely include technology and
policy imperatives to meet both service and sustainability goals
Future facility demands will likely include technology and
policy imperatives to meet both service and sustainability goals
A purpose-built, highly productive facility would be
attractive to carriers deploying the largest vessels
A purpose-built, highly productive facility would be
attractive to carriers deploying the largest vessels
Competitive Position Assessment

28
Deep water will become an imperative to develop a competitive value proposition
Competitive Position Assessment
2006 vessel construction
0102030405060
<4,000 4,000-4,999
5,000-5,999
6,000-6,999
7,000-7,999
8,000+
TEU Capacity
Num
ber o
f ves
sels
deliv
ered
200
6 Panamax Post Panamax
Super Post Panamax
Nominal 50’-52’ draft2006 vessel construction
0102030405060
<4,000 4,000-4,999
5,000-5,999
6,000-6,999
7,000-7,999
8,000+
TEU Capacity
Num
ber o
f ves
sels
deliv
ered
200
6 Panamax Post Panamax
Super Post Panamax
Nominal 50’-52’ draft
Panama Canal expansion includes planned depth of -51 feet plus over dredgePort facilities surrounding the Panama Canal gateways have depths up to -52 feetExisting US East Coast transhipment facility (Freeport, Bahamas) maintains -51 feet of draft.
-60-50-40-30-20-10
010
NY&
NJ
Virg
inia
Cha
rlest
on
Sava
nnah
Jack
sonv
ille
Competing Port Drafts
-60-50-40-30-20-10
010
Mal
aysi
a
Hon
gK
ong
Qui
ndao
Yant
ian
Bus
an
Kao
shia
n
Tian
jin
Dal
ian
Major Asian Port Drafts
PlannedSource: Clarksons Research Services, CH2M HILL Analysis Source: Port Websites, CH2M HILL Analysis
Source: Port / Terminal Operator Websites, CH2M HILL Analysis

29
Intermodal rail service will be required to build scale, establishing competitive position against other ports
Competitive Position Assessment
North Carolina
International Terminal
Foreseeable CSX Network Improvements
I-95 Corridor double stack clearance to Washington/Baltimore and west to OhioAtlanta “mixing” improvements – focused on network optimization and improved service to Midwest markets
Atlanta
I-95 Corridor
Each of the Project’s competitors provide intermodal service today– Savannah 20% and Charleston <20% total
intermodal split – Port of Virginia inland port / Norfolk Southern
Heartland corridor are major intermodal playsHow cargo enters the network is important– Jacksonville is CSX’s primary South Atlantic
“mixing’ facility– Savannah CSX intermodal traffic is positioned
and “mixed” in JacksonvilleThe Project’s geographic position makes rail service an imperative– Opens gateway to deep hinterland markets (i.e.
Atlanta, Memphis, Louisville, Chicago)Dedicated CSX service to the Project site is achievable– CSX has expressed interest in the project– As sole service provider to the Project site, CSX
has indicated willingness to explore competitiveness improvement opportunities with the Authority
With large cargo discharges per call – a well designed service can be deployed to deliver 50% of container traffic by intermodal
Existing LinesForeseeable Improvements
Legend
Source: CSX, CH2M HILL Analysis

30
Good highway access makes truck transport competitive for destinations within 250 miles
Competitive Position Assessment
Shippers require supply chain reliabilityAvoiding urban areas is major asset to reliable growth Truck transport could be comparatively efficient from the Project site
Large distribution centers and warehousing facilities follow port developments
Big box retailers have set up massive import facilities near Port of Savannah, Port of Virginia, and Port of Houston
Success requires good connectivity to distribution centers and warehousing
Efficient Interstate connectivity is essential– Savannah is finalizing “Last Mile” initiativeApproximately 50% of cargo volume forecast to travel to/from terminal by truckThe Project’s location creates opportunity to construct a dedicated highway connection away from population centers
Market demand within 250 miles within NC (millions of TEU)
2020 2030
Import 2.0 2.5
Export 1.7 2.2
3.7 4.7
Sizeable local market within trucking distance>12 million people within 250 miles
Source: Global Insight, CH2M HILL Analysis

31
High productivity at the berth will be necessary to meet expectations of carriers with large vessel deployments
Competitive Position Assessment
Reported productivity metrics at competing ports are mixed
Rates of over 40 moves per hour have been recorded, including at Wilmington
However, typical productivity rates are on the order of 30 – 35 moves per hour
High capacity vessels will require fast turnaround times in port to be competitive
A first-port-of-call opportunity will generate significant container moves per call for a large vessel
A terminal designed to accommodate high productivity rates, and fast vessel turnaround times, will have a competitive advantage

32
A State-of-the-Art facility will address multiple dimensions of service, stewardship and responsibility
Competitive Position Assessment
Environmental Sustainability
Lowest Life-Cycle Costs
Terminal Technology
Security Protocols
APMT Portsmouth represents the state-of-the-art in North America todayAutomation provides productivity improvements while offsetting labor costsInformation technology will continue to improve the ability to provide seamless vessel to inland transfer capability
All port facilities are viewed with significant environmental scrutinyEnvironmental demands have consistently become more stringentAn eye towards environmental sustainability, today, could be a competitive advantage tomorrow
Terminal security vs. cargo securityA systemic approach to port and supply chain security, designed to maximize cargo velocityNuclear, biological, and chemical security
Focusing on reducing long-term operating costs versus lower initial capital costsCareful selection of materials and construction methodologies to reduce maintenance expensesSelection of equipment to capture economic benefits of overall system efficiency
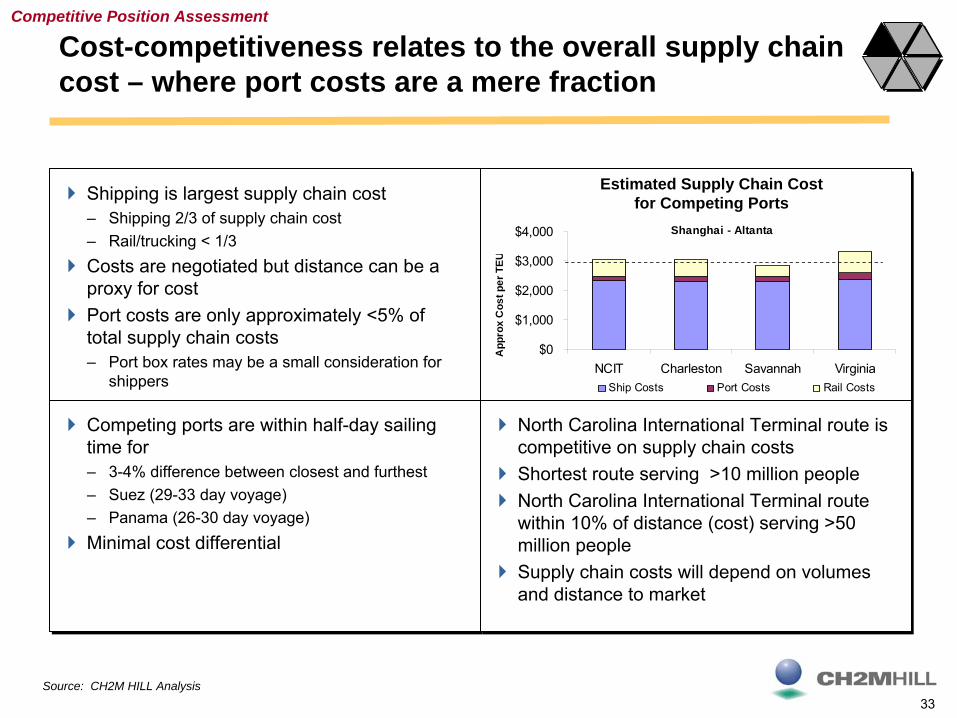
33
Cost-competitiveness relates to the overall supply chain cost – where port costs are a mere fraction
Competitive Position Assessment
Shipping is largest supply chain cost– Shipping 2/3 of supply chain cost– Rail/trucking < 1/3Costs are negotiated but distance can be a proxy for costPort costs are only approximately <5% of total supply chain costs– Port box rates may be a small consideration for
shippers
Competing ports are within half-day sailing time for – 3-4% difference between closest and furthest– Suez (29-33 day voyage) – Panama (26-30 day voyage)Minimal cost differential
North Carolina International Terminal route is competitive on supply chain costsShortest route serving >10 million peopleNorth Carolina International Terminal route within 10% of distance (cost) serving >50 million peopleSupply chain costs will depend on volumes and distance to market
Shanghai - Altanta
$0
$1,000
$2,000
$3,000
$4,000
NCIT Charleston Savannah Virginia
App
rox
Cos
t per
TEU
Ship Costs Port Costs Rail Costs
Estimated Supply Chain Cost for Competing Ports
Source: CH2M HILL Analysis

34
With On-Terminal Rail service, North Carolina International Terminal could reach capacity of 3 million TEUs by 2027…
Source: Global Insight, CH2M HILL Analysis
Competitive Position AssessmentTh
roug
hput
Dem
and
(M T
EU)
CAGR 4.3%
0
1
2
3
4
5
6
7
2015
2016
2017
2018
2019
2020
2021
2022
2023
2024
2025
2026
2027
2028
2029
2030
2031
2032
2033
2034
2035
2036
2037
2038
2039
2040
2041
2042
2043
2044
2045
Base Case Hinterland Strategy
`
With Off-Terminal Rail
Projected Container TrafficNorth Carolina International Terminal
Years 2017 - 2045(M TEU)
…Beyond 2029, a modest growth rate results in opportunity up to 6 million TEU across a typical 30-year concession term
Estimated Footprint CapacityWith On-Terminal Rail
2017 - 2021
CAGR 17.0%
2021 - 2030
CAGR 8.6%
2030 - 2045
CAGR 4.0%
Start to Capacity
CAGR 11.3%
35
Introduction
Opportunity Assessment
Competitive Position Assessment
Revenue Projection
O&M Cost Projection
Pro Forma Economic Model
Conclusions / Recommendations
Appendix
Contents

36
Key objectives of the revenue projectionRevenue Projection
ObjectivesObjectives
Determine the envelop of potential revenues for North Carolina International Terminal Establish the range of box rates for North Carolina International Terminal, based on competitor ratesAssess opportunity to increase rates over time
Determine the envelop of potential revenues for North Carolina International Terminal Establish the range of box rates for North Carolina International Terminal, based on competitor ratesAssess opportunity to increase rates over time
Major AnalysesMajor Analyses
Benchmark rates at the Authority and competing container terminalsBenchmark rates at the Authority and competing container terminals
Purpose / ExpectationsPurpose / Expectations
A realistic estimate of revenue per unit is required to understand potential marginsA realistic estimate of revenue per unit is required to understand potential margins
DeliverablesDeliverables
Competitive box rate and revenue growth scenario for North Carolina International TerminalCompetitive box rate and revenue growth scenario for North Carolina International Terminal

37
Competing terminal handling charges (Box Rates) range from $70 to $150 more than Port of Wilmington, today
Port CostsPort Costs
Today, the Authority offers the most-competitive box rate for container handling services at Port of Wilmington
Competitive rates range from approximately $150 to $300 per box– Rates are subject to local market
conditions – Rates may be negotiated on a volume
basis for some carriers
The greatest opportunity for variability in rates is at the Terminal level
Cost-competitiveness is subject to the overall value chain associated with ocean transport, port costs, and land-side carrier costs.
Today, the Authority offers the most-competitive box rate for container handling services at Port of Wilmington
Competitive rates range from approximately $150 to $300 per box– Rates are subject to local market
conditions– Rates may be negotiated on a volume
basis for some carriers
The greatest opportunity for variability in rates is at the Terminal level
Cost-competitiveness is subject to the overall value chain associated with ocean transport, port costs, and land-side carrier costs.
Notes: *Port of Wilmington Rates are based on 2007 contracted rates plus stevedoring rates, and an assumed rail split commensurate with assumed future NCIT split
Source: Port Financial Statements, CH2M HILL Analysis
0 % 2 5% 50 % 75% 10 0 % 12 5% 150 % 175% 2 0 0 %
Vessel
Terminal
Labor
Comparison of Variability Between Box Rate Components (Percentage)
Ben
chm
ark
Box
Rat
es ($
)Ty
pica
l Rev
enue
com
pone
nts
Percent Variability
Revenue Projection
$0
$50
$10 0
$150
$2 0 0
$2 50
$3 0 0
New York &
New Jersey
Virginia
Charleston
Savannah
Wilmington
Comparison of Terminal Handling Charges (Box Rates)* at Competing Ports

38
Despite The Authority’s current below-market rate, future rates commensurate with regional ports can be assumed…
The below-market rate environment at Port of Wilmington, today, is representative of system-wide capacity surplus, geography, and land-side access
The proposed services that would be offered at North Carolina International Terminal differ significantly from Port of Wilmington, today
Start of operations would coincide with projected capacity constraints along the US East Coast, providing opportunities to command market rates
Marginal costs (i.e.. ongoing capital improvements) would be timed to maximize marginal benefits
…Thus the Competitive Range is identified as $200 to $250 (2007) for box rates, and used in the economic model
Revenue Projection

39
Introduction
Opportunity Assessment
Competitive Position Assessment
Revenue Projection
O&M Cost Projection
Pro Forma Economic Model
Conclusions / Recommendations
Appendix
Contents

40
An O&M cost projection is necessary to determine margin potential, and overall profitability
O&M Cost Projection
ObjectivesObjectives
Identify and quantify representative O&M cost parameters for US East Coast container terminalsDescribe a conceptual operating plan, from which the Pro Forma may be generatedIdentify and quantify representative O&M cost parameters for US East Coast container terminalsDescribe a conceptual operating plan, from which the Pro Forma may be generated
Major AnalysesMajor Analyses
Benchmark publicly available cost data at the Authority and competing container terminalsCharacterize base operating assumptions
Benchmark publicly available cost data at the Authority and competing container terminalsCharacterize base operating assumptions
Purpose / ExpectationsPurpose / Expectations
A realistic estimate of cost per unit is required to understand potential margins and overall attractiveness of the enterprise
A realistic estimate of cost per unit is required to understand potential margins and overall attractiveness of the enterprise
DeliverablesDeliverables
Representative proportional O&M costs and potential reduction scenario for North Carolina International Terminal Representative proportional O&M costs and potential reduction scenario for North Carolina International Terminal

41
Operating expenses (OPEX) typically represent 65%-80% of revenues at public ports
CommentsComments
Surveyed publicly available financial statements for U.S. East Coast ports to determine benchmark OPEXBenchmarks may be developed on a per TEU or per box basis, however do not correlate wellVolume variability between ports and differences in market conditions are key factors that affect correlation of benchmark dataFor benchmarking purposes, operating costs are more correlated to revenues, a ratio that is typically used by industry for reporting terminal performance and to assess investment opportunitiesA detailed operating cost build-up will be developed during the next project phase
Surveyed publicly available financial statements for U.S. East Coast ports to determine benchmark OPEXBenchmarks may be developed on a per TEU or per box basis, however do not correlate wellVolume variability between ports and differences in market conditions are key factors that affect correlation of benchmark dataFor benchmarking purposes, operating costs are more correlated to revenues, a ratio that is typically used by industry for reporting terminal performance and to assess investment opportunitiesA detailed operating cost build-up will be developed during the next project phase
Operating expenses
0%
20%
40%
60%
80%
100%
Savannah Virginia (VIT) Charleston East Coast West Coast
Operating expenses
Operating labor, 51%
Maintenance labor, 17%
Power and Fuel, 4%
Management, 1%
Rent / Tariff, 11%
Depreciation, 6%
Equipment, IT, Security & other,
9%
Typical OPEX Breakdown
A comparison of OPEX as a percentage of revenue
O&M Cost Projection
Source: Port Financial Statements, CH2M HILL Analysis
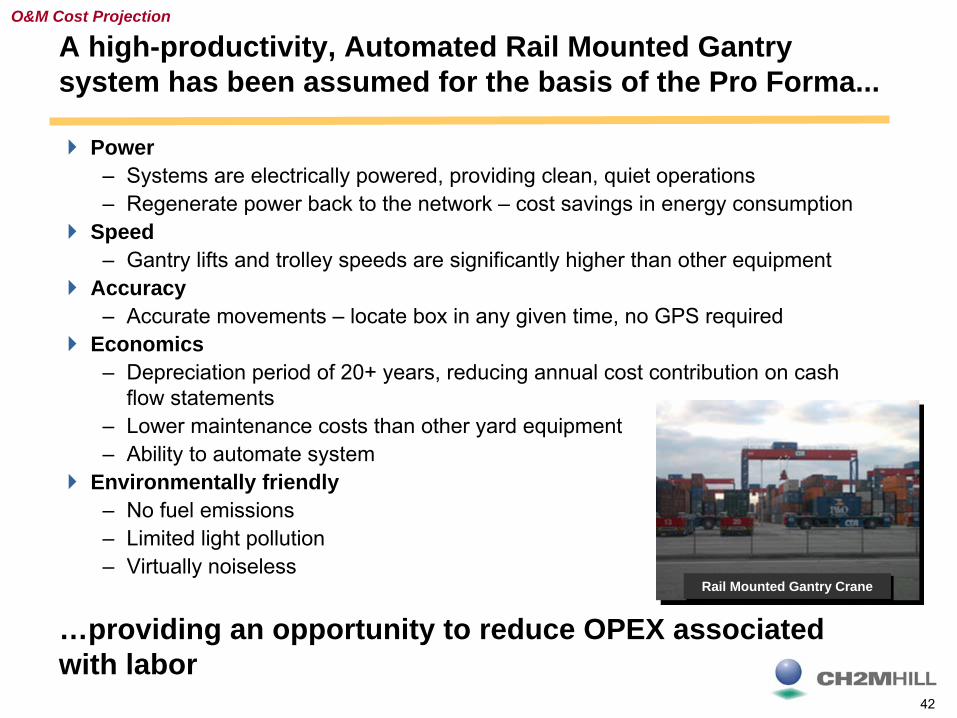
42
A high-productivity, Automated Rail Mounted Gantry system has been assumed for the basis of the Pro Forma...
O&M Cost Projection
Rail Mounted Gantry CraneRail Mounted Gantry Crane
Power– Systems are electrically powered, providing clean, quiet operations– Regenerate power back to the network – cost savings in energy consumption
Speed– Gantry lifts and trolley speeds are significantly higher than other equipment
Accuracy– Accurate movements – locate box in any given time, no GPS required
Economics– Depreciation period of 20+ years, reducing annual cost contribution on cash
flow statements– Lower maintenance costs than other yard equipment– Ability to automate system
Environmentally friendly– No fuel emissions– Limited light pollution– Virtually noiseless
…providing an opportunity to reduce OPEX associated with labor

43
The ARMG operation will reduce typical OPEX by up to 28%, as a result of lower operating labor costs
ARMG Impacts to Labor vs. Other General Operations
ARMG Impacts to Labor vs. Other General Operations
Lower number of equipment operators.– Shorter travel distances for manned equipment
to interchange zones – Minimal yard labor needed for stacking
operations (only for exceptions) Faster productivity allows for better utilization of personnel– Minimal to no standby time due to reliance on
other operations cycles – Easily pooled machines allow for better unit
productivity Lower number of clerks. – By automating the stacking process, there is
less potential for an errant move and less human-to-machine handovers which require a move update
– There is literally no space to allow any redundant personnel due to safety issues. For example, clerks are not allowed in an automated space.
Lower number of equipment operators.– Shorter travel distances for manned equipment
to interchange zones– Minimal yard labor needed for stacking
operations (only for exceptions)Faster productivity allows for better utilization of personnel– Minimal to no standby time due to reliance on
other operations cycles – Easily pooled machines allow for better unit
productivityLower number of clerks. – By automating the stacking process, there is
less potential for an errant move and less human-to-machine handovers which require a move update
– There is literally no space to allow any redundant personnel due to safety issues. For example, clerks are not allowed in an automated space.
A comparison of Operations Labor Costs by deployed Yard System
(100% RTG = 51% Operating Labor Cost Contribution)
Operating labor, 23%
RMG cost savings potential,
28%
Maintenance labor, 17%
Equipment, IT, Security & other,
9%
Management, 1%
Rent / Tariff, 11%
Depreciation, 6%
Power and Fuel, 4%
Impact on Typical OPEX due to ARMG System deployment
Source: CH2M HILL AnalysisNote: ARMG cost savings ranges from 13% to 28%, depending on original equipment deployed
RMG System, 44%
Straddle Carrier, 65%
Wheels, 72%Top Pick,
73%
RTG, 100%
0%
20%
40%
60%
80%
100%
RTG
Top
Pick
Whe
els
Stra
ddle
Car
rier
RM
GSy
stem
O&M Cost Projection
Source: CH2M HILL Analysis

44
With the ARMG system, North Carolina International Terminal can assume OPEX as low as 50% of revenue
While heavier capital investments are required for the ARMG system, the system inherently provides operating cost savings, with the greatest impact on Operating Labor
– Worse Case – 80% ratio benchmark less 28% = OPEX at 52% of Revenue– Best Case – 65% ratio benchmark less 13% = OPEX at 52% of Revenue
Additional OPEX savings can be expected against such elements as maintenance and fuel consumption expenses – however, with significantly lower impact potential when compared to impact on Operating Labor
– Assumed 2% additional savings
Today, only one ARMG equipped facility exists in North America – APMT Virginia Terminal
– Realization of anticipated OPEX savings is yet to be documented
For North Carolina International Terminal, the following OPEX to Revenue Ratios were assumed:
– Start of Operations: OPEX at 62% of Revenue– Long-term Operations: OPEX declines to 50% of Revenue
O&M Cost Projection

45
Introduction
Opportunity Assessment
Competitive Position Assessment
Revenue Projection
O&M Cost Projection
Pro Forma Economic Model
Conclusions / Recommendations
Appendix
Contents

46
A Pro Forma Economic Model helps to predict financial fundamentals of a project under a variety of conditions
Pro Forma Economic Model
ObjectivesObjectives
Determine the economic viability of the North Carolina International Terminal enterpriseIdentify any major gaps or economic barriers to project successDetermine those value levers that most improve the fundamentals of the project
Determine the economic viability of the North Carolina International Terminal enterpriseIdentify any major gaps or economic barriers to project successDetermine those value levers that most improve the fundamentals of the project
Major AnalysesMajor Analyses
Determine an operating structure for the enterprise, and its relationship with the portIdentify the required rates of return Develop annual cash flow profile
Determine an operating structure for the enterprise, and its relationship with the portIdentify the required rates of return Develop annual cash flow profile
Purpose / ExpectationsPurpose / Expectations
An assumed enterprise structure is necessary to formulate the business relationship and flows of moneyRequired rates of return vary by industry, depending on risk levelsFree cash flow is the best measure of enterprise value
An assumed enterprise structure is necessary to formulate the business relationship and flows of moneyRequired rates of return vary by industry, depending on risk levelsFree cash flow is the best measure of enterprise value
DeliverablesDeliverables
Pro Forma Economic ModelKey assumptionsPro Forma Economic ModelKey assumptions

47
The Project consists of five Project Cost Components
Development CostsDevelopment Costs
Navigation Channel Improvement Costs Navigation Channel Improvement Costs
Rail Access Improvement Costs
Rail Access Improvement Costs
Highway Access Improvement Costs
Highway Access Improvement Costs
Container TerminalContainer Terminal
Up-front costs associated with planning and permittingUp-front costs associated with planning and permitting
Costs associated with dredging the existing Federal Navigation Channel from -42 feet to the planned depth for the new container terminalCosts associated with dredging the existing Federal Navigation Channel from -42 feet to the planned depth for the new container terminal
Costs associated with improvement of existing rail infrastructure that is located outside the boundaries of the planned terminalCosts associated with improvement of existing rail infrastructure that is located outside the boundaries of the planned terminal
Costs associated with construction of highway access to the siteCosts associated with construction of highway access to the site
Costs associated with design and construction of the container terminal footprint, berthing facilities, and vessel access to the Federal navigation channel
Costs associated with design and construction of the container terminal footprint, berthing facilities, and vessel access to the Federal navigation channel
Pro Forma Economic Model
Project Cost Component Description

48
Two operating scenarios exist, depending on market response and customer service requirements
Low-Peaking ScenarioLow-Peaking Scenario
Considers minimum number of equipment units required to achieve projected capacity levels according average operating conditionsAnticipates minimal peak operating events (i.e. four vessels operating at four berths simultaneously)Maximizes utilization of deployed equipment (i.e. wharf cranes utilized at >90%)Minimizes intensity of capital requirementsEnables use of “average annual” revenue and cost variables in development of the Pro Forma Economic Model
Considers minimum number of equipment units required to achieve projected capacity levels according average operating conditionsAnticipates minimal peak operating events (i.e. four vessels operating at four berths simultaneously)Maximizes utilization of deployed equipment (i.e. wharf cranes utilized at >90%)Minimizes intensity of capital requirementsEnables use of “average annual” revenue and cost variables in development of the Pro Forma Economic Model
High-Peaking ScenarioHigh-Peaking Scenario
Considers maximum number of equipment units required to accommodate peak demand characteristicsAnticipates significant periods of peak operating eventsMinimizes utilization of deployed equipment (i.e. wharf cranes utilized at <55%)Maximizes intensity of capital requirementsRequires a tiered rate structure to meet revenue requirementsRequires continuous review of marginal benefits against marginal costsNot applicable for a Base Case Pro Forma Business Plan
Considers maximum number of equipment units required to accommodate peak demand characteristicsAnticipates significant periods of peak operating eventsMinimizes utilization of deployed equipment (i.e. wharf cranes utilized at <55%)Maximizes intensity of capital requirementsRequires a tiered rate structure to meet revenue requirementsRequires continuous review of marginal benefits against marginal costsNot applicable for a Base Case Pro Forma Business Plan
The current level of analysis supports a Low-Peaking scenario, and is selected for the preliminary concept
Pro Forma Economic Model

49
The difference between the two Peaking Scenarios is approximately $200 million in capital cost for equipment
Terminal Construction Costs, $713,398
Terminal Equipment, $340,864
Equipment Contingency, $34,086
Engineering, $105,044
Contractors Preliminaries, $210,852
Terminal Construction Contingency, $178,350
$ Thousands
Capital Expenditure Breakdown
(Low-Peaking Scenario - 9 Cranes)
Total $1,383.4 m (2007 $)
Terminal Construction Costs, $704,601
Terminal Construction Contingency, $176,150
Terminal Equipment, $208,000
Equipment Contingency, $20,800
Engineering, $91,320
Contractors Preliminaries, $182,520
$ Thousands
Total $1,582.5 m (2007 $)
Capital Expenditure Breakdown
(High-Peaking Scenario - 16 Cranes)
Source: CH2M HILL AnalysisNote: Capital costs exclude development phase engineering and environmental work required to receive certificates and permits. These costs are approximately $50 - $70 million and are assumed to be borne by the Port. These costs are assumed to be incurred prior to awarding a concession. Recouping these costs is assumed to be through concession lease/tariffs.
Pro Forma Economic Model
The Pro Forma Analysis (in the remainder of this report) addresses only the Low-Peaking Scenario

50
Under the Low-Peaking Scenario, the five Project Cost Components total approximately $2.3 billion
Project ComponentApproximate
Cost(2007 $ M)
Responsible Stakeholder
Development Costs $60.0 The Authority
Navigation Channel Improvement Costs $531.650% - The Authority50% - Federal Government
Rail Access Improvement Costs $127.4 Railroad Service Provider / Owner of existing rail line
Highway Access Improvement Costs $181.5 State Department of Transportation (DOT)
Container Terminal $1,383.4Option 1 – The AuthorityOption 2 – Private SectorOption 3 – Joint Venture Entity
Pro Forma Economic Model
Estimated Project Costs by Project Component(Low-Peaking Scenario)
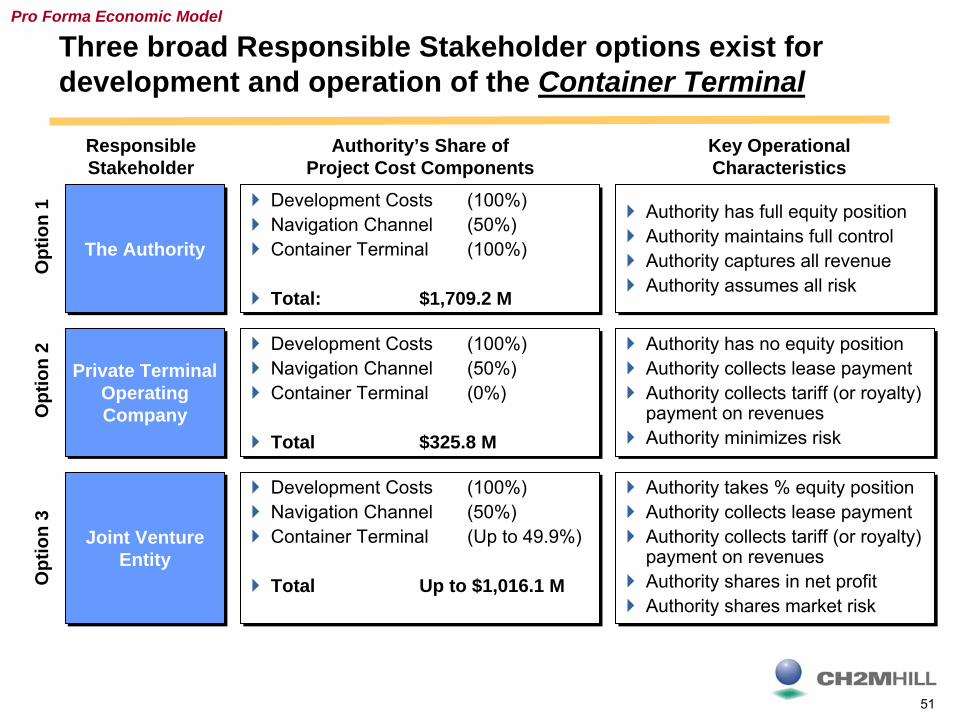
51
Three broad Responsible Stakeholder options exist for development and operation of the Container Terminal
The AuthorityThe Authority
Authority has full equity positionAuthority maintains full controlAuthority captures all revenueAuthority assumes all risk
Authority has full equity positionAuthority maintains full controlAuthority captures all revenueAuthority assumes all risk
Private Terminal Operating Company
Private Terminal Operating Company
Joint Venture Entity
Joint Venture Entity
Opt
ion
1O
ptio
n 2
Opt
ion
3
Responsible Stakeholder
Key Operational Characteristics
Authority’s Share of Project Cost Components
Development Costs (100%)Navigation Channel (50%)Container Terminal (100%)
Total: $1,709.2 M
Development Costs (100%)Navigation Channel (50%)Container Terminal (100%)
Total: $1,709.2 M
Development Costs (100%)Navigation Channel (50%)Container Terminal (0%)
Total $325.8 M
Development Costs (100%)Navigation Channel (50%)Container Terminal (0%)
Total $325.8 M
Development Costs (100%)Navigation Channel (50%)Container Terminal (Up to 49.9%)
Total Up to $1,016.1 M
Development Costs (100%)Navigation Channel (50%)Container Terminal (Up to 49.9%)
Total Up to $1,016.1 M
Authority has no equity positionAuthority collects lease paymentAuthority collects tariff (or royalty) payment on revenuesAuthority minimizes risk
Authority has no equity positionAuthority collects lease paymentAuthority collects tariff (or royalty) payment on revenuesAuthority minimizes risk
Authority takes % equity positionAuthority collects lease paymentAuthority collects tariff (or royalty) payment on revenuesAuthority shares in net profitAuthority shares market risk
Authority takes % equity positionAuthority collects lease paymentAuthority collects tariff (or royalty) payment on revenuesAuthority shares in net profitAuthority shares market risk
Pro Forma Economic Model

52
Under all options, the Container Terminal component represents the primary revenue source to recover costs
Development CostsDevelopment Costs
Navigation Channel Improvement Costs Navigation Channel Improvement Costs
Rail Access Improvement Costs
Rail Access Improvement Costs
Highway Access Improvement Costs
Highway Access Improvement Costs
Container TerminalContainer Terminal
Project development enablerProject development enabler
Competitive advantage enablerCompetitive advantage enabler
Competitive advantage enablerCompetitive advantage enabler
Competitive advantage enablerCompetitive advantage enabler
Start of operations and generation of free cash flowsStart of operations and generation of free cash flows
$0 – Sunk Cost$0 – Sunk Cost
$0, however, a small Harbor Fee may be collected in addition to box rate if commercially feasible
$0, however, a small Harbor Fee may be collected in addition to box rate if commercially feasible
$0 – Any marginal revenue collected by Railroad Service Provider
$0 – Any marginal revenue collected by Railroad Service Provider
$0, however, potential exists for toll collection if commercially feasible for all users
$0, however, potential exists for toll collection if commercially feasible for all users
$200 to $250 per box$200 to $250 per box
Project Cost Component
Investment Purpose
Revenue Opportunity
Pro Forma Economic Model

53
For analytical purposes, Option 2 (Private Terminal Operating Company) was selected
Option 2 requires the lowest Public investment from the Authority
Option 2 provides the lowest exposure to market risk for the Authority
Option 2 Provides guaranteed positive cash flows to the Authority from the start of operations
Option 2 provides the most rigorous test of return requirements
Results of Option 2 can be transferred to either Option 1 or Option 3, should the economics and risk profiles prove attractive to the Authority for further Public investment
Option 2 fits with observed investment practices of industry investors
Option 2 provides the greatest opportunity for expediency
Option 2 provides economic impacts that are commensurate with Option 1
Pro Forma Economic Model

54
Under Option 2, both Public and Private perspectives are met
Key CharacteristicsKey Characteristics
Project has large capital investment requirements and a growing long-term robust revenue potentialOperators and private equity investors have a high appetite for infrastructure assetsA PPP concession contract has been assumedIncludes a fixed term contract (Ranging from 25 years to 50 years of operations)
Project has large capital investment requirements and a growing long-term robust revenue potentialOperators and private equity investors have a high appetite for infrastructure assetsA PPP concession contract has been assumedIncludes a fixed term contract (Ranging from 25 years to 50 years of operations)
Public Sector PerspectivePublic Sector Perspective
Maintains ownership of the underlying assetPublic sector receives lease payments/tariffs– Land lease– Percentage of gross revenues– Concession royalty payments– Upfront premium payment
Public sector can be an equity participantTurnover of a functioning facility with asset book value at conclusion of concession
Private Sector PerspectivePrivate Sector Perspective
Pro Forma Economic Model
Public Sector PerspectivePublic Sector Perspective
Maintains ownership of the underlying assetPublic sector receives lease payments/tariffs– Land lease– Percentage of gross revenues– Concession royalty payments– Upfront premium payment
Public sector can be an equity participantTurnover of a functioning facility with asset book value at conclusion of concession
Maintains ownership of the underlying assetPublic sector receives lease payments/tariffs– Land lease– Percentage of gross revenues– Concession royalty payments– Upfront premium payment
Public sector can be an equity participantTurnover of a functioning facility with asset book value at conclusion of concession
Private sector financing and equity Operating profits cover financing costs and return on investmentTransfer assets back to public sector at end of term
Private sector financing and equity Operating profits cover financing costs and return on investmentTransfer assets back to public sector at end of term

55
Initial Project feasibility is determined by assessing only free cash flows of the Container Terminal component
Enabler Investments
Container Terminal Operations & Free Cash Flows
Dev
elop
men
t Cos
ts
Nav
igat
ion
Cha
nnel
Im
prov
emen
ts
Hig
hway
Acc
ess
Impr
ovem
ents
Rai
l Acc
ess
Impr
ovem
ents
Economic Impact to
State
Financial Return to Investors (Authority and/or Private
Sector Operating Company)
Financial Return to Railroad Service
Provider
Con
tain
er T
erm
inal
C
onst
ruct
ion
ILLUSTRATIVE
ILLUSTRATIVE
Ben
efits
C
aptu
red
Neg
ativ
e C
ash
Flow
s
Annual Net Revenues
Posi
tive
Cas
h Fl
ows
Free cash flows from Container Terminal
Operations must first meet minimum required rates of return, as determined by the investor, in order for
Project to be feasible
Free cash flows from Container Terminal
Operations must first meet minimum required rates of return, as determined by the investor, in order for
Project to be feasible
Pro Forma Economic Model
Financial returns to Authority could offset Public Enabler Investments
(Public) (Private) (Public, Private, or Both)
Federal Portion
State Portion

56
Capital costs associated with the Container Terminal are included in the model according to 3 Development Phases
Development Phase
Major Infrastructure Components1
Approximate Cost$ M (2007)
Time Frame for Expenditure
Phase 1
Berths 1 & 2 complete50% Backlands completeApproach Channel Turning Basin
$976 2014 - 2017
Phase 2Berth 3 completeAdditional backlands complete
$240 2018 - 2020
Phase 3 Berth 4 complete100% terminal complete $167 2021 - 2025
Total All Phases $1,383 2014 - 2025
Notes: 1Equipment is phased in on an annual basis, as requiredSource: CH2M HILL Analysis
High Level Phased Development PlanNorth Carolina International Terminal – Container Terminal Component
(Low-Peaking Scenario)
Pro Forma Economic Model

57
The development plan results in high up-front investment requirements for the Container Terminal component
$0
$100
$200
$300
$400
$500
$600
$700
$800
2014 2015 2016 2017 2018 2019 2020 2021 2022 2023 2024 2025 2026 2027
$ M
illio
ns (n
omim
al d
olla
rs)
Terminal Construction Costs Terminal Construction Contingency
Terminal Equipment Equipment Contingency
Engineering Contractors Preliminaries
Capital Expenditure Profile Low-Peaking Scenario
(Nominal Dollars – As Spent in Future Year Value)
Terminal ConstructionMarine/Wharf
Dredging (Basin, Berth and connection)
Civil/Site WorkFacility Buildings
Mechanical/Site WorkElectricalSecurity
TelecommunicationsIntermodal Yard
Wetland MitigationEntrance Bridge
Terminal EquipmentQuay Cranes
ARMGsShuttle Carriers
IY CranesYard Equipment
Source: CH2M HILL AnalysisNote: Capital costs include 25% contingency for civil works and 10% contingency for equipment
ExclusionsNavigation Channel
Rail corridor upgradesHighway corridor development
Development costs (environmental permitting)
Included Costs ($1,383 M)
Excluded Costs ($900.5 M)
Pro Forma Economic Model

58
The model determines returns to the Authority and a Private Terminal Operating Company, under Option 2
Operating Costs
Operating Costs
RevenueBox Rate x
Volume Forecast
RevenueBox Rate x
Volume Forecast
Labor (fixed and variable)
Labor (fixed and variable)
EBITDAEBITDA
Fuel, Power, Security, IT
etc.
Fuel, Power, Security, IT
etc.
Lease /Tariff Payment to
Port
Lease /Tariff Payment to
Port
Debt Service – Bond Interest and Principle
Debt Service – Bond Interest and Principle
Reserve Account Reserve Account
Distributions (if EBITDA >1.2 x debt
service)
Distributions (if EBITDA >1.2 x debt
service)
Overhead and Management
Overhead and Management
- == -
Pro Forma Economic Model
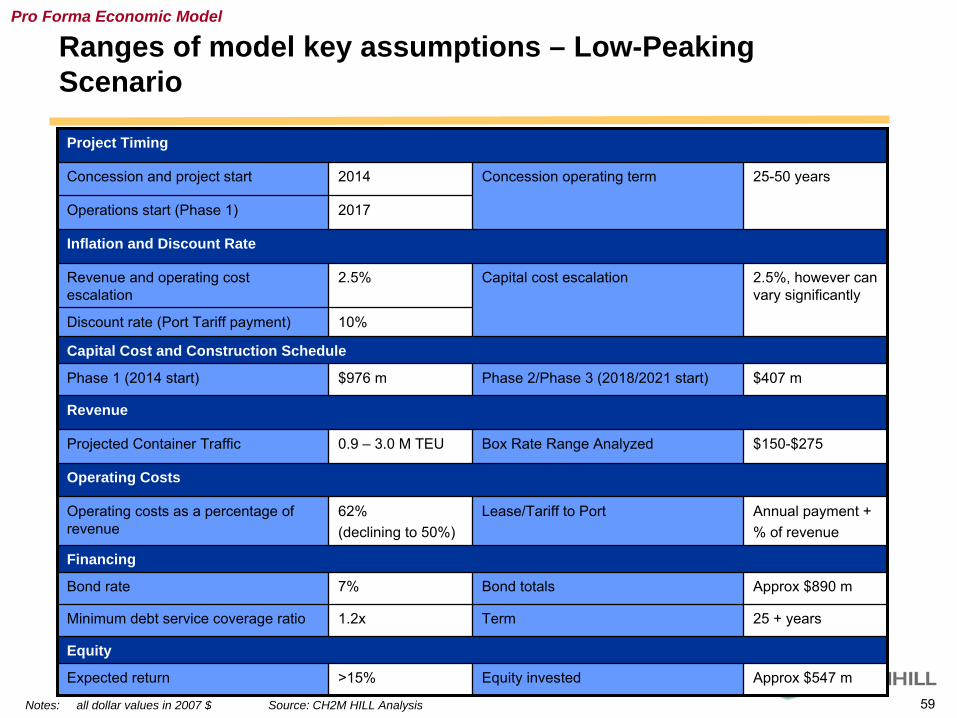
59
Ranges of model key assumptions – Low-Peaking Scenario
Project Timing
Concession and project start 2014 Concession operating term 25-50 years
Operations start (Phase 1) 2017
Inflation and Discount Rate
Revenue and operating cost escalation
2.5% Capital cost escalation 2.5%, however can vary significantly
Discount rate (Port Tariff payment) 10%
Capital Cost and Construction Schedule
Phase 1 (2014 start) $976 m Phase 2/Phase 3 (2018/2021 start) $407 m
Revenue
Projected Container Traffic 0.9 – 3.0 M TEU Box Rate Range Analyzed $150-$275
Operating Costs
Operating costs as a percentage of revenue
62% (declining to 50%)
Lease/Tariff to Port Annual payment +% of revenue
Financing
Bond rate 7% Bond totals Approx $890 m
Minimum debt service coverage ratio 1.2x Term 25 + years
Equity
Expected return >15% Equity invested Approx $547 m
Notes: all dollar values in 2007 $ Source: CH2M HILL Analysis
Pro Forma Economic Model
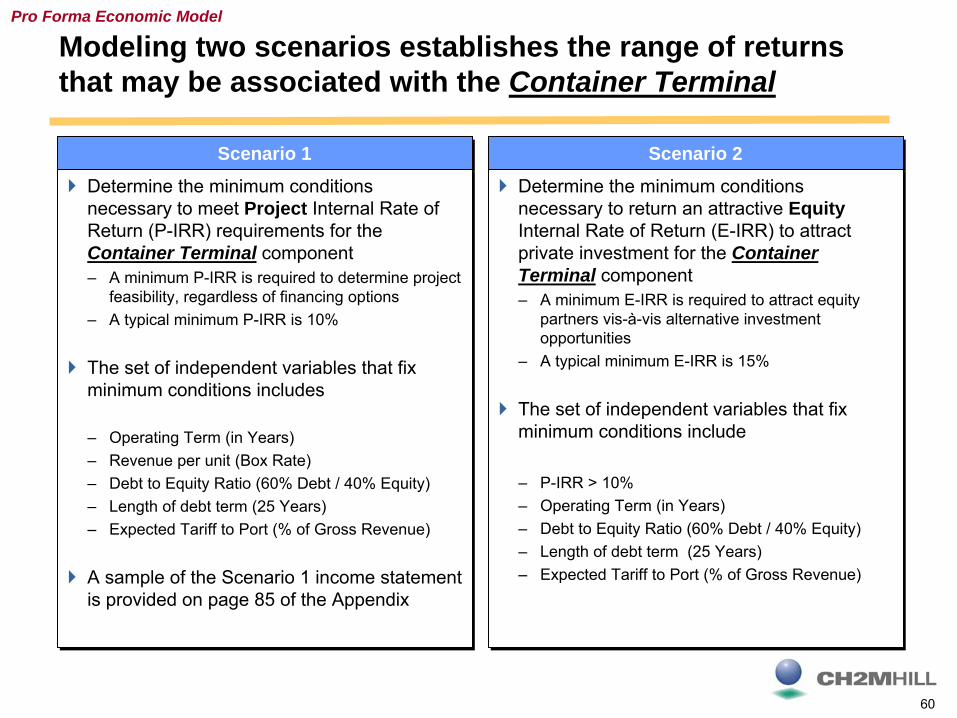
60
Modeling two scenarios establishes the range of returns that may be associated with the Container Terminal
Scenario 1Scenario 1
Determine the minimum conditions necessary to meet Project Internal Rate of Return (P-IRR) requirements for the Container Terminal component– A minimum P-IRR is required to determine project
feasibility, regardless of financing options – A typical minimum P-IRR is 10%
The set of independent variables that fix minimum conditions includes
– Operating Term (in Years)– Revenue per unit (Box Rate)– Debt to Equity Ratio (60% Debt / 40% Equity)– Length of debt term (25 Years)– Expected Tariff to Port (% of Gross Revenue)
A sample of the Scenario 1 income statement is provided on page 85 of the Appendix
Determine the minimum conditions necessary to meet Project Internal Rate of Return (P-IRR) requirements for the Container Terminal component– A minimum P-IRR is required to determine project
feasibility, regardless of financing options– A typical minimum P-IRR is 10%
The set of independent variables that fix minimum conditions includes
– Operating Term (in Years)– Revenue per unit (Box Rate)– Debt to Equity Ratio (60% Debt / 40% Equity)– Length of debt term (25 Years)– Expected Tariff to Port (% of Gross Revenue)
A sample of the Scenario 1 income statement is provided on page 85 of the Appendix
Scenario 2Scenario 2
Determine the minimum conditions necessary to return an attractive EquityInternal Rate of Return (E-IRR) to attract private investment for the Container Terminal component– A minimum E-IRR is required to attract equity
partners vis-à-vis alternative investment opportunities
– A typical minimum E-IRR is 15%
The set of independent variables that fix minimum conditions include
– P-IRR > 10%– Operating Term (in Years)– Debt to Equity Ratio (60% Debt / 40% Equity)– Length of debt term (25 Years)– Expected Tariff to Port (% of Gross Revenue)
Pro Forma Economic Model
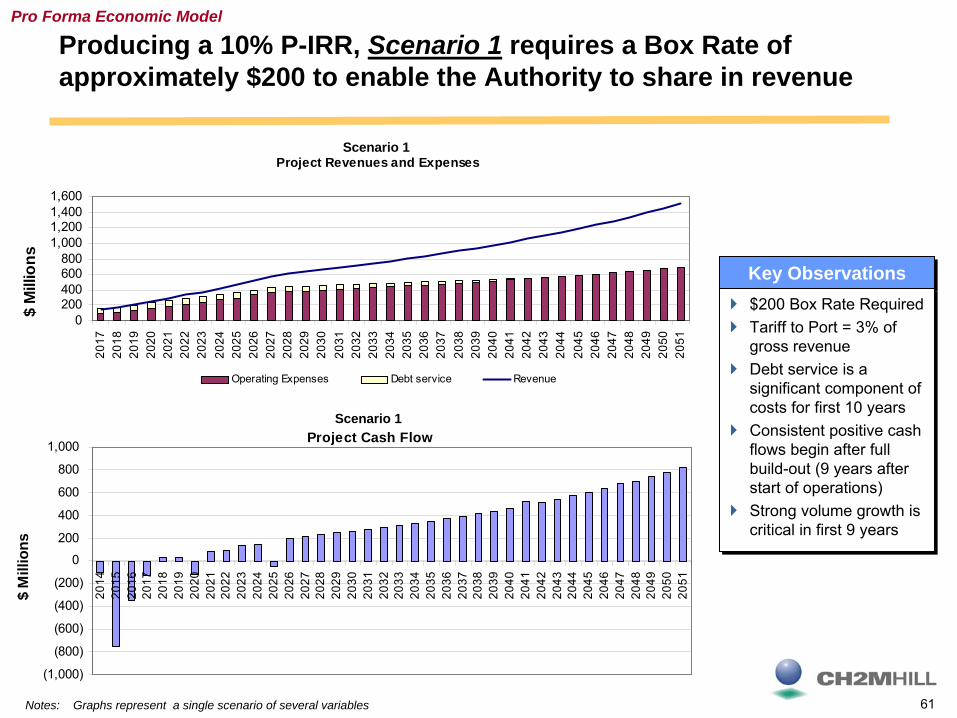
61
Project Cash Flow
(1,000)
(800)
(600)
(400)
(200)
0
200
400
600
800
1,000
2014
2015
2016
2017
2018
2019
2020
2021
2022
2023
2024
2025
2026
2027
2028
2029
2030
2031
2032
2033
2034
2035
2036
2037
2038
2039
2040
2041
2042
2043
2044
2045
2046
2047
2048
2049
2050
2051
$ M
illio
ns
Project Revenues and Expenses
0200400600800
1,0001,2001,4001,600
2017
2018
2019
2020
2021
2022
2023
2024
2025
2026
2027
2028
2029
2030
2031
2032
2033
2034
2035
2036
2037
2038
2039
2040
2041
2042
2043
2044
2045
2046
2047
2048
2049
2050
2051
$ M
illio
ns
Operating Expenses Debt service Revenue
Producing a 10% P-IRR, Scenario 1 requires a Box Rate of approximately $200 to enable the Authority to share in revenue
Key ObservationsKey Observations
$200 Box Rate RequiredTariff to Port = 3% of gross revenueDebt service is a significant component of costs for first 10 yearsConsistent positive cash flows begin after full build-out (9 years after start of operations)Strong volume growth is critical in first 9 years
$200 Box Rate RequiredTariff to Port = 3% of gross revenueDebt service is a significant component of costs for first 10 yearsConsistent positive cash flows begin after full build-out (9 years after start of operations)Strong volume growth is critical in first 9 years
Notes: Graphs represent a single scenario of several variables
Scenario 1
Pro Forma Economic Model
Scenario 1

62
Equity Profile (to port development and operating company)
(400)
(200)
0
200
400
600
800
1,000
2014
2015
2016
2017
2018
2019
2020
2021
2022
2023
2024
2025
2026
2027
2028
2029
2030
2031
2032
2033
2034
2035
2036
2037
2038
2039
2040
2041
2042
2043
2044
2045
2046
2047
2048
2049
2050
2051Eq
uity
($ M
illio
ns)
(4,000)
(2,000)
0
2,000
4,000
6,000
8,000
10,000
($ m
illio
ns)
Cum
ulat
ive
Equi
ty
Equity Cumulative
Port Tariff Revenue
05
101520253035404550
2014
2015
2016
2017
2018
2019
2020
2021
2022
2023
2024
2025
2026
2027
2028
2029
2030
2031
2032
2033
2034
2035
2036
2037
2038
2039
2040
2041
2042
2043
2044
2045
2046
2047
2048
2049
2050
2051
$ M
illio
ns
Total Lease/Tariff to Port
Producing approximately $100 million (Present Value) for the Port, Scenario 1 returns a marginal E-IRR of 12.6%
Notes: For illustrative purposes only - Graphs represent a single scenario of several variables
Key ObservationsKey Observations
Large dividends are possible after 20 yearsEquity breakeven period is 13 years from operations start (acceptable duration is subject to individual investor preferences)Equity IRR is 12.6% (below market rates under this scenario)Present value (2007) of tariff = $100 millionAnnual port tariff available immediately Port tariff can be structured in several ways to suit the needs of the Port
Large dividends are possible after 20 yearsEquity breakeven period is 13 years from operations start (acceptable duration is subject to individual investor preferences)Equity IRR is 12.6% (below market rates under this scenario)Present value (2007) of tariff = $100 millionAnnual port tariff available immediately Port tariff can be structured in several ways to suit the needs of the Port
Pro Forma Economic Model
Scenario 1
Scenario 1
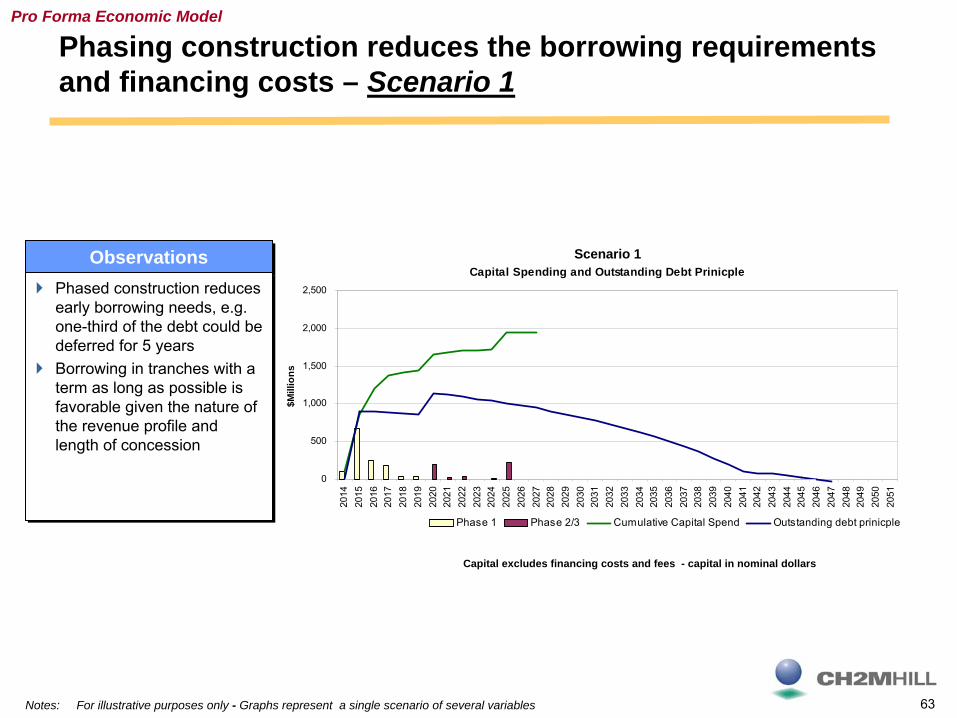
63
Capital Spending and Outstanding Debt Prinicple
0
500
1,000
1,500
2,000
2,500
2014
2015
2016
2017
2018
2019
2020
2021
2022
2023
2024
2025
2026
2027
2028
2029
2030
2031
2032
2033
2034
2035
2036
2037
2038
2039
2040
2041
2042
2043
2044
2045
2046
2047
2048
2049
2050
2051
$Mill
ions
Phase 1 Phase 2/3 Cumulative Capital Spend Outstanding debt prinicple
Phasing construction reduces the borrowing requirements and financing costs – Scenario 1
Notes: For illustrative purposes only - Graphs represent a single scenario of several variables
ObservationsObservations
Phased construction reduces early borrowing needs, e.g. one-third of the debt could be deferred for 5 yearsBorrowing in tranches with a term as long as possible is favorable given the nature of the revenue profile and length of concession
Phased construction reduces early borrowing needs, e.g. one-third of the debt could be deferred for 5 yearsBorrowing in tranches with a term as long as possible is favorable given the nature of the revenue profile and length of concession
Pro Forma Economic Model
Capital excludes financing costs and fees - capital in nominal dollars
Scenario 1
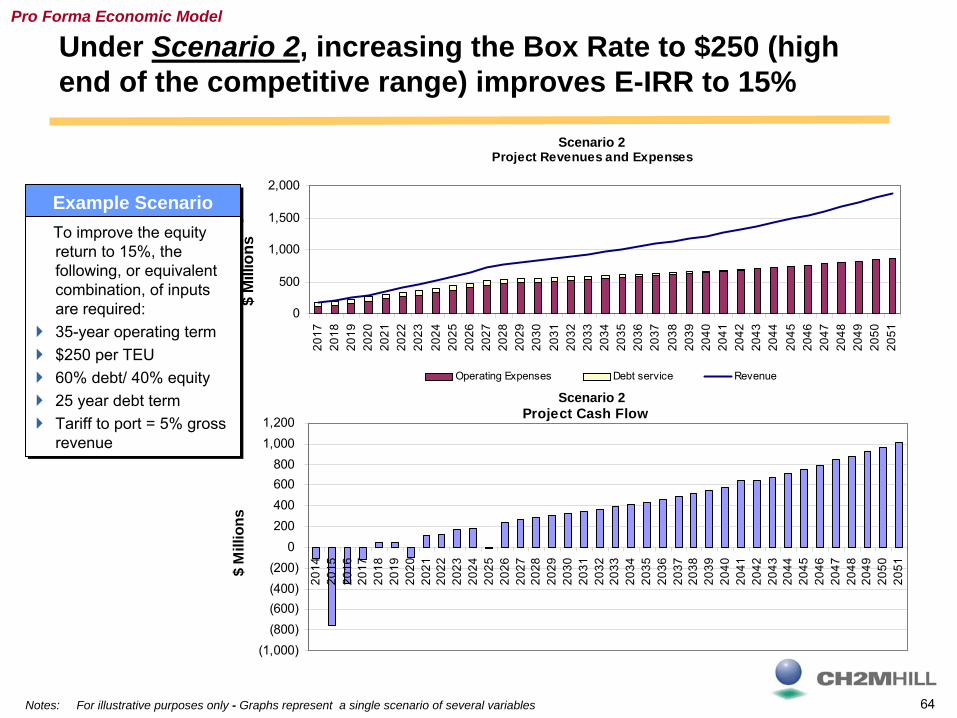
64
Under Scenario 2, increasing the Box Rate to $250 (high end of the competitive range) improves E-IRR to 15%
Project Revenues and Expenses
0
500
1,000
1,500
2,000
2017
2018
2019
2020
2021
2022
2023
2024
2025
2026
2027
2028
2029
2030
2031
2032
2033
2034
2035
2036
2037
2038
2039
2040
2041
2042
2043
2044
2045
2046
2047
2048
2049
2050
2051
$ M
illio
ns
Operating Expenses Debt service Revenue
Project Cash Flow
(1,000)(800)(600)(400)(200)
0200400600800
1,0001,200
2014
2015
2016
2017
2018
2019
2020
2021
2022
2023
2024
2025
2026
2027
2028
2029
2030
2031
2032
2033
2034
2035
2036
2037
2038
2039
2040
2041
2042
2043
2044
2045
2046
2047
2048
2049
2050
2051$ M
illio
ns
Example ScenarioExample ScenarioTo improve the equity return to 15%, the following, or equivalent combination, of inputs are required: 35-year operating term$250 per TEU60% debt/ 40% equity25 year debt termTariff to port = 5% gross revenue
To improve the equity return to 15%, the following, or equivalent combination, of inputs are required:35-year operating term$250 per TEU60% debt/ 40% equity25 year debt termTariff to port = 5% gross revenue
Pro Forma Economic Model
Scenario 2
Scenario 2
Notes: For illustrative purposes only - Graphs represent a single scenario of several variables

65
Scenario 2 provides the Authority with approximately $187 million (Present Value), while meeting E-IRR requirements
Port Tariff Revenue
0102030405060708090
2014
2015
2016
2017
2018
2019
2020
2021
2022
2023
2024
2025
2026
2027
2028
2029
2030
2031
2032
2033
2034
2035
2036
2037
2038
2039
2040
2041
2042
2043
2044
2045
2046
2047
2048
2049
2050
2051
$ M
illio
ns
Total Lease/Tariff to Port
Equity Profile (to port development and operating company)
(400)
(200)
0
200
400
600
800
1,000
1,200
2014
2015
2016
2017
2018
2019
2020
2021
2022
2023
2024
2025
2026
2027
2028
2029
2030
2031
2032
2033
2034
2035
2036
2037
2038
2039
2040
2041
2042
2043
2044
2045
2046
2047
2048
2049
2050
2051
Equi
ty ($
Mill
ions
)
(4,000)
(2,000)
0
2,000
4,000
6,000
8,000
10,000
12,000
($ m
illio
ns)
Cum
ulat
ive
Equi
ty
Equity Cumulative
ObservationsObservations
Equity breakeven period is shortened to 9 years from operations startAnnual port tariff available immediately and can be increased significantly in future yearsPresent value (2007) of tariff payments = $187 millionPort tariff can be structured in several ways to suit the needs of the Port
Equity breakeven period is shortened to 9 years from operations startAnnual port tariff available immediately and can be increased significantly in future yearsPresent value (2007) of tariff payments = $187 millionPort tariff can be structured in several ways to suit the needs of the Port
Pro Forma Economic Model
Scenario 2
Scenario 2
Notes: For illustrative purposes only - Graphs represent a single scenario of several variables

66
A variety of increased value options to the Authority exist, should financing options reduce E-IRR requirements
Project Internal Rate of Return at Box Rates
6%7%8%9%
10%
11%12%13%14%15%
125 150 175 200 225 250 275 300
Box Rate ($)
P-IR
R
25 yr term 30 yr term 35 yr term 50 yr term
Approximate Concession Tariff to Port based on Box Rate
0
200
400
600
800
1000
125 150 175 200 225 250 275
Box Rate ($)
PV o
f Tar
iff to
Por
t in
2007
($
mill
ions
)
25 yr term 30 yr term 35 yr term 50 yr term
Based on 10% discount rate to start of operations, 3% rate to 2007Tariff scenarios based on achieving 10% P-IRR and E-IRR>12%Provided for illustrative purposes - commercially acceptable terms will vary
Pro Forma Economic Model
Analysis DiscussionAnalysis Discussion
Alternative financing structures can significantly change E-IRR requirements and improve value to the Authority, while maintaining P-IRR at greater than 10%– Off-balance sheet financing to reduce debt
to equity ratios – Partnering with financiers requiring low
returns – i.e. Pension funds Ignoring impact on E-IRR, the value of the Project ranges significantly depending on operating term and deployed box rate Combined with the appropriate financing structure, the project could potentially fund related improvements such as channel dredgingPhase IIB will focus more on Financing alternatives
Alternative financing structures can significantly change E-IRR requirements and improve value to the Authority, while maintaining P-IRR at greater than 10%– Off-balance sheet financing to reduce debt
to equity ratios– Partnering with financiers requiring low
returns – i.e. Pension fundsIgnoring impact on E-IRR, the value of the Project ranges significantly depending on operating term and deployed box rate Combined with the appropriate financing structure, the project could potentially fund related improvements such as channel dredgingPhase IIB will focus more on Financing alternatives
P-IR
R >
10%

67
Construction cost escalation, as experienced in the past few years, presents a risk
Pro Forma Economic Model
Escalation AssumptionsEscalation Assumptions Escalation RiskEscalation Risk
Past few years have experienced construction escalation rates upwards of 6% to 8%, resulting from a variety of factors– Increased fuel costs– Increased materials costs– Increased labor costsVaries by local market and materialsRisks exist for short periods of high construction escalation at any time, and potentially during the planned construction timeframe (similar to the situation of the past few years)A sudden increase in capital costs could challenge the project economics
Past few years have experienced construction escalation rates upwards of 6% to 8%, resulting from a variety of factors– Increased fuel costs– Increased materials costs– Increased labor costsVaries by local market and materialsRisks exist for short periods of high construction escalation at any time, and potentially during the planned construction timeframe (similar to the situation of the past few years)A sudden increase in capital costs could challenge the project economics
Analysis built upon capital cost escalation of 2.5% per year, and assumes alignment with Consumer Price Index over the long termThis rate is also applied to base revenue and operating cost growthRate reflects North American long-term forecast GDP growth and Consumer Price Index growth (inflation) Limited basis to assume that one cost sector (revenue, operating costs, capital costs) should increase faster than another for an extended period of time (i.e. estimating beyond 2020)If higher construction escalation rates are sustained for any significant period, assume that rates of all goods (hence revenue) would increase at the same rateThis in effect should neutralize an increase in capital costs
Analysis built upon capital cost escalation of 2.5% per year, and assumes alignment with Consumer Price Index over the long termThis rate is also applied to base revenue and operating cost growthRate reflects North American long-term forecast GDP growth and Consumer Price Index growth (inflation) Limited basis to assume that one cost sector (revenue, operating costs, capital costs) should increase faster than another for an extended period of time (i.e. estimating beyond 2020)If higher construction escalation rates are sustained for any significant period, assume that rates of all goods (hence revenue) would increase at the same rateThis in effect should neutralize an increase in capital costs

68
Introduction
Opportunity Assessment
Competitive Position Assessment
Revenue Projection
O&M Cost Projection
Financial Model
Conclusions / Recommendations
Appendix
Contents

69
The Pro-forma business plan answers four key questions (1 of 2)
What are the factors that make a new
container terminal necessary and
attractive?
What are the factors that make a new
container terminal necessary and
attractive?
Does a new container terminal in North
Carolina make economic sense from
the perspectives of the various
stakeholders?
Does a new container terminal in North
Carolina make economic sense from
the perspectives of the various
stakeholders?
1.1.
2.2.
An opportunity exists to capture a sizeable share of the future market demand for container terminal capacityOperators and developers recognize the North Carolina International Terminal site as the only available large greenfield site along the U.S. East Coast to develop a new terminalA Pro Forma economic analysis indicates that cash flows from projected container terminal operations are sufficient to fund construction of the terminal and meet estimated return requirements
An opportunity exists to capture a sizeable share of the future market demand for container terminal capacityOperators and developers recognize the North Carolina International Terminal site as the only available large greenfield site along the U.S. East Coast to develop a new terminalA Pro Forma economic analysis indicates that cash flows from projected container terminal operations are sufficient to fund construction of the terminal and meet estimated return requirements
A comparison of available and planned container terminal capacity along the US East and Gulf Coasts indicates that demand will exceed capacity as early as the year 2014Proximity to fast-growing population centers makes the site attractiveThe projected capacity footprint of the proposed site could be met within the first 10 years of operationsRevenue opportunities exist to return value back to an operator,developer, and the Authority
A comparison of available and planned container terminal capacity along the US East and Gulf Coasts indicates that demand will exceed capacity as early as the year 2014Proximity to fast-growing population centers makes the site attractiveThe projected capacity footprint of the proposed site could be met within the first 10 years of operationsRevenue opportunities exist to return value back to an operator,developer, and the Authority
Conclusions

70
What competitive advantage can be created for a new
container terminal in North Carolina?
What competitive advantage can be created for a new
container terminal in North Carolina?
3.3.
Under what organizational conditions can
benefits be maximized?
Under what organizational conditions can
benefits be maximized?
4.4.A PPP could be utilized to develop the project, while providing acceptable returns to the investorAlternative financing structures may further improve the economicsRevenue opportunities exist to return value back to the Authority – Revenues to the Authority would consist of land lease and royalty payments
across the term of the PPP agreement
A PPP could be utilized to develop the project, while providing acceptable returns to the investorAlternative financing structures may further improve the economicsRevenue opportunities exist to return value back to the Authority – Revenues to the Authority would consist of land lease and royalty payments
across the term of the PPP agreement
Potential exists to go to market with a competitive cost structure
A preliminary go-to-market strategy for North Carolina International Terminal encompasses six key strategic elements, identified as competitive and attractive
1. Deep water (-52.5 feet draft) to accommodate the growing fleet of large ships
2. High intermodal rail split focused on deep hinterland markets
3. Good highway access to meet development needs of distribution centers
4. High productivity to minimize shippers’ costs of operating large ships
5. State-of-the-Art facility with technologically advanced operations, providing environmental sustainability, advanced port and supply chain security, and lowest total cost of ownership characteristics
6. Cost Competitive Service – delivering required customer services at a total supply chain cost that is competitive with other ports and gateways
The Pro-forma business plan answers four key questions (2 of 2)
Conclusions

71
Recommendations
Prepare a bottom-up cost analysis to better characterize the operating cost profile of the selected operating planFurther detail engineering requirements to reduce unknowns and better characterize capital costs (i.e. reduce contingencies)Work with railroad to further develop the inland transportation service characteristics and overall value chain costsLobby the Federal Government to develop Federal interest in development of the navigation channelSeek financing alternatives for project developmentContinue to evaluate project economics as cost profiles become clearer
Recommendations

72
Introduction
Opportunity Assessment
Competitive Position Assessment
Revenue Projection
O&M Cost Projection
Financial Model
Conclusions / Recommendations
Appendix
Contents

73
As a market sector, containerized cargo continues to outpace all other major cargo groups
0
1,000
2,000
3,000
4,000
5,000
6,000
7,000
8,000
1996 1997 1998 1999 2000 2001 2002 2003 2004 2005 2006
Major Bulk Minor Bulk Container General Cargo
Crude Oil Oil Products LPG LNG
0
50
100
150
200
250
300
1996 1997 1998 1999 2000 2001 2002 2003 2004 2005 2006
Major Bulk Minor Bulk Container
General Cargo Crude Oil Oil Products
LPG LNG Line 9
Indexed growth rates of major shipping markets
(Base = 100)
Container
LNG
World Cargo Shipping Growth(1996 -2006)
Appendix
Source: Clarkson Research Services, CH2M HILL Analysis

74
The U.S. East Coast is poised to lead the nation in growth of containerized traffic
Container traffic bound for U.S. East and Gulf Coast increased 13% per annum from 2001 to 2005Growth is expected to continueDriven from increased volume from Asia to U.S. East and Gulf CoastEast Coast bound cargo via transpacific routes increased 119% from 2001 to 2005, compared to a 55% increase for West Coast bound cargo via transpacific trade routes over the same periodThis trend is expected to continue, and expand with the expansion of the Panama Canal
Source: PIERS
Appendix
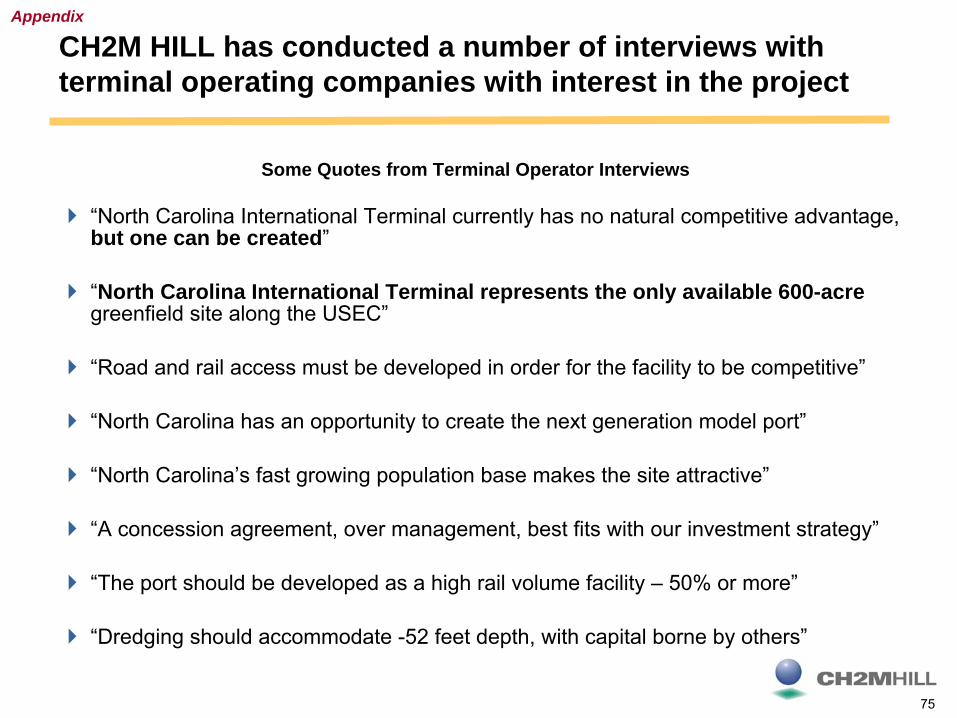
75
CH2M HILL has conducted a number of interviews with terminal operating companies with interest in the project
“North Carolina International Terminal currently has no natural competitive advantage, but one can be created”
“North Carolina International Terminal represents the only available 600-acregreenfield site along the USEC”
“Road and rail access must be developed in order for the facility to be competitive”
“North Carolina has an opportunity to create the next generation model port”
“North Carolina’s fast growing population base makes the site attractive”
“A concession agreement, over management, best fits with our investment strategy”
“The port should be developed as a high rail volume facility – 50% or more”
“Dredging should accommodate -52 feet depth, with capital borne by others”
Some Quotes from Terminal Operator Interviews
Appendix

76
From the perspective of the vessel, sailing times vary within only half a day between competing ports
-16-12-8-4048
1216
Virginia Charleston Savannah Jacksonville
Asia – Panama Canal Route Suez – Europe Route
-16-12-8-4048
1216
Virginia Charleston Savannah Jacksonville
Note: Assumes 16 knot average sailing speedSource: CH2M HILL Analysis
Hou
rs
Hou
rsNorth Carolina International Terminal Advantage (+) North Carolina International Terminal Advantage (+)
3% difference based on a 26-30 day journey. <4% difference based on a 29-33 day journey.
Appendix

77
With good road and rail connectivity, North Carolina International Terminal could be competitive within a number of inland markets
Overland Road Comparison
Overland Rail Comparison
Notes: Values represent percent difference from lowest measured distanceColored cells represent markets where North Carolina International Terminal is within 20% difference from lowest measured distance
Source: CH2M HILL Analysis
Appendix
Virginia NCIT Charleston Savannah Jacksonville
Raleigh 14% 0% 75% 102% 184%Winston Salem 0% 1% 10% 26% 77%Charlotte 56% 0% 0% 21% 84%Atlanta 140% 73% 29% 0% 40%Memphis 41% 27% 9% 0% 12%Louisville 6% 17% 0% 6% 24%Cincinatti 0% 11% 1% 8% 30%Indianapolis 0% 9% 0% 6% 21%Columbus 0% 11% 10% 18% 41%Chicago 0% 12% 1% 5% 13%
Port FacilityDestination
Virginia NCIT Charleston Savannah Jacksonville
Raleigh 13% 0% 8% 49% 121%Winston Salem 13% 0% 13% 14% 71%Charlotte 88% 0% 16% 20% 100%Atlanta 130% 64% 40% 0% 22%Memphis 37% 37% 28% 12% 0%Louisville 9% 9% 0% 8% 16%Cincinatti 0% 18% 9% 16% 26%Indianapolis 0% 15% 7% 14% 22%Columbus 0% 42% 32% 40% 49%Chicago 4% 7% 0% 14% 10%
Port FacilityDestination

78
Strategy key success factors – Deep Water
Vessel SizeVessel Size
Ultra-competitive shipping lines are looking to larger ships as a means to drive down costs– Opportunities for marine cost savings are
diminishing Container terminals of the future must respond to this trend by offering access, infrastructure and capacity to support these shipsTerminal operations must be able to support the required throughput – Require skilled laborLargest vessels in the 12,000+ TEU (Emma Maersk) require draft 16 m (51’)5 largest carriers control 45% of global capacity– Shipping lines carry significant market power
Emma Maersk (>12,000 TEU)Emma Maersk (>12,000 TEU)
How big will they get?Constraints include:
Malacca Straight (21 m draft – approx 18,000 TEU)Cost of transforming all supporting infrastructure– Crane reach– Berth lengthNeed for second power plant on vessel – Emma Maersk has the most powerful diesel engine
ever produced Turn-around time – larger vessels will sit in port for extended periods, disrupting chain patternsAirbus 3XX analogies – few airports can currently accommodate the aircraft – limitations at gates, taxiways etc.
How big will they get?Constraints include:
Malacca Straight (21 m draft – approx 18,000 TEU)Cost of transforming all supporting infrastructure– Crane reach– Berth lengthNeed for second power plant on vessel – Emma Maersk has the most powerful diesel engine
ever producedTurn-around time – larger vessels will sit in port for extended periods, disrupting chain patternsAirbus 3XX analogies – few airports can currently accommodate the aircraft – limitations at gates, taxiways etc.
Appendix

79
U.S. East and Gulf Coast container capacity forecast (M TEU)Appendix
Source: As reported publicly by Port Authority / Terminal Operator, CH2M HILL Analysis.
Terminal Area
(Acres)Estimated Capacity
Total Capacity 2006 2007 2008 2009 2010 2011 2012 2013 2014 2015 2016 2017 2018 2019 2020 2021 2022 2023 2024 2025 2026 2027 2028 2029 2030
Individual Port AnalysisNorth Altantic
MassportConley Container Terminal 0.4 0.4 0.4 0.4 0.4 0.4 0.4 0.4 0.4 0.4 0.4 0.4 0.4 0.4 0.4 0.4 0.4 0.4 0.4 0.4 0.4 0.4 0.4 0.4 0.4 0.4 0.4
PANYNJGlobal Container Terminal 98 0.2 0.2 0.2 0.2 0.2 0.2 0.2 0.2 0.2 0.2 0.2 0.2 0.2 0.2 0.2 0.2 0.2 0.2 0.2 0.2 0.2 0.2 0.2 0.2 0.2 0.2 0.2NYCT 187 0.425 0.425 0.425 0.425 0.425 0.425 0.425 0.425 0.425 0.425 0.425 0.425 0.425 0.425 0.425 0.425 0.425 0.425 0.425 0.425 0.425 0.425 0.425 0.425 0.425 0.425Port Newark 1 1 1 1 1 1 1 1 1 1 1 1 1 1 1 1 1 1 1 1 1 1 1 1 1 1 1Port Elizabeth 900 4.5 4.5 4.5 4.5 4.5 4.5 4.5 4.5 4.5 4.5 4.5 4.5 4.5 4.5 4.5 4.5 4.5 4.5 4.5 4.5 4.5 4.5 4.5 4.5 4.5 4.5 4.5
BaltimoreDundalk 570 0.7 0.7 0.7 0.7 0.7 0.7 0.7 0.7 0.7 0.7 0.7 0.7 0.7 0.7 0.7 0.7 0.7 0.7 0.7 0.7 0.7 0.7 0.7 0.7 0.7 0.7 0.7
VirginiaNIT 811 1.5 1.5 1.5 1.5 1.5 1.5 1.5 1.5 1.5 1.5 1.5 1.5 1.5 1.5 1.5 1.5 1.5 1.5 1.5 1.5 1.5 1.5 1.5 1.5 1.5 1.5 1.5PMT 219 0.8 0.8 0.8 0.8 0.8 0.8 0.8 0.8 0.8 0.8 0.8 0.8 0.8 0.8 0.8 0.8 0.8 0.8 0.8 0.8 0.8 0.8 0.8 0.8 0.8 0.8 0.8NNMT 140 0.1 0.1 0.1 0.1 0.1 0.1 0.1 0.1 0.1 0.1 0.1 0.1 0.1 0.1 0.1 0.1 0.1 0.1 0.1 0.1 0.1 0.1 0.1 0.1 0.1 0.1 0.1CIMT 580 0 0 0 0 0 0 0 0 0 0 0 0 1 1 1 1 1 1 2 2 2 2.5 2.5 2.5 3 3
APMTAPMT Virginia 575 2.5 2.5 0 2.5 2.5 2.5 2.5 2.5 2.5 2.5 2.5 2.5 2.5 2.5 2.5 2.5 2.5 2.5 2.5 2.5 2.5 2.5 2.5 2.5 2.5 2.5 2.5
NCSPAWilmington 0.4 0.4 0.4 0.4 0.4 0.4 0.4 0.4 0.4 0.4 0.4 0.4 0.4 0.4 0.4 0.4 0.4 0.4 0.4 0.4 0.4 0.4 0.4 0.4 0.4 0.4 0.4NCIP 600 0 0 0 0 0 0 0 0 0 0 0 0 0 0 0 0 0 0 0 0 0 0 0 0 0 0
South AtlanticCharleston
All Facilities 395 2 2 2 2.4 2.4 2.4 2.4 2.4 2.4 2.4 2.4 2.4 2.4 2.4 2.4 2.4 2.4 2.4 2.4 2.4 2.4 2.4 2.4 2.4 2.4 2.4Navy Base 280 0 0 0 0 0 0 0 1.4 1.4 1.4 1.4 1.4 1.4 1.4 1.4 1.4 1.4 1.4 1.4 1.4 1.4 1.4 1.4 1.4 1.4 1.4Jasper County TBD 0 0 0 0 0 0 0 0 0 0 0 0 0 0 0 0 0 0 0 0 0 0 0 0 0 0 0
GPAAll Facilities 1200 2.41 2.41 2.41 2.41 2.9 2.9 3.5 4 4.6 5.2 5.78 5.78 6.5 6.5 6.5 6.5 6.5 6.5 6.5 6.5 6.5 6.5 6.5 6.5 6.5 6.5 6.5
Jacksonville158 0.91 0.91 0.91 0.91 0.91 0.91 0.91 0.91 0.91 0.91 0.91 0.91 0.91 1.71 1.71 1.71 1.71 1.71 1.71 1.71 1.71 1.71 1.71 1.71 1.71 1.71 1.71
Port of Palm Beach0.2 0.2 0.2 0.2 0.2 0.2 0.2 0.2 0.2 0.2 0.2 0.2 0.2 0.2 0.2 0.2 0.2 0.2 0.2 0.2 0.2 0.2 0.2 0.2 0.2 0.2 0.2
Port Everglades350 1 1 1 1 1 1 1 1 1.5 1.5 1.5 1.5 1.5 1.5 1.5 1.5 1.5 1.5 1.5 1.5 1.5 1.5 1.5 1.5 1.5 1.5 1.5
Port of Miami1.5 1.5 1.5 1.5 1.5 1.5 1.5 1.5 1.5 1.5 1.5 1.5 1.5 1.5 1.5 1.5 1.5 1.5 1.5 1.5 1.5 1.5 1.5 1.5 1.5 1.5 1.5
Gulf CoastMobile
135 0.8 0.8 0.8 0.8 0.8 0.8 0.8 0.8 0.8 0.8 0.8 0.8 0.8 0.8 0.8 0.8 0.8 0.8 0.8 0.8 0.8 0.8 0.8 0.8 0.8 0.8 0.8Tampa
0.2 0.2 0.2 0.2 0.2 0.2 0.2 0.2 0.2 0.2 0.2 0.2 0.2 0.2 0.2 0.2 0.2 0.2 0.2 0.2 0.2 0.2 0.2 0.2 0.2 0.2 0.2Port Manatee
20 0.1 0.1 0.1 0.1 0.1 0.1 0.1 0.1 0.1 0.1 0.1 0.1 0.1 0.1 0.1 0.1 0.1 0.1 0.1 0.1 0.1 0.1 0.1 0.1 0.1 0.1 0.1
Gulfport0.2 0.2 0.2 0.2 0.2 0.2 0.2 0.2 0.2 0.2 0.2 0.2 0.2 0.2 0.2 0.2 0.2 0.2 0.2 0.2 0.2 0.2 0.2 0.2 0.2 0.2 0.2
New Orleans0.366 0.366 0.366 0.366 0.366 0.366 0.366 0.366 0.366 0.366 0.366 0.366 0.366 0.366 0.366 0.366 0.366 0.366 0.366 0.366 0.366 0.366 0.366 0.366 0.366 0.366 0.366
HoustonBarbours Cut 1.9 1.9 1.9 1.9 1.9 1.9 1.9 1.9 1.9 1.9 1.9 1.9 1.9 1.9 1.9 1.9 1.9 1.9 1.9 1.9 1.9 1.9 1.9 1.9 1.9 1.9 1.9Bayport 378 2.3 0 0.36 0.36 0.36 1 1 1 1.5 1.5 1.5 2.3 2.3 2.3 2.3 2.3 2.3 2.3 2.3 2.3 2.3 2.3 2.3 2.3 2.3 2.3
North Atlantic 10.025 12.525 12.525 12.525 12.525 12.525 12.525 12.525 12.525 12.525 12.525 13.525 13.525 13.525 13.525 13.525 13.525 14.525 14.525 14.525 15.025 15.025 15.025 15.525 15.525South Atlantic 8.02 8.02 8.91 8.91 9.51 10.01 12.51 13.11 13.69 13.69 14.41 15.21 15.21 15.21 15.21 15.21 15.21 15.21 15.21 15.21 15.21 15.21 15.21 15.21 15.21Gulf Coast 3.566 3.926 3.926 3.926 4.566 4.566 4.566 5.066 5.066 5.066 5.866 5.866 5.866 5.866 5.866 5.866 5.866 5.866 5.866 5.866 5.866 5.866 5.866 5.866 5.866
Total Capacity 21.611 24.471 25.361 25.361 26.601 27.101 29.601 30.701 31.281 31.281 32.801 34.601 34.601 34.601 34.601 34.601 34.601 35.601 35.601 35.601 36.101 36.101 36.101 36.601 36.601
North Carolina International Terminal

80
Competitor Profile: Virginia Port Authority
Physical AssetsBerth Length (ft) 9,270-17,000+(future)
Terminal Area (Acres) NIT – 811PMT – 219NNMT - 140
Cranes 22
Capacity (M TEU) 3
Yard System RTG/Strd
Future Terminals + Craney Island 580
Channel Depth (ft) 50
Miles from Sea (nm) 18
OperationsThroughput (M TEU) 2.0 (FY 06)
Intermodal Rail Split (%) Approx. 20%
Box rate $285
Operating Margin 75%
Rail Service NS, CSX
Business Strategies
Planned Capacity (M TEU and Year)
5.4 (2030)
Primary Trading Markets Europe/Asia/South America
Import Destinations Columbus, Chicago, Louisville, St. Louis, North Carolina
Appendix
Source: As reported publicly by Port Authority, CH2M HILL Analysis

81
Competitor Profile: APMT, Virginia (open 2007 build-out 2017)
Physical AssetsBerth Length (ft) 3200 - 4000
Storage Yard (Acres) 575
Cranes 8 - 10
Capacity (M TEU) 1 - 2.5
Yard System ARMG
Potential Yard Area (Acres) 575
Channel Depth (ft) 50
Miles from Sea (nm) 18
OperationsThroughput (M TEU) Opened 2007
Intermodal Rail Split (%) Opened 2007
Box rate Data is proprietary
Operating Margin Privately held
Rail Service NS/CSX
Business Strategies
Planned Capacity (M TEU and Year)
2.5 m
Primary Trading Markets Asia/Europe
Import Destinations Columbus, Chicago
Appendix
Source: As reported publicly by Terminal Operator, CH2M HILL Analysis

82
Competitor Profile: Port of Charleston
Physical AssetsBerth Length (ft) 8,300-11,000+ (future)
Storage Yard (Acres) 395
Cranes 25
Capacity (M TEU) 1.99
Yard System RTG/Tpl
Potential Yard Area (Acres) ~ 540
Channel Depth (ft) 45
Miles from Sea (nm) 6-15
OperationsThroughput (M TEU) 1.9 (FY07)
Intermodal Rail Split (%) <20%
Box rate $255
Operating Margin ~65%
Rail Service NS, CSX
Business Strategies
Planned Capacity (M TEU and Year)
3.8 (2013-2016)
Primary Trading Markets Europe/Asia
Import Destinations Atlanta, Memphis, Huntsville-AL, Chicago, Louisville-KY, Dallas-TX, Gulf Coast, Nashville, and Birmingham
Appendix
Source: As reported publicly by Port Authority, CH2M HILL Analysis
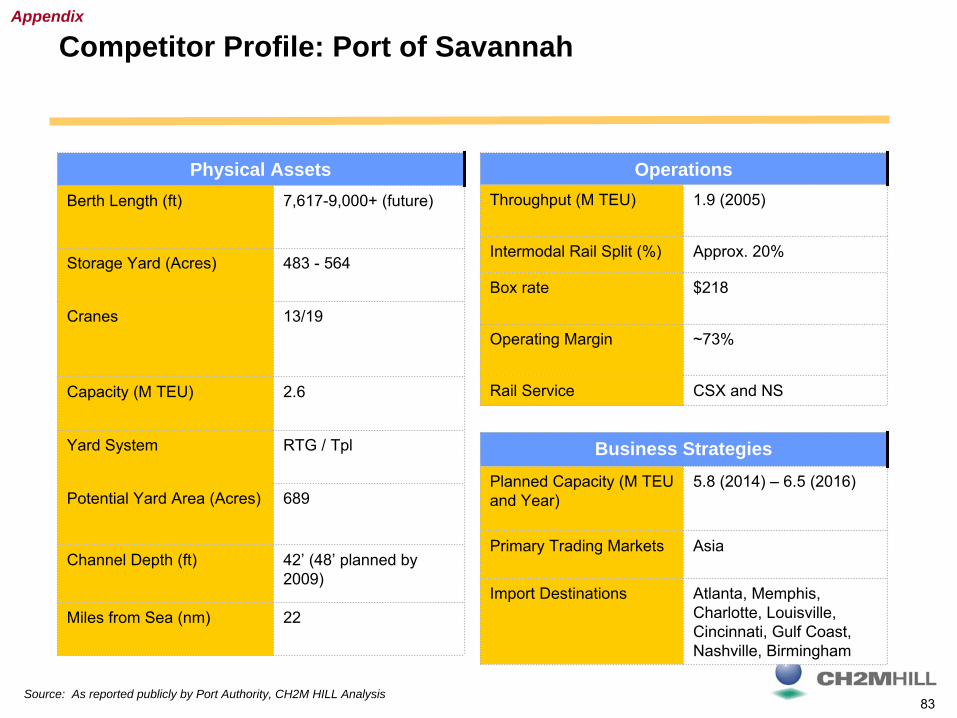
83
Competitor Profile: Port of Savannah
Physical AssetsBerth Length (ft) 7,617-9,000+ (future)
Storage Yard (Acres) 483 - 564
Cranes 13/19
Capacity (M TEU) 2.6
Yard System RTG / Tpl
Potential Yard Area (Acres) 689
Channel Depth (ft) 42’ (48’ planned by 2009)
Miles from Sea (nm) 22
OperationsThroughput (M TEU) 1.9 (2005)
Intermodal Rail Split (%) Approx. 20%
Box rate $218
Operating Margin ~73%
Rail Service CSX and NS
Business StrategiesPlanned Capacity (M TEU and Year)
5.8 (2014) – 6.5 (2016)
Primary Trading Markets Asia
Import Destinations Atlanta, Memphis, Charlotte, Louisville, Cincinnati, Gulf Coast, Nashville, Birmingham
Appendix
Source: As reported publicly by Port Authority, CH2M HILL Analysis

84
Competitor Profile: Jacksonville Port Authority
Physical AssetsBerth Length (ft) 10,050 (shared)
Storage Yard (Acres) Blount Island – 150Talleyrand – 170 (mixed use)
Cranes 14
Capacity (M TEU) 0.9
Yard System Mixed wheeled and reach-stacker
Potential Yard Area (Acres) 158 new acres at Mitsui Terminal (Dames Point)
Channel Depth (ft) 38-40
Miles from Sea (nm) 9 to 21 miles, depending on Terminal
OperationsThroughput (M TEU) 0.8 (FY 06)
Intermodal Rail Split (%) < 20%
Box rate Data unavailable
Operating Margin n/a
Rail Service CSX
Business Strategies
Planned Capacity (M TEU and Year)
1.7 (2017)
Primary Trading Markets South Am., Caribbean, Asia
Import Destinations Atlanta
Appendix
Source: As reported publicly by Port Authority, CH2M HILL Analysis

85
Terminal Operating CompanyIncome statement 8 9 10 11 12 13 14 15 16 17FYE December 31 all values in '000s 2014 2015 2016 2017 2018 2019 2020 2021 2022 2023
Total Volume TEUs (000's) 0 0 0 916 1072 1254 1468 1717 1936 2122
Total Revenue 0 0 0 138,011 165,510 198,487 238,036 285,465 329,854 370,553Total operating expenses -85,371 -104,037 -124,766 -149,626 -179,439 -207,341 -236,630
62% 63% 63% 63% 63% 63% 64%
EBITDA 0 0 0 52,639 61,473 73,721 88,410 106,026 122,513 133,924EBITDA margin 38% 37% 37% 37% 37% 37% 36%
Depreciation -2,894 -21,771 -28,631 -33,725 -34,559 -35,413 -41,001 -41,528 -42,392 -42,392Amortization of financing fees 0 -355 -355 -355 -355 -355 -474 -474 -474 -474
EBIT -2,894 -22,126 -28,987 18,559 26,559 37,953 46,936 64,024 79,648 91,058EBIT margin 13% 16% 19% 20% 22% 24% 25%
Interest Income - Operating Cash 0 0 2,274 68 70 82 107 1,424 1,282 1,161Interest Income - Undrawn Long Term Debt 0 2,240 0 0 0 0 1,439 1,121 659 659Interest Expense on Long Term Debt 0 -63,000 -63,000 -63,000 -62,004 -60,938 -80,798 -79,578 -78,272 -76,543
EBT -2,894 -82,886 -89,713 -44,373 -35,375 -22,903 -32,316 -13,009 3,316 16,3350% 0% 0% -32% -21% -12% -14% -5% 1% 4%
FYE December 31 all values in '000s
Total Volume TEUs (000's)
Total RevenueTotal operating expenses
EBITDAEBITDA margin
DepreciationAmortization of financing fees
EBITEBIT margin
Interest Income - Operating CashInterest Income - Undrawn Long Term DebtInterest Expense on Long Term Debt
EBT
2024 2025 2026 2027 2028 2029 2030
2321 2536 2733 2939 3000 3000 3000
421,559 472,155 521,492 574,909 610,271 634,681 660,069-265,622 -297,503 -328,589 -362,248 -379,423 -389,366 -399,576
63% 63% 63% 63% 62% 61% 61%
155,937 174,652 192,902 212,662 230,848 245,316 260,49337% 37% 37% 37% 38% 39% 39%
-42,189 -45,093 -43,868 -42,958 -42,809 -42,657 -41,659-474 -474 -474 -474 -474 -474 -474
113,274 129,086 148,561 169,230 187,565 202,185 218,36027% 27% 28% 29% 31% 32% 33%
1,670 2,353 3,009 0 0 0 0490 0 0 0 0 0 0
-74,693 -72,713 -70,595 -68,329 -65,904 -63,309 -60,532
40,741 58,726 80,975 100,901 121,661 138,876 157,82810% 12% 16% 18% 20% 22% 24%
2051
3000
1,504,143-752,072
50%
752,07250%
-26,2400
725,83248%
000
725,83248%
Scenario 1

86
0
10
20
30
40
50
60
70
80
90
100
0 10 20 30 40 50 60 70 80 90100
110
120
130
140
150
160
170
180
190
200
210
220
230
240
250
260
270
280
290
300
310
320
330
340
350
360
370
380
State
Private
Global
Internationally, container terminal investments and operations are largely dominated by the private sector
Region
Source: Drewry Shipping Consultants
Distribution of Terminal Operators by Region
Ope
rato
r Mix
(%)
Nor
th A
mer
ica
Nor
th E
urop
e
Sout
h Eu
rope
Far E
ast
SE
Asi
a
Mid
Eas
t
Car
ib /
C.A
.
Sou
th A
mer
ica
Oce
ania
S. A
sia
Afri
caE
ast E
urop
e
% of Global Market Share
Global Container Terminal Operating Companies
Appendix
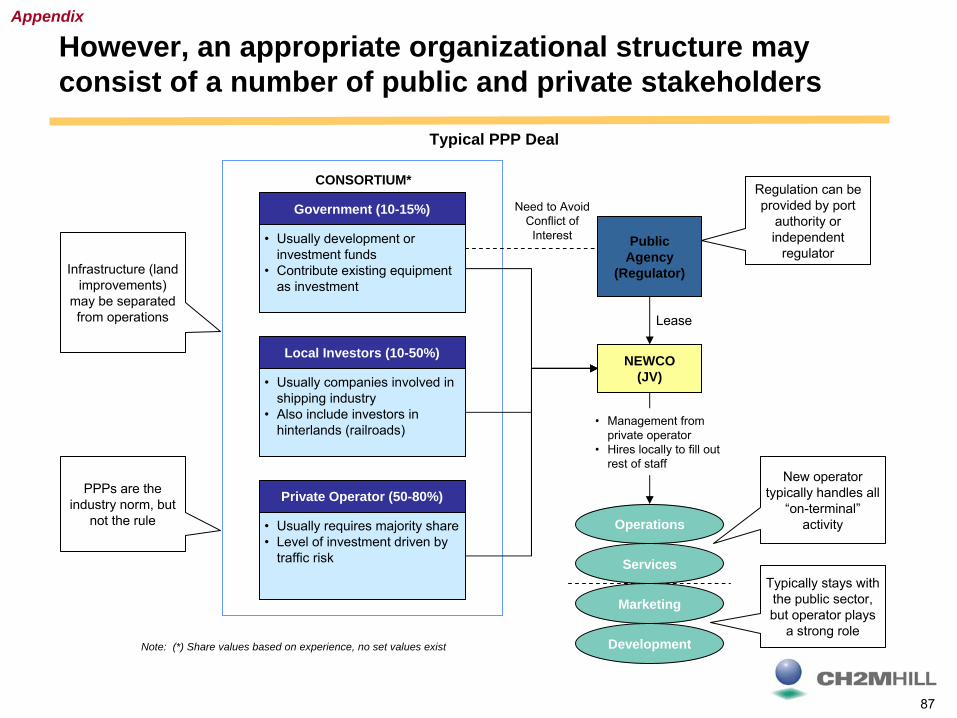
87
Need to AvoidConflict ofInterest
However, an appropriate organizational structure may consist of a number of public and private stakeholders
Government (10-15%)
• Usually development or investment funds
• Contribute existing equipment as investment
Local Investors (10-50%)
• Usually companies involved in shipping industry
• Also include investors in hinterlands (railroads)
Private Operator (50-80%)
• Usually requires majority share• Level of investment driven by
traffic risk
NEWCO(JV)
Operations
PublicAgency
(Regulator)
• Management from private operator
• Hires locally to fill out rest of staff
Lease
Typical PPP Deal
CONSORTIUM*
Note: (*) Share values based on experience, no set values exist
Infrastructure (land improvements)
may be separated from operations
Regulation can be provided by port
authority or independent
regulator
Services
Marketing
Development
New operator typically handles all
“on-terminal” activity
Typically stays with the public sector, but operator plays
a strong role
PPPs are the industry norm, but
not the rule
Appendix

88
Potential partnering options can vary significantly – the optimum structure will depend on the goals of the Port
Cash Flow Analysis for Typical PPP
Investment
Revenue
OpEx
CapEx
Interest
Public Entity Joint Venture Private Operator
Investment Investment
Fees
Lease
Royalty
Regulatory
TaxesLocal
Federal
ProfitProfit Profit
• Leases are fixed, royalties are variable
• Royalties can have minimums
• Optional regulatory fees can fund oversight
GoodwillGoodwill
• Becoming more rare due to competition among opportunities
• Profit share is driven by equity participation
• Public entity may waive their profit share to ensure adequate reinvestment
• May include equipment from port or private operator – a fair market value should be established by an independent entity
Key: Negative Cash FlowPositive Cash flow
Appendix
Appendix B
Summary of Infrastructure Study and Cost Estimate


B-1 Copyright 2008 by CH2M HILL Inc.
Reproduction and distribution in whole or in part beyond the intended scope of the contract without the written consent of CH2M HILL Inc. is prohibited.
Summary of Infrastructure Study and Cost Estimate
North Carolina International Terminal
A study was conducted solely for the purpose of conceptually identifying components necessary for planning a modern container terminal prepared to adapt to future changes in technology, equipment, and operations. The key elements of this study are summarized as follows:
B.1 General Assumptions
The assumed design criteria identify and establish the major elements, industry standards, and criteria necessary for further project development. The assumptions, summarized below, are deemed to be reasonable for the preliminary conceptual level description of the components of the North Carolina International Terminal project:
• Maximum of 3 million TEUs per annum.
• Vessels up to 12,000-TEU capacity.
• Automated Rail-Mounted Gantry (ARMG) crane operation in the container stacking yard.
• Automated guided shuttle carriers for the water-side operation.
• Intermodal yard (IY) operated by gantry cranes or top pick operation.
• 50 percent of import containers would leave the terminal by truck.
• 50 percent of import containers would leave the terminal by rail.
• Full import, export operation. No transshipment assumed.
• Road and rail supporting infrastructure improvements are needed.
B.2 Vessel Characteristics
For the purposes of initial project investigations, the 12,000 TEU is considered the project design vessel and the largest vessel expected to call at the port.
• Container capacity – 12,000 TEU.
• Length Over All (LOA) 1,263 ft.
• Beam 185 ft (22 containers wide on deck).
• Draft 50.0 ft (15.2 m).
• Dead Weight Tonnage is approximately 162,385 long tons (LT).
B.3 Dredging
A preliminary conceptual dredging study was conducted to approximate the design and provide input data to a cost analysis resulting in a conceptual-level cost estimate for dredging activities required to construct a channel and turning basin to accommodate the maximum design vessel. For purposes of the current investigation, the design vessel requires a vessel operating depth of 52.5 ft at mean lower low water (MLLW). In open water, the dredge depth has been increased to accommodate wind and wave effects on the vessels.
B.3.1 Channel Layout The channel widths were designed using the EM standards for 0.5- to 1.5-knot currents in the interior channel and less than 0.5-knot currents offshore. Preliminary analysis resulted in channel widths of 600 ft inshore and 500 ft offshore. For the areas in the Smith Island range and

B-2 Copyright 2008 by CH2M HILL Inc.
Reproduction and distribution in whole or in part beyond the intended scope of the contract without the written consent of CH2M HILL Inc. is prohibited.
Baldhead Shoal reaches where the 42 ft channel is already widened for severe current conditions, an additional 100 ft of channel width was added to accommodate the larger vessel characteristics.
B.4 Terminal Layout
B.4.1 General
The layout as shown on Drawing A, North Carolina International Terminal Concept Plan, in Appendix C, assumes up to 4,600 ft of berth would be available for use.
It is assumed the container yard (CY) would be serviced by the use of ARMGs. The container stacks would be sized to accommodate ARMGs. The gross stack dimensions are 10 containers wide and up to 5 containers high in 400-TEU ground slot segments.
B.4.2 Container Handling Yard Equipment
Both Automated Guided Vehicles (AGVs) and manually operated shuttle carriers or mini-straddle carriers are potential container transporters.
The water-side end of the ARMG stacks could be serviced by shuttle carriers or mini-straddle carriers which would transport boxes from the wharf to the end of the ARMG stacks. The shuttle carriers are 1 (container) over 1 and shorter than conventional straddle carriers. The shuttle carriers are assumed to be manually operated and were used for operational modeling and cost estimating purposes.
B.4.3 Capacity Calculations
Spreadsheet calculations were used to analyze the capacities of the individual operations of the berth, wharf cranes, and CY. The results of these calculations indicate the facility has a maximum throughput capacity of approximately 3 million TEUs per annum.
The ARMG stacks are assumed to have a maximum stack height of 5 containers and for the yard capacity calculations an average height of 3.5 containers was assumed to allow for re-moves and reshuffling. The annual yard capacity would be a function of dwell time.
B.4.4 Summary of Container Terminal Equipment
• 16 Super-Post-Panamax Quay Gantry Cranes. • 64 ARMGs (at 2 ARMGs per stack). • 40 shuttle carries or AGVs (water-side operation). • 20 shuttle carriers or AGVs (land-side operation to serve rail intermodal yard [IY]). • 5 rail-mounted gantry cranes for rail IY.
B.4.5 Reefer Storage
• Reefer storage is assumed to represent approximately 10 percent of the total storage cargo.
• Reefers would be stored in storage racks within the ARMG rows at the rear of the terminal.
• Considering 10 percent of the 32 blocks with a maximum storage height of 5 containers, a quantity of 6,400 reefer plugs is anticipated.
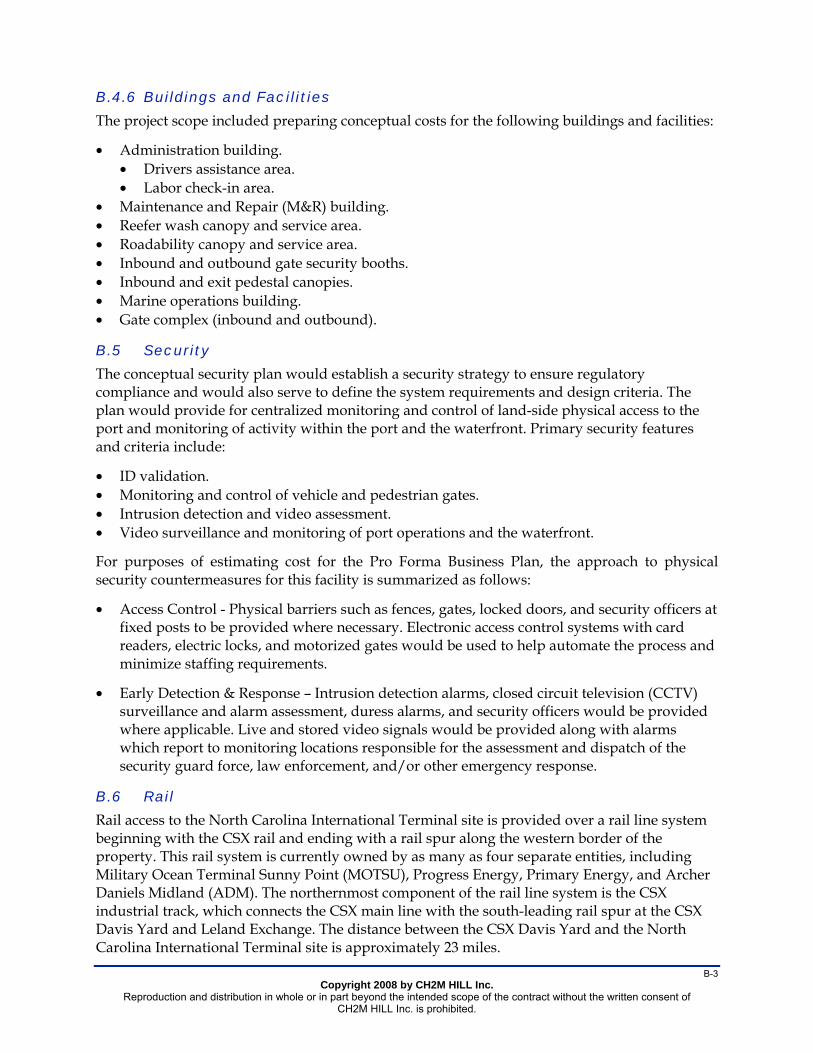
B-3 Copyright 2008 by CH2M HILL Inc.
Reproduction and distribution in whole or in part beyond the intended scope of the contract without the written consent of CH2M HILL Inc. is prohibited.
B.4.6 Buildings and Facilities
The project scope included preparing conceptual costs for the following buildings and facilities:
• Administration building. • Drivers assistance area. • Labor check-in area.
• Maintenance and Repair (M&R) building. • Reefer wash canopy and service area. • Roadability canopy and service area. • Inbound and outbound gate security booths. • Inbound and exit pedestal canopies. • Marine operations building. • Gate complex (inbound and outbound).
B.5 Security
The conceptual security plan would establish a security strategy to ensure regulatory compliance and would also serve to define the system requirements and design criteria. The plan would provide for centralized monitoring and control of land-side physical access to the port and monitoring of activity within the port and the waterfront. Primary security features and criteria include:
• ID validation. • Monitoring and control of vehicle and pedestrian gates. • Intrusion detection and video assessment. • Video surveillance and monitoring of port operations and the waterfront.
For purposes of estimating cost for the Pro Forma Business Plan, the approach to physical security countermeasures for this facility is summarized as follows:
• Access Control - Physical barriers such as fences, gates, locked doors, and security officers at fixed posts to be provided where necessary. Electronic access control systems with card readers, electric locks, and motorized gates would be used to help automate the process and minimize staffing requirements.
• Early Detection & Response – Intrusion detection alarms, closed circuit television (CCTV) surveillance and alarm assessment, duress alarms, and security officers would be provided where applicable. Live and stored video signals would be provided along with alarms which report to monitoring locations responsible for the assessment and dispatch of the security guard force, law enforcement, and/or other emergency response.
B.6 Rail
Rail access to the North Carolina International Terminal site is provided over a rail line system beginning with the CSX rail and ending with a rail spur along the western border of the property. This rail system is currently owned by as many as four separate entities, including Military Ocean Terminal Sunny Point (MOTSU), Progress Energy, Primary Energy, and Archer Daniels Midland (ADM). The northernmost component of the rail line system is the CSX industrial track, which connects the CSX main line with the south-leading rail spur at the CSX Davis Yard and Leland Exchange. The distance between the CSX Davis Yard and the North Carolina International Terminal site is approximately 23 miles.

B-4 Copyright 2008 by CH2M HILL Inc.
Reproduction and distribution in whole or in part beyond the intended scope of the contract without the written consent of CH2M HILL Inc. is prohibited.
Upgrades, improvements, and portions of new rail (passing tracks) would be required to support the volume of the North Carolina International Terminal facility at Maximum Build-out.
Current rail planning is based on the following cargo projections:
• Annual Marine Terminal Throughput: 3 million TEUs. • Intermodal Rail Volume: 50 percent (1. 5 million TEUs or 882,353 annual rail lifts).
Considering the annual rail throughput of 882,353 containers and the rail line operating 364 days per year, 2,451 containers is the expected average daily rail throughput. A 10,000-ft train contains a maximum of 262 containers, which equates to 10 trains per day. Realistically, however, not all trains would be 10,000 ft in length; therefore, from 10 to 14 trains per day would be expected.
B.7 Roads
The roads in the project area are already experiencing heavy traffic from the current growth in the region. With the addition of almost 900,000 trucks annually, it was necessary to study the impacts the proposed new terminal would have on the roadway infrastructure as well as projected growth in the area.
For purposes of this initial evaluation only, NC-87 is assumed to represent the end point of the terminal connector accessing the public road system. One of the alternative routes investigated will become the North Carolina International Terminal transportation corridor and allow traffic to travel between the terminal and the interstate highway system. The analysis reviewed three existing NC highway alignments and one proposed new location alignment between NC-87 and US-17, to represent the transportation corridor. These alternative transportation corridors had lengths in the range of 12 to 22 miles. These potential routes would allow traffic to travel between the terminal and US-17 (a rural major arterial which connects to the national interstate system) with significant infrastructure improvements. These routes are illustrated on Drawing B, Brunswick County Map, in Appendix C.
Because of extensive wetland impacts and right of way (ROW) constraints, NC 133 was not considered a viable option. Other options may exist for the conceptualized new alignment but only one was considered in this study. The conceptualized new alignment was considered the most desirable at this time and the associated preliminary estimated costs were provided as input to the Pro Forma Business Plan. The route appeared to offer the least impacts to existing properties from ROW acquisition, the shortest travel distance, and a cost-effective use of roadway improvement budgets.
B.8 Preliminary Draft Cost Estimate
The preliminary, conceptual planning of the terminal utilized current industry standards, approximations, professional judgment, and assumptions as a means to provide structure to the description of the proposed development. The identified terminal components then became the basis of a preliminary conceptual cost estimate for the proposed development. This cost estimate must be treated as a general approximation of cost and would be subject to change following further analysis in future phases of the project.
Two scenarios are defined in this section:

B-5 Copyright 2008 by CH2M HILL Inc.
Reproduction and distribution in whole or in part beyond the intended scope of the contract without the written consent of CH2M HILL Inc. is prohibited.
• High-Peaking—representing a terminal with high throughput peaking characteristics and low equipment utilization; four vessels would be at berth simultaneously, requiring the maximum number of cranes to support the berth operation.
• Low-Peaking—representing low throughput peaking characteristics and high utilization of equipment; significant peaks of throughput would not be anticipated, nor the likelihood four vessels would be at berth simultaneously, allowing maximum use of equipment.
The two costing scenarios are operations-dependent. The determination of the operations scenarios is in turn dependent on the shipping carriers and market conditions. Most terminals in the U.S. are of the high-peaking type, but there is a greater possibility for low-peaking terminal facilities in the future.
The results of the Low-Peaking cost analysis can be consolidated into the major components and rounded approximate costs shown in Table B-1.
TABLE B-1 Results of Low-Peaking Cost Analysis
Component Approximate Cost
Responsibility of Authority or State of North Carolina
Environmental and Permitting Cost. $60,000,000
Terminal Development Cost (Subject of a PPP). $1,383,400,000
Non-Federal Share of Channel Deepening Cost (50%). $265,800,000
Sub-Total of Authority or State of North Carolina Costs $1,709,200,000
Responsibility of Other Parties
Total Roadway Improvements Cost. $181,500,000
Total Railroad Improvements Cost. $127,400,000
Federal Share of Channel Deepening Cost (50%). $265,800,000
Sub-Total of Other Party Costs $574,700,000
Total Low-Peaking Port Development Cost $2,283,900,000
The results of the High-Peaking cost analysis can be consolidated into the major components and rounded approximate costs shown in Table B-2.
TABLE B-2 Results of High-Peaking Cost Analysis
Component Approximate Cost
Responsibility of Authority or State of North Carolina
Environmental and Permitting Cost. $60,000,000
Terminal Development Cost (Subject of a PPP). $1,582,600,000

B-6 Copyright 2008 by CH2M HILL Inc.
Reproduction and distribution in whole or in part beyond the intended scope of the contract without the written consent of CH2M HILL Inc. is prohibited.
TABLE B-2 Results of High-Peaking Cost Analysis
Component Approximate Cost
Non-Federal Share of Channel Deepening Cost (50%).
$265,800,000
Sub-Total of Authority or State of North Carolina Costs $1,908,400,000
Responsibility of Other Parties
Total Roadway Improvements Cost. $181,500,000
Total Railroad Improvements Cost. $127,400,000
Federal Share of Channel Deepening Cost (50%). $265,800,000
Sub-Total of Other Party Costs $574,700,000
Total High-Peaking Port Development Cost $2,483,100,000
Contingencies For conceptual-level cost estimating purposes, a contingency allowance was included in addition to the costs estimated. This contingency would allow for additional cost due to uncertainty and risk, including:
• Additional costs due to design development. • Estimating error and uncertainty. • Unforeseen conditions such as soil anomalies and meteorological conditions. • Risks, whether allocated to the construction contractor or owner.
During early concept development, an allowance of 25 percent was used as generic guidance for a construction contingency. Typically, equipment cost is less problematic than construction cost, so a contingency factor of 10 percent was used as generic guidance for equipment contingencies.
B.9 Timeline
Based on the limited information available, Figure B-1 depicts the most optimistic North Carolina International Terminal Project Timeline. According to this timeline, start-up of operations is estimated to begin in year 2017 when it is anticipated at least two berths would be available.

FIGURE B-1 North Carolina International Terminal Timeline for Planning, Development, and Construction
B-7 Copyright 2008 by CH2M HILL Inc.
Reproduction and distribution in whole or in part beyond the intended scope of the contract without the written consent of CH2M HILL Inc. is prohibited.


Appendix C
Drawings


INBOUND GATE
ROADABILITY CHECKPOINT
OUTBOUND GATE
RPM PORTAL
SECONDARY RPM PORTAL
SECURITY
OCR PORTAL
DRIVER ASSISTANCE
EMERGENCY LANE
SECURITY
RETURN GATE
TROUBLE PARKING
SCALE
SLIDING GATE EXIT (TROUBLE TRUCK)
LIGHT POLE
PICK-UP PARKING (ADMIN.PERSONEL)
CAMERA BRIDGE
OCR READER
DYNAMIC INFO BOARD
ADMIN PARKING
MAINTENANCE BUILDING
ADMIN BUILDING
MOTOR POOL
POV PARKING
US CUSTOM SECURITY1
2
3
4
5
6
7
8
9
10
11
12
13
14
15
16
17
18
19
20
21
22
23
24
25
KEY NOTES:
346191
JANUARY 2008
A
0
Scale In Feet
200 400 600
PROJ
DATE
DA
TE
NO
.R
EV
ISIO
NA
PV
DB
Y
SHEET
DWG
FILENAME: PLOT DATE: PLOT TIME:346191_Fig_A.dgn 2/5/2008 1:45:19 PM
CH
2M
HIL
L 2
00
4.
AL
L R
IGH
TS
RE
SE
RV
ED
.
1 2 3 4 5 6
A
B
C
D
VERIFY SCALE
BAR IS ONE INCH ON
ORIGINAL DRAWING.
1"0
CH
2M
HIL
L A
ND
IS
NO
T T
O B
E U
SE
D,
IN W
HO
LE
OR
IN
PA
RT
, F
OR
AN
Y O
TH
ER
PR
OJE
CT
WIT
HO
UT
TH
E W
RIT
TE
N A
UT
HO
RIZ
AT
ION
OF
CH
2M
HIL
L.
TH
IS D
OC
UM
EN
T, A
ND
TH
E I
DE
AS
AN
D D
ES
IGN
S I
NC
OR
PO
RA
TE
D H
ER
EIN
, A
S A
N I
NS
TR
UM
EN
T O
F P
RO
FE
SS
ION
AL
SE
RV
ICE
, IS
TH
E P
RO
PE
RT
Y O
FR
EU
SE
OF
DO
CU
ME
NT
S:
c
346191
NO
RT
H C
AR
OL
INA
ST
AT
E P
OR
TS
AU
TH
OR
ITY
WIL
MIN
GT
ON
, N
OR
TH
CA
RO
LIN
A
NO
RT
H C
AR
OL
INA
ISS
UE
D
INT
ER
NA
TIO
NA
L T
ER
MIN
AL
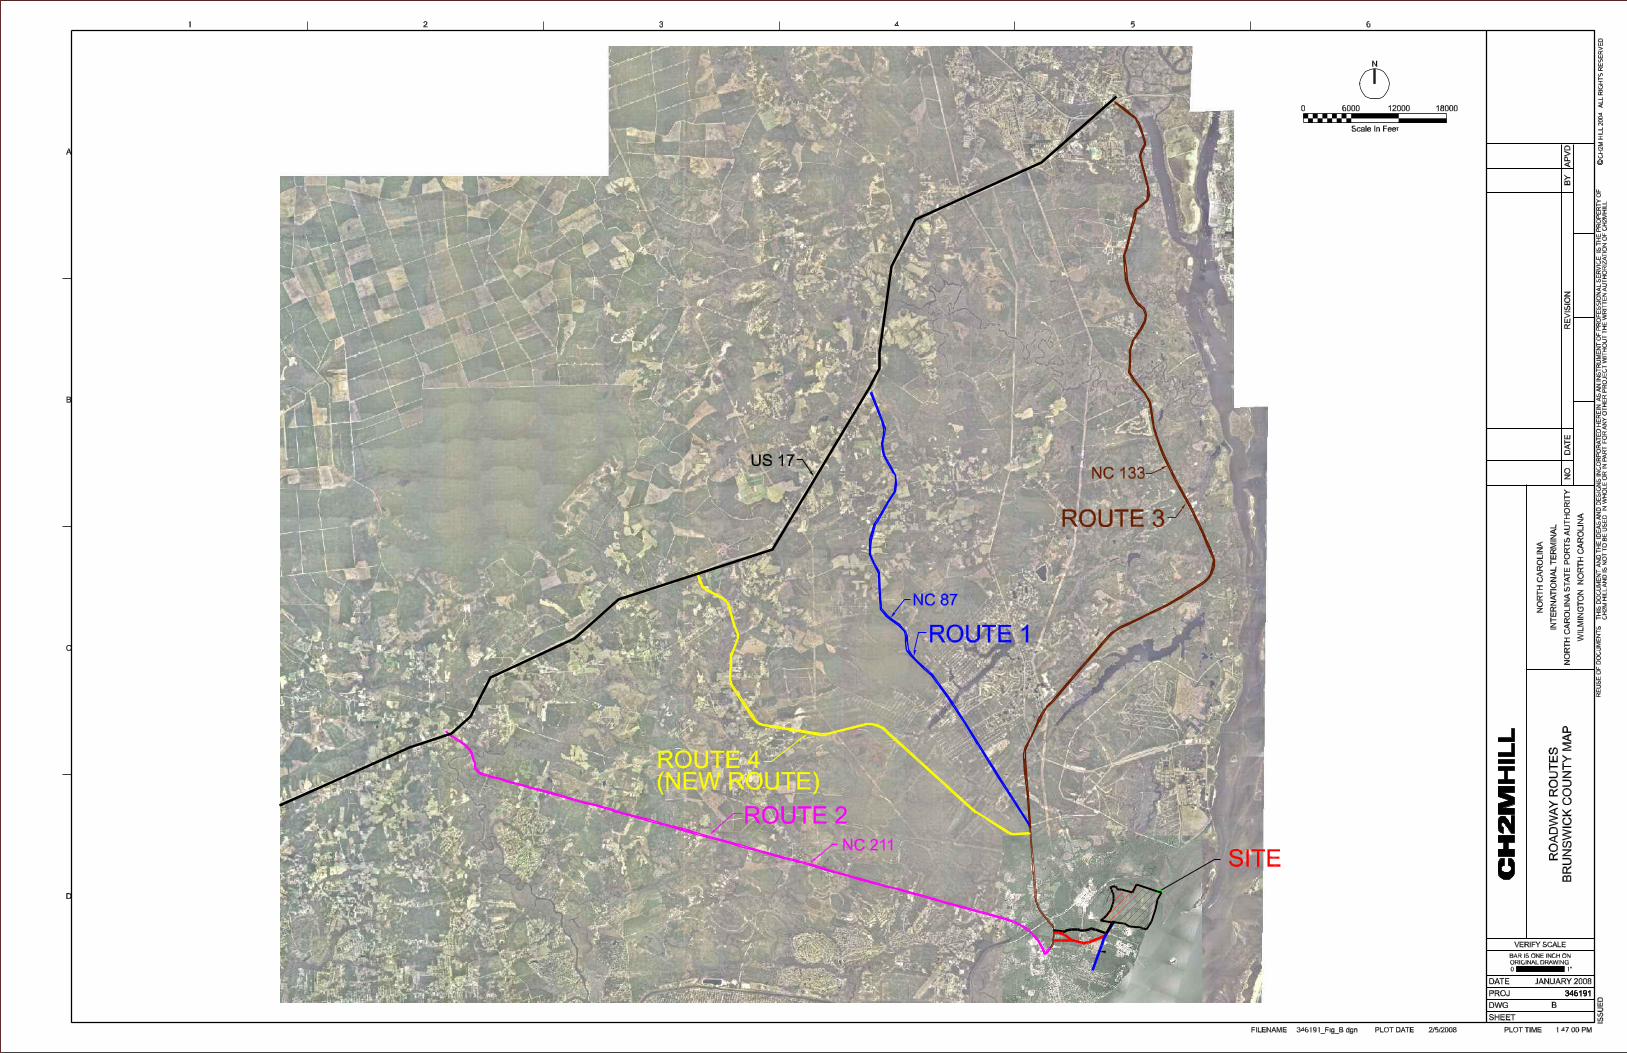
346191
N
JANUARY 2008
0 6000 12000 18000
Scale In Feet
US 17
NC 87
NC 133
ROUTE 1
ROUTE 3
RO
AD
WA
Y R
OU
TE
S
BR
UN
SW
ICK
CO
UN
TY
MA
P
ROUTE 2
SITENC 211
ROUTE 4(NEW ROUTE)
B
PROJ
DATE
DA
TE
NO
.R
EV
ISIO
NA
PV
DB
Y
SHEET
DWG
FILENAME: PLOT DATE: PLOT TIME:346191_Fig_B.dgn 2/5/2008 1:47:00 PM
CH
2M
HIL
L 2
00
4.
AL
L R
IGH
TS
RE
SE
RV
ED
.
1 2 3 4 5 6
A
B
C
D
VERIFY SCALE
BAR IS ONE INCH ON
ORIGINAL DRAWING.
1"0
CH
2M
HIL
L A
ND
IS
NO
T T
O B
E U
SE
D,
IN W
HO
LE
OR
IN
PA
RT
, F
OR
AN
Y O
TH
ER
PR
OJE
CT
WIT
HO
UT
TH
E W
RIT
TE
N A
UT
HO
RIZ
AT
ION
OF
CH
2M
HIL
L.
TH
IS D
OC
UM
EN
T, A
ND
TH
E I
DE
AS
AN
D D
ES
IGN
S I
NC
OR
PO
RA
TE
D H
ER
EIN
, A
S A
N I
NS
TR
UM
EN
T O
F P
RO
FE
SS
ION
AL
SE
RV
ICE
, IS
TH
E P
RO
PE
RT
Y O
FR
EU
SE
OF
DO
CU
ME
NT
S:
c
346191
NO
RT
H C
AR
OL
INA
ST
AT
E P
OR
TS
AU
TH
OR
ITY
WIL
MIN
GT
ON
, N
OR
TH
CA
RO
LIN
A
NO
RT
H C
AR
OL
INA
ISS
UE
D
INT
ER
NA
TIO
NA
L T
ER
MIN
AL

Appendix D
Glossary


D-1 Copyright 2008 by CH2M HILL Inc.
Reproduction and distribution in whole or in part beyond the intended scope of the contract without the written consent of CH2M HILL Inc. is prohibited.
Appendix D Glossary Addressable Market – As used in this analysis, the container market demand served by container ports along the U.S. East Coast and Gulf Coast. The forecast container volume at the North Carolina International Terminal was calculated as a market share percentage of the addressable market.
Authority – North Carolina State Ports Authority.
Automated Rail-Mounted Gantry (ARMG) Crane – An unmanned rail-mounted gantry crane, used for the purpose of transporting, stacking, loading, or unloading containers. The ARMG is linked to the terminal operating system and operated by computer sensing devices.
Automated Guided Vehicle (AGV) – Vehicles designed to carry cargo (containers) and to perform their operations from computer-generated commands and without direct human guidance. An automatic guided vehicle system (AGVS) consists of one or more computer-controlled, wheel-based load carriers running without the need for an onboard operator or driver. AGVs have defined paths or areas where they navigate. Navigation is achieved by any one of several means, including following a path defined by buried inductive wires, surface-mounted magnetic or optical strips, or inertial, satellite, or laser guidance.
Beam – The overall width of the ship, measured at its widest point (outside of bulkhead to outside of bulkhead); also known as breadth.
Berth – The designated place where a ship lies when secured to a wharf or pier.
Bollard – A short steel column with a base plate used to secure ship mooring lines, thus holding the ship to the wharf while at berth. Bollards are available in various shapes and load capacities.
Box Rate – The conglomerated cost to transport a container from a ship berthed at the port to the conveyance used to transport the container out of the port facilities. The cost also applies to containers coming into the port for loading aboard ship.
Capacity – The number of TEUs or containers handled by the facility at an acceptable level of service, performance, and unit cost.
Capital Cost – The amount of money needed to acquire or improve capital assets (sometimes called “fixed assets”) such as land, buildings, equipment, and machinery.
Capital Assets – The tools of the business and the means of being in business rather than the products or services of the business.
Channel Alignment – The primary path of the channel is defined by its alignment. Often the centerline of the channel is depicted on charts to define the channel’s navigation geometry or alignment.
Chassis – Over-the-road trailer used for transporting containers, usually owned and maintained by the shipping line or terminal operator in the U.S. market.
Competitive Position Assessment – Provides an understanding of the competitive environment within which the port must market, determines a marketing strategy that will create sustainable competitive advantage, and provides a future container demand projection for the port.

D-2 Copyright 2008 by CH2M HILL Inc.
Reproduction and distribution in whole or in part beyond the intended scope of the contract without the written consent of CH2M HILL Inc. is prohibited.
Compound Annual Growth Rate (CAGR) – Rate of growth of a number when compounded year after year. Compounding means the growth rate applies to each increase in the base number.
Concession – The granting of the use of property, and the right to undertake and profit from activities conducted by the grantee (or concessionaire), by a government entity in return for specific services, revenue, and/or activities conducted to achieve a specific purpose through the use of such concession by the grantee.
Crane Availability – The amount of the total available time when a crane is available for use. In general, the non-available time would be related to equipment failure or maintenance activities requiring the crane to sit idle until fully re-instated to working status. Crane Beam – A structural steel member, typically used as a bridge girder to allow the crane’s load carrying device to reach out to the object to be secured.
Crane Boom – A mechanism mounted horizontally on the frame of an overhead crane to which the crane rails and trolley bridge are attached. On a ship-to-shore crane, the crane boom is located transverse to the wharf, extending over the ship’s hatch and extending back to the shoreward side of the wharf. The water-side portion of the crane boom can be raised by means of a hinged connection to allow ships to pass along the wharf face.
Crane Utilization – The portion of the time when the crane is actually in use as compared to the total time the crane is available for use.
Deployed Technology – Technology which is already in use by the subject industry, or by other industries.
Depth (ft) – Vertical measurement of the internal size of the cargo hold.
Development Costs – Up-front costs associated with planning and permitting.
Diversity Factor – A multiplication factor used to reduce the demand of for power which was determined by simply adding up the maximum demand for each source in a system. The diversity factor is used to recognized that each piece of equipment will not be utilizing a full demand at the same time.
Draft – Vertical measurement from the ship’s waterline to the bottom of the keel.
Dredge Depth – Normal operating water depth plus 2 ft of over-dredge allowance, i.e., -52.5 ft plus 2 ft of over-dredge equals a -54.5 ft dredge depth.
Dwell Time – The average time (in days) a container is in the container yard, the amount of time a container resides within the port terminal area.
Econometric Evaluation – The use of computer analysis and modeling techniques to describe in mathematical terms the relationship between key economic forces such as labor, capital, interest rates, and government policies; then test the effects of changes in economic scenarios. For example, an econometric model might show the relationship between housing starts and interest rates.
Fenders – Fenders are flexible, structural components of the wharf which are intended to prevent the ship from coming into direct contact with the wharf and are used to absorb or dissipate the kinetic energy of the berthing ship by converting it into potential energy in the fender materials. The fender is similar to a bumper and is generally constructed in the form of a fender pile, a column of rubber, a foam-filled cylinder, or pneumatic device. Other energy conversion processes are also possible.

D-3 Copyright 2008 by CH2M HILL Inc.
Reproduction and distribution in whole or in part beyond the intended scope of the contract without the written consent of CH2M HILL Inc. is prohibited.
Forty-foot Ground Slot (FGS) – The ground area required for a single stack of forty-foot containers.
Forty-Foot Equivalent Unit (FEUs) – Containers with a length of 40 feet (12.19 meters). One FEU is equal to two TEUs.
Gantry Crane – A classification which refers to an overhead crane used for picking up and moving cargo by means of a horizontal rail system and a form of movable bridge spanning between the rails. The bridge is supported on the rails by wheels called “trolleys.” Movable gantry cranes are generally supported either by rubber tires or steel wheels. Several forms of gantry cranes are used in port facilities, including ship-to-shore container gantry cranes for loading and unloading the ship, and rubber-tired or rail-mounted gantry cranes used for moving cargo or loading and unloading cargo onto trucks and trains.
Height from Keel to Antenna Mast – Total height (in ft) of vessel from keel (bottom-most part of the ship) to top of antenna mast (highest component of ship).
Height from Keel to Top Tier on Deck – Total height (in ft) from the bottom of the keel to the top of the highest container stacked on the deck of the ship.
High-Peaking Operation – Operation characterized by cargo arriving at the port in large quantities over a very short period of time and then dropping to a much lower, perhaps idle, operation at other times.
Highway Access Improvement Costs – Costs associated with construction of highway access to the site.
HS20-44 – A designation established by AASHTO. “HS” refers to the type of vehicles a bridge or highway can accommodate. AASHTO also identifies the conventional semi- or tractor-trailer vehicle as an HS truck configuration; “20” refers to the loading specification of the bridge, in tons; “44” indicates the year the specification was adopted. HS20-44 capacity means that the bridge or highway is able to safely accommodate 3- or 4-axle vehicles, such as a large semi-tractor-trailer.
HS25-44 – A scaled-up version of the HS20 vehicle.
Intermodal Yard (IY) – An area where an interchange of people or cargo occurs among various modes of transportation, such as ships, trucks, buses, or trains. Typically, in a port environment, the IY is a rail yard where container cargo from the ship is loaded onto freight trains. The equipment in an IY is often compatible with multiple transport systems.
Internal Rate of Return (IRR) – The discount rate at which the present value of the future cash flow of an investment equals the cost of the investment. When the net present values of cash outflows (the cost of the investment) and the cash inflows (returns on investment) equal zero, the rate of discount being used is the IRR. When the IRR is greater than the required return (called the “hurdle rate” in capital budgeting), the investment would generally be considered acceptable.
Kips – A 1,000-pound load (5 kips = 5,000 pounds).
Live Load – The weight or forces applied to the structure by any object or material exclusive of the actual construction materials used to create the subject structure. Live loads may be static (not moving) like stacked containers, dynamic (moving) as by a vehicle, repetitive, or impact (generally a sudden event).

D-4 Copyright 2008 by CH2M HILL Inc.
Reproduction and distribution in whole or in part beyond the intended scope of the contract without the written consent of CH2M HILL Inc. is prohibited.
Low-Peaking Operation – Operation characterized by cargo arriving at the port in a more steady volume throughout the working hours of the terminal, creating a steady flow of equipment operation with less, or no, idle time.
Market Entry Strategy—A plan describing the timing and process to be used to introduce a new or improved product into the marketplace in a manner best suited to achieving the objectives of the stakeholders.
Maximum Build-out – The peak level of container throughput obtained after all facilities in the conceptual plan are built and operating, producing a four-berth (8,000-TEU ship) container terminal with an estimated throughput of 3,000,000 TEUs per year.
Mean Low Water (MLW) – See definition of “Mean Lower Low Water.”
Mean Lower Low Water (MLLW) – There are two low tides in each tidal cycle (so usually two low tides in each day). These two low tides are not quite the same height because one tide is generated by the relatively small gravitational interaction with the sun, and the other is generated by the larger gravitational interaction with the moon. Since the two low tides (or water levels) are different levels of low, one is naturally the higher low water (higher low tide) and the other is the lower low water (lower low tide). So MLLW is the average of the lower low water height of each tidal day (i.e., average of the lowest low tide from each day). The averages are taken over a period called the National Tidal Datum Epoch (a 19-year epoch).
Minimum Build-out – When two of the four berths planned for the North Carolina International Terminal are available for use and the terminal goes into operation while remaining elements of terminal facilities are still under construction.
Mini-Straddle Carrier – A small straddle carrier or small piece of mobile truck equipment capable of straddling and lifting one container within its own framework.
Navigation Channel Improvement Costs – Costs associated with dredging the existing Federal Navigation Channel from -42 feet to the planned depth for the new container terminal.
Operating Equivalent Load – The sum of the wheel loads produced (by the ship-to-shore gantry crane) while operating on the supporting structure (wharf).
Operation and Maintenance (O&M) Cost – Those ongoing costs of doing business related to the operation of the business and the maintenance of capital assets such as roads, buildings, infrastructure, equipment, and services such as water and power.
Operation and Maintenance Cost Projection – A method used to identify and quantify representative O&M cost parameters; in this context, the O&M cost projection describes a conceptual operating model for the North Carolina International Terminal.
Opportunity Assessment – A method used to identify and quantify the future addressable market for waterborne container traffic which may be captured by the port; determines the need for additional system capacity to address the needs of a particular market.
Panamax – A term meaning the maximum size vessel which can utilize the existing Panama Canal. The maximum size ship allowed to transit the canal is defined by the following dimensions:
Width – 106 feet (32.3 meters) Length – 965 feet (294.3 meters) Draft – 39.5 feet (12 meters) Dead Weight Tons – Approximately 69,000

D-5 Copyright 2008 by CH2M HILL Inc.
Reproduction and distribution in whole or in part beyond the intended scope of the contract without the written consent of CH2M HILL Inc. is prohibited.
Panzer Belt – A proprietary system used to protect the electric cable which supplies power from the wharf to the ship-to-shore container crane. A continuous semi-flexible belt, fabricated from rubber with inlaid steel reinforcement, which lies over a cable storage trench cast in the wharf, thus covering the cable trench.
Peaking Factor – The ratio of the maximum usage of some system or element of a system to the average usage of the system or element in the system. Often used to express the relationship between peak use and average use of systems, such as electrical systems and water systems, where the peak can be much higher than the average usage. The Peaking Factor for a number of such systems is an empirically derived value of common usage in engineering calculations.
Pedestal Canopy – A canopy is a building structure with a roof but without walls. The pedestal canopy is a roof supported by vertical columns covering the pedestal for the purpose of providing shade and shelter from the elements.
Pile – A long, slender pole which can be used for many purposes and may be in many shapes including round, square, or multi-faceted. A pile is often used as the structural component of a wharf which holds up the deck. As a support structure, a pile is typically driven (or placed) vertically (plumb) or at an angle (batter). Piles may be made of steel, precast concrete, precast prestressed concrete, timber, steel/concrete composite, or, depending on use, other materials such as plastic or rubber.
Port – In this report, the North Carolina International Terminal.
Post-Panamax – The class of ships constructed in excess of the size permitted through the Panama Canal. In general, these ships are in the 5,000-TEU to 8,000-TEU class.
Power Factor (PF)– A measurement of electrical efficiency denoted by PF or the mathematical symbol φ (Cosine of Phi or Cos. Phi). It is the ratio of productive power (kW) to total power (kVA) and is measured as a number between 0 and 1 or as a percentage. Consider the following: Imagine driving your car down the highway, you’re using gasoline to power the engine (total power) and the engine is generating 200 horsepower (productive power) to move. If all the gasoline you’re using is going towards moving the car, you are said to have a power factor of 1. Now in contrast, you turn your car on but let it sit in the driveway. You are still using gas (total power), but the engine is generating 0 horsepower (productive power), and you are said to have a power factor of 0. Recent studies have shown that the average power factor of a house is approximately 0.8. This means that you’re using about 80 percent of the power that’s given to you and therefore wasting the other 20 percent. This 20 percent is lost due to heat generated by friction inside the electrical lines.
Power Factor Correction – The means of increasing the power factor within an electrical system and therefore its efficiency.
Power Factor Correction Capacitors – Specially designed capacitors used specifically for power factor correction. The primary function of a capacitor is to store electricity using an electric field. Due to its physical nature, the capacitor has a tendency to maintain a constant voltage. When the voltage drops on an electrical system, the capacitor will release some of the electricity stored within itself to correct this drop. Power capacitors are measured in kVAR, which signifies their reactive power or their ability to react to changes in voltage. PPP – Public-Private Partnership; also referred to as a P3.
Pro Forma Business Plan – The term “pro forma” means “as a matter of form” in Latin. It refers to a presentation of data, such as a balance statement or income statement, where certain
D-6 Copyright 2008 by CH2M HILL Inc.
Reproduction and distribution in whole or in part beyond the intended scope of the contract without the written consent of CH2M HILL Inc. is prohibited.
amounts are hypothetical. For example, a pro forma business plan might show revenues or costs which are proposed, or assumed or approximated, but which are conceptual because they have not yet been consummated.
Pro Forma Economic Model – Provides a computational assessment of the economic viability of a given project, in this case the North Carolina International Terminal enterprise, identifies any major gaps or economic barriers to project success, and identifies those elements that would most improve the economic fundamentals of the project.
Rail Access Improvement Costs – Costs associated with improvement of existing rail infrastructure that is located outside the boundaries of the planned terminal.
Reefer – A refrigerated container.
Reefer Plug – The plug used to provide power to a refrigerated container. Reefer plugs are generally grouped together to allow the temporary storage of refrigerated containers while maintaining the temperature integrity of the cargo.
Re-handling, Re-moves and Re-shuffling – Container movements from one point in the container yard to another point in the yard. Re-shuffling can be either for the convenience of the yard operator, in which case they do not generate revenue for the yard operator, or by direction of the shipping line, in which case they may generate revenue.
Revenue Projection – Identifies, evaluates, and quantifies the key revenue opportunities for a project, such as a port, as an ongoing enterprise.
Roadability – The condition of a vehicle for purposes of travel by public roads. An inspection to determine if a vehicle cargo and chassis is "roadworthy," especially after repair or servicing A roadability building is a facility which supports roadability inspections.
Scantling Draught – Depth (in ft) from the ship’s waterline to its keel, also called “draft.”
Slip – See definition for “Berth.”
Stowed Equivalent Load – The sum of the loads produced (by the crane) on the wharf in a non-operating or "stowed” condition. In the stowed position, the ship-to-shore gantry crane boom is up, the trolley and lifting system are in the stowed position, and tiedowns, if any, are in place.
Straddle Carrier – A manually operated, movable, drivable rubber-tired gantry crane capable of carrying one FEU. In general, the use of a straddle carrier is to pick up a box, either from the ground or from a single-line stack of up to 3 or 4 containers, and move the container either to a different ground location or a different stack as a step in the processing of the container through the port facility.
Super Post-Panamax – A class of newer, larger ships created through advances in engine technology which began appearing in about 1997. These ships generally range from 8,000 TEUs to 10,000 TEUs.
Terminal – The location where cargo is handled and generally consisting all operations between the ship and the inbound and outbound gates. The area where cargo is handled between transportation modes, such as between rail or highway and ship transport.
TGS – Twenty-foot ground slot. The ground area required for a single stack of twenty-foot containers.
D-7 Copyright 2008 by CH2M HILL Inc.
Reproduction and distribution in whole or in part beyond the intended scope of the contract without the written consent of CH2M HILL Inc. is prohibited.
Tiers on Deck – The number of containers stacked on the ship deck, as measured by containers.
Transshipment – The term used to describe cargo coming into a port facility by ship and subsequently departing the same port facility by a different ship, all without leaving the port facilities.
Turning Basin – An area for turning a vessel around to change the direction it is facing. This activity is generally accomplished either before docking the vessel or prior to departure. Often, a terminal operator and/or the vessel’s pilot will have a preference for berthing vessels either “starboard side-to” or “port-side-to,” which will define when, in the course of a vessel call, the vessel is turned.
Twenty–Foot Equivalent Unit (TEU) – The expression most commonly used in the container shipping business as a measurement or quantity of containers. The TEU refers to containers measuring 20 feet (6.1 meters) in length and which are generally 8 feet wide and 8.5 feet in height. Two TEUs are equal to one FEU.
Twenty-Foot Ground Slot – The area representing the footprint of one TEU.
Unconstrained Economic Forecast – An economic forecast which assumes an "normal" economic environment. A normal economic environment would not include the effect of catastrophic events such as war, extreme effects of major weather events (draughts, famine), severe global recession, or similar occurrences.
Ultra Large Container Ship (ULCS) – The newest class of ships which began design in approximately 2001 and began construction in approximately 2006 and which are thought to be in the 12,000-TEU to 15,000-TEU range. These ships (or a sub-class of these ships) may also be called NPX Class, which would refer to ships capable of transiting the anticipated Panama Canal expansion. The exact size of the NPX ships is unknown at this time.
Wave Period – The time, generally expressed in seconds, it takes for a complete wave to pass a fixed point. Generally, the wave period measurement would be taken from the crest (highest point) of the first passing wave to the crest of the second passing wave.
Wharf – The wharf is the structure to which the ship is attached when at berth. It is designed specifically to accept the load created by a berthing vessel. When the wharf is aligned with the shore and connected to the shore along its full length, it is called a marginal wharf or perimeter wharf. A wharf can have more than one berth, allowing it to accommodate more than one ship at a time.
Wind Loading – The force of the wind on an object as the result of wind-induced pressure or suction. Wind loading is dependent upon the interrelationship of: wind velocity; air mass density; structural geometry including dimensions, stiffness, orientation, and location; and the surrounding ground surface conditions.