Privatising SOEs in Ireland Is it worth it? · Privatisation in Ireland to date Company Year Gov...
23
Privatising SOEs in Ireland – Is it worth it? Donal Palcic & Eoin Reeves Privatisation and PPP Research Group Department of Economics University of Limerick Ireland Presented to Irish Economy Conference February 1 st 2013
Transcript of Privatising SOEs in Ireland Is it worth it? · Privatisation in Ireland to date Company Year Gov...

Privatising SOEs in Ireland – Is it worth it?
Donal Palcic & Eoin Reeves
Privatisation and PPP Research Group
Department of Economics
University of Limerick
Ireland Presented to Irish Economy Conference February 1st 2013

Stock of SOEs in 2013
Energy
• Electricity Supply Board
• Bord Gais Éireann
• Bord na Mona (Energy)
• Coillte (Forestry)
Transport
• CIE (Rail and Bus)
• Dublin Airport Authority
• Ports (10)
• Irish Aviation Authority
Communications
• RTE (Broadcasting)
• An Post
Financial • National Asset Management Agency • Anglo Irish Bank • Educational Building Society • Irish Nationwide Building Society • Allied Irish Banks • Bank of Ireland (partial) • Irish Life & Permanent • Voluntary Health Insurance Other • Arramarra • Irish National Stud Coming on Stream Irish Water, Shannon Airport Authority

Development of Privatisation Agenda
• Driven by – (1) Domestic Policymakers and – (2) Troika.
• Review Group on State Assets and Liabilities (April 2011).
• MOUs and Initial uncertainty over: – Revenue target – now €3bn. – SOEs to be sold (partial sale of ESB!) – Use of proceeds

• Bord Gáis Energy.
• Some electricity generating capacity
• Remaining stake in Aer Lingus (25%)
• National Lottery
• Possible sale of Coillte (harvesting rights – not land).
For Sale 2013

Assessing Privatisation Plans 1: Vis-a-Vis the NewERA Plan
• Only detailed vision for SOE sector presented by trade unions.
• Adopted later (2009) by Fine Gael - NewERA Plan
• Involves:
– Using SOEs as vehicle for investment in infrastructure;
– Altering SOE governance structures;
– Some Privatisation.


Privatisation in Ireland to date
Company Year Gov Proceeds
(€m)
Method of
Sale
Greencore 1991-93 210.65 IPO + Place
Irish Life 1991-93 601.93 IPO + Place
B&I Line 1992 10.8 Trade Sale
Irish Steel 1995 0 Trade sale
Eircom 1999 6,399.907 IPO + T.Sale
ICC Bank Jan 2001 322.274 Trade Sale
TSB Bank April 2001 408.35 Trade Sale
INPC May 2001 20.0 Trade Sale
ACC Bank Dec 2001 154.6 Trade Sale
Aer Lingus Oct 2006 240.902m IPO
Total €8,369.4bn

Privatisation Objectives – 1. Performance/Efficiency
• Theoretical case not strong. Depends on competition
• Evidence is mixed.
• Pattern of improved performance before divestiture (static efficiency gains)
• Not always sustained after divestiture (dynamic efficiency)
• Factors such as product market competition and regulation generally more important determinants of performance

Other Objectives
2. Raising Revenue for the Exchequer – Objective is maximise proceeds (minimise costs)
– Costs include:
– Discounts
– Transaction Costs
– Debt write-offs
3. Widening Share Ownership/ Re-Distribution – Sell share to citizens, employees, customers
– Reduce trade union power

Irish experience: Performance / Efficiency
• 10 companies: pre- and post-privatisation data
available for:
– All 4 floated companies
– Irish Steel and ISPAT
– INPC and ConocoPhillips
– B&I and Irish Ferries
– 2 of the 3 state banks (no post-privatisation data for TSB)

Privatisation and Performance Example: Irish Sugar Authors’ calculation from annual report data
0.2
0.4
0.6
0.8
1
1.2
1.4
1.6
1984 1985 1986 1987 1988 1989 1990 1991 1992 1993 1994 1995 1996 1997 1998 1999
ROS ROA SEFF VAE
Privatised in April 1991

Privatisation and Productivity Example: Irish Sugar Authors’ calculation from various data sources
0.0
0.2
0.4
0.6
0.8
1.0
1.2
1.4
1.6
1984 1985 1986 1987 1988 1989 1990 1991 1992 1993 1994 1995 1996 1997 1998 1999
TFP LP

• Irish Life (IL&P 1999): Improvements before and after
• B&I Line (ICG): Marked improvement after
• 3 State Banks:
– ICC (BoSI): Improvements before and after
– ACC (Rabobank): Modest improvements after
– TSB (IL&P): Modest improvement before. No post-privatisation data
• Irish Steel (ISPAT): Privatised 1996. Closed 2001
• Aer Lingus and INPC: Volatile environments and erratic performance. No evidence of relationship between ownership and performance.
Performance / Efficiency (cont/d)
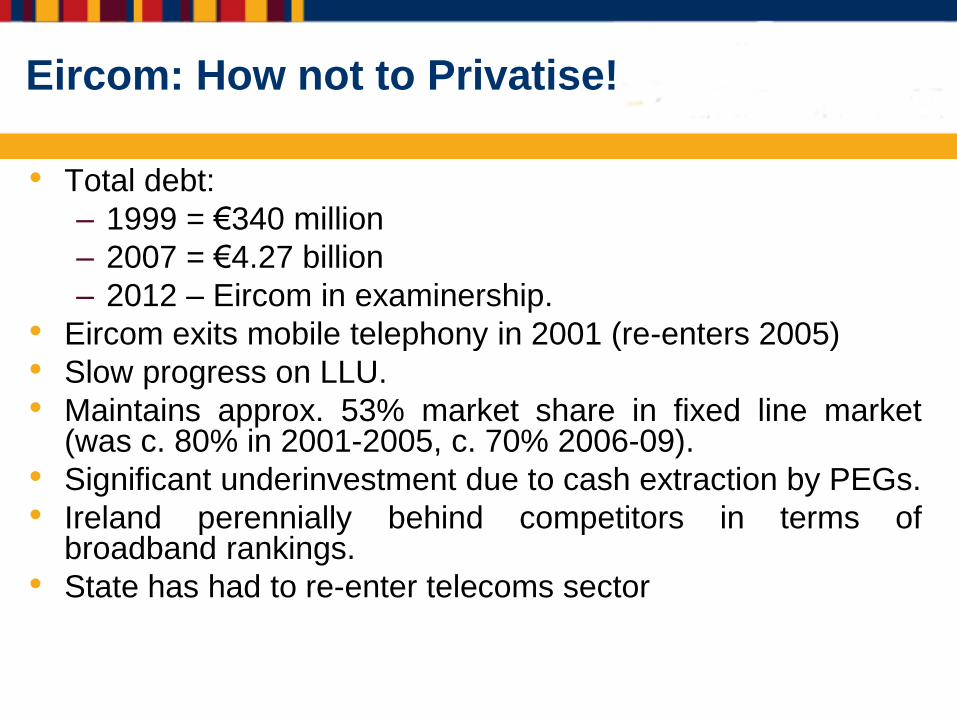
Eircom: How not to Privatise!
• Total debt:
– 1999 = €340 million
– 2007 = €4.27 billion
– 2012 – Eircom in examinership.
• Eircom exits mobile telephony in 2001 (re-enters 2005)
• Slow progress on LLU.
• Maintains approx. 53% market share in fixed line market (was c. 80% in 2001-2005, c. 70% 2006-09).
• Significant underinvestment due to cash extraction by PEGs.
• Ireland perennially behind competitors in terms of broadband rankings.
• State has had to re-enter telecoms sector

• In general, empirical evidence fails to confirm
simple hypothesis of improved performance after
privatisation
• Irish experience consistent with international
experience
– Eircom experience dominates
Overall conclusions on privatisation and
performance

• Revenues = €8.37 billion
• Revenues foregone?
– Biggest cost due to ESOPs - €1.01bn
– Share discounts (except Eircom) relatively low - €0.9bn
– All costs = €2.14bn
– Also, some debt write-offs questionable (e.g. B&I)
Privatisation and exchequer

• Winners and losers
• Shareholders: – Widening Share Ownership?
– Winners - Private Equity Groups
– Losers - Small shareholders
• Other Big Winners - Employees & ESOPs
Distributional issues

Company
Overall ESOP value (€m)
Per employee - Ex Ante
(€)
Per employee - Ex Post
(€)
Eircom 1,252.7 €105,333 €93,000
ACC 24.6 €50,000 same
ICC 52.0 €145,328 €88,900
TSB 64.1 €53,446 €76,000
INPC 8.9 €38,734 $83,000
Aer Lingus 173.7 €37,242 €15,000
Estimates of value of ESOPs to employees 2010

• A new era of privatisation inevitable.
• Conditionality means privatising to raise revenue
(not a good starting point).
• Most important consideration should be efficiency
(translating into lower prices etc.)
• Sales should be confined to SOEs in ‘competitive
markets’.
Conclusions

• Smart privatisation’ – state should retain
some control
• Ex ante analysis of individual sales should be
made before any final decision
• Development of privatisation policy in recent
months raises concerns
Conclusions

Company
Gross
Proceeds
Direct
Costs
(1)
Indirect
Costs
(2)
ESOPs
(3)
Total
1+2+3
Greencore 210.651 1.727 17.462 - 19.189
Irish Life 601.931 9.405 21.673 - 31.078
B&I 10.793 - 44.441 - 44.441
Irish Steel 0 0.656 47.328 - 47.984
Eircom 6,399.908 97.643 777.575 1,011.484 1,886.702
ICC 322.275 0.913 - 26.887 27.800
TSB 408.350 0.461 - 38.995 39.456
INPC 20.000 1.480 - - 1.480
ACC 154.603 1.159 - 12.385 13.544
Aer Lingus 240.902 6.000 26.282 - 32.282
Total 8,369.413 119.444 934.761 1,089.751 2,143.956
Note: Indirect costs include the cost of underpricing and debt write-offs.
Gross proceeds and total costs
(€millions)

Greek bailout(s)
• Greece – August 2010
– Dec 2010: target of €7bn.
– Feb 2011: €15bn by 2015 (incl. real estate)
• New deal in July 2011:
– Target of €5 billion by 2011,
– €15bn by 2012,
– €50bn by 2015 (22% of 2011 GDP)!
• Target has been continually revised downwards due to delays – EC recently forecast €8.5bn in sales by 2016

Portuguese bailout
• Portugal – MOU signed in May 2011
– Accelerate existing plans for sales - €5bn
– Full (not partial) divestiture of electricity SOEs
– Others in rail, airports, airlines, post, insurance.
– Portugal exceeded target for sales in December 2012 when it sold airports operator for €3bn