Private Network EDI vs. Internet Electronic Markets
43
i Private Network EDI vs. Internet Electronic Markets: A Direct Comparison of Fulfillment Performance Yuliang Yao a *, Jonathan Palmer b , and Martin Dresner c a College of Business & Economics, Lehigh University b College of Business, College of William and Mary c Robert H. Smith School of Business, University of Maryland ABSTRACT Prior literature has documented the performance benefits from the use of electronic data interchange (EDI) and the Internet. Little research, however, has provided a direct comparison between the performance of the two systems. Using purchase and fulfillment records gathered from the U.S. government’s Federal Supply Service, a direct comparison of performance is provided between a private network EDI channel and an Internet electronic market. Performance is measured using order cycle time and complete orders fulfilled. Our findings show that the Internet-based electronic market performs superior to the EDI-based channel. Order cycle times were significantly lower when using the Internet-based channel, while the percentage of complete shipments was significantly higher after controlling for product, transaction, seller, and buyer specific factors. Since EDI is still prevalent in many industries, these results point to the gains that may be realized by switching to the newer technology. Key Words: Interorganizational Information System, Electronic Markets, Supply Chain Performance; Electronic Data Interchange; Internet * Corresponding Author. Address: 621 Taylor Street, Bethlehem, PA 18015. Email: [email protected] , Tel: (610) 758-6726
Transcript of Private Network EDI vs. Internet Electronic Markets

i
Private Network EDI vs. Internet Electronic Markets: A Direct Comparison
of Fulfillment Performance
Yuliang Yao a*, Jonathan Palmer
b, and Martin Dresner
c
a College of Business & Economics, Lehigh University
b College of Business, College of William and Mary
c Robert H. Smith School of Business, University of Maryland
ABSTRACT
Prior literature has documented the performance benefits from the use of electronic data
interchange (EDI) and the Internet. Little research, however, has provided a direct comparison
between the performance of the two systems. Using purchase and fulfillment records gathered
from the U.S. government’s Federal Supply Service, a direct comparison of performance is
provided between a private network EDI channel and an Internet electronic market. Performance
is measured using order cycle time and complete orders fulfilled. Our findings show that the
Internet-based electronic market performs superior to the EDI-based channel. Order cycle times
were significantly lower when using the Internet-based channel, while the percentage of
complete shipments was significantly higher after controlling for product, transaction, seller, and
buyer specific factors. Since EDI is still prevalent in many industries, these results point to the
gains that may be realized by switching to the newer technology.
Key Words: Interorganizational Information System, Electronic Markets, Supply Chain
Performance; Electronic Data Interchange; Internet
* Corresponding Author. Address: 621 Taylor Street, Bethlehem, PA 18015.
Email: [email protected], Tel: (610) 758-6726

1
Private Network EDI vs. Internet Electronic Markets:
A Direct Comparison of Fulfillment Performance
1. Introduction
Over the past decade, there has been considerable research documenting the performance
benefits from the use of electronic data interchange (EDI) (e.g., Srinivasan et al. 1994;
Mukhopadhyay et al. 1995; Lee et al. 1999; Mukhopadhyay and Kekre 2002). These benefits
include reduced shipment errors, higher inventory turnover, and reduced stockouts. More recent
work on Internet-based electronic markets has also uncovered performance improvements in
terms of lower cost of goods sold and higher inventory turnover (e.g., Zhu and Kraemer 2002).
However, there is little research that provides a direct comparison between the performance of
the two systems.
As organizations decide whether to maintain well-established private network EDI
systems, or switch to Internet-based electronic markets, it is helpful for managers to know what
benefits may be expected from switching from EDI to Internet-based electronic markets.
Although the Internet is perceived to be a superior technology (e.g., lower implementation and
operating costs, better search capabilities), firms in many industries have not reached a
consensus on migrating from EDI to the Internet, thereby maintaining EDI-based networks
(Mount 2003). As outlined by Kauffman and Mohtadi (2004), “…it is highly surprising that
despite the overwhelming evidence of the advantages of e-procurement systems, proprietary
systems such as electronic data interchange (EDI) continue to persist…”. The decision to keep
EDI systems may be due to uncertainties over potential benefits from Internet-based systems.
Although both private network EDI and electronic markets provide communication and
transaction links between organizations, a growing body of literature has documented that the

2
two types of systems can be quite different (Bakos 1991a; Bakos 1997; Choudhury 1997;
Choudhury et al. 1998; Zhu 2004; Zhu and Kraemer 2005) (Detailed descriptions of the two
systems are provided in section 2.1). In this research, we develop and test a model that directly
compares the fulfillment performances of an Internet electronic market, an EDI transaction
system, and a traditional paper-based system, using data on approximately three million
transactions by U.S. federal government purchasers through the U.S. Federal Supply Service
(FSS). Fulfillment performance is measured by order cycle time and the percentage of complete
orders fulfilled.
The FSS provides an excellent setting for this research for a number of reasons. First, the
FSS offers both a private network EDI-based transaction system and an Internet-based electronic
market, as well as a traditional paper-based system. The provision of three parallel transaction
systems allows us to evaluate the performance differences among the three systems. Since all
three systems are operated within the same context, this renders better control over other factors
that could affect system performance, thereby minimizing potential confounding environmental
effects. Second, the richness of the source data enables us to comprehensively track and estimate
our models using purchase data from a diverse set of product categories for improved
generalizability. Finally, the FSS data allow us to assess transaction-based performance
outcomes, thus providing complementary empirical evidence to studies that have used survey
methods.
Our main empirical finding is that the FSS’s Internet-based system is superior to its EDI
counterpart on our two performance measures. We believe that this performance gap can be
attributed in large part to the information discovery capabilities of the Internet system, lacking in
EDI linkages. Since EDI channels are more prevalent than Internet-based electronic markets in
3
some industries, these results point to the gains that may be realized by updating communication
and transaction technologies that support product search, vendor comparison, electronic
information discovery, and electronic transaction processing, all available with Internet-based
electronic markets.
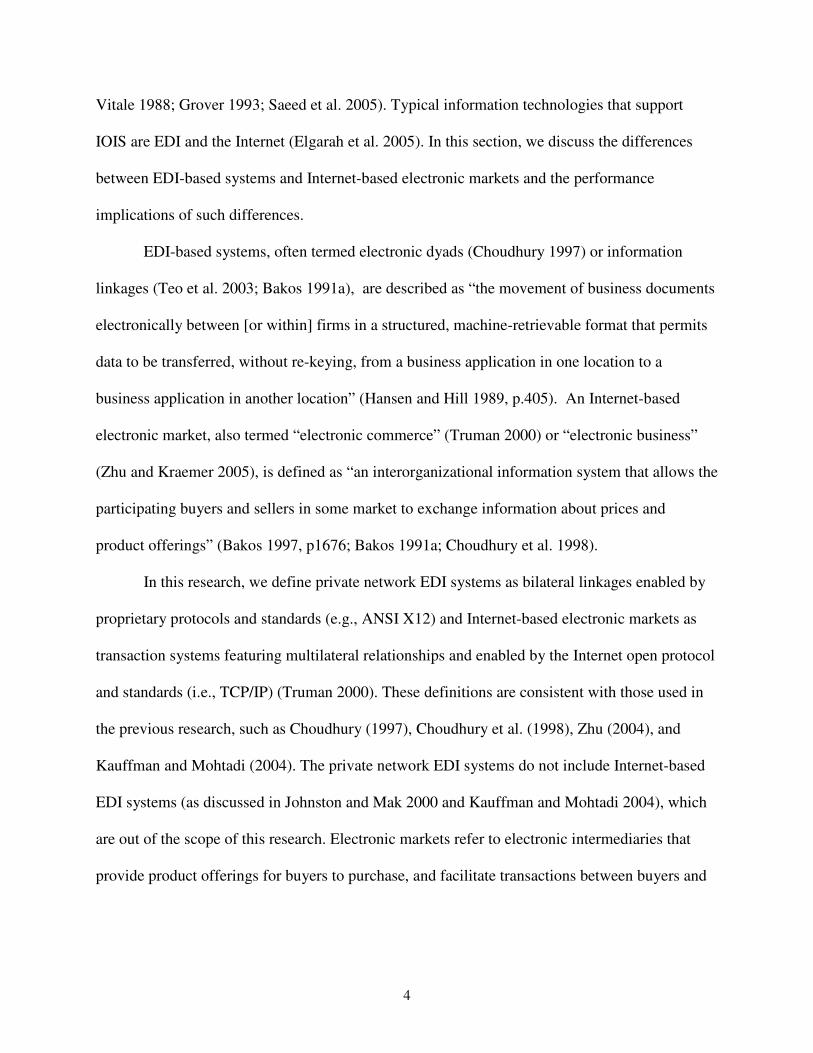
We believe that this paper makes important theoretical and empirical contributions.
From a theoretical perspective, the paper synthesizes findings from previous literature to provide
a rationale for potential performance differences between Internet-based electronic markets and
private network based EDI systems. On the empirical side, this paper is the first attempt to
directly compare performance benefits between a private network EDI system and an electronic
market. As such, our research responds to the call of Mukhopadhyay and Kekre (2002) for more
research on new technologies such as the Internet.
The rest of the paper is structured as follows: Section 2 presents theoretical perspectives
and reviews relevant literature related to the use of EDI and the Internet. Section 3 develops our
research model and our hypotheses. Section 4 describes the procurement processes of the FSS.
Section 5 details the research methodology. Section 6 presents the empirical results and
robustness checks. Section 7 discusses the findings and implications. Finally, Section 8 presents
our conclusions, discusses research limitations, and outlines the potential for future research.
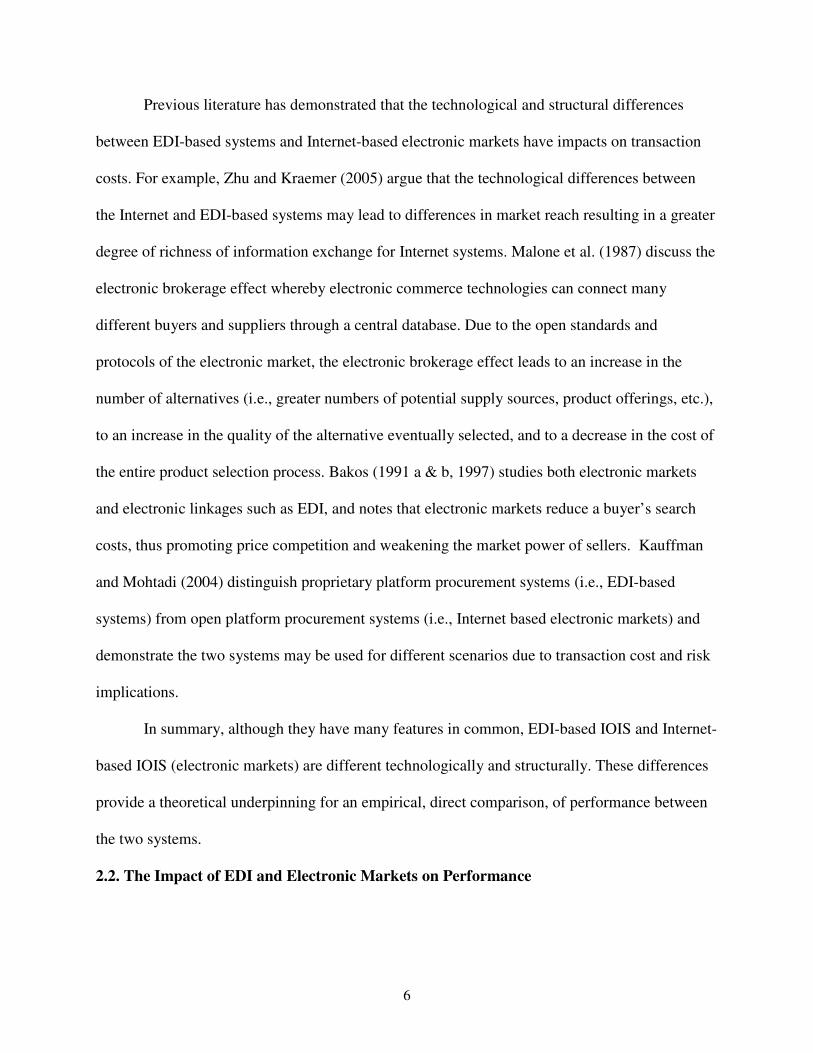
2. Theoretical Perspective and Literature Review
2.1 EDI vs. Electronic Markets
Both EDI linkages and electronic markets are forms of interorganizational information
systems (IOIS). An IOIS is defined as “an automated information system shared by two or more
companies” (Cash and Konsynski 1985), and “is built around information technology that
facilitates the creation, storage, transformation and transmission of information” (Johnston and
4
Vitale 1988; Grover 1993; Saeed et al. 2005). Typical information technologies that support
IOIS are EDI and the Internet (Elgarah et al. 2005). In this section, we discuss the differences
between EDI-based systems and Internet-based electronic markets and the performance
implications of such differences.
EDI-based systems, often termed electronic dyads (Choudhury 1997) or information
linkages (Teo et al. 2003; Bakos 1991a), are described as “the movement of business documents
electronically between [or within] firms in a structured, machine-retrievable format that permits
data to be transferred, without re-keying, from a business application in one location to a
business application in another location” (Hansen and Hill 1989, p.405). An Internet-based
electronic market, also termed “electronic commerce” (Truman 2000) or “electronic business”
(Zhu and Kraemer 2005), is defined as “an interorganizational information system that allows the
participating buyers and sellers in some market to exchange information about prices and
product offerings” (Bakos 1997, p1676; Bakos 1991a; Choudhury et al. 1998).
In this research, we define private network EDI systems as bilateral linkages enabled by
proprietary protocols and standards (e.g., ANSI X12) and Internet-based electronic markets as
transaction systems featuring multilateral relationships and enabled by the Internet open protocol
and standards (i.e., TCP/IP) (Truman 2000). These definitions are consistent with those used in
the previous research, such as Choudhury (1997), Choudhury et al. (1998), Zhu (2004), and
Kauffman and Mohtadi (2004). The private network EDI systems do not include Internet-based
EDI systems (as discussed in Johnston and Mak 2000 and Kauffman and Mohtadi 2004), which
are out of the scope of this research. Electronic markets refer to electronic intermediaries that
provide product offerings for buyers to purchase, and facilitate transactions between buyers and

5
suppliers (Bakos 1991a; Bakos 1997; Choudhury et al. 1998).1 We limit the research scope to
transaction activities conducted using these systems, recognizing EDI or the Internet may also be
used for other activities, such as collaboration (e.g., information sharing, vendor-managed
inventory, etc.). For the rest of the paper, unless specifically noted, EDI refers to private network
EDI and electronic markets refers to Internet-based electronic markets.
While these two systems have features in common, such as the electronic communication
effect (Malone et al. 1987), EDI-based systems and Internet-based electronic markets also
exhibit differences from both technological and structural perspectives. From a technological
perspective, the Internet is characterized by an open standard, a public network, and by broad
connectivity (both front end and back end), whereas EDI is a system of proprietary standards, a
private network with back end integration (Zhu and Kramer 2005; Johnston and Mak 2000).
From a structural perspective, the Internet-based electronic market is characterized as a
multilateral IOIS that enables a many-to-many or a one-to-many set of relationships (Johnston
and Mak 2000; Choudhury et al. 1998), whereas EDI-based bilateral links establish “individual
electronic links with each of a select set of trading partners” (i.e., a one-to-one type of
relationship) (Choudhury 1997; Choudhury et al. 1998). Multilateral electronic markets feature
the electronic brokerage effect (Malone et al. 1987) that facilitates comparisons among multiple
sellers with respect to prices, product quality, product availability, or on a number of other
factors (Choudury et al. 1998). On the other hand, bilateral EDI systems feature the electronic
integration effect (Malone et al. 1987) that facilitates interfirm coordination leading to
improvement in the efficiency of gathering and communicating information, including
information sharing, inventory control, and process monitoring (Bakos 1991a).
1 We do not consider electronic markets involving auctions or reverse auctions (Anandalingam et al. 2005).
6
Previous literature has demonstrated that the technological and structural differences
between EDI-based systems and Internet-based electronic markets have impacts on transaction
costs. For example, Zhu and Kraemer (2005) argue that the technological differences between
the Internet and EDI-based systems may lead to differences in market reach resulting in a greater
degree of richness of information exchange for Internet systems. Malone et al. (1987) discuss the
electronic brokerage effect whereby electronic commerce technologies can connect many
different buyers and suppliers through a central database. Due to the open standards and
protocols of the electronic market, the electronic brokerage effect leads to an increase in the
number of alternatives (i.e., greater numbers of potential supply sources, product offerings, etc.),
to an increase in the quality of the alternative eventually selected, and to a decrease in the cost of
the entire product selection process. Bakos (1991 a & b, 1997) studies both electronic markets
and electronic linkages such as EDI, and notes that electronic markets reduce a buyer’s search
costs, thus promoting price competition and weakening the market power of sellers. Kauffman
and Mohtadi (2004) distinguish proprietary platform procurement systems (i.e., EDI-based
systems) from open platform procurement systems (i.e., Internet based electronic markets) and
demonstrate the two systems may be used for different scenarios due to transaction cost and risk
implications.
In summary, although they have many features in common, EDI-based IOIS and Internet-
based IOIS (electronic markets) are different technologically and structurally. These differences
provide a theoretical underpinning for an empirical, direct comparison, of performance between
the two systems.
2.2. The Impact of EDI and Electronic Markets on Performance

7
Most of the research on how interorganizational information systems affect performance
has focused on the use of EDI. In a field study of the logistics operations of Chrylser assembly
centers, Srinivasan et al. (1994) find that EDI substantially facilitates the implementation of just-
in-time (JIT) shipments leading to significantly lower shipment errors. A subsequent study
(Mukhopadhyay et al. 1995) finds that the savings accruing to Chrysler through the use of EDI
amounted to over $100 per vehicle. EDI use contributes to higher inventory turnover, lower
obsolescence costs, and lower transportation costs. Lee et al. (1999) examine the use of EDI in
conjunction with a continuous replenishment program at the Campbell Soup Company and a
number of its retail customers. They find that EDI provides benefits in terms of lower inventory
levels and reduced stockouts, not only to the EDI “champion”, but also to other firms in the
supply chain. They attribute improved performance, in part, to greater “vertical information
integration”. Mukhopadhyay and Kekre (2002) show that EDI-enabled B2B procurement
processes bring not only strategic, but also operational benefits to suppliers and customers. The
magnitude of the benefits depends on how EDI-based systems are established between suppliers
and customers. For example, the supplier derives large strategic benefits when the customer
initiates the system and the supplier enhances its capability.
Other research in the operations management and supply chain fields supports the
benefits from the use of EDI. Ahmad and Schroeder (2001) study the impact of EDI on delivery
performance and find that the extent of EDI use significantly improves delivery performance,
after controlling for contextual factors. Crum et al. (1998) survey trucking companies and find
both operational benefits (e.g., increased accuracy, improved communication) and strategic
benefits (e.g., the ability to gain or retain competitive advantage) from using EDI. Dröge and
Germain (2000) survey members of a logistics professional organization and find EDI use to be
8
positively associated with both inventory and financial performance, net of any impact due to the
use of JIT. Finally, a survey of suppliers to Australian automotive manufacturers (Mackay and
Rosier 1994) shows relationships between EDI use and improved productivity, including lower
clerical staffing levels, improve data accuracy and customer service, and lower administrative
costs.
More recent studies have examined the impact of electronic markets on performance.
Zhu and Kraemer (2002) find that firms that use Internet technologies are more likely to be agile
and capable of competing in dynamic markets than are firms without these capabilities. Zhu
(2004) finds that electronic commerce capabilities and information technology infrastructure
both are positively related to firm performance in terms of sales per employee, inventory
turnover, and cost reduction. Choudhury et al. (1998) study the aircraft parts industry and find
inventory levels are unaffected by the use of electronic markets, although there are some
improvements in identifying parts and reducing aircraft downtime.
In summary, a number of studies show linkages between the use of electronic transaction
systems, including EDI and Internet-based electronic markets, and improved performance.
However, none of these studies provide a direct comparison between the performance impacts of
Internet-based electronic markets and EDI-based transaction systems. Based on the different
characteristics of the two systems, as outlined above, performance could vary substantially.
2.3. Measures of Fulfillment Performance
There have been a number of methods used to measure the performance of EDI or
Internet- based electronic markets. These measures include reduction in cost (e.g.,
Mukhopadhyay et al. 1995; Zhu and Kraemer 2002), reduction in inventory (e.g., Choudhury et
al. 1998; Zhu and Kraemer 2002), reduction in data entry errors (e.g., Dearing 1990),
9
improvement in supplier-buyer relationships (Dearing 1990; Subramani 2004), responsiveness to
customer needs (e.g., Ahmad and Schroeder 2001), and improvement in delivery quality (e.g.,
Srinivansan et al. 1994; Ahmad and Schroeder 2001).
For this paper, we assess performance based on the fulfillment levels of the EDI and
Internet-based IOIS. Fulfillment performance is an essential metric given the shift from product-
centric, firm-specific management models to customer-centric, supply chain management
(Kalakota and Robinson 2003). Improved fulfillment performance enhances customer
satisfaction, hopefully leading to improved financial performance. In particular, we evaluate an
organization’s fulfillment performance using two variables: order cycle time and complete orders
fulfilled. In addition, we calculate the percentage of units short-shipped, a dimension of complete
orders fulfilled, and use this measure to augment our analysis. (Detailed definitions of these
variables are provided in Section 4.2).
The use of Internet-based electronic markets and EDI-based systems may result in
significantly different performance levels due to their technological and structural differences as
discussed in Section 2.1. In the next section, we develop a research model that links the
differences in these two systems to fulfillment performance, and hypothesize the impacts of the
two systems on performance.
3. Hypotheses Development
The process of purchasing a product can include several stages, from problem
recognition, to information search, to the evaluation of alternatives, to the actual purchase
transaction, and finally, to post-purchase fulfillment (Engel and Kollat 1978; Kolter 2002). In
general, the pre-purchase period involves a process of information discovery leading to the
purchase decision. This is a period when the buyer searches for product alternatives, compares
10
the offerings, and negotiates for the desired products from among suppliers. Once a purchase
decision has been made and communicated to the supplier, the actual transaction processing
takes place and the order is fulfilled. Transaction processing is when the transaction is executed
by the exchange of appropriate documents, and remittances are made from buyer to supplier.
Finally, the post-purchase period includes, potentially, a number of activities encompassing
production, order picking, and transportation. The fulfillment performance, in terms of both
complete orders filled and order cycle time, is generally measured after this last stage in the
purchase process and can depend on the performance of the supplier at all three stages of the
ordering process. For example cycle time can be reduced and/or the number of complete orders
shipped can be increased if the supplier does the following: provides real time and accurate
inventory information to potential buyers (pre-purchase period); expedites purchase orders and
confirmation through electronic means (transaction period); and uses expedited transportation
carriers (post-transaction period).
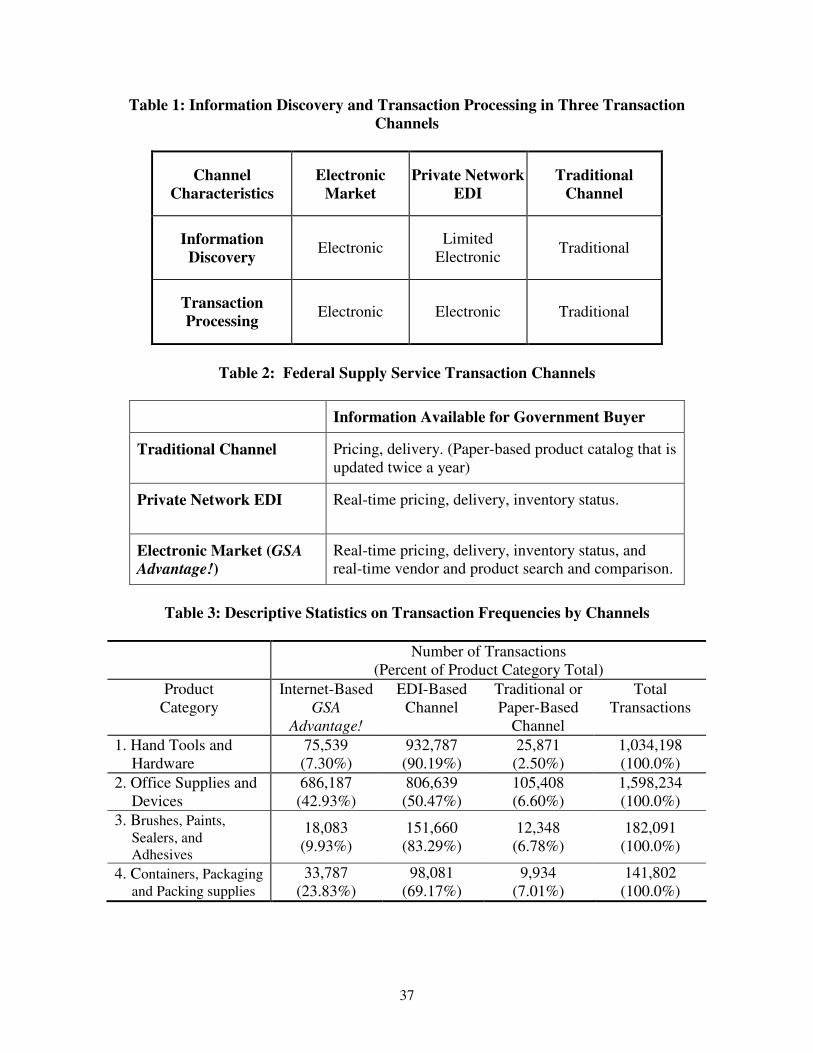
We use the concepts of information discovery (Barua et al. 2004) and transaction
processing (Mukhopadhyay and Kekre 2002) to distinguish between three potential transaction
channels. Information discovery and transaction processing can be conducted through either
electronic means or traditional means (paper-based). Traditional transaction channels, such as
telephone, fax, personal sales calls, etc., are characterized as having both traditional, paper-based
(i.e., non-electronic) information discovery and transaction processing characteristics. Although
these channels do make use of technologies (e.g., fax machines), the technologies do not allow
for direct integration between the buyer’s and seller’s information systems, nor do they allow for
rapid electronic search capabilities. Electronic markets, on the other hand, allow for both
electronic search capabilities and electronic transaction processing (Baura et al. 2004; Zhu and

11
Kraemer 2005; Bakos 1991a; Bakos 1997; Choudhury et al. 1998). Finally, private network EDI
systems typically allow for electronic transaction processing through their document exchange
properties (such as purchase orders, shipping notices, invoices, fund transfers, etc.), but have
only limited electronic information discovery capabilities. For example, with an EDI system, a
buyer may be able to query a supplier as to inventory status, but there may be limited capabilities
to query and compare the status of multiple vendors. Table 1 summarizes the characteristics of
the three communication and transaction channels in terms of information discovery and
transaction processing.
<<Insert Table 1 about here>>
Empirical research has shown that the use of technology with information discovery
capabilities and electronic transaction processing can lead to better supply chain outcomes for
the buyer in terms of lower prices, higher levels of availability, and lower cycle times (Barua and
Lee 1997, Riggins and Mukhopadhyay 1994, Wang and Seidmann 1995). The use of the
technology allows buyers to search more quickly, conveniently, and widely for various purchase
options. If purchasers can obtain real-time data on inventory availability, they can purchase from
sellers that have inventory in stock, thus avoiding short-shipments and delivery delays. In
addition, the use of technology for transaction processing can reduce order cycle times, in that
this technology removes much of the potential for human delays in document processing.
Since both EDI and the Internet-based electronic markets have electronic-based
transaction processing, they should both reduce order cycle time compared to paper-based
systems. Both systems, too, may contribute to greater percentages of complete orders fulfilled.
The Internet with its advanced information discovery systems should allow buyers to search for
suppliers with available inventory. EDI, with more rudimentary electronic information

12
discovery characteristics (e.g., inventory queries) should also result in better order fulfillment
compared to paper-based systems. Therefore, our first two hypotheses are as follows:
H1: The use of EDI transaction systems or Internet-based electronic markets will result in
shorter order cycle times, compared to the use of traditional, paper-based transaction
systems.
H2: The use of EDI transaction systems or Internet-based electronic markets will result in a
higher percentage of complete orders fulfilled, compared to the use of traditional, paper-
based transaction systems.
As discussed above, private network EDI and Internet systems are technically and
structurally different. The implication of these differences is that electronic markets feature the
capability for simultaneous search so that a buyer can compare real-time product offerings from
multiple potential vendors at the same time (on a single webpage, for example). EDI-based
transaction systems, on the other hand, do not offer such capability. If a buyer needs to search for
products or vendors, the buyer has to place a number of request-for-quotes (RFQs)2 to a set of
potential vendors and compare their responses. In contrast to the simultaneous search capabilities
of the Internet, this process may be viewed as a sequential search procedure. The simultaneous
search capabilities offered by electronic markets can greatly reduce buyer search costs (Smith
and Brynjolfsson 2001; Smith 2002). As Malone et al. (1987) state, “[t]he standards and
protocols of the electronic markets allow a buyer to screen out obviously inappropriate suppliers,
and to compare the offerings of many different potential supplier quickly, conveniently, and
inexpensively.”
2 An EDI standard transaction set (840) containing information needed by a vendor to perform a request for price and availability quote for a product or service.

13
As a result, electronic markets typically allow greater search capabilities than those
provided in private network EDI systems, a notion also noted in previous literature (Barua et al.
2004; Choudhury et al. 1998; Zhu and Kraemer 2002; Zhu 2004). Greater search capabilities
allow purchasers to more readily locate appropriate products and suppliers, thus reducing order
cycle times and improving product availability. For example, a buyer is able to choose a product
in stock (as opposed to a product that must be back ordered), that can be delivered within 3-5
days (as opposed to a competing vendor that offers 5-7 day delivery, for example). Therefore, we
expect that electronic markets to outperform EDI-based systems. Our next two hypotheses are as
follows:
H3: The performance results, with respect to order cycle times, should be superior for Internet-
based electronic markets as compared to EDI-based transaction systems.
H4: The performance results, with respect to complete orders fulfilled, should be superior for
Internet-based electronic markets as compared to EDI-based transaction systems.
In summary, we propose that both EDI-based systems and Internet-based electronic
markets should reduce order cycle times and improve performance with respect to orders
fulfilled and short-shipments compared to traditional transaction systems. However, the
improvements should be greater for electronic markets, due to better information discovery
technology. A direct comparison between the performance of an EDI system and an electronic
market will be made, using data gathered from the Federal Supply Service.
3. The Federal Supply Service Procurement Process
The U.S. federal government is one of the largest (if not the largest) procurer of goods in
the world. A core component of the U.S. federal government’s supply chain is the Federal
Supply Service of the General Services Administration, which acts as an intermediary in the

14
chain. The FSS is designed to bring purchasers from a large number of government agencies
together with a variety of product providers. Both buyers and sellers are certified by the United
States government. Buyers are identified as authorized to purchase for a specific agency.
Vendors must meet a rigorous set of standards to qualify for inclusion in the General Services
Administration’s Supply Business or on the Federal Supply Schedules, and thus be certified as
vendors for products that can be purchased by FSS users.
The FSS provides government buyers with access to over four million products and
services. The FSS system includes three identifiable channels for placing orders: paper forms;
government developed electronic data interchange systems using the ANSI X12 standard; and
the Internet-based GSA Advantage! system. All terms and conditions that apply to paper-based
orders apply, as well, to both of the electronic channel formats. All government users (certified
buyers) have all three channels available to them and all vendors (certified sellers) are required
to support all three channels. A key difference across the channels is the product and vendor
information available to buyers. As shown in Table 2, the traditional paper forms offer the least
amount of information, the EDI systems additional information, including inventory availability
for individual vendors; and GSA Advantage! the greatest quantity and most timely information,
including real-time information on multiple vendors.
<<Insert Table 2 about here>>
The availability of a search engine on GSA Advantage! facilitates simultaneous product
and vendor searches and comparisons. No comparable capability is available through the private
network EDI system (although a certified user may search sequentially, as discussed earlier).
Therefore, while both the EDI and the Internet-based electronic markets provide electronic
transaction processing, the Internet-based channel provides greater technology-based information
15
discovery characteristics. The question this paper addresses is whether these advanced
capabilities result in performance benefits to users.
4. Research Methodology
4.1 Data
Data were collected from the FSS. The data are the FSS’s transaction and fulfillment
records of goods shipped during fiscal year 2000. The source data consist of 3.7 million records,
each record corresponding to one purchase order and fulfillment. Given the size of the database
and the diversity of products in the dataset, we only include those product categories with over
100,000 transactions a year in our main analysis. This criterion yields four product categories as
defined by the FSS. They are: hand tools and hardware (category 1); office supplies and devices
(category 2), brushes, paints, sealers, and adhesives (category 3), and containers, packaging and
packing supplies (category 4). Across these product categories, there were 2,960,776 transactions
in sum, accounting for 80% of total records. Of these records, 4,451 were eliminated because of
likely entry errors or missing data. Specifically, 460 records were eliminated because the
shipping date was earlier than the order date; 3,424 records were eliminated because of
incomplete product identifiers, and 567 records were eliminated because of non-positive
transaction prices. Finally, 2,956,325 records remained.
Table 3 presents descriptive statistics on transaction frequency by transaction channel and
by product category. For example, the table shows that for office supplies and devices, 686,187
or 42.93% of the transactions were made using the Internet-based GSA Advantage! channel,
806,639 or 50.47% of the transactions were conducted using the EDI-based channel, and
105,408 or 6.60% of the transactions were made through the traditional, paper-based channel.
All product categories have a substantial number of transactions with each channel, with the
16
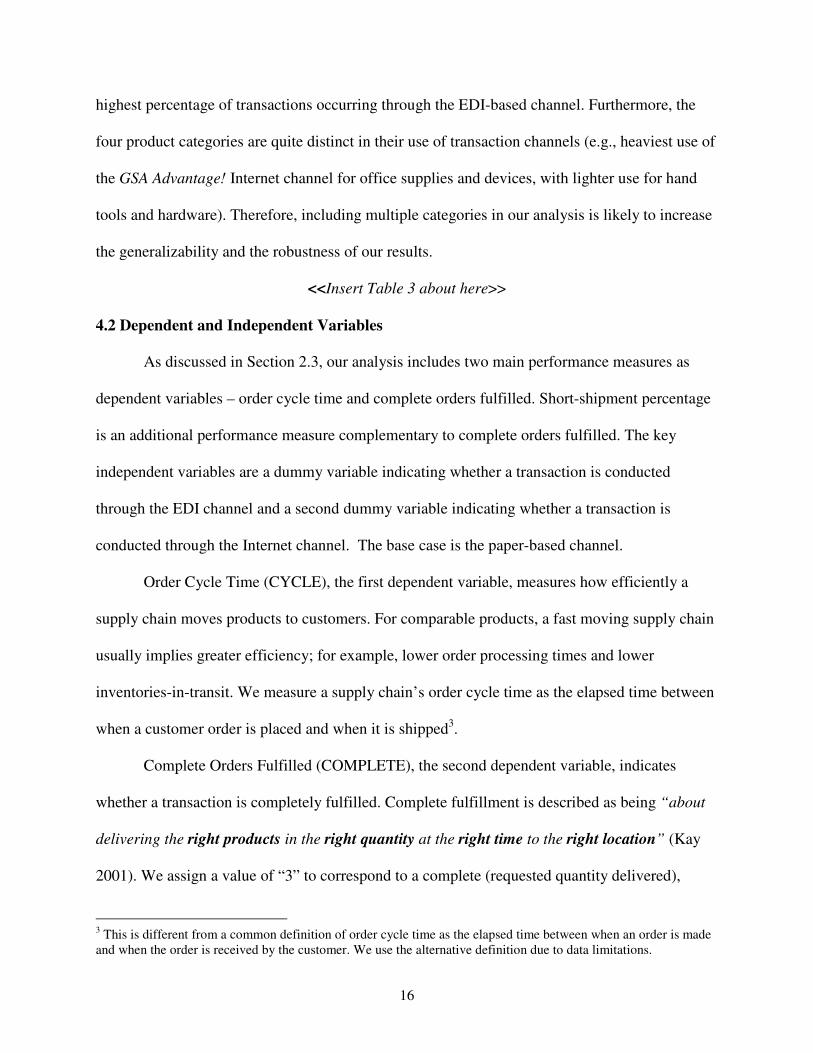
highest percentage of transactions occurring through the EDI-based channel. Furthermore, the
four product categories are quite distinct in their use of transaction channels (e.g., heaviest use of
the GSA Advantage! Internet channel for office supplies and devices, with lighter use for hand
tools and hardware). Therefore, including multiple categories in our analysis is likely to increase
the generalizability and the robustness of our results.
<<Insert Table 3 about here>>
4.2 Dependent and Independent Variables
As discussed in Section 2.3, our analysis includes two main performance measures as
dependent variables – order cycle time and complete orders fulfilled. Short-shipment percentage
is an additional performance measure complementary to complete orders fulfilled. The key
independent variables are a dummy variable indicating whether a transaction is conducted
through the EDI channel and a second dummy variable indicating whether a transaction is
conducted through the Internet channel. The base case is the paper-based channel.
Order Cycle Time (CYCLE), the first dependent variable, measures how efficiently a
supply chain moves products to customers. For comparable products, a fast moving supply chain
usually implies greater efficiency; for example, lower order processing times and lower
inventories-in-transit. We measure a supply chain’s order cycle time as the elapsed time between
when a customer order is placed and when it is shipped3.
Complete Orders Fulfilled (COMPLETE), the second dependent variable, indicates
whether a transaction is completely fulfilled. Complete fulfillment is described as being “about
delivering the right products in the right quantity at the right time to the right location” (Kay
2001). We assign a value of “3” to correspond to a complete (requested quantity delivered),
3 This is different from a common definition of order cycle time as the elapsed time between when an order is made and when the order is received by the customer. We use the alternative definition due to data limitations.

17
correct (no substitute products shipped), and on-time (no units backordered) order. A “2” is
assigned to an order with any two of the three requirements fulfilled, a “1” to an order with only
one of three requirements fulfilled, and a “0” to orders with none of the requirements. For
simplicity, we call this variable COMPLETE, although, as indicated above, the variable
encompasses the correct and on-time shipment of products, as well as the complete (requested
quantity) shipment. Figure 1 visually presents how the variable is defined. If an order is fulfilled
without any part of the order backordered, it is given a “1” in the “right time” dimension; if an
order is fulfilled with the requested quantity, it is given a “1” in the “right quantity” dimension;
and if an order is fulfilled with the product requested (as opposed to a substitute product), it is
given a “1” in the “right product” dimension. When the order fulfillment status is at point (1, 1,
1), the order is fulfilled in a complete, correct, and on-time manner and the variable is coded 3.
When the order fulfillment status is at point (1, 0, 1), (1, 1, 0), or (0, 1, 1), the order is partially
fulfilled and the variable is coded 2. An order fulfillment status at any of the points (0, 0, 1), (0,
1, 0), or (1, 0, 0), implies a partially fulfilled order with a variable coding of 1. Finally, when the
order fulfillment status is at the point (0, 0, 0), the order is coded 0.
Short Shipment Percentage (SHORT), a dependent variable used to complement
COMPLETE, is a continuous variable that measures the “right quantity” dimension of order
fulfillment with greater granularity. It is calculated as the percentage of units in a customer’s
order that are out of stock, and thereby short-shipped. Results from estimating SHORT are used
to complement and supplement the regression results from estimating COMPLETE.
We use two dummy variables to measure our key independent variables representing the
FSS’s EDI and Internet transaction channels. (The base case is the paper-based transaction
channel.) As outlined above, government purchasers can procure products through three
18
different channels – a traditional, paper-based channel, an EDI channel, and an electronic market
channel, GSA Advantage!. If the purchase was conducted through EDI, then the EDI channel
dummy (EDI) is coded 1 and the Internet channel is coded 0. If the purchase was conducted
through GSA Advantage!, then the Internet channel (INTERNET) is coded 1 and the EDI
channel is coded 0. If the purchase was conducted through the traditional, paper-based channel,
then both of the dummy variables are coded 0.
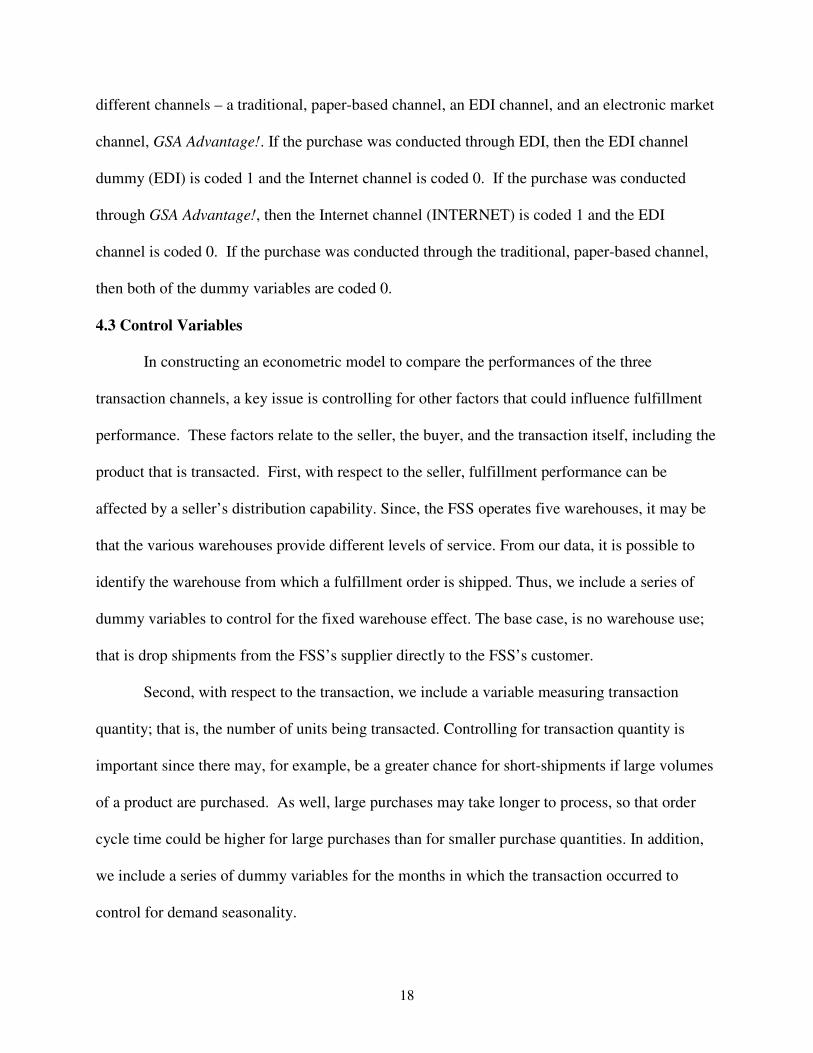
4.3 Control Variables
In constructing an econometric model to compare the performances of the three
transaction channels, a key issue is controlling for other factors that could influence fulfillment
performance. These factors relate to the seller, the buyer, and the transaction itself, including the
product that is transacted. First, with respect to the seller, fulfillment performance can be
affected by a seller’s distribution capability. Since, the FSS operates five warehouses, it may be
that the various warehouses provide different levels of service. From our data, it is possible to
identify the warehouse from which a fulfillment order is shipped. Thus, we include a series of
dummy variables to control for the fixed warehouse effect. The base case, is no warehouse use;
that is drop shipments from the FSS’s supplier directly to the FSS’s customer.
Second, with respect to the transaction, we include a variable measuring transaction
quantity; that is, the number of units being transacted. Controlling for transaction quantity is
important since there may, for example, be a greater chance for short-shipments if large volumes
of a product are purchased. As well, large purchases may take longer to process, so that order
cycle time could be higher for large purchases than for smaller purchase quantities. In addition,
we include a series of dummy variables for the months in which the transaction occurred to
control for demand seasonality.

19
Third, we have variables to control for the product being purchased. In particular,
product price and item transaction frequency are included to control for the potential differences
in inventory management practices for high and low-value items and for frequently and
infrequently purchased products. For example, firms may minimize inventory levels for high
value products to hold down inventory holding costs. As a result, high value products may have
lower fulfillment rates and longer cycle times than low value products, ceteris paribus . As well,
the FSS may stock proportionally higher inventory levels for frequently transacted items,
resulting in better fulfillment performance. If the FSS does not adopt this policy, frequently
transacted items may be associated with lower fulfillment performance. Furthermore, since our
data include multiple product categories, a series of dummy variables to control for potential
differences between product categories is included. For example, office supplies may be given a
lower fulfillment priority than hand tools.
Finally, we control for potential heterogeneity among buyers by including a variable
measuring a buyer’s annual transaction volume. Larger total purchase volume may indicate a
buyer with, potentially, greater financial resources. In addition, this variable controls for the
potential learning effect among buyers. Buyers who make more transactions with the FSS may
be better able to utilize the functionality provided by electronic channels.
4.4 Econometric Model
Our estimation is conducted at the transaction level (i.e., each transaction is an
observation). We estimate the following:
CYCLE = β0 + β1 EDI + β2 INTERNET + β3 PRICE + β4 QUANTITY + β5 BVOL+ β6
FREQ +
∑W
iiWAREHOUSE1
γ +∑m
ii MONTH1
δ
+ ∑n
iiCATEGORY1
λ + ε. (1)

20
COMPLETE = β0 + β1 EDI + β2 INTERNET + β3 PRICE + β4 QUANTITY + β5 BVOL+
β6 FREQ +
∑W
iiWAREHOUSE1
γ +∑m
ii MONTH1
δ + ∑n
iiCATEGORY1
λ + ζ (2)
SHORT = β0 + β1 EDI + β2 INTERNET + β3 PRICE + β4 QUANTITY + β5 BVOL+ β6
FREQ +
∑W
iiWAREHOUSE1
γ +∑m
ii MONTH1
δ + ∑n
iiCATEGORY1
λ + η. (3)
where:
• CYCLE, COMPLETE, and SHORT are defined as in section 4.2.
• WAREHOUSEi represents one of a series of dummy variables, coded 1 if the goods are
shipped from WAREHOUSEi. If goods are shipped directly from the supplier (and not
through an FSS warehouse), then all of the warehouse dummy variables are coded 0.
• MONTHi consists of 11 dummy variables, each denoting a month in which the
transaction was initiated. December is omitted as the base case for comparison purposes.
• CATEGORYi is a series of dummy variables for all (but one) product categories.
• QUANTITY is transaction quantity, measured as the total units in a transaction.
• PRICE is the product price.
• BVOL is the buyer’s total annual purchase volume with the FSS during the year the data
were collected, measured in dollars.
• FREQ is an item’s transaction frequency measured as the number of times the item was
transacted during the year.
• β, γ, and δ are parameters to be estimated and ε, ζ and η are disturbance terms.
Table 4 presents the descriptive statistics and the correlation matrix for the variables. To
check for potential multicollinearity, we estimated ordinary least squares (OLS) variants of our

21
models and computed variance inflation factor (VIF) scores for all independent variables. The
VIF scores for all independent variables are between 1.00 and 4.72, lower than the commonly
accepted level of 10 (Kennedy 2003), indicating that multicollinearity may not be a concern.
<<Insert Table 4 about here>>
4.5 Model Estimation
The dependent variable, complete orders fulfilled, is an ordered multinomial-choice
variable; that is, with 3 being the best outcome and 0 the worst. A regular multinomial logit
model fails to account for the ordinal nature of the variable, while an ordinary least squares
(OLS) regression is more appropriate for a cardinal dependent variable (Greene 1997). Ordered
logit models, on the other hand, have been widely used to estimate ordinal responses with
ordered values.
The second dependent variable, order cycle time, is the counted number of days between
the placement of an order and the shipment of that order. As a count measure, it follows a
Poisson distribution (Greene 1997). According to Greene (1997, p. 931), a preponderance of zero
values for the dependent variable (in our case, orders that are received and shipped on the same
day) and the clearly discrete nature of count data, suggest that a Poisson regression is a better
estimation approach than a linear model. However, the dependent variable may be “over-
dispersed” since a Poisson distribution assumes equal mean and variance. In the case of over-
dispersion (i.e., variance greater than mean), a negative binomial distribution is considered, since
a negative binomial regression relaxes the assumption of equal mean and variance. A test of
deviance statistics following the Poisson regression yielded a highly significant (p<0.000) Chi-

22
squared statistic of 3.32e+7, suggesting over-dispersion. A negative binomial regression is
therefore used.4
The third dependent variable, short-shipment percentage, is always non-negative; that is,
can only be either zero or a positive number. When an order is completely filled, short-shipment
percentage equals zero; otherwise it may be any positive number up to 100. Moreover, the
percentage of data points that equal zero for short shipments is much larger than what one would
expect under normal distributions. In total 2,670,264 observations are zeros, accounting for
90.3% of the total cases (i.e., 90.3% of the shipments were completely filled). Therefore, it can
be determined that short-shipment percentage has a censored distribution; that is, it is left-
censored at the value zero. The existence of a censored dependent variable results in a non-
normal error distribution, thus violating one of the ordinary least squares’ assumptions. Hence,
OLS results may be biased. Therefore, a Tobit model is considered. Tobit, a censored regression
model, is designed to estimate regressions with censored dependent variables by compensating
for the non-normal distribution of the dependent variable (Greene 1997).
A final estimation concern is that there are repeated transactions for the same buyers over
time implying that these transactions may not be independent. Thus, we estimate our models
with Huber-White robust standard errors that correct for model estimations with repeated
observations within a cluster (Wooldridge 2002)5.
5. Empirical Findings
5.1 Estimation Results
The equations for order cycle time, complete orders fulfilled, and short shipment quantity
are estimated individually. In order to show the robustness of our results, we estimate three
4 Estimations using Poisson regressions were also performed and the results are consistent with those presented.
23
variants of the model. Model 1 is a base model that includes the independent variables, EDI and
INTERNET, and control variables for time (i.e., month dummies) and shipping location (i.e.,
warehouse dummies). Model 2 adds two additional control variables, PRICE and QUANTITY,
to account for product and transaction specific effects. Model 3 is the full model that adds the
control variables BVOL, FREQ, and the product category dummies, to further control for buyer
and product related factors.
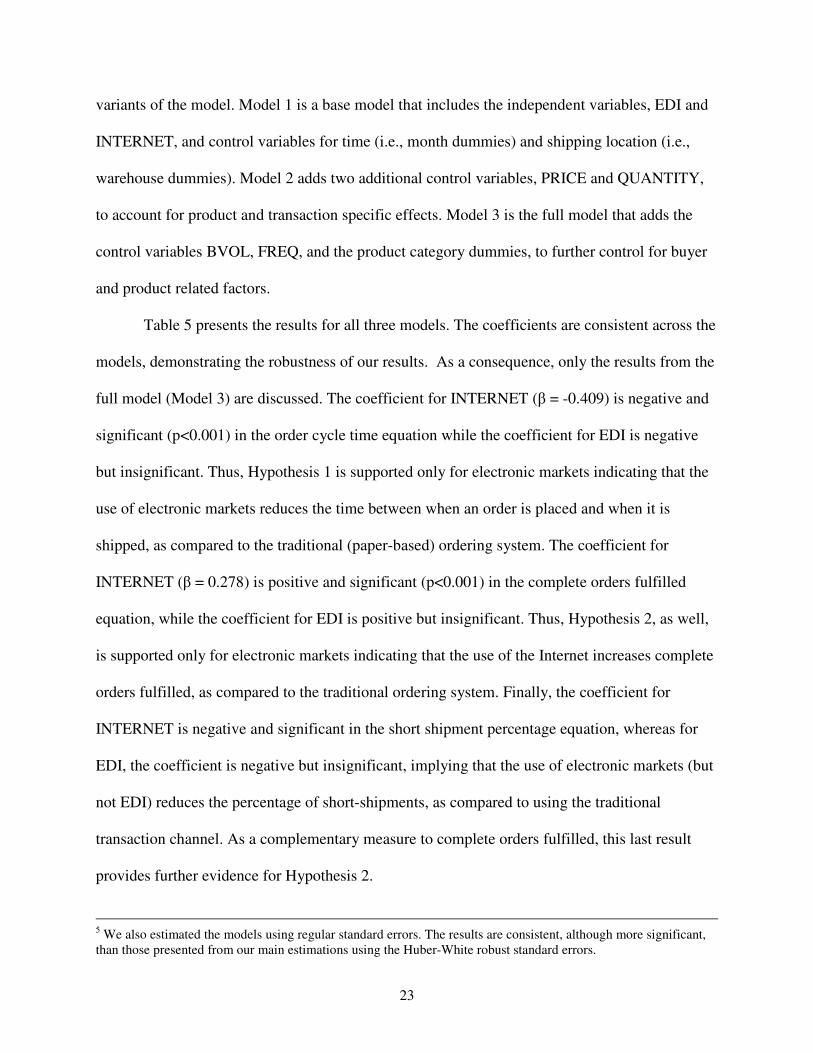
Table 5 presents the results for all three models. The coefficients are consistent across the
models, demonstrating the robustness of our results. As a consequence, only the results from the
full model (Model 3) are discussed. The coefficient for INTERNET (β = -0.409) is negative and
significant (p<0.001) in the order cycle time equation while the coefficient for EDI is negative
but insignificant. Thus, Hypothesis 1 is supported only for electronic markets indicating that the
use of electronic markets reduces the time between when an order is placed and when it is
shipped, as compared to the traditional (paper-based) ordering system. The coefficient for
INTERNET (β = 0.278) is positive and significant (p<0.001) in the complete orders fulfilled
equation, while the coefficient for EDI is positive but insignificant. Thus, Hypothesis 2, as well,
is supported only for electronic markets indicating that the use of the Internet increases complete
orders fulfilled, as compared to the traditional ordering system. Finally, the coefficient for
INTERNET is negative and significant in the short shipment percentage equation, whereas for
EDI, the coefficient is negative but insignificant, implying that the use of electronic markets (but
not EDI) reduces the percentage of short-shipments, as compared to using the traditional
transaction channel. As a complementary measure to complete orders fulfilled, this last result
provides further evidence for Hypothesis 2.
5 We also estimated the models using regular standard errors. The results are consistent, although more significant, than those presented from our main estimations using the Huber-White robust standard errors.

24
<< Insert Table 5 about here >>
Hypotheses 3 and 4 provide direct comparisons between the performance of the EDI
system and electronic markets. In order to test these hypotheses, we performed Wald-tests
(Greene 1997) comparing the magnitudes of the EDI and INTERNET coefficients in each of the
six regressions. The results are in Table 6. For Hypothesis 3 to be supported, the coefficients for
INTERNET in the regressions on Order Cycle Time must be significantly “more negative” than
their EDI counterparts, implying that the order cycle times using the electronic market are
significantly lower than the cycle times using the EDI-based transaction channel. As shown in
the first row of Table 6, Hypothesis 3 is strongly supported. In order for Hypothesis 4 to be
supported, the coefficients for INTERNET must be significantly greater than the coefficients for
EDI in the Complete Orders Fulfilled equations. As indicated in the second row of Table 6, this
is true at the .001 significance level. To provide further support for Hypothesis 4, as shown in
the third row of Table 6, the coefficients for INTERNET in the regressions on Short-Shipments
are significantly “more negative” than their EDI counterparts, implying that a lower percentage
of items was short-shipped when using the electronic market.
<<Insert Table 6 about here>>
Table 7 presents log likelihood ratio tests for each of the three regressions. The tests
compare the fit of the complete models to models without the EDI and INTERNET variables
(i.e., restricted models). The purpose of the tests is to determine whether the inclusion of these
two variables improves the prediction of the three dependent variables. In all tests, the log
likelihood ratio is significant at the p-value of .001, indicating that the fit of the complete models
is significantly better than the fit of the restricted models.
<<Insert Table 7 about here>>

25
5.2 Validation and Robustness Checks
In order to validate our estimations, we performed several different robustness checks.
First, we calculated hit rates for the ordered logit models used to estimate complete orders filled.
The hit rates indicate that the ordered logit models correctly predict complete orders fulfilled
89.53% of the time. Second, since our data include four product categories, we ran our models
using sub-samples for each product category separately and obtained consistent results for our
key variables (EDI and INTERNET)6. Third, we reran our models using 50%, 10% and 1%
randomly drawn samples. The results from the random draws are consistent with those reported,
indicating that our results are not sensitive to the volume of data points. Furthermore, we
estimated our model using only the sub-sample of transactions involving buyers who purchased
exclusively through a single channel throughout the year (either electronic market, EDI or
traditional). This sample selection excludes buyers who may use one channel for a particular
type of products (e.g., commodities) and a second channel for other types of products (e.g.,
strategic purchases). The reduced sample included 64,403 out of 67,709 buyers, and
approximately 74.31% of the transactions in our dataset. We find that the results (Table 8) are
consistent with those reported above, although with this estimation, both the EDI channel and the
Internet channel outperformed the paper-based channel, with the Internet-based channel
achieving the highest performance results. Finally, we estimated our models using data on the
smaller FSS product categories not included in our original estimations. These categories have
annual numbers of transactions between 1,000 and 10,0007. The results (Table 9) are consistent
6 The results are omitted for brevity but available upon request. 7 These product categories include (1) service equipment; (2) agricultural machinery and equipment; (3) material handling equipment; (4) rope, cable, chain and fittings; (5) cooling equipment; (6) pumps and compressors; (7) plumbing, heat and sanitation equipment; (8) pipe, tubing, hose and fittings; (9) prefabridated structures and scaffolding; (10) construction and building materials; (11) commercial telecommunication equipment; (12) electrical and electronic equipment component; (13) photographic equipment; and (14) books, maps and other publications.

26
with those reported, indicating that our findings can be generalized to a broad range of product
categories.
<<Insert Tables 8 and 9 about here>>
6. Discussion
A number of research studies have shown performance benefits from using EDI-based
systems (e.g., Srinivasan et al. 1994; Mukhopadhyay et al. 1995; Lee et al. 1999). More
recently, researchers have differentiated between EDI and electronic markets (Choudhury et al.
1998) and stated that it is not clear that EDI results can be extended to electronic markets (Zhu
and Kraemer 2002). Despite the rich literature on the performance evaluation of the use of EDI-
based systems, and the growing body of literature on the performance of Internet-based
electronic markets, little or no research has been done to compare and contrast the two systems
in terms of performance. Our research provides an empirical addition to the existing literature on
performance improvements from electronic-based transactions. The paper also makes the first
attempt using a direct comparison to show how Internet-based electronic markets can outperform
EDI-based transaction systems in terms of order fulfillment.
In this paper, we show that federal government purchasers who use the Internet-based
GSA Advantage! can expect lower order cycle times, a greater percentage of complete orders,
and a smaller percentage of items short-shipped after controlling for transaction characteristics,
buyer characteristics, item characteristics, and other environmental factors. That is, Internet-
based systems outperform both EDI-based and traditional transaction systems with lower order
cycle times, higher order fulfillment, and a smaller percentage of items short-shipped. To
illustrate these results, we use regression estimates from Table 5 (Model 3) to compute the

27
potential effects of transaction channel choice on the dependent variables. The potential effects
are computed as the changes to the dependent variable when the EDI or Internet variables change
from 0 to 1, while maintaining the rest of the independent variables at their means. Table 10
presents the potential effects for our sample. We can see from the table, that relative to the use of
the traditional transaction channel, EDI has only a minor impact on cycle time and complete
shipments. On the other hand, the use of the Internet-based GSA Advantage! has a substantial
impact. GSA Advantage! reduces cycle time by from 4.8 days to 3.0 days or by 37.5% on
average. In addition, GSA Advantage! increases the order fulfillment rate by 2 percentage points
from 91.7% to 93.7%. Finally, GSA Advantage! reduces short-shipments by 1.87 percentage
points from 4.78% of total shipments under a paper-based channel to 2.91% of total shipments.
This represents a 39.02% reduction in the short-shipment percentage. These results show that the
performance improvements resulting from the use of electronic markets, relative to EDI-based
and traditional channels, are not only statistically significant, but economically significant.
<<Insert Table 10 about here>>
Performance differences among transaction channels may be attributed to the ways that
transactions are facilitated. Both Internet and EDI-based transaction systems facilitate the
electronic exchange of documents (e.g., purchase orders, acknowledgement of purchase orders,
etc.). Electronic document exchanges may reduce cycle time and increase order fulfillment rates
due to increased order accuracy. However, the most important advantage of the Internet-based
system over both of its alternatives may be its superior information discovery characteristics.
The ability to use information discovery tools to locate suppliers with available inventory and to
compare offerings among suppliers may lead to both increased order fulfillment and reduced

28
cycle time. As a result, we find Internet-based transaction systems are associated with better
fulfillment levels, compared to both EDI-based and traditional transaction systems.
Our result that the EDI system did not outperform the paper-based system is surprising,
given the EDI system’s superior transaction capabilities. However, it should be noted that when
we estimated transactions conducted by purchasers who only used one transaction system
throughout the year (see Table 8), the EDI system did outperform the paper-based channel.
Our findings provide complementary empirical evidence and alternative perspectives to
the concept of online informational capability (OIC) (Barua et al. 2004), which is a key factor in
determining performance or net-enhanced business value (e.g., Zhu and Kraemer 2002; Barua et
al. 2004). We shed light on an important decision faced by businesses; that is, the choice
between EDI and Internet-based transaction systems. Although many firms have switched from
private network EDI systems to electronic markets, the use of EDI is still prevalent in some
industries. For example, a survey of logistics managers in the food industry found that private
network EDI technology was used to place four times as many orders with suppliers than was
web-based technology (although neither technology was used as much as traditional transaction
channels) (Dresner et al. 2001). Our own statistics show that EDI-based channels are still
heavily used by government purchasers. For example, for the hand tools category, the EDI-based
channel was used for 90.19% of FSS purchases, while the Internet-based channel for only 7.30%
of purchases. Clearly, there may be significant performance gains if a higher proportion of FSS
purchasers, and, perhaps, greater numbers of purchasers in general, converted from EDI-based
systems to electronic markets. On the other hand, suppliers (especially those with inferior
performance) may be reluctant to move toward the use of electronic markets since their use
heightens competition among suppliers through reductions in search costs (Bakos 1991a; Bakos

29
1997), reductions in information asymmetry between buyers and suppliers (Bakos 1997), and
decreases in supplier bargaining power (Clemons et al. 1993; Malone et al. 1987).
Although our results strongly support increased performance through the use of
electronic markets, caution should be employed in generalizing the results. The FSS supply
chain is regulated more closely than most supply chains in the private sector. For example,
government purchasers are only allowed to procure through either the FSS or through suppliers
that are pre-approved by the FSS, whereas in the private sector, purchasers may be free to
procure from a greater number of sources. The FSS supply chain is also one of the largest in the
world in terms of transaction volumes. The specific conditions of the FSS supply chain may not
be applicable to smaller organizations. However, we believe the FSS supply chain may be
comparable to internal supply chains of large retail firms; for example, supermarket chains,
where retail outlets are supplied from central distribution centers and/or directly from vendors.
7. Conclusions
This paper examines how the use of different types of communication and transaction
channels can affect organizational performance, most notably order cycle time and complete
orders fulfilled. Using data gathered from the FSS supply chain, three types of channels are
examined – a traditional, paper-based channel, a private network EDI channel, and an Internet-
based channel. Our paper extends previous research on EDI performance (e.g., Srinivasan et al.
1994; Mukhopadhyay et al. 1995; Lee et al. 1999) to the electronic market context. Our results
support recent research that demonstrates that the use of electronic markets may lead to
improved performance over private network IOIS (Zhu and Kraemer, 2002; Zhu, 2004). Despite
literature that notes substantial differences between the two channel technologies (Choudhury et
al. 1998), there is no research, of which we are aware, that provides a direct performance

30
comparison between EDI and Internet transaction systems. Our findings suggest that channel
choice does matter, and that the information discovery capabilities of the Internet-based IOIS
may contribute to its superior performance. Since EDI channels still dominate some industries
(e.g., Dresner et al. 2001), these results point to the gains that may be realized by updating
communication and transaction technologies to support product search and vendor comparisons.
A limitation of this paper is the use of a single organization, the Federal Supply Service,
to test our results. This limitation reduces the generalizability of the results. However, on the
plus side, sampling from a single organization allows us to strictly control for the influence of
parallel technologies and purchasing procedures, such as just-in-time purchasing programs, that
may influence organizational performance (e.g., Srinivasan et al. 1994). A further limitation is
that the types of products examined in this research are indirect products, including those often
associated with maintenance, repair, and operations (MRO) categories. These materials are often
purchased on a spot market basis without long term commitments. Further research may
determine if our results can be extended to direct input materials that are purchased under long
term contracts.
References
Ahmad, S. and R.G. Schroeder. 2001. “The Impact of Electronic Data Interchange on Delivery
Performance.” Production and Operations Management (10:1), pp.16-30.
Anandalingam, G., R.W. Day, and S. Raghavan. 2005. “The Landscape of Electronic Market
Design.” Management Science (51:3), pp.316-327.
Bakos, Y. J. 1991a. “Information Links and Electronic Marketplaces: The Role of
Interorganizational Information Systems in Vertical Markets.” Journal of Management
Information Systems (8:2), pp. 31-52.
31
Bakos, Y. J. 1991b. “A Strategic Analysis of Electronic Marketplaces.” MIS Quarterly, pp. 295-
310.
Bakos, Y. J. 1997. “Reducing Buyer Search Costs: Implications for Electronic Marketplaces.”
Management Science (43:12), pp. 1676-1692.
Barua, A., P. Konana, and A.B. Whinston. 2004. “An Empirical Investigation of Net-Enabled
Business Value.” MIS Quarterly (28:4), pp.585-620.
Barua, A. and B. Lee. 1997. “An Economic Analysis of the Introduction of an Electronic Data
Interchange System.” Information Systems Research (8:4), pp. 398-422.
Cash, J.I. and B. Konsynski. 1985. IS Redraws Competitive Boundaries. Harvard Business
Review (63:2), pp. 134-142.
Choudhury, V. 1997. “Strategic Choices in the Development of Interorganizational Information
Systems.” Information Systems Research (8:1), pp. 1-24.
Choudhury, V., Hartzel, K. S., and Konsynski, B. R. 1998. “Uses and Consequences of
Electronic Markets: An Empirical Investigation in the Aircraft Parts Industry,” MIS
Quarterly, pp. 471-507.
Clemons, E. K. and S. P. Reddi. 1993. “The Impact of Information Technology on the
Organization of Economic Activity: The "Move to the Middle" Hypothesis.” Journal of
Management Information Systems (10:2): pp. 9-36.
Crum, M. R., D. A. Johnson and B. J. Allen. 1998. “A longitudinal Assessment of EDI Use in
the U.S. Motor Carrier Industries.” Transportation Journal (38:1), pp. 15-28.
Dearing, B. 1990. “The Strategic Benefits of EDI.” The journal of Business Strategy (11:1), pp.
4-6
Devaraj, S., M. Fan, and R. Kohli. 2002. “Antecedents of B2C Channel Satisfaction and

32
Preference: Validating e-Commerce Metrics.” Information Systems Research (13:3), pp. 316-
333.
Dresner, M., Y. Yao and J. Palmer. 2001. “Internet Technology Use Across the Food Industry
Supply Chain.” Transportation Journal (40:4), pp. 14-26.
Dröge, C. and Germain, R. 2000. “The Relationship of Electronic Data Interchange with
Inventory and Financial Performance,” Journal of Business Logistics (21:2), pp. 209-230.
Engel, J.F. and R.D. Kollat. 1978. “Consumer Behavior.” 3rd ed., Holt, Rinehart and Winston,
New York.
Elgarah, W., N. Falaleeva, C.S. Saunders, V. Llie, J.T. Shim, and J.F. Courtney. 2005. “Data
Exchange in Interorganizational Relationship: Review Through Multiple Conceptual
Lenses.” The DATA BASE for Advances in Information Systems (36:1), pp.8-29.
Greene, W. H. 1997. Econometric Analysis. Saddle River, New Jersey, Prentice Hall.
Grover, V. 1993. “An Empirical Derived Model for the Adoption of Customer-based
Interorganizational Systems.” Decision Sciences (24:3), pp.603-640.
Gupta A., B. Su, and Z. Walter. 2004. “Risk Profile and Consumer Shopping Behavior in
Electronic and Traditional Channels.” Decision Support Systems (38:3): pp. 347-367.
Hansen, J.V. and N.C. Hill. 1989. “Control and Audit of Electronic Data Interchange.” MIS
Quarterly (13:4), pp. 402-413.
Johnston, R. B. and H. C. Mak. 2000. “An Emerging Vision of Internet-Enabled Supply Chain
Electronic Commerce.” International Journal of Electronic Commerce (4:4): pp.43-59.
Jonston, H.R. and M.R. Vitale. 1988. “Creating Competitive Advantage with Interorganizational
Systems. MIS Quarterly (12:2), pp.153-165.
Kalakota, R. and M. Robinson. 2003. “Service Blueprint: Roadmap for Execution.” Addison-

33
Wesley, Reading, MA.
Kalakota, R. and A.B. Whinston. 1997. “Electronic Commerce: A Manager’s Guide.” Addison-
Wesley, Reading, MA.
Kauffman, R.J. and H. Mohtadi. 2004. “Proprietary and Open Systems Adoption in E-
Procurement: A Risk-Augmented Transaction Cost Perspective.” Journal of Management
information Systems (21:1), pp.137-166.
Kay, R. 2001. Supply Chain Management. Computerworld. 35: 32.
Kennedy, P. 2003. A Guide to Econometrics, 5th Edition, MIT Press, Cambridge, MA.
Kolter, P. 2002. “Marketing Management.” 11th ed., Prentice-Hall, New York.
Lee, H. G., T. Clark and K. Y. Tam. 1999. “Research Report. Can EDI Benefit Adopters?”
Information Systems Research (10:2), pp. 186-195.
Lynch J.G. Jr. and D. Ariely. 2000. “Wine Online: Search Costs Affect Competition on Price,
Quality, and Distribution.” Marketing Science (19:1), pp. 83-103.
Mackay, D. and Rosier, M. 1996. “Measuring Organizational Benefits of EDI Diffusion; A Case
of the Australian Automotive Industry,” International Journal of Physical Distribution &
Logistics Management (26:10), pp. 60-78.
Malone, T. W., J. Yates and R. I. Benjamin. 1987. “Electronic Markets and Electronic
Hierarchies.” Communications of the ACM (30:6), pp. 484-497.
Mount, I. 2003. “Why EDI Won't Die.” Business 2.0 (4:7).
Mukhopadhyay, T. and Kekre, S. 2002. “Strategic and Operational Benefits of Electronic
Integration in B2B Procurement.” Management Science (48:10), pp.1301-1313.
Mukhopadhyay, T., Kekre, S., and Kalathur, S. 1995. “Business Value of Information
Technology: A Study of Electronic Data Interchange,” MIS Quarterly, June, pp. 137-156.

34
Riggins, F.J. and Mukhopadhyay, T. 1994. “Interdependent benefits from interorganizational
systems: Opportunities for business partner reengineering.” Journal of Management
Information Systems (11:2), pp. 37-57.
Saeed, K.A., M.K. Malhotra, and V. Grover. 2005. “Examining the Impact of Interorganizational
Systems on Process Efficiency and Sourcing Leverage in Buyer-Supplier Dyads.” Decision
Sciences (36:3), pp.365-396.
Srinivasan, K., Kekre, S., and Mukhopadhyay, T. 1994. “Impact of Electronic Data Interchange
Technology on JIT Shipments,” Management Science (40:10), pp. 1291-1304.
Straub, D.W., D.L. Hoffman, B.W. Weber, and C. Steinfield. 2002a. “Measuring e-Commerce in
Net-Enabled Organizations: An Introduction to the Special Issue.” Information Systems
Research (13:2), pp. 115-124.
Straub, D.W., D.L. Hoffman, B.W. Weber, and C. Steinfield. 2002b. “Toward New Metrics for
Net-Enabled Organizations.” Information Systems Research (13:3), pp. 227-238.
Subramani, M. 2004. “How Do Suppliers Benefit from Information Technology Use in Supply
Chain Relationships?” MIS Quarterly (28:1), pp. 45-73.
Teo, H.H., K.K. Wei, and I. Benbasat. 2003. “Predicting Intention to Adopt Interorganizational
Linkages: An Institutional Perspective.” MIS Quarterly (27:1), pp. 19-49.
Truman, G.E. 2000. “Integration in Electronic Exchange Environments.” Journal of
Management Information Systems (17:1), pp.209-244.
Wang, E. T. G. and A. Seidmann. 1995. “Electronic Data Interchange: Competitive Externalities
and Strategic Implementation Policies.” Management Science (41:3), pp. 401-418.
Wooldridge, J.M. 2002. “Econometric Analysis of Cross Section and Panel Data.” MIT Press,
Cambridge, MA.

35
Zaheer, A. and N. Venkatraman. “Determinants of Electronic Integration in the Insurance
Industry – An Emprical Test.” Management Science (40:5), pp. 549-566.
Zhu, K. 2004. “The Complementarity of Information Technology Infrastructure and E-
Commerce Capability: A Resource-Based Assessment of Business Value,” Journal of
Management Information Systems (21:1), pp.167-202.
Zhu, K., and Kraemer, K. L. 2002. “e-Commerce Metrics for Net-Enhanced Organizations:
Assessing the Value of e-Commerce to Firm Performance in the Manufacturing Sector,”
Information Systems Research (13:3), pp. 275-295.
Zhu, K., and Kraemer, K. L. 2005. “Post-Adoption Variations in Usage and Value of E-Business
by Organizations: Cross-Country Evidence from the Retail Industry.” Information Systems
Research (16:1), pp. 61-84.

36
Figure 1: Dimensions of Complete Order Fulfillment
Right ProductRight Q
uantity
Rig
ht
Tim
e
(1,1,1)
(0,0,0)
(1,1,0)(0,1,0)
(1,0,1)(0,0,1)
(1,0,0)
(0,1,1)
Right ProductRight Q
uantity
Rig
ht
Tim
e
(1,1,1)
(0,0,0)
(1,1,0)(0,1,0)
(1,0,1)(0,0,1)
(1,0,0)
(0,1,1)
37
Table 1: Information Discovery and Transaction Processing in Three Transaction
Channels
Channel
Characteristics
Electronic
Market
Private Network
EDI
Traditional
Channel
Information
Discovery Electronic
Limited Electronic
Traditional
Transaction
Processing Electronic Electronic Traditional
Table 2: Federal Supply Service Transaction Channels
Information Available for Government Buyer
Traditional Channel Pricing, delivery. (Paper-based product catalog that is updated twice a year)
Private Network EDI Real-time pricing, delivery, inventory status.
Electronic Market (GSA
Advantage!)
Real-time pricing, delivery, inventory status, and real-time vendor and product search and comparison.
Table 3: Descriptive Statistics on Transaction Frequencies by Channels
Number of Transactions (Percent of Product Category Total)
Product Category
Internet-Based GSA
Advantage!
EDI-Based Channel
Traditional or Paper-Based
Channel
Total Transactions
1. Hand Tools and Hardware
75,539 (7.30%)
932,787 (90.19%)
25,871 (2.50%)
1,034,198 (100.0%)
2. Office Supplies and Devices
686,187 (42.93%)
806,639 (50.47%)
105,408 (6.60%)
1,598,234 (100.0%)
3. Brushes, Paints, Sealers, and Adhesives
18,083 (9.93%)
151,660 (83.29%)
12,348 (6.78%)
182,091 (100.0%)
4. Containers, Packaging and Packing supplies
33,787 (23.83%)
98,081 (69.17%)
9,934 (7.01%)
141,802 (100.0%)

38
Table 4: Descriptive Statistics and Correlation Matrix (N=2,956,325)
Mean S.D. Min. Max. 1 2 3 4 5 6 7 8
1. COMPLETE 2.85 0.46 0 3 1
2. SHORT 0.07 0.24 0 1 -0.65*** 1
3. CYCLE 6.65 15.75 0 350 -0.22*** 0.37*** 1
4. EDI 0.67 0.47 0 1 0.01*** -0.01*** 0.10*** 1
5. INTERNET 0.28 0.45 0 1 0.004*** -0.002*** -0.11*** -0.88*** 1
6. PRICE 25.69 393.99 0.02 98,605 0.003*** -0.002** 0.07*** 0.00 -0.02*** 1
7. QUANTITY 14.24 156.45 1 99,312 -0.08*** 0.02*** 0.02*** -0.01*** -0.01*** -0.003*** 1
8. BVOL 426,720 1,178,963 0.06 1.83e+07 -0.04*** -0.004*** 0.07*** 0.21*** -0.21*** 0.01*** 0.03*** 1
9. FREQ 1,888.86 2,753.45 1 22,617 0.03*** -0.04*** -0.11*** -0.09*** 0.10*** -0.02*** 0.02*** -0.04***
* p < 0.05; ** p < 0.01; ***p<0.001

39
Table 5 Estimation Results
(Huber-White Robust Standard Errors in Parentheses)
Model 1 Model 2 Model 3
Order Cycle
Time
Complete
Orders
Fulfilled
Short
Shipment
Percentage
Order Cycle
Time
Complete
Orders
Fulfilled
Short
Shipment
Percentage
Order Cycle
Time
Complete
Orders
Fulfilled
Short
Shipment
Percentage
INTERCEPT 3.398*** (0.045)
-2.874*** (0.041)
3.377*** (0.047)
-2.565*** (0.043)
3.361*** (0.047)
-2.870*** (0.041)
EDI -0.054 (0.042)
0.100* (0.050)
-0.057 (0.030)
-0.040 (0.044)
0.198*** (0.055)
-0.164*** (0.031)
-0.041 (0.042)
0.018 (0.063)
-0.040 (0.033)
INTERNET -0.452*** (0.037)
0.401*** (0.048)
-0.276*** (0.029)
-0.430*** (0.041)
0.247*** (0.053)
-0.228*** (0.030)
-0.409*** (0.038)
0.278*** (0.059)
-0.246*** (0.032)
Price (x10-3) 0.222***
(0.053) -0.049*** (0.007)
0.007 (0.005)
0.114** (0.035)
-0.045*** (0.006)
0.006 (0.004)
Quantity (x10-3) 0.464***
(0.067) -2.836*** (0.345)
0.296*** (0.062)
0.513*** (0.068)
-2.622*** (0.325)
0.272*** (0.057)
Buyer’s Total Purchase Volume (x10-6)
0.058** (0.018)
-0.051* (0.022)
0.025 (0.014)
Item’s Transaction Frequency (x10-6)
-43.30*** (1.210)
85.60*** (2.550)
-53.80*** (1.640)
Product Category Dummies
Included Included Included
Warehouse Dummies
Included Included Included Included Included Included Included Included Included
Month Dummies
Included Included Included Included Included Included Included Included Included
Model Statistics
N 2,956,325 2,956,325 2,956,325 2,956,325 2,956,325 2,956,325 2,956,325 2,956,325 2,956,325
Log Likelihood -7,872,460 -1,142,802 -1,042,576 -7,852,178 -1,156,768 -1,061,142 -7,856,875 -1,129,298 -1,036,283 * p < 0.05; ** p < 0.01; ***p<0.001

40
Table 6: Wald Tests Between EDI and INTERNET Coefficients
Dependent
Variable
EDI
Coefficient
INTERNET
Coefficient
Chi2 Significance
CYCLE -0.041 -0.409 456 0.000
COMPLETE 0.018 0.278 193 0.000
SHORT -0.040 -0.246 445 0.000
Table 7 Likelihood Ratio Test
Dependent
Variable
Log Likelihood
(Restricted
Model)
Log Likelihood
(Full Model)
Likelihood
Ratio
p
value
CYCLE -7,873,647 -7,856,875 -33,544 <0.000
COMPLETE -1,130,851 -1,129,298 -3,106 <0.000
SHORT -1,038,513 -1,036,283 -4,460 <0.000
The restricted model refers to estimations without the EDI and Internet variables.
Likelihood ratio is calculated by using the differences in log likelihood between two models
and times -2 (Greene 1997).

41
Table 8: Estimation Results – Subsample of Single Channel Buyers
(Huber-White Robust Standard Errors in Parentheses)
Model 3
Order Cycle
Time
Complete
Orders
Fulfilled
Short
Shipment
Percentage
INTERCEPT 3.490*** (0.060)
-2.891*** (0.052)
EDI -0.182** (0.056)
0.279*** (0.067)
-0.192*** (0.039)
INTERNET -0.554*** (0.054)
0.461*** (0.066)
-0.367*** (0.038)
Price (x10-3) 0.167** (0.063)
-0.035*** (0.008)
0.007 (0.006)
Quantity (x10-3) 0.708*** (0.103)
-3.466*** (0.531)
0.420*** (0.109)
Buyer’s Total Purchase Volume (x10-6)
0.217*** (0.047)
-0.283*** (0.040)
0.158*** (0.020)
Item’s Transaction Frequency (x10-6)
-44.70*** (1.06)
83.60*** (2.62)
-54.70*** (1.76)
Warehouse Dummies
Included Included Included
Month Dummies
Included Included Included
Product Category Dummies
Included Included Included
Model Statistics
N 2,196,777 2,196,777 2,196,777
Log Likelihood -5,681,848 -805,000 -745,244 * p < 0.05; ** p < 0.01; ***p<0.001
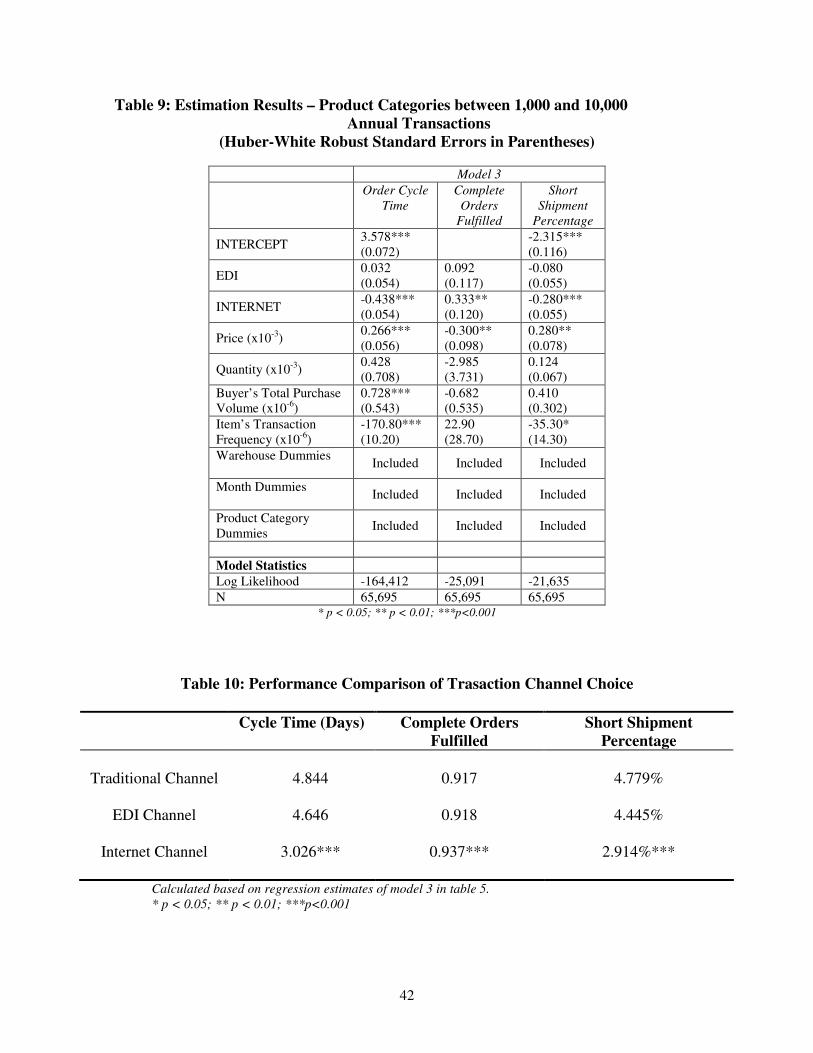
42
Table 9: Estimation Results – Product Categories between 1,000 and 10,000
Annual Transactions
(Huber-White Robust Standard Errors in Parentheses)
Model 3
Order Cycle
Time
Complete
Orders
Fulfilled
Short
Shipment
Percentage
INTERCEPT 3.578*** (0.072)
-2.315*** (0.116)
EDI 0.032 (0.054)
0.092 (0.117)
-0.080 (0.055)
INTERNET -0.438*** (0.054)
0.333** (0.120)
-0.280*** (0.055)
Price (x10-3) 0.266*** (0.056)
-0.300** (0.098)
0.280** (0.078)
Quantity (x10-3) 0.428 (0.708)
-2.985 (3.731)
0.124 (0.067)
Buyer’s Total Purchase Volume (x10-6)
0.728*** (0.543)
-0.682 (0.535)
0.410 (0.302)
Item’s Transaction Frequency (x10-6)
-170.80*** (10.20)
22.90 (28.70)
-35.30* (14.30)
Warehouse Dummies
Included Included Included
Month Dummies
Included Included Included
Product Category Dummies
Included Included Included
Model Statistics
Log Likelihood -164,412 -25,091 -21,635
N 65,695 65,695 65,695 * p < 0.05; ** p < 0.01; ***p<0.001
Table 10: Performance Comparison of Trasaction Channel Choice
Cycle Time (Days)
Complete Orders
Fulfilled
Short Shipment
Percentage
Traditional Channel 4.844 0.917 4.779%
EDI Channel 4.646 0.918 4.445%
Internet Channel 3.026*** 0.937*** 2.914%***
Calculated based on regression estimates of model 3 in table 5.
* p < 0.05; ** p < 0.01; ***p<0.001