Private Label and National Brand Pricing and Promotional Strategies in Canadian Food Retailing...
19
Private Label and National Brand Pricing and Promotional Strategies in Canadian Food Retailing Waseem Ahmad and Sven Anders REES, University of Alberta
-
Upload
kerry-palmer -
Category
Documents
-
view
214 -
download
0
Transcript of Private Label and National Brand Pricing and Promotional Strategies in Canadian Food Retailing...
Private Label and National Brand Pricing and Promotional Strategies in Canadian Food
Retailing
Waseem Ahmad and
Sven AndersREES, University of Alberta
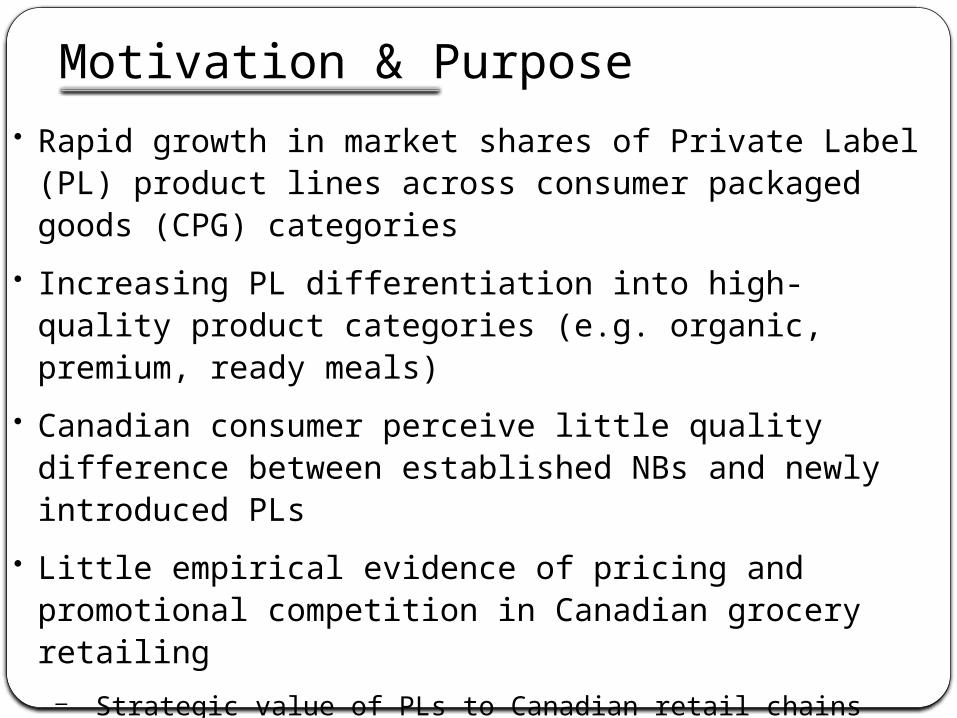
Motivation & Purpose• Rapid growth in market shares of Private Label (PL)
product lines across consumer packaged goods (CPG) categories
• Increasing PL differentiation into high-quality product categories (e.g. organic, premium, ready meals)
• Canadian consumer perceive little quality difference between established NBs and newly introduced PLs
• Little empirical evidence of pricing and promotional competition in Canadian grocery retailing
– Strategic value of PLs to Canadian retail chains
– Retail pricing and promotional behaviour in response to emerging consumer demand
• Lead question…
A.Quantify the competitive interactions of PLs and NBs in selected differentiated CPG categories
B. Test whether health-attribute product differentiation affects PL-NB competitive interactions in pricing and promotional strategies
C. Quantify key retail PL behavioural parameters of price setting, promotional strategies and frequencies, and price rigidity
Objectives

• PL–NB game theoretical analyses: Raju et al (1995); Narasimhan/Wilcox (1998); Cotterill/Putsis (2001); Wu/Wang (2005); Karray/Herran (2009); Chen et al. (2010) → Introduction of PLs benefits retailer
• PL Strategic Pricing and Demand: Sethuraman (1995); Cotterill/Putsis (2000); Ailawadi/Harlam (2004); Akbay/Jones (2005); Du/Stiegert (2009) Meza/Sudhir (2010); Richards et al. (2010) → PL pricing sign. affects NB market share
• PL Promotions: Huang et al (2003); Muller et al. (2009); Ailawadi and Harlam (2009); Volpe (2010) → PLs promoted competitively with NBs to maintain/expand PL market shares during NB promotions. Promotional frequencies (and market concentration) determine PL/NB price relation
• PL Quality: Appelbaum et al. (2003); Hassan/Monier-Dilhan (2006)
Past Literature

Private Label Continuum 1st Generation 2nd Generation 3rd Generation 4th Generation
Type Generic CPGs Quasi-Brand Umbrella Brand Differentiated Brand
Strategy
-Low volume, low quality CPG
-Increase margin -Competitive pricing
-Countervailing power (NB)
-Increase margin-Average quality CPG
-Competitive pricing
-Max. category margins
-Product differentiation
-Quality/image equality (NB)
-Quality-based pricing
-Customer loyalty-PL sub-brands-Equal/superior quality (NB)-Brand purchase criterion
Attribute Price Price Value Brand
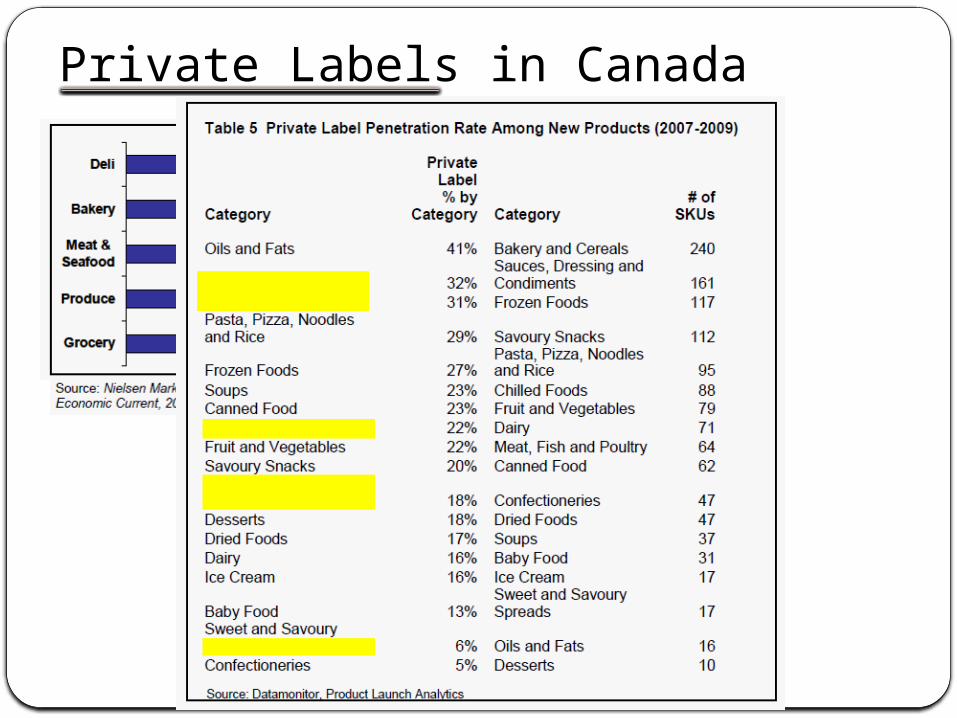
Private Labels in Canada

Case Study Analyses
Sliced Packaged Bacon Commercial Fresh Bread/Toast
PL-NB Competition in Health-differentiated Food Product Categories
NEIO oligopoly model of PL-NB category-level market share competition using price as the strategic variable
Hot Breakfast Cereals
Game theoretical model of strategic PL-NB pricing interactions using Roy et al.’s (2006) Non-Nested Model Comparisons (NNMC) approach
Related work: peanut butter, salad dressing, granola bars

• Proprietary weekly store-level scanner data w01/2004 - w27/2007 • Major US-Canadian retail chain • SIEPR-Giannini Data Center, Stanford University
Data
Data StructureUPC UPC
CategoriesStores
CAN (US) Time Sales
>40,000 200 269 (1928)random sample:BC, AB, MB, SK, ON
183w aggregate promo (y/n)
• net revenue• gross revenue• qty or quant• AGP= sales +
allowance -product cost
• unit cost to retailer
description entry-exit
food, non-food
location, size, banner

Share Rankings and Trends
Region Division
PLH PLR NBH NBR
Trend
PL NB
Calgary 2/3 4 3/2 1 flat +
Winnipeg 2 4 3 1 - +
Victoria 3/2 4 2/3 1 flat flat
Ontario 2 4 3 1 - +
Saskatoon 3 4 2 1 - +
• NBR market leader in all areas
• PLH and NBH in close constant market share competition
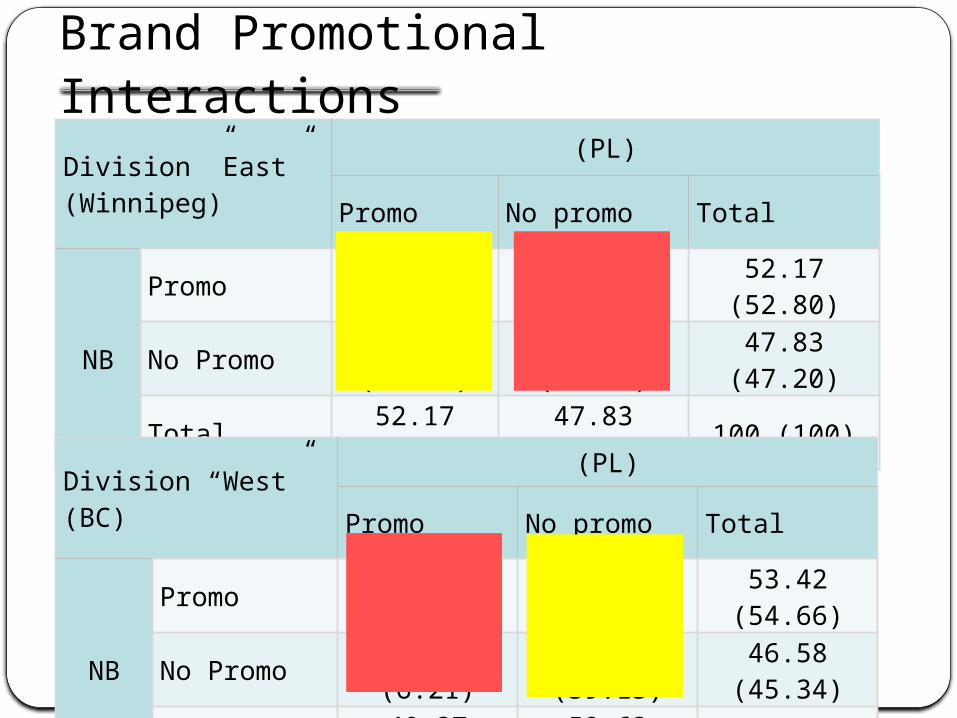
Brand Promotional Interactions
Division ”East”(Winnipeg)
(PL)
Promo No promo Total
NB
Promo 29.19 (25.47) 22.98 (27.33) 52.17 (52.80)
No Promo 22.98 (16.15) 24.84 (31.06) 47.83 (47.20)
Total 52.17 (41.61) 47.83 (58.39) 100 (100)
Division “West”(BC)
(PL)
Promo No promo Total
NB
Promo 25.47 (16.77) 27.95 (37.89) 53.42 (54.66)No Promo 14.91 (6.21) 31.68 (39.13) 46.58 (45.34)Total 40.37 (22.98) 59.63 (77.02) 100 (100)
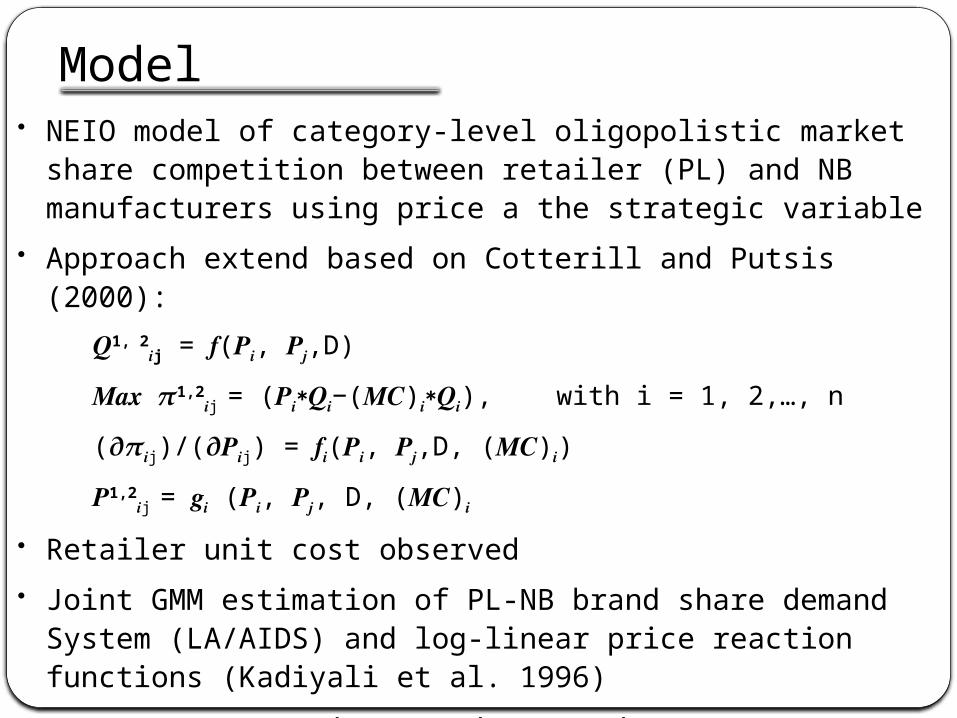
• NEIO model of category-level oligopolistic market share competition between retailer (PL) and NB manufacturers using price a the strategic variable
• Approach extend based on Cotterill and Putsis (2000): 𝑸1, 2𝒊j = (𝒇 𝑷𝒊, 𝑷𝒋,D)
𝑴𝒂𝒙 𝝅1,2j 𝒊 = (𝑷𝒊∗𝑸𝒊−( )𝑴𝑪 𝒊∗𝑸𝒊), with i = 1, 2,…, n
(𝝏𝝅 j𝒊 )/(𝝏𝑷 j𝒊 ) = 𝒇𝒊(𝑷𝒊, 𝑷𝒋,D, ( )𝑴𝑪 𝒊)𝑷1,2j 𝒊 = 𝒈𝒊 (𝑷𝒊, 𝑷𝒋, D, ( )𝑴𝑪 𝒊
• Retailer unit cost observed• Joint GMM estimation of PL-NB brand share demand System (LA/AIDS) and
log-linear price reaction functions (Kadiyali et al. 1996)
S1,2ij = α10 + α11 lnP1
ij + α12 lnP2ij + α13 ln(Eij/Pij) + α14Dij
Model
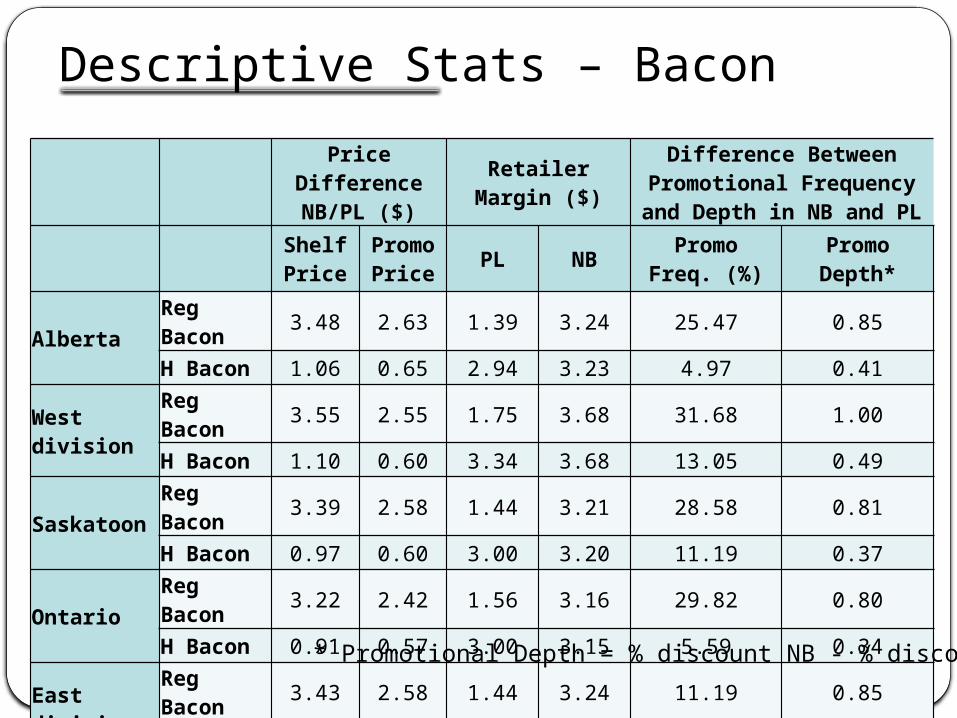
Descriptive Stats – Bacon
Price Difference NB/PL ($) Retailer Margin ($)
Difference Between Promotional Frequency and Depth in NB and
PL
Shelf Price
Promo Price PL NB Promo Freq.
(%) Promo Depth*
AlbertaReg Bacon 3.48 2.63 1.39 3.24 25.47 0.85
H Bacon 1.06 0.65 2.94 3.23 4.97 0.41
West division Reg Bacon 3.55 2.55 1.75 3.68 31.68 1.00
H Bacon 1.10 0.60 3.34 3.68 13.05 0.49
SaskatoonReg Bacon 3.39 2.58 1.44 3.21 28.58 0.81
H Bacon 0.97 0.60 3.00 3.20 11.19 0.37
OntarioReg Bacon 3.22 2.42 1.56 3.16 29.82 0.80
H Bacon 0.91 0.57 3.00 3.15 5.59 0.34
East divisionReg Bacon 3.43 2.58 1.44 3.24 11.19 0.85
H Bacon 1.02 0.61 2.99 3.24 0.00 0.41
* Promotional Depth = % discount NB - % discount PL
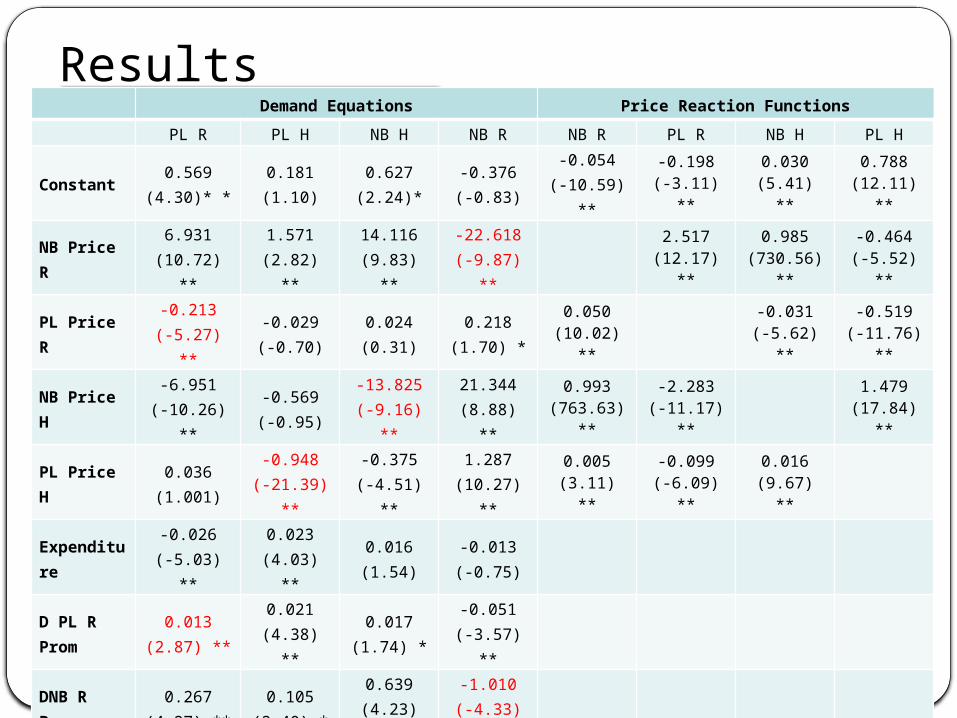
Results Demand Equations Price Reaction Functions
PL R PL H NB H NB R NB R PL R NB H PL H
Constant 0.569(4.30)* *
0.181(1.10)
0.627(2.24)*
-0.376(-0.83)
-0.054(-10.59) **
-0.198(-3.11) **
0.030(5.41) **
0.788(12.11) **
NB Price R 6.931(10.72) **
1.571(2.82) **
14.116(9.83) **
-22.618(-9.87) **
2.517(12.17) **
0.985(730.56) **
-0.464(-5.52) **
PL Price R -0.213(-5.27) **
-0.029(-0.70)
0.024(0.31)
0.218(1.70) *
0.050(10.02) **
-0.031(-5.62) **
-0.519(-11.76) **
NB Price H -6.951(-10.26) **
-0.569(-0.95)
-13.825(-9.16) **
21.344(8.88) **
0.993(763.63) **
-2.283(-11.17) **
1.479(17.84) **
PL Price H 0.036(1.001)
-0.948(-21.39) **
-0.375(-4.51) **
1.287(10.27) **
0.005(3.11) **
-0.099(-6.09) **
0.016(9.67) **
Expenditure -0.026(-5.03) **
0.023(4.03) **
0.016(1.54)
-0.013(-0.75)
D PL R Prom 0.013(2.87) **
0.021(4.38) **
0.017(1.74) *
-0.051(-3.57) **
DNB R Prom 0.267(4.27) **
0.105(2.40) *
0.639(4.23) **
-1.010(-4.33) **
D PL H Prom 0.002(0.28)
-0.103(-8.54) **
-0.150(-7.12) **
0.250(7.84) **
D NB H Prom -0.312(-4.46) **
-0.013(-0.24)
-0.533(-3.20) **
0.858(3.33) **
PL Share 0.001(1.72) *
-0.469(-8.61) **
0.043(35.29) **
-2.142(-37.21) **
Herfindahl Index
-0.005(-19.74) **
0.119(7.14) **
-0.035)(-23.66) **
1.352(20.72) **
Retailer Cost 0.000(-1.21)
1.767(29.78) **
0.002(5.75) **
0.027(7.71) **
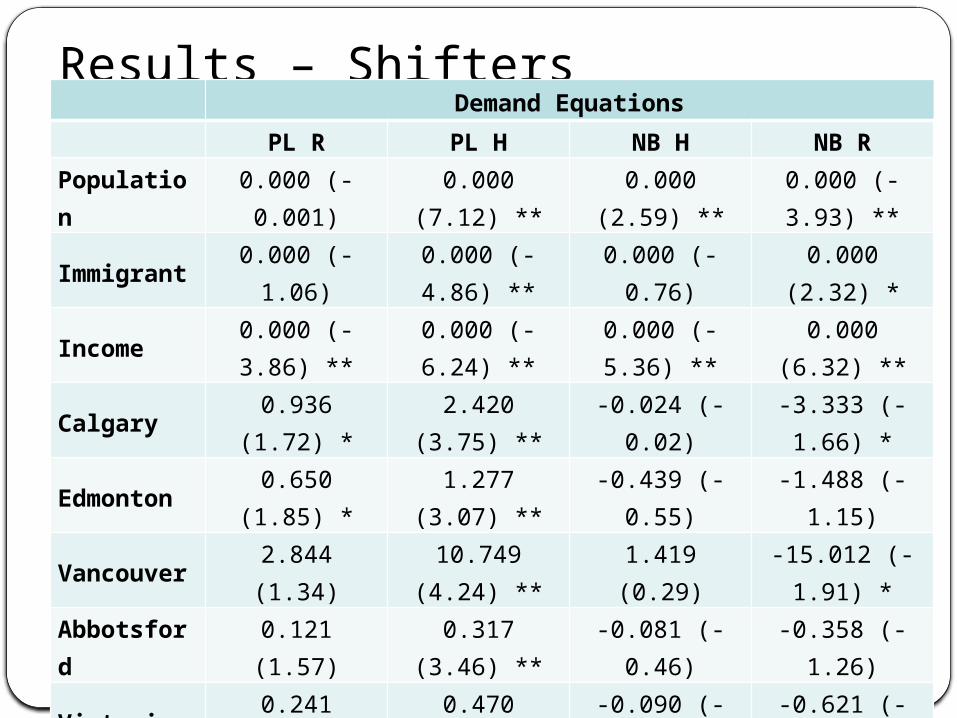
Results – Shifters Demand Equations
PL R PL H NB H NB R
Population 0.000 (-0.001) 0.000 (7.12) ** 0.000 (2.59) ** 0.000 (-3.93) **
Immigrant 0.000 (-1.06) 0.000 (-4.86) ** 0.000 (-0.76) 0.000 (2.32) *
Income 0.000 (-3.86) ** 0.000 (-6.24) ** 0.000 (-5.36) ** 0.000 (6.32) **
Calgary 0.936 (1.72) * 2.420 (3.75) ** -0.024 (-0.02) -3.333 (-1.66) *
Edmonton 0.650 (1.85) * 1.277 (3.07) ** -0.439 (-0.55) -1.488 (-1.15)
Vancouver 2.844 (1.34) 10.749 (4.24) ** 1.419 (0.29) -15.012 (-1.91) *
Abbotsford 0.121 (1.57) 0.317 (3.46) ** -0.081 (-0.46) -0.358 (-1.26)
Victoria 0.241 (2.07) * 0.470 (3.40) ** -0.090 (-0.34) -0.621 (-1.45)
Saskatoon 0.044 (4.03) ** -0.133 (-9.75) ** -0.173 (-6.93) ** 0.261 (6.76) **
Winnipeg 0.417 (1.93) * 0.726 (2.86) ** -0.371 (-0.77) -0.771 (-0.98)
Thunder Bay 0.031 (3.03) ** -0.034 (-2.79) ** -0.121 (-5.32) ** 0.125 (3.35) **
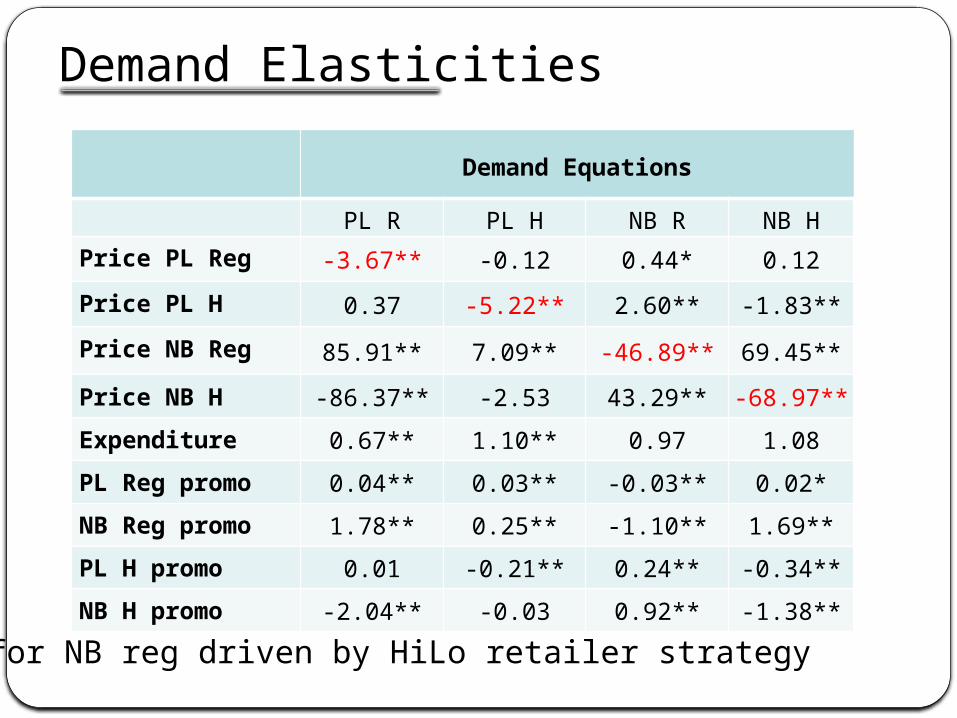
Demand Elasticities
Demand Equations
PL R PL H NB R NB HPrice PL Reg -3.67** -0.12 0.44* 0.12
Price PL H 0.37 -5.22** 2.60** -1.83**
Price NB Reg 85.91** 7.09** -46.89** 69.45**
Price NB H -86.37** -2.53 43.29** -68.97**
Expenditure 0.67** 1.10** 0.97 1.08PL Reg promo 0.04** 0.03** -0.03** 0.02*NB Reg promo 1.78** 0.25** -1.10** 1.69**PL H promo 0.01 -0.21** 0.24** -0.34**NB H promo -2.04** -0.03 0.92** -1.38**
ηii for NB reg driven by HiLo retailer strategy

Demand Elasticities Demand Equations
PL R PL H NB R NB H
Population 0.00 4.99** -3.84** 3.85**
Immigration -5.43 -10.74** 7.21* -3.56
Income -1.75** -1.17** 1.78** -2.34**
Calgary 0.98* 0.91** -0.57* -0.01
Edmonton 0.68 0.48** -0.25 -0.18
Vancouver 2.96 4.04** -2.55* 0.59
Abbotsford 0.12 0.12** -0.06 -0.03
Victoria 0.25* 0.17** -0.10 -0.04
Saskatoon 0.05** -0.05** 0.04** -0.07**
Winnipeg 0.43* 0.27** -0.13 -0.15
Thunder Bay 0.03** -0.01** 0.02** -0.05**

Conclusions • Increasing category-level concentration increases PL prices and lowers NB prices.
The evidence suggest that retailers are able to establish PL brand loyalty and can effectively narrow the price gap to competing NBs as they raise PL prices to improve profitability.
• PL promotion is an effective tool in PL-NB competition. Yet, demand is more responsive to NB price promotions.
• Cross-price elasticities are decidedly asymmetric. NBs price has a distinct impact on PL sales. The reverse impact of PL price on NB demand is much weaker. This is consistent with Cotterill and Putsis (2000) and Allenby and Rossi (1991).

[email protected] and [email protected]
Resource Economics & Environmental SociologyUniversity of Alberta
Research Funding: Alberta Livestock and Meat AgencyU of AlbertaSIEPR- Giannini
Private Label and National Brand Pricing and Promotional Strategies in Canadian Food
Retailing

Descriptive Stats II
Alberta West Saskatoon East Ontario
Share PL Reg 0.101 0.113 0.075 0.095 0.055
Share NB Reg 0.472 0.431 0.433 0.481 0.549
Share PL H 0.223 0.239 0.239 0.239 0.241
Share NB H 0.204 0.217 0.253 0.185 0.156
Price PL Reg 3.226 3.515 3.271 3.269 3.360
Price NB Reg 5.853 6.063 5.848 5.851 5.778
Price PL H 5.211 5.455 5.245 5.246 5.211
Price NB H 5.864 6.060 5.844 5.856 5.782


![01 Pakistan Waseem[1]](https://static.fdocuments.in/doc/165x107/577d234b1a28ab4e1e99722e/01-pakistan-waseem1.jpg)