Private Equity Waterfall and Carried Interest Provisions...
51
The audio portion of the conference may be accessed via the telephone or by using your computer's speakers. Please refer to the instructions emailed to registrants for additional information. If you have any questions, please contact Customer Service at 1-800-926-7926 ext. 10. NOTE: If you are seeking CPE credit , you must listen via your computer — phone listening is no longer permitted. Private Equity Waterfall and Carried Interest Provisions: Economic and Tax Implications for Investors and Sponsors Today’s faculty features: 1pm Eastern | 12pm Central | 11am Mountain | 10am Pacific TUESDAY, JUNE 14, 2016 Chris P. Kallos, Partner, Kirkland & Ellis, Chicago Daniel P. Meehan, Partner, Kirkland & Ellis, Chicago Presenting a 90-Minute Encore Presentation of the Webinar with Live, Interactive Q&A
-
Upload
duongxuyen -
Category
Documents
-
view
220 -
download
0
Transcript of Private Equity Waterfall and Carried Interest Provisions...

The audio portion of the conference may be accessed via the telephone or by using your computer's
speakers. Please refer to the instructions emailed to registrants for additional information. If you
have any questions, please contact Customer Service at 1-800-926-7926 ext. 10.
NOTE: If you are seeking CPE credit, you must listen via your computer — phone listening is no
longer permitted.
Private Equity Waterfall and Carried Interest
Provisions: Economic and Tax Implications
for Investors and Sponsors
Today’s faculty features:
1pm Eastern | 12pm Central | 11am Mountain | 10am Pacific
TUESDAY, JUNE 14, 2016
Chris P. Kallos, Partner, Kirkland & Ellis, Chicago
Daniel P. Meehan, Partner, Kirkland & Ellis, Chicago
Presenting a 90-Minute Encore Presentation of the Webinar with Live, Interactive Q&A

Tips for Optimal Quality
Sound Quality
If you are listening via your computer speakers, please note that the quality
of your sound will vary depending on the speed and quality of your internet connection.
If the sound quality is not satisfactory, you may listen via the phone: dial
1-888-450-9970 and enter your PIN when prompted. Otherwise, please
send us a chat or e-mail [email protected] immediately so we can address the
problem.
If you dialed in and have any difficulties during the call, press *0 for assistance.
NOTE: If you are seeking CPE credit, you must listen via your computer — phone
listening is no longer permitted.
Viewing Quality
To maximize your screen, press the F11 key on your keyboard. To exit full screen,
press the F11 key again.
FOR LIVE EVENT ONLY

Continuing Education Credits
In order for us to process your continuing education credit, you must confirm your
participation in this webinar by completing and submitting the Attendance
Affirmation/Evaluation after the webinar.
A link to the Attendance Affirmation/Evaluation will be in the thank you email that you
will receive immediately following the program.
For CPE credits, attendees must participate until the end of the Q&A session and
respond to five prompts during the program plus a single verification code. In addition,
you must confirm your participation by completing and submitting an Attendance
Affirmation/Evaluation after the webinar and include the final verification code on the
Affirmation of Attendance portion of the form.
For additional information about continuing education, call us at 1-800-926-7926 ext.
35.
FOR LIVE EVENT ONLY

Program Materials
If you have not printed the conference materials for this program, please
complete the following steps:
• Click on the ^ symbol next to “Conference Materials” in the middle of the left-
hand column on your screen.
• Click on the tab labeled “Handouts” that appears, and there you will see a
PDF of the slides for today's program.
• Double click on the PDF and a separate page will open.
• Print the slides by clicking on the printer icon.
FOR LIVE EVENT ONLY
Private Equity Waterfall and Carried Interest Provisions:
Economic and Tax Implications for Investors and Sponsors
Structuring Distribution Waterfalls, Carried Interest Clawbacks and Allocations;
Carried Interest Sharing at the Fund Sponsor Level;
Related Planning and Drafting to Address Tax Consequences
Chris P. Kallos, P.C.
Daniel P. Meehan, P.C.
Kirkland & Ellis LLP
June 14, 2016
© 2015 Kirkland & Ellis LLP KE Doc # 38766057

Overview
Typical waterfall variations and their economic implications for investors and the
sponsor
Carried interest clawbacks
Carried interest sharing arrangements at the general partner level
Tax ramifications, allocation provisions and tax distributions
www.kirkland.com 6

Terminology Waterfall
Investors / Limited Partners (“LPs”)
Sponsor / General Partner (“GP”)
Principals / GP Members
Carried Interest / Carry
Clawback
Preferred Return / Hurdle
Realized Investments
Management Fee
Expenses
Allocations vs Distributions
www.kirkland.com 7

Typical waterfall variations and their economic
implications for investors and the sponsor
www.kirkland.com 8

Return-of capital variations
Priority return of all contributed capital before distribution of any preferred return or carried
interest (“European waterfall”) (whether invested in realized or unrealized deals, or used for
expenses)
Return capital contributed for (or attributed to) “realized” investments only (“American
waterfall”) before carried interest distributions begin
Definition of “realized” varies in relation to loss investments
“Written-off” vs “written-down”
Tax definition vs GAAP definition
Possible middle ground: “fair value capital account” approach
GP may distribute carried interest to itself prior to full return of capital if/when:
LPs’ “fair value” capital accounts
+ cumulative distributions to LPs
[120%] of LP capital contributions
www.kirkland.com 9
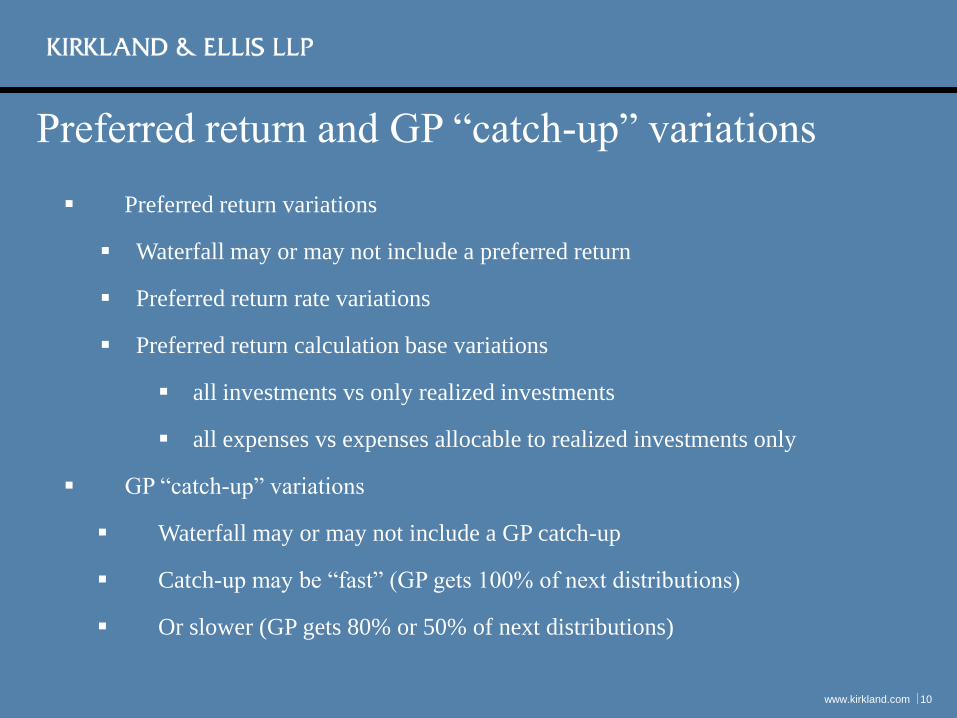
Preferred return and GP “catch-up” variations
www.kirkland.com 10
Preferred return variations
Waterfall may or may not include a preferred return
Preferred return rate variations
Preferred return calculation base variations
all investments vs only realized investments
all expenses vs expenses allocable to realized investments only
GP “catch-up” variations
Waterfall may or may not include a GP catch-up
Catch-up may be “fast” (GP gets 100% of next distributions)
Or slower (GP gets 80% or 50% of next distributions)

Hypothetical Fund
www.kirkland.com 11
Five investments made during investment period (cost $90m)
Sale of first investment (cost $20m) in Year 3
Sale of second investment (cost $20m) in Year 4
Cumulative fees/expenses as of Year 3 sale date = $5m ($2m allocable to first
investment), and $10m as of Year 4 sale date ($2m allocable to second
investment), all funded with capital contributions
GP’s capital commitment is $0

Deal-by-deal carried interest distributions; no preferred
return
www.kirkland.com 12
Yr 3 sale of first investment (cost $20m)
Five investments made as of sale date (cost $90m)
Cumulative expenses as of sale date = $5m ($2m allocated to first investment)
Yr 3 sale proceeds 52m
Cost 20m Investors
Expense recovery 2m Investors
Profit 30m
20% carried interest 6m GP
Residual 80% 24m Investors
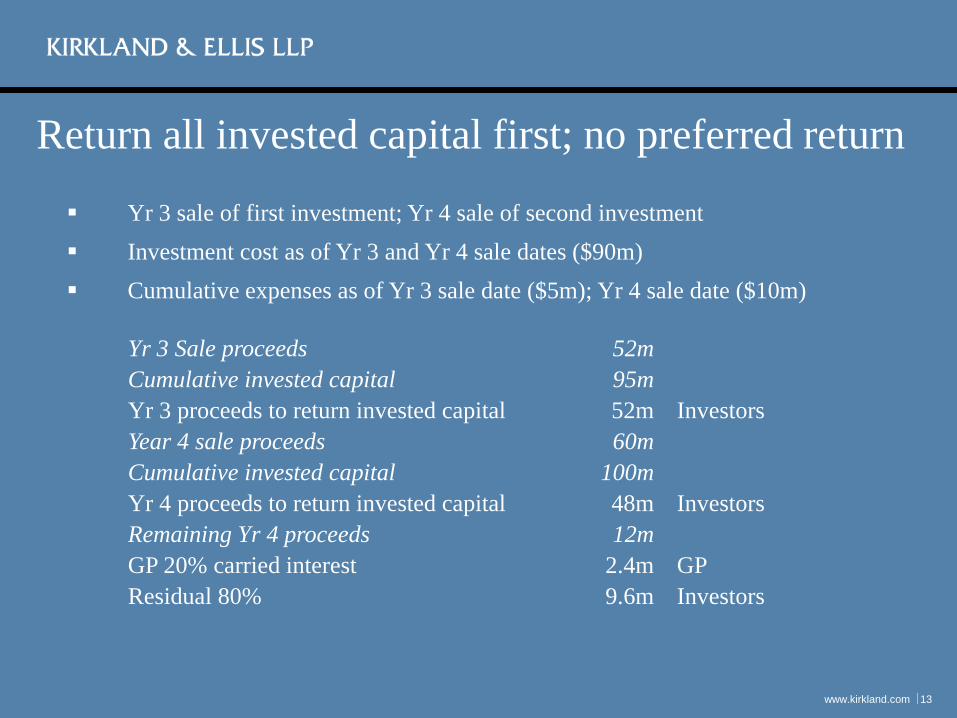
Return all invested capital first; no preferred return
www.kirkland.com 13
Yr 3 sale of first investment; Yr 4 sale of second investment
Investment cost as of Yr 3 and Yr 4 sale dates ($90m)
Cumulative expenses as of Yr 3 sale date ($5m); Yr 4 sale date ($10m)
Yr 3 Sale proceeds 52m
Cumulative invested capital 95m
Yr 3 proceeds to return invested capital 52m Investors
Year 4 sale proceeds 60m
Cumulative invested capital 100m
Yr 4 proceeds to return invested capital 48m Investors
Remaining Yr 4 proceeds 12m
GP 20% carried interest 2.4m GP
Residual 80% 9.6m Investors

Deal-by-deal carried interest distributions, with preferred
return
www.kirkland.com 14
Yr 3 sale of first investment (cost $20m)
Five investments made as of sale date (cost $90m)
Cumulative expenses as of sale date = $5m ($2m allocated to firstinvestment)
Cumulative preferred return as of sale date = $4m ($2m allocated to first investment)
Yr 3 sales proceeds 54m
Return cost of first investment 20m Investors
Expense recovery 2m Investors
Preferred return 2m Investors
Remaining Profit 30m
“GP catch-up” on preferred return 500k GP
Remaining Profit 29.5m
20% carried interest 5.9m GP
Residual 80% 23.6m Investors

Full return of capital, with preferred return
www.kirkland.com 15
Yr 3 sale of first investment; Yr 4 sale of second investment
Investments cost as of Yr 3 and Yr 4 sale dates ($90m)
Cumulative expenses as of Yr 3 sale date ($5m); Yr 4 sale date ($10m)
Cumulative preferred return as of Yr 4 sale date = $5m
Yr 3 Sale proceeds 54m
Cumulative invested capital 95m
Yr 3 proceeds to return invested capital 54m Investors
Year 4 sale proceeds 60m
Cumulative invested capital 100m
Yr 4 proceeds to return invested capital 46m Investors
Preferred return 5m Investors
Remaining Yr 4 proceeds 9m
GP catch-up on preferred return 1.25m GP
Remaining Profit 7.75m
20% carried interest 1.55m GP
Residual 80% 6.2m Investors

GP catch-up: none
www.kirkland.com 16
Permanent preferred return (rare outside of some real estate funds)
Carried interest computed only on excess profit after subtracting preferred return (i.e., no GP catch-up)
Example
Cumulative profit 100m
Cumulative preferred return 10m Investors
Carried interest 18m GP
Residual 80% 72m Investors
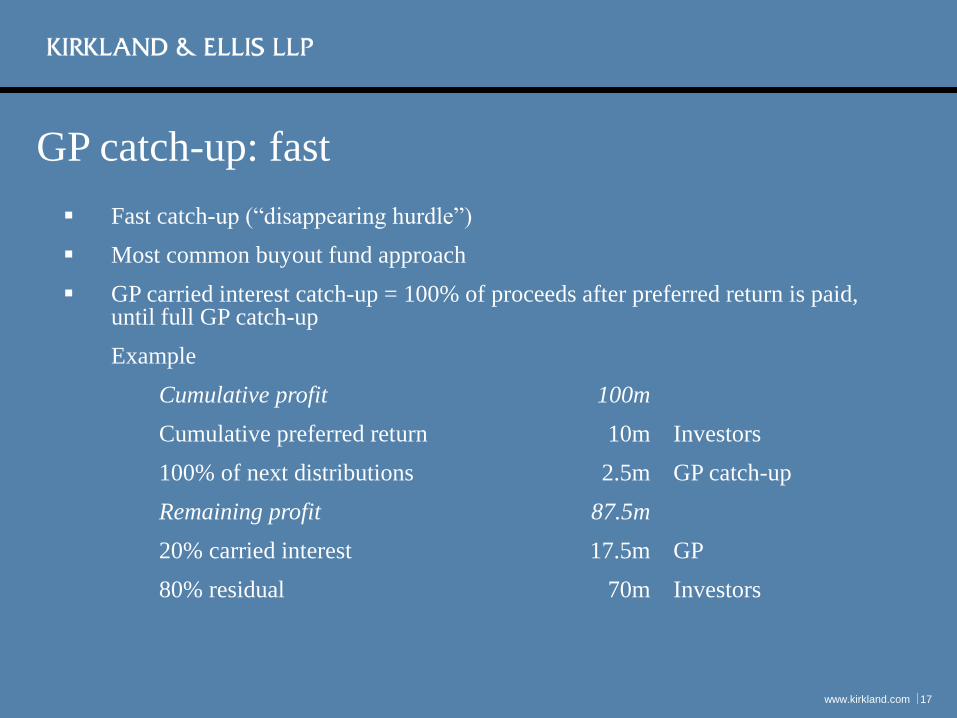
GP catch-up: fast
www.kirkland.com 17
Fast catch-up (“disappearing hurdle”)
Most common buyout fund approach
GP carried interest catch-up = 100% of proceeds after preferred return is paid, until full GP catch-up
Example
Cumulative profit 100m
Cumulative preferred return 10m Investors
100% of next distributions 2.5m GP catch-up
Remaining profit 87.5m
20% carried interest 17.5m GP
80% residual 70m Investors

GP catch-up: slow
Slow catch-up (hurdle “disappears” more gradually)
GP carried interest catch-up = 50% of proceeds after preferred return is paid, until
full GP catch-up
Example
Cumulative profit 100m
Cumulative preferred return 10m Investors
Next distributions 6.67m
50% to GP (catch-up) 3.33m GP
50% to Investors 3.33m Investors
Remaining profit 83.33m
20% carried interest 16.67m GP
80% residual 66.67m Investors
www.kirkland.com 18

Partner-by-partner vs aggregated waterfall
www.kirkland.com 19
Facilitates drafting for:
Reduction/elimination of fee and carry burden for certain partners (e.g., GP and estate planning vehicles of the Principals)
Excuse/exclusion of particular partners from specific investments
Incremental accounting complexity is modest
Typically implemented as follows:
Apportion distributions pro rata (according to capital contributions for the investment) among all partners participating in the particular investment
Distribute GP/affiliated partners’ apportioned amount to them
Amount apportioned to each other partner runs through waterfall

Other considerations
www.kirkland.com 20
Losses / write-offs / write-downs
Capital called in increments over investment period
Tax distributions (discussed later)
In-kind distributions
Liquidation
“Distribution-driven” vs
“Allocation-driven”

Carried interest clawbacks
www.kirkland.com 21

Carried interest clawback basics
www.kirkland.com 22
If GP is distributed (a) more than its carried interest percentage (e.g., 20%) of
cumulative net profits (over the fund’s life), or (b) any carried interest in a fund
that ultimately does not satisfy the preferred return hurdle, GP must return any
overdistributed carried interest (subject to a cap equal to the aggregate after-tax
carried interest it received) to the partnership
Why does it happen?
Capital called in increments
American waterfall
Preferred return accrual
Can it happen with a European waterfall?
Tax considerations discussed later
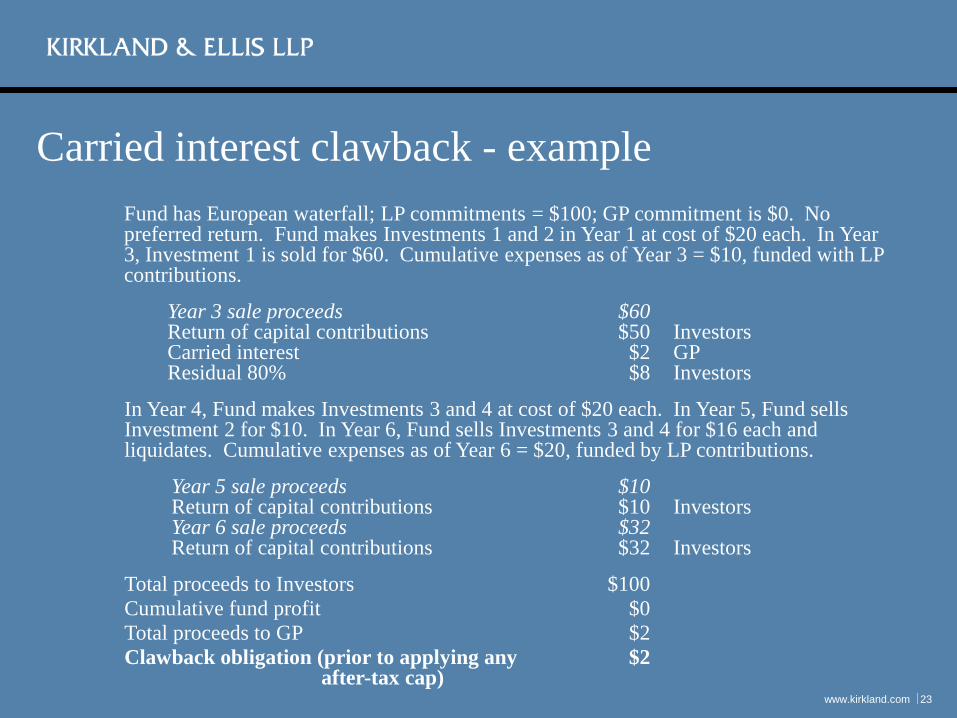
Carried interest clawback - example
www.kirkland.com 23
Fund has European waterfall; LP commitments = $100; GP commitment is $0. No preferred return. Fund makes Investments 1 and 2 in Year 1 at cost of $20 each. In Year 3, Investment 1 is sold for $60. Cumulative expenses as of Year 3 = $10, funded with LP contributions.
Year 3 sale proceeds $60 Return of capital contributions $50 Investors Carried interest $2 GP Residual 80% $8 Investors
In Year 4, Fund makes Investments 3 and 4 at cost of $20 each. In Year 5, Fund sells Investment 2 for $10. In Year 6, Fund sells Investments 3 and 4 for $16 each and liquidates. Cumulative expenses as of Year 6 = $20, funded by LP contributions.
Year 5 sale proceeds $10 Return of capital contributions $10 Investors Year 6 sale proceeds $32 Return of capital contributions $32 Investors
Total proceeds to Investors $100
Cumulative fund profit $0
Total proceeds to GP $2
Clawback obligation (prior to applying any $2 after-tax cap)

Carried interest sharing arrangements at the
general partner level
www.kirkland.com 24
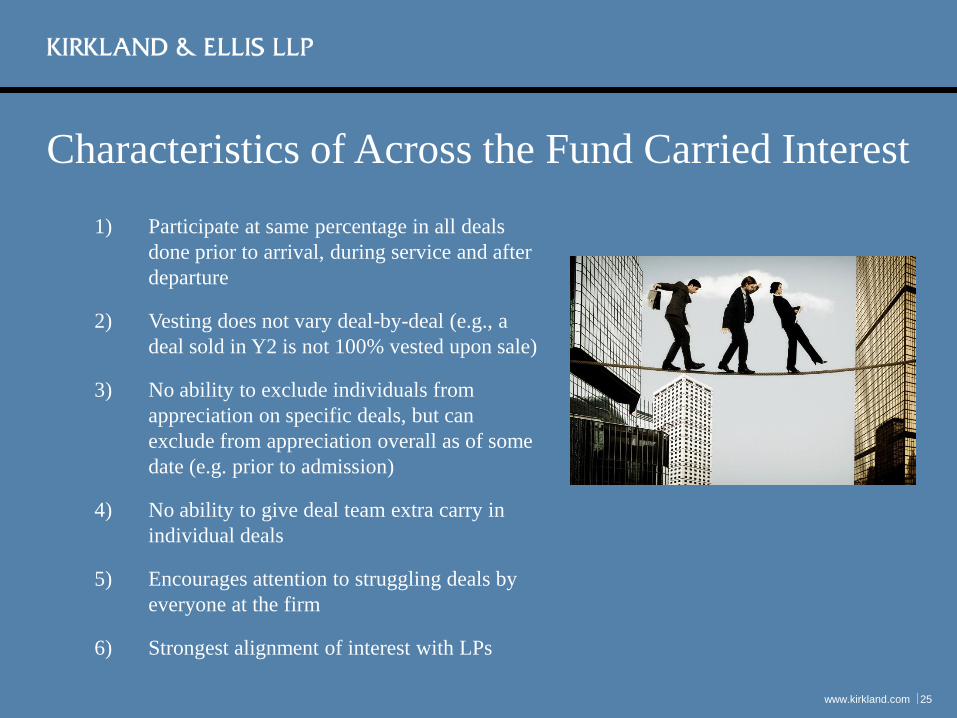
Characteristics of Across the Fund Carried Interest
1) Participate at same percentage in all deals
done prior to arrival, during service and after
departure
2) Vesting does not vary deal-by-deal (e.g., a
deal sold in Y2 is not 100% vested upon sale)
3) No ability to exclude individuals from
appreciation on specific deals, but can
exclude from appreciation overall as of some
date (e.g. prior to admission)
4) No ability to give deal team extra carry in
individual deals
5) Encourages attention to struggling deals by
everyone at the firm
6) Strongest alignment of interest with LPs
www.kirkland.com 25
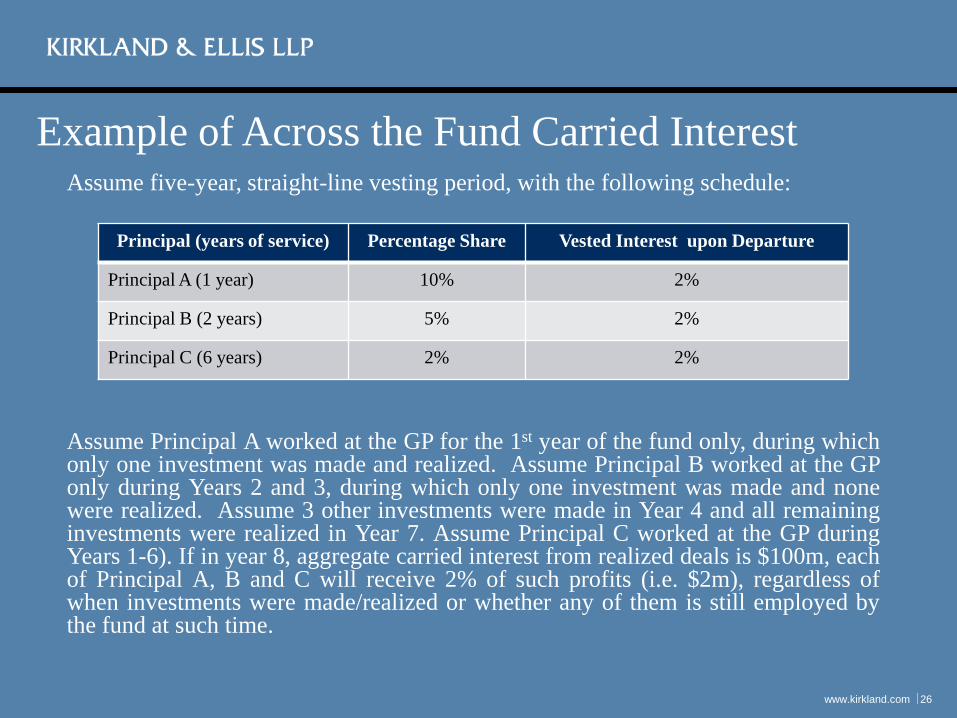
Example of Across the Fund Carried Interest
www.kirkland.com 26
Assume five-year, straight-line vesting period, with the following schedule:
Assume Principal A worked at the GP for the 1st year of the fund only, during which only one investment was made and realized. Assume Principal B worked at the GP only during Years 2 and 3, during which only one investment was made and none were realized. Assume 3 other investments were made in Year 4 and all remaining investments were realized in Year 7. Assume Principal C worked at the GP during Years 1-6). If in year 8, aggregate carried interest from realized deals is $100m, each of Principal A, B and C will receive 2% of such profits (i.e. $2m), regardless of when investments were made/realized or whether any of them is still employed by the fund at such time.
Principal (years of service) Percentage Share Vested Interest upon Departure
Principal A (1 year) 10% 2%
Principal B (2 years) 5% 2%
Principal C (6 years) 2% 2%

Characteristics of Deal-by-Deal Carried Interest
1) Ability for people to “own their deals”
2) Ability to incentivize “venture partners” or others who may be hired only for
one or a limited number of companies
3) Ability to have investment principals only participate in deals done while they
are at the firm, and not before or after
4) Ability to accelerate vesting on realized deals or to otherwise have deal-by-
deal vesting (can avoid deals done near the end of the commitment period
being substantially vested at closing)
5) Ability to promote people over time into larger shares of carry on some, but
not all, deals
www.kirkland.com 27

Deal-by-Deal Carry Sharing Approaches
1) Some variation of the “let the
chips fall where they may”
approach
2) Equalize distribution ratios
www.kirkland.com 28

Examples of Deal-by-Deal Carried Interest
www.kirkland.com 29
Assume that each Principal receives 10% of the carried interest generated by its own deals and 5% of the carried interest generated by any other deals (and none has left the firm).
Sale of Principal A’s deal 100m profit (20m carried interest)
2m Principal A
1m Principal B
1m Principal C
Sale of Principal B’s deal 100m profit (20m carried interest)
1m Principal A
2m Principal B
1m Principal C
Sale of Principal C’s deal 100m profit (20m carried interest)
1m Principal A
1m Principal B
2m Principal C
Aggregate carried interest of $60m from the fund, allocated $4m to each Principal. All deals were profitable, and carry allocations align generally with results.
Examples of Deal-by-Deal Carried Interest
www.kirkland.com 30
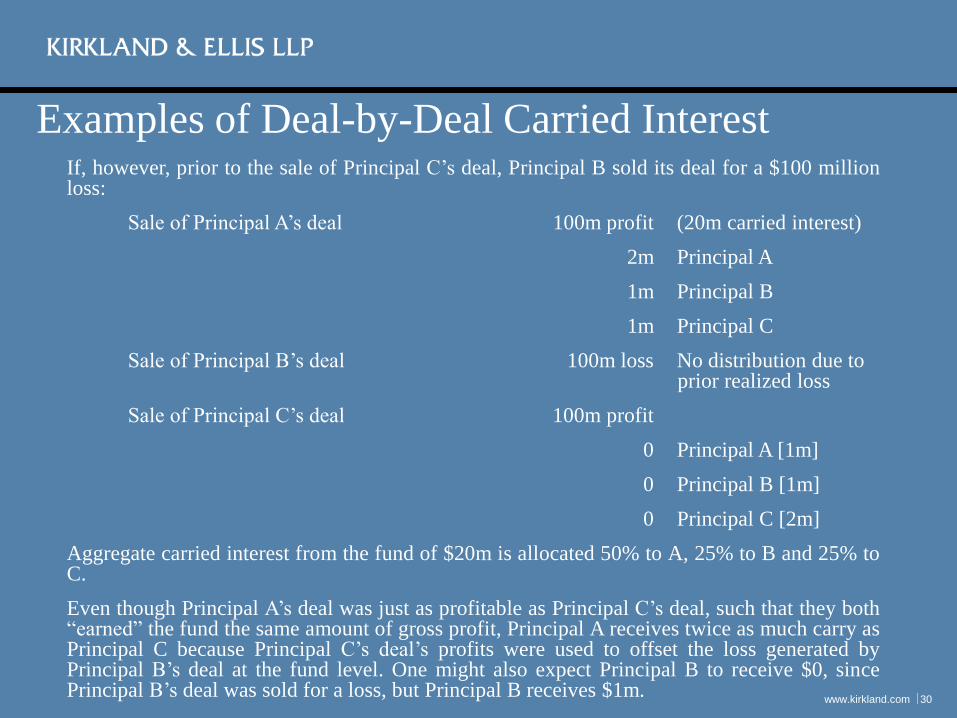
If, however, prior to the sale of Principal C’s deal, Principal B sold its deal for a $100 million loss:
Sale of Principal A’s deal 100m profit (20m carried interest)
2m Principal A
1m Principal B
1m Principal C
Sale of Principal B’s deal 100m loss No distribution due to prior realized loss
Sale of Principal C’s deal 100m profit
0 Principal A [1m]
0 Principal B [1m]
0 Principal C [2m]
Aggregate carried interest from the fund of $20m is allocated 50% to A, 25% to B and 25% to C.
Even though Principal A’s deal was just as profitable as Principal C’s deal, such that they both “earned” the fund the same amount of gross profit, Principal A receives twice as much carry as Principal C because Principal C’s deal’s profits were used to offset the loss generated by Principal B’s deal at the fund level. One might also expect Principal B to receive $0, since Principal B’s deal was sold for a loss, but Principal B receives $1m.
Examples of Deal-by-Deal Carried Interest
www.kirkland.com 31
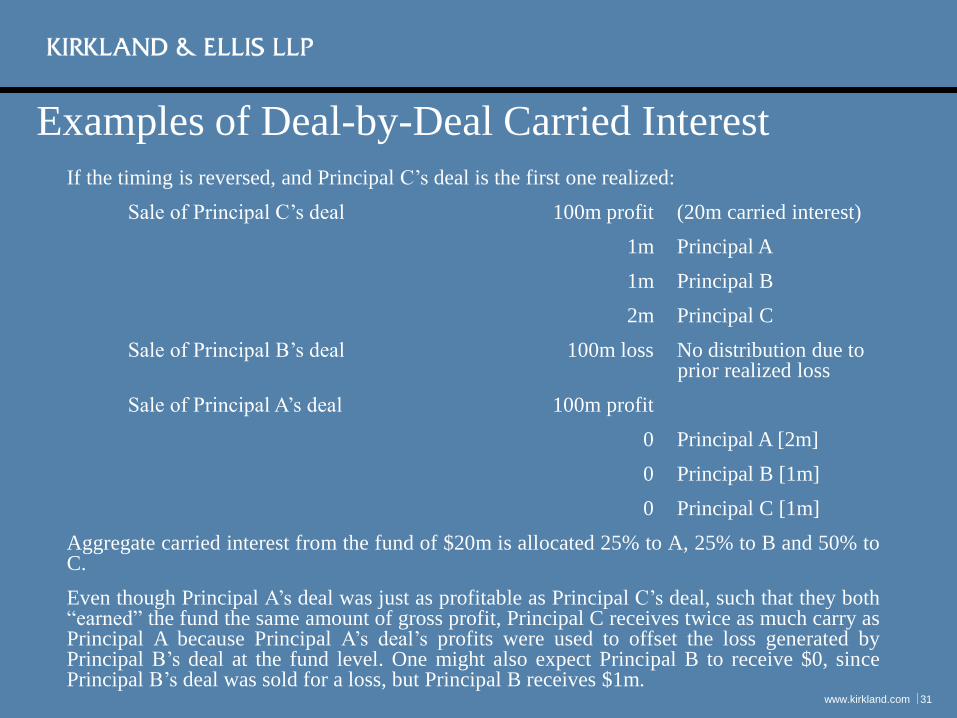
If the timing is reversed, and Principal C’s deal is the first one realized:
Sale of Principal C’s deal 100m profit (20m carried interest)
1m Principal A
1m Principal B
2m Principal C
Sale of Principal B’s deal 100m loss No distribution due to prior realized loss
Sale of Principal A’s deal 100m profit
0 Principal A [2m]
0 Principal B [1m]
0 Principal C [1m]
Aggregate carried interest from the fund of $20m is allocated 25% to A, 25% to B and 50% to C.
Even though Principal A’s deal was just as profitable as Principal C’s deal, such that they both “earned” the fund the same amount of gross profit, Principal C receives twice as much carry as Principal A because Principal A’s deal’s profits were used to offset the loss generated by Principal B’s deal at the fund level. One might also expect Principal B to receive $0, since Principal B’s deal was sold for a loss, but Principal B receives $1m.

Is there a fairer way to apportion net carried
interest under the deal-by-deal approach?
www.kirkland.com 32
Examples of Deal-by-Deal Carried Interest – Equalized
Distribution Ratios
www.kirkland.com 33
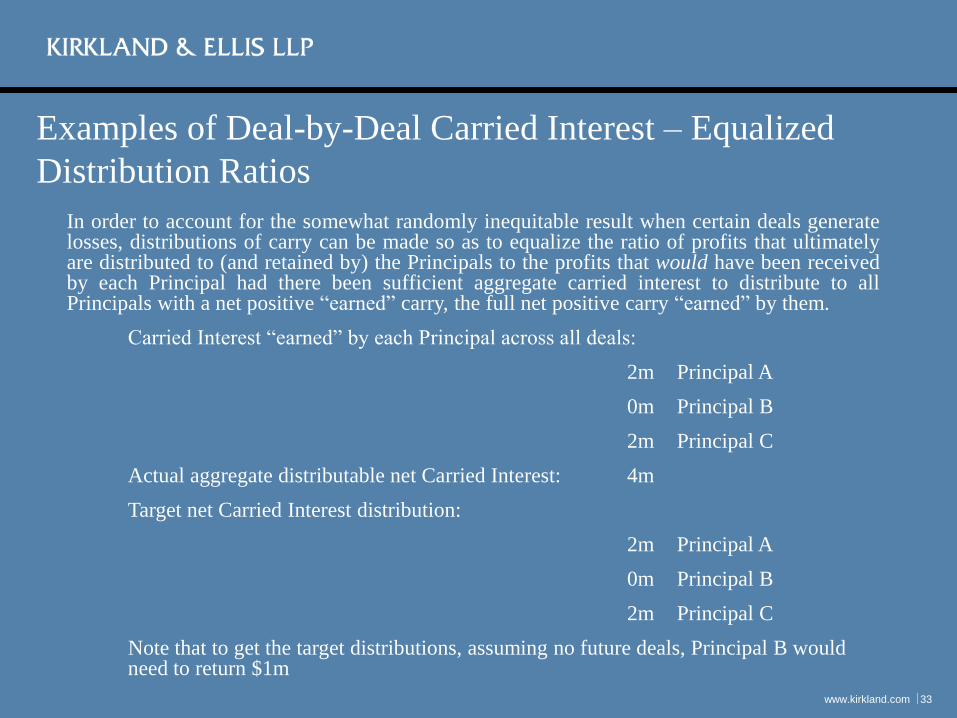
In order to account for the somewhat randomly inequitable result when certain deals generate losses, distributions of carry can be made so as to equalize the ratio of profits that ultimately are distributed to (and retained by) the Principals to the profits that would have been received by each Principal had there been sufficient aggregate carried interest to distribute to all Principals with a net positive “earned” carry, the full net positive carry “earned” by them.
Carried Interest “earned” by each Principal across all deals:
2m Principal A
0m Principal B
2m Principal C
Actual aggregate distributable net Carried Interest: 4m
Target net Carried Interest distribution:
2m Principal A
0m Principal B
2m Principal C
Note that to get the target distributions, assuming no future deals, Principal B would need to return $1m

Examples of Deal-by-Deal Carried Interest – Equalized
Distribution Ratios
www.kirkland.com 34
If there were a second deal by Principal C (for a total of 4 deals), which was sold for a $200m profit, the “earned” carried interest would be each Principal across all deals would be for:
4m Principal A
2m Principal B
6m Principal C
Actual aggregate distributable net Carried Interest: 12m
Target Carried Interest distribution for Deal 4 assuming prior distributions made per the prior example with no distributions returned by Principal B:
Prior Carry
Distributions
Target Carry Incremental
Carry
Distributions
Principal A 2m 4m 2m
Principal B 1m 2m 1m
Principal C 1m 6m 5m
Selected tax considerations
www.kirkland.com 35
Overview
www.kirkland.com 36
Flow-through taxation
Capital accounts / allocation basics
Carried interest and phantom income
Carried interest clawbacks: tax considerations
Expense allocations
Tax distributions

Capital accounts and income/loss allocations
www.kirkland.com 37
What is a capital account and how is it adjusted?
Contributions, distributions, profit allocations, loss allocations
Types of capital accounts
Financial reporting / GAAP
704(b) capital account maintenance
Allocations of tax items

Interaction between capital accounts and partner economics
www.kirkland.com 38
Allocation-driven agreements
Liquidation based on capital account balances
Means partner economics are ultimately dictated by allocations of income and loss among capital accounts
Greater tax certainty; potential economic uncertainty
Distribution-driven agreements
Liquidation based on distribution waterfall
Means partner economics are dictated by the distribution waterfall
Greater economic certainty; potential tax uncertainty

Fund allocations – underlying principles
www.kirkland.com 39
Key point: allocations of income may precede or follow distributions of cash – can have tax without cash, or cash without tax
Distribution-driven agreement: drive each partner’s capital account to match that partner’s distributable amount in “hypothetical liquidation”
Use of 704(b) “book” value in hypothetical liquidation
Allocation-driven agreement: same fundamental principle guides drafting of allocation language, but allocations ultimately dictate distribution amounts
Starting point: capital contributions are credited to capital accounts
Typically allocate only realized gains/losses for tax purposes
Book-ups rare in PE, venture and debt funds
Built-in gains also rare at fund level
In profitable years, expense allocations follow profit allocations unless specific economic deal says otherwise

Sample allocation format: allocation-driven LPA
www.kirkland.com 40
(a) Profits:
(i) Reverse residual loss allocations (i.e., tier (b)(iv) below)
(ii) Preferred Return allocation
(iii) GP catch-up
(iv) 80% to all Partners; 20% to GP (carried interest)
(b) Losses:
(i) Reverse residual profits (i.e., 80/20 profits)
(ii) Reverse GP catch-up
(iii) Reverse preferred return allocations
(iv) To the partners in proportion to their capital commitments

Allocation-driven LPA (cont’d)
www.kirkland.com 41
Regulatory allocation provisions
Qualified income offset
Minimum gain chargebacks
Nonrecourse deductions
Rarely come into play for plain vanilla buyout/venture fund investing only in corporations
More relevant for real estate funds and flow-through investments
“Fractions rule” (for real estate funds)

Sample allocation language: distribution-driven LPA
www.kirkland.com 42
Items of Partnership income, gain, loss, expense or deduction for any fiscal period shall be allocated among the Partners in such manner that, as of the end of such fiscal period and to the greatest extent possible, the Capital Account of each Partner shall be equal to the respective net amount, positive or negative, that would be distributed to such Partner from the Partnership or for which such Partner would be liable to the Partnership under this Agreement, determined as if, on the last day of such fiscal period, the Partnership were to (a) liquidate the Partnership’s assets for an amount equal to their book value (determined according to the rules of Treas. Reg. §1.704-1(b)(2)(iv)) and (b) distribute the proceeds in liquidation in accordance with [Liquidation Provision / Distribution Waterfall].
References to “minimum gain” sometimes included
Some regulatory allocation language often included

Fund allocations – hypothetical liquidation
www.kirkland.com 43
Example
American waterfall; all capital from LPs
Three investments made as of Year 3 (cost $30m each)
No prior exits
Investment 1 sold for $55m in Year 5
Ignore expenses for simplicity
Cumulative preferred return as of sale date = $12m ($4m allocable to Investment 1)
FMV of remaining investments $200

Hypothetical liquidation (cont’d)
www.kirkland.com 44
Distributions
Yr 5 sales proceeds 55m
Return cost of first investment 30m Investors
Preferred return 4m Investors
Remaining Proceeds 21m
“GP catch-up” on preferred return 1m GP
Remaining Proceeds 20m
20% carried interest 4m GP
Residual 80% 16m Investors
Allocations Investors GP Total
Capital accounts on Day 1, Year 5 $90m $0
Year 5 distributions ($50m) ($5m) $55m
Year 5 capital accounts before allocations $40m ($5m) $35m
Year 5 net profit $35m
Cumulative net profit $35m
Distribution entitlement in hypothetical liquidation $68m $2m $70m
Year 5 profit allocation $28m $7m $35m
Ending capital accounts $68m $2m $70m
Note: FMV of remaining investments ignored (hypothetical liquidation is based on book value.

Carried interest and “phantom income”
www.kirkland.com 45
How does it happen? Examples:
European waterfall – various scenarios
Any time realized gain exceeds prior losses and accrued preferred return but LPs have not received distributions equal to invested capital plus preferred return
Example: early winner after multiple investments with no prior realizations
American waterfall with prior write-offs that may not yet have resulted in tax loss allocations
Recycling
Carried interest - phantom income Example 1
www.kirkland.com 46
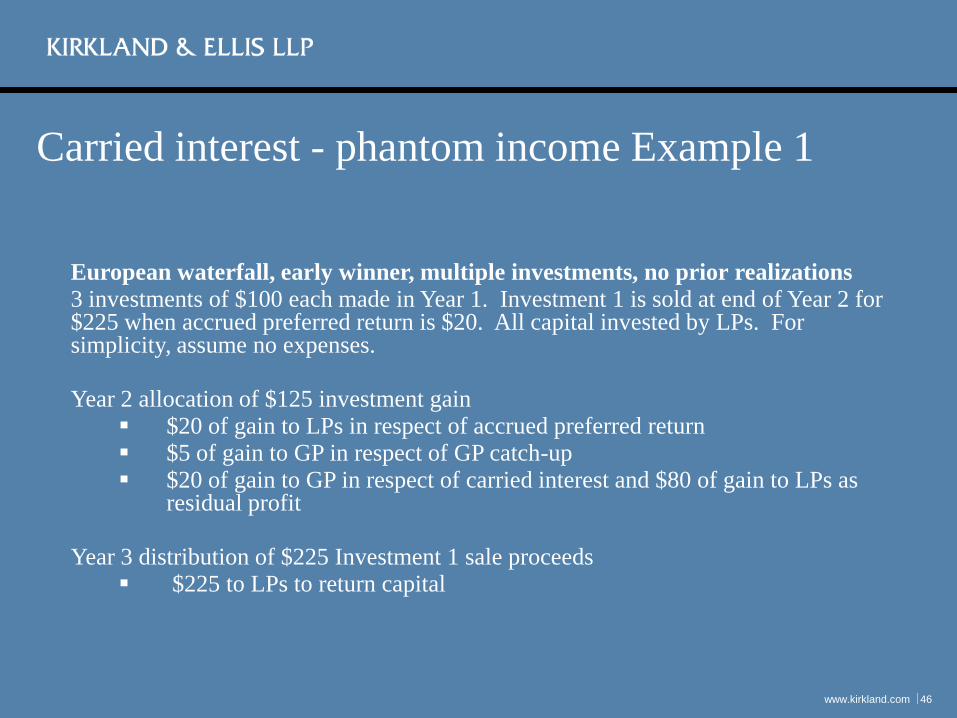
European waterfall, early winner, multiple investments, no prior realizations
3 investments of $100 each made in Year 1. Investment 1 is sold at end of Year 2 for $225 when accrued preferred return is $20. All capital invested by LPs. For simplicity, assume no expenses.
Year 2 allocation of $125 investment gain
$20 of gain to LPs in respect of accrued preferred return $5 of gain to GP in respect of GP catch-up $20 of gain to GP in respect of carried interest and $80 of gain to LPs as
residual profit
Year 3 distribution of $225 Investment 1 sale proceeds $225 to LPs to return capital

Carried interest - phantom income Example 2
www.kirkland.com 47
American waterfall, prior writeoffs not yet “realized” for tax purposes 3 investments of $100 each made in Year 1. Investment 1 is written down to $0 for GAAP purposes in Year 2, but not yet written off for tax purposes. Investment 2 is sold at end of Year 3 for $240 when accrued preferred return is $32. All capital invested by LPs. For simplicity, assume no expenses.
Year 3 allocation of $140 investment gain
$32 of gain to LPs in respect of accrued preferred return $8 of gain to GP in respect of GP catch-up $20 of gain to GP in respect of carried interest and $80 of gain to LPs as
residual profit
Year 3 distribution of $240 Investment 1 sale proceeds $100 to LPs to return capital for Investment 1 (“realized” due to GAAP
writedown) $100 to LPs to return capital for Investment 2 $32 to LPs as accrued preferred return $8 to GP as GP catch-up
Carried interest clawbacks – tax considerations
www.kirkland.com 48
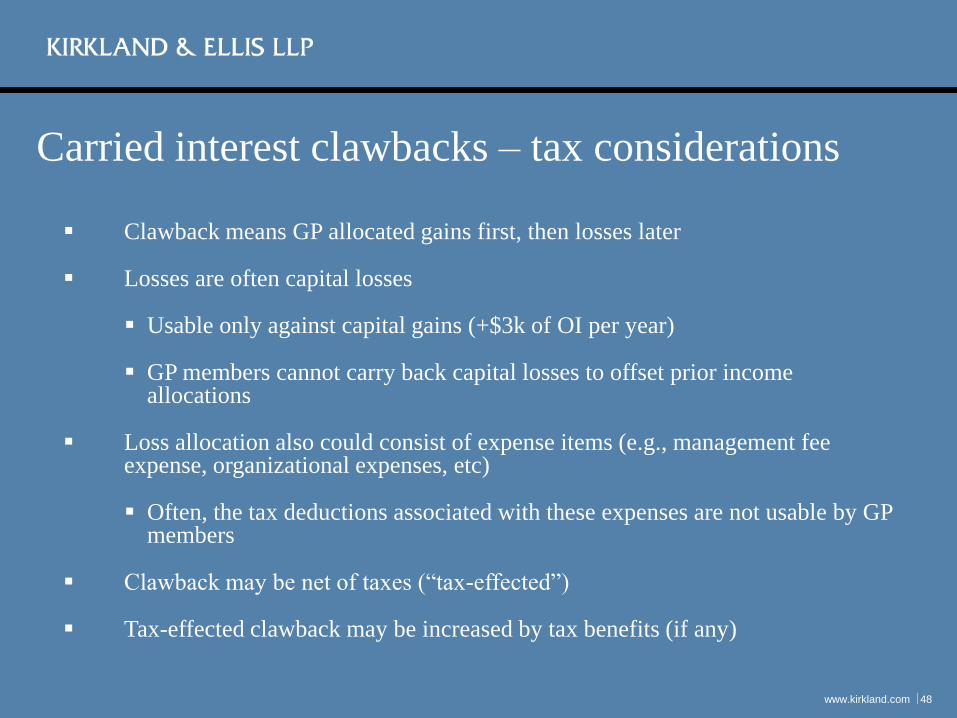
Clawback means GP allocated gains first, then losses later
Losses are often capital losses
Usable only against capital gains (+$3k of OI per year)
GP members cannot carry back capital losses to offset prior income allocations
Loss allocation also could consist of expense items (e.g., management fee expense, organizational expenses, etc)
Often, the tax deductions associated with these expenses are not usable by GP members
Clawback may be net of taxes (“tax-effected”)
Tax-effected clawback may be increased by tax benefits (if any)

Carried interest clawbacks – effect on allocations of
profits/losses to capital accounts
www.kirkland.com 49
GP clawback drives allocations of taxable income/loss
GP clawback arises only if GP has received carried interest distributions
GP with clawback almost always has been allocated taxable income
Distribution-driven LPA
Hypothetical liquidation must take into account clawback obligation
If clawback would occur, losses/expenses are allocated to GP
Allocation-driven LPA
Same result ; different language
In loss years, fund typically allocates loss first to GP to reverse prior allocations of carried interest

Fund allocations – expenses (distribution-driven agreement)
www.kirkland.com 50
3 investments of $100 each made in Year 1. Investment 1 is sold at end of Year 2 for $210. Expenses in each of Years 1 and 2 = $10 of management fees (each year). For simplicity, assume no preferred return. LPs contribute all capital. Carried interest is computed net of expenses.
Year 1 allocation of $10 management fee expense: All to LPs Year 2 allocation of $110 investment gain
$10 to LPs to reverse Year 1 expense allocation $20 of gain to GP in respect of carried interest and $80 of gain to LPs as
residual profit
Year 2 allocation of $10 management fee expense Follows gains: $2 to GP and $8 to LP (ignores reversal of prior losses)
Problem: Management fee expense deductions likely not usable by GP members
• But GP members are taxable on the management fee income • Can we specially allocate expenses entirely to LPs?
Tax distributions
www.kirkland.com 51
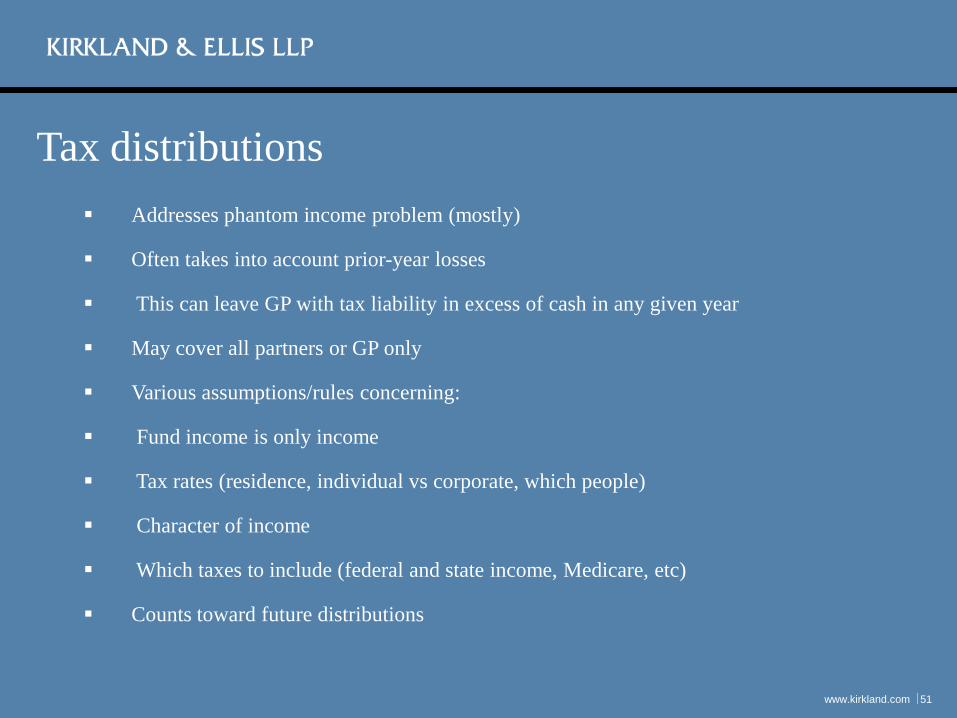
Addresses phantom income problem (mostly)
Often takes into account prior-year losses
This can leave GP with tax liability in excess of cash in any given year
May cover all partners or GP only
Various assumptions/rules concerning:
Fund income is only income
Tax rates (residence, individual vs corporate, which people)
Character of income
Which taxes to include (federal and state income, Medicare, etc)
Counts toward future distributions