Private Equity in Africa
51
Private Equity in Africa April 2014 1
Transcript of Private Equity in Africa

Private Equity
in Africa
April 2014
1

Content
▪ Introduction to the project
▪ Africa as an investment destination
▪ Private Equity in Africa
▪ Proposed Investment Strategy
▪ Conclusion
2

The Project
Maera Capital, an investment and advisory firm specialized in Africa and
with offices in London (UK) and Casablanca (Morocco), has asked a group
of five INSEAD MBA students (Astrid Suermondt, Francisco Meneses,
Helene Baudon, Jorge Fernández Vidal and Wafic Mounla) to assist them in
the analysis of the Private Equity market in Africa, as part of INSEAD’s
Private Equity class with Professor Vikas Aggarwal
In this project, we have tried to provide a brief overview of the Private Equity
market in Africa and have outlined a potential investment strategy for Maera
Capital
For this purpose, we have carried out extensive desk research and have
interviewed a number of PE practitioners in Africa, as well as consultants,
academics and operators during the months of March and April of 2014
3

Content
▪ Introduction to the project
▪ Africa as an investment destination
▪ Private Equity in Africa
▪ Proposed Investment Strategy
▪ Conclusion
4

Africa is the fastest
growing continent
in the world, and its
increasing income
and population
create significant
opportunities for
investors
Sub-Saharan Africa has recently been one of the fastest growing
regions in the world and it is expected to continue the trend
Sub-Saharan countries
1.8951.292
731331
8977476571.016
211133
7028
2018 2013 2001 2006
GDP (current)
$ billion
Population
# billion
Fixed Investment
$ billion
Source: Global Insight
1.6281.4101.2181.032Real GDP per
capita
$
5

Institutional reforms and an increasing middle class are creating
opportunities for investment
“350 million Africans now earn between $2 and $20
per day and are increasing the ranks of Africa’s
middle class”
African Development Bank, Annual Development
Effectiveness 2013
“After years of headlines about Africa's poverty, its
emerging middle class is now grabbing attention as
a driver of growth and democracy and an
expanding pool of consumers for market-hungry
retailers”
Reuteurs, “Africa's emerging middle class drives
growth and democracy” - 2013, May 10
“More than two-thirds of African countries have
improved their quality of governance, leading to a
better business climate, improved basic services
and expanded economic opportunities”
African Development Bank, Annual Development
Effectiveness 2013
“These structural changes have helped invigorate
markets and commerce, creating an environment
that is increasingly conducive to business and
investment. Furthermore, widespread reform,
together with steady improvements in political
governance, the commodities boom, substantially
increased levels of disposable income, urbanization
and a rapidly developing services sector, have
contributed to a continued and, what we believe to
be, a sustainable growth path for Africa,
“Building Bridges - Africa” Ernst & Young’s 2012
attractiveness survey
6

Content
▪ Introduction to the project
▪ Africa as an investment destination
▪ Private Equity in Africa
▪ Proposed Investment Strategy
▪ Conclusion
7

Private Equity is set to grow rapidly across Africa, but there are
some specific opportunities that should not be overlooked
Source: “Uncovering hidden investment opportunities in Africa”, McKinsey & Company
Demand for capital in
Africa is expected to grow
by 8% p.a. from 2014-
2018
There are wide variations
by country and industry
and there seems to be a
mismatch between supply
and demand for capital
Small and mid cap funds
in East, West and
Southern Africa
(excluding South Africa)
seem to be very
attractive, with growing
capital needs but relatively
limited funding
8

Most PE investors (+60%) focus on growth, infrastructure, buyout
and venture funds
Preferred investment strategies for PE funds in Africa in 2013
% # of respondents
1 Includes Co-Investment (4%), Early Stage (4%), Mezzanine (2%) and Infrastructure Fund of Funds (2%)
Source: “How do private equity investors create value”, 2013 Study, EY and AVCA
Growth 21%
Infrastructure 16%
Buyout 12%
Venture 11%
Fund of Funds 10%
Expansion / late stage
7%
Natural Resources
7%
Real Estate 6%
Other1 12%
9

Most deals are achieved via relationship or network, and funds
typically take a minority stake
Source: “How do private equity investors create value”, 2013 Study, EY and AVCA
Sourcing of deals Participation on deals
9% of deals made through auctions (vs.
proprietary deals)
80% of auctions took place in South Africa,
but number is increasing in other countries
as well
Majority
stake
20% Minority
stake
80%
Use of minority protection rights to influence
management and direction of a company, :
Board seats
Veto rights on major decisions
Right to change management
Right to change auditor
Importance of being comfortable with existing
management team:
Prior relationship with management team
helps
Due diligence of management is critical
Relation-ship /
Network 48%
Sector tracking
33%
Opportu-nities
brought to PE 14%
Other 5%
10
% # of deals % # of deals

Southern Africa as a region, and the financial and industrial goods
sectors have the highest share of exits in Africa
Source: “How do private equity investors create value”, 2013 Study, EY and AVCA
Geography breakdown Sector breakdown
11%
11%
42%
25%
11%
118 exits between 2007 and 2012
South Africa, Nigeria, Egypt, Kenya
and Ghana accounted for 74% of the
exits
23% Financials
13% Industrial goods
9% Food & beverage
9% Agriculture
Utilities, oil & gas
Travel & leisure
2%
1%
3%
3% Mining & metals
Media
Autimobile & parts
3%
Health care
Business services
Construction
6%
Retail & consumer goods
8%
6%
Telecommunications
4%
5%
Technology
8%
11
% # of deals % # of deals

Local and regional strategic buyers are responsible for the
majority of purchases from PE funds
Source: “How do private equity investors create value”, 2013 Study, EY and AVCA
Exit route
23%
32%
18%
14%
52%
14%
29%
55%
21%
47%
63%11%
12%
7%
8%
11%
12%
12%
11%
12%
7%
12% 12%
51%
41%
2007
2009
2008
4% 2011
2010
2012
4%
5%
Trade
Private
Stock sale on public market
IPO
Creditors / banks PE
Breakdown of exits by trade buyer
50% 40%
40%
33%40% 33%40% 33%
20% 25%
20m-50m 0m-5m 5m-20m
25%
20%
50m+
Local buyer
Multinational buyer
Regional buyer
Average exit returns and drivers
1,90,9
1,0
PE return Market
return
Strategic &
operational
improvements
12
% # of deals % # of deals
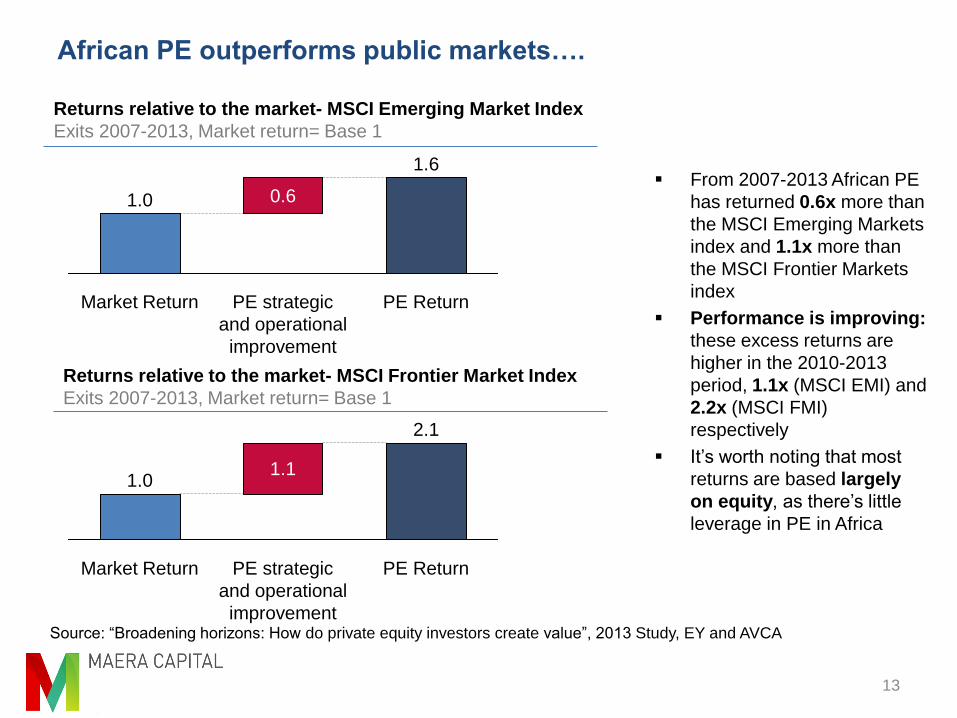
African PE outperforms public markets….
13
0.6
PE Return
1.0
Market Return
1.6
PE strategic
and operational
improvement
Source: “Broadening horizons: How do private equity investors create value”, 2013 Study, EY and AVCA
2.1
PE strategic
and operational
improvement
PE Return
1.1
Market Return
1.0
Returns relative to the market- MSCI Emerging Market Index
Exits 2007-2013, Market return= Base 1
Returns relative to the market- MSCI Frontier Market Index
Exits 2007-2013, Market return= Base 1
From 2007-2013 African PE
has returned 0.6x more than
the MSCI Emerging Markets
index and 1.1x more than
the MSCI Frontier Markets
index
Performance is improving:
these excess returns are
higher in the 2010-2013
period, 1.1x (MSCI EMI) and
2.2x (MSCI FMI)
respectively
It’s worth noting that most
returns are based largely
on equity, as there’s little
leverage in PE in Africa

…as well as more established PE markets
14
1.04 1.00
Africa North America
1.20
Europe
Relative multiples, Africa versus Europe and North America
Exits 2010-2012, North America= Base 1
Source: “Broadening horizons: How do private equity investors create value”, 2013 Study, EY and AVCA; Team interviews
Exit multiples in Africa are
higher than those of other
established markets in
Europe and North America
(by as much as one-fifth)
The higher multiples are
explained by the positive
outlook in the continent
Although PE returns in
Africa are higher (~15%-
~+30% depending on fund,
sector and geographies),
they are also
commensurate with the
higher risk of investing in
Africa

Successful PE deals in Africa seem to share some common traits
15
Case Study 1: Compagnie de Distribution de Côte d’Ivoire (CDCI)
Case Study 2: Vitalait
Case Study 3: Southey Holdings
Case Study 4: Société Internationale de Plantations d’Hévéas
Case Study 5: ABC Transport
Selected case studies
Introduction of best-practices in a wide number of areas (finance, IT,
governance, operations, etc)
Strengthening of management teams (new hires, incentive programs, etc)
Focus on growth (increase in product offerings, expansion into new
markets, etc)
EBITDA improvements (cost reduction, focus on high-margin products, etc)
Leverage the PE investor’s networks and know-how to identify new
customers, acquisition targets and potential buyers
How PE firms create value in Africa
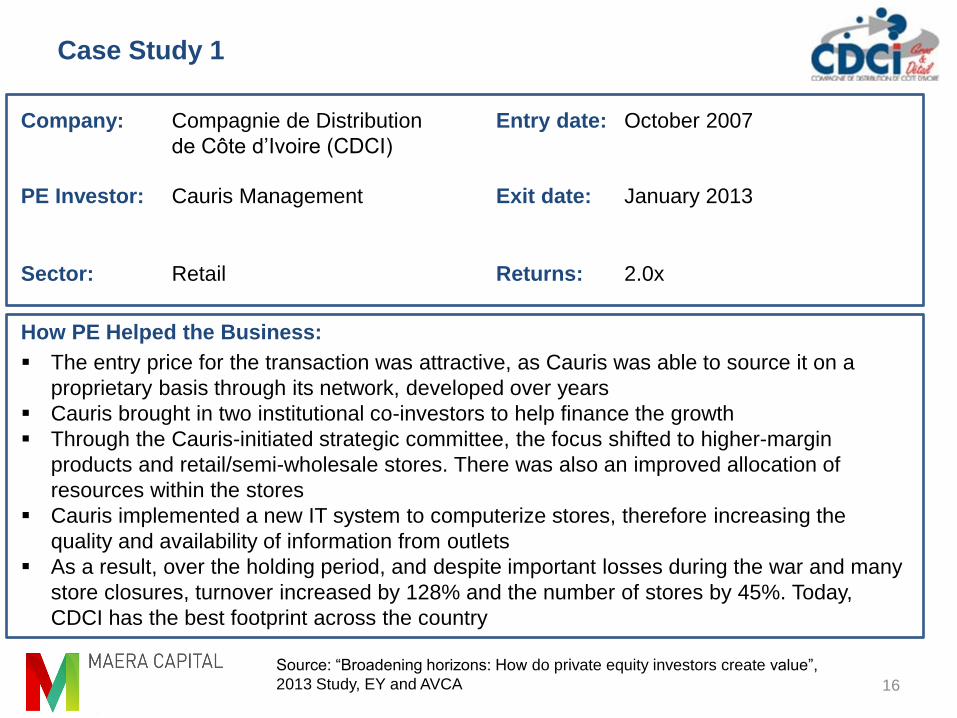
Case Study 1
16
Company:
PE Investor:
Sector:
Entry date:
Exit date:
How PE Helped the Business:
Compagnie de Distribution
de Côte d’Ivoire (CDCI)
Cauris Management
Retail
October 2007
January 2013
2.0x Returns:
The entry price for the transaction was attractive, as Cauris was able to source it on a
proprietary basis through its network, developed over years
Cauris brought in two institutional co-investors to help finance the growth
Through the Cauris-initiated strategic committee, the focus shifted to higher-margin
products and retail/semi-wholesale stores. There was also an improved allocation of
resources within the stores
Cauris implemented a new IT system to computerize stores, therefore increasing the
quality and availability of information from outlets
As a result, over the holding period, and despite important losses during the war and many
store closures, turnover increased by 128% and the number of stores by 45%. Today,
CDCI has the best footprint across the country
Source: “Broadening horizons: How do private equity investors create value”,
2013 Study, EY and AVCA

Case Study 2
17
Company:
PE Investor:
Sector:
Entry date:
Exit date:
How PE Helped the Business:
Vitalait
AfricInvest Fund I and Maghreb
Private Equity Fund II
Agribusiness, dairy products
September 2006
December 2011
2.2x Returns:
Improved governance and reinforced the management team
Created a strong local brand and diversified the product range from one SKU in milk to a
wider milk and fresh dairy products
Put in place a long environmental and social program reducing waste and improving the
waste management process
Put in place a large farmers’ empowerment program (the company buys milk from more
than 5,000 families)
Source: “Broadening horizons: How do private equity investors create value”,
2013 Study, EY and AVCA

Case Study 3
18
Company:
PE Investor:
Sector:
Entry date:
Exit date:
How PE Helped the Business:
Southey Holdings
The Abraaj Group
Industrials
July 2009
May 2013
48% (IRR) Returns:
Southey consolidated its business operations in South Africa and focused on new markets
in Africa. Under Abraaj’s guidance, the company expanded into seven new country
markets to a position where 40% of the Group’s profits were generated from markets
outside of South Africa at the time of Abraaj’s exit
With Abraaj’s involvement, Southey created a sustainable business model by
strengthening governance, including establishing a compensation committee, restructuring
the business to better leverage African growth opportunities, implementing a
comprehensive management information system, improving growth in terms of service and
geography, and introducing new marketing strategies
Abraaj’s established an employee share trust to promote broad-based equity ownership
and to further enable the institutionalization of this family business
Source: “Broadening horizons: How do private equity investors create value”,
2013 Study, EY and AVCA

Case Study 4
19
Company:
PE Investor:
Sector:
Entry date:
Exit date:
How PE Helped the Business:
Société Internationale
de Plantations d’Hévéas
Emerging Capital Partners (ECP)
Agriculture/forestry
March 2005
July 2007
3.4x Returns:
ECP’s investment allowed the company to expand production and implement cutting-edge
techniques. The funding, combined with ECP’s support in establishing the right
partnerships and management team, resulted in revenue growth of 44 % annually over
ECP’s two-year holding period
ECP helped the company to become more attractive to investors by implementing
standard financial reporting and identifying appropriate acquisition targets
In 2006, ECP played an instrumental role in negotiating the acquisition of Michelin’s rubber
plantations in Nigeria in exchange for a 20% stake in SIPH
Source: “Harvesting growth: How do private equity investors create value”,
2013 Study, EY and AVCA

Case Study 5
20
Company:
PE Investor:
Sector:
Entry date:
Exit date:
How PE Helped the Business:
ABC Transport
African Capital Alliance (ACA)
Transportation
August 2003
February 2008
4.7x Returns:
ACA helped improve corporate governance and financial reporting and also assisted with
recruiting senior management
ACA introduced some key corporate customers
ACA worked with management on expansion of the company’s operations beyond Nigeria
further into West Africa
ACA worked with management to prepare the company for and ensure a successful listing
on the Nigerian Stock Exchange
Source: “Harvesting growth: How do private equity investors create value”,
2013 Study, EY and AVCA

Content
▪ Introduction to the project
▪ Africa as an investment destination
▪ Private Equity in Africa
▪ Proposed Investment Strategy
▪ Recommended Geographical Focus
▪ Recommended Sectorial Focus
▪ Potential Investment Vehicles
▪ Conclusion
21

We propose to use a broad and flexible investment strategy
Details of investment strategy
Geographic
Focus
Focus on a number of selected countries that have promising economic fundamentals
and an adequate investment environment (i.e. Transition countries)
Diversify geographical reach, but limited to a number of countries to build strong local
networks and knowledge
Sectorial
Focus
Investment
vehicle
Target a broad range of diverse sectors to take advantage of upcoming opportunities and
untapped markets
Focus on one of Africa’s biggest opportunities: the emerging consumer; around a wide
range of sectors (e.g. pharmaceuticals, food and beverages, textiles, etc)
Tap into these opportunities by investing in businesses with manufacturing operations
targeting emerging consumers
Choose the investment vehicle that better suits our investors’ needs and preferences (to
be discussed with investors)
Simplify initial investment strategy by operating on a deal-by-deal basis, with a view of
creating a fund or dedicated investment firm in the future (potentially covering both debt
and equity investments)
22
Deal Size
Target small and mid transactions (€5-€30m) are the most underserved markets for a
new investment manager (i.e. supply and demand mismatch; page #9)
Remain flexible to invest or co-invest in larger transactions on a case-by-case basis

Content
▪ Introduction to the project
▪ Africa as an investment destination
▪ Private Equity in Africa
▪ Proposed Investment Strategy
▪ Recommended Geographical Focus
▪ Selected Opportunities by Sector
▪ Potential Investment Vehicles
▪ Conclusion
23

We have defined 3 criteria to identify African economies with high
potential
Analysis of countries
according to exports per
capita and economic
diversification
We follow McKinsey’s approach in the report “Lions on the move” (with
updated data), where countries are distributed in homogeneous groups
according to exports per capita and economic diversification (share of
manufacturing and services in GDP)
Studies show these variables are correlated with economic growth:
Countries need to export to fund investments (including imports) in a
sustainable manner
Manufacturing and services sector expand as urbanization increases and
as middle class rises, creating opportunities for investments in different
areas
Countries in transition (with increasing exports and economic diversification)
are the ones with better prospects for investment
1
2014 Index of
Economic Freedom by
the Heritage Foundation
We consider that certain countries lack a conducive business, legal and
political environment for investment
We look at the 2014 Index of Economic Freedom by the Heritage Foundation
and exclude countries with an index below 50 (i.e. repressive)
2 Individual reports /
interviews
We believe economic data in Africa is not fully reliable so we consider a
number of countries that according to studies and interviews appear to be
attractive investment destinations, at least in selected sectors 3
Criteria Rationale
Source: Team Analysis
24

The first analysis allows us to clearly split countries into 4
categories Exports per capita vs. Share of Manufacturing and Services in GDP; Size of
bubbles proportional to GDP
10
100
1.000
10.000
75 90 65 85 0 25 30 70 35 40 45 50 55 60 80
Exports per capita ($)
20121
Namibia
South Africa Tunisia
Morocco
Botswana
Mauritius
Rwanda Sudan
Burkina Faso Mali
Cameroon
Cote d’Ivoire
Liberia
Ghana Nigeria
Libya Gabon
Equatorial Guinea
Congo, Rep.
Chad
Angola
Algeria
Ethiopia
Kenya Mozambique
Senegal
Share of Manufacturing and Services in GDP (%)
20121
Egypt, Arab Rep. Zambia
Uganda Tanzania Congo, Dem. Rep.
1 When data for 2012 was not available, previous period were used (see backup)
Note: Included countries with GDP in 2012 above $10 billion or GDP growth rate 2005-2012 above 7%
Source: World Bank Economic Development Indicators; www.econstats.com; “Lions on the Move (Africa), McKinsey Global Institute”
Transition economies
Pre-transition economies
Diversified economies
Oil exporters
25

Some African countries have “Repressed Economies”
according to the IEF
Mauritius
Botswana
Cape Verde
Rwanda
Ghana
South Africa
Madagascar
Swaziland
Zambia
Uganda
Gambia
Namibia
Burkina Faso
Morocco
Gabon
Tanzania
Côte d'Ivoire
77
72
66
65
64
62
62
61
60
60
60
59
59
58
58
58
58
8
27
60
65
66
75
79
82
88
91
92
94
98
103
105
106
107
Country Score
World
rank
Tunisia
Kenya
Benin
Seychelles
Djibouti
Mali
Malawi
Senegal
Niger
Mozambique
Nigeria
Guinea
Mauritania
Egypt
Cameroon
Liberia
Burundi
57
57
57
56
56
56
55
55
55
55
54
54
53
53
53
52
51
109
111
113
117
118
122
124
125
127
128
129
133
134
135
136
138
141
Country Score
World
rank
Comoros
Guinea-Bissau
Algeria
Sierra Leone
Ethiopia
Togo
Lesotho
São Tomé and Príncipe
Angola
Central African Republic
Chad
Equatorial Guinea
Congo, Republic of
Congo, Dem. Republic
Eritrea
Zimbabwe
51
51
51
51
50
50
49
49
48
47
45
44
44
41
38
36
142
143
146
148
151
152
154
157
160
161
167
168
169
172
174
176
Country Score
World
rank
Note: The Index is computed as a simple average of scores on Property Rights, Freedom from Corruption, Fiscal Freedom, Government
Spending, Business Freedom, Labor Freedom, Monetary Freedom, Trade Freedom, Investment Freedom and Financial Freedom
Source: 2014 Index of Economic Freedom by the Heritage Foundation
According to the Heritage Foundation an
Index below 50 represents a “Repressed
Economy”
26

According to our pre-defined criteria, we have identified 8
countries with high potential for investment
6 transition economies…
Kenya
Ghana
Tanzania
Cameroon
Senegal
Mozambique
… and 2 economies commonly perceived today as being attractive investment destinations
Nigeria Ethiopia
Oil exporter country
with high level of
exports per capita
and currently making
a significant effort to
diversify its economy
Pre-transition
economy which is
seen today as one of
the most promising
economies in Sub-
Saharan Africa
Source: Press Research; Team Interviews; Team Analysis
27

The countries we have selected have shown consistent growth of
GDP and population (1/2)
Kenya
Ghana
Tanzania
Cameroon
2619
+5%
1811
+8%
2214
+7%
2117
2005 2012
+3%
43 36
+3%
25 21
+2%
4839
+3%
2218
2005 2012
+3%
595524
+2%
724502
+5%
483375
+4%
964915
2005 2012
+1%
Real GDP
$ billions
Population
Millions
Real GDP per capita
$
Source: World Bank Economic Development Indicators; www.econstats.com
CAGR 2005-2012
28

Senegal
Mozambique
Nigeria
Ethiopia
The countries we have selected have shown consistent growth
of GDP and population (2/2)
119
+3%
117
+7%
178112
+7%
2312
+10%
2012 2005
1411
+3%
2521
+3%
169140
+3%
9276
2012
+3%
2005
797773
0%
417313
+4%
1.053 804
+4%
253160
2005
+7%
2012
Real GDP
$ billions
Population
Millions
Real GDP per capita
$
CAGR 2005-2012
Source: World Bank Economic Development Indicators; www.econstats.com
29

Content
▪ Introduction to the project
▪ Africa as an investment destination
▪ Private Equity in Africa
▪ Proposed Investment Strategy
▪ Recommended Geographical Focus
▪ Recommended Sectorial Focus
▪ Potential Investment Vehicles
▪ Conclusion
30

There are multiple opportunities for PE investors in Africa across
several sectors
Consumer Goods Logistics
Oil & Gas
acquired
Shell Ghana
Aug’13 Nov’13 Nov’13
Nov’13 Dec’13 Jun’13
acquired
acquired
Utilities
acquired
Manufacturing
Financial Services
acquired acquired
SAMPLE OF DEALS
Source: Press Research
31

A large number of African PE investors have a sector(s)-specific
investment strategy and it seems to be the trend going forward
“Being a generic private equity
investor, a generalist, isn’t going to
deliver you superior returns. The only
way to do that is through domain
knowledge, deep understanding of
sectors that you’re interested
in, and having the ability to bring
other types of value-add to the party”
John van Wyk, Head of Africa, Actis
The Africa Handbook, PEI
Supplement, Sep’12
“There is a growing trend toward funds that
target specific sectors, largely to capitalize
on opportunities in sectors benefiting from
consumer growth as well as much-needed
infrastructure investment (i.e.,
infrastructure, real estate and agri funds)”
Private equity roundup- Africa,
Ernst & Young, Feb’13
Source: Press Research; Team Interviews
“With so many firms fundraising in the
market, we are looking for teams that have
deep sector expertise and know local
markets very well”
DFI PE investment officer
32

There are a number of sectors that seem to attract a lot of
attention from investors
33
Key sectors
However, we believe
that the greatest
opportunities for new
investors are in the
consumer space
and, in particular, in
consumer-focused
manufacturing
Agriculture
Infrastructure
Source: Press Research; Team Interviews
Manufacturing Real Estate
Natural Resources
Consumer Goods
Financial Services Energy

The African consumer will drive growth in the continent going
forward, offering attractive investment opportunities
0
200
400
600
800
2012 2014 2016 2008 2018 2010 2004 2006 2000 2002
+9,3%
Source: Global Insight
5,67,14,84,64,74,34,47,5
-0,2
10,9
-6,3
24,9
2008 2009 2007 2013 2014 2018 2015 2016 2011 2012 2010 2017
Nominal Private Consumption
Current US$, Sub-Saharan Africa
Real Private Consumption
Growth Rate (%), Sub-Saharan Africa
34

Share of households in each income bracket
%, millions of households
Consuming middle class
(10,000–20,000)
Emerging consumers
(5,000–10,000)
Household income brackets
$ PPP1 2005
Globals (>20,000)
Basic consumer needs
(2,000–5,000)
Destitute (<2,000)
Households with
income >$5,000
Million
59 85 128
Basic needs
Discretionary
income
3424
18
29
32
29
1821
23
6 8100% =
17
2020F
244
12
14
196 163
2008 2000
11
Source: “Lions on the move”, McKinsey Global Institute
By 2020, it is estimated that half of African households will have
discretionary income

Trends indicate that consumer-facing industries in Africa are likely
to outgrow most other sectors in the continent
36
Estimated annual Revenue by industry in
2020, $ Billion Main drivers of growth in the consumer industry in
Africa are:
Youngest population in the world (200 million
people between 15 an 24) and increasing levels
of education which will result in high levels of
workforce
Increasing levels of urbanization, which makes it
easier to reach consumers and raises their
income (with higher wages earned)
Growing middle-class, shifting purchasing
patterns from basic needs only to other
products
Technology development and higher
penetration, with social media representing an
important role in consuming, and with the creation
of an opportunity for online commerce
Improving business climate with stable levels of
inflation and accelerated regional integration
Source: “Lions on the Move (Africa), McKinsey Global Institute”; “African Consumers: Driving the African Private Equity
Opportunity, FMO and Fairview”
Growth 2008-2020
($ billion)
540
500
To
tal
Re
so
urc
es
Infr
astr
uctu
re
2,620 200
Co
nsu
me
r
Ag
ricu
ltu
re
1,380
520 110 220 130 980

There are a wide range of alternatives to serve the “emerging
African consumer”
37
Manufacturing Distribution Provision of Raw
Materials
Logistics and Market Linkages
Provision of Services Advertising
Banking
Insurance
Mobile services
Telecom
Construction materials
Food and beverages
House appliances
Pharmaceutical
Retail
Textiles
Infrastructure
Transportation
Potential sectors of
interest The “Consumer” Value Chain
Recommended
focus

We believe that the manufacturing sector represents an attractive
and untapped investment opportunity for PE investors in Africa
38
▪ African consumers demand African products: companies need to produce for
the local markets, adapting to the local tastes
▪ Africa has all the necessary inputs for a competitive manufacturing sector:
low-wage labor, abundant and diverse natural resources, privileged access to
selected high-income markets for exports, sufficiently large local or regional market
to allow emerging producers to develop high-volume production
▪ Africa’s manufacturing sector can benefit from China’s growth: China is
shifting from an export-driven model to one more focused on domestic markets,
creating huge opportunities for low-cost manufacturing locations like Africa
▪ PE investors can make a difference in the African manufacturing sector: PE
investors can provide their capital, best-practices know-how, strategic and
operational skills and networks to yet-not-very-productive manufacturing business
1
2
3
Source: “African Consumers: Driving the Private Equity Opportunity” FMO Fairview; Press Research; Team Interviews;
Team Analysis
4

The African manufacturing sector is growing very rapidly
“…a quiet boom in manufacturing in
Africa is already taking place. Farming
and services are still dominant,
backed by the export of commodities,
but new industries are emerging in a
lot of African countries”
The Economist, Feb’14
1 Mozambique includes ‘04-11 and Cameroon ‘04-07 data only
Source: Press Research; Team Interviews; Team Analysis
Mozambique
11,1%
5,6%
Tanzania
Senegal
Ethiopia
16,3%
12,2%
5,7%
Nigeria
8,2%
Ghana
13,1%
8,0%
Kenya
Cameroon
Manufacturing Value Added Growth
CAGR 04-121, Current US$
39

The African manufacturing sector is attracting a lot of attention
and investments in recent years from large corporates…
Ethiopia
Textile Production
Nigeria
Electrical Gear
Plant
Madagascar
Chocolate Bar
Production
Kenya
Car Production
Kenya
Pharmaceutical
Plant
Nigeria
Car Production
South Africa
Multi-category
Manufacturing Plant
Tanzania
Food-processing
Plant
Mozambique
Cement Plant
Cameroon
Agro-processing
Plant
Source: Press Research
40

…as well as from PE investors
41
Selected PE Deals in the Consumer/Manufacturing space in 2013
GP Company Country Sector Value
Abraaj Group &
Danone
Fan Milk Ghana Dairy Products US$400m
CapitalWorks Construction Products
Africa
South Africa Construction
Materials
US$135m
Pearl Capital Partners Freshco Kenya Ltd Kenya Agribusiness US$0.6m
Catalyst Principal
Partners
Chai Bora
Tanzania Agribusiness
N/A
Centum
Almasi Beverages
Kenya Food and
beverages
US$5m
Pearl Capital Partners
and Voxtra
Biyinzika Enterprises Uganda
Food and
beverages
US$4m
Catalyst Principal
Partners
Yes Brands
Ethiopia N/A Food and
beverages
Tanzanian Food
Corporation
Agri Vie Tanzania Food and
beverages
US$4.9m
Source: “Private Equity Confidence Survey 2014”, Deloitte and Africa Assets

The African manufacturing sector is very likely to continue to
grow at a fast pace
Growth drivers of the manufacturing sector in Africa
Urbanization
Economic
Growth Trade Policy
Regional
Integration
Low-cost
Base
Investment
Policy
Human
Capital
Natural
Resources
Emergence of middle-class
and increase in household
consumption and
discretionary income
Accelerating urbanization
(50% of Africa’s population
will be urban by 2020)
Huge pool of young workers
available for labor-intensive
light manufacturing
Africa is emerging as the
new global provider of low-
cost, low-skilled labor
Source: Press Research; Interviews; “Light Manufacturing in Africa” World Bank Report
Abundant natural resources
used as inputs in the
manufacturing industry
Opening up of markets,
increased competitiveness
and productivity
African products have
preferential access to the
USA and to the EU
Increased public investment
by governments and DFIs
Attraction of FDI
42

Content
▪ Introduction to the project
▪ Africa as an investment destination
▪ Private Equity in Africa
▪ Proposed Investment Strategy
▪ Recommended Geographical Focus
▪ Recommended Sectorial Focus
▪ Potential Investment Vehicles
▪ Conclusion
43

We believe that a pledge fund or a deal-by-deal structure might
work better for Maera, given the challenge of raising a Fund Advantages
Pledge
Fund
Structured
Fund
Deal-by-
deal
A structured fund might help in talent hiring
and deal sourcing by giving “prestige and
credibility to investors”
GP doesn’t have to worry about fundraising
or availability of funds once the money is
raised
Relatively easy to form if the investor has access to a good network, given its flexibility, reduced cost and transparency
Gives the investor some form of “comfort” about the availability of funds
Gives LPs flexibility to invest on a deal-by-deal basis
Freest form of investment for both GPs and
LPs, allowing for total flexibility on
investments
Limited operating costs
44
Disadvantages
Difficult to raise money, particularly
given limited track record
Expensive and time consuming
process (e.g. road shows, etc)
Non-biding nature of the LP
commitment does generate some
uncertainty
Sellers look for certainty of close and
might have doubts about the
investor’s ability to raise the
necessary funds
GP might have a hard time raising
funds for a particular transaction,
both pre and post due diligence
Sellers look for certainty of close and
might have doubts about the
investor’s ability to raise the
necessary funds
Source: Team Interviews; Team Analysis

Content
▪ Introduction to the project
▪ Africa as an investment destination
▪ Private Equity in Africa
▪ Proposed Investment Strategy
▪ Conclusion
45

Our main conclusions
46
Africa represents a great investment opportunity for a PE investor like
Maera Capital, with very decent risk-adjusted returns and with plenty of
value-creation opportunities for investors with the right skills and know-
how
Consumer-facing industries seems to have a strong potential and is
likely to be one of the greatest opportunities going forward. Serving the
emerging consumer will require local products and local production,
creating significant opportunities in the (light) manufacturing sector
Finally, while we have recommended a specific investment strategy, we
know very well that there’s not a right answer to the question of how to
invest in PE in Africa and believe that there are many other models that
can work as well as or better than the one we have proposed

ANNEX
47

Economic data per country (1/2) 2012
Algeria
Angola
Benin
Botswana
Burkina Faso
Burundi
Cabo Verde
Central African Republic
Congo, Dem. Rep.
Congo, Rep.
Djibouti
Equatorial Guinea
Ethiopia
Gambia, The
Guinea
Kenya
Liberia
Country
(1) 2011 data
(2) 2010 data
(3) 2008 data
Source: World Bank Economic Development Indicators; www.econstats.com; “Lions on the Move (Africa), McKinsey Global Institute”
Cameroon
Chad
Comoros
Cote d'Ivoire
Egypt, Arab Rep.
Eritrea
Gabon
Ghana
Guinea-Bissau
Lesotho
Nominal GDP
$
Nominal GDP per
capita
$
Real GDP growth
% CAGR 2005-2012
Population
Millions
Share of Manufacturing
and Services in GDP
%
Exports per
Capita
$
206 5,348 2.6% 38 443 1,989
114 5,482 10.3% 21 37 3,295
8 752 3.9% 10 613 1091
15 7,238 4.4% 2 68 3,221
11 652 5.8% 16 44 179
2 251 4.4% 10 52 22
2 3,695 6.0% 0 923 1,177
25 1,167 3.4% 22 693 340
2 483 6.8% 5 38 56
13 1,035 4.7% 12 33 305
1 831 1.7% 1 N/A 1301
17 262 6.0% 66 38 145
14 3,154 4.8% 4 293 2,9031
25 1,244 2.2% 20 713 6352
N/A N/A N/A 1 963 514
263 3,256 5.0% 81 61 567
18 24,036 3.5% 1 213 20,280
3 504 1.6% 6 N/A 611
42 454 9.6% 92 45 64
18 11,257 3.4% 2 393 6,403
1 507 3.4% 2 72 145
41 1,605 8.0% 25 57 736
6 492 2.7% 11 543 146
1 494 2.1% 2 N/A 86
41 943 4.6% 43 63 257
2 1,193 4.8% 2 70 555
2 414 11.4% 4 48 134
48

Economic data per country (2/2) 2012
Libya
Madagascar
Malawi
Mali
Mauritania
Mauritius
Morocco
Namibia
Rwanda
Sao Tome and Principe
Seychelles
Somalia
Sudan
Tanzania
Tunisia
Zambia
Country
Mozambique
Niger
Nigeria
Senegal
Sierra Leone
South Africa
Swaziland
Togo
Uganda
Zimbabwe
Nominal GDP
$
Nominal GDP per
capita
$
Real GDP growth
% CAGR 2005-2012
Population
Millions
Share of Manufacturing
and Services in GDP
%
Exports per
Capita
$
93 15,853 5.2% 6 343 9,940
10 447 2.8% 22 733 1161
4 268 3.5% 16 653 1051
10 699 4.3% 15 553 218
4 1,106 5.5% 4 41 642
10 8,120 4.2% 1 89 4,448
96 2,902 4.9% 33 71 1,068
14 565 6.9% 25 713 168
13 5,786 4.5% 2 72 2,464
7 395 5.5% 17 48 98
263 1,555 6.8% 169 403 862
7 620 8.1% 11 57 82
0 1,400 4.8% 0 N/A 157
14 1,023 3.3% 14 73 249
1 12,783 4.6% 0 92 5,4731
4 635 6.9% 6 373 801
N/A N/A N/A 10 N/A N/A
384 7,352 3.2% 52 81 2,077
59 1,580 2.3% 37 47 99
4 3,042 1.6% 1 93 2,147
28 609 6.8% 48 58 175
4 574 3.8% 7 62 2231
46 4,237 3.4% 11 77 2,032
20 551 7.3% 36 55 128
21 1,463 6.6% 14 51 678
10 714 0.4% 14 68 316
(1) 2011 data
(2) 2010 data
(3) 2008 data
Source: World Bank Economic Development Indicators; www.econstats.com; “Lions on the Move (Africa), McKinsey Global Institute”
49

Detailed Index of Economic Freedom by country (1/2)
Country
Source: 2014 Index of Economic Freedom by the Heritage Foundation
World
Rank
2014
Score
Property
Rights
Freedom
from
Corruption
Fiscal
Freedom
Gov't
Spending
Business
Freedom
Labor
Freedom
Trade
Freedom
Monetary
Freedom
Investment
Freedom
Financial
Freedom
Mauritius 8 77 65 53 92 82 74 78 89 77 85 70
Botswana 27 72 70 61 81 70 69 70 83 72 75 70
Cape Verde 60 66 70 55 77 69 64 48 70 79 70 60
Rwanda 65 65 30 47 80 78 70 84 78 75 65 40
Ghana 66 64 50 40 85 83 63 60 65 66 70 60
South Africa 75 62 50 42 69 69 75 54 76 75 55 60
Madagascar 79 62 40 27 91 92 63 44 78 78 55 50
Swaziland 82 61 40 32 75 71 64 72 82 72 65 40
Zambia 88 60 30 31 72 83 75 50 85 68 60 50
Uganda 91 60 30 24 79 87 45 87 75 71 60 40
Gambia 92 60 30 32 79 80 57 66 65 71 65 50
Namibia 94 59 30 44 67 59 64 82 83 75 50 40
Burkina Faso 98 59 30 31 83 82 61 55 68 79 60 40
Morocco 103 58 40 33 71 64 76 31 59 78 70 60
Gabon 105 58 40 29 74 82 59 63 61 75 55 40
Tanzania 106 58 30 29 80 78 47 61 77 66 60 50
Tunisia 109 57 40 39 74 64 81 73 62 76 35 30
Benin 113 57 30 30 68 86 51 51 60 75 70 50
Djibouti 118 56 30 31 81 63 43 65 55 77 65 50
Mali 122 56 20 28 70 82 48 63 73 77 55 40
Malawi 124 55 45 32 78 63 39 60 73 64 50 50
Senegal 125 55 40 30 65 75 48 41 73 82 60 40
Niger 127 55 30 26 77 88 35 45 66 88 55 40
Mozambique 128 55 30 26 76 65 65 37 76 81 45 50
Côte d'Ivoire 107 58 30 22 79 80 55 59 71 81 50 50
Kenya 111 57 30 21 78 75 56 64 73 75 50 50
Seychelles 117 56 50 48 77 62 68 68 33 75 50 30
50

Detailed Index of Economic Freedom by country (2/2)
Country
World
Rank
2014
Score
Property
Rights
Freedom
from
Corruption
Fiscal
Freedom
Gov't
Spending
Business
Freedom
Labor
Freedom
Trade
Freedom
Monetary
Freedom
Investment
Freedom
Financial
Freedom
Nigeria 129 54 30 23 85 74 48 66 64 73 40 40
Guinea 133 54 20 19 69 86 52 73 61 64 50 40
Mauritania 134 53 25 24 82 76 38 53 69 76 50 40
Egypt 135 53 20 29 86 70 63 46 71 60 45 40
Cameroon 136 53 30 22 72 86 45 56 61 69 35 50
Liberia 138 52 30 34 84 70 62 47 64 73 40 20
Burundi 141 51 20 16 73 52 60 63 72 68 60 30
Comoros 142 51 30 22 64 85 49 50 73 75 35 30
Guinea-Bissau 143 51 20 20 89 87 41 61 61 74 30 30
Algeria 146 51 30 29 81 51 66 48 61 68 45 30
Sierra Leone 148 51 15 25 81 86 55 29 70 70 55 20
Ethiopia 151 50 30 27 77 90 58 55 64 59 20 20
Togo 152 50 30 24 70 82 43 43 63 79 35 30
Lesotho 154 49 40 37 67 0 54 62 69 76 50 40
S. Tomé Príncipe 157 49 20 33 87 28 53 45 75 68 50 30
Angola 160 48 15 18 88 55 48 40 70 64 40 40
Chad 167 45 20 16 46 80 25 43 55 70 50 40
Congo, Rep. 169 44 10 21 67 80 35 47 56 72 20 30
Eritrea 174 38 10 23 57 66 19 64 69 58 0 20
Zimbabwe 176 36 10 19 63 64 35 22 54 73 5 10
Libya N/A N/A 10 18 95 0 50 78 N/A 67 5 20
Sudan N/A N/A N/A 10 85 90 55 49 56 56 15 N/A
Somalia N/A N/A N/A 5 N/A N/A N/A N/A N/A N/A N/A N/A
CAR 161 47 10 21 65 93 34 40 52 72 50 30
Equatorial Guinea 168 44 10 17 75 63 43 42 54 75 35 30
Congo, Dem. Rep. 172 41 10 18 69 75 30 39 63 63 20 20
Source: 2014 Index of Economic Freedom by the Heritage Foundation
51