Private equity development in the MENA region. An ...
26
Private equity development in the MENA region. An exploratory analysis. Thomas Lagoarde-Segot 1 Laurence Lepoder 2 Abstract The objective of this paper is to explore private equity market attractiveness in the MENA region based on a modified questionnaire and a set of bootstrapped attractiveness indices which we analyze through a cluster method. Our conclusions are the following. First, investor’s perceptions and real institutional development levels differ, suggesting the presence of informational asymmetries. Second, attractiveness levels are very heterogeneous. This suggests that investors should not consider the region as a block for allocation purposes. JEL classification: G11;G12;G15 Keywords: MENA economies, international finance, economic development. 1 Euromed Marseille Ecole de Management and DEFI, Université de la Méditerranée, France. Email contact : [email protected] . Tel : +33 (0) 662 540 361. 2 Euromed Marseille Ecole de Management.
Transcript of Private equity development in the MENA region. An ...

Private equity development in the MENA region. An exploratory analysis.
Thomas Lagoarde-Segot1
Laurence Lepoder2
Abstract
The objective of this paper is to explore private equity market attractiveness in the MENA region based on a modified questionnaire and a set of bootstrapped attractiveness indices which we analyze through a cluster method. Our conclusions are the following. First, investor’s perceptions and real institutional development levels differ, suggesting the presence of informational asymmetries. Second, attractiveness levels are very heterogeneous. This suggests that investors should not consider the region as a block for allocation purposes.
JEL classification: G11;G12;G15 Keywords: MENA economies, international finance, economic development.
1 Euromed Marseille Ecole de Management and DEFI, Université de la Méditerranée, France. Email contact : [email protected]. Tel : +33 (0) 662 540 361. 2 Euromed Marseille Ecole de Management.

2
1. Introduction
Fifteen years after the launching of the Barcelona Process, the emerging transition economies
of the MENA3 region are still contending with dysfunctional financial systems. At an internal
level, financial structures are heavily bank-oriented, with bank assets accounting for 85% of
total financial assets, versus 48% in emerging Asian countries, 41% in Emerging Europe and
33% globally (Abed and Soueid, 2005). At an external level, these countries remain net
capital exporters, as oil-related surpluses indeed tend to be channelled abroad through OECD
financial intermediaries rather than invested domestically (OECD, 2006). This dynamic takes
place in a context of massive investment needs, as 22 million new jobs must be created before
2020 in order to stabilize the region’s unemployment levels at their current rate of 15%
(FEMISE, 2006).
Taking this into account, the development of a local private equity industry may be viewed as
a necessary component of financial sector modernization. Four theoretical mechanisms indeed
unite private equity to economic development. First, the private equity industry brings lenders
and borrowers together where asymmetric information and uncertainty costs exist, thereby
allowing for the riskiest projects to obtain financing (Bonini and Alkan, 2006). Second, stage
financing usually implies a tight control on a firm’s operations. This helps to ensure
productive efficiency in small business entities often characterized by a lack of management
expertise (Gorman and Sahlman, 1989). Third, private equity industry participate in the
creation of a knowledge-based economy. Private equity investors play an important social
role in the innovation process through their involvement in four embedded networks: financial
markets, entrepreneurs, services to business and labour market professionals (Hellmann,
2000). Fourth, a large number of family-owned companies operate in emerging markets.
While often profitable and employing large numbers of workers, these companies usually do
3 This paper focuses on ten MENA countries: Morocco, Egypt, Tunisia, Turkey, Israel, Algeria, Jordan, Lebanon, Lybia and Syria. These countries are referred to as the MEDA group by the European Commission.

3
not comply with international norms of transparency, corporate governance and investor
protection, and often operate at the borderline of informal economy. In this context, private
equity markets may act a bridge from traditional proprietary companies to modern listed
companies (OECD, 2006). Overall, private equity market development in the MENA region
could (i) channel greater investment flows into domestic economies; (ii) diversify financing
sources for local firms; and (iii) increase productivity through managerial externalities.
A growing awareness of these issues has led most MENA countries to undertake significant
financial reforms over the last decade. Foreign investment is liberalized, and the region’s
stock markets are active and developing (Lagoarde-Segot and Lucey, 2008). However,
virtually nothing is known about private equity in the region. As shown in table 1, the only
available aggregated data highlights that the region is still lagging behind Emerging Asia and
Eastern Europe ($5,027 billion invested in 2007 versus $28,668 billion and $14,629 billion,
respectively). In addition, Israel accounts for more than half of the region’s private equity
investment flows (ANIMA, 2008).
Table 1 Emerging Private Equity Fundraising Total, 2003-2007 (US$ billions)
Emerging Asia CEE/Russia Latin America Sub-Saharan Africa MENA
2003 2,200 406 417 NA NA
2004 2,800 1,777 714 NA NA
2005 15,446 2,711 1,272 791 1,915
2006 19,386 3,272 2,656 2,353 2,946
2007 28,668 14,629 4,419 2,340 5,027
Source: Emerging Private Equity Association 2007.
Taking this into account, the objective of this paper is to explore the MENA private equity
market development dynamic by juxtaposing local investors’ perceptions and the observed
institutional reform process. We thus first discuss investors’ perception of the region through
a modified questionnaire. We then compare MENA countries to other emerging markets in
terms of institutional reforms using cross-country data. We finally consider the intersection of
these results and discuss the gap between investor’s perceptions and institutional
developments, which allows us to raise a set of conjectures for the conduct of policy-making.

4
The remainder of the paper is structured as follows. Section 2 reviews the determinants of
private equity market development. Section 3 describes the questionnaire and discusses
investor’s perceptions of the MENA region. Section 4 develops a battery of attractiveness
indices and proceeds to a cluster analysis for a panel of emerging markets. Section 5 brings
together our conclusions.
2. Emerging markets characteristics and private equity development
The size of the domestic economy is clearly a major determinant for the development of
private equity investment, whose volumes are usually significantly correlated with GDP
growth (Romain and van Pottelsberghe de la Potterie, 2004). Gompers and Lerner (1998)
indeed pointed out that there are more attractive opportunities for entrepreneurs in large and
dynamic economies. Although hard to quantify, political risk is another key variable for
emerging market investment, as it determines the risk premium associated to local projects
(Chuah, 1992). Local financial development is also essential. Black and Gilson (1998)
suggested a positive relationship between financial development and private equity
investment levels. Gompers and Lerner (1998) also emphasized that risk capital flourishes in
countries with deep and liquid stock markets, while the maturity of the private equity market
itself may also attract foreign investors.
In addition, the overall business environment may also play a significant role in determining
private equity investment levels. For instance, Jeng and Wells (2000) found that labour
market rigidities, the level of IPOs, entrepreneurship climate, and bankruptcy procedures
explained a large part of cross-country variations in private equity activity. Focusing on fiscal
factors, Poterba (1989) argued that lower tax rates prompt employees to become
entrepreneurs, leading to more demand for private equity funds. This was confirmed by
Gompers and Lerner (1998) who found that lower capital gains tax rates have strong effect on
the amount of VC investments supplied. Similarly, legal development is an important factor.

5
Cumming et al. (2006) indeed suggested that the quality of a country’s legal system has a
stronger impact on private equity activity than the size of its stock market, while Johnson et
al. (1999) emphasized the importance of the protection of property rights for private equity
markets.
High levels of human capital are also necessary for the development of private equity
markets. Schertler (2003) emphasized that the number of employees in the R&D field and the
number of patents have a positive impact on the development of private equity activity. Along
the same lines, Farag et al. (2004) highlighted that the quality of management ranks as a
primary reason for private equity investment failure in Central Europe. Finally, social
environment may also have a role to play. For instance, Baughn and Neupert (2003) argued
that national attitudes towards entrepreneurial activity determine the development of a local
risk-capital culture and affect the set of investment opportunities for international investors.
Based on this literature review, we classify institutional underpinnings of private equity
market development into eight criteria, including (i) economic activity, (ii) business
opportunities, (iii) favourable taxation environment, (iv) political stability, (v) capital market
development, (vi) human capital, (vii) legal investor protection and (viii) social environment.
3. Local investor’s perceptions
3.1 Data
In an effort to measure investor’s perceptions of the MENA private equity markets, the
following questions were asked to a panel of private equity investors:
1. How do you regard the attractiveness of the following emerging markets for Private
Equity investors? (7=excellent, 1= poor)
2. How important are each of the attractiveness criteria in your decision to invest in a
given country in general? (7=very important, 1=not important at all)
6
3. How attractive do you consider the MENA region according to the same criteria?
(7=very attractive, 1=not attractive at all)
4. How attractive are the MENA countries for you as an investor? (7=very attractive,
1=not attractive at all)
This short questionnaire was first sent by email to 1500 private equity investors worldwide,
using email contacts from European Venture Capital Association, Gulf Venture Capital
Association, and the African Venture Capital Association websites. This approach yielded 13
responses. MENA markets private equity investors were directly interviewed by phone,
yielding 22 responses4. Finally, the questionnaire was distributed to investors participating in
the 2nd EUROMED Capital Forum held in Tunis on April 24-25th, 2008, yielding 25
additional responses. In total, we thus obtained 60 responses, a reasonable sample for our
exploratory purposes. By comparison, Groh, Liechtenstein and Canela (2008), considered a
sample of 75 responses in a study focusing on Eastern Europe.
3.2 Results
As shown in table 2, responding investors are quite optimistic about the region’s ability to
attract further private equity investment. Taken as a whole, the MENA region (5.09) is indeed
ranked first among emerging countries, ahead of Asia (4.64), Central Europe (4.63), Sub-
Saharan Africa (4.45) and Latin America (4.13). Investors’ perceptions on the region as a
whole appear relatively homogeneous, as standard deviation (1.54) is third lowest, behind
Sub-Saharan Africa (1.38) and Latin America (1.47).
4 We thank Raphaël Botiveau from the ANIMA Investment Network (http://www.animaweb.org) for gracefully providing this data.

7
Table 2 Investors' perceptions
Question 1: How do you regard the attractiveness of the following emerging markets for Private Equity investors?
N.Obs. Mean SD Min Max
MEDA 55,00 5,09 1,54 1,00 7,00
Asia 53,00 4,64 1,82 1,00 7,00
Central Europe 51,00 4,63 1,60 1,00 7,00
Sub-Saharan Africa 53,00 4,45 1,38 2,00 7,00
Latin America 48,00 4,13 1,47 1,00 7,00
Question 2: How attractive are the following MEDA countries for you?
Morocco 57.00 5.18 1.68 1.00 7.00
Tunisia 57.00 5.05 1.62 1.00 7.00
Turkey 53.00 4.98 1.69 2.00 7.00
Egypt 55.00 4.89 1.51 2.00 7.00
Jordan 55.00 4.51 1.14 1.00 7.00
Algeria 57.00 4.25 1.89 1.00 7.00
Israël 49.00 4.00 2.00 1.00 7.00
Lybia 55.00 3.85 1.94 1.00 7.00
Lebanon 55.00 3.82 1.59 1.00 7.00
Syria 54.00 3.65 1.75 1.00 7.00
Question 3: How important are the following criteria in your decision to invest in a given country in general?
Business opportunities 56.00 5.39 2.02 1.00 7.00
Investor protection 56.00 5.18 2.22 1.00 7.00
Political risk 53.00 5.17 2.04 1.00 7.00
Human capital 55.00 5.13 1.72 1.00 7.00
Economic activity 57.00 5.02 1.88 1.00 7.00
Capital market development 55.00 4.87 1.49 2.00 7.00
Taxation 56.00 4.79 1.82 1.00 7.00
Social environment 54.00 4.63 1.42 2.00 7.00
Question 4: How attractive do you consider the MEDA region according to the same criteria?
Business opportunities 54.00 5.33 1.78 1.00 7.00
Economic activity 54.00 5.30 1.72 1.00 7.00
Political risk 49.00 5.08 1.59 1.00 7.00
Taxation 54.00 4.80 1.50 1.00 7.00
Investor protection 54.00 4.70 1.56 1.00 7.00
Human capital 51.00 4.69 1.44 1.00 7.00
Capital market development 54.00 4.61 1.42 1.00 7.00
Social environment 53.00 4.45 1.50 1.00 7.00
Turning to an intra-regional assessment of private equity attractiveness, investors ranked
Morocco first (5.18), followed by Tunisia (5.05), Turkey (1.69), Egypt (4.89) and Jordan
(4.51). Finally, Algeria (4.25), Israel (4.00), Libya (3.85), Lebanon (3.82) and Syria (3.65)
constitute a third group of countries. The low ranking of Israel is somewhat surprising given
that this country has one of the world’s most developed private equity markets. However, our
respondents were all based in the MENA region, whereas the Israeli private equity market is
relying on national and global investors (especially US investors). The low ranking of Israel

8
might thus reflect a low intra-regional economic integration. It may also reflect negative local
perceptions due to the persistence of the Middle-East conflict.
Turning to attractiveness criteria, investors seem to adopt a holistic approach to country
assessment, as all criteria obtain average scores higher than 4: from business opportunities
(5.33) to social environment (4.63). Investor protection (5.18) and political stability (5.17)
obtain very close scores, suggesting that these are deeply connected in this region. These are
followed by human capital (5.13), economic activity (5.02), and capital market development
(4.87), other important factors for private equity development. Taxation (4.79) and social
environment (4.63) come at last. Overall, this suggests that labour costs are not as important
as economic opportunities and legal guarantees in the allocation of international private equity
investment flows.
Interestingly, the MENA countries’ attractiveness for private equity stems mostly from
business opportunities (5.33), economic activity (5.30) and political stability (5.08). This may
result from a strong policy commitment to economic reforms, which has resulted in a
significant privatization program and in a relatively high rate of capital accumulation, most
MENA countries experiencing economic growth rates in excess of 4%. However, areas of
improvements can be identified in human capital (4.69), capital market development (4.61)
and social environment (4.45).
4. Attractiveness indices
4.1 Data
Our dataset covers the 53 countries classified as either ‘emerging’ or ‘frontier’ markets by the
Standard & Poors rating agency. We gather data from the CEPII’s 2006 Institutional Profile
(IP) database and the World Bank’s 2006 World Development Indicators (WDI) database.
The IP database is developed by means of a questionnaire addressed by French Embassies in
86 countries and offers a very comprehensive analysis of international institutional

9
arrangements. The WDI database offers key economic variables as well as a set of
institutional ratings developed by benchmark agencies. We consider the cross section of these
databases and identify a set of variables reflecting the eight chosen components of private
equity attractiveness: (i) economic activity, (ii) business opportunities, (iii) political stability,
(iv) capital market development, (v) investor protection, (vi) social environment, (vii) tax
environment and (viii) human capital. Merging these two databases leaves a total of 42
countries in the sample. In many cases, scale, direction and magnitude of each variable differ.
We thus rescaled and normalized raw indices so that variables range from 0 to 1, a higher
score indicating higher attractiveness. Selected index components and sources are described
in annex 1.
4.2 Methodology
We generate a set of synthetic indexes reflecting the criteria described in table 2.These
indexes can be described as follows:
+++++++=
+++++=
++++++=
++=
++++++=
++++++++=
++++=
+++++=
87654321
654321
7654321
321
7654321
987654321
54321
654321
HUMHUMHUMHUMHUMHUMHUMHUMHUMINDEX
SOCSOCSOCSOCSOCSOCSOCINDEX
INVINVINVINVINVINVINVINVINDEX
TAXTAXTAXTAXINDEX
CAPCAPCAPCAPCAPCAPCAPCAPINDEX
POLPOLPOLPOLPOLPOLPOLPOLPOLPOLINDEX
BUSBUSBUSBUSBUSBUSINDEX
ECOECOECOECOECOECOECOINDEX
iiiiiiiii
iiiiiii
iiiiiiii
iiii
iiiiiiii
iiiiiiiiii
iiiiii
iiiiiii
σµγφδχβα
γφδχβα
µγφδχβα
χβα
µγφδχβα
ρσµγφδχβα
φδχβα
γφδχβα
(1)
For each index, weights are comprised between 0 and 1 and are derived based on a
nonparametric bootstrap technique. The process is the following. We first generate 10,000
random combinations of uniformly distributed weights adding up to unity in the interval [0,1].
The corresponding indexes are calculated for each of these combinations, and the selected
index value corresponds to the 50th percentile of the associated cumulative distribution. This

10
methodology allows us to derive a significance level for the index without relying on strong
distributional assumptions on investor’s preferences5.
To refine our understanding of institutional development in the MENA region, we then
analyzed those indexes with a hierarchical clusters based on Ward’s (1963) linkage. Within
this framework, the squared Euclidean distance is used as a measure of dissimilarity. For
each cluster, the means for all the variables are computed. Then, for each object, the squared
Euclidean distance to the cluster means is calculated. These distances are summed for all the
objects. At each stage, the two clusters with the smallest increase in the overall sum of
squares within cluster distances are combined. The recurrence formula is the following:
ij
kji
kkj
kji
kj
ki
kji
kijik d
nd
nd
nd
ηηηηηη
η
ηηηη
++−
++
++
++
+=),(
(2)
Where kji ηηη ,, are the numbers of observations contained in groups i, j and k, respectively.
ijd is the distance between cluster i and cluster j, )(ijkd is the distance between cluster k and the
new cluster formed by joining clusters i and j. The optimal number of clusters is identified
based on the pseudo F index (Calinski and Harabasz, 1974) which is defined as
( )[ ]( )[ ]knWTrace
kBTraceF
−
−=
/
1/ where n is the number of observations in a sample, K is the number of
clusters, B is the between cluster sum of squares and cross product matrix, and W is the
pooled within cluster sum of squares and cross products matrix. Using this method, the
optimal number of clusters is determined by plotting the F index against the number of
clusters. An inspection of the repartition of clusters across the scatterplot matrix provides
insight into their respective characteristics.
5 The distribution of normalized indexes and robustness tests on the indices’ properties are available on request.

11
4.3 Results
Country positions are shown in figure 1 to 8 and highlight that the MENA region is very
heterogeneous, countries being scattered evenly across the emerging markets universe. As
shown in figure 1, levels of economic activity are extremely variables in the MENA region.
Israel (3.38), the first MENA country, comes third in the entire sample, after China (3.40) and
South Korea (3.52). It is followed by Turkey (3.24), which may be compared to Chile (3.25).
Then come Algeria (3.16) which can be compared to India (3.15); and Tunisia (3.04), Egypt
(3.08) and Lebanon (3.02), which are close to the Philippines (3.03). Finally, Jordan (2.90)
and Morocco (3.00) are lagging behind and can be compared to Sri Lanka (2.92).
Business opportunity indices are charted in figure 2. Jordan (0.82) and Israel (0.82) come first
in the entire sample, hence confirming investor’s claim that the MENA region is the most
attractive among emerging markets. Morocco (0.65) comes third and can be compared to
Brazil (0.66) and Poland (0.65). Then come Turkey (0.59) and Egypt (0.57) which are ranked
ahead of Bulgaria (0.56) and Chile (0.56). Tunisia (0.45) and Algeria (0.41) are significantly
lower in our ranking and can be compared to Mexico (0.45) and Malaysia (0.42). Finally,
Lebanon (0.32) and Syria (0.27) seem to offer the least attractive business opportunities in the
MENA region and can be compared to Argentina (0.31) and Botswana (0.27).
Inspection of figure 3 suggests that the MENA region does not compare favourably with other
emerging market areas in terms of political stability. The MENA countries are indeed located
in the lower segment of the figure. Israel (0.67) nevertheless comes first in the MENA region
and can be compared to Ukraine (0.68). Jordan (0.58), Tunisia (0.55) and Turkey (0.54)
follow, and can be compared to India (0.58), Botswana (0.57) and Peru (0.53), respectively.
Morocco (0.51) and Algeria (0.46) can be compared to Bangladesh (0.48) and Indonesia
(0.47). Finally, Lebanon (0.39), Egypt (0.35) and Syria (0.34) are lagging behind and can be
compared to Venezuela (0.38) and Zimbabwe (0.32), respectively.

12
Turning to capital market development, figure 4 shows that Israel (0.82) comes first in the
entire sample. Within the MENA region it is followed by Turkey (0.58). Then come Lebanon
(0.56) and Tunisia (0.55) which can be compared to Indonesia (0.54). Egypt (0.49) and
Morocco (0.47) follow and can be compared to Thailand (0.48) and Peru (0.47). Jordan
(0.37), Algeria (0.35) and Syria (0.20) are lagging at the lower end of the sample.
Taxation environment is described in figure 5, which highlights that Israel (0.77) is the most
fiscally competitive country in the entire sample, well ahead of Czech Republic (0.67).
Morocco (0.46) and Jordan (0.44) seem to constitute an intermediate group that is comparable
to Argentina (0.45). By contrast, Algeria (0.38), Tunisia (0.34), Syria (0.33), Lebanon (0.26),
Egypt (0.21) and Turkey (0.14) are located in the lower end of the figure and compare
unfavourably with other emerging markets.
Social environment constitutes an interesting case. As shown in figure 6, Israel (0.72) clearly
outperforms most emerging markets as it is ranked just behind the Czech Republic (0.73).
Algeria (0.56), Morocco (0.56), Lebanon (0.53) and Tunisia (0.53), which are all civil law
countries, constitute a very homogeneous group and are ranked just above Indonesia (0.50)
and Thailand (0.50). Syria (0.48), Jordan (0.48) and Turkey (0.44) follow, while Egypt (0.34)
is lagging behind.
Inspection of figure 7 highlights that the highest level of investor protection can be observed
in Israel (0.87), which is ranked just behind Chile (0.88). Jordan (0.65) comes second in the
MENA region and can be compared to Korea (0.65). Tunisia (0.61), Morocco (0.56), Turkey
(0.54) and Algeria (0.54) constitute a relatively homogeneous group, while Lebanon (0.50),
Egypt (0.40) and Syria (0.38) appear to be the region’s least investor friendly countries.
Finally, human capital levels are also very heterogeneous. As shown in figure 8, Israel (0.85)
offers the most educated workforce in the entire sample, ahead of Estonia (0.81). It is
followed by Lebanon (0.58) and Jordan (0.57), which have attained similar levels to Brazil

13
(0.58) and Sri Lanka (0.55), respectively. Turkey (0.53) and Tunisia (0.51) are close to one
another, while Algeria (0.42), Syria (0.39), Morocco (0.28) and Egypt (0.28) are located at the
bottom of the figure. Overall, this analysis suggests that Israel is one of the most attractive
emerging private equity markets, an observation in line with high private equity activity in
this country. It also highlights the existence of a real success story in the MENA region.
As shown in table 4, most indices are positively and significantly correlated. This suggests
that institutional development reforms in the MENA region should be coordinated.
Interestingly, although significantly correlated with investor protection, the business
opportunities index does not appear directly related to other components of private equity
market attractiveness; suggesting that improving institutional climate requires a specific
reform program.

Fig
ure
1 E
con
om
ic a
ctiv
ity
Fig
ure
2 B
usi
nes
s o
pp
ort
un
itie
s
Economic Activity
01
23
4
Zimbabwe
Ghana
Kenya
Cote d'Ivoire
Nigeria
Bangladesh
Jordan
Sri Lanka
Syrian Arab Republic
Pakistan
Morocco
Ukraine
Bulgaria
Lebanon
Philippines
Tunisia
Egypt, Arab Rep.
Botswana
Romania
Indonesia
Peru
Estonia
Lithuania
Colombia
India
Algeria
Thailand
South Africa
Hungary
Venezuela, RB
Turkey
Chile
Malaysia
Czech Republic
Russian Federation
Poland
Brazil
Mexico
Argentina
Israel
China
Korea, Rep.
MEDA
Non-MEDA
Business opportunities
00,2
0,4
0,6
0,8
1
Venezuela, RB
Botswana
Syrian Arab Republic
Argentina
Lebanon
Russian Federation
Indonesia
South Africa
Zimbabwe
Ghana
Algeria
Malaysia
Mexico
Tunisia
Ukraine
Bangladesh
India
China
Korea, Rep.
Lithuania
Chile
Bulgaria
Egypt, Arab Rep.
Kenya
Turkey
Thailand
Estonia
Nigeria
Sri Lanka
Colombia
Philippines
Poland
Morocco
Brazil
Czech Republic
Peru
Hungary
Romania
Pakistan
Cote d'Ivoire
Israel
Jordan
MEDA
Non-MEDA

15
Fig
ure
3 P
oli
tica
l st
ab
ilit
y
F
igu
re 4
Ca
pit
al
ma
rk
et d
evel
op
men
t
Political stability
00,2
0,4
0,6
0,8
1
Cote d'Ivoire
Zimbabwe
Syrian Arab Republic
Egypt, Arab Rep.
Nigeria
Russian Federation
Venezuela, RB
Lebanon
China
Pakistan
Thailand
Algeria
Indonesia
Bangladesh
Morocco
Philippines
Peru
Turkey
Colombia
Tunisia
Botswana
Sri Lanka
Jordan
India
Malaysia
Mexico
Kenya
Korea, Rep.
South Africa
Bulgaria
Ghana
Poland
Brazil
Israel
Ukraine
Romania
Czech Republic
Argentina
Chile
Lithuania
Hungary
Estonia
MEDA
Non-MEDA
Capital market development
0,0
0,2
0,4
0,6
0,8
1,0
Syrian Arab Republic
Ukraine
Algeria
Jordan
Cote d'Ivoire
Venezuela, RB
Estonia
Russian Federation
Botswana
Morocco
Ghana
Peru
Thailand
Egypt, Arab Rep.
Zimbabwe
Kenya
Czech Republic
Indonesia
Tunisia
Lebanon
China
Sri Lanka
Turkey
Romania
Bangladesh
India
Nigeria
Pakistan
Bulgaria
Lithuania
Korea, Rep.
Poland
Mexico
Malaysia
Chile
Colombia
Brazil
South Africa
Philippines
Argentina
Hungary
Israel
MEDA
Non-MEDA

16
Fig
ure
5 T
axa
tio
n e
nv
iro
nm
ent
Fig
ure
6 S
oci
al
env
iro
nm
ent
Taxation environment
00,2
0,4
0,6
0,8
1
Cote d'Ivoire
Turkey
Egypt, Arab Rep.
Russian Federation
Lebanon
Malaysia
Ghana
Bangladesh
Syrian Arab Republic
Nigeria
Tunisia
Bulgaria
Botswana
Mexico
Algeria
Zimbabwe
Philippines
Hungary
Peru
Brazil
Kenya
Pakistan
Estonia
South Africa
Jordan
Argentina
Morocco
Sri Lanka
Indonesia
Ukraine
Thailand
Korea, Rep.
Venezuela, RB
Lithuania
Colombia
Romania
China
Chile
Poland
India
Czech Republic
Israel
MEDA
Non-MEDA
Social environment
00,2
0,4
0,6
0,8
Bangladesh
Pakistan
India
Peru
Nigeria
Egypt, Arab Rep.
China
Philippines
Mexico
Venezuela, RB
Ukraine
South Africa
Malaysia
Russian Federation
Botswana
Turkey
Zimbabwe
Korea, Rep.
Kenya
Cote d'Ivoire
Ghana
Jordan
Syrian Arab Republic
Thailand
Indonesia
Tunisia
Lebanon
Morocco
Algeria
Lithuania
Colombia
Argentina
Bulgaria
Brazil
Poland
Romania
Sri Lanka
Hungary
Chile
Estonia
Israel
Czech Republic
MEDA
Non-MEDA

17
Fig
ure
7 I
nv
esto
r p
rote
ctio
n
F
igu
re 8
Hu
ma
n c
ap
ita
l
Investor protection
00,2
0,4
0,6
0,8
1
China
Russian
Venezuela, RB
Syrian Arab
Egypt, Arab Rep.
Ukraine
Cote d'Ivoire
Lebanon
Romania
India
Algeria
Mexico
Turkey
Pakistan
Morocco
Indonesia
Zimbabwe
Malaysia
Ghana
Tunisia
Thailand
Nigeria
Brazil
Argentina
Bulgaria
Kenya
Botswana
Jordan
Korea, Rep.
Philippines
Bangladesh
Peru
Poland
South Africa
Colombia
Lithuania
Hungary
Czech Republic
Estonia
Sri Lanka
Israel
Chile
MEDA
Non-MEDA
Human capital
00,2
0,4
0,6
0,8
1
Nigeria
Egypt, Arab Rep.
Morocco
Peru
Mexico
Syrian Arab
Botswana
Ghana
Indonesia
China
Algeria
Bangladesh
Cote d'Ivoire
Venezuela, RB
Kenya
Pakistan
Tunisia
Turkey
Russian Federation
South Africa
India
Ukraine
Sri Lanka
Jordan
Colombia
Philippines
Thailand
Zimbabwe
Brazil
Lebanon
Poland
Bulgaria
Chile
Argentina
Malaysia
Lithuania
Romania
Korea, Rep.
Hungary
Czech Republic
Estonia
Israel
MEDA
Non-MEDA
18
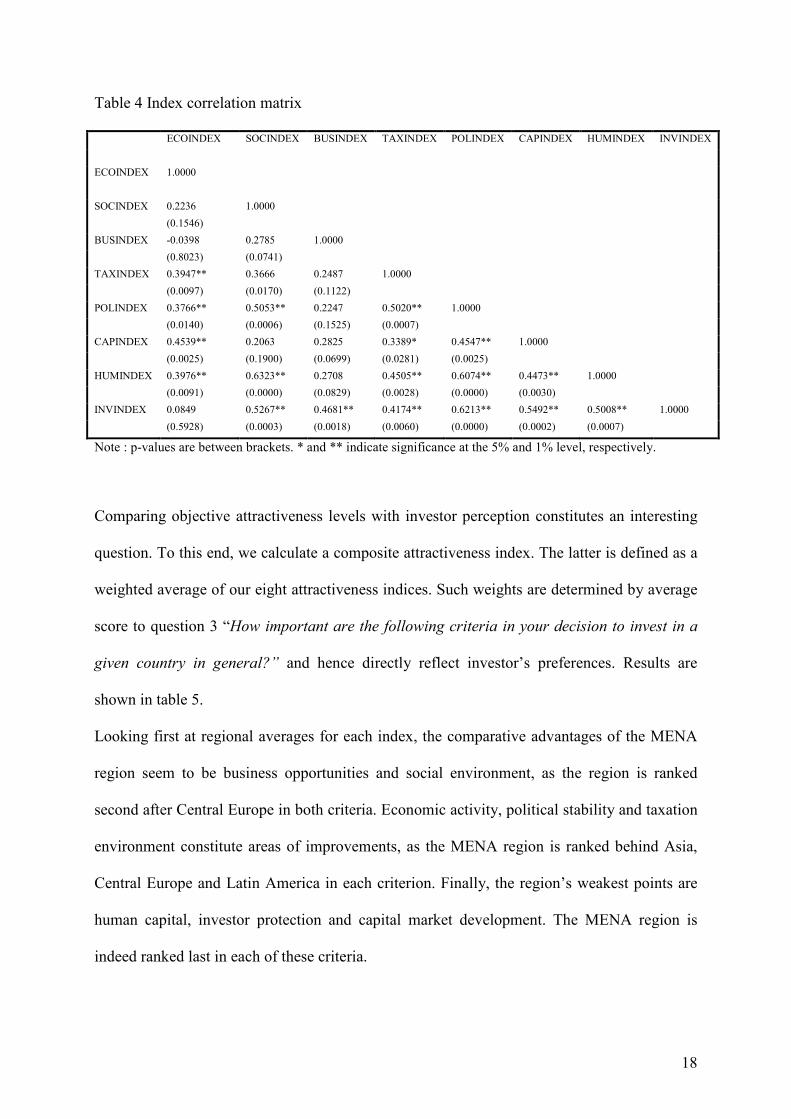
Table 4 Index correlation matrix
ECOINDEX SOCINDEX BUSINDEX TAXINDEX POLINDEX CAPINDEX HUMINDEX INVINDEX
ECOINDEX 1.0000
SOCINDEX 0.2236 1.0000
(0.1546)
BUSINDEX -0.0398 0.2785 1.0000
(0.8023) (0.0741)
TAXINDEX 0.3947** 0.3666 0.2487 1.0000
(0.0097) (0.0170) (0.1122)
POLINDEX 0.3766** 0.5053** 0.2247 0.5020** 1.0000
(0.0140) (0.0006) (0.1525) (0.0007)
CAPINDEX 0.4539** 0.2063 0.2825 0.3389* 0.4547** 1.0000
(0.0025) (0.1900) (0.0699) (0.0281) (0.0025)
HUMINDEX 0.3976** 0.6323** 0.2708 0.4505** 0.6074** 0.4473** 1.0000
(0.0091) (0.0000) (0.0829) (0.0028) (0.0000) (0.0030)
INVINDEX 0.0849 0.5267** 0.4681** 0.4174** 0.6213** 0.5492** 0.5008** 1.0000
(0.5928) (0.0003) (0.0018) (0.0060) (0.0000) (0.0002) (0.0007)
Note : p-values are between brackets. * and ** indicate significance at the 5% and 1% level, respectively.
Comparing objective attractiveness levels with investor perception constitutes an interesting
question. To this end, we calculate a composite attractiveness index. The latter is defined as a
weighted average of our eight attractiveness indices. Such weights are determined by average
score to question 3 “How important are the following criteria in your decision to invest in a
given country in general?” and hence directly reflect investor’s preferences. Results are
shown in table 5.
Looking first at regional averages for each index, the comparative advantages of the MENA
region seem to be business opportunities and social environment, as the region is ranked
second after Central Europe in both criteria. Economic activity, political stability and taxation
environment constitute areas of improvements, as the MENA region is ranked behind Asia,
Central Europe and Latin America in each criterion. Finally, the region’s weakest points are
human capital, investor protection and capital market development. The MENA region is
indeed ranked last in each of these criteria.

19
Interestingly, there appears to be a significant gap between local investors’ perception and the
region’s attractiveness: investors optimistically perceive the MENA region as the most
attractive of emerging market areas. However, within our composite index this region is
ranked behind Central Europe, Latin America and Asia. This suggests that MENA private
equity markets benefit from a home bias, which could be attributed to geographical and
cultural proximity from the Euro-Mediterranean area and the Gulf countries.
Turning to country level ranking, investors converge with the composite indices in the case of
Turkey (ranked third in both), Algeria (ranked sixth in both), Syria (ranked last in both) and
Lebanon (ranked eighth by investors and ninth in our composite index). Investors may be
overly optimistic in the case of Morocco (ranked first by investors and fifth in our index),
Tunisia (ranked second by investors and fourth in the composite index) and Egypt (ranked
fourth by investors and eighth in the composite index). By contrast, investors may be overly
pessimistic in the case of Jordan (ranked fifth by investors and second in the composite index)
and Israel (ranked seventh by investors and first in the composite index). This suggests that
private equity investment decisions do not reflect institutional development levels in the
region and may be affected by psychological factors.
The cluster analysis allows us to further analyze the attractiveness of the MENA private
equity markets. As shown in table 6, the MENA countries are scattered in four different
clusters. Egypt, Lebanon, Syria and Algeria belong to cluster A. In spite of relatively
favourable taxation levels (taxation index is the second highest), this cluster seems to gather
the least attractive emerging private equity markets. This cluster is the second lowest in terms
of human capital, social environment, and economic activity. It also gathers countries with the
lowest investor protection, political stability and capital market development, indicating areas
of improvement for these four countries.

20
Table 5 Indices and questionnaires
PERCEPTION COMPOSITE ECO SOC BUS TAX POL CAP HUM INV
MENA 5.09 (1) 1.517 (4) 3.08 0.52 0.55 0.37 0.49 0.49 0.49 0.56
Asia 4.64 (2) 1.533 (3) 3.14 0.40 0.53 0.46 0.51 0.59 0.54 0.61
Central Europe 4.63 (3) 1.568 (1) 3.15 0.59 0.58 0.48 0.68 0.56 0.68 0.63
Sub-Saharan Africa 4.45 (4) 1.491 (5) 2.81 0.45 0.50 0.34 0.45 0.52 0.49 0.59
Latin America 4.13 (5) 1.550 (2) 3.25 0.50 0.49 0.47 0.60 0.62 0.51 0.64
Morocco 5.18 (1) 1.514 (5) 3.00 0.56 0.65 0.46 0.51 0.47 0.29 0.56
Tunisia 5.05 (2) 1.520 (4) 3.05 0.52 0.45 0.34 0.55 0.55 0.51 0.61
Turkey 4.98 (3) 1.522 (3) 3.24 0.44 0.59 0.14 0.54 0.58 0.53 0.54
Egypt 4.89 (4) 1.459 (8) 3.08 0.34 0.57 0.21 0.35 0.49 0.28 0.40
Jordan 4.51 (5) 1.536 (2) 2.90 0.48 0.82 0.44 0.58 0.37 0.56 0.65
Algeria 4.25 (6) 1.499 (6) 3.16 0.56 0.41 0.38 0.46 0.36 0.43 0.54
Israël 4 (7) 1.651 (1) 3.39 0.72 0.82 0.77 0.68 0.82 0.85 0.87
Lebanon 3.82 (8) 1.490 (7) 3.02 0.53 0.32 0.26 0.39 0.56 0.58 0.49
Syria 3.65 (9) 1.427 (9) 2.93 0.48 0.27 0.33 0.34 0.20 0.39 0.37
Note: this table shows regional averages and country scores for investor perception, the composite index (using a logarithmic scale) and each of the bootstrapped indices. Numbers between brackets denote region and country ranks.
Morocco and Jordan belong to cluster B, which displays relatively good performance in
business opportunities and investor protection, which echoes previous results. However, these
countries perform relatively poorly in terms of political stability, capital market development
and taxation; and also have the lowest human capital, economic activity and social
environment scores. Considering that business opportunities and investor protection are
necessary but not sufficient conditions for the development of a private equity market, this
suggests areas of improvements.
Tunisia and Israel belong to cluster C, which gathers mostly Central European markets and is
ranked first in terms of political stability, business opportunities, taxation environment,
investor protection and social environment. It comes second in terms of economic activity and
capital market development. These two countries thus seem the most attractive private equity
markets of the MENA region.
Finally, Turkey belongs to cluster D, gathering advanced emerging markets with the highest
economic activity and capital market development. This cluster comes second in terms of
human capital, social environment, and political stability. Areas of improvements include

21
business opportunities, investor protection and taxation environment. For Turkey, one priority
should be to improve the overall business climate in order to increase private equity levels.
Table 6 Cluster analysis
Cluster A Cluster B Cluster C Cluster D
India Kenya Romania Argentina
China Bangladesh Tunisia South Africa
Syrian Arab Republic Jordan Hungary Korea, Rep.
Indonesia Cote d'Ivoire Israël Turkey
Russia Nigeria Czech Republic Malaysia
Egypt Ghana Chile Mexico
Lebanon Peru Estonia
Botswana Zimbabwe Lithuania
Ukraine Pakistan Bulgaria
Algeria Philippines Thailand
Venezuela Morocco Sri Lanka
Brazil
Poland
Colombia
Table 7 Descriptive statistics
Cluster ECOINDEX POLINDEX BUSINDEX CAPINDEX TAXINDEX INVINDEX SOCINDEX HUMINDEX
A 11 11 11 11 11 11 11 11
3.13 0.45 0.37 0.46 0.41 0.46 0.43 0.46
0.14 0.11 0.13 0.12 0.14 0.10 0.09 0.09
B 11 11 11 11 11 11 11 11
2.87 0.46 0.61 0.52 0.37 0.61 0.40 0.43
0.15 0.17 0.14 0.10 0.09 0.06 0.11 0.12
C 14 14 14 14 14 14 14 14
3.17 0.66 0.63 0.62 0.51 0.72 0.62 0.66
0.13 0.11 0.09 0.10 0.12 0.11 0.07 0.11
D 6 6 6 6 6 6 6 6
3.33 0.62 0.45 0.66 0.36 0.61 0.45 0.58
0.11 0.06 0.10 0.05 0.14 0.06 0.08 0.13
Note: This table shows descriptive statistics for the four clusters described in table 4. In each cell, the first row displays the number of observations, the second row shows the cluster average and the third row displays standard deviation.
5. Conclusion
The objective of this paper was to conduct an exploratory analysis of private equity market
development in the MENA region. We focused on a set of eight criteria: (i) economic activity,
(ii) business opportunities (iii) political stability, (iv) capital market development, (v) investor
protection, (vi) tax environment, (vii) social environment and (viii) human capital and
22
proceeded to a set of international comparisons. In doing so, we analyzed answers from a
questionnaire and developed a set of comprehensive attractiveness indices. Considering the
intersection of these analyses permits raise a set of conjectures.
First, as shown in the questionnaire, local investors rank the MENA region ahead of other
emerging markets areas. In addition, we observe a gap between investor’s perceptions and a
set of quantitative attractiveness indices. Our indices indeed suggest that taken as a whole, the
MENA region is in fact less attractive than Central Europe, Asia or Latin America. These
positive investors’ perceptions could be interpreted as evidence of a Mediterranean home
bias. In addition, investors appear overly optimistic in the case of Morocco and Tunisia and
Egypt, and overly pessimistic in the case of Jordan and Israel. This suggests a possible
interference of psychological factors in the allocation of private equity investment to this
region.
A cluster analysis also revealed that the MENA countries may be divided into three main
groups: Israel, Tunisia and Turkey seem to be converging towards the most attractive
emerging private equity markets. Morocco and Jordan display strong business and investor
protection but have low human capital, economic activity and social environment scores.
Finally, Egypt, Lebanon, Syria and Algeria belong to the least attractive segment of emerging
private equity markets. From a policy point of view, this highlights potential improvement
areas for each country. Interestingly, our attractiveness indices are significantly correlated,
suggesting that that policy reforms should be coordinated if the region is to attract higher
investment levels.
It should be noted, however, that the expected developmental effect of private equity
investment depends upon its sectoral allocation. For a positive impact of be reached, these
flows must indeed be channelled towards the riskiest and most innovative segment of
investment projects, rather than towards traditional sectors (such as real estate, textile and

23
manufacturing). In the latter case, the high returns demanded by private equity investors
would indeed constitute an un-necessary punction on productive capital, especially if profits
are repatriated abroad, or used as collateral to borrow from local bank and invested
internationally. More research is thus needed in order to disentangle the nature and impact of
private equity investment in this region. In this context, the recent European institutional
surge in interest for the Mediterranean economies could offer interesting research
opportunities.
References
Abed, G.T., Soueid, M.M. (2005) “Capital Markets in the Middle East and North Africa”
Working Paper, European Investment Bank – FEMIP Experts Committee.
ANIMA (2008) “Med Funds: Panorama du Capital-Investissement dans la Région MEDA.”
ANIMA Investment Network, Notes & Documents 26.
Baughn, C. C., Neupert, K. E. (2003) “Culture and National Conditions Facilitating
Entrepreneurial Start-Ups.” Journal of International Entrepreneurship, 1: 313-330.
Black B.S., Gilson R.J. (1998) “Venture Capital and the Structure of Capital Markets: Banks
Versus Stock Markets.” Journal of Financial Economics, 47: 243-277.
Bonini, S., Alkan, S. (2006) “The Macro and Political Determinants of Venture Capital
Investments Around the World.” Working Paper, University of Bocconi. Electronic copy
available at: http://ssrn.com/abstract=945312
Calinsky, T., Harabasz, J. (1974). “A Dendrite Method for Cluster Analysis.”
Communications in Statistics, 3(1): 1–27.
Chuhan, P. (1992) “Sources of Portfolio Investment in Emerging Markets. Working Paper,
World Bank, International Economics Department.
Contractual Channel in Private Equity” Quarterly Journal of Economics, 120: 223-246.

24
Cumming, D.J. (2006) “The Determinants of Venture Capital Portfolio Size: Empirical
Evidence” Journal of Business 79: 1083-1126.
Köke, F. J. (1999) “Institutional Investment in Central and Eastern Europe: Investment
criteria of Western portfolio managers.” ZEW Discussion Paper No. 99-37.
Farag, H., Hommel, U., Witt, P. and Wright, M. (2004) “Contracting, Monitoring, and Exiting
Venture Investments in Transitioning Economies: a Comparative Analysis of Eastern
European and German markets.” Venture Capital, 6(4): 257-282.
FEMISE, 2006. “Annual Report on the Euro-Mediterranean Partnership.” European
Commission.
Gompers, P., Lerner, J., 1998. “What Drives Venture Fundraising?” Brookings Papers on
Economic Activity, Microeconomics: 149-192.
Gorman, M., Sahlman, W.A. (1989) “What Do Venture Capitalists Do?” Journal of Business
Venturing, 4: 231-48.
Groh, A., Liechtenstein, H. and Canela, M.A. (2008) “Limited Partners' Perceptions of the
Central Eastern European Venture Capital and Private Equity Market” Working Paper IESE
Business School No. 727.
Hellmann, T., Puri, M. (2000) “The Interaction Between Product Market and Financing
Strategy: The Role of Venture Capital.” Review of Financial Studies 13 (4): 959-984.
Jeng, L.A., Wells, P.H.C. (2000) “The Determinants of Venture Capital Funding: Evidence
Across Countries.” Journal of Corporate Finance, 6(3): 241-289
Johnson, S. H., McMillan, J. and Woodruff, C.M. (1999) “Property Rights, Finance and
Entrepreneurship.” CESifo Working Paper Series No. 212. Available at SSRN:
http://ssrn.com/abstract=198409

25
Lagoarde-Segot, T., Lucey, B. (2008) “The Emerging MENA Equity Markets. Situation and
Characteristics.” Emerging Markets Finance and Trade, September-October 2008
(forthcoming)
Lerner, J., Schoar, A. (2005) “Does Legal Enforcement Affect Financial Transactions? The
OECD (2006) “Challenges for Reform in Financial Markets in MENA Countries.” Working
Group 4 Discussion Paper.
Poterba, J.M. (1989) “Venture Capital and Capital Gains Taxation.” Working Paper n°2832,
NBER, Cambridge
Romain, A., Van Pottelsberghe, B. (2004) "The Economic Impact of Venture Capital"
Working Papers CEB 04-014.RS, Université Libre de Bruxelles, Solvay Business School,
Centre Emile Bernheim (CEB).
Schertler A. (2003) “Driving Forces of Venture Capital Investments in Europe: a Dynamic
Panel Data Analysis. European Integration, Financial Systems and Corporate Performance
(EIFC).” United Nations University, Working Paper 03-27.
Ward, J. H. (1963) “Hierarchical Grouping to Optimize an Objective Function” Journal of the
American Statistical Association 58: 236-244

26
Annex 1 Institutional data
INDEX 1 : Economic Activity Source
ECO1 : 2006 logGDP (constant 2000 US$) WDI database ECO2: 2006 logGDP per capita (constant 2000 US$) WDI database ECO3 : 2006 logGNI per capita, PPP (current international $) WDI database ECO4: 2006 Gross fixed capital formation (% of GDP) WDI database ECO5: 2006 Gross domestic savings (% of GDP) WDI database ECO6 : 2006 GDP growth WDI database INDEX 2 : Business opportunities BUS1 : Price liberalization CEPII database BUS2: Reforms and privatization of non financial institutions between 2001 and 2006
CEPII database
BUS3 : Implementation of privatization program CEPII database BUS4 : Openness of privatization program CEPII database BUS5 : Weight of institutional shareholders CEPII database INDEX 3 : Political Stability POL1: Political rights and functioning of political institutions CEPII database POL2: Change in political rights over the last 3 years CEPII database POL3: Public freedom and civil society development CEPII database POL4: Change in public freedoms over the last 3 years CEPII database POL5 : Internal public security CEPII database POL6 : External public security CEPII database POL7: Change in security levels over the last 3 years CEPII database POL8 : Corruption CEPII database POL9 : Performance of judicial system CEPII database INDEX 4 : Capital market development CAP1 : Weights of small shareholders CEPII database CAP2 : Venture capital and innovation CEPII database CAP3 : Insurance, pension funds CEPII database CAP4 : Traditional credit systems CEPII database CAP5 : Disclosure requirement CEPII database CAP6: Financial system regulation reforms over the last 3 years CEPII database CAP7: Openness to foreign equity and loans CEPII database INDEX 5 : Taxation environment CEPII database TAX1 : Centralization vs .Fiscal autonomy CEPII database TAX2: Fiscal efficiency CEPII database TAX3: Fiscal reforms over the last 3 years WDI database INDEX 6 : Investor protection INV1: Enforcement of traditional property rights CEPII database INV2 : Formal property rights CEPII database INV3 : Nature of private contracts CEPII database INV4 : Enforcement of private contracts CEPII database INV5 : Enforcement of governmental contracts CEPII database INV6 : Financial information CEPII database INV7 : Respect of intellectual property CEPII database INDEX 7 : Social environment SOC1 : Labour market rigidity CEPII database SOC2: Labour market reforms over the last 3 years CEPII database SOC3 : Informal labour market CEPII database SOC4 : Protection of workers CEPII database SOC5 : Labour contract protection CEPII database SOC6 : Social dialogue CEPII database INDEX 8: Human capital HUM1: Education and health - basic public goods CEPII database HUM2: Attitude towards change and innovation CEPII database HUM3 : Investment for future generations CEPII database HUM4: Equity in access to public goods CEPII database HUM5 : Training of elite CEPII database HUM6 : Diffusion of innovation CEPII database HUM7 :Adult professional training CEPII database HUM8 : Social mobility CEPII database