
Private Equity: Barbarians at the Gate? · Private Equity: Barbarians at the Gate? An analysis of...
68
Private Equity: Barbarians at the Gate? An analysis of the effect of private equity on the economic growth in 21 European countries from 1989-2014 By Jordy Mitchell Klaassen ERASMUS UNIVERSITY ROTTERDAM ERASMUS SCHOOL OF ECONOMICS Department of Economics MSc Economics & Business Master Specialisation International Economics Author: J.M. Klaassen Student number: 345402 Thesis supervisor: Prof. dr. J.M.A. Viaene Place: Rotterdam, the Netherlands Finish date: 06/2016 E-mail address: [email protected]
Transcript of Private Equity: Barbarians at the Gate? · Private Equity: Barbarians at the Gate? An analysis of...

Private Equity: Barbarians at the Gate?
An analysis of the effect of private equity on the economic growth in 21 European countries from 1989-2014
By Jordy Mitchell Klaassen
ERASMUS UNIVERSITY ROTTERDAM ERASMUS SCHOOL OF ECONOMICS Department of Economics MSc Economics & Business Master Specialisation International Economics
Author: J.M. Klaassen Student number: 345402 Thesis supervisor: Prof. dr. J.M.A. Viaene Place: Rotterdam, the Netherlands Finish date: 06/2016 E-mail address: [email protected]
ii
ABSTRACT
The recent collapse of Dutch department store V&D has lead to much controversy again about the
effects of private equity firms on the overall market. This study examines the effect of private
equity on the economic growth to provide a concrete example on the effects of private equity in
line with the goal of the European Private Equity & Venture Capital Association (EVCA). Using
a dataset of 21 European countries from 1989-2014, I find strong evidence that private equity
investments promotes economic growth in Europe. Specifically, I find evidence that an increase
in private equity investments by 1% increases the economic growth by 1.9% to 2.8%. Furthermore,
the results are robust to different specifications and after controlling for endogeneity using an
instrumental variable approach. This study therefore contributes to both the existing literature and
the field of private equity in practice. This study is one of the first papers to use European data and
to empirically examine the direct effects of private equity on economic growth. Furthermore,
private equity firms and the EVCA can use the results of this paper to revise the image of the
private equity industry.
JEL Classification: C34, F21, F43 Keywords: Private Equity, FDI, GDP, investments, economic growth, Europe

iii
TABLE OF CONTENTS
ABSTRACT' ii!
TABLE'OF'CONTENTS' iii!
LIST'OF'TABLES' iv!
LIST'OF'FIGURES' v!
1.'Introduction' 1!
2.'Theory' 5!2.1$Private$equity$ 5!
2.1.1!What!is!private!equity?! 5!2.1.2!Private!equity!strategies! 6!2.1.3!The!structure!of!private!equity! 7!
2.2$Theoretical$framework$ 9!2.3$Hypothesis$ 11!2.4$Literature$review$ 12!
2.4.1!FDI!on!economic!growth! 12!2.4.2!Private!equity!on!innovation! 13!2.4.3!Private!equity!on!productivity! 15!2.4.4!Private!equity!on!competition!and!trade! 16!2.4.5!Private!equity!on!economic!growth! 17!
3.'Data'and'Methodology' 19!3.1$Data$and$descriptive$statistics$ 19!
3.1.1!Independent!variable! 19!3.1.2!Dependent!variable! 21!3.1.3!Control!variables! 21!
3.2$Methodology$ 26!
4.'Empirical'Results' 30!4.1$Single$equations$ 30!4.2$Endogeneity$ 34!4.3$TwoIstage$least$squares$ 36!4.4$Robustness$checks$ 38!
5.'Discussion'of'Results' 43!
6.'Conclusion' 46!
REFERENCES' 49!
APPENDIX'A' 58!
APPENDIX'B' 62!
APPENDIX'C' 63!

iv
LIST OF TABLES
Table 3.1: Descriptive statistics of the key variables 20
Table 3.2: Unit root tests for the key variables 29
Table 4.1: Durbin-Wu-Hausman test 30
Table 4.2: Wooldridge test 31
Table 4.3: Modified Wald test 31
Table 4.4: Effect of private equity on the real GDP growth per capita 33
Table 4.5: Wooldridge test 34
Table 4.6: Modified Wald test 34
Table 4.7: Effect of economic growth on private equity 35
Table 4.8: Durbin-Wu-Hausman test 35
Table 4.9: Effect of private equity on the real GDP growth per capita 40
Table 4.10: Effect of private equity on the real GDP growth per capita 41

v
LIST OF FIGURES
Figure 1.1: Private equity investments and GDP growth in Europe 3
Figure 2.1: Private equity strategies 7
Figure 2.2: Private equity structure 8
Figure 2.3: The effect of private equity on economic growth 11
Figure 3.1: The balance of payments 21

1
1. Introduction
On December 31st 2015 a large Dutch chain of department stores, V&D, was declared bankrupt
following months of uncertainty among employees and customers1. At first sight, this
bankruptcy seems just like many of the other bankruptcies in the retail industry following the
surge of internet web shops, but there is one notable difference: V&D was owned by Sun
Capital Partners. Sun Capital Partners is a private equity (PE) firm located in Florida, U.S. and
also holds stakes in, for example, the Dutch clothing store Scotch & Soda.
Although there is not one definition of what a PE firm is, the European Private Equity
& Venture Capital Association (interchangeably called EVCA or Invest Europe) defines it as
‘a form of equity investment into private companies that are not publicly traded on a stock
exchange’. This usually happens through the investment in long-term, typically 10 years,
closed-end funds. Investors in these funds are usually pension funds, insurance companies and
high net worth individuals. Over the last few decades, PE firms have been struggling with their
image of short-term minded, asset-stripping and employee-firing grasshoppers, and Sun Capital
Partners is no exception. This image seems to persist from the 1980s, in which Kohlberg,
Kravis, Roberts & Co (KKR) completed a leveraged buyout (LBO) of RJR Nabisco. The
owners of KKR were later called ‘barbarians at the gate’ because of their greediness in this
deal, and is nowadays a renowned example of corporate greed and PE in general. Even recently
a member of the Dutch parliament, Henk Nijboer, called to battle PE excesses, although he
stated that PE could be beneficial for companies2.
The financial trouble at V&D caused Sun Capital to impose a 5.8% pay cut to V&D
employees in 2015, and even in this early stage this lead to much controversy for the Dutch
union FNV about the owners of V&D3. In a recent article in NRC Handelsblad, Sun Capital
Partners were not blamed, however, for the financial distress at V&D4. Nonetheless, the general
public and media seems to maintain the negative image of PE firms.
In fact, a recent report by Investec Fund (2013) indicates that the PE industry is indeed
still struggling with its negative image since the financial crisis. The study finds that PE firms
have to adapt to the new post-crisis environment to address this negative image, specifically
1 V&D failliet: Dit betekent het voor medewerkers, leveranciers en klanten. (2015, December 31). NOS. Retrieved February 15, 2016, from http://nos.nl/artikel/2078060-v-d-failliet-dit-betekent-het-voor-medewerkers-leveranciers-en-klanten.html 2 Jonker, S. (2015, January 26). PvdA wil ‘uitwassen’ private equity aanpakken. Financieele Dagblad. Retrieved February 15, 2016, from http://fd.nl/frontpage/economie-politiek/1090069/pvda-wil-uitwassen-private-equity-aanpakken 3 V&D-personeel moet salaris inleveren, 50 mensen ontslagen. (2015, January 19). NRC Handelsblad. Retrieved February 15, 2016, from https://nrccarriere.nl/artikelen/vd-personeel-moet-salaris-inleveren-vd-ontslaat-50-mensen 4 Rijlaarsdam, B. (2015, January 27). Blinde paniek in het warenhuis. NRC Handelsblad. Retrieved February 15, 2016, from http://www.nrc.nl/nieuws/2015/01/27/warenhuis-in-nood-redt-wat-er-te-redden-valt
2
targeting buyout firms to behave more maturely. If they do not, this could lead to more
regulation and, as a result, a lower ability to raise funds from new investors (Investec Fund,
2013). Even more recently, the EVCA has expressed their concerns about the negative image
of PE. PE firms are seen as maximizing the return for their investors at the expense of jobs and
economic growth. Eileen Appelbaum, Senior Economist at the Center for Economic and Policy
Research, agrees with this current negative image of the PE industry, but does note that PE
firms are able to improve the number of jobs and the value for stakeholders (Appelbaum and
Batt, 2014). She believes that PE firms can improve their image by focusing on smaller
companies, distressed companies and improving operating performance, because that is where
PE firms are value-adding. To revise the image of the PE industry, the EVCA focuses on
‘encouraging the private equity industry to look beyond returns and recognize its role as a global
influencer and agent for progress, [which] requires concrete examples and models for
inspiration’5. This thesis attempts to provide such a concrete example of the beneficial effect of
the PE industry on economic growth.
This master’s thesis examines the effect of PE, partially as part of foreign direct
investments (hereafter: FDI) on the economic growth in European countries. Research on the
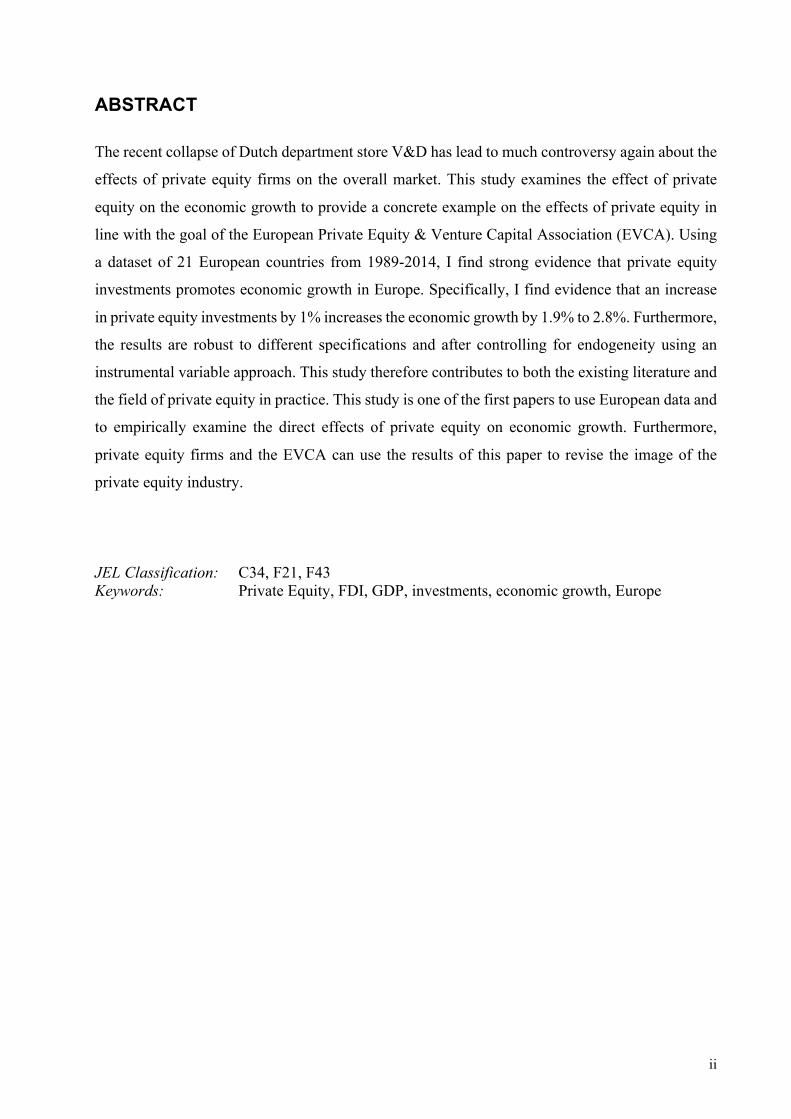
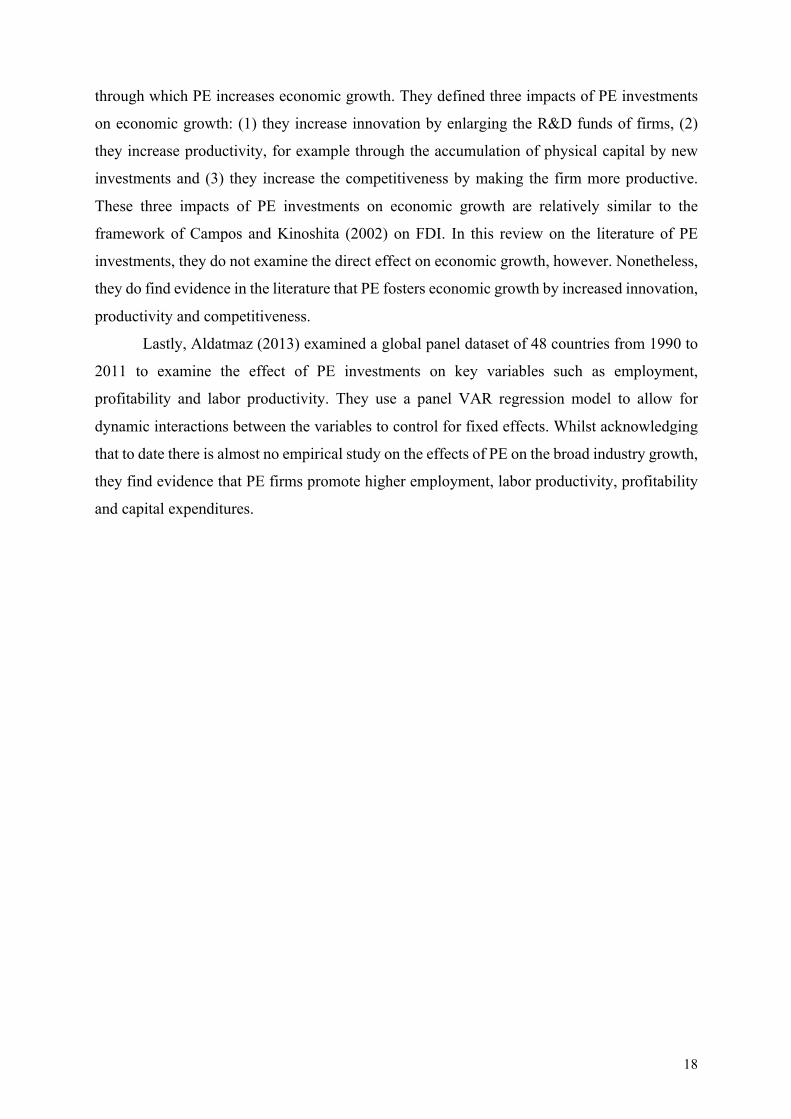
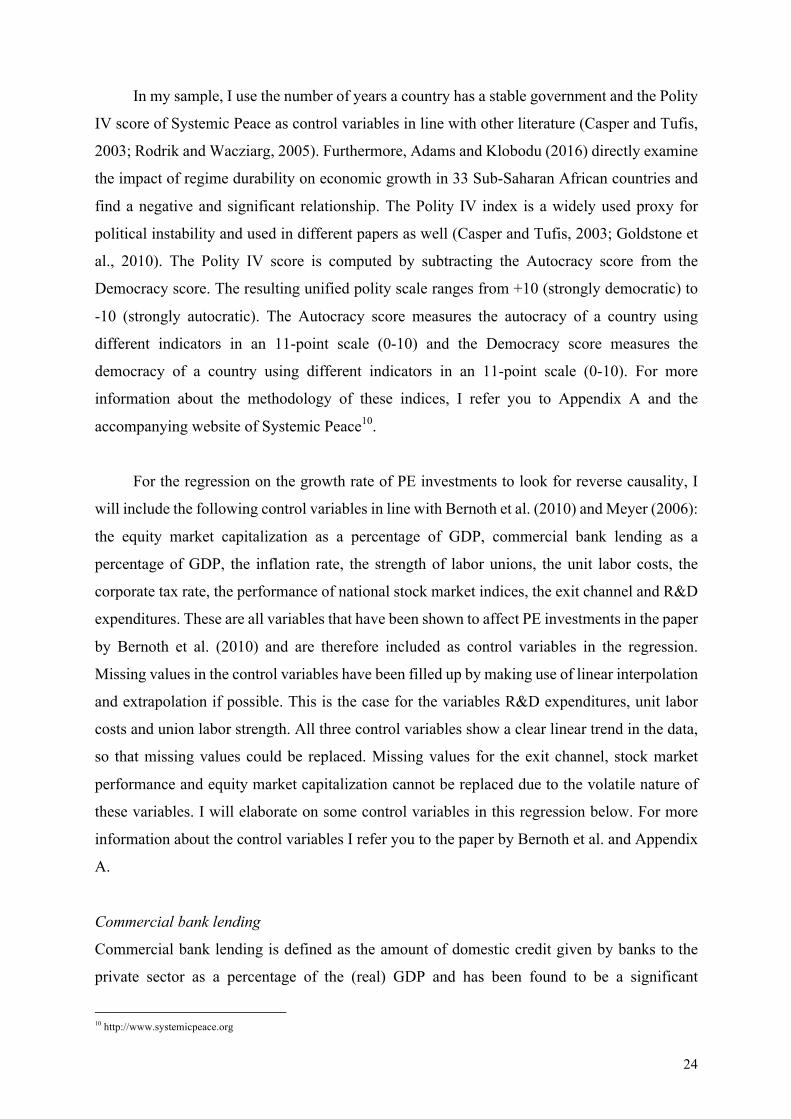
effects of PE on macroeconomic variables is limited. As can be seen in Figure 1.1, PE
investments have been increasing extensively over the past two decades. The enormous increase
in PE investments has caught the attention of policy makers and economists as well, wondering
what the effects of PE are. The examination of the PE industry is thus relatively new. Studies
have been focusing on the effects of PE on innovation, productivity, firm competition and trade.
For example, Lichtenberg and Siegel (1990) were one of the first to examine the effects of PE
on total factor productivity (TFP) and finds that PE firms increase the total productivity of their
portfolio firms. Other studies find similar positive effects for the link between PE and
innovation and PE and trade (Kortum and Lerner, 2000; Popov and Roosenboom, 2012; Samila
and Sorenson, 2011; Strömberg, 2009). To date, however, little research is done on the direct
effect of PE on economic growth (Strömberg, 2009). This is mostly due to data availability
issues, since PE firms are not obliged to disclose data, and endogeneity issues (Strömberg,
2009). Figure 1.1 shows that there is a correlation between PE investments and economic
growth in Europe. For example, during the financial crisis (2007-2009) the GDP growth
stagnates in line with PE investments, whereas both indicators increase substantially after the
financial crisis.
5 http://www.investeurope.eu/Content/Microsites/symposium2014/overview.html

3
Source: Invest Europe Yearbook - 2015 Yearbook and World Bank World Development Indicators Database
This topic serves both the interest of the academic private equity literature as well as the
private equity industry in practice. PE firms are concerned about their negative image6.
Research on the effects of PE is therefore very useful to PE firms who could use these results
to revise their image. Even though there has been research on the effects of PE firms on
macroeconomic variables before, no information is available about their effects in recent years
and almost no study uses economic growth as their focus. Furthermore, these studies generally
examine only U.S. data because of data availability issues. This thesis examines only European
countries since especially the research on European effects is limited, and to avoid the effect
that more than 50% of the database contains U.S. PE investments. Lastly, this thesis attempts
to control for reverse causality issues by employing an instrumental variable approach.
The research question of this paper is: What is the effect of private equity on economic
growth? This question will be answered using data on private equity investments from the
Invest Europe Yearbook - 2015 for 21 European economies. In evaluating the effect of private
equity on economic growth, I test one hypothesis in line with the endogenous growth theory
and empirical literature which explains positive effects of PE on innovation, productivity and
competition: private equity has a positive effect on economic growth in Europe. This hypothesis
is tested using a Least Squares Dummy Variable Model (LSDVM) using fixed effects to control
6 Weissink, A. (2015, April 29). ‘Private equity maakt zich zorgen om imago van sprinkhanen’. Financieele Dagblad.
I6,0%
I5,0%
I4,0%
I3,0%
I2,0%
I1,0%
0,0%
1,0%
2,0%
3,0%
4,0%
5,0%
€ 0!
€ 10.000!
€ 20.000!
€ 30.000!
€ 40.000!
€ 50.000!
€ 60.000!
€ 70.000!
€ 80.000!
90 91 92 93 94 95 96 97 98 99 00 01 02 03 04 05 06 07 08 09 10 11 12 13 14
Millions
Figure 1.1: Private equity investments and GDP growth in Europe
PE!investments GDP!growth
4
for omitted variable bias. In the first regression, I regress economic growth on private equity
investments, the stock market performance, the unemployment rate and other control variables
that have been shown to affect the economic growth in line with previous literature. Moreover,
I test for endogeneity using two measures: (1) by regressing private equity investments on the
real GDP growth rate and other control variables that have been shown to affect private equity
investments in line with previous literature and (2) by means of a Hausman test. Lastly, I will
control for endogeneity employing a two-stage least squares regression using venture capital
investments and buyout investments as instrumental variables for private equity investments.
The regressions are then examined to accept or reject the hypothesis.
The empirical results indicate strong evidence that private equity has a positive effect
on the economic growth in a sample of 21 European countries. Specifically, this paper finds
evidence that an increase in private equity investments by 1% increases the real economic
growth rate by approximately 1.9% to 2.8%. This result is in line with the empirical literature
of Meyer (2006) who finds similar results using a European dataset from 1994-2004.
Furthermore, these results are robust to different specifications and endogeneity issues.
To summarize, this thesis contributes to the existing literature and the field of private
equity in practice in several ways. First, it is one of the first papers to examine the direct impact
of private equity investments on the economic growth. Second, it examines the impact of private
equity investments on economic growth only for European countries whereas previous studies
mainly used U.S. data. And lastly, it contributes to the field of private equity in practice as it
attempts to answer the question whether private equity firms in general add value. The results
of this thesis can be used to revise the image of private equity firms.
The remainder of this thesis is arranged as follows. Chapter 2 presents the theory on the
topic and an extensive literature review on the link between private equity and various
characteristics. Chapter 3 describes the data and methodology and Chapter 4 describes the
empirical results. Further, Chapter 5 provides an overview of my results and links them to the
previous literature and Chapter 6 concludes and summarizes the results.

5
2. Theory
The literature on PE has developed considerably over the last few decades, focusing on the
performance of PE firms to the effect of PE on macro- and microeconomic variables like firm
characteristics and productivity. This section gives a short overview of the extensive amount of
literature on PE. First, I will define PE, its structure and its strategies. Second, I will elaborate
on the theoretical framework that will be used and the resulting hypothesis. Finally, I will
present an overview of the current literature on PE and their impact on innovation, productivity,
competition and overall economic growth.
2.1 Private equity
2.1.1 What is private equity? In the current literature, there is no single definition of PE and the jury is still out whether or
not to include PE as part of FDI. Further, the terms PE and venture capital are often mixed up,
whereas the latter is just one of the strategies of PE. This has to do with a difference in
definitions on PE and venture capital in Europe and the United States.
According to the European Private Equity & Venture Capital Association (EVCA),
private equity is defined as ‘a form of equity investment into private companies that are not
publicly traded on a stock exchange’7. This usually happens through the investment in long-
term, typically 10 years, closed-end funds. The British Private Equity & Venture Capital
Association (BVCA) defines PE as ‘finance provided for return in an equity stake in potentially
high-growth companies’7.
Venture capital, on the other hand, is the investment of PE funds into young and high-
growth companies, according to the EVCA. The first part of confusion is that people generally
tend to overlook the addition of the word ‘young’ in the definition of venture capital. The
second part of confusion is by the the way in which venture capital is treated in different regions
in the world. According to the BVCA, PE and venture capital are seen as different types of
investments in the United States, whereas in Europe venture capital is regarded as one strategy
that PE firms typically pursue. Nonetheless, in both regions venture capital is seen as
investments in the early stages of development, whereas PE typically invests in more mature
companies7.
Metrick and Yasuda (2011), although both American and publishing their book in the
United States, adopt the ‘European’ definition of PE: a broad class of investing that includes
7 FAQs in Private Equity. (n.d.). Retrieved April 26, 2016, from http://www.bvca.co.uk/PrivateEquityExplained/FAQsinPrivateEquity.aspx

6
venture capital (VC) as well as investments in leveraged buyouts (LBOs), mezzanine structures,
and distressed companies. Therefore, in line with most of the literature, I will adopt the
European style of defining PE in this thesis. That is, I will use the definition of the EVCA.
Furthermore, there is some debate as to whether or not to include PE investments as part
of FDI or a portfolio investment in the balance of payments. UNCTAD (2008) defines FDI as
‘an investment involving a long-term relationship and reflecting a lasting interest in and control
by a resident entity in one economy of an enterprise resident in a different economy’. FDI is
different from portfolio investments in that FDI establishes or maintains control of the
enterprise receiving the investment (Bowen et al., 2012). According to the Financial Times,
control is defined as having at least 10% of the voting shares in a company8. The debate is on
whether or not PE investments, having met the 10% control threshold, involve a ‘long-term’
relationship since PE firms typically disinvest within 5-7 years.
Nonetheless, the current literature on PE has been gradually including PE as part of FDI.
Specifically, Agmon and Messica (2009) were one of the first to include PE investments into
FDI and name it Financial Foreign Direct Investments (FFDI). They define FFDI as
‘investments of PE funds in emerging markets for the purpose of generating a high return-on-
investment over a relatively short period (5-7 years)’. More recently, Ramamurti (2013)
identified in his paper three new players to possibly play a large role in FDI over the coming
years: emerging market transnational corporations, sovereign wealth funds and PE. However,
he finds that although the PE industry has been thriving over the last decade, the contribution
of PE to FDI is likely to be small and unsustainable.
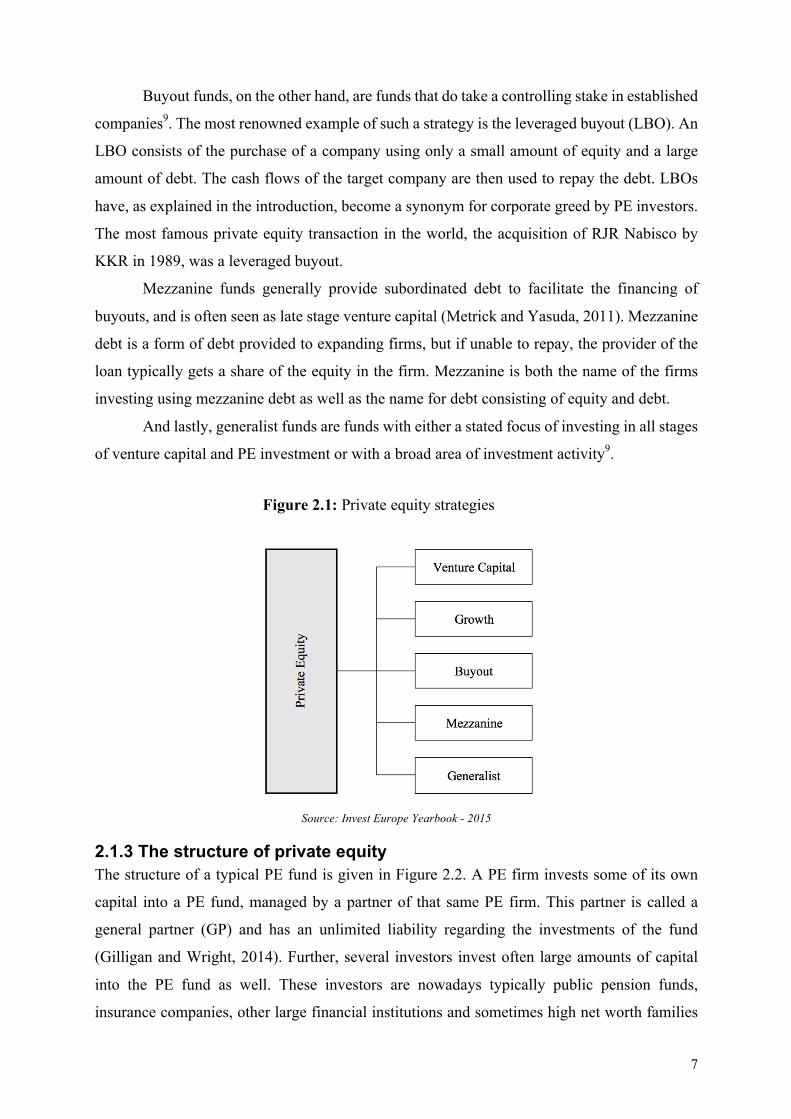
2.1.2 Private equity strategies In line with the EVCA, I distinguish between 5 different strategies of PE funds (Figure 2.1).
Venture capital is an investment by PE firms in the early stages of development of a firm, as
defined in the previous section. The other strategies include growth, buyouts, mezzanine and
generalist funds. The definitions of these types of fund stage focuses will be given in line with
the definitions of the EVCA since this paper uses the database of the EVCA as well.
Growth funds are defined as investments by PE firms in mature companies that are
looking to expand or restructure their operations9. It is usually classified as a strategy that has
characteristics of both venture capitalism and leveraged buyouts, although the strategy often
does not use leverage to invest in companies. Furthermore, most of the PE firms using a growth
strategy only take minority stakes.
8 Financial Times lexicon. (n.d.). Retrieved April 26, 2016, from http://lexicon.ft.com/Term?term=foreign-direct-investment 9 Invest Europe - About Research. (n.d.). Retrieved April 26, 2016, from http://www.investeurope.eu/research/about-research/glossary/
7
Buyout funds, on the other hand, are funds that do take a controlling stake in established
companies9. The most renowned example of such a strategy is the leveraged buyout (LBO). An
LBO consists of the purchase of a company using only a small amount of equity and a large
amount of debt. The cash flows of the target company are then used to repay the debt. LBOs
have, as explained in the introduction, become a synonym for corporate greed by PE investors.
The most famous private equity transaction in the world, the acquisition of RJR Nabisco by
KKR in 1989, was a leveraged buyout.
Mezzanine funds generally provide subordinated debt to facilitate the financing of
buyouts, and is often seen as late stage venture capital (Metrick and Yasuda, 2011). Mezzanine
debt is a form of debt provided to expanding firms, but if unable to repay, the provider of the
loan typically gets a share of the equity in the firm. Mezzanine is both the name of the firms
investing using mezzanine debt as well as the name for debt consisting of equity and debt.
And lastly, generalist funds are funds with either a stated focus of investing in all stages
of venture capital and PE investment or with a broad area of investment activity9.
Source: Invest Europe Yearbook - 2015
2.1.3 The structure of private equity The structure of a typical PE fund is given in Figure 2.2. A PE firm invests some of its own
capital into a PE fund, managed by a partner of that same PE firm. This partner is called a
general partner (GP) and has an unlimited liability regarding the investments of the fund
(Gilligan and Wright, 2014). Further, several investors invest often large amounts of capital
into the PE fund as well. These investors are nowadays typically public pension funds,
insurance companies, other large financial institutions and sometimes high net worth families
Figure 2.1: Private equity strategies
8
and individuals and are called limited partners (LPs). They are called limited partners because
they are only liable for the amount that they invest in the fund. The LPs only provide capital to
the PE fund and do not manage the fund. Consequently, the GP of the fund (the PE firm) will
then look for suitable investments and invest the capital provided by the PE firm and the limited
partners into a range of companies.
The LPs and GP sign a limited partnership agreement (LPA) in which both parties agree
on, among others, the duration of the fund, the management fee to be paid to the GP and the
type of companies that the GP can invest in (Gilligan and Wright, 2014). The PE fund therefore
has a limited lifetime: PE firms typically cannot invest in new companies after 6 years and the
fund is terminated within 10 years. PE firms typically have multiple funds open for different
types of investments, with each fund manager managing different funds at the same time.
Source: Gilligan and Wright (2014)
To conclude, fund managers (or the PE firm) have 4 sources of income according to
Gilligan and Wright (2014): basic salary, management fees, return on investments and
additional performance fees. Management fees typically consist of 1% to 3% of the invested
capital per year. In addition, there usually is an additional performance fee that consists of an
extra fee if a pre-determined hurdle rate has been obtained. This hurdle rate is typically 8% and
the PE firm obtains 20% of any return above that rate. The return on investment is only made
when the company is sold again.
Figure 2.2: Private equity structure

9
2.2 Theoretical framework In the current literature, there are two opposite growth models: neoclassical growth models and
endogenous growth models. According to the neoclassical growth model, developed by Solow
(1956) and Swan (1956), growth is exogenously determined. Long-run growth in these models
occurs through an exogenous technological progress. Specifically, Solow used a Cobb-Douglas
production function in which labor (L), capital (K) and the effectiveness of labor (A) affect the
rate of economic growth (productivity (Y)):
! = #$%&'($ (2.1)
In the 1990s, Mankiw et al. (1992) came up with the addition of human capital (H) to this model
to better explain real world economic growth:
! = #$)*%&'($(* (2.2)
Thus, these models treat long-run economic growth as exogenously given, indicating that
economic growth is not affected by economic forces.
From the 1980s, many economists were unhappy with the exogenous growth theories
to explain real world phenomena and wanted to explain growth endogenously. Romer (1986)
therefore laid the foundation of endogenous growth theory with the AK-model. The AK-model
is build on the following production function:
! = %# (2.3)
where A is technology and K is (human) capital. In this model, the long-run economic growth
rate will be affected by economic factors (Aghion et al., 1998). A weakness of this model is
that it combines both technological progress and capital accumulation in one factor.
To account for this weakness, innovation-based endogenous growth theories have
emerged which separate human and physical capital from intellectual capital (Aghion et al.,
1998). The first model using this separation in capital was Romer (1990). Romer’s model
explained that economic growth, or aggregate productivity, increases with the number of
varieties in products. Romer used an Ethier (1982) production function with Dixit-Stiglitz
preferences (Aghion et al., 1998):

10
! = &'($ +(-)$/0-,2
3 (2.4)
where L is constant labor supply, x(i) is the flow input of intermediate product i and A reflects
the number of varieties of intermediate product i. In this model, innovation increases growth by
increasing the number of varieties A in the above production function.
Another innovation-based endogenous growth model has been constructed by
Grossman and Helpman (1991) and is based on Schumpeter’s (1942) theory of ‘creative
destruction’. In contrast to Romer’s (1990) model, this version focuses on the effect of
innovation on the quality of products, rather than the number of varieties, which makes older
products useless (Aghion et al., 1998). The production function of this model is given by:
! = &'($ %(-)'($+(-)$/0-,'
3 (2.5)
where product variety has now been set to unity (Aghion et al., 1998). Furthermore, each
intermediate product i now has a different productivity A. Economic growth will now be
obtained by innovations that improve the productivity, or quality, parameter A.
To put things in perspective, this paper analyzes the effect of PE investments on
economic growth with the innovation-based endogenous growth theory. Specifically, PE
investments promote economic growth in three ways as described in a report by Frontier
Economics (2013). Firstly, PE investments can promote economic growth as they improve
innovation. PE firms attract funds to invest in companies. These funds can be used to increase
innovation by increasing the R&D fund of the firm. Furthermore, PE investments often invest
in start-ups which have a tendency to be more innovative than normal (Frontier Economics,
2013). Innovation, in return, is a key determinant of economic growth in the above mentioned
endogenous growth model. Therefore, PE is expected to increase economic growth through
innovation.
Secondly, PE investments increase productivity, for example through the accumulation
of physical capital like investments in buildings and machines and innovation of new
technologies. Furthermore, they can promote employment rates by creating new business for
the firms in question. In the above mentioned endogenous growth model in equation 2.5, this
leads to economic growth again.
Thirdly, the aforementioned increase in productivity increases the competitiveness of
domestic firms. Moreover, PE can help domestic firms expand to foreign markets and improve

11
the external trade. The increased competitiveness of firms incentivizes firms to be more
innovative and in return increases production according to the endogenous growth model.
A summary of the three ways in which PE improves economic growth can be seen in
Figure 2.3.
Source: Own work and Frontier Economics (2013)
2.3 Hypothesis The main research question of my master’s thesis will be the following:
What is the effect of private equity on the economic growth in Europe?
This research question will be answered using the following hypothesis in line with the
endogenous growth theory and empirical literature which explains positive effects of PE on
innovation, productivity and competition:
H1: Private equity has a positive impact on the economic growth in Europe
Figure 2.3: The effect of private equity on economic growth
12
2.4 Literature review Over the last few decades the literature on PE and FDI has developed into numerous topics of
research, ranging from the determinants of FDI to the impact of FDI and PE on various
macroeconomic variables. This literature review will first shortly examine the impact of FDI
on economic growth. In line with the theoretical framework and the ways in which PE promotes
growth, I will then examine the impact of PE on innovation, productivity and competition and
trade. The literature review concludes with the current empirical literature on the direct effect
of PE on economic growth. Note that this literature review is far from exhaustive and is limited
to the most important papers in the field.
2.4.1 FDI on economic growth The literature on the impact of FDI on economic growth is extensive, but inconclusive about
their effects and the direction of the effect. The initial ideas of the effect of FDI on economic
growth was developed by Brems (1970). Brems simply used the standard exogenous
neoclassical growth model, also called Solow-Swan model, and argued that FDI added to the
physical capital of a country by including FDI into the factors of production of the model. This
in turn increases the growth in the host economy. While this concept seems simple, the theory
was flawed since this model only captures short-term effects to economic growth (Neuhaus,
2006).
However, it was not until Romer (1990) and Borensztein et al. (1998) developed a new
endogenous growth model in which FDI did affect economic growth in the long-term. They
developed a model in which foreign direct investments increase the economic growth in a host
country because domestic firms benefit from the technologies that foreign firms bring. As a
result, domestic firms can produce more ‘new’ varieties of capital goods. Borensztein et al.
(1998) found a positive effect of FDI on economic growth using a seemingly unrelated
regression (SUR) with panel data of 69 countries in the world, but only when the country
receiving the investments has already a certain level of human capital available. However, as
noted in Neuhaus (2006), this theory neglects the immediate effect of foreign direct investments
on the technology level of the domestic country, such as greenfield investments. Furthermore,
they noted that no ideal instruments are available to control for endogeneity between FDI and
economic growth. Attempting to control for this, they find the same results.
More recently, Nair-Reichert and Weinhold (2001) tried to control for endogeneity
problems using the Mixed and Fixed Random (MFR) estimator to control for the heterogeneity
of panel data. Their result indicates that imposing homogeneity assumptions in panel data may

13
lead to biased results. In their panel data set of 24 developing countries from 1971 to 1995, they
find some evidence that the causality runs from FDI to economic growth, yet acknowledge that
this relationship is not uniform across countries.
Campos and Kinoshita (2002) build on the theory of Borensztein et al. (1998) and
identify the three ways in which FDI may promote economic growth. The first is that FDI boosts
economic growth through the accumulation of capital. The second asserts that FDI increases
the growth of a country through technology and human capital (knowledge) transfers and the
third asserts that FDI directly increases the level of technology, for example by learning (i.e.
how to produce faster). In line with three previous studies, Campos and Kinoshita reproduce
their results with a different dataset, controlling for endogeneity and reverse causality using
two-stage least squares and Granger causality tests. In their dataset of 25 transition economies
in Eastern Europe, they find evidence in line with the theory that FDI increases economic
growth.
Lastly, Li and Liu (2005) also examine, using a panel data of 84 countries from 1970 to
1999, the impact of FDI on economic growth. They identify two ways in which endogeneity
has been covered in the current literature. The first is through the use of bilateral causality
testing using, for example, Granger causality tests in line with Campos and Kinoshita (2002).
Although using Granger causality tests are useful to some extent, there are more sophisticated
and better approaches available to test for causality (Chowdhury and Mavrotas, 2006). The
second approach uses simultaneous equation systems such as instrumental variable approaches
like Borensztein et al. (1998) in which FDI and growth (or more variables) are treated as
endogenous variables. Using both types of testing, Li and Liu find that FDI and economic
growth have become increasingly endogenously related. This implies that they find evidence
that FDI promotes economic growth and vice versa. Nonetheless, the current literature still
shows ambiguous results across time and between countries (Carkovic and Levine, 2002; Choe,
2003; Hsiao and Hsiao, 2006)
2.4.2 Private equity on innovation The current literature on the effect of PE on innovation finds in general a positive link
(Strömberg, 2009). However, because PE firms are not obliged to disclose data to any database
and PE is a relatively new concept in Europe, the current literature mainly examines venture
capital data in U.S. samples. For example, Kortum and Lerner (2000) were one of the first to
examine the effect of venture capital firms on the number of patented inventions. The number
of patented inventions is a widely used proxy for innovation and still used nowadays. Using a
U.S. sample of 20 manufacturing industries from 1965-1992, they find a positive effect of
14
venture capital firms on the number of patented inventions. In addition, they find that this effect
is robust to different specifications and endogeneity issues. In fact, they find that venture capital
firms were attributed for 14% of the U.S. innovative activity by 1998.
More recently, Mollica and Zingales (2007) confirm the findings of Kortum and Lerner
(2000) in their study on the impact of venture capital on new business creation and the number
of patents. They find that venture capital investments increases the number of businesses and
the number of patents in a U.S. sample. Their results indicate that a one-unit increase in the
standard deviation of venture capital investments increases the number of patents from 4% to
15%, dependent on the sample. Furthermore, a 10% increase in venture capital investments
increases the number of businesses by 2.5%.
However, Hirukawa and Ueda (2011) casts doubts on the direction of causality of the
previously mentioned papers. They use the same methodology as Kortum and Lerner (2000),
but include data until 2001. They test two hypotheses: the VC-first hypothesis and the
innovation-first hypothesis. The VC-first hypothesis states that venture capital investments
stimulate innovation, whereas the innovation-first hypothesis claims that first new technology
arrives and this increases the demand for venture capital. Furthermore, they use two proxies for
innovation: total factor productivity growth (TFP) and the number of patents. Again using a
sample of the U.S. manufacturing industry, Hirukawa and Ueda only find weak evidence of the
VC-first hypothesis when using total factor productivity as a proxy for innovation. However,
they find no significant evidence when using the total number of patents as a proxy, in contrast
to the findings of Kortum and Lerner (2000) and Mollica and Zingales (2007). On the other
hand, they find a significant effect for the innovation-first hypothesis when using TFP growth.
It must be noted that they do not find evidence for reverse causality when using the number of
patents.
Using firm-level data within Italy and Germany, respectively, both Engel and Keilbach
(2007) and Caselli et al. (2009) confirm the findings of Hirukawa and Ueda (2011). Engel and
Keilbach use a German sample and find that young venture-funded German firms have a higher
number of patent applications than non-venture funded firms. Nonetheless, this result already
occurs before the funding of the venture capitalist, so that the number of patent applications is
not found to differ between venture funded and non-venture funded firms after venture capital
firms step in. However, they do find a weakly significant difference overall.
Caselli et al. (2009) confirm these results by using the same methodology. Using 37
Italian venture funded firms and matching these with 37 similar but non-venture funded firms
between 1995-2004, they find that venture capital firms select their companies based on their

15
innovation, but after the investment they focus on improving the profits of the firm rather than
innovation. Both papers find evidence that sales increases for the firms who received venture
capital financing, but the number of patent applications decreases.
Popov and Rosenboom (2012), on the other hand, confirm that venture capital has had
a positive effect on the number of patented inventions for a European sample of 21 countries,
but the results are ambiguous. In their paper, they have addressed the causality issues of
Hirukawa and Ueda (2011), Engel and Keilbach (2007) and Caselli et al. (2009). They confirm
some of the results of the firm-level evidence in the latter two papers, but also find evidence
that venture capital investments increase innovation, in line with the U.S. sample of Mollica
and Zingales (2007). Although they find that venture capital firms have accounted for 10.2%
of the industrial innovation in Europe, this finding differs per sample and is found to be
generally lower than their impact in the United States. Further, they find that venture capital
firms have a greater impact on innovation in countries in Europe with lower barriers to
entrepreneurship and a better environment for venture capital firms in terms of taxes.
2.4.3 Private equity on productivity Concerning the link between PE and productivity, Strömberg (2009) finds in his literature
review a positive effect. In fact, PE participation leads to a 6.9% increase in EBITDA per
employee on average according to Strömberg, but this effect is larger for European firms than
for U.S. firms.
Lichtenberg and Siegel (1990) were one of the first to examine the effects of PE on total
factor productivity (TFP), defined as output per unit of input. Previous studies focused solely
on the effect of PE on stock prices or profits, but these measures of efficiency have been found
to not adequately reflect future performance (Shleifer and Vishny, 2003). Using a sample of
131 leveraged buyouts (LBOs), and in specific management buyouts (MBOs), they find that
the LBOs (MBOs) in the period of 1983-1986 had a significant positive effect on TFP from 2%
to 8.3% in the three years after the buyout. However, they found no significant increase for the
years of 1981 and 1982.
Harris et al. (2005) extend the paper of Lichtenberg and Siegel (1990) by including more
recent data and control variables, a larger sample and by applying more sophisticated
techniques. Using data for the U.K. and using a GMM estimation, in contrast to Lichtenberg
and Siegel using OLS estimations, Harris et al. confirm the previous findings that MBOs
increase the productivity of firms. Their findings suggest that PE firms increase the labor
efficiency of their portfolio firms by outsourcing. These results are confirmed more recently by
16
Bernstein et al. (2010) who find evidence of productivity growth due to PE investments in 20
OECD countries from 1991-2007.
In a more recent paper, however, Hirukawa and Ueda (2011) extend the paper of Kortum
and Lerner (2002) concerning the impact of venture capital investments on innovation, but also
focus on productivity growth. Unlike Lichtenberg and Siegel (1990) and Harris et al. (2005),
they find no evidence that venture capital investments increase TFP growth in a sample of
OECD countries.
The paper by Hirukawa and Ueda (2011) is the only paper not finding a significant
relationship between PE investments and productivity growth. For example, accountancy firm
Ernst & Young (2012) finds that PE investments improve productivity, measured as the
EBITDA per employee, by 6.9% on average across all European countries. In France, the UK
and Ireland, the productivity gains were the largest, increasing by more than 10% because of
PE investments. They find similar results for employment growth.
Lastly, more recently Davis et al. (2014) published a paper in the renowned American
Economic Review regarding the effect of PE on jobs and productivity. Specifically, they use a
large sample of LBOs and include new control variables and estimation techniques to examine
this impact and find a positive effect of LBOs on the TFP growth. This is largely due to target
firms closing down low TFP plants and replacing them with high TFP plants, indicating that
PE firms reallocate jobs more efficiently.
2.4.4 Private equity on competition and trade Lastly, the effect of PE on competitiveness and trade in markets is examined. An increased
productivity and innovation, as discussed in the previous 2 sections, could lead to increased
competition and trade (Frontier Economics, 2013).
Lockett et al. (2008) were the first to examine the effect of PE on the internationalization
of firms using data of the EVCA. Their main result is that venture capital investments are
significantly positively related to the export intensity of portfolio firms, but this effect depends
on the investment stage of the firm. More precisely, they find that venture capital investments
have a greater impact on early-stage target firms than late-stage target firms. These results
indicate that venture capital firms can help target firms internationalize their activities.
Lutz and George (2012) also examine the internationalization of PE portfolio firms in a
theoretical paper including 18 case studies. They find that entrepreneurial spirit increases when
target firms of PE investors are able to acquire slack financial resources from the venture
capitalist. This implies that the entrepreneur is able to grasp more opportunities because cash is
readily available to invest in opportunities that suddenly appear.

17
Concerning the effect on new business creation, there are two papers that have examined
this effect: Samila and Sorenson (2011) and Popov and Rosenboom (2013). The first paper
finds that venture capital investments increases the number of startup firms in a panel of U.S.
metropolitan areas. These results are robust to different specifications and after controlling for
endogeneity using a two-stage least squares approach. For example, doubling the amount of
investments by venture capital firms leads to a 2.11% increase in new firms and a 1.24% higher
employment. Samila and Sorenson explain this fact by mentioning two mechanisms. The first
implies that would-be startups first look at the availability of capital in a certain sector before
they start their firms. Second, venture capital firms that invest in certain firms may stimulate
other firms in terms of inspiration and training grounds.
Confirming this piece of evidence, Popov and Rosenboom (2013) find that venture
capital investments increase new business creation in a sample of 21 European firms from 1998-
2008. In general, they find that new business creation is 7.1% higher in venture funded
industries than in non-venture funded industries. Furthermore, they find that this effect is higher
in more capital intensive industries, more R&D intensive industries, higher human capital
countries and lower capital gains tax countries. These results hold when controlling for
endogeneity and different robustness tests. Thus, the two papers that have examined this issue
both confirm the positive effects of PE on new business creation.
2.4.5 Private equity on economic growth While the literature on the impact of PE on various characteristics of firms is exhaustive, the
direct impact of PE on economic growth is incomprehensive. To date, there are two known
studies that have examined this direct effect specifically.
Strömberg (2009) examines the PE literature and indeed finds that the literature on PE
investments and overall economy growth is scarce. In fact, he notes that there is no rigorous
academic study analyzing this impact and that this is particularly due to reverse causality issues.
That is, the literature on PE encounters the same issues as that on FDI and economic growth.
Meyer (2006) examined a set of panel data of 20 European countries between 1994 and
2004 and found a positive effect of PE investments on real economic growth. He further
analyzed differences between buyouts, venture capital and early stage investments and found
significantly positive effects for all three types of investments of PE firms. Meyer found no
evidence of reverse causality by looking at the determinants of venture capital investments,
indicating that there is no statistical relationship of economic growth on investments.
The report by Frontier Economics (2013) prepared a summary of the literature on PE
investments for the EVCA (now: Invest Europe) and described the analytical framework
18
through which PE increases economic growth. They defined three impacts of PE investments
on economic growth: (1) they increase innovation by enlarging the R&D funds of firms, (2)
they increase productivity, for example through the accumulation of physical capital by new
investments and (3) they increase the competitiveness by making the firm more productive.
These three impacts of PE investments on economic growth are relatively similar to the
framework of Campos and Kinoshita (2002) on FDI. In this review on the literature of PE
investments, they do not examine the direct effect on economic growth, however. Nonetheless,
they do find evidence in the literature that PE fosters economic growth by increased innovation,
productivity and competitiveness.
Lastly, Aldatmaz (2013) examined a global panel dataset of 48 countries from 1990 to
2011 to examine the effect of PE investments on key variables such as employment,
profitability and labor productivity. They use a panel VAR regression model to allow for
dynamic interactions between the variables to control for fixed effects. Whilst acknowledging
that to date there is almost no empirical study on the effects of PE on the broad industry growth,
they find evidence that PE firms promote higher employment, labor productivity, profitability
and capital expenditures.
19
3. Data and Methodology
3.1 Data and descriptive statistics The sample consists of data from 1989 until 2014 for the 21 following European countries:
Austria, Belgium, Czech Republic, Denmark, Finland, France, Germany, Greece, Hungary,
Ireland, Italy, the Netherlands, Norway, Poland, Portugal, Romania, Slovakia, Spain, Sweden,
Switzerland and the United Kingdom. The starting point of 1989 is chosen since this is the first
year in which data is available from the Invest Europe Yearbook – 2015 database. The data on
the independent variable, PE investments, will thus be retrieved from this database. The data
on PE investments is also shown separately, dividing buyout investments, venture investments
and other investments.
The data on the dependent and control variables will be retrieved from various sources,
in line with Barro and Lee (1994, 1996) and Meyer (2006). The dependent variable, real GDP
growth, will be obtained from the World Bank World Development Indicators Database. The
control variables will be obtained from various sources including the World Bank World
Development Indicators Database, the OECD database, Barro and Lee (1996), the United
Nations Statistics Division, UNCTAD World Investment Reports, Yahoo Finance, and
Freedom House.
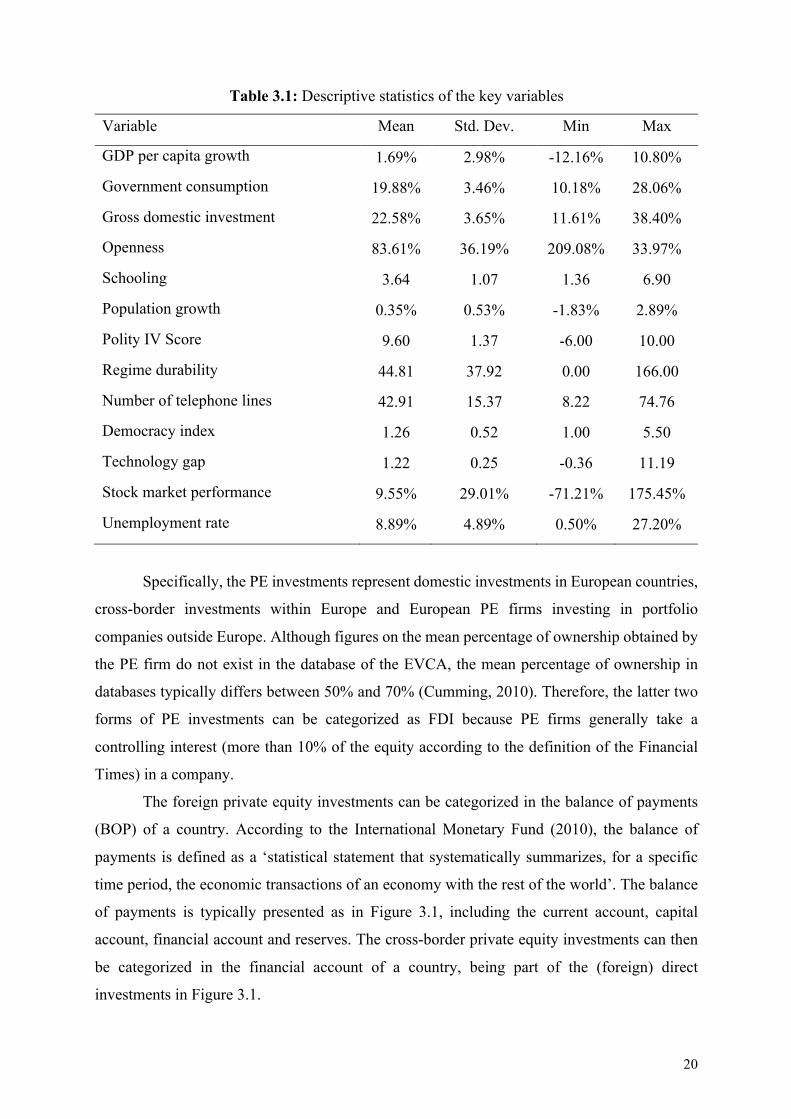
Table 3.1 shows the descriptive statistics of the key variables. Since the dataset contains
missing values on PE investments, PE divestments and control variables for several countries,
the total number of observations in the panel dataset is 546. Therefore, it is an unbalanced panel
data set. The following pages provide an explanation of the variables used in this analysis. More
information about the variables can be consulted in Appendix A.
3.1.1 Independent variable In line with Meyer (2006), I will use PE investments as a percentage of the real GDP as the
independent variable in this analysis. The PE investments data are obtained from the Invest
Europe Yearbook - 2015 database, including data on more than 1,200 European PE firms from
22 countries covering 91% of the European PE market. It is the most comprehensive dataset of
European PE investments available.
The data is obtained by PEREP_Analytics on behalf of the EVCA. They use an annual
survey in which they ask more than 1,200 PE firms about their activity data regarding
fundraising, investments and divestments. These figures are then aggregated by country and
updated every 3 months and therefore represent a flow variable.
20
Table 3.1: Descriptive statistics of the key variables
Variable Mean Std. Dev. Min Max
GDP per capita growth 1.69% 2.98% -12.16% 10.80%
Government consumption 19.88% 3.46% 10.18% 28.06%
Gross domestic investment 22.58% 3.65% 11.61% 38.40%
Openness 83.61% 36.19% 209.08% 33.97%
Schooling 3.64 1.07 1.36 6.90
Population growth 0.35% 0.53% -1.83% 2.89%
Polity IV Score 9.60 1.37 -6.00 10.00
Regime durability 44.81 37.92 0.00 166.00
Number of telephone lines 42.91 15.37 8.22 74.76
Democracy index 1.26 0.52 1.00 5.50
Technology gap 1.22 0.25 -0.36 11.19
Stock market performance 9.55% 29.01% -71.21% 175.45%
Unemployment rate 8.89% 4.89% 0.50% 27.20%
Specifically, the PE investments represent domestic investments in European countries,
cross-border investments within Europe and European PE firms investing in portfolio
companies outside Europe. Although figures on the mean percentage of ownership obtained by
the PE firm do not exist in the database of the EVCA, the mean percentage of ownership in
databases typically differs between 50% and 70% (Cumming, 2010). Therefore, the latter two
forms of PE investments can be categorized as FDI because PE firms generally take a
controlling interest (more than 10% of the equity according to the definition of the Financial
Times) in a company.
The foreign private equity investments can be categorized in the balance of payments
(BOP) of a country. According to the International Monetary Fund (2010), the balance of
payments is defined as a ‘statistical statement that systematically summarizes, for a specific
time period, the economic transactions of an economy with the rest of the world’. The balance
of payments is typically presented as in Figure 3.1, including the current account, capital
account, financial account and reserves. The cross-border private equity investments can then
be categorized in the financial account of a country, being part of the (foreign) direct
investments in Figure 3.1.

21
Source: International Monetary Fund (2010)
Furthermore, the PE investment data are in nominal terms, so that the annual inflation
rate is included as a control variable. Next to aggregated total PE investment data, the database
contains information on the investments per strategy (venture capital, growth capital, buyout,
mezzanine and generalist) and sector (e.g. agriculture, consumer goods and transportation).
3.1.2 Dependent variable In line with Li and Liu (2005) and Meyer (2006) the dependent variable is the growth rate of
real GDP per capita. I use the real GDP per capita in order to account for inflation, since the
panel dataset runs over a period of 26 years. The real GDP per capita represents a flow variable
as well, in line with the independent variable, i.e. it is measured over an interval of time. The
growth rate of the real GDP per capita is a widely employed proxy for economic growth and
used in, inter alia, Borensztein et al. (1998), Li and Liu (2005) and Meyer (2006). The real GDP
per capita is obtained from the World Bank World Development Indicators Database and the
growth rate of the real GDP per capita is obtained as follows:
4567/89:/;5</=6;->6/?<@A>ℎ:/4567/89:/;5</=6;->6D − 4567/89:/;5</=6;->6/D('
4567/89:/;5</=6;->6D(' (3.1)
3.1.3 Control variables For the regression on the real GDP growth rate, I will include the following control variables
in line with Barro and Lee (1994, 1996): real GDP per capita in 1990 at 2005 constant prices,
gross domestic investment as a percentage of GDP, the openness of a country, the average years
Figure 3.1: The balance of payments
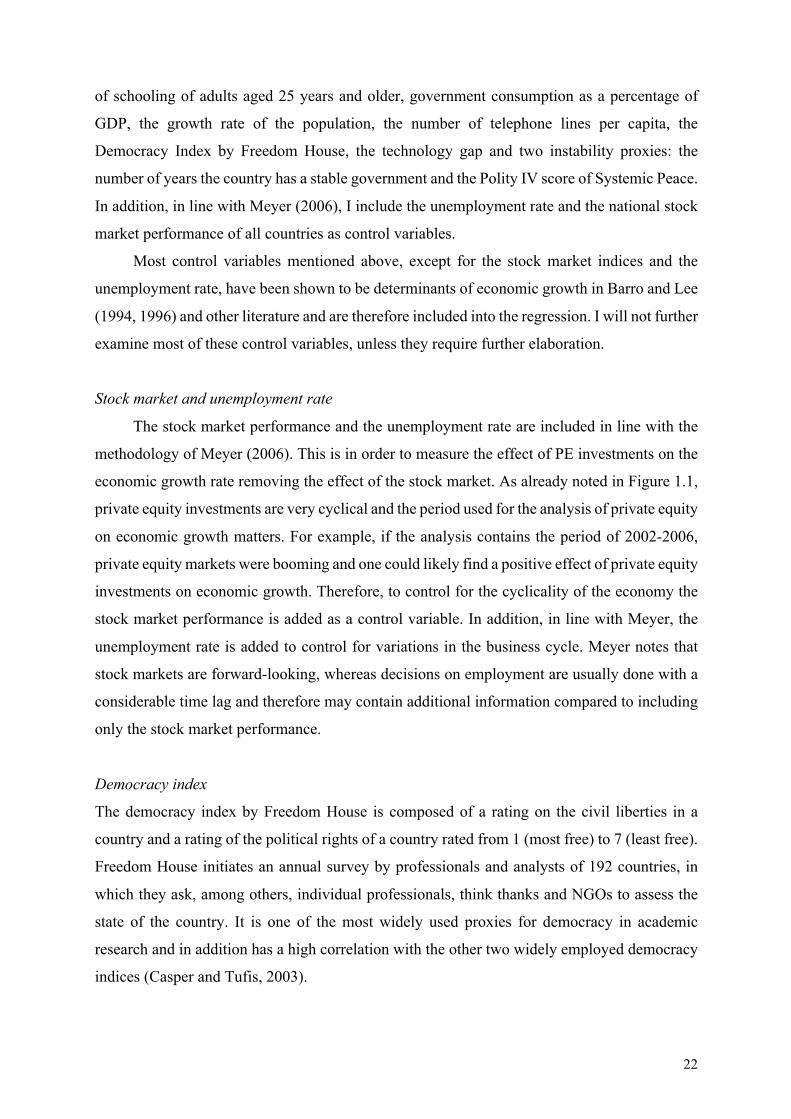
22
of schooling of adults aged 25 years and older, government consumption as a percentage of
GDP, the growth rate of the population, the number of telephone lines per capita, the
Democracy Index by Freedom House, the technology gap and two instability proxies: the
number of years the country has a stable government and the Polity IV score of Systemic Peace.
In addition, in line with Meyer (2006), I include the unemployment rate and the national stock
market performance of all countries as control variables.
Most control variables mentioned above, except for the stock market indices and the
unemployment rate, have been shown to be determinants of economic growth in Barro and Lee
(1994, 1996) and other literature and are therefore included into the regression. I will not further
examine most of these control variables, unless they require further elaboration.
Stock market and unemployment rate
The stock market performance and the unemployment rate are included in line with the
methodology of Meyer (2006). This is in order to measure the effect of PE investments on the
economic growth rate removing the effect of the stock market. As already noted in Figure 1.1,
private equity investments are very cyclical and the period used for the analysis of private equity
on economic growth matters. For example, if the analysis contains the period of 2002-2006,
private equity markets were booming and one could likely find a positive effect of private equity
investments on economic growth. Therefore, to control for the cyclicality of the economy the
stock market performance is added as a control variable. In addition, in line with Meyer, the
unemployment rate is added to control for variations in the business cycle. Meyer notes that
stock markets are forward-looking, whereas decisions on employment are usually done with a
considerable time lag and therefore may contain additional information compared to including
only the stock market performance.
Democracy index
The democracy index by Freedom House is composed of a rating on the civil liberties in a
country and a rating of the political rights of a country rated from 1 (most free) to 7 (least free).
Freedom House initiates an annual survey by professionals and analysts of 192 countries, in
which they ask, among others, individual professionals, think thanks and NGOs to assess the
state of the country. It is one of the most widely used proxies for democracy in academic
research and in addition has a high correlation with the other two widely employed democracy
indices (Casper and Tufis, 2003).

23
Democracy is included as a control variable because Barro and Lee (1994) include civil
liberties and political freedom as separate control variables and find that more liberty is bad for
growth and more freedom is good for growth. In addition, Barro (1997) finds a significant non-
linear relationship between democracy and economic growth. When a country has low civil
rights, an increase in these civil rights leads to an increase in the economic development up to
a certain point. After a certain point, an increase in democracy reduces economic growth. A
possible interpretation could be that extreme dictatorships limit economic growth, but once a
country has a certain level of political rights an increase in democracy hampers growth due to
concerns about income redistributions and social programs (Barro, 1997).
Technology gap
In line with Li and Liu (2005), the technology gap is introduced as a control variable because
it has been shown to be an important determinant of economic growth. The technology gap is
defined as follows:
8%:FD =GH6+D − GFD
GFD (3.2)
where GH6+D is the real GDP per capita in the United States at time t and GFD is the real GDP
per capita in country j at time t. By using the technology gap and the number of years of
secondary schooling, I estimate an endogenous growth model in line with Li and Liu (2005).
In their paper, they find a negative and significant effect of the technology gap on economic
growth. This result indicates that a larger technology gap hampers economic growth of the
country receiving the foreign direct investment.
Instability
Proxies of the instability of countries have been included in growth regressions for a long time.
Barro and Lee (1994) find a negative impact of political instability on economic growth, using
different measures for political instability. In their sample, they use the number of revolutions,
the number of wars and wartime to proxy instability. However, because there have been no
wars and revolutions in the countries of my sample, I will use different proxies in line with the
previous literature. Barro (1997) uses the Rule-of-Law index as a proxy for political instability,
but this index is not freely available.
24
In my sample, I use the number of years a country has a stable government and the Polity
IV score of Systemic Peace as control variables in line with other literature (Casper and Tufis,
2003; Rodrik and Wacziarg, 2005). Furthermore, Adams and Klobodu (2016) directly examine
the impact of regime durability on economic growth in 33 Sub-Saharan African countries and
find a negative and significant relationship. The Polity IV index is a widely used proxy for
political instability and used in different papers as well (Casper and Tufis, 2003; Goldstone et
al., 2010). The Polity IV score is computed by subtracting the Autocracy score from the
Democracy score. The resulting unified polity scale ranges from +10 (strongly democratic) to
-10 (strongly autocratic). The Autocracy score measures the autocracy of a country using
different indicators in an 11-point scale (0-10) and the Democracy score measures the
democracy of a country using different indicators in an 11-point scale (0-10). For more
information about the methodology of these indices, I refer you to Appendix A and the
accompanying website of Systemic Peace10.
For the regression on the growth rate of PE investments to look for reverse causality, I
will include the following control variables in line with Bernoth et al. (2010) and Meyer (2006):
the equity market capitalization as a percentage of GDP, commercial bank lending as a
percentage of GDP, the inflation rate, the strength of labor unions, the unit labor costs, the
corporate tax rate, the performance of national stock market indices, the exit channel and R&D
expenditures. These are all variables that have been shown to affect PE investments in the paper
by Bernoth et al. (2010) and are therefore included as control variables in the regression.
Missing values in the control variables have been filled up by making use of linear interpolation
and extrapolation if possible. This is the case for the variables R&D expenditures, unit labor
costs and union labor strength. All three control variables show a clear linear trend in the data,
so that missing values could be replaced. Missing values for the exit channel, stock market
performance and equity market capitalization cannot be replaced due to the volatile nature of
these variables. I will elaborate on some control variables in this regression below. For more
information about the control variables I refer you to the paper by Bernoth et al. and Appendix
A.
Commercial bank lending
Commercial bank lending is defined as the amount of domestic credit given by banks to the
private sector as a percentage of the (real) GDP and has been found to be a significant
10 http://www.systemicpeace.org

25
determinant of PE investments in Europe by Bernoth et al. (2010). Their results indicate that
PE investments are significantly positively affected by a higher rate of commercial bank
lending. Furthermore, they find that this result is more pronounced in CEE countries than in
Western European countries, although the result is significant for both subsamples. The
intuition behind this result is that when PE firms have more access to debt financing, which is
proxied by a higher rate of commercial bank lending, they are more likely to pursue investments
because PE firms often use significant amounts of debt in their transactions.
Corporate tax rate
The corporate tax rate is defined as the basic central government income tax rate. Gompers and
Lerner (1998) find that corporate tax incentives play a significant role for the amount of PE
investments. Their results indicate that a higher corporate tax rate significantly decreases the
amount of venture capital investments. This result is intuitive as PE firms are less willing to
invest in countries if they have to pay more taxes. This result is confirmed by Bernoth et al.
(2010) in CEE countries, but they find an insignificant result for Western European countries.
This result implies that Eastern European countries can attract more PE investments by
lowering their corporate income taxes.
R&D expenditures
The current literature has found a positive and significant effect of research and development
(R&D) expenditures on the amount of PE investments (Bonini and Alkan, 2012; Gompers and
Lerner, 1998). The intuition is as follows. According to Gompers and Lerner, increases in the
R&D expenditures and the level of the stock market often imply a growing economy. Growing
economies present more opportunities to start a new business, which increases the demand for
venture capitalists. This could, in return, increase the level of commitments to PE funds. Since
data on R&D expenditures are missing from 1989-1995 for virtually every country, the data for
these countries has been obtained by making use of a linear extrapolation of the data. Linear
extrapolation could be used because the R&D expenditures followed a linear trend from 1996-
2014.
Exit channel
The exit channel is in line with Meyer (2006) and defined as follows:
I+->/=ℎ6JJ57 =K:L/0-M5N>H5J>ND:I/-JM5N>H5J>ND(O
(3.3)
26
where IPO divestments is the amount of divestments of private equity firms through an initial
public offering (IPO) at time t. The ability to exit the investment opportunity within 3 to 5 years
is an important determinant to invest or not for a PE firm (Caselli, 2010). If a PE firm is unable
to exit an investment within a short period of time, the firm is less likely to invest. This implies
that a higher exit channel is associated with higher PE investments. The exit within 3 years is
chosen here because of data availability. A longer time period for the exit of 4 or 5 years would
significantly reduce the sample on divestments.
3.2 Methodology This section presents the empirical methodology. In line with Li and Liu (2005) and Frontier
Economics (2013), I will estimate an endogenous growth model with innovation as the most
important determinant of economic growth, as outlined in the theoretical framework. For this
examination, I will perform the following basic LSDVM regression:
889:FD = P3 + P':IFD + PRSFD + TFD (3.4)
where 889:FD is the growth rate of the real GDP in country j at time t; :IFD is private equity
investments in country j at time t as a percentage of the real GDP and SFD is a matrix of control
variables which have been shown to affect the GDP growth rate in line with Barro and Lee
(1994, 1996) and Meyer (2006). These control variables are described in the Data section. Since
this is a panel data study of 21 European countries, I expect there to be omitted variables that
vary per country but not over time. Therefore, this regression will be estimated using cross-
section fixed effects, to control for omitted variable bias. Appendix B shows the correlation
matrix of the independent variable PE and the control variables. The table shows that there is
no multicollinearity among these variables in equation 3.4.
Obstfeld (2009) notes that the major ambiguity in the finance-growth literature is
whether financial development causes growth or is caused by growth, though much of the
literature finds evidence for the first effect. To examine whether reverse causality is an issue
for this paper, I will use the approach of Meyer (2006) and Li and Liu (2005). That is, I examine
first if real economic growth affects PE investments after accounting for certain control
variables using the following basic OLS regression:
:IFD = P3 + P'889:FD + PRUFD + TFD (3.5)
27
where :IFD is PE investments in country j at time t as a percentage of real GDP; 889:FD is the
growth rate of the real GDP in country j at time t and UFD is a matrix of control variables. These
control variables are in line with Meyer (2006) and Bernoth et al. (2010) and include, among
others, the national stock market performance, the exit channel (initial public offering
divestments/PE investments three years before) and general expenditures of a country to R&D
expenses. Again, since this is a panel data study of 21 European countries, I expect there to be
omitted variables that vary per country but not over time. Therefore, this regression will be
estimated using cross-section fixed effects to control for omitted variable bias. Appendix C
shows the correlation matrix of the independent variable GGDP and the control variables. The
table shows that there is no multicollinearity among these variables in equation 3.5.
In addition, I will perform a second test to determine whether there is an endogenous
relationship between PE investments and economic growth by performing the Durbin-Wu-
Hausman test (augmented regression test) in line with Davidson and MacKinnon (1993) and Li
and Liu (2005). This procedure works as follows. Suppose that there are two single equations
of the following form:
V = 63 + 6'+' + 6R+R + W' ; X = Y3 + Y'V + YR+O + WR (3.6)
To perform the augmented regression, I first need to obtain the residuals (res_z) of each
endogenous right-hand side variable by estimating the following reduced form regression:
V = =3 + ='+' + =R+R + =O+O + WO (3.7)
Then, the following augmented regression is performed including the residuals of z:
X = 03 + 0'V + 0R+O + 0OV_<5N + W[ (3.8)
If we find that the coefficient for 0O is significantly different from zero using an F-test, the OLS
estimates are not consistent and endogeneity is indicated.
If the two tests indicate endogeneity, I will attempt to control for this using the approach
of Li and Liu (2005). That is, I will use a two-stage least-squares (2SLS) procedure with
instrumental variables. While it is acknowledged that there are no perfect instrumental variables
available (Strömberg, 2009), other attempts to control for endogeneity are not free of problems
either. For example, the research done by Nair-Reichert and Weinhold (2001) using the MFR

28
estimator may suffer from spurious causality due to the omission of relevant variables (Li and
Liu, 2005). This is the case for other studies using Granger causality tests as well, which could
lead to wrong inferences of the way in which the causality flows (Caporale and Pittis, 1997).
The instrumental variables to instrument PE investments to control for possible
endogeneity will be in line with Li and Liu (2005), Campos and Kinoshita (2002) and
Borensztein et al. (1998). To date, there have been no empirical studies that directly examine
the effect of PE investments on economic growth whilst controlling for endogeneity. Therefore,
there are no (perfect) instrumental variables. All the variables on the right-hand side of the
reduced form in equation 3.7 will be tested to use as instrumental variables. For example,
(lagged values of) the real GDP growth rate, gross domestic investments, the number of
telephone lines and all other control variables mentioned above in the Data section.
Furthermore, I test venture capital investments and buyout investments as an instrument for
private equity investments because it has been shown in the literature that venture capital
investments are not affected by the real GDP growth rate (Meyer, 2006). Lastly, I test the
financial assets held by domestic autonomous pension funds and insurance corporations as a
percentage of GDP as an instrumental variable (Bernstein et al., 2010).
Before proceeding to the empirical results, I need to ensure that all the variables in the
panel data set are stationary. This is needed to ensure that the provided regressions are not
spurious. In line with Li and Liu (2005), I use the panel unit root test by Levin et al. (2002).
The null hypothesis of this test is that the variable in question contains a unit root. The results
are depicted in Table 3.2 and show that all the variables, except for the regime durability, are
stationary. The nonstationarity of the regime durability variable lies in the nature of the variable.
Once a regime changes, the regime durability starts from 0 again and consequently moves back
to where it started in terms of the number of years of the new regime. Because all other variables
are stationary, the regression results are therefore reliable and not spurious.

29
Table 3.2: Unit root tests for the key variables The panel Levin-Lin-Chu unit root test with a null hypothesis that the variable in question contains a unit root is performed on all key variables below. Lag length is chosen automatically according to the Schwarz Information Criterion (SIC). All tests are done with an intercept, unless specified otherwise.
Variable Levin et al.
t-statistic p-value
Observations
included
GGDP -9.377 0.000*** 492
PE -2.348 0.009*** 464
GDP initial N/A N/A N/A
GDI -4.516 0.000*** 505
SCH -31.479 0.000*** 448
GPOP -3.139 0.001*** 488
OPEN^ -2.973 0.002*** 514
GFCE -2.273 0.012** 515
Telephone lines -3.172 0.001*** 511
Democracy -3.883 0.000*** 279
Technology gap -1.960 0.025** 498
Regime durability 0.188 0.574 25
Polity IV score -16.727 0.000*** 120
Stock market -16.926 0.000*** 461
Unemployment rate -4.043 0.000*** 483
Notes: (1) ^ with intercept and trend. *significant at 10%; **significant at 5%; ***significant at 1%
30
4. Empirical Results
This section first presents the results on the single equations and then tests for endogeneity
issues. The next section addresses the endogeneity issues using two-stage least squares
regressions and in the last subsection I provide robustness checks.
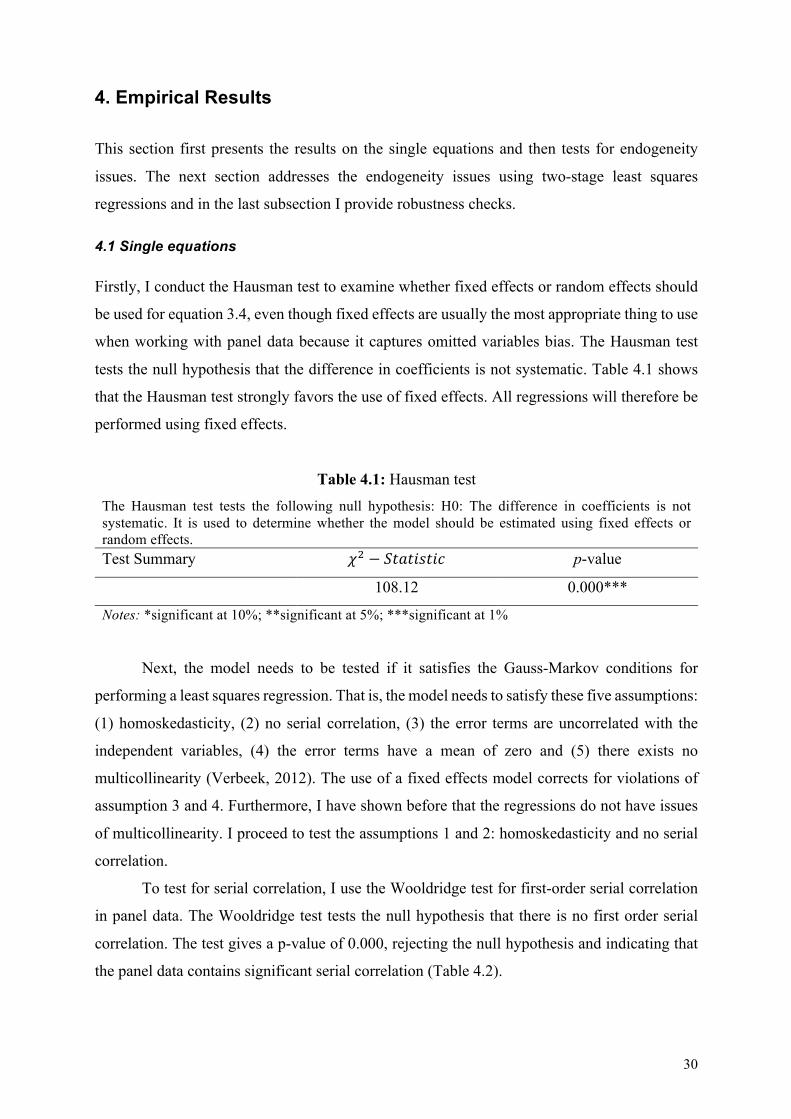
4.1 Single equations Firstly, I conduct the Hausman test to examine whether fixed effects or random effects should
be used for equation 3.4, even though fixed effects are usually the most appropriate thing to use
when working with panel data because it captures omitted variables bias. The Hausman test
tests the null hypothesis that the difference in coefficients is not systematic. Table 4.1 shows
that the Hausman test strongly favors the use of fixed effects. All regressions will therefore be
performed using fixed effects.
Table 4.1: Hausman test The Hausman test tests the following null hypothesis: H0: The difference in coefficients is not systematic. It is used to determine whether the model should be estimated using fixed effects or random effects. Test Summary UR − \>6>-N>-= p-value
108.12 0.000***
Notes: *significant at 10%; **significant at 5%; ***significant at 1%
Next, the model needs to be tested if it satisfies the Gauss-Markov conditions for
performing a least squares regression. That is, the model needs to satisfy these five assumptions:
(1) homoskedasticity, (2) no serial correlation, (3) the error terms are uncorrelated with the
independent variables, (4) the error terms have a mean of zero and (5) there exists no
multicollinearity (Verbeek, 2012). The use of a fixed effects model corrects for violations of
assumption 3 and 4. Furthermore, I have shown before that the regressions do not have issues
of multicollinearity. I proceed to test the assumptions 1 and 2: homoskedasticity and no serial
correlation.
To test for serial correlation, I use the Wooldridge test for first-order serial correlation
in panel data. The Wooldridge test tests the null hypothesis that there is no first order serial
correlation. The test gives a p-value of 0.000, rejecting the null hypothesis and indicating that
the panel data contains significant serial correlation (Table 4.2).
31
Table 4.2: Wooldridge test The Wooldridge test tests the following null hypothesis: H0: No first-order autocorrelation. Test Summary F-statistic p-value
286.339 0.000***
Notes: *significant at 10%; **significant at 5%; ***significant at 1%
Secondly, I perform a modified Wald test for groupwise heteroskedasticity in a fixed
effects regression model. This test tests the null hypothesis of homoskedasticity. Table 4.3
indicates the presence of significant heteroskedasticity.
Table 4.3: Modified Wald test
The modified Wald test tests the following null hypothesis: H0: Homoskedasticity. Test Summary UR − \>6>-N>-= p-value
194.35 0.000***
Notes: *significant at 10%; **significant at 5%; ***significant at 1%
Thus, before I estimate equation 3.4, I need to correct for both serial correlation and
heteroskedasticity. To overcome this problem, I use the method of Hoechle (2007) which
corrects for heteroskedasticity and serial correlation in panel data using Driscoll and Kraay
(1998) standard errors while allowing to use fixed effects. Further, I will use country fixed-
effects to capture structural differences between countries as indicated by the DWH test.
The results for equation 3.4 are depicted in Table 4.4. Note that due to the use of fixed
effects, an important explanatory variable needs to be removed from the equations, GDP initial
per capita. The robustness section will further elaborate on this issue. Regression 4.1 shows the
basic regression with the core variables that influence GDP growth in the literature. Not all core
variables have the expected signs. Specifically, the number of years of secondary schooling
significantly negatively affects the economic growth rate which is not consistent with the
empirical literature. More interesting is the fact that regression 4.1 shows a significant and
positive effect of private equity investments on economic growth after controlling for the core
variables that affect economic growth. A 1% increase in private equity investments raises
economic growth by approximately 2%. Specifications 4.2 and 4.3 include control variables for
the infrastructure and stability of a country. The results are similar to regression 4.1 and show
a positive and significant effect of private equity investments on economic growth, whilst the
added control variables are insignificant. Regression 4.4 is the only specification in which
private equity investments do not significantly affect economic growth, although the sign is still

32
positive and the coefficient is only barely insignificant at the 10% level. This regression
includes the technology gap and results in a positive and significant effect on economic growth.
This implies that a higher technology gap increases economic growth.
Regressions 4.5 until 4.7 all show the same picture. Private equity investments continue
to have a positive and significant effect on economic growth whilst including political stability
control variables and the unemployment rate and stock market performance. Of these control
variables, only regime durability enters the regressions significantly. Specifically, a higher
stable regime duration significantly decreases economic growth at the 5% significance level.
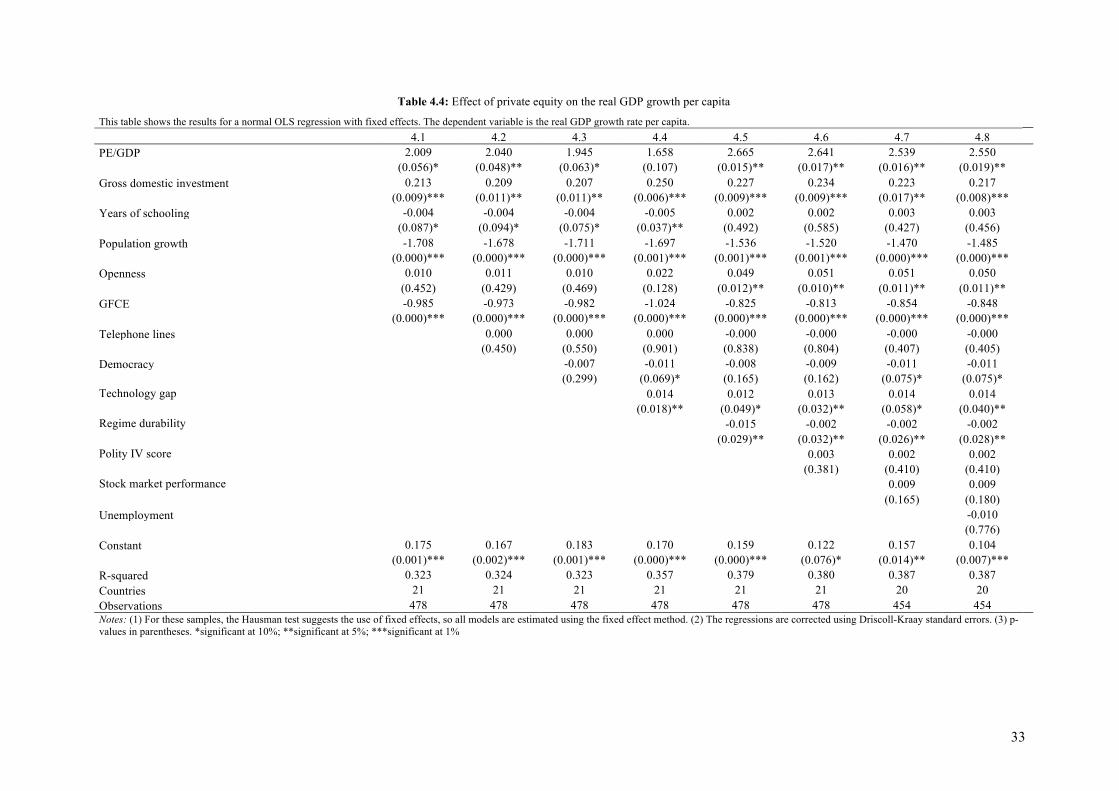
33
Table 4.4: Effect of private equity on the real GDP growth per capita
This table shows the results for a normal OLS regression with fixed effects. The dependent variable is the real GDP growth rate per capita. 4.1 4.2 4.3 4.4 4.5 4.6 4.7 4.8
PE/GDP 2.009 2.040 1.945 1.658 2.665 2.641 2.539 2.550 (0.056)* (0.048)** (0.063)* (0.107) (0.015)** (0.017)** (0.016)** (0.019)** Gross domestic investment 0.213 0.209 0.207 0.250 0.227 0.234 0.223 0.217 (0.009)*** (0.011)** (0.011)** (0.006)*** (0.009)*** (0.009)*** (0.017)** (0.008)*** Years of schooling -0.004 -0.004 -0.004 -0.005 0.002 0.002 0.003 0.003 (0.087)* (0.094)* (0.075)* (0.037)** (0.492) (0.585) (0.427) (0.456) Population growth -1.708 -1.678 -1.711 -1.697 -1.536 -1.520 -1.470 -1.485 (0.000)*** (0.000)*** (0.000)*** (0.001)*** (0.001)*** (0.001)*** (0.000)*** (0.000)*** Openness 0.010 0.011 0.010 0.022 0.049 0.051 0.051 0.050 (0.452) (0.429) (0.469) (0.128) (0.012)** (0.010)** (0.011)** (0.011)** GFCE -0.985 -0.973 -0.982 -1.024 -0.825 -0.813 -0.854 -0.848 (0.000)*** (0.000)*** (0.000)*** (0.000)*** (0.000)*** (0.000)*** (0.000)*** (0.000)*** Telephone lines 0.000 0.000 0.000 -0.000 -0.000 -0.000 -0.000 (0.450) (0.550) (0.901) (0.838) (0.804) (0.407) (0.405) Democracy -0.007 -0.011 -0.008 -0.009 -0.011 -0.011 (0.299) (0.069)* (0.165) (0.162) (0.075)* (0.075)* Technology gap 0.014 0.012 0.013 0.014 0.014 (0.018)** (0.049)* (0.032)** (0.058)* (0.040)** Regime durability -0.015 -0.002 -0.002 -0.002 (0.029)** (0.032)** (0.026)** (0.028)** Polity IV score 0.003 0.002 0.002 (0.381) (0.410) (0.410) Stock market performance 0.009 0.009 (0.165) (0.180) Unemployment -0.010 (0.776) Constant 0.175 0.167 0.183 0.170 0.159 0.122 0.157 0.104 (0.001)*** (0.002)*** (0.001)*** (0.000)*** (0.000)*** (0.076)* (0.014)** (0.007)*** R-squared 0.323 0.324 0.323 0.357 0.379 0.380 0.387 0.387 Countries 21 21 21 21 21 21 20 20 Observations 478 478 478 478 478 478 454 454 Notes: (1) For these samples, the Hausman test suggests the use of fixed effects, so all models are estimated using the fixed effect method. (2) The regressions are corrected using Driscoll-Kraay standard errors. (3) p-values in parentheses. *significant at 10%; **significant at 5%; ***significant at 1%
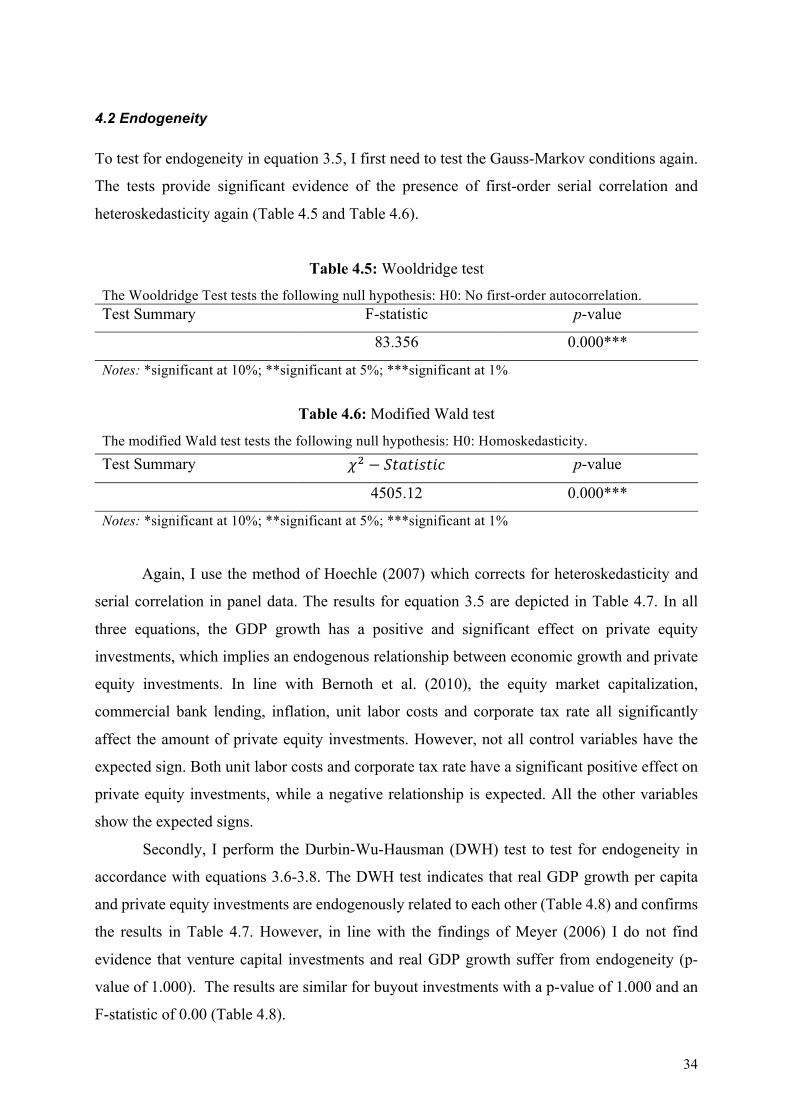
34
4.2 Endogeneity To test for endogeneity in equation 3.5, I first need to test the Gauss-Markov conditions again.
The tests provide significant evidence of the presence of first-order serial correlation and
heteroskedasticity again (Table 4.5 and Table 4.6).
Table 4.5: Wooldridge test The Wooldridge Test tests the following null hypothesis: H0: No first-order autocorrelation. Test Summary F-statistic p-value
83.356 0.000***
Notes: *significant at 10%; **significant at 5%; ***significant at 1%
Table 4.6: Modified Wald test
The modified Wald test tests the following null hypothesis: H0: Homoskedasticity. Test Summary !" − $%&%'(%') p-value
4505.12 0.000***
Notes: *significant at 10%; **significant at 5%; ***significant at 1%
Again, I use the method of Hoechle (2007) which corrects for heteroskedasticity and
serial correlation in panel data. The results for equation 3.5 are depicted in Table 4.7. In all
three equations, the GDP growth has a positive and significant effect on private equity
investments, which implies an endogenous relationship between economic growth and private
equity investments. In line with Bernoth et al. (2010), the equity market capitalization,
commercial bank lending, inflation, unit labor costs and corporate tax rate all significantly
affect the amount of private equity investments. However, not all control variables have the
expected sign. Both unit labor costs and corporate tax rate have a significant positive effect on
private equity investments, while a negative relationship is expected. All the other variables
show the expected signs.
Secondly, I perform the Durbin-Wu-Hausman (DWH) test to test for endogeneity in
accordance with equations 3.6-3.8. The DWH test indicates that real GDP growth per capita
and private equity investments are endogenously related to each other (Table 4.8) and confirms
the results in Table 4.7. However, in line with the findings of Meyer (2006) I do not find
evidence that venture capital investments and real GDP growth suffer from endogeneity (p-
value of 1.000). The results are similar for buyout investments with a p-value of 1.000 and an
F-statistic of 0.00 (Table 4.8).

35
Table 4.7: Effect of economic growth on private equity This table shows the results for a normal OLS regression with country-specific fixed effects. The dependent variable is the private equity investments. 4.9 4.10 4.11 Real GDP growth per capita 0.010 0.010 0.010 (0.001)*** (0.001)*** (0.001)*** Market capitalization 0.001 0.001 0.001 (0.004)*** (0.002)*** (0.003)*** Commercial bank lending 0.001 0.001 0.001 (0.006)*** (0.007)*** (0.007)*** Inflation 0.014 0.015 0.013 (0.000)*** (0.000)*** (0.001)*** Unit labor costs 0.000 0.000 0.000 (0.000)*** (0.000)*** (0.000)*** Corporate tax rate 0.002 0.002 0.002 (0.022)** (0.056)* (0.039)** R&D expenditure -0.011 -0.008 -0.010 (0.681) (0.772) (0.717) Exit channel -0.000 -0.000 (0.147) (0.142) Stock market performance -0.000 (0.130) Constant -0.005 -0.005 -0.005 (0.000)*** (0.000)*** (0.000)*** R-squared 0.330 0.336 0.339 Countries 20 20 20 Observations 407 393 392 Notes: *significant at 10%; **significant at 5%; ***significant at 1%
Table 4.8: Durbin-Wu-Hausman test This Wald test tests the following null hypothesis: H0: Residuals are equal to zero. Test Summary F-statistic p-value
Residuals PE investments 8.94 0.008***
Residuals VC investments 0.00 1.000
Residuals BUY investments 0.00 1.000
Notes: *significant at 10%; **significant at 5%; ***significant at 1%
36
4.3 Two-stage least squares Since the literature of private equity on economic growth is limited, there exists no perfect
instrumental variable to instrument private equity investments. Li and Liu (2005) in their study
on FDI suggest the use of all right-hand side variables of the reduced form (equation 3.7) as
instrumental variables. This implies the use of all control variables of equation 3.4 and 3.5 as
instrumental variables. In Table 4.7, I find that the following variables have a significant effect
on PE investments: real GDP growth rate, market capitalization, commercial bank lending,
inflation, unit labor costs and finally the corporate tax rate. Therefore, these variables are
initially tested as instrumental variables including lagged variables of PE in line with the FDI
literature (Borensztein et al., 1998). Furthermore, I test venture capital investments as an
instrument for private equity investments because it has been shown in the literature that venture
capital investments are not affected by the real GDP growth rate (Meyer, 2006). I come to the
same conclusion that venture capital investments (and buyout investments) and the real GDP
growth rate are not endogenously related in my sample as noted before. Lastly, I test the
financial assets held by domestic autonomous pension funds and insurance corporations as a
percentage of GDP as an instrumental variable. Bernstein et al. (2010) used this as an
instrumental variable for private equity investments, including lagged values of private equity
investments.
To test the validity of these instrumental variables, they need to satisfy two assumptions
in line with Verbeek (2012):
1. Relevance
2. Exogeneity
The relevance assumption states that the instrumental variable should have a significant
effect on private equity investments. I test for this assumption in two ways. First, I regress the
instrumental variables on the private equity investments to see if the variables are correlated.
Second, I test the significance of the excluded instruments in the first-stage regression using an
F-statistic. As a rule of thumb, Stock and Watson (2011) find that an F-statistic larger than 10
in the first-stage regression suggests that the instruments used are strong and vice versa.
The exogeneity assumption states that the instrumental variables are uncorrelated with
the error term. This assumption cannot be tested. In line with Verbeek (2012), I therefore
assume that the instrumental variables are exogenous. A test for overidentifying restrictions, or

37
Hansen’s J-statistic, tests whether all instrumental variables are exogenous after assuming that
at least one of the instruments is already exogenous.
All the proposed instruments above have a significant effect on private equity
investments. Furthermore, these instrumental variables provide an F-statistic in the first-stage
regression of 21.31, which is above the rule of thumb by Stock and Watson (2011). However,
the Hansen-J statistic of overidentification presents that the instruments are overidentified (p-
value of 0.001 and J-statistic of 22.432). Therefore, instrumental variables are removed to
satisfy the test of overidentification. The resulting instrumental variables are venture capital
investments and buyout investments, both of which have been found not to be affected by
endogeneity issues before (Table 4.8). When using lagged variables of PE, a common
instrumental variable in the economic growth literature, all combinations of instrumental
variables indicate overidentification. Therefore, lagged variables of PE are not used as
instrumental variables.
The F-statistic of the first-stage regression is 6912.26, which is well above the rule of
thumb of 10 by Stock and Watson (2011), implying strong and valid instruments. Furthermore,
the Hansen J-statistic states that I cannot reject the null hypothesis, supporting the validity of
my instruments (p-value of 0.590 and J-statistic of 0.290). Therefore, I have confirmed that
these two instruments are valid and will be used throughout the paper.
The 2SLS regression is performed using HAC standard errors that are robust to
heteroskedasticity and serial correlation whilst using fixed effects. The results are shown in
Table 4.9. Again, regression 4.12 shows the basic regression with the core variables that
influence GDP growth in the economic growth literature. Because of the high correlation
between private equity investments and venture capital investments (61.25%) and buyout
investments (97.61%), the results are in line with the single equations. Again the number of
years of secondary schooling shows the unexpected negative sign, although the result is only
significant in specifications 4.14 and 4.15. Nonetheless, this result is in line with Li and Liu
(2005), finding the same unexpected outcome.
The most interesting result is the positive and significant effect of private equity
investments on the economic growth in all equations. In fact, an increase in private equity
investments as a percentage of GDP of 1% increases economic growth by 1.9% to 2.8%,
depending on the specification. This finding is significant at the 1% significance level in all
specifications. This result confirms the findings of the single equations and shows that the
findings of the single equations are robust to endogeneity issues.

38
Furthermore, more openness to trade still positively affects economic growth in line
with the single equations in specifications 4.16 to 4.19. In line with the previous literature,
government consumption also negatively and significantly affects economic growth in all
specifications. The results on the technology gap and regime durability remain highly
significant in all specifications as well, with their respective unexpected signs. That is, a higher
technology gap increases economic growth and a higher level of regime duration decreases
economic growth. An interesting result arises from the stock market performance. There exists
a positive and significant effect of the stock market on economic growth in both regression 4.18
and 4.19, unlike the single regressions estimated before. This result is in line with Meyer (2006).
Nonetheless, the unemployment rate, the Polity IV score and the number of telephone lines per
capita never enter the regressions significantly.
4.4 Robustness checks To further examine the relationship between private equity investments and real GDP growth,
I have estimated several different specifications to test the general robustness of my results.
Firstly, the definitions above of PE and real GDP growth assume that increases in
private equity investments in one year lead to increases in real GDP growth in that same year,
i.e. it investigates a relationship over the short-run. To investigate whether private equity
investments have a long-run effect on real GDP growth as well, I include lagged variables of
private equity investments as a robustness check in line with the methodology of Görg and
Strobl (2002). That is, I include lagged variables of private equity investment as explanatory
variables.
Secondly, due to the use of fixed effects the initial real GDP per capita had to be dropped
in all of the previous regressions. Nonetheless, the initial real GDP per capita has been shown
to have a strong effect on real GDP growth in previous literature. Including the initial real GDP
per capita takes into account the fact that some countries are (initially) richer than others, which
explains their subsequent growth pattern. Therefore, I include the initial real GDP per capita to
examine whether this affects the outcomes. The results are shown in Table 4.10 and corrected
for heteroskedasticity and serial correlation in accordance with the previous methodology.
Regressions 4.20-4.22 indicate the results using pooled OLS whilst using fixed effects
including lagged variables of PE investments up until the third lag. The results show that all
three lagged variables of PE investments are highly statistically insignificant, which suggests
that there is no long-run positive effect of private equity investments on the real GDP growth
rate. However, these results are not controlled for the observed reverse causality. Therefore,

39
regressions 4.23-4.25 indicate the results using two-stage least squares whilst using the same
instrumental variables as before. The results indicate a strong statistically significant and
positive sign of private equity investments on real GDP growth, indicating that private equity
investments have a positive long-run effect on real GDP growth. These findings support my
earlier results.
Finally, regressions 4.26 and 4.27 indicate the results including the initial real GDP per
capita as control variables to see if the results change. The results suggest that the effect of
private equity investments on real GDP growth remain more or less unchanged, indicating a
strong positive effect of private equity investments on real GDP growth, even after controlling
for endogeneity.

40
Table 4.9: Effect of private equity on the real GDP growth per capita This table shows the results for the two-stage least squares (2SLS) regressions with fixed effects and HAC standard errors. The dependent variable is the real GDP growth rate per capita.
4.12 4.13 4.14 4.15 4.16 4.17 4.18 4.19 PE/GDP 2.285 2.307 2.210 1.869 2.814 2.776 2.633 2.573 (0.001)*** (0.000)*** (0.001)*** (0.005)*** (0.000)*** (0.000)*** (0.000)*** (0.001)*** Gross domestic investment 0.211 0.205 0.205 0.248 0.226 0.233 0.222 0.213 (0.002)*** (0.002)*** (0.002)*** (0.000)*** (0.001)*** (0.001)*** (0.003)*** (0.018)** Years of schooling -0.004 -0.004 -0.005 -0.005 0.002 0.002 0.003 0.003 (0.101) (0.106) (0.071)* (0.038)** (0.445) (0.532) (0.326) (0.352) Population growth -1.714 -1.683 -1.715 -1.699 -1.536 -1.520 -1.470 -1.477 (0.000)*** (0.000)*** (0.000)*** (0.000)*** (0.000)*** (0.000)*** (0.000)*** (0.000)*** Openness 0.010 0.011 0.010 0.022 0.049 0.051 0.051 0.051 (0.469) (0.460) (0.506) (0.181) (0.006)*** (0.007)*** (0.007)*** (0.007)*** GFCE -0.984 -0.972 -0.981 -1.023 -0.822 -0.810 -0.853 -0.851 (0.000)*** (0.000)*** (0.000)*** (0.000)*** (0.000)*** (0.000)*** (0.000)*** (0.000)*** Telephone lines 0.000 0.000 0.000 -0.000 -0.000 -0.000 -0.000 (0.505) (0.636) (0.916) (0.878) (0.854) (0.527) (0.525) Democracy -0.007 -0.011 -0.008 -0.009 -0.011 -0.011 (0.276) (0.073)* (0.196) (0.178) (0.058)* (0.059)* Technology gap 0.014 0.012 0.013 0.014 0.015 (0.000)*** (0.003)*** (0.003)*** (0.011)** (0.012)** Regime durability -0.002 -0.002 -0.002 -0.002 (0.000)*** (0.000)*** (0.000)*** (0.000)*** Polity IV score 0.003 0.002 0.002 (0.462) (0.561) (0.565) Stock market performance 0.009 0.009 (0.016)** (0.014)** Unemployment -0.013 (0.840) Countries 21 21 21 21 21 21 20 20 Observations 478 478 478 472 472 472 454 454 Notes: (1) For these samples, the Hausman test suggests the use of fixed effects, so all models are estimated using the fixed effect method. (2) The regressions are corrected using HAC standard errors. (3) p-values in parentheses. (4) Instruments used are venture capital investments and buyout investments. (5) The constant is not reported because it is not estimated in a 2SLS model with fixed effects. (6) R-squared is not reported because it does not provide any information in 2SLS. *significant at 10%; **significant at 5%; ***significant at 1%

41
Table 4.10: Effect of private equity on the real GDP growth per capita This table shows the results for the robustness checks including lagged independent variables and the initial real GDP as control variable. The dependent variable is the real GDP growth rate per capita.
4.20 OLS
4.21 OLS
4.22 OLS
4.23 2SLS
4.24 2SLS
4.25 2SLS
4.26 OLS
4.27 2SLS
PE/GDP 3.580 3.912 (0.009)*** (0.000)*** PE/GDP (-1) -0.431 4.261 (0.726) (0.001)*** PE/GDP (-2) -1.082 6.239 (0.249) (0.003)*** PE/GDP (-3) 0.256 7.846 (0.785) (0.028)** GDP initial 0.000 0.000 (0.404) (0.338) Gross domestic investment 0.178 0.231 0.314 0.209 0.264 0.334 0.059 0.061 (0.060)* (0.009)*** (0.000)*** (0.030)** (0.008)*** (0.001)*** (0.482) (0.442) Years of schooling 0.003 0.003 0.004 0.003 0.003 0.003 -0.005 -0.006 (0.500) (0.425) (0.241) (0.375) (0.349) (0.368) (0.010)*** (0.013)** Population growth -1.48 -1.565 -1.901 -1.502 -1.712 -2.189 -0.635 -0.657 (0.000)*** (0.000)*** (0.000)*** (0.000)*** (0.000)*** (0.000)*** (0.093)* (0.080)* Openness 0.046 0.048 0.053 0.056 0.069 0.075 0.021 0.022 (0.020)** (0.011)** (0.004)*** (0.003)*** (0.001)*** (0.002)*** (0.001)*** (0.002)*** GFCE -0.908 -0.892 -0.830 -0.869 -0.926 -0.911 -0.279 -0.286 (0.000)*** (0.000)*** (0.000)*** (0.000)*** (0.000)*** (0.000)*** (0.009)*** (0.000)*** Telephone lines -0.000 -0.000 -0.000 -0.000 -0.000 -0.000 0.000 0.000 (0.352) (0.535) (0.375) (0.542) (0.682) (0.502) (0.129) (0.111) Democracy -0.014 -0.012 -0.016 -0.011 -0.008 -0.012 -0.003 -0.003 (0.019)** (0.046)** (0.015)** (0.075)* (0.184) (0.110) (0.571) (0.749) Technology gap 0.020 0.022 0.025 0.015 0.017 0.023 0.001 0.001 (0.022)** (0.020)** (0.005)*** (0.020)** (0.022)** (0.006)*** (0.619) (0.861) Regime durability -0.001 -0.001 -0.002 -0.002 -0.002 -0.003 -0.000 -0.000 (0.052)* (0.091)* (0.022)** (0.000)*** (0.000)*** (0.000)*** (0.006)*** (0.000)*** Polity IV score 0.003 0.003 0.001 0.003 0.002 -0.000 0.003 0.003 (0.220) (0.291) (0.655) (0.468) (0.630) (0.961) (0.140) (0.441) Stock market performance 0.009 0.008 0.007 0.011 0.010 0.006 0.010 0.010 (0.189) (0.213) (0.307) (0.004)*** (0.007)*** (0.119) (0.153) (0.024)** Unemployment -0.076 -0.070 -0.040 -0.000 0.008 -0.009 -0.032 -0.031 (0.097)* (0.112) (0.342) (0.997) (0.910) (0.894) (0.300) (0.402) Constant 0.167 0.144 0.154 0.035 0.036

42
(0.009)*** (0.024)** (0.023)** (0.422) (0.486) R-squared 0.381 0.400 0.429 - - - 0.206 - Countries 20 20 20 20 20 20 20 20 Observations 449 434 417 449 434 417 454 454 Notes: (1) The estimation method is provided below the regression number. (2) Regressions 4.20 to 4.25 are estimated using fixed effects (3) The regressions using OLS are corrected using Driscoll-Kraay standard errors (4) The regressions using 2SLS are corrected using HAC-standard errors. (5) p-values in parentheses. (6) Instruments used are venture capital investments and buyout investments. (7) The constant is not reported for 2SLS because it is not estimated in a 2SLS model with fixed effects. (8) R-squared is not reported for 2SLS because it does not provide any information in 2SLS. *significant at 10%; **significant at 5%; ***significant at 1%

43
5. Discussion of Results
This chapter discusses the results of my analysis and links them to the results of previous
literature on the topic. This thesis investigates the research question: what is the effect of private
equity on the economic growth in Europe? This question is answered using the hypothesis that
private equity has a positive effect on economic growth following the endogenous growth
model and previous literature.
Thus far, the empirical analysis provides strong evidence that private equity promotes
economic growth. Specifically, I find strong evidence that, ceteris paribus, an increase in private
equity investments as a percentage of GDP by 1% increases the real economic growth rate by
approximately 1.9% to 2.8%. This result is in line with my hypothesis and the findings of Meyer
(2006), who finds that an increase in private equity investments by 1% increases real economic
growth by 2% for buyout investments and 3.6% for venture capital investments. Furthermore,
I find that these findings are robust to reverse causality issues using an instrumental variable
approach and different specifications. Specifically, an increase in private equity investments as
a percentage of GDP by 1% increases the real economic growth rate by 4.3% to 7.8% in the
long-run. This implies that my results confirm the general findings of Frontier Economics
(2013) and Meyer (2006). In fact, Meyer does not find evidence that real GDP growth and
private equity investments are endogenously related. This is due to the fact that his research
uses venture capital investments as the dependent variable in the endogeneity regression. My
results also indicate no evidence of reverse causality when using venture capital and buyout
investments as a dependent variable, but this result changes when using total private equity
investments as a dependent variable. Therefore, I have used venture capital investments and
buyout investments as an instrumental variable for private equity investments. A reason for the
discrepancy between my findings and those of Meyer could be the sample used. Meyer uses
data from 1994-2004 and includes a booming period of private equity investments as can be
seen in Figure 1.1. My sample includes the relatively infant years of the European private equity
industry and the recent financial crisis. Furthermore, Meyer makes a distinction between
venture capital investments and buyout investments whereas I use total private equity
investments.
Some other interesting results arise from the control variables. I find no evidence that
higher political instability of a country decreases economic growth. On the contrary, I find that
that a higher stable regime durability as a proxy for political stability decreases economic

44
growth. In addition, I find no significant evidence of the Polity IV score on economic growth.
Most of the literature on economic growth finds a negative and significant effect of political
instability on economic growth (Barro and Lee, 1994; Easterly and Levine, 1997; Fosu, 2001;
Sala-i-Martin, 1997). However, there is some literature that finds no evidence of an effect of
political stability on economic growth. For example, Borensztein et al. (1998) use the number
of assassinations and wars in a country as a proxy for political instability. Although the signs
of the coefficients are in the same direction as the literature mentioned above, the results were
not significant. Similarly, Li and Liu (2005) use the number of riots as a measure of political
instability and also find insignificant results. They also note that previous literature finds strong
evidence of a negative relationship between political instability and economic growth, but that
there is much ambiguity about the real effects of political instability. Part of the reason why I
find no evidence of an effect of political stability on the economic growth is that I use a sample
of predominantly developed countries. This is because information on private equity
investments in developing countries is not available. Other studies mainly use panel data of
countries all over the world. Nonetheless, the effect of the Polity IV score is in line with the
results of Sachs et al. (1995), although they use a different political instability index.
Moreover, the significant effect of the stock market on economic growth is in line with
the expectations, but this result must be taken with caution. A number of mechanisms are at
work. Intuitively, higher stock markets increase the optimism of consumers who consequently
increase their spending on consumer goods. Secondly, in bull markets companies are more
optimistic about the future prospects of their firm. Moreover, borrowing rates are often more
attractive when the economy is booming. As a result, companies invest more in, for example,
employees, machines and other factors that eventually increase GDP because of improved
productivity. But this is not the entire story. In fact, Ritter (2005) finds evidence that the
correlation between long-run equity returns and long-run economic growth is negative. He
states that economic growth occurs through increases in productivity and increased inputs, in
line with the findings by Krugman (1994). However, increases in productivity and inputs do
not necessarily benefit capital owners. In fact, economic growth increases the standard of living
of people, but this does not imply that share prices increase.
My results also indicate a negative effect of the population growth rate on economic
growth. This finding contradicts Barro and Lee (1994) but is in line with Mankiw et al. (1992).
The reasoning of Barro and Lee is that a higher population growth rate indicates that a country
has a high net immigration rate or a lower mortality rate. Both factors contribute to economic
growth. On the other hand, Mankiw et al. state that a higher population growth rate creates a

45
situation in which the available capital of a country must be spread more thinly over more
people. As a result, the total factor productivity of the country decreases, which lowers
economic growth. The empirical findings in this thesis therefore support the findings of Mankiw
et al. and the augmented Solow growth model which predicts this finding.
Another contribution of this paper is that I find a positive and significant effect of the
technology gap on economic growth. This implies that a higher technology gap increases
economic growth. This result contradicts the findings of Li and Liu (2005) who find the
opposite effect of the technology gap. However, my results are in line with Bende-Nabende et
al. (2003) and Sjöholm (1999). Bende-Nabende et al. examine the effect of FDI on output in
the less-developed countries Thailand and the Philippines and the more-developed countries
Japan and Taiwan. They find evidence that, although Thailand and the Philippines are less-
developed, the effect of FDI on output is more pronounced in these countries. This implies that
a larger technology gap between countries increases the productivity spillovers. A similar result
occurs in my sample, although further research is needed to examine whether private equity
investments affect economic growth more in less-developed countries.
Finally, in line with the trade literature, my results also indicate a positive influence of
(trade) openness on economic growth. This result is in line with the extensive trade-growth
literature that examines this finding (Frankel and Romer, 1999; Li and Liu, 2005; Sachs et al.,
1995; Sala-i-Martin, 1997). In fact, it is the main goal of the European Commission to promote
trade to increase economic growth for the European Union in the coming 4 years according to
the newly adopted strategy (European Commission, 2014). My findings indicate that the
strategy of the European Commission should work to promote economic growth.
Overall, the empirical findings indicate strong and robust evidence that private equity
is able to promote economic growth in 21 European economies. Specifically, I find evidence
that an increase in private equity investments as a percentage of GDP by 1% increases economic
growth by 1.9% to 2.8%, and these results are robust to different specifications and endogeneity
issues.

46
6. Conclusion
The recent bankruptcy of Dutch department store V&D has lead to much controversy again
about the effects of private equity. The general public and media seem to have a rather
pessimistic view of PE firms. Various reports indeed confirm that PE firms are struggling with
a negative image and even the EVCA has expressed their concerns about the negative image of
PE firms. This image seems to persist from the 1980s, in which leveraged buyouts with leverage
levels up to 90% were the rule rather than the exception. Furthermore, member of the Dutch
parliament Henk Nijboer frequently puts private equity on the agenda, calling to battle private
equity excesses. Even PE firms themselves are worried about their image, possibly preventing
them to raise funds in the future if this image persists. To battle the negative image, the EVCA
calls to ‘encourage the private equity industry to look beyond returns and recognize its role as
a global influencer and agent for progress, which requires concrete examples and models for
inspiration’. This thesis provides such a concrete example for the private equity industry.
Using a sample of 21 European countries from 1989-2014, I examine the effect of
private equity on economic growth. In line with previous literature and the endogenous growth
model, I test the hypothesis that private equity investments have a positive effect on the
economic growth in Europe. I test this hypothesis using two measures. In the first regression, I
regress economic growth on private equity investments using a Least Squares Dummy Variable
Model using fixed effects to control for omitted variable bias. In the second regression, after
testing for endogeneity, I employ a two-stage least squares regression using venture capital
investments and buyout investments as instrumental variables for private equity investments.
The results are consequently checked for their robustness to different specifications.
The empirical results indicate strong evidence that private equity has a positive effect
on the economic growth in a sample of 21 European countries. Specifically, this paper finds
strong evidence that an increase in private equity investments by 1% increases the real
economic growth rate by approximately 1.9% to 2.8% in the short-run. This result is in line
with the empirical literature of Meyer (2006) who finds similar results using a European dataset
from 1994-2004. Furthermore, I find that this result is robust to different specifications and
endogeneity issues. Specifically, after controlling for endogeneity using an instrumental
variable approach, the significant positive effect remains strong throughout different
specifications. That is, I find evidence that an increase in private equity investments by 1%
increases the real economic growth rate by 4.3% to 7.8% in the long-run. The results of this
47
paper therefore show a clear acceptance of the first hypothesis and suggest that PE firms
unilaterally increase economic growth.
This study contributes to both the existing literature and the field of PE in practice. This
study is one of the first papers to use European data and to empirically examine the direct effects
of PE on economic growth. Furthermore, PE firms and the EVCA can use the results of this
paper to revise the image of the PE industry since it is found to contribute significantly to
economic growth.
However, a number of limitations of this thesis need to be considered. The first limitation is
that there are no perfect instrumental variables available to control for endogeneity. Even
though both of the instrumental variables have been found not to be endogenously related to
GDP growth, the exogeneity of the instruments cannot be tested. The results of 2SLS could
then be inconsistent and not reliable. Nonetheless, I cannot reject the null hypothesis of
overidentified restrictions, implying that my instruments are exogenous given that at least one
of the instruments is exogenous.
A second limitation is the use of virtually only developed countries in Europe. Although
I tried to include developing countries in Europe, including the Baltic countries and Ukraine,
data on PE investments and control variables where hard to find. Therefore, these countries
were excluded from the dataset. The inclusion of developing countries in this analysis could
lead to vastly different results.
Finally, I have used an unbalanced panel data set due to missing observations for a
number of control variables and PE investments. However, the use of an unbalanced panel data
is not problematic in this case. Although there are some missing values for the Slovak Republic,
the rest of the sample for the results in Table 4.4 are balanced and include all information. The
results in Table 4.7 are more problematic, however, with missing observations for multiple
countries and multiple variables. Nonetheless, the results for this Table are less important and
double checked using a DWH test for endogeneity.
The results of this thesis present a number of topics for further research and an important policy
implication. For example, the inclusion of developing countries could provide valuable insights
into the effects of PE in developing countries in line with Li and Liu (2005). Due to data
availability issues, this empirical analysis is not feasible today. Furthermore, further research
could provide valuable insights into the relationship between the components of PE investments
and economic growth. And lastly, the relationship between international PE investments as part

48
of FDI and economic growth has not been examined in this paper. This is due to the fact that
these numbers are only recorded from 2007 onwards in the Invest Europe Yearbook - 2015.
Future research on this topic would be an interesting contribution to the current literature of
FDI and economic growth. To conclude this thesis, I must note that there are still exuberances in PE, but this thesis
has found a s structural and positive relationship between PE and economic growth. Therefore,
an important policy implication would be to improve the image of PE in general as it proves to
be a valuable alternative investment class. This thesis proves to be an important contribution to
the EVCA in revising the image of the PE industry as it provides a concrete example of the
beneficial effect of PE investments.

49
REFERENCES
Adams, S., and Klobodu, E. K. M. (2016). Remittances, regime durability and economic
growth in Sub-Saharan Africa (SSA). Economic Analysis and Policy, 50, 1-8.
Aghion, P., Howitt, P., Brant-Collett, M., and García-Peñalosa, C. (1998). Endogenous
Growth Theory. Cambridge, MA: The MIT Press.
Agmon, T., and Messica, A. (2009). Financial foreign direct investment: The role of private
equity investments in the globalization of firms from emerging markets. MIR:
Management International Review, 49(1), 11–25.
Aitken, B. J., and Harrison, A. E. (1999). Do domestic firms benefit from foreign direct
investment? Evidence from Venezuela. The American Economic Review, 89(3), 605–
618.
Aldatmaz, S. (2013). Private equity in the global economy: Evidence on industry spillovers.
(Doctoral dissertation). Retrieved from ProQuest. (3562682).
Alfaro, L., Chanda, A., Kalemli–Ozcan, S., and Sayek, S. (2004). FDI and economic growth:
The role of local financial markets. Journal of International Economics, 61(64), 89-
112.
Appelbaum, E., and Batt, R. L. (2014). Private Equity at Work: When Wall Street Manages
Main Street. New York, NY: Russel Sage Foundation.
Azman-Saini, W. N. W., Baharumshah, A. Z., and Law, S. H. (2010). Foreign direct
investment, economic freedom and economic growth: International evidence.
Economic Modelling, 27(5), 1079-1089.
Barrell, R., and Pain, N. (1997). Foreign direct investment, technological change, and
economic growth within Europe. The Economic Journal, 445(107), 1770–1786.
50
Barro, R. J. (1997). Determinants of Economic Growth: A Cross-Country Empirical Study.
Cambridge, MA: The MIT Press.
Barro, R. J., and Lee, J. W. (1994). Sources of economic growth. Carnegie-Rochester
Conference Series on Public Policy, 40, 1-46.
Barro, R. J., and Lee, J. W. (1996). International measures of schooling years and schooling
quality. The American Economic Review, 86(2), 218-223.
Bende-Nabende, A., Ford, J. L., Santoso, B., and Sen, S. (2003). The interaction between
FDI, output and the spillover variables: Co-integration and VAR analyses for APEC,
1965-1999. Applied Economics Letters, 10(3), 165-172.
Bengoa, M., and Sanchez–Robles, B. (2003). Foreign direct investment, economic freedom,
and growth: New evidence from Latin America. European Journal of Political
Economy, 19(3), 529–545.
Bernoth, K., Colavecchio, R., and Sass, M. (2010). Drivers of private equity investment in
CEE and Western European countries (DIW Discussion Papers No. 1002). Berlin:
Deutsches Institut für Wirtschaftsforschung.
Bernstein, S., Lerner, J., Sørensen, M., and Strömberg, P. (2010). Private equity and industry
performance (Working Paper No. w15632). Cambridge, MA: National Bureau of
Economic Research.
Bonini, S., and Alkan, S. (2012). The political and legal determinants of venture capital
investments around the world. Small Business Economics, 39(4), 997-1016.
Borensztein, E., De Gregorio, J., and Lee, J. (1998). How does foreign direct investment
affect economic growth. Journal of International Economics, 45(1), 115-135
Bowen, H. P., Hollander, A., and Viaene, J. M. (2012). Applied International Trade (2nd
ed.). Houndmills, Basingstoke, Hampshire: Palgrave Macmillan.
51
Branstetter, L. (2006). Is foreign direct investment a channel of knowledge spillovers?
Evidence from Japan’s FDI in the United States. Journal of Development Economics,
68(2), 325–344.
Brems, H. (1970). A growth model of international direct investment. The American
Economic Review, 60(3), 320-331.
Campos, N. F., and Kinoshita, Y. (2002). Foreign direct investment as technology transferred:
Some panel evidence from the transition economies. The Manchester School, 70(3),
398-419.
Caporale, G. M., and Pittis, N. (1997). Causality and forecasting in incomplete systems.
Journal of Forecasting, 16(6), 425-437.
Carkovic, M. V., and Levine, R. (2002). Does foreign direct investment accelerate economic
growth? (University of Minnesota Department of Finance Working Paper).
Minneapolis, MN: University of Minnesota.
Caselli, S. (2010). Private Equity and Venture Capital in Europe: Markets, Techniques, and
Deals. Burlington, MA: Academic Press/Elsevier.
Caselli, S., Gatti, S., and Perrini, F. (2009). Are venture capitalists a catalyst for innovation?.
European Financial Management, 15(1), 92-111.
Casper, G., and Tufis, C. (2003). Correlation versus interchangeability: The limited
robustness of empirical findings on democracy using highly correlated data sets.
Political Analysis, 11(2), 196-203.
Choe, J. I. (2003). Do foreign direct investment and gross domestic investment promote
economic growth?. Review of Development Economics, 7(1), 44-57.
Chowdhury, A., and Mavrotas, G. (2006). FDI and growth: What causes what? The World
Economy, 29(1), 9–19.
52
Cumming, D. (2010). Private Equity: Fund Types, Risks and Returns, and Regulation.
Hoboken, NJ: Wiley.
Davidson, R., and MacKinnon, J. G. (1993). Estimation and Inference in Econometrics. New
York, NY: Oxford University Press.
Davis, S. J., Haltiwanger, J., Handley, K., Jarmin, R. S., Lerner, J., and Miranda, J. (2014).
Private equity, jobs, and productivity. The American Economic Review, 104(12),
3956-3990.
Durham, J. B. (2004). Absorptive capacity and the effects of foreign direct investment and
equity foreign portfolio investment on economic growth. European Economic Review,
48(2), 285-306.
Driscoll, J. C., and Kraay, A. C. (1998). Consistent covariance matrix estimation with
spatially dependent panel data. Review of Economics and Statistics, 80(4), 549-560.
Easterly, W., and Levine, R. (1997). Africa's growth tragedy: Policies and ethnic divisions.
The Quarterly Journal of Economics, 112(4), 1203-1250.
Engel, D., and Keilbach, M. (2007). Firm-level implications of early stage venture capital
investment - An empirical investigation. Journal of Empirical Finance, 14(2), 150-
167.
European Commission (2014). European Union Explained: Trade. Brussels: European
Commission. Retrieved May 20, 2016, from European Commission website:
http://europa.eu/pol/pdf/flipbook/en/trade_en.pdf.
Ernst & Young (2012). Branching Out: How do Private Equity Investors Create Value? A
Study of European Exits. UK: EYGM Limited.
Ethier, W. J. (1982). National and international returns to scale in the modern theory of
international trade. The American Economic Review, 72(3), 389-405.

53
Fosu, A. K. (2001). Political instability and economic growth in developing economies: Some
specification empirics. Economics Letters, 70(2), 289-294.
Frankel, J. A., and Romer, D. (1999). Does trade cause growth?. The American Economic
Review, 89(3), 379-399.
Frontier Economics (2013). Exploring the Impact of Private equity on Economic Growth in
Europe (Rep.). London: Frontier Economics Europe.
Gilligan, J., and Wright, M. (2014). Private Equity Demystified: An Explanatory Guide (3rd
ed.). London: ICAEW Corporate Finance Faculty.
Goldstone, J. A., Bates, R. H., Epstein, D. L., Gurr, T. R., Lustik, M. B., Marshall, M. G., ...
and Woodward, M. (2010). A global model for forecasting political instability.
American Journal of Political Science, 54(1), 190-208.
Gompers, P. A., and Lerner, J. (1998). What drives venture capital fundraising?. Brookings
Papers on Economic Activity: Microeconomics, 1998, 149-204.
Görg, H., and Strobl, E. (2002). Multinational companies and indigenous development: An
empirical analysis. European Economic Review, 46(7), 1305-1322.
Grossman, G. M., and Helpman, E. (1991). Quality ladders in the theory of growth. The
Review of Economic Studies, 58(1), 43-61.
Harris, R., Siegel, D. S., and Wright, M. (2005). Assessing the impact of management
buyouts on economic efficiency: Plant-level evidence from the United Kingdom.
Review of Economics and Statistics, 87(1), 148-153.
Hausman, J. A. (1978). Specification tests in econometrics. Econometrica: Journal of the
Econometric Society, 46(6), 1251-1271.
Hirukawa, M., and Ueda, M. (2011). Venture capital and innovation: Which is first?. Pacific
Economic Review, 16(4), 421-465.
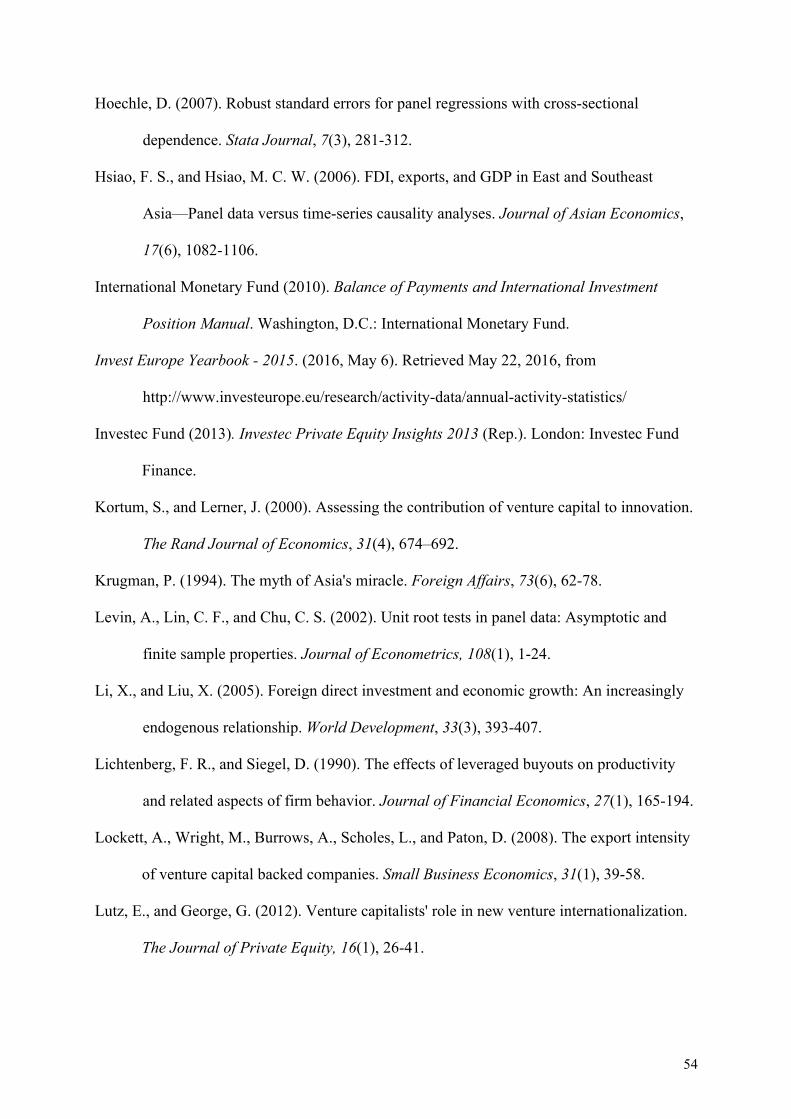
54
Hoechle, D. (2007). Robust standard errors for panel regressions with cross-sectional
dependence. Stata Journal, 7(3), 281-312.
Hsiao, F. S., and Hsiao, M. C. W. (2006). FDI, exports, and GDP in East and Southeast
Asia—Panel data versus time-series causality analyses. Journal of Asian Economics,
17(6), 1082-1106.
International Monetary Fund (2010). Balance of Payments and International Investment
Position Manual. Washington, D.C.: International Monetary Fund.
Invest Europe Yearbook - 2015. (2016, May 6). Retrieved May 22, 2016, from
http://www.investeurope.eu/research/activity-data/annual-activity-statistics/
Investec Fund (2013). Investec Private Equity Insights 2013 (Rep.). London: Investec Fund
Finance.
Kortum, S., and Lerner, J. (2000). Assessing the contribution of venture capital to innovation.
The Rand Journal of Economics, 31(4), 674–692.
Krugman, P. (1994). The myth of Asia's miracle. Foreign Affairs, 73(6), 62-78.
Levin, A., Lin, C. F., and Chu, C. S. (2002). Unit root tests in panel data: Asymptotic and
finite sample properties. Journal of Econometrics, 108(1), 1-24.
Li, X., and Liu, X. (2005). Foreign direct investment and economic growth: An increasingly
endogenous relationship. World Development, 33(3), 393-407.
Lichtenberg, F. R., and Siegel, D. (1990). The effects of leveraged buyouts on productivity
and related aspects of firm behavior. Journal of Financial Economics, 27(1), 165-194.
Lockett, A., Wright, M., Burrows, A., Scholes, L., and Paton, D. (2008). The export intensity
of venture capital backed companies. Small Business Economics, 31(1), 39-58.
Lutz, E., and George, G. (2012). Venture capitalists' role in new venture internationalization.
The Journal of Private Equity, 16(1), 26-41.

55
Mankiw, N. G., Romer, D., and Weil, D. N. (1992). A contribution to the empirics of
economic growth. The Quarterly Journal of Economics, 107(2), 407-437.
Metrick, A., and Yasuda, A. (2011). Venture Capital and the Finance of Innovation (2nd ed.).
New York, NY: Wiley.
Meyer, T. (2006). Private equity - Spice for European economies. Journal of Financial
Transformation, 18, 61-69.
Mollica, M., and Zingales, L. (2007). The impact of venture capital on innovation and the
creation of new businesses (Unpublished Working Paper). Chicago, IL: University of
Chicago.
Nair!Reichert, U., and Weinhold, D. (2001). Causality tests for cross!country panels: A new
look at FDI and economic growth in developing countries. Oxford Bulletin of
Economics and Statistics, 63(2), 153-171.
Neuhaus, M. (2006). The Impact of FDI on Economic Growth: An Analysis for the Transition
Countries of Central and Eastern Europe. Heidelberg: Physica-Verlag.
Obstfeld, M. (2009). International finance and growth in developing countries: What have we
learned?. IMF Staff Papers, 56(1), 63-111.
Popov, A., and Roosenboom, P. (2012). Venture capital and patented innovation: Evidence
from Europe. Economic Policy, 27(71), 447-482.
Popov, A., and Roosenboom, P. (2013). Venture capital and new business creation. Journal of
Banking and Finance, 37(12), 4695-4710.
Ramamurti, R. (2013). Impact of the crisis on new FDI players: Past, present and future of
sovereign wealth funds, private equity and emerging market transnational
corporations. Transnational Corporations, 20(1), 39-68.
Ritter, J. R. (2005). Economic growth and equity returns. Pacific-Basin Finance Journal,
13(5), 489-503.

56
Rodrik, D., and Wacziarg, R. (2005). Do democratic transitions produce bad economic
outcomes?. The American Economic Review, 95(2), 50-55.
Romer, P. M. (1986). Increasing returns and long-run growth. The Journal of Political
Economy, 94(5), 1002-1037.
Romer, P. M. (1990). Endogenous technological change. The Journal of Political Economy,
98(5), 71-102.
Sachs, J. D., Warner, A., Åslund, A., and Fischer, S. (1995). Economic reform and the
process of global integration. Brookings Papers on Economic Activity, 1995(1), 1-118.
Sala-i-Martin, X. X. (1997). I just ran two million regressions. The American Economic
Review, 87(2), 178-183.
Samila, S., and Sorenson, O. (2011). Venture capital, entrepreneurship, and economic growth.
The Review of Economics and Statistics, 93(1), 338-349.
Schumpeter, J. A. (1942). Capitalism, Socialism and Democracy. New York, NY: Harper and
Row.
Shleifer, A., and Vishny, R. W. (2003). Stock market driven acquisitions. Journal of
Financial Economics, 70(3), 295-311.
Sjöholm, F. (1999). Technology gap, competition and spillovers from direct foreign
investment: Evidence from establishment data. The Journal of Development Studies,
36(1), 53-73.
Solow, R. M. (1956). A contribution to the theory of economic growth. The Quarterly
Journal of Economics, 70(1), 65–94.
Stock, J. H., and Watson, M. W. (2011). Introduction to Econometrics (3rd ed.). Boston, MA:
Pearson Education Limited.
Strömberg, P. (2009). The economic and social impact of private equity in Europe: Summary
of research findings (Working Paper). Stockholm: Stockholm School of Economics.

57
Swan, T. W. (1956). Economic growth and capital accumulation. Economic Record,
32(2), 334–361.
UNCTAD. (1999). World Investment Report 1999: Foreign Direct Investment and the
Challenge of Development. New York, NY: United Nations.
UNCTAD. (2008). World Investment Report 2008: Transnational Corporations and the
Infrastructure Challenge. Geneva: United Nations.
Verbeek, M. (2012). A Guide to Modern Econometrics (4th ed.). Chichester: Wiley.
Zhang, K. H. (2001). Does foreign direct investment promote economic growth? Evidence
from East Asia and Latin America. Contemporary Economic Policy, 19(2), 175-185.
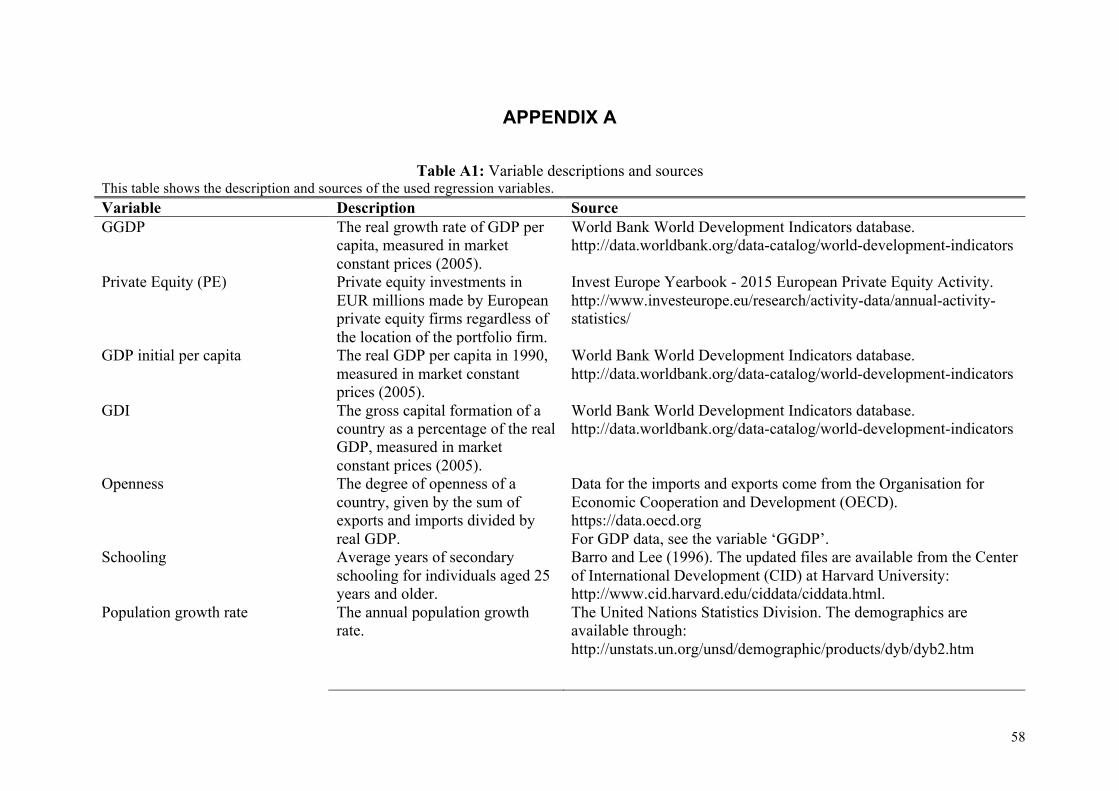
58
APPENDIX A
Table A1: Variable descriptions and sources
This table shows the description and sources of the used regression variables. Variable Description Source GGDP The real growth rate of GDP per
capita, measured in market constant prices (2005).
World Bank World Development Indicators database. http://data.worldbank.org/data-catalog/world-development-indicators
Private Equity (PE) Private equity investments in EUR millions made by European private equity firms regardless of the location of the portfolio firm.
Invest Europe Yearbook - 2015 European Private Equity Activity. http://www.investeurope.eu/research/activity-data/annual-activity-statistics/
GDP initial per capita The real GDP per capita in 1990, measured in market constant prices (2005).
World Bank World Development Indicators database. http://data.worldbank.org/data-catalog/world-development-indicators
GDI The gross capital formation of a country as a percentage of the real GDP, measured in market constant prices (2005).
World Bank World Development Indicators database. http://data.worldbank.org/data-catalog/world-development-indicators
Openness The degree of openness of a country, given by the sum of exports and imports divided by real GDP.
Data for the imports and exports come from the Organisation for Economic Cooperation and Development (OECD). https://data.oecd.org For GDP data, see the variable ‘GGDP’.
Schooling Average years of secondary schooling for individuals aged 25 years and older.
Barro and Lee (1996). The updated files are available from the Center of International Development (CID) at Harvard University: http://www.cid.harvard.edu/ciddata/ciddata.html.
Population growth rate The annual population growth rate.
The United Nations Statistics Division. The demographics are available through: http://unstats.un.org/unsd/demographic/products/dyb/dyb2.htm

59
GFCE Government final consumption expenditure as a percentage of the real GDP.
World Bank World Development Indicators database. http://data.worldbank.org/data-catalog/world-development-indicators
Telephone lines The number of fixed telephone subscriptions per capita.
World Bank World Development Indicators database. http://data.worldbank.org/data-catalog/world-development-indicators
Democracy Democracy index which is an average of the rating for civil liberties and the rating for political rights on a scale of 1 (most free) to 7 (least free).
Freedom House Freedom Rating Database. https://freedomhouse.org
Technology gap The level of GDP per capita in the European country as a percentage of the GDP per capita in the United States.
World Bank World Development Indicators database. http://data.worldbank.org/data-catalog/world-development-indicators
Regime durability The number of years since the most recent regime change, defined by a three- point change in the Polity IV score over a period of three years or less, or the end of transition period defined by the lack of stable political institutions (denoted by a standardized authority score).
The Center for Systemic Peace. http://www.systemicpeace.org/inscrdata.html
Polity IV score The Polity IV score is computed by subtracting the Autocracy score from the Democracy score. The resulting unified polity scale ranges from +10 (strongly democratic) to -10 (strongly autocratic).
The Center for Systemic Peace. http://www.systemicpeace.org/inscrdata.html
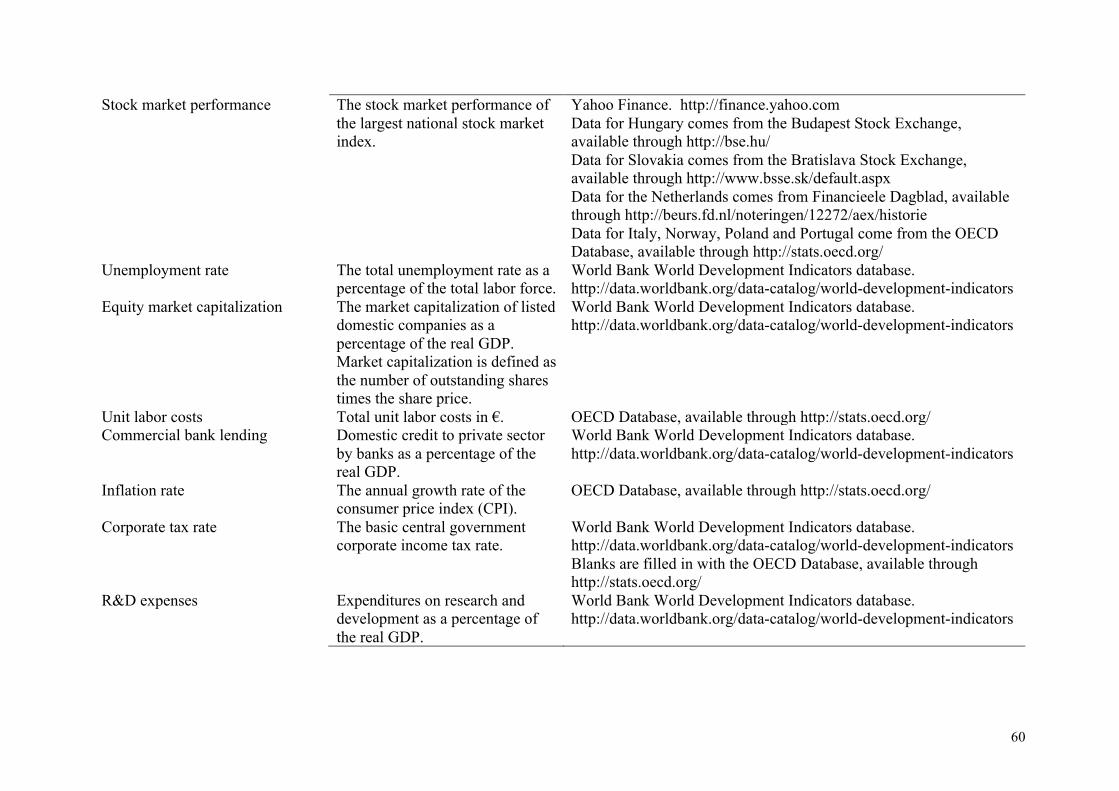
60
Stock market performance The stock market performance of the largest national stock market index.
Yahoo Finance. http://finance.yahoo.com Data for Hungary comes from the Budapest Stock Exchange, available through http://bse.hu/ Data for Slovakia comes from the Bratislava Stock Exchange, available through http://www.bsse.sk/default.aspx Data for the Netherlands comes from Financieele Dagblad, available through http://beurs.fd.nl/noteringen/12272/aex/historie Data for Italy, Norway, Poland and Portugal come from the OECD Database, available through http://stats.oecd.org/
Unemployment rate The total unemployment rate as a percentage of the total labor force.
World Bank World Development Indicators database. http://data.worldbank.org/data-catalog/world-development-indicators
Equity market capitalization The market capitalization of listed domestic companies as a percentage of the real GDP. Market capitalization is defined as the number of outstanding shares times the share price.
World Bank World Development Indicators database. http://data.worldbank.org/data-catalog/world-development-indicators
Unit labor costs Total unit labor costs in €. OECD Database, available through http://stats.oecd.org/ Commercial bank lending Domestic credit to private sector
by banks as a percentage of the real GDP.
World Bank World Development Indicators database. http://data.worldbank.org/data-catalog/world-development-indicators
Inflation rate The annual growth rate of the consumer price index (CPI).
OECD Database, available through http://stats.oecd.org/
Corporate tax rate The basic central government corporate income tax rate.
World Bank World Development Indicators database. http://data.worldbank.org/data-catalog/world-development-indicators Blanks are filled in with the OECD Database, available through http://stats.oecd.org/
R&D expenses Expenditures on research and development as a percentage of the real GDP.
World Bank World Development Indicators database. http://data.worldbank.org/data-catalog/world-development-indicators

61
Labor union strength The number of union members as a percentage of the number of employees in a country.
OECD Database, available through http://stats.oecd.org/
Exit channel The exit channel is defined as the divestments through an initial public offering (IPO) as a percentage of the private equity investments three years before.
Invest Europe Yearbook - 2015 European Private Equity Activity. http://www.investeurope.eu/research/activity-data/annual-activity-statistics/

62
APPENDIX B
Table B1: Correlation matrix equation 3.4
PE GDP initial GDI Openness Schooling GFCE Population Telephone lines Democracy
Tech-
nology
gap
Regime durability Polity IV score Stock market
Un-
Employment
rate
PE 1.000
GDP
initial 0.250 1.000
GDI -0.216 -0.266 1.000
Openness -0.093 -0.486 0.144 1.000
Schooling 0.404 0.212 -0.173 0.170 1.000
GFCE 0.222 -0.053 -0.260 -0.032 0.227 1.000
Population 0.173 -0.046 0.281 0.059 0.183 -0.155 1.000
Telephone
lines 0.219 0.306 -0.136 -0.293 0.313 -0.006 0.195 1.000
Democracy -0.228 0.190 -0.083 -0.270 -0.381 -0.076 -0.272 -0.067 1.000
Technology
gap -0.185 -0.279 0.183 0.148 -0.413 -0.018 -0.483 -0.587 0.233 1.000
Regime durability 0.293 0.012 -0.164 0.115 0.291 -0.419 0.396 0.367 -0.225 -0.544 1.000
Polity IV
score 0.003 -0.101 -0.159 -0.127 0.005 -0.181 -0.014 0.109 -0.044 -0.152 0.152 1.000
Stock market -0.077 -0.014 -0.053 -0.050 -0.029 0.011 -0.027 0.048 0.005 -0.028 -0.011 0.042 1.000
Unemployment rate -0.101 -0.017 -0.263 0.145 -0.225 0.185 0.298 -0.168 0.268 0.361 -0.415 -0.073 0.086 1.000

63
APPENDIX C
Table C1: Correlation matrix equation 3.5
GDP
growth
rate
Equity
market
cap
Unit
labor
costs
Commercial
bank
lending
Corporate
tax rate R&D
Labor
union
strength
Stock
market
Exit
channel
Inflation
rate
GDP growth rate 1.000
Equity market cap 0.147 1.000
Unit labor costs -0.366 -0.097 1.000
Commercial bank
lending -0.407 0.257 0.479 1.000
Corporate tax rate 0.023 0.047 -0.410 -0.163 1.000
R&D -0.114 0.385 0.139 0.227 -0.016 1.000
Union labor strength 0.019 0.129 -0.216 -0.138 0.067 0.557 1.000
Stock market 0.125 0.128 -0.181 -0.168 0.088 0.014 0.095 1.000
Exit channel 0.141 0.225 -0.188 -0.100 0.001 0.062 0.082 0.056 1.000
Inflation rate 0.067 -0.033 -0.038 -0.064 -0.022 0.033 0.087 -0.007 0.159 1.000