private equity - corporate tax - antitrust international corporate finance
Upload
chris-mercerCategory
view
156download
1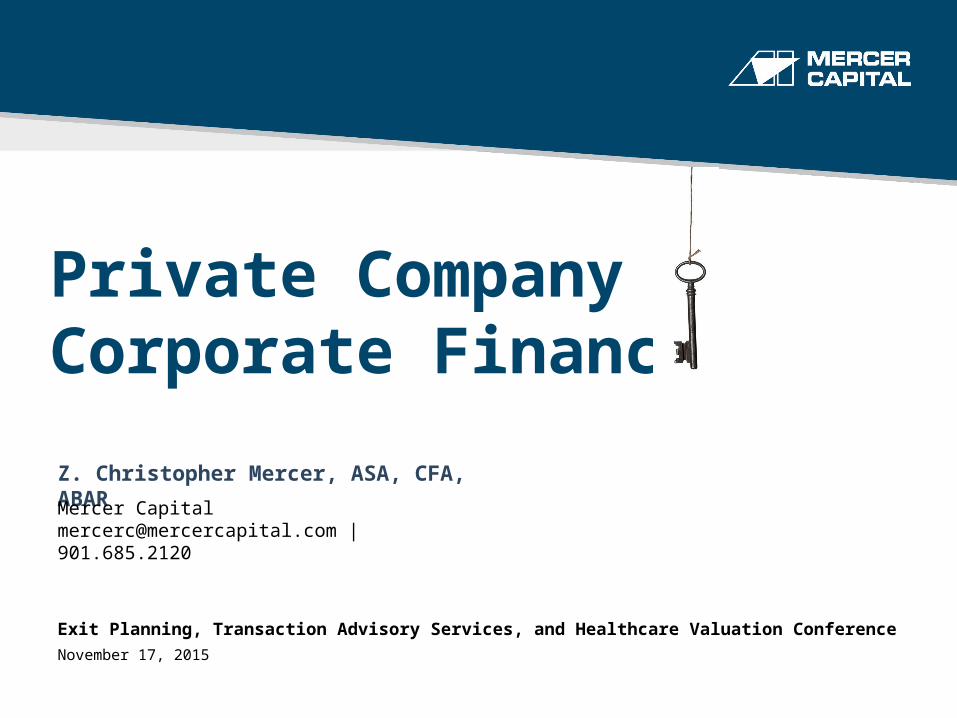
Private Company Corporate FinanceZ. Christopher Mercer, ASA, CFA, ABARMercer [email protected] | 901.685.2120
Exit Planning, Transaction Advisory Services, and Healthcare Valuation ConferenceNovember 17, 2015

2
Ownership Transfer Matrix Vertical or Horizontal?
See Figure 3 on page 22 in Unlocking Private Company Wealth.© Z. Christopher Mercer, 2015 | www.mercercapital.com | www.ChrisMercer.net
Partial Sale/Transfer
Total Sale/Transfer
Voluntary Transfer
• Private Equity/PE
• Sales to Insiders/Relatives
• Gifting Programs
• Sale of Business
• ESOP/Management Buyout
• Buy-Sell Agreements
Involuntary Transfer
• Personal Financial Issues
• Divorce
• Death
• Divorce
• Buy-Sell Agreements

There are legitimate, effective, and available alternative techniques to create shareholder liquidity and cash flow, enhance business performance and returns, and provide opportunities for overall portfolio diversification
Not all are appropriate for all companies at all times
May be appropriate for consideration under specific conditions and circumstances

4
Private Company Finance Options
Easily implemented optionsRegular dividends
Special dividend
Repurchase shares from owners desiring to sell
Establish a management buy-in program
Significant & Realistic Minority OptionsLeveraged dividend recap
Leveraged stock recap (buy-back)
ESOP
Non-control private equity investment for liquidity/growth
Control-Level OptionsLeveraged dividend recap
Leveraged stock recap (buy-back)
ESOP
Private equity (majority investment)
© Z. Christopher Mercer, 2015 | www.mercercapital.com | www.ChrisMercer.net

5
Today’s Session
Dividend policy
Special dividends
Leveraged dividend recaps
Leveraged share repurchases
Balance sheet optimization
EBITDA multiple
ESOPs
© Z. Christopher Mercer, 2015 | www.mercercapital.com | www.ChrisMercer.net

6
The
Solution
Using One Percent
Solution strategies is
tantamount to applying
basic tools of corporate
finance to private
corporate America
See page 36 in Unlocking Private Company Wealth.© Z. Christopher Mercer, 2015 | www.mercercapital.com | www.ChrisMercer.net

7
The
Solution
Basic ToolsDividend Policy
Capital Investment Decisions
Share Repurchases
Leverage
See page 36 in Unlocking Private Company Wealth.© Z. Christopher Mercer, 2015 | www.mercercapital.com | www.ChrisMercer.net

8
Dividend Policy
© Z. Christopher Mercer, 2015 | www.mercercapital.com | www.ChrisMercer.net

Every company has a dividend policy
Dividend policy is a starting point for portfolio diversification
Special dividends enhance personal liquidity and diversification
Dividend policy matters
Boards of directors need to establish thoughtful dividend policies
Dividends and Dividend Policy for Private Cos
Never pay a dividend One time dividend Special dividend
Constant dollar dividend
Set a dividend payout ratio target
Dividend yield target
Residual dividend policy
Spin-out for spin-off of subsidiaries or
other assets
Leveraged dividend
recapitalization
10 Types of Dividend Policies
Distributions for tax pass-through liabilities

Dividend Policy Influences Return
on Business Investment
Theory – Neutral
Reality – If you run the company well, pay dividends, and maintain normal capital
structure, you may well beat the theoretical
12© Z. Christopher Mercer, 2015 | www.mercercapital.com | www.ChrisMercer.net
13© Z. Christopher Mercer, 2015 | www.mercercapital.com | www.ChrisMercer.net

14
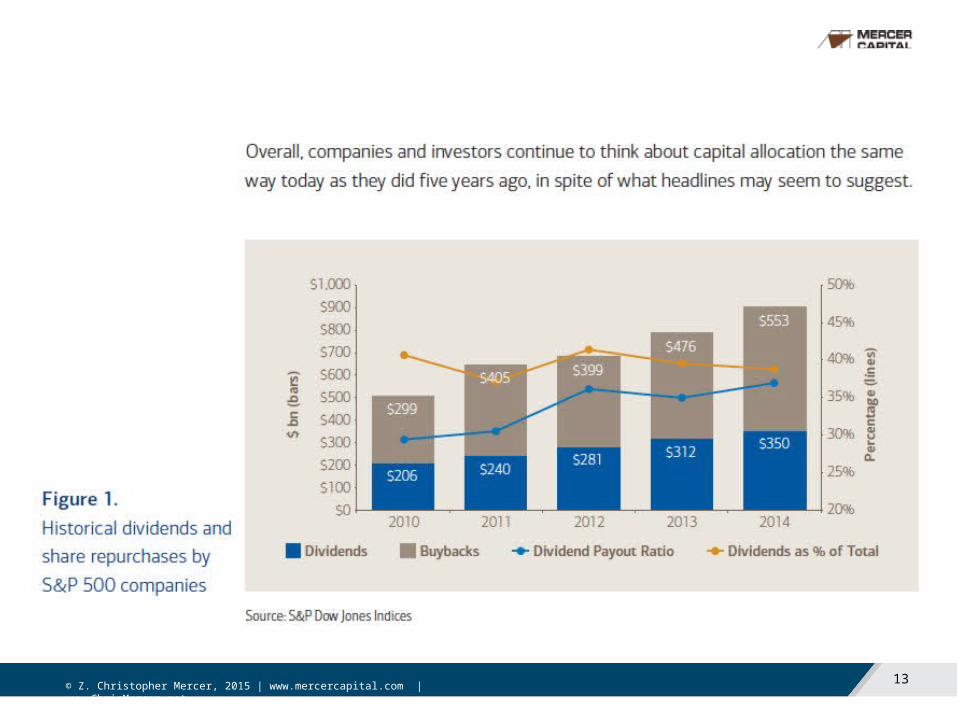
A key benefit of this type of policy is that shareholders retain a regular quarterly dividend, but the company has more flexibility in how it returns additional excess cash beyond the regular dividend rather than having to repurchase share regardless of price.
© Z. Christopher Mercer, 2015 | www.mercercapital.com | www.ChrisMercer.net

15© Z. Christopher Mercer, 2015 | www.mercercapital.com | www.ChrisMercer.net

16© Z. Christopher Mercer, 2015 | www.mercercapital.com | www.ChrisMercer.net
17
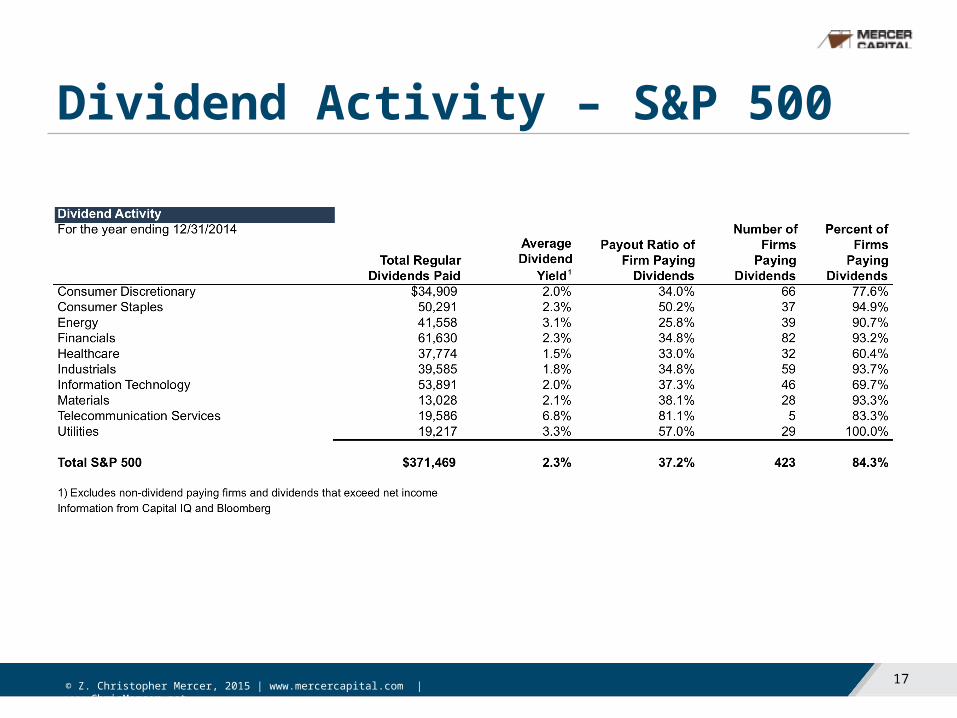
Dividend Activity – S&P 500
© Z. Christopher Mercer, 2015 | www.mercercapital.com | www.ChrisMercer.net

18
Dividend Policy Influences Return on Business Investment
© Z. Christopher Mercer, 2015 | www.mercercapital.com | www.ChrisMercer.net

19
Return Concepts
© Z. Christopher Mercer, 2015 | www.mercercapital.com | www.ChrisMercer.net

20
Special Dividends
© Z. Christopher Mercer, 2015 | www.mercercapital.com | www.ChrisMercer.net

21
Special Dividends – S&P 500

22
Leveraged Dividend Recaps
© Z. Christopher Mercer, 2015 | www.mercercapital.com | www.ChrisMercer.net

Leveraged Dividend Recap
23
Debt
EquityEquity
Debt
Cash Dividend to Shareholders
© Z. Christopher Mercer, 2015 | www.mercercapital.com | www.ChrisMercer.net

24
Leveraged Dividend RecapLiquidity & Diversification Leveraged Dividend Recap
Means of Achieving Partial LiquidityCreating Diversification Opportunities Yes, for all shareholders
Creating Diversification Opportunities Yes, for all shareholders
Tax Treatment Dividend rates
© Z. Christopher Mercer, 2015 | www.mercercapital.com | www.ChrisMercer.net

25
Leveraged Dividend RecapLiquidity & Diversification Leveraged Dividend Recap
Shareholder BenefitsEffect on Number of Shares Outstanding No effect
Relevant Shareholders All shareholders (no change in ownership)
Effect on Earnings Per Share (EPS) Decrease (earnings lowered by interest expense)
Effect on Return on Equity (ROE) Increase (equity reduced relatively more than earnings lowered)
Effect on Expected Future Value Growth Increase (as debt is repaid)
Effect on Dividends Per Share None (assuming any prior dividend is retained)
Effect on Price/Book (P/B) Value Ratio Increase (equity reduced relatively more than earnings lowered)
Effect on Pro Rata Ownership of Company No effect (no change in number of shares outstanding)
© Z. Christopher Mercer, 2015 | www.mercercapital.com | www.ChrisMercer.net

26
Leveraged Dividend RecapLiquidity & Diversification Leveraged Dividend Recap
Additional Benefits to Company & OwnersEffect on Capital Structure Move toward optimizing (assuming reasonable leverage)
Effect on Management Should focus attention on operating so that debt can be reduced timely
© Z. Christopher Mercer, 2015 | www.mercercapital.com | www.ChrisMercer.net

27
Leveraged Recapitalizations
© Z. Christopher Mercer, 2015 | www.mercercapital.com | www.ChrisMercer.net
Two types of transactions look similar to company
Share Repurchases Dividends

28
Leveraged Recapitalizations
© Z. Christopher Mercer, 2015 | www.mercercapital.com | www.ChrisMercer.net
Look similar to company

29
Leveraged Recapitalizations
© Z. Christopher Mercer, 2015 | www.mercercapital.com | www.ChrisMercer.net

30
Leveraged Recapitalizations
© Z. Christopher Mercer, 2015 | www.mercercapital.com | www.ChrisMercer.net
Which is best? You decide

31
Leveraged Share Repurchases
© Z. Christopher Mercer, 2015 | www.mercercapital.com | www.ChrisMercer.net

32
Leveraged Share RepurchasesLiquidity & Diversification Leveraged Share RepurchasesMeans of Achieving Partial Liquidity
Creating Diversification OpportunitiesYes, partial or full liquidity for selling owners
Creating Diversification Opportunities Yes, for selling owners
Tax Treatment Capital gains rates
© Z. Christopher Mercer, 2015 | www.mercercapital.com | www.ChrisMercer.net
33
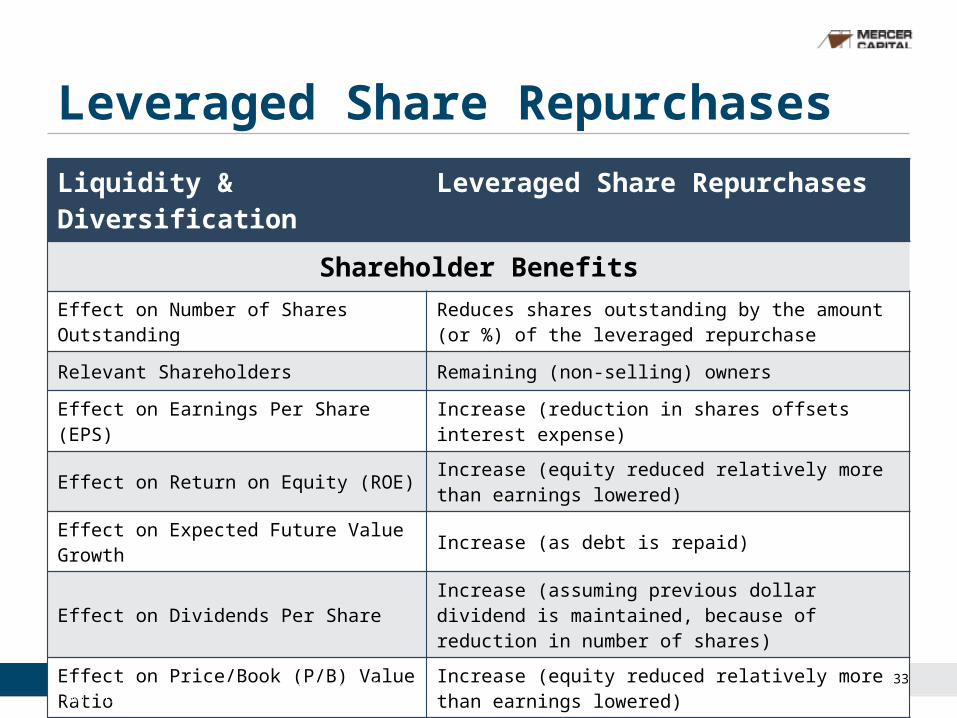
Leveraged Share RepurchasesLiquidity & Diversification Leveraged Share Repurchases
Shareholder Benefits
Effect on Number of Shares Outstanding Reduces shares outstanding by the amount (or %) of the leveraged repurchase
Relevant Shareholders Remaining (non-selling) owners
Effect on Earnings Per Share (EPS) Increase (reduction in shares offsets interest expense)
Effect on Return on Equity (ROE) Increase (equity reduced relatively more than earnings lowered)
Effect on Expected Future Value Growth Increase (as debt is repaid)
Effect on Dividends Per Share Increase (assuming previous dollar dividend is maintained, because of reduction in number of shares)
Effect on Price/Book (P/B) Value Ratio Increase (equity reduced relatively more than earnings lowered)
Effect on Pro Rata Ownership of Company Increase (by number of shares owned divided by (1-% of total shares repurchased))
© Z. Christopher Mercer, 2015 | www.mercercapital.com | www.ChrisMercer.net

34
Leveraged Share RepurchasesLiquidity & Diversification Leveraged Share Repurchases
Additional Benefits to Company & Owners
Effect on Capital Structure Move toward optimizing (assuming reasonable leverage)
Effect on Management Should focus attention on operating so that debt can be reduced timely
© Z. Christopher Mercer, 2015 | www.mercercapital.com | www.ChrisMercer.net

35
Share Repurchases – S&P 500
© Z. Christopher Mercer, 2015 | www.mercercapital.com | www.ChrisMercer.net
36
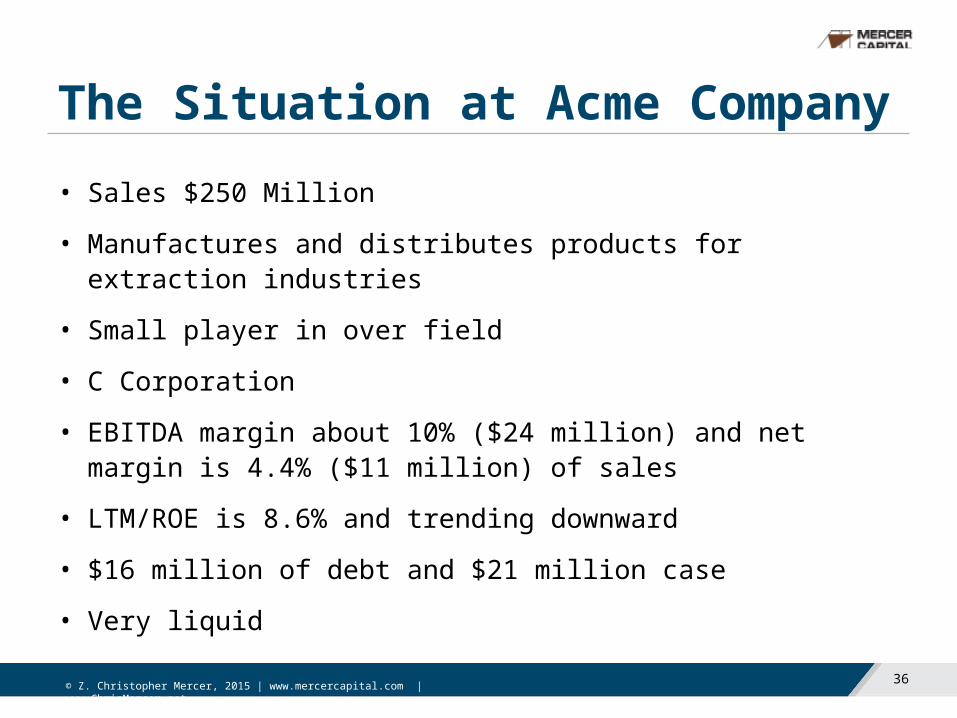
The Situation at Acme Company• Sales $250 Million
• Manufactures and distributes products for extraction industries
• Small player in over field
• C Corporation
• EBITDA margin about 10% ($24 million) and net margin is 4.4% ($11 million) of sales
• LTM/ROE is 8.6% and trending downward
• $16 million of debt and $21 million case
• Very liquid
© Z. Christopher Mercer, 2015 | www.mercercapital.com | www.ChrisMercer.net

37
The Situation• Working capital as a percentage of sales is about 32% (vs 20% for
publics)
• $126 million of equity, which comprises 72% of assets
• Equity value - $149 million
• 6 X EBITDA – Debt + Cash
• Cash dividend of $3.0 million per year for years
• Payout ratio of 27.5%
© Z. Christopher Mercer, 2015 | www.mercercapital.com | www.ChrisMercer.net

38
Transaction AssumptionsKey Transaction Assumptions Values Comments
1 Number of Shares to be Purchased 300,000 30% of the outstanding shares
2 % of Cash Considered Excess 100.0% Use all cash on balance sheet
3 EBITDA Multiple for Pricing Transaction 6.0 Assumption
4 Dollars of Current Annual Dividends $3,000,000 Factual
5 Given Number of Shares for Example 100,000 10% block
6 Interest Rate on Pro Forma Cash 1.00% Assumption of CFO
7 Interest Rate on Pro Forma Debt 6.00% Assumption per bank discussions
8 Effective Tax Rate 36.20% Factual
9 EBITDA Multiple for Pro Forma #1 Valuation 6.00 No Change in EBITDA Multiple
10 Price/Earnings Multiple for Pro Forma #2 13.7 Proxy for future benefit of recap
© Z. Christopher Mercer, 2015 | www.mercercapital.com | www.ChrisMercer.net

39
Financing of Transaction
© Z. Christopher Mercer, 2015 | www.mercercapital.com | www.ChrisMercer.net

40
Pro Forma AnalysisBalance Sheet Ratios Before Pro Forma Comments
Current Ratio 4.4Lots of liquidity
3.5 Adequately liquid
Acid Test Ratio 2.2 1.3 Reasonable
Working Capital % of Sales 31.6% 23.5% Reasonable
Total Liabilities / Assets 28.3% 47.5% Reasonable
Total Liabilities / Equity 39.9% 91.8% Reasonable
Interest Bearing Debt / Equity 13.0%Low leverage
50.2% Moderate leverage
Interest Bearing Debt / Assets 9.2% 26.0% Reasonable
Assets / Equity 1.4 1.9 Reasonable
Debt / MVTC 11.3% 28.0% Reasonable
© Z. Christopher Mercer, 2015 | www.mercercapital.com | www.ChrisMercer.net

41
Income Statement Analysis
© Z. Christopher Mercer, 2015 | www.mercercapital.com | www.ChrisMercer.net
42
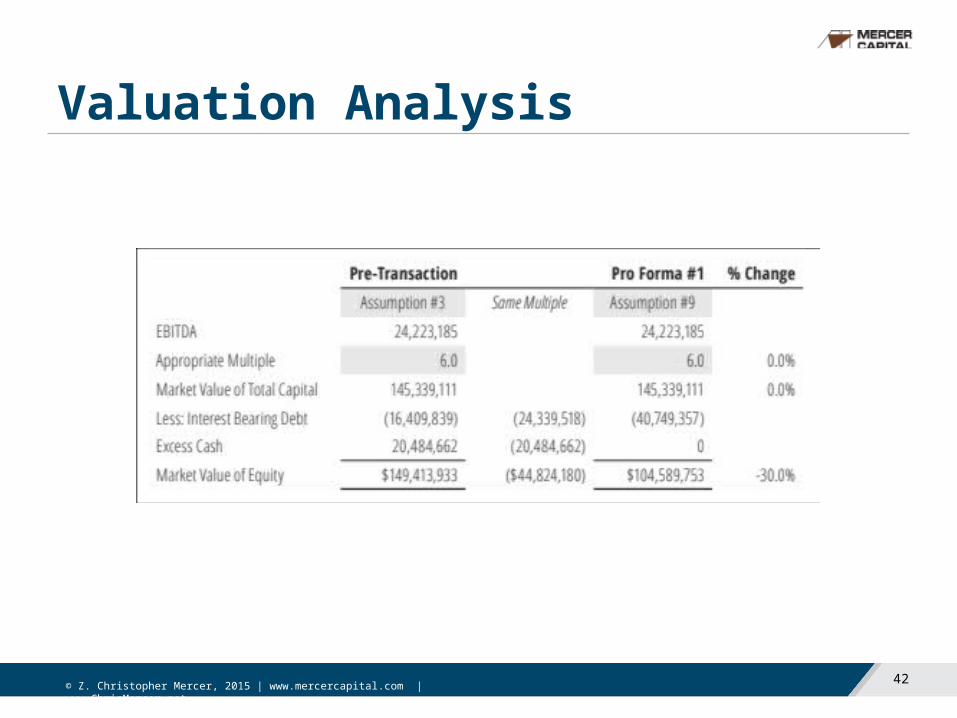
Valuation Analysis
© Z. Christopher Mercer, 2015 | www.mercercapital.com | www.ChrisMercer.net

43
Return Analysis
© Z. Christopher Mercer, 2015 | www.mercercapital.com | www.ChrisMercer.net

44
Benefits to Remaining Owners
© Z. Christopher Mercer, 2015 | www.mercercapital.com | www.ChrisMercer.net

45
Balance Sheet Optimization
© Z. Christopher Mercer, 2015 | www.mercercapital.com | www.ChrisMercer.net

46
Apple Balance SheetApple, Inc (AAPL)in $ millions, except per share data
Balance Sheet Reported Adjusted
Cash & Short Term Investments $41,601 ($41,601) $0Other Current Assets $47,777 $47,777Long Term Investments $164,065 ($164,065) $0Other Long Term Assets $37,036 $37,036Total Assets $290,479 $84,813
Current Liabilities $80,610 $80,610Long Term Debt $53,463 $53,463Other Liabilities $37,051 $37,051Total Liabilities $171,124 $171,124
Total Equity $119,355 ($205,666) ($86,311)Total Liabilities & Shareholders' Equity $290,479 $84,813
Value of Adjustment $205,666Common Shares Outstanding (millions) 5,578.75Special Dividend $36.87
© Z. Christopher Mercer, 2015 | www.mercercapital.com | www.ChrisMercer.net
47
Apple Income Statement
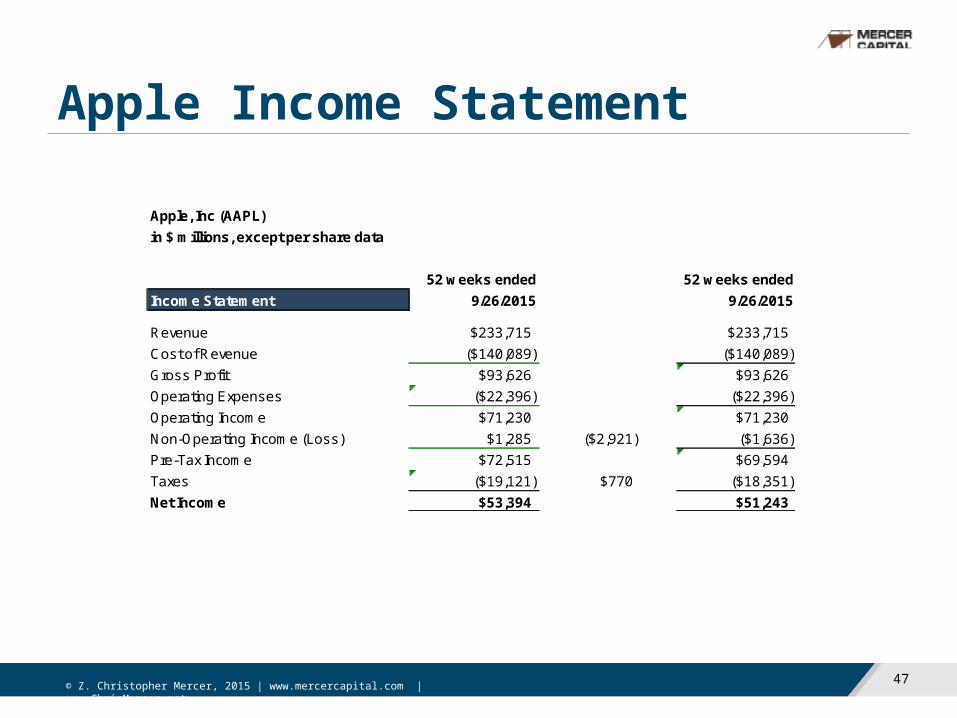
Apple, Inc (AAPL)in $ millions, except per share data
52 weeks ended 52 weeks endedIncome Statement 9/26/2015 9/26/2015
Revenue $233,715 $233,715Cost of Revenue ($140,089) ($140,089)Gross Profit $93,626 $93,626Operating Expenses ($22,396) ($22,396)Operating Income $71,230 $71,230Non-Operating Income (Loss) $1,285 ($2,921) ($1,636)Pre-Tax Income $72,515 $69,594Taxes ($19,121) $770 ($18,351)Net Income $53,394 $51,243
© Z. Christopher Mercer, 2015 | www.mercercapital.com | www.ChrisMercer.net

48
Apple Shareholder Statistics
Shareholder Information Actual AdjustedShares Oustanding (millions) 5578.75 5578.75Price Per Share $114.71 $77.84Earnings per Share $41.89 $41.89Dividends Per Share $1.98 $38.85Book Value Per Share $4.91 $4.91Price/Earnings Multiple 2.74 1.86Price/Book Value 23.34 15.84Dividend Yield 1.73% 49.90%Dividend Payout Ratio 0.05 0.93Return on Equity 44.7% -59.4%
© Z. Christopher Mercer, 2015 | www.mercercapital.com | www.ChrisMercer.net

49
EBITDA Multiple
© Z. Christopher Mercer, 2015 | www.mercercapital.com | www.ChrisMercer.net
50
Public Markets Provide Context for Private Company Valuation
Consider Google (NASDAQ: GOOG). Its price changes every day. Often, there will be observable trends in the price.
We want to buy cheap and sell dear when we invest in public companies
• With private companies, there is no market for shares. Many private companies never obtain a business valuation (or appraisal), and little is known about value
© Z. Christopher Mercer, 2015 | www.mercercapital.com | www.ChrisMercer.net

51
Public Markets Provide Context for Private Company Valuation
With public companies there is a tension between reinvesting in the business for future growth and with returning money to shareholders, either in the form of dividends or stock repurchases or buybacks
• Private company values also change over time, even if no one is watching, i.e., even if there are no appraisals of a business. Private company values are a function of expected cash flows, expected growth, and risk, just like with public companies.
© Z. Christopher Mercer, 2015 | www.mercercapital.com | www.ChrisMercer.net

52
Public Markets Provide Context for Private Company Valuation
Shareholders of public companies have access to enormous amounts of information about each company that provides, at least in concept, sufficient information for investors to make informed investment decisions
• Private companies have virtually no required public disclosure, or even shareholder disclosure. A bank may require that a lending client obtain an annual audit, but that is about the extent of required financial disclosure. Investors in most private companies, sometimes even significant owners, often lack good information about their company’s performance and value
© Z. Christopher Mercer, 2015 | www.mercercapital.com | www.ChrisMercer.net

53
Public Markets Provide Context for Private Company Valuation
Many sets of eyes are looking at most public companies
• Sell-side analysts
• Buy-side analysts
• Analysts at asset management firms
• Technical analysts
• Individual investors as analysts
© Z. Christopher Mercer, 2015 | www.mercercapital.com | www.ChrisMercer.net

54
Public Markets Provide Context for Private Company Valuation
Another result of all of this attention being paid to public companies.
An inherent discipline imposed on public companies to report their financial results and prospects and to run their companies for the benefit of shareholders.
• Private companies have no analysts following them. They provide little or no financial disclosure to shareholders or to anyone else. Bank credit analyst do look at the financial performance over time of significant lending customers of their banks. But that’s about it.
© Z. Christopher Mercer, 2015 | www.mercercapital.com | www.ChrisMercer.net

55
Public Markets Provide Context for Private Company Valuation
Now, let’s take one final look at private companies in the context of this overview discussion of the context of public company pricing and valuation in the public markets
• The value of private companies, like that of public companies, is based on expectations regarding cash flow, growth and risk. Value is always future-based
• There are virtually no external analysts following or even looking at most closely held and family businesses, regardless of their size
• Value changes for private companies over time and with changes in external and internal conditions, even if no one is watching the change
© Z. Christopher Mercer, 2015 | www.mercercapital.com | www.ChrisMercer.net
56
Public Markets Provide Context for Private Company Valuation
We look at the focus on public company valuation for an important reason. When markets are public, there is keen focus on pricing and valuation from many differing viewpoints. When we think about the value of private companies, we will employ a bit of this public market viewpoint.
• Financial disclosure
• Analytical attention
• Value changes over time
The business valuations we do are the first step in applying basic corporate finance and market knowledge to help manage private company wealth.
© Z. Christopher Mercer, 2015 | www.mercercapital.com | www.ChrisMercer.net

57
Discounted Cash Flow Method (DCF)
In theory, the DCF model requires a forecast of expected annual cash flows for every year after the valuation date into the indefinite future. Valuation is a perpetuity concept. The business is expected to continue to generate cash flows into perpetuity.
Algebraically and conceptually, the DCF model looks like this:
© Z. Christopher Mercer, 2015 | www.mercercapital.com | www.ChrisMercer.net

58
The Gordon Model
In a 1962 text, Professor Myron Gordon proved that the DCF equation above could be simplified to the following equation:
Two Key Assumptions
© Z. Christopher Mercer, 2015 | www.mercercapital.com | www.ChrisMercer.net

59
Two-Stage DCF Model
In the two-stage model, the analyst forecasts cash flows for a finite period of years, quite often five years (or three years or ten years). Conceptually, the two-stage DCF model looks like this:
© Z. Christopher Mercer, 2015 | www.mercercapital.com | www.ChrisMercer.net

60
Valuation Basics for Business Owners
© Z. Christopher Mercer, 2015 | www.mercercapital.com | www.ChrisMercer.net

61
(Net) Cash Flow
© Z. Christopher Mercer, 2015 | www.mercercapital.com | www.ChrisMercer.net

62
Growth and Risk Impact Multiples
© Z. Christopher Mercer, 2015 | www.mercercapital.com | www.ChrisMercer.net

63
Growth and Risk Impact MultiplesAssume that the discount rate is 15% and the expected growth rate for the long term is 5%. Doing a little math, we can determine that under these assumptions, the multiple, M, is 10x (i.e., 1 / (15% – 5%))
• Risk impacts the multiple and value. The discount rate, r, has a positive sign in the denominator. That means that if risk goes up, other things being equal, then value goes down. It works the other way as well. If risk goes down, other things being equal, then value will rise.
• Expected growth impacts the multiple and value. The growth rate, g, has a negative sign in the denominator. If the growth rate increases, the denominator gets smaller and the multiple rises. That’s why business appraisers and market participants focus on the outlook for growth when they are valuing companies.
© Z. Christopher Mercer, 2015 | www.mercercapital.com | www.ChrisMercer.net

64
Growth and Risk Impact Multiples
Earnings = Net income, net cash flow, debt free net income / cash flow
Multiple = Build up, ACAPM, equity discount rate (R), WACC
© Z. Christopher Mercer, 2015 | www.mercercapital.com | www.ChrisMercer.net
65
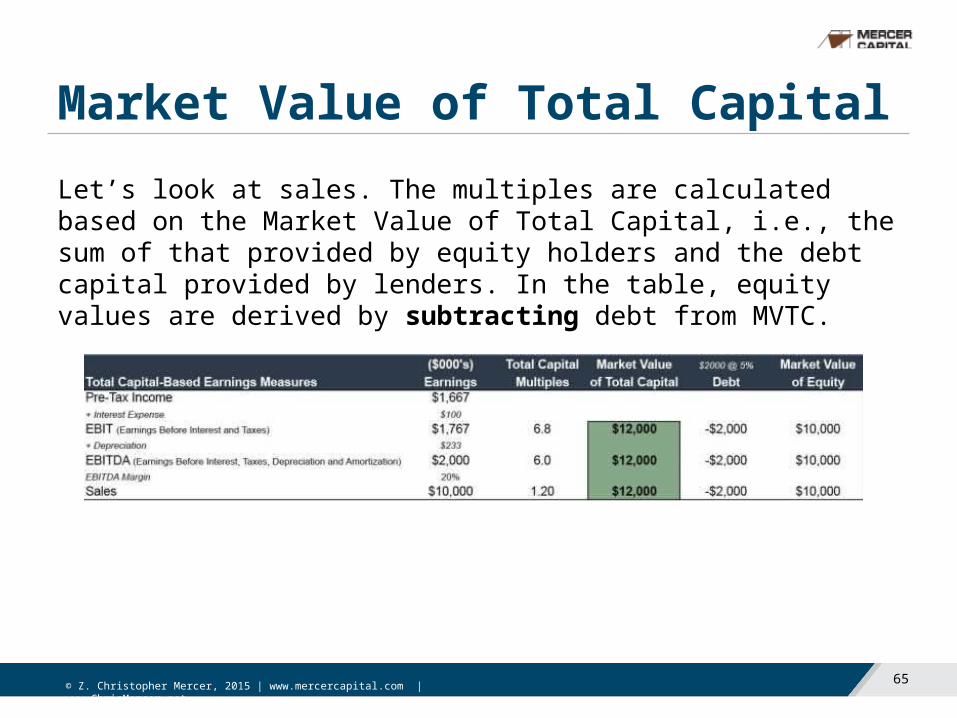
Market Value of Total CapitalLet’s look at sales. The multiples are calculated based on the Market Value of Total Capital, i.e., the sum of that provided by equity holders and the debt capital provided by lenders. In the table, equity values are derived by subtracting debt from MVTC.
© Z. Christopher Mercer, 2015 | www.mercercapital.com | www.ChrisMercer.net

66
Building the Equity Discount Rate
Using the assumptions above, we can show the actual build-up of a discount rate in a table to make clear what we have done.
© Z. Christopher Mercer, 2015 | www.mercercapital.com | www.ChrisMercer.net

67
Developing the Weighted Average Cost of Capital
© Z. Christopher Mercer, 2015 | www.mercercapital.com | www.ChrisMercer.net

68
Using the WACC in Valuation
© Z. Christopher Mercer, 2015 | www.mercercapital.com | www.ChrisMercer.net

69
MVTC, Enterprise Value, and MVEs
© Z. Christopher Mercer, 2015 | www.mercercapital.com | www.ChrisMercer.net
70
Is It Okay to Consider EBITDA?Can we look at EBITDA as an earnings measure to use in developing total capital value indications? Well, yes, and appraisers and market participants do so every day. Two commonly used valuation methods when valuing public (and private) companies are:
• The guideline (comparable) public company method, capitalizing EBITDA (or expected EBITDA) of a private company based on analysis of EBITDA multiples of similar publicly traded entities.
• The guideline transactions method, capitalizing EBITDA of a private company based on analysis of EBITDA multiples found in transactions involving the sale of similar companies.
Then we have the seemingly ubiquitous rules of thumb that, for example, companies in the widget-gadget industry trade in a range of 4.0x to 6.0x EBITDA, or so.
© Z. Christopher Mercer, 2015 | www.mercercapital.com | www.ChrisMercer.net
71
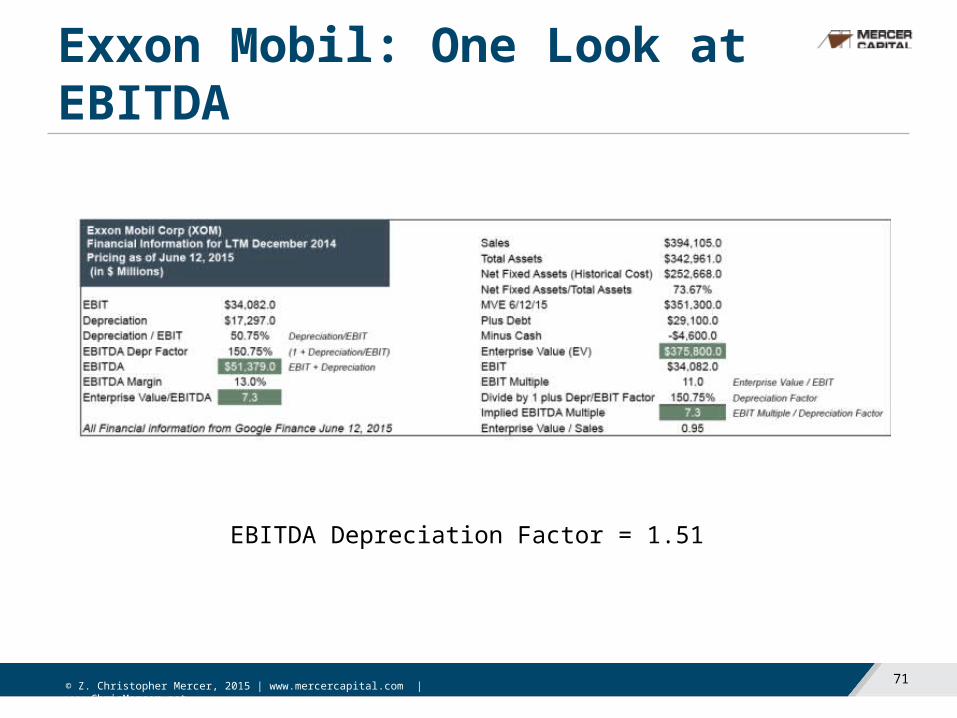
Exxon Mobil: One Look at EBITDA
EBITDA Depreciation Factor = 1.51
© Z. Christopher Mercer, 2015 | www.mercercapital.com | www.ChrisMercer.net

72
Apple: Another Look at EBITDA
EBITDA Depreciation Factor = 1.17
© Z. Christopher Mercer, 2015 | www.mercercapital.com | www.ChrisMercer.net
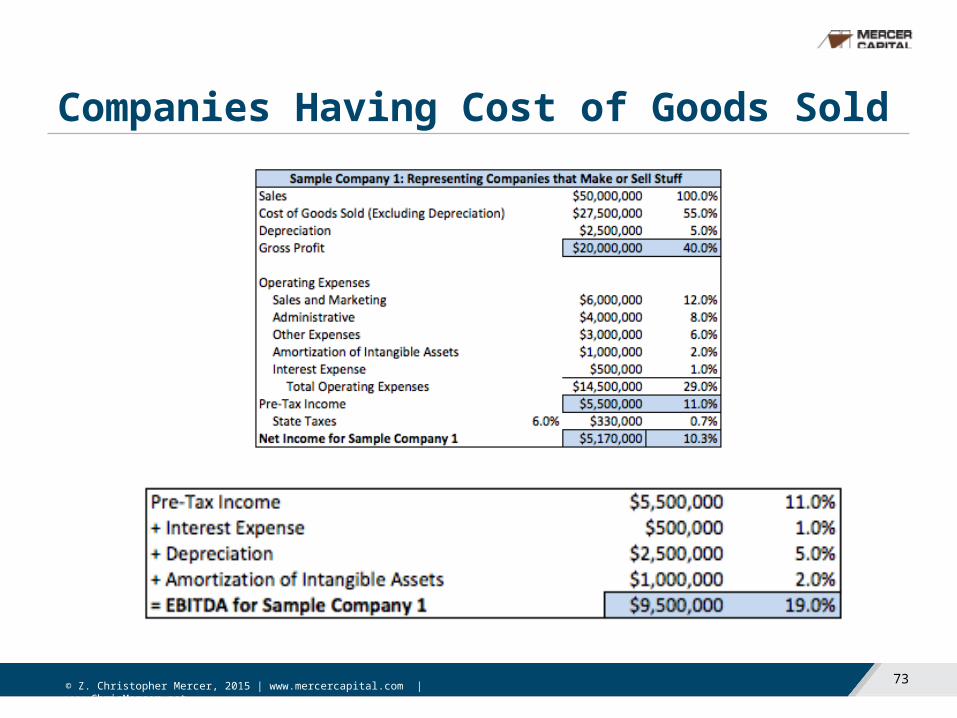
73
Companies Having Cost of Goods Sold
© Z. Christopher Mercer, 2015 | www.mercercapital.com | www.ChrisMercer.net

74
Companies That Deliver Services
© Z. Christopher Mercer, 2015 | www.mercercapital.com | www.ChrisMercer.net

75
What’s the Big Deal with EBITDA?
EBITDA is the topmost level of cash flow that is available (or not) for all of the reinvestments that are necessary to enable businesses to grow and to provide returns for owners.
© Z. Christopher Mercer, 2015 | www.mercercapital.com | www.ChrisMercer.net

76
Debt Free Frequency Before and After Tax
© Z. Christopher Mercer, 2015 | www.mercercapital.com | www.ChrisMercer.net

77
For Every EBIT There is Depreciation
EBITDA Multiple for Exxon = 11.0x / 1.51 = 7.3x
EBITDA Multiple for Apple = 11.1x / 1.17 = 9.5x
© Z. Christopher Mercer, 2015 | www.mercercapital.com | www.ChrisMercer.net

78
Building EBITDA Multiples of Enterprise Value
© Z. Christopher Mercer, 2015 | www.mercercapital.com | www.ChrisMercer.net

79
Key Assumptions of the Analysis
© Z. Christopher Mercer, 2015 | www.mercercapital.com | www.ChrisMercer.net

80
Developing a Range of Implied EBITDA Multiples
© Z. Christopher Mercer, 2015 | www.mercercapital.com | www.ChrisMercer.net

81
Tradeoffs Between Expected Growth and Risk and the Impact on Value
© Z. Christopher Mercer, 2015 | www.mercercapital.com | www.ChrisMercer.net
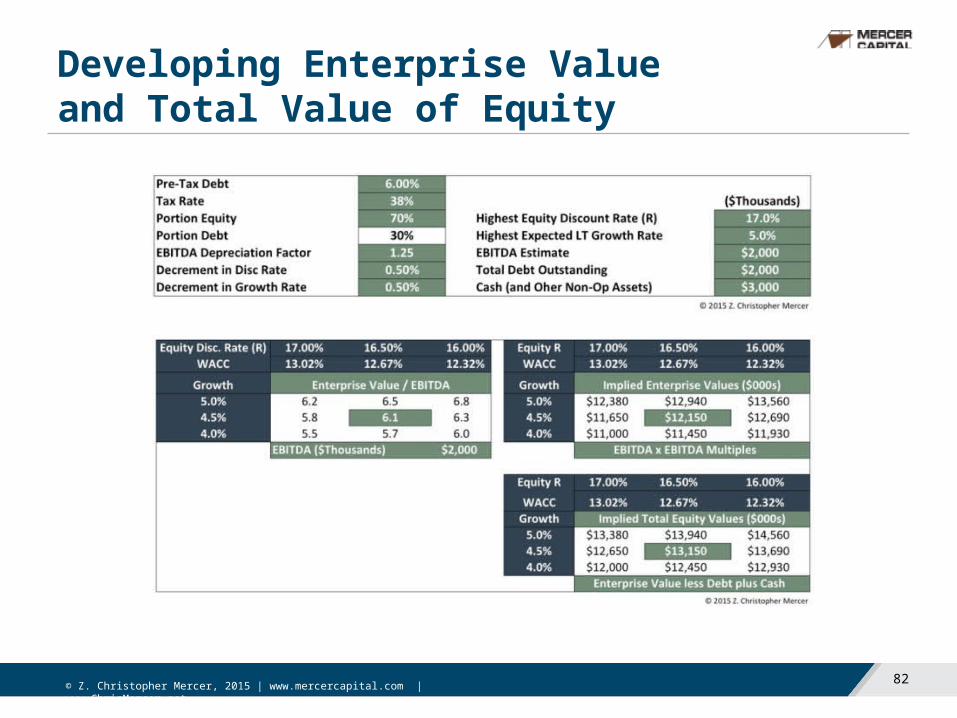
82
Developing Enterprise Value and Total Value of Equity
© Z. Christopher Mercer, 2015 | www.mercercapital.com | www.ChrisMercer.net

83
Relationship between Depreciation and EBIT
Depreciation is a non-cash expense that flows through the income statement in the process of deriving EBIT. Amortization is a similar non-cash expense.
Depreciation in any period is based on the existing stock of depreciable assets on a company’s balance sheet at the beginning of the period.
Amortization in any period is based on the existing stock of amortizable intangible assets on the balance sheet.
There is a relationship between EBITDA and EBIT that can be measured by looking at depreciation (and amortization) as a percentage of EBIT. For simplicity, let’s focus on depreciation. If EBIT is $1.0 million and depreciation is $300 thousand, depreciation expense is 30% of EBIT ($300m / $1,000m). Similarly, if depreciation is $500 thousand with the same EBIT, depreciation is 50% of EBIT.
© Z. Christopher Mercer, 2015 | www.mercercapital.com | www.ChrisMercer.net

84
Relationship between Depreciation and EBIT
Depreciation is a proxy for the need for capital expenditures for a business. If there is a lot of depreciation, chances are there will be a need for significant capital expenditures to maintain the capital stock. If a company is growing, it would not be surprising for capital expenditures to exceed depreciation in a given period, or over time.
The ratio of depreciation to EBIT is a measure of the capital-intensity of a business. The higher the ratio, generally, the higher the level of capital-intensity.
We derive EBITDA by adding the D&A, or depreciation and amortization, to EBIT.
We calculate Depreciation as a percentage of EBIT (Depreciation/EBIT).
We then calculate the EBITDA Depreciation Factor by adding one to the result of the above quotient, or [1 + (Depreciation/EBIT)]
We calculate the EBITDA multiple by dividing the EBITDA Depreciation Factor into the base EBIT multiple derived by building up an EBIT capitalization rate – and multiple – for a particular company.
© Z. Christopher Mercer, 2015 | www.mercercapital.com | www.ChrisMercer.net

85
Perspective on the EBITA Depreciation Factor
Depreciation can be thought of as one proxy for expected capital expenditures. It is not a perfect proxy, of course, but assume that for a company to grow, it must spend at least as much on capital expenditures in a year as the depreciation for that year. In other words, assume that a company’s capital stock is replenished by spending the cash flow created by its non-cash depreciation charges. We know that capex tend to be lumpy, but we can clearly infer something about capital intensity by examining the EBITDA Depreciation Factors.
If one company can spend a lower portion of its EBIT on capital expenditures than another, otherwise identical company, then it warrants a higher EBITDA multiple, since there’s more of EBITDA available for non-capex uses (taxes, additional reinvestment, and dividends or distributions).
© Z. Christopher Mercer, 2015 | www.mercercapital.com | www.ChrisMercer.net

86
Perspective on the EBITA Depreciation Factor
© Z. Christopher Mercer, 2015 | www.mercercapital.com | www.ChrisMercer.net

87
Public Market Perspectives
© Z. Christopher Mercer, 2015 | www.mercercapital.com | www.ChrisMercer.net

88
Private Market Evidence
© Z. Christopher Mercer, 2015 | www.mercercapital.com | www.ChrisMercer.net

89
ESOPs
© Z. Christopher Mercer, 2015 | www.mercercapital.com | www.ChrisMercer.net

90
Why Would You Use an ESOP for Liquidity?
If your company is similar to the kind of businesses described below, then you might want to consider an ESOP for partial (and, perhaps ultimately, total) liquidity for a number of reasons:
A properly structured ESOP can provide liquidity for a portion of an owner’s shares at a reasonable price
You do not sell to outsiders
Transparent financial management is necessary for the ESOP to succeed and for your employees to believe that it is a real benefit
The ESOP may provide time for smooth, internal management transitions
Contributions and distributions to an ESOP are tax-deferred (and ultimately taxable to employee beneficiaries), so a dollar of cash flow received pro rata is a dollar available to pay principal and interest on the ESOP’s debt
Because you didn’t sell to outsiders, the benefit of ESOP debt pay-down is allocated to employees
An ESOP provides a very real benefit for employees, especially for S corporation ESOPs
© Z. Christopher Mercer, 2015 | www.mercercapital.com | www.ChrisMercer.net

91
When Do ESOPs Work Best?Based on our experience in working with ESOPs for more than 30 years and with having an ESOP at Mercer Capital since 2006, ESOPs work best if the following conditions are met:
Companies are consistently profitable and have stable and, preferably, growing earnings
Companies do not require heavy reinvestment in working capital, fixed assets or plant and equipment to grow. Service companies, professional service companies, distribution companies with decent margins, non-cyclical manufacturing business, and others may fit the bill
The owner(s) who desire(s) to sell have an interest in staying with the company for at least a period of years and a smooth management transition plan is in place for the future
The owner(s) desiring to sell do not desire to sell all of their stock so that the ESOP can establish and the company can learn about the ESOP absent the pressure of leverage for 100% of the stock. Note that ESOP transactions of whatever size are usually leveraged 100%. It is just easier for the parties to get comfortable with and prove the concept with smaller transactions at the outset
© Z. Christopher Mercer, 2015 | www.mercercapital.com | www.ChrisMercer.net

92
ESOP Players
1. (Sponsoring) Company
2. ESOP Trust (ESOP)
3. Trustee of the ESOP Trust
4. Selling Shareholder(s)
5. Bank or Other Lender
6. Employee Beneficiaries
7. Plan Administrator
8. Business Appraiser
9. Attorneys
© Z. Christopher Mercer, 2015 | www.mercercapital.com | www.ChrisMercer.net

93
ESOP Process v
© Z. Christopher Mercer, 2015 | www.mercercapital.com | www.ChrisMercer.net
94
Mercer Capital’s ESOP
© Z. Christopher Mercer, 2015 | www.mercercapital.com | www.ChrisMercer.net

95
Questions?
© Z. Christopher Mercer, 2015 | www.mercercapital.com | www.ChrisMercer.net

96
Unlocking Private Company Wealth
ChrisMercer.net/books
Purchase Unlocking Private Company Wealth
When ordering from website, receive a PDF of complimentary resources
• Buy-Sell Agreements for Closely Held and Family Business Owners
• The Buy-Sell Agreement Review Checklist
• Checklist for Shareholder Promissory Notes
1 - 4 books | $25.00 per5 - 24 books | $20.00 per25 - 49 books | $19.00 per50 - 99 books | $18.00 per
100 - 199 books | $16.00 per200 - 499 books | $15.00 per500 - 999 books | $12.50 per1,000+ books | $10.00 per
© Z. Christopher Mercer, 2015 | www.mercercapital.com | www.ChrisMercer.net

97
Z. Christopher Mercer, ASA, CFA, ABAR
www.MercerCapital.comwww.ChrisMercer.netlinkedin/in/zchristophermercer
Mercer Capital5100 Poplar Ave., Suite 2600Memphis, TN 38137
Chris Mercer is the founder and CEO of Mercer Capital, a national business valuation and financial advisory firm.
Chris began his business valuation career in the 1970s and has been involved with hundreds of valuations for purposes related to mergers & acquisitions, litigation, and estate and gift tax planning, among others. He has extensive experience in litigation engagements including statutory fair value cases, business damages, and lost profits. He is also an expert in buy-sell agreement disputes.
Designations held include Accredited Senior Appraiser (ASA) from the American Society of Appraisers, Chartered Financial Analyst (CFA) from the CFA Institute, and Accredited in Business Appraisal Review (ABAR) from the Institute of Business Appraisers.
Chris has written widely on business valuation-related topics and is a frequent speaker on business valuation issues for national professional associations, other business and professional groups, and business owners.
Recent books authored by Chris include Unlocking Private Company Wealth (Peabody Publishing, LP 2014), Buy-Sell Agreements for Closely Held and Family Business Owners (Peabody Publishing, LP 2010) and Business Valuation: An Integrated Theory, 2nd Edition, with Travis W. Harms (John Wiley and Sons 2008).
For a complete list of the books authored by Chris, as well as further information on his valuation-related experience, view his complete CV at www.mercercapital.com.
© Z. Christopher Mercer, 2015 | www.mercercapital.com | www.ChrisMercer.net