Private Client Group - RBC · Private Client Group RBC Dain Rauscher TSX / NYSE: RY ... 2 Morgan...
20
Private Client Group Private Client Group Charley Grose President Private Client Group RBC Dain Rauscher TSX / NYSE: RY Presentation to analysts and institutional investors Toronto - June 18, 2003
Transcript of Private Client Group - RBC · Private Client Group RBC Dain Rauscher TSX / NYSE: RY ... 2 Morgan...

Private Client GroupPrivate Client Group
Charley GrosePresident Private Client GroupRBC Dain Rauscher
TSX / NYSE: RY
Presentation to analysts and institutional investorsToronto - June 18, 2003

2
Who we areWho we are
1,213Raymond James Financial101,322Legg Mason9
1,945**RBC Dain Rauscher85,384A.G. Edwards78,595Edward Jones68,801UBS Paine Webber5
12,000+*Wachovia Securities412,927Salomon Smith Barney313,191Morgan Stanley Dean Witter215,147Merrill Lynch1
Estimated Number of U.S. BrokersCompanyRank
Source: SIA Yearbook (Jan. 2002) *Pending completion of merger with Prudential** Currently 1,850
3
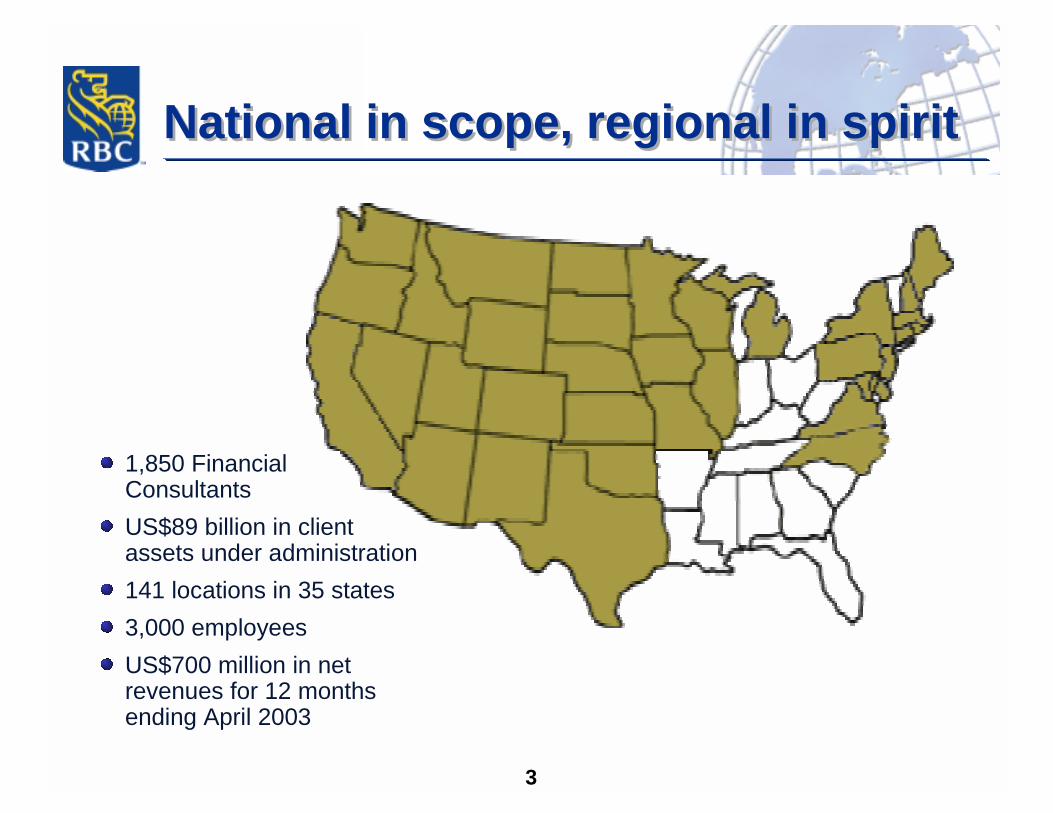
National in scope, regional in spiritNational in scope, regional in spirit
1,850 Financial ConsultantsUS$89 billion in client assets under administration141 locations in 35 states3,000 employeesUS$700 million in net revenues for 12 months ending April 2003

4
Key prioritiesKey priorities
Performance
Execution of strategy
Future profitability

5
PerformanceCost cuttingPerformanceCost cutting
Market values, economic growth and investor activity in declineTactical measures required to maintain profitability
Note: Historical revenues include pro forma Tucker Anthony Sutro results
PCG Quarterly Revenue & Market Trend
$0
$50,000
$100,000
$150,000
$200,000
$250,000
$300,000
$350,000
Q1/
00
Q2/
00
Q3/
00
Q4/
00
Q1/
01
Q2/
01
Q3/
01
Q4/
01
Q1/
02
Q2/
02
Q3/
02
Q4/
02
Q1/
03
Q2/
03
(US$
in th
ousa
nds)
-
200
400
600
800
1,000
1,200
1,400
1,600
PCG NetRevenue
S&P 500(right scale)

6
PerformanceCost cuttingPerformanceCost cutting
225 corporate support job eliminations
down 18% from TAS close to April 2003*92 reduction in force effective April 2003
Retail branch office support staff reduction
194 in past year** 73 in April 2003revenue per branch support employee up 11% from 2001
300,000 ft2 reduction in real estate portfolio
US$10 million in annual rent reductionmajor market projects in process to cut US$2 - $5 million in future rent
Cost containmenthiring and salary freezediscretionary spending
* Pro forma, including Tucker Anthony Sutro** Excludes branch closings

7
PerformanceFuture expensesPerformanceFuture expenses
$44
$30
$14
$0
$70
2002 2003E 2004E 2005E 2006E
(in U
S$ m
illio
ns)
Acquisition retention compensation trend (pre-tax)

8
PerformancePositioned for leveragePerformancePositioned for leverage
($60)
($102)
$Annual Change
$111
$193
Q220011
Platform costs2
Net revenue
in US$ millions
PCG cost takeout impactPCG cost takeout impact
($15)
($26)
$ Change
-13%$96
-13%$167
%Change
Q22003
1 Pro forma including TAS historical results2 PCG costs including Dain corporate support allocations, but excluding FC commissions,settlements, acquisition retention, and parent company allocations

9
Strategy executionStrategy execution
Attract and retain the very best people
Know our clients and meet their needs
Provide excellent service
Grow strategically

10
Enhanced sales productivityReplacing low revenue producing FCs with higher producing FCsIncreased leverage on fixed costs over time
(93)11(104)Net change
4
(24)
28
(144)
51
Total
15
(5)
20
(9)
20> $400k
(11)
(19)
8
(135)
31< $400k
Revenue production per FC
Net change (US$ MM)
Annual revenue departed (US$ MM)
Annual revenue recruited (US$ MM)
Financial Consultants departed
Financial Consultants recruited
Fiscal Q2 Year-to-date Recruiting vs. Attrition Data
Strategy execution1: Attract and retain the best Strategy execution1: Attract and retain the best

11
Attractive compensation levels for highly productive FCs
Compensation fair to the firm
Deferred compensation good for FC and firm
Strategy execution1: Attract and retain the best Strategy execution1: Attract and retain the best

12
Strategy execution2: Meet client needsStrategy execution2: Meet client needs

13
15%
-13%-15%-30%
All Dain
All Participants
Top 25% of Participants
1st Wealth Management ClassChange In revenue(June 2001 – December 2002)
S&P 500 Index
Strategy execution2: Meet client needsStrategy execution2: Meet client needs

14
Fee-based and mutual fund products align FC and client interests
Fixed income partnership+
Diversified product mix smoothes revenue over the cycle
PCG commission revenue mix1
50%33%
15%26%
21%17%
19%6% 6%8%
1998 2002OtherFee-BasedMutual FundsFixed IncomeEquities
1 Excludes net interest, cash and house fee revenue
Strategy execution2: Meet client needsStrategy execution2: Meet client needs

15
2002 survey results
High client satisfaction ratings to Dain and to FCtop 10% of clientsease of doing business with
High ratings from FCswork environment Ease of doing business with
Strategy execution3: Provide excellent serviceStrategy execution3: Provide excellent service

16
Appointed director of servicekey initiatives focus on servicestreamline processes, e.g., account opening
Strategy execution3: Provide excellent serviceStrategy execution3: Provide excellent service

17
Strategy execution3: Provide excellent serviceStrategy execution3: Provide excellent service
Sales leadership in branchesMitigates riskImprove ability to manage business and execute strategy

18
Strategy execution4: Grow strategicallyStrategy execution4: Grow strategically
Leverage RBC’s U.S. platform Focus resources and capital Expand in key markets
CaliforniaTexasNew YorkMassachusetts
Bolt-on acquisitions

19
Future profitabilityFuture profitability
We have materially reduced our cost structureThe platform can be leveragedOne-fourth of PCG’s revenues are fees tied to AUMCustomer leverage is historically low
Estimated Incremental Operating NIAT for RBC
$18$13
$8
$0
$5
$10
$15
$20
$25
10% 20% 30%PCG Revenue Growth vs. Q2 2003
Qua
terly
NIA
T (U
S$)

20
Key takeawaysKey takeaways
Attractive industry positionProactive measures to reduce costs and increase profits in difficult market environmentExecuting strategy for long-term growth and profitabilityPoised for margin expansion upon market recovery


![FIS for the RBC/RBC Handover...4.2.1.1 The RBC/RBC communication shall be established according to the rules of the underlying RBC-RBC Safe Communication Interface [Subset-098]. Further](https://static.fdocuments.in/doc/165x107/5e331307d520b57b5677b3fa/fis-for-the-rbcrbc-handover-4211-the-rbcrbc-communication-shall-be-established.jpg)