Prism Cement Limited
26
Prism Cement Limited Investor Presentation AMONGST INDIA’S LEADING INTEGRATED BUILDING MATERIALS COMPANY www.prismcement.com May’16 1
Transcript of Prism Cement Limited

Prism Cement LimitedInvestor Presentation
AMONGST INDIA’S LEADING INTEGRATED BUILDING MATERIALS COMPANY
www.prismcement.com
May’161

Our Brands
www.prismcement.com
2

Prism Cement
PPC
Champion
Champion Plus
Hi-tech / Duratech
OPC
RMC Readymix
Ready-mixed concrete
Aggregates
Manufactured Sand
H&R Johnson (India)
Tiles (Ceramic, Vitrified, Industrial)
Sanitaryware & Faucets (Bath Fittings)
Modular Kitchens
Construction Chemicals
Engg. Marbles & Quartz
Integrated Building Materials Company
www.prismcement.com 3
36% 39% 39%
23%
23%
13%
2.52
0.670.50
2.30
0.78
0.30
0.00
0.50
1.00
1.50
2.00
2.50
3.00
Cement HRJ RMC
EBITDA Divisional Spilt
Rs bn FY16 Rs bn FY15
Total EBITDAFY16 - `3.74bnFY15- `3.37bn
68% 68%
19% 23% 13% 9%
36% 39% 41% 39%
23% 21%
20.1
22.9
12.6
21.9 22.1
12.0
0.0
5.0
10.0
15.0
20.0
25.0
Cement HRJ RMC
Sales Divisional Split
Rs bn FY16 Rs bn FY15
Total Net SalesFY16 - `55.6bnFY15- `56.0bn
36% 39% 41% 39%23% 21%

Years of Challenges
Years of Consolidation
FY11-14
FY15 &16
Benchmark
EBITDA – `1229/Ton & ROCE – 63% in FY 10
Sales CAGR – 17% (‘03-’12). Conso EBITDA of 14.6% in FY10
Sales CAGR – 39% (‘03-’12). EBITDA of 6.1% in FY11
Cement
TBK
RMC
Blending Silo reconstruction, low capacity utilz, estimated opportunity loss ~`4bn of cash flows
Power & Fuel unavailability in AP(2 Plants) & Karnataka,(40% Capacity). Flat sales in FY13-14. Conso EBITDA 2.2% in FY14
Cautious on Debtors mgmt, lower utilz leading flattish sales during FY13-14 and EBITDA margins came down (2.5% in FY15)
TBK
RMC
Years of Profitable Growth
Cement
Resort to pet coke, imported coal, lower power consumption and lead distance = Better EBITDA/Ton despite reduced realn
Instl 3 Coal Gassifiers in AP, N-gas availability in Karnataka and scaling up of mkting activities - arrested mkt Share loss
Flat sales continued.Closure and relocation of idle plants, increasing sales of value added concrete and cost management.
TBK
RMC
Cement
Prism Cement- Efforts towards re-creating history
www.prismcement.com 4

Infrastructure activities likely to pick up – especially road construction (concretization), railways incl dedicated freight corridors, ports and power
Focus on Housing for all Program. Rural housing likely to see demand growth subject to normal monsoons
Passage of Real Estate Bill might lead to better demand over longer period
Government initiatives on Smart Cities, Swacch Bharat Abhiyan and Make in India
Softening interest rate and benign commodity / fuel prices, although fuel prices seem to be bottoming out
GST likely to benefit overall economy, especially sectors with significant unorganized presence, e.g Tiles and Ready mixed concrete.
Business Environment – expect better demand environment
www.prismcement.com
5

www.prismcement.com

2 Modern Plants in Satna, MP(Central India) with effective capacity of 7mn ton
Superior Capital Employed < ~US$ 38mn/ton
No significant capacities planned in Cluster. Consolidation happening in the cluster
Wide network of ~3790 dealers and ~ 155 stocking points
Launched Premium Cement Duratech and Champion Plus in UP, MP & Bihar
Superior Product Mix – Hi-tech, Duratech and Champion Plus contributed ~6% of totalvolume in FY16 v/s 3% in FY15
Growth plans – Greenfield expansion in Kurnool District, AP. ~3000 acres of land inpossession, limestone reserves secured and environment clearance in place
Current
83%
17%
Trade Non Trade
Cement Overview
www.prismcement.com7
Sales Mix
51%
27%
22%
Eastern UP MP Bihar

Cement – Financial & Operational Highlights
www.prismcement.com 8
Particulars Unit FY16 FY15 FY10
Cement & clinker sales volume Mn Ton 5.29 5.60 2.86Net Sales Rs in bn 20.1 21.9 10.2Net realization incl clinker Rs/Ton 3800 3907 3562
Total cost Rs in bn 17.7 19.7 6.7Total cost Rs/Ton 3356 3518 2347EBITDA incl operating income Rs/Ton 477 410 1229
Freight & forwarding Unit FY16 FY15 FY10Lead Distance Kms 405 399 377Mode MixRailway % 63 64 73Road % 37 36 27
Power and fuel Unit FY16 FY15 FY10Power consumption per ton of cement Kwh 71 73 72Fuel MixPet-Coke % 59 61 0Coal % 41 38 100AFR % 0 2 0Note: Fuel Mix is on Calorific Value

Cement – Realization and Cost Trend
www.prismcement.com
9
2859
3562
31303272
39113784
3907
3800
2036
23472664
3055
3611 36323518 3356
832
1227
501
249
339
173
410
477
0
200
400
600
800
1000
1200
1400
2000
2500
3000
3500
4000
4500
FY09 FY10 FY11 FY12 FY13 FY14 FY15 FY16
` E
BIT
DA
/To
n
Re
aln
–C
ost
`/T
on
Realisation Total cost EBITDA/Ton (Incl Operating Income)

ROCE: 63%…
Subdued Markets
Blending Silo Re-construction
Low Capacity Utilization (Capacity increased from 3 MTPA to 7 MTPA)
New Blending Silo
Pet Coke
Despite reduced realn
Q4FY16 EBITDA / ton at `594
Cement EBITDA/Ton
www.prismcement.com
10
741
1,229
501
249339
173
410477
0
200
400
600
800
1,000
1,200
1,400
2009 2010 2011 2012 2013 2014 2015 2016
In `

www.prismcement.com

Ready mixed concrete is concrete in ready to use form. It is one of themost versatile building material used in construction.
Started in mid-90s : ~10% of total cement used for concrete in India isthrough RMC route (Metros / Tier1 ~35% & Tier2 ~20%) v/s 50-70% indeveloped economies
Industry Structure
Barriers to entry : Location and permission in cities
~60% unorganized. GST implementation would shift market towardsorganized players
RMC to gain further on account of Real Estate Bill being cleared.Benefits such as consistent quality, saving of site space, reduced labour,safety etc
Excise benefit extended to captive site plants in FY16 Budget
RMC Overview
www.prismcement.com
RMC India
88
Aggregate Plants - 7
Concrete Plants -81
12

2nd largest player : pan India presence with 81 Plants in 38 Cities/towns
Backward integration: 7 plants of aggregates & manufactured sand
NABL Accredited Labs
’03-’12 Sales CAGR of 39%. After nearly flattish growth for 4 years, double digit growth expected inthe medium term
Demand drivers – Urbanization & Infrastructure, affordable housing offers growth opportunity
EBITDA margins bottoming out (4% in FY16). Levers for margin improvement
Improvement in capacity utilization (~40% in FY16)
Increase in sales of Value Added products and focus on IHB
Cost management program in place
ROCE to improve (~15% in FY16)
EBITDA margin: 3-7%
Asset turnover: >7x (Capital Employed – ~Rs1.8bn and Sales ~Rs12.6bn)
RMC Readymix (India)
www.prismcement.com
13

Subdued Economy
Extra Cautious on Debtors Management
Capacity Utilization dropped to 40%
RMC EBITDA – Performance
www.prismcement.com
14
Q4FY16 EBITDA @ 5.7%
0.40
0.56 0.56
0.49
0.39
0.30
0.505.9%
6.1%4.9%
2.4%
3.4%2.5%
4.0%
0.0%
1.0%
2.0%
3.0%
4.0%
5.0%
6.0%
7.0%
0.00
0.10
0.20
0.30
0.40
0.50
0.60
2010 2011 2012 2013 2014 2015 2016
EBIT
DA
%
EBIT
DA
`b
n
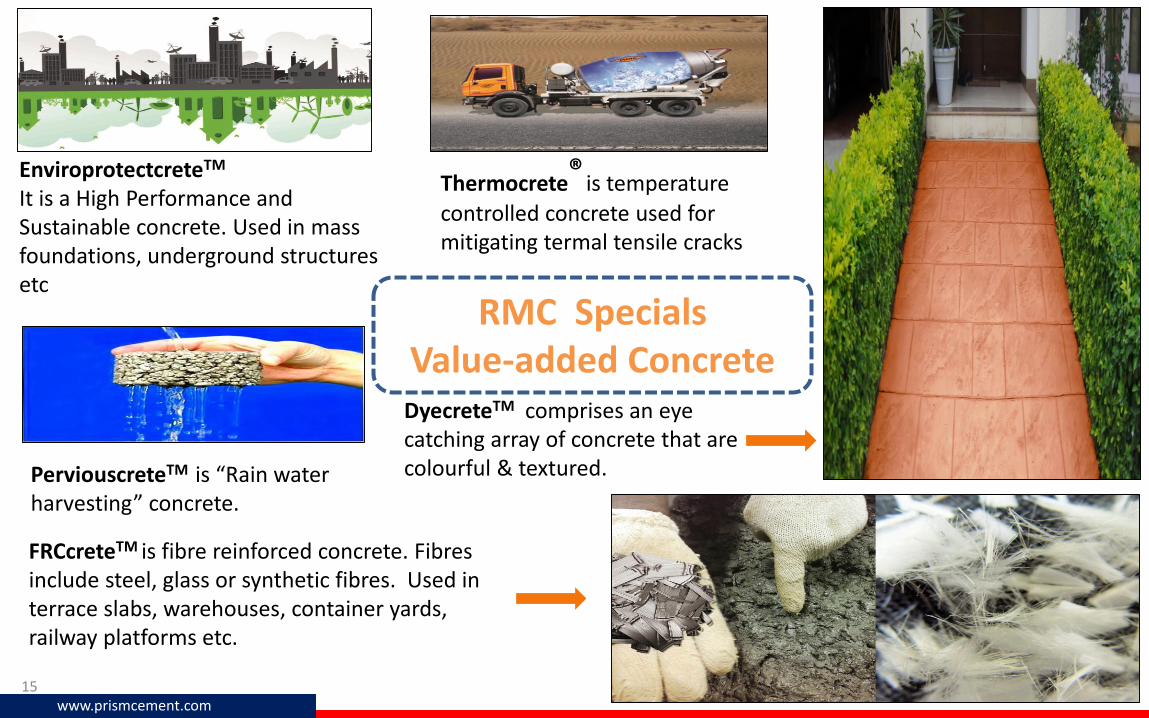
EnviroprotectcreteTM
It is a High Performance and Sustainable concrete. Used in mass foundations, underground structures etc
FRCcreteTM is fibre reinforced concrete. Fibres include steel, glass or synthetic fibres. Used interrace slabs, warehouses, container yards, railway platforms etc.
PerviouscreteTM is “Rain water harvesting” concrete.
DyecreteTM comprises an eye catching array of concrete that are colourful & textured.
Thermocrete®
is temperature
controlled concrete used for mitigating termal tensile cracks
RMC Specials Value-added Concrete
www.prismcement.com15

www.prismcement.com

Set up in 1958, offering wide range of tiles, sanitary ware, bath fittings, modular kitchens and construction chemical
10 Manufacturing plants(Own & JVs) with capacity of ~58mn m2 pa. Asset light business model through six manufacturing JVs contributing 70% of capacity with 4 JVs in Gujarat & 2 JVs in AP
Large national trade network of ~1000 dealers
26 “House of Johnson” chain of retail outlets across India contributing ~9% of Division’s total sales
Complimentary businesses to leverage Brand and Distributions
www.prismcement.com 17
•50% Stake in Ardex Endura—JV with Ardex, Germany
•R&D Driven
•Pioneer in tile fixing adhesives
•Added industrial flooring and waterproofing
•Plants in Bengaluru and Vadodara; Pan India presence
•Sanitaryware , Taps, Bath Fittings, wellness products
•Healthy industry structure; Brand and after sales service play key role
•2 Manufacturing plants for Fittings—Baddi, HP & Samba, J&K
•Sunrise industry
•High growth potential
•Offers complete range of products including installation
•Tie-up with a German company for sourcing
Construction Chemicals Bathrooms Modular Kitchens
TBK Overview

Enjoyed leadership position with ’03 -’12 (Sales CAGR 17%)
FY10 consolidated EBITDA margins of 14.6%
FY11-14, Challenging years as 40% of total capacity in AP and Karnataka suffered on account of power and fuel availability
Addressed Power and fuel issues in South by
Installing 3 coal gassifiers in AP plants and winning bids for onshore micro gas wells
Natural gas pipeline connectivity completed for Karnataka plant
Scaled up marketing activities, distribution channels amongst other
As a result gained market share since Q4 FY14 for ~18 months
Margin / Market share recovery expected going forward
Gas price reduction
Antidumping duty on vitrified tiles
Product mix improvement
Sales team to generate demand for dealers through strong influencer connect
Operating leverage as capacity utilization levels go up
www.prismcement.com
18
On recovery path…

www.prismcement.com
19
TBK EBITDA - Performance
1.76
1.56
1.18
0.89
0.45
0.780.67
14.6%
10.3%
6.7%
4.7%
2.2%3.3% 2.9%
0.0%
2.0%
4.0%
6.0%
8.0%
10.0%
12.0%
14.0%
16.0%
0.00
0.20
0.40
0.60
0.80
1.00
1.20
1.40
1.60
1.80
2.00
2010 2011 2012 2013 2014 2015 2016
EBIT
DA
%
EBIT
DA
` b
n

JV with QBE Group of Australia
Focus on speciality products like liability insurance, marine liability and trade credit
Strategic sale of 23% stake to existing partner for AUS$ 21.6mn
Prism’s investment : 51% stake at book value of `1.05bn
FY16 financials:
Gross written premium : `0.37bn
Profit before tax: `0.15bn
Strategic Investment – Raheja QBE General Insurance
www.prismcement.com
20

Mr. Vijay Aggarwal, Managing Director
B. Tech (Elec.) from IIT, Delhi and PGDM from IIM,Ahmedabad
Tenure in Company: 22 years
Past experience includes SBI Capital Markets
On the Board of various companies including ExideIndustries, Exide Life Insurance Co, Aptech, Asianet SatelliteCommunications, Ardex Endura (India), Raheja QBE GeneralInsurance Co
21
Management Profile
www.prismcement.com

Mr. Venugopal M Panicker, Executive Director & CEO – RMC
Chartered Accountant, Company Secretary and a Member of the Institute of CompanySecretaries & Administrators, UK (AICSA-UK)
Tenure in Company: 19 years
Past experience includes Walchandnagar and Tatas
22
Management Profile
Mr. Vivek K. Agnihotri, Executive Director & CEO - Cement
M.B.A. from F.M.S., University of Delhi
Tenure in Company: 10 months
Past experience includes Ambuja Cements and ACC
Mr. Joydeep Mukherjee, Executive Director & CEO - HRJ
PGDM in Marketing Management, IGNOU, Kolkata and EMIB - International Business andMarketing from IIFT, New Delhi.
Tenure in Company: 6 months
Past experience includes ACC and Hindalco
www.prismcement.com

23
Management Profile
Mr. Pramod Akhramka , CFO
Cost and Works Accountant, Chartered Accountant, Company Secretary and ExecutiveManagement courses
Tenure in Company: 2 Years
Past experience includes Ashok Piramal Group and Vaibhav Global Group
Mrs. Aneeta Kulkarni – Company Secretary
Company Secretary, LLB, PGDAM (NMIMS) and FIII (Fellow of Insurance Institute of India)
Tenure in Company: 21 years
Past experience includes New India Assurance, Thirumalai Chemicals and VijayshreeChemicals
Mr. Rajnish Sacheti, Group President Legal & Indirect Taxes
Company Secretary
Tenure in Company: 18 years
Past experience includes Grasim Industries
www.prismcement.com

Borrowings as on 31st March’16
Net consolidated `20.7bn, down by ~`0.9bn
Net standalone `17.5bn, down by ~`0.7bn
Average cost of Standalone debt: 10.75%
Focus on de-leveraging
www.prismcement.com
24

Shareholding Pattern as on 31st Mar’16
www.prismcement.com
Promoters, 74.9%
Foreign Inst, 6.4%
Domestic Inst, 9.6%
Non Inst, 9.1%
Shareholder %
HDFC Trustee Company Ltd - HDFC Equity Fund 3.5
Morgan Stanley Asia (Singapore) PTE 2.1
National Westminster Bank Plc as Trustee of the Jupiter India Fund 1.3
Goldman Sachs India Fund 1.2
ICICI Prudential Value Discovery Fund 1.0
Public category holding over 1% of total shares
25

www.prismcement.com
26
THANK YOUFor further information, please contact:
Munzal [email protected]
+91 22 6675 4142-46
Disclaimer Cautionary statement regarding forward – looking statementsThis presentation may contain certain forward – looking statements relating to the future business,development and economic performance.Such statements may be subject to a number of risks, uncertainties and other important factors, such asbut not limited to (1) competitive pressures; (2) legislative and regulatory developments; (3) global,macroeconomic and political trends; (4) fluctuations in currency exchange rates and general financialmarket conditions; (5) delay or inability in obtaining approvals from authorities; (6) technical developments;(7) litigations; (8) adverse publicity and news coverage, which could cause actual development and resultsto differ materially from the statements made in this presentation. Prism Cement Limited assumes noobligation to update or alter forward – looking statements whether as a result of new information, futureevents or otherwise.