Prioritizing NAMA Options and Developing NAMAs in …asialeds.org/sites/default/files/1....
20
Training Session : Prioritizing and Developing Nationally Appropriate Mitigation Actions (NAMAs) in Agriculture Janie Rioux and Armine Avagyan Food and Agriculture Organization Asia LEDS Partnership: Mobilizing Investment for low-emission development in Asia’s agricultural sector October 28-20, 2015, Ho Chi Ming City, Vietnam
Transcript of Prioritizing NAMA Options and Developing NAMAs in …asialeds.org/sites/default/files/1....
Training Session: Prioritizing and Developing Nationally Appropriate
Mitigation Actions (NAMAs) in Agriculture
Janie Rioux and Armine AvagyanFood and Agriculture Organization
Asia LEDS Partnership: Mobilizing Investment for low-emission development in Asia’s agricultural sectorOctober 28-20, 2015, Ho Chi Ming City, Vietnam

Training Objectives
1. Prioritize mitigation actions for NAMAs in different sub-sectors of agriculture in Asia
2. Evaluate the barriers to NAMAs implementation and incentives for transformational change
3. Identify indicators for monitoring GHG and non GHG benefits of NAMAs

Training Structure
Overview presentation Case-study Philippines: MRV and financing scheme of NAMA
for improved rice irrigation with the use of AWDSpeakers: Eng. Sibayan and Mr. Vladislav, PhilRice
WG1: Identify NAMA interventions and incentives in crop production and processing
WG2: MRV for GHG and non GHG benefits for NAMAs in crop production and processing
Discussion on further application and NAMA learning support

GHG emissions from agriculture in Asia
Data source: FAOSTAT
Presenter
Presentation Notes
Emissions from energy use in agriculture added another 408 million tonnes CO2 eq/year The data include emissions from fossil fuel energy needed to power machinery, irrigation pumps and fishing vessels.408 million tonnes eq/year

The largest emitters in agriculture in Asia
Data source: FAOSTAT
• Emissions from energy use in agriculture added another 408 million tonnes CO2 eq/year

Nationally Appropriate Mitigation Actions (NAMAs)
In line with national
development strategies
High potential for GHG
emissions reduction
Potential totransform the
system
Providedevelopmentco-benefits
NAMAs
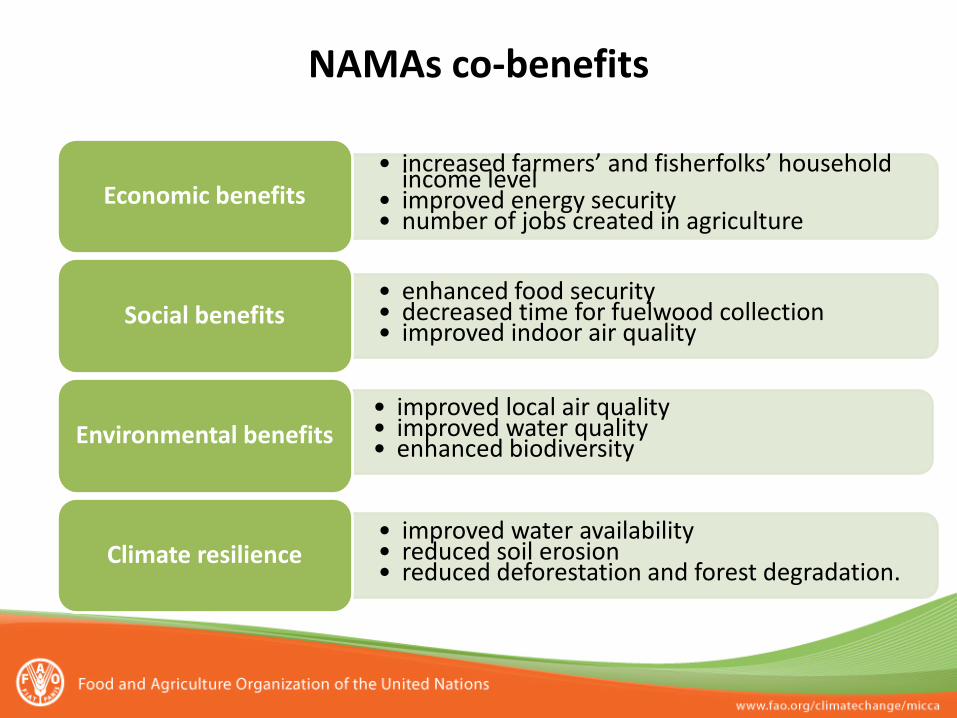
NAMAs co-benefits
• increased farmers’ and fisherfolks’ household income level• improved energy security• number of jobs created in agriculture
Economic benefits
• enhanced food security• decreased time for fuelwood collection • improved indoor air quality
Social benefits
• improved local air quality• improved water quality• enhanced biodiversityEnvironmental benefits
• improved water availability• reduced soil erosion• reduced deforestation and forest degradation.
Climate resilience
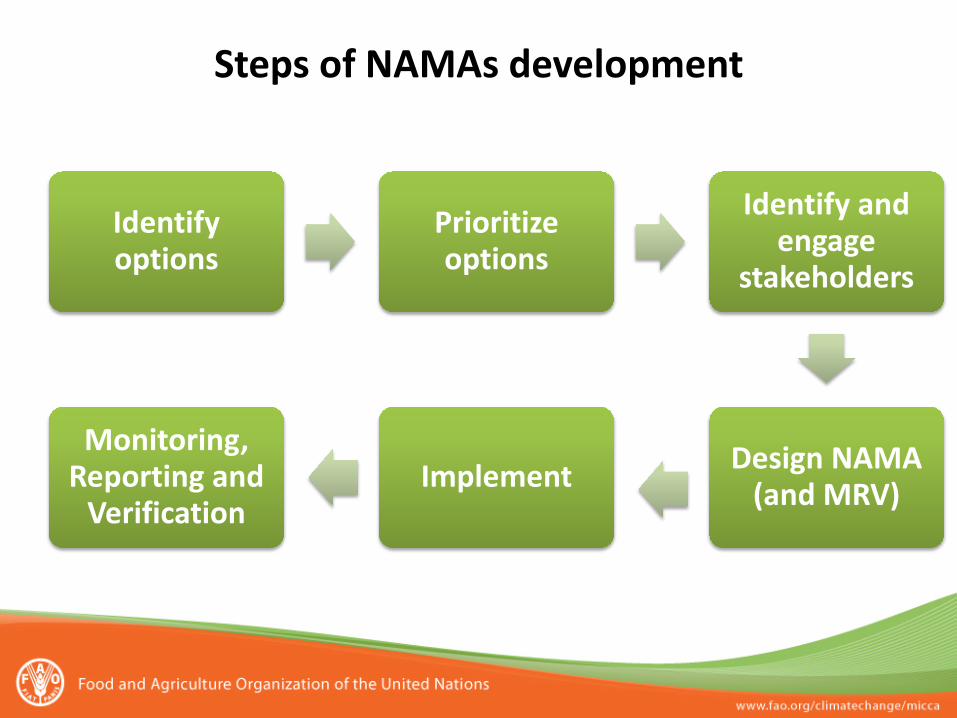
Steps of NAMAs development
Identifyoptions
Prioritizeoptions
Identify and engage
stakeholders
Design NAMA (and MRV)Implement
Monitoring, Reporting and
Verification

Measurement, Reporting and Verification (MRV)
Measurement/monitoring activities and collecting data on GHG fluxes and on non-GHG impacts, as well as on financial flows and overall implementation progress.
Reporting in a transparent manner and sharing information on the NAMA’s impacts on GHG fluxes and non-GHG, its support for national development, and its financial status by providing background data, data sources and methodologies applied for data quantification.
Verifying the completeness, consistency and reliability of the reported information through an independent process.
The objective of MRV is to assess the progress of a NAMA towards its mitigationand national development goals.

FAOSTAT providing country level data on GHG emissions and projections
=
FAOSTAT, FRA & geo-referenced data
+IPCC 2006 Guidelines
http://faostat3.fao.org
Presenter
Presentation Notes
FAOSTAT emissions database for AFOLU covering 1961-2012 (agriculture) and 1990-2012 (Forestry and Other Land Use) for almost 200 countries using IPCC Tier 1 methodology

FAOSTAT Emissions DatabaseDOMAIN CATEGORY GAS ACTIVITY
DATA
Em
issi
ons -
Agr
icul
ture
Enteric Fermentation CH4 FAOSTAT
Manure Management CH4, N2O
FAOSTAT
Rice Cultivation CH4 FAOSTAT
Agr
icul
tura
lsoi
ls
Synthetic Fertilizers N2O FAOSTAT
Manure applied to soils N2O FAOSTAT
Manure left on pasture N2O FAOSTAT
Crop residues N2O FAOSTAT
Cultivated organicsoils N2O
HWSD, GLC2000,
GLW
Burning - Savanna CH4, N2O
GFED4, CZ, GEZ
Burning – Crop residues
CH4, N2O
FAOSTAT
DOMAIN CATEGORY GAS ACTIVITYDATA
Em
issi
ons -
Lan
d U
se Forest land CO2 FRA
Cropland CO2HWSD,
GLC2000
Grassland CO2
HWSD, GLC2000,
GLW
Burning BiomassCH4, N2O, CO2
GFED4,HWSD,
CZ, GEZ
HWSD – FAO-IIASA-ISRIC Harmonized World Soil DatabaseGLC2000 – EU-JRC Global Land Cover 2000GLW – FAO Gridded Livestock of the WorldGFED4 – Global Fire Emissions Database v.4CZ – JRC Climate ZoneGEZ – FAO Global Ecological ZonesFRA – FAO Forest Resources Assessment
Presenter
Presentation Notes
Burning savanna – burnt savanna area and used JRC for climatic information Burning biomass – for organic (GFED4 for total burnt area + HWSD for organic soils), for forest (GFED4 total forest area burnt + FRA-GEZ to diferentiate forests)
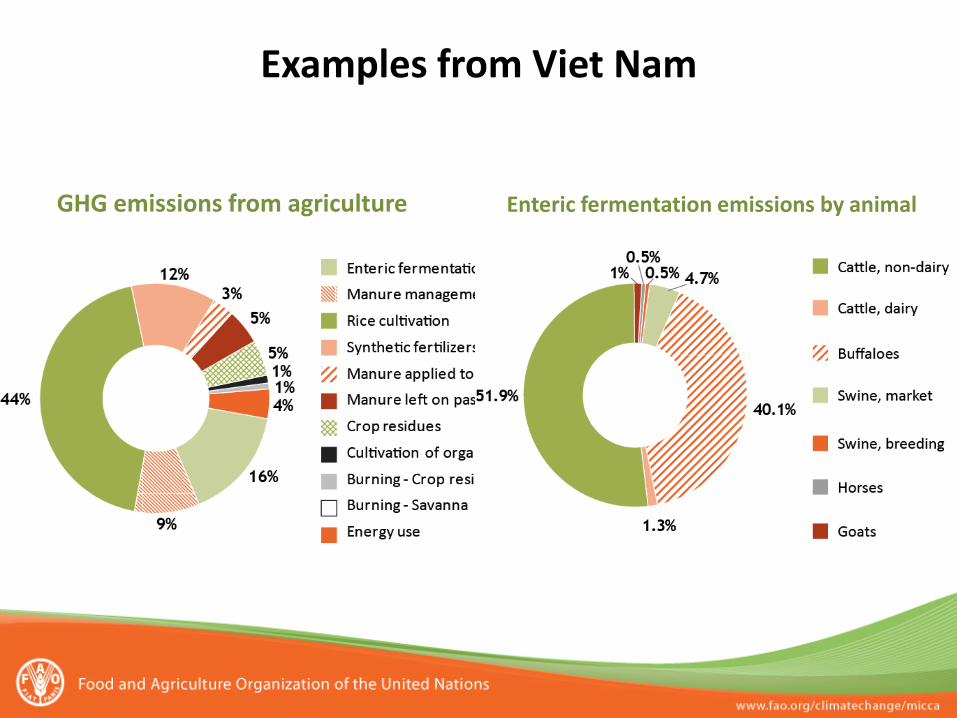
Examples from Viet Nam
GHG emissions from agriculture Enteric fermentation emissions by animal

Examples from Viet Nam
GHG emissions projections from rice cultivation
GHG emissions projections from enteric fermentation

FAOSTAT Emissions Database on YouTube
English: https://www.youtube.com/watch?v=QcxEpL7DnWA

The Manual provides member countries with a guidance to identify, build and access a minimum set of data to complete a National GHG Inventory for agriculture and land use, following the default Tier 1 method of the 2006 IPCC Guidelines for national Inventories
Manual to address data requirements for developing countries
www.fao.org/3/a-i4260e.pdf

E-learning Course Building a national greenhouse gas inventory for Agriculture,
Forestry and Other Land Use
• Guide the user through the preparation of a tier 1 national GHG inventory for the Agriculture, Forestry and Other Land use (AFOLU) sector following 2006 IPCC Guidelines.
• Provide a general introduction to the national GHG inventory (NGHGI) and on its context in the UNFCCC reporting framework.
• Introduce some FAO products that could support countries to improve the NGHGI.
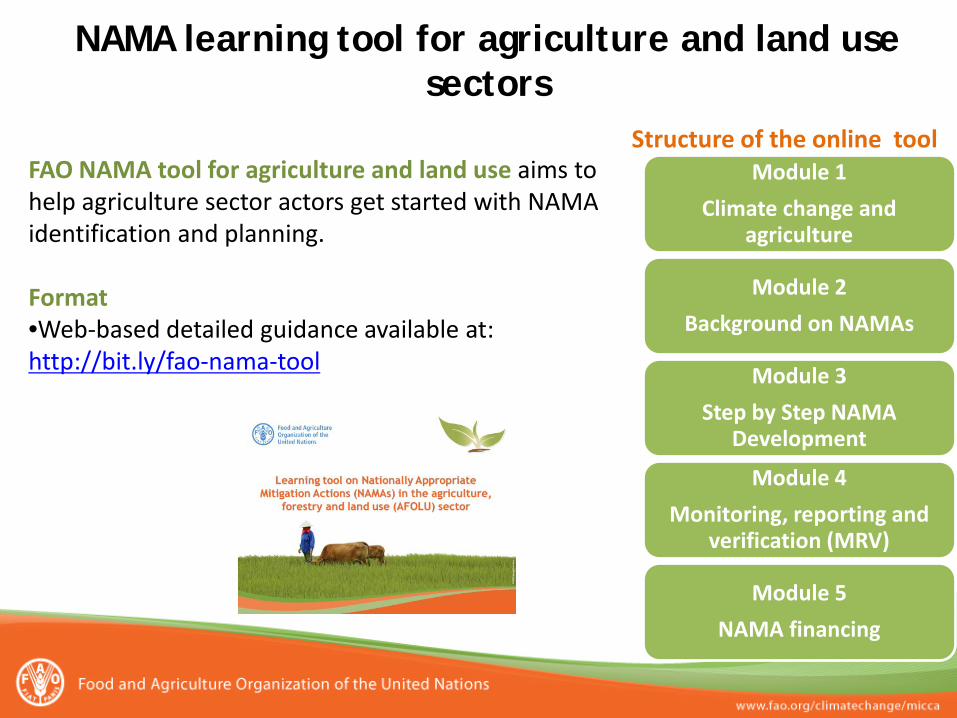
NAMA learning tool for agriculture and land use sectors
Module 1Climate change and
agriculture
Module 2Background on NAMAs
Module 3Step by Step NAMA
Development
Module 4Monitoring, reporting and
verification (MRV)
Module 5NAMA financing
Structure of the online toolFAO NAMA tool for agriculture and land use aims to help agriculture sector actors get started with NAMA identification and planning.
Format •Web-based detailed guidance available at: http://bit.ly/fao-nama-tool

Questions
Is there NAMAs in agriculture being developed in your country?
What are the main crop production and processing sectors (commodities)?

Exercise 1: Prioritization of mitigation options
Task: For one of the crop production and processing sectors (e.g. rice cultivation, palm oil production, coffee cultivation-or as selected by the working groups) identify and prioritize mitigation interventions.( For GHG reduction and economic profitability potential, evaluate from 1-5, 1= low, 5= high)
Crop production
and processing
sector
GHG reduction potential
Economic profitability
Co-benefits: food security,
adaptation, etc.
Barriers and incentives for
scaling up

Exercise 2: Monitoring plan
Actions Monitoring Gaps in data Challenges
Indicators Frequency
Responsible
Task: For each of the NAMA ideas prepare a draft MRV plan with the indicators, methods, frequency and responsible entities for the monitoring plan. Also indicate the frequency and responsible entities for reporting and verification. Identify also gaps in data, and institutional challenges.