An Approach to Track Maintenance Prioritization for Urban Rail Transit - r1
1
Advisory Panel Meeting
PRIORITIZATION
OF PROMINENT
ROAD-RAIL CONFLICTS
May 23, 2016

2
• Welcome & Introductions
• Agenda Overview
• Project Overview
• Existing Materials & Database
• Key Questions & Issues
• Next Meeting
• Roundtable Comments
• Adjourn
MEETING AGENDA
3
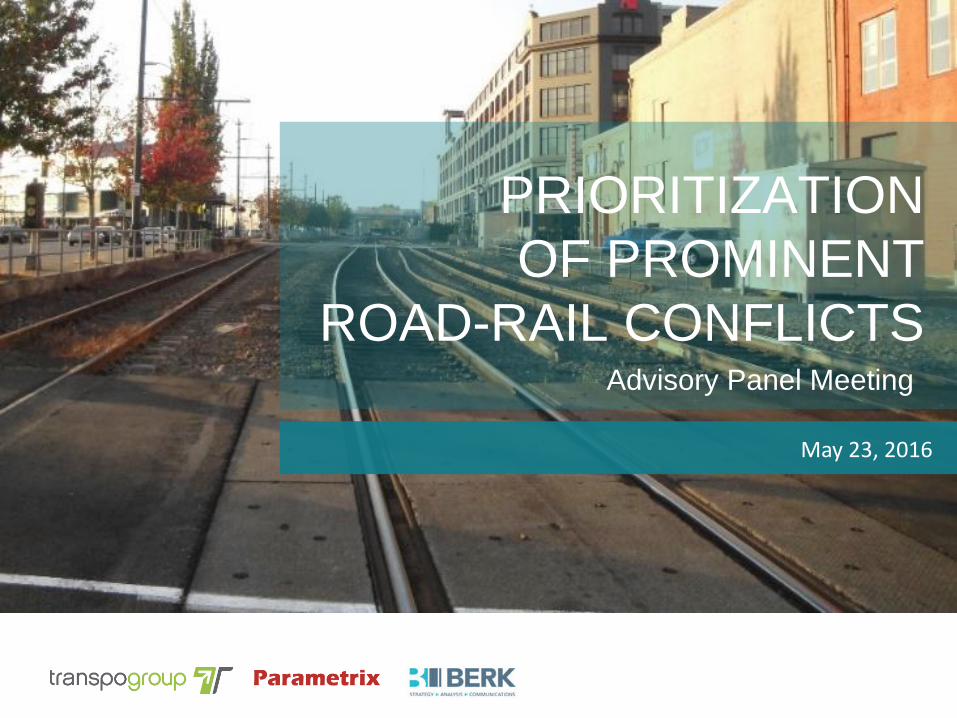
1. Beth Redfield, JTC, Project
Manager
2. Mary Fleckenstein, JTC
3. Dave Catterson, AWC
4. Alison Hellberg, AWC
5. Gary Rowe, WSAC
6. Jason Lewis, UTC
7. Amanda Cecil, UTC
8. Sean Ardussi, PSRC
9. Elizabeth Robbins, WSDOT
Planning
10. Faris Al-Memar, WSDOT
Planning
11. Chris Herman, WSDOT
Freight Systems
12. Steven Ogle, Ecology
13. Hayley Gamble, STC
14. Paul Ingiosi, HTC
15. Kathy Cody, OFM
16. Jackson Maynard, SRC
17. Sharon Swanson, SDC
18. Debbie Driver, HDC
19. Dana Quam, HRC
ROSTERS AND ROLES
ADVISORY PANEL
1. Paul Roberts, City of Everett, AWC
2. Sean Guard, City of Washougal, AWC
3. Lisa Janicki, Skagit County, WSAC
4. Al French, Spokane County, WSAC
5. Kevin Murphy, Skagit COG
6. Ashley Probart, FMSIB
7. Dave Danner, UTC
8. James Thompson, WPPA
9. Ron Pate, WSDOT
10. Johan Hellman, BNSF
STAFF WORK GROUP

4
WHAT IS THE PROJECT?
The Project IS:
• Unified Database of Crossings
• Development of a Prioritization Process Framework
• Commodity Neutral
The Project IS NOT:
• Development and Ranking of a Project List
• Funding Request
5
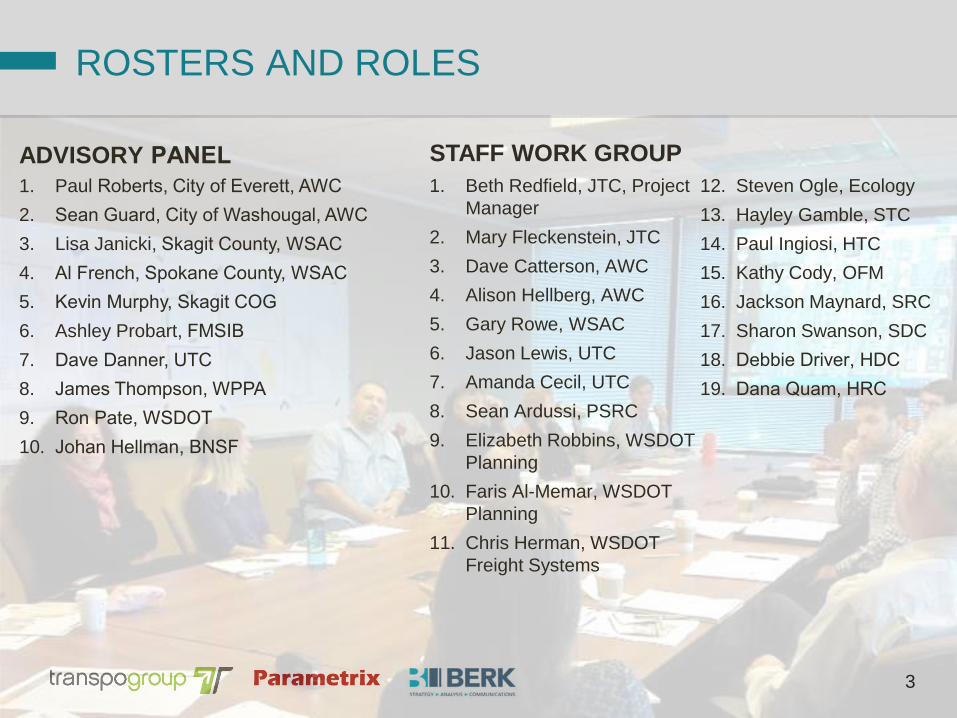
WHAT ARE ROAD-RAIL CONFLICTS?
Locations where rail lines and
roadways intersect
Example Types of Conflicts:
• Collisions between trains and vehicles/pedestrians
• Long and unpredictable travel delays for both the general
public and freight users
• Temporary impacts to emergency vehicle routing

6
PROJECT OBJECTIVES
• Understand Current and
Future Mobility, Community
Impacts, and Safety Problems
• Understand and Apply
State, Local, and Private Policy
Interests
• Develop a Criteria-Based
Prioritization Process

77
SCHEDULE
8
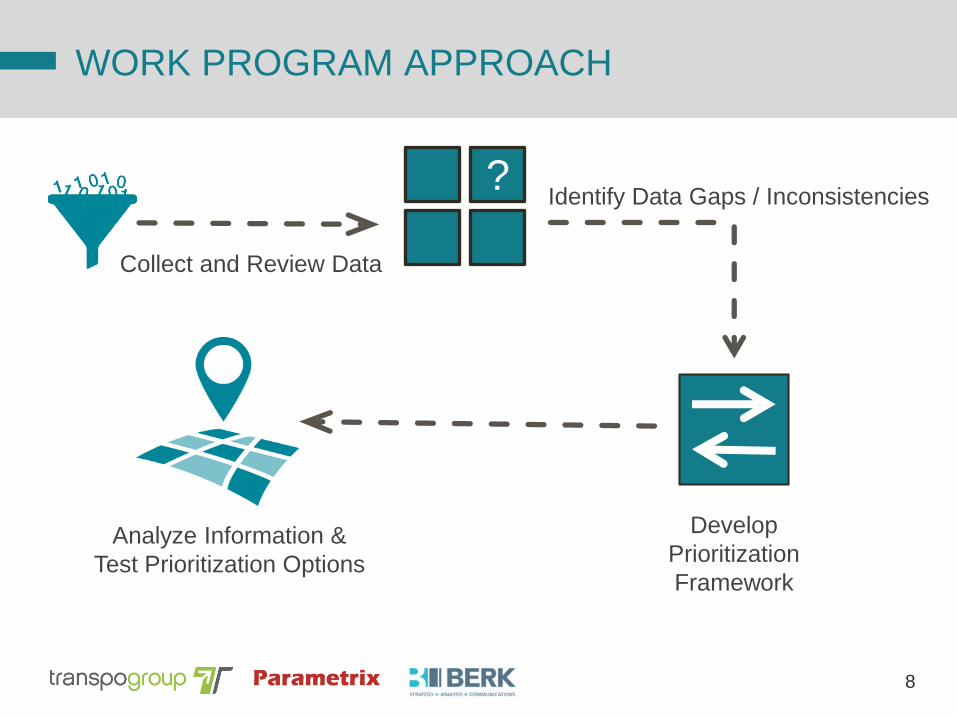
WORK PROGRAM APPROACH
Collect and Review Data
Identify Data Gaps / Inconsistencies
Develop
Prioritization
Framework
Analyze Information &
Test Prioritization Options
?
9
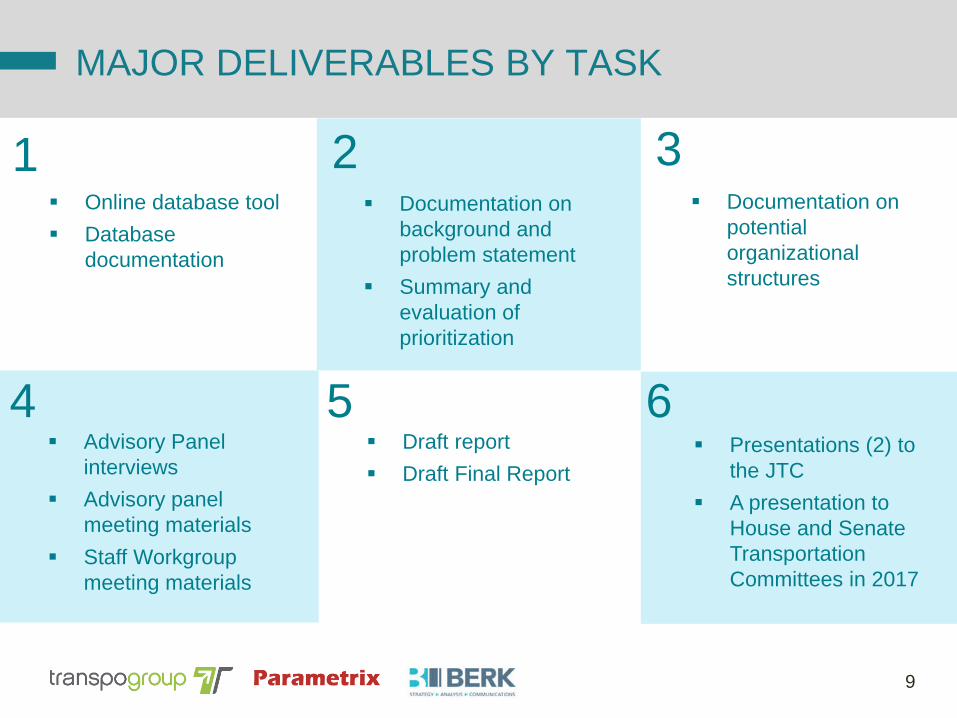
1 Online database tool
Database
documentation
MAJOR DELIVERABLES BY TASK
Documentation on
background and
problem statement
Summary and
evaluation of
prioritization
Documentation on
potential
organizational
structures
Presentations (2) to
the JTC
A presentation to
House and Senate
Transportation
Committees in 2017
Draft report
Draft Final Report
Advisory Panel
interviews
Advisory panel
meeting materials
Staff Workgroup
meeting materials
2 3
4 5 6

10
ALIGN DATABASE TO PROJECT GOALS
Understand Current and
Future Mobility,
Community Impacts, and
Safety Problems
Develop a Criteria-Based
Prioritization Process
Understand & Apply State,
Local, and Private Policy
Interests
Project Goal Strategy
Collect and Review Data• Develop database
• Prepare mapping tool
Classify, Weight,
Score, & Display• Determine appropriate inputs & scoring
• Publish results to web map for all to
view & comment
Filter Priorities by Interests• Apply local, state, & private criteria
• Provide web platform for local
discussions

11
TYPICAL DATA
LIMITATIONS
• Not readily available
• Outdated data
• Inconsistent sourcing and not available for all crossings
• Real-world fluctuations not reflected in data
DATA SOURCES
RTPOs/MPOs
Cities/Counties
Pacific Northwest
Marine Cargo Forecast
12
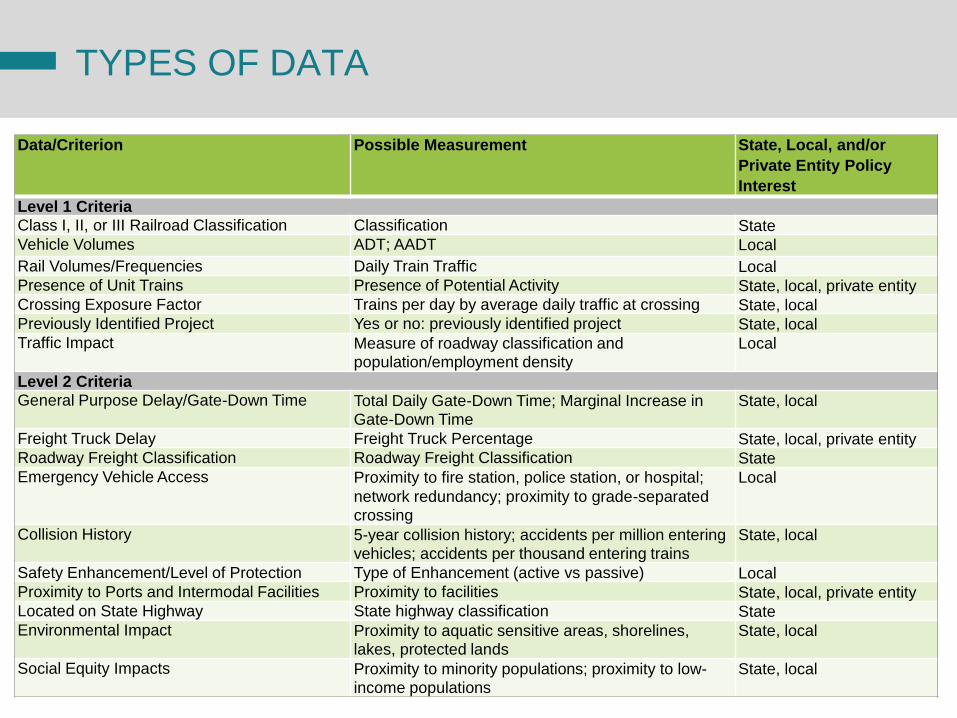
TYPES OF DATA
Data/Criterion Possible Measurement State, Local, and/or
Private Entity Policy
Interest
Level 1 CriteriaClass I, II, or III Railroad Classification Classification StateVehicle Volumes ADT; AADT Local
Rail Volumes/Frequencies Daily Train Traffic LocalPresence of Unit Trains Presence of Potential Activity State, local, private entityCrossing Exposure Factor Trains per day by average daily traffic at crossing State, localPreviously Identified Project Yes or no: previously identified project State, localTraffic Impact Measure of roadway classification and
population/employment densityLocal
Level 2 Criteria General Purpose Delay/Gate-Down Time Total Daily Gate-Down Time; Marginal Increase in
Gate-Down TimeState, local
Freight Truck Delay Freight Truck Percentage State, local, private entityRoadway Freight Classification Roadway Freight Classification StateEmergency Vehicle Access Proximity to fire station, police station, or hospital;
network redundancy; proximity to grade-separated crossing
Local
Collision History 5-year collision history; accidents per million entering vehicles; accidents per thousand entering trains
State, local
Safety Enhancement/Level of Protection Type of Enhancement (active vs passive) LocalProximity to Ports and Intermodal Facilities Proximity to facilities State, local, private entityLocated on State Highway State highway classification StateEnvironmental Impact Proximity to aquatic sensitive areas, shorelines,
lakes, protected landsState, local
Social Equity Impacts Proximity to minority populations; proximity to low-income populations
State, local

13
USDOT
Crossing
Number
City Railroad
Class
Vehicle
Volume
Train
Volume
Gate-
down
Time
(mins)
Freight
Class
Unit
Train
Previously
Identified
Crossing
XXXXXX Seattle I 50,000 30 240 T1 Y Y
XXXXXX Tacoma I 26,000 28 200 T4 Y N
XXXXXX Spokane I 16,000 30 145 T3 N Y
XXXXXX Ellensburg III 8,000 24 120 T2 Y N
XXXXXX Yakima I 6,500 20 120 T5 Y N
PROPOSED DATABASE STRUCTURE
At-
Gra
de C
ros
sin
gs
Data/Information for Each Crossing
DATABASE IS AN
EXCEL
SPREADSHEET
Locational information
(latitude/longitude)
used to link to ESRI
GIS software

1414
MAPPING TOOL
The project will use one or more web maps to present spatial and
tabular data for each rail crossing. Depending on the task, web maps
will be used to tell a story, review information, or gather input.
1
EXAMPLE USES
1
2
Use a narrative alongside the map to convey information to the team or the public.
Embed information for each location that can be viewed with a click or exported as a table.
2
3 Show criteria and prioritization visually in the same map or on several maps.
3
JTC STAKEHOLDERSCONSULTANT
TEAM
ALL PARTICIPANTS CAN SEE THE SAME INFORMATION AND
UPDATES ARE VISIBLE
IMMEDIATELY

15
KEY QUESTIONS AND ISSUES
• What should the key objectives of a prioritization process
be?
• How do we maintain a systems (statewide) perspective?
o For example, how should corridors be defined?
• What are some of the tradeoffs likely to be?
1616
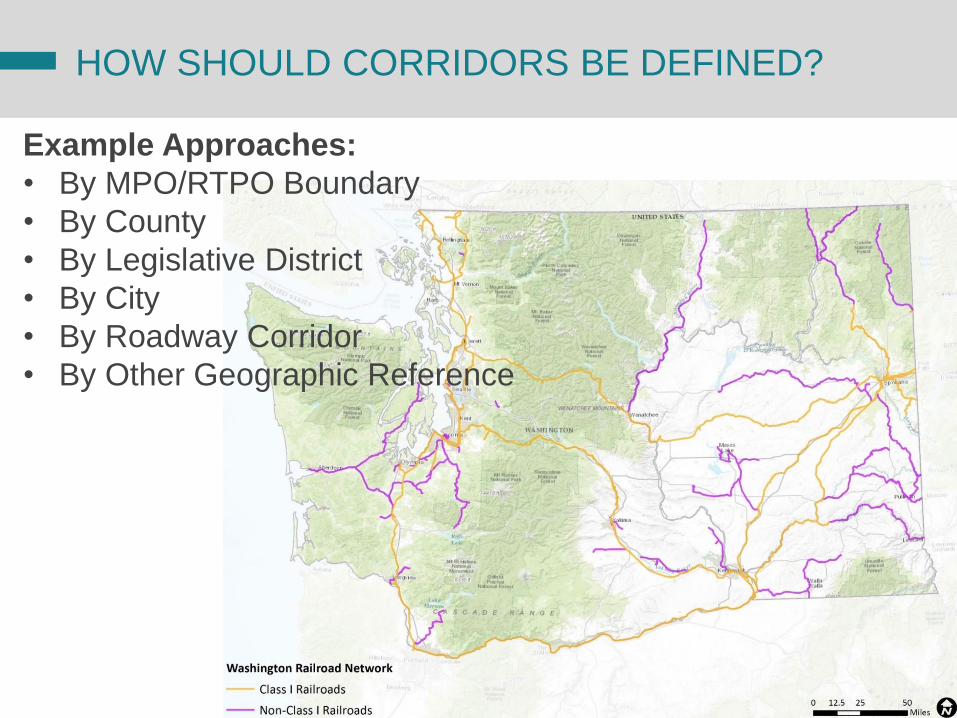
HOW SHOULD CORRIDORS BE DEFINED?
Example Approaches:
• By MPO/RTPO Boundary
• By County
• By Legislative District
• By City
• By Roadway Corridor
• By Other Geographic Reference

17
ADVISORY PANEL MEETINGS
August 2nd (10:00am to 4:00pm)Location: Seatac, The Conference Center at Sea-Tac Airport
September 28th (10:00am to 4:00pm)Location: Seatac, Meeting Room TBD
November 2nd (10:00am to 3:00pm)Location: Olympia, John A. Cherberg Building Room ABC

18
FREIGHT USERS
PANEL
Concept: 3-5 representatives from
the freight community will participate
in a panel at the August 2 meeting
Purpose: Expand perspectives on
road rail conflicts and why they are
critical to address
Questions for the Advisory Panel:
• What questions would you have for
the Freight User Panel?
• Given these questions, do you
have suggestions for participants?

19
What should we keep in mind as
we continue our work?
What questions do you have?
Other comments and
suggestions?
ROUNDTABLE DISCUSSION
20
MORE INFO
Beth RedfieldJTC Project Manager
http://leg.wa.gov/JTC/Pages/Road-Rail-Study.aspx
Jon Pascal, PE, PTOE
Consultant Project Manager