
PRINTED ON WHITE CHLORINE FREE PAPER - EUROPA - European
72
Transcript of PRINTED ON WHITE CHLORINE FREE PAPER - EUROPA - European


Taxation Papers are written by the staff of the European Commission's Directorate-General for Taxation and Customs Union, or by experts working in association with them. Taxation Papers are intended to increase awareness of the work being done by the staff and to seek comments and suggestions for further analyses. The views expressed in the Taxation Papers are solely those of the authors and do not necessarily reflect the views of the European Commission. Comments and inquiries should be addressed to: TAXUD [email protected] Cover photo made by Milan Pein Despite all our efforts, we have not yet succeeded in identifying the authors and rights holders for some of the images. If you believe that you may be a rights holder, we invite you to contact the Central Audiovisual Library of the European Commission. This paper is available in English only. Europe Direct is a service to help you find answers to your questions about the European Union Freephone number: 00 800 6 7 8 9 10 11 A great deal of additional information on the European Union is available on the Internet. It can be accessed through EUROPA at: http://europa.eu. For information on EU tax policy visit the European Commission's website at: http://ec.europa.eu/taxation_customs/taxation/index_en.htm Do you want to remain informed of EU tax and customs initiatives? Subscribe now to the Commission's e-mail newsflash at: http://ec.europa.eu/taxation_customs/common/newsflash/index_en.htm Cataloguing data can be found at the end of this publication. Luxembourg: Office for Official Publications of the European Communities, 2010 DOI 10.2778/13821 ISBN 978-92-79-15863-6 © European Union, 2010 Reproduction is authorised provided the source is acknowledged. PRINTED ON WHITE CHLORINE-FREE PAPER

COMPANY CAR TAXATION
SUBSIDIES, WELFARE AND ENVIRONMENT
BY COPENHAGEN ECONOMICS
AUTHORS: SIGURD NÆSS-SCHMIDT (PROJECT MANAGER, MANAGING ECONOMIST) AND MARCIN WINIARCZYK (ECONOMIST), COPENHAGEN ECONOMICS.
CLIENT: DG TAXUD, EUROPEAN COMMISSION
DATE: NOVEMBER 2009
ABSTRACT: THIS STUDY PRESENTS NEW, NEARLY EU WIDE ESTIMATES OF THE LEVEL OF SUBSIDIES TO COMPANY CARS. IN ADDITION IT ALSO PROVIDES SOME PRELIMINARY ROUGH ILLUSTRATIONS OF THE POSSIBLE EFFECTS OF SUCH SUBSIDIES ON ECONOMIC WELFARE AND ENVIRONMENT AND DISCUSES THE POLICY IMPLICATIONS.
KEYWORDS: TAXATION, CAR TAXATION, SUBSIDIES, ENVIRONMENT
JEL CLASSIFICATION: H22, H23, H25, H31, H32, H54

PREFACE AND EXECUTIVE SUMMARY Company cars are defined as passenger light-duty vehicles, which companies lease or own and which employees use for their personal and business travel1. They account for roughly 50 percent of all new sales of cars in EU. Cars have a central importance both as a creator of mobility but also as a source of adverse environmental impact such as CO2 emissions, noise, particles, congestion problems etc. This study reviews the extent to which the current taxation of company cars artificially promotes the use of such cars beyond its underlying merits. The key question is whether the employees by way of the free use of such cars receive benefits that are under-taxed relative to alternative salary remuneration. A favourable tax treatment of company cars is distorting and imposes a welfare cost to the society. It encourages car ownership and affects the choice of car model, as well as driving habits, and in this way aggravates the environmental problems caused by the transport sector. In fact, evidence from Belgium and the Netherlands suggests that pure business use represents only 20-30 percent of company car use2, the rest being private use. This study presents new, nearly EU wide estimates of the level of subsidies to company cars. In addition it also provides some preliminary rough illustrations of the possible effects of such subsidies on economic welfare and environment and discuses the policy implications. The main conclusions are:
Under-taxation of company cars is largely the norm within EU, though with substantial variations as outlined in chapter 2.
Direct revenue losses may approach ½ percent of EU GDP (€54 billion) and welfare losses from distortions of consumer choice are substantial, perhaps equal to 0.1 to 0.3 percent of GDP (€12 billion to €37 billion) as explained in chapter 3.
CO2 emissions are boosted by incentives to buy fuel and larger cars More neutral taxation of company cars, i.e. higher taxation of employee benefits,
could... ... enhance welfare... ... and reduce adverse environmental impacts in line with national and EU objectives
in the areas of climate and energy policy: Consequently, Member States should urgently look whether their company car tax
facilities can be better aligned with their general policy objectives on economic efficiency, the environment and equity, and more specifically on their greenhouse gas reduction targets.
This study hopes to start such a discussion with a brief sketch of options for policy reforms
1 DSF (2005) 2 Measured as percentage of total company car annual mileage or the number of trips, cf. also Table 2.1.
2

Chapter 1 MAIN FINDINGS To evaluate the impact of company car taxation from the environmental and welfare perspectives we have divided the study into three main parts asking the following questions: • Is the private use of company cars subsidised in EU Member States? • What effect do such subsidies have on the composition and size of the EU car fleet, as
well as the total amount of car travelling, and hence also on the environment and general welfare?
• Which options do Member States and the EU have at their disposal for (potentially) reforming the taxation of company cars?
We summarise the findings regarding these three questions below.
1.1. MEASUREMENT OF SUBSIDIES FOR COMPANY-OWNED CARS
Concepts of tax neutrality To measure the size of potential subsidies, we first develop the concept of tax neutrality: company car taxation is deemed to be neutral if the employees’ net disposable income position is the same whether a given level of total compensation from the employer side is provided as a cash remuneration or as fringe benefits in the form a company car also for private use. We provide two alternative versions of such tax neutrality. In the first definition, tax rules are deemed neutral if the actual costs incurred by the employer in providing the company car lead to a corresponding increase in the imputed taxable income for the employee using the car. We call this the firm cost principle. Such costs include four types of costs namely (1) financial costs associated with the purchase of the car such as interest charges, (2) the depreciation of the value of the car in the period where the car is owned by the company and (3) maintenance costs (e.g. insurance and repair work) and (4) fuel costs. In the second definition, tax rules are deemed neutral if the imputed taxable income for the employees equals the costs the employee would have incurred with a personal ownership of the car. We call this the opportunity cost principle. Using the opportunity cost principle will most often lead to a higher taxable income than with a firm cost approach as the employer has some advantages vis-à-vis the employee in buying, financing and maintaining cars. That includes larger discounts from dealers and lower interest rates from banks.
Taxation of company cars in practice Before discussing how company cars could or should be taxed, it is worth recapitulating the various ways in which a company car could in principle be under taxed relative to other business assets with the same productive function:
Company level o Favourable depreciation rules for company car relative to other assets with
same economic life providing up front liquidity gains o The company may deduct the car purchase and subsequent repair purchases for
VAT purposes while the employee does not pay VAT on the use of the car
3

Low imputed value for the employee for use of the company car o The firm incurs cost in terms of (1) financing the original purchase (2)
realising a loss when selling it and typically (3) paying repair and maintenance. o The firm may choose to lease a car rather than to own it: it will provide fees to
the leasing company equal to these costs. o The employee may be under-taxed relative to the cost of providing this service
irrespective of whether the car is owned or leased by the firm o Free provision of fuel for private use is typically not taxed
Tax treatment at the employee side o Imputed car benefits may not be subjected to employer or employee social
security contributions but ‘only’ pure wage taxation When designing systems for taxation of company cars, tax authorities need to decide on two key parameters. These are linked first to the issue of having tax systems that work in practice; and second to more principal issues such as choosing a benchmark for evaluating a neutral level of taxation, including the choice between the firm and the opportunity cost principle. Concerning the first issue, the practicability of tax systems, unless the system is to be highly complicated and cumbersome to operate, the rules for imputing the tax value of company car benefits must be based upon simple parameters applicable to all firms, employees and cars. The actual marginal financing cost for any particular firm is not known with certainty. Hence when calculating the value for the employee of the firm taking a loan to finance a car, tax authorities will have to base the imputed value on some average financing costs for either firms (‘firm cost principle’) or the employee (‘opportunity cost principle’). Depreciation rates also differ among car makes and attempts to further distinguish between private individuals and companies would require more complicated systems. Hence, in practice taxation rules have a relatively simple structure. As a proxy for the total level of finance, depreciation and maintenance costs, Member States impute a taxable income which is a fixed percent of the car price. Some countries – for example Austria, France, Ireland and Portugal – use the actual purchase cost for the company as a base, while others – for example Denmark, the Netherlands and UK – use the list price for the car. Selection of the former base could be seen as expressing a choice for the firm cost principle, while the latter as using an opportunity cost principle; acquisition costs for companies will always be either on par with or lower than list prices. The rates for imputing the tax base differ considerably across EU Member States, which indicate substantial variance in the effective taxation of company cars cf. Table 1.1. Only two countries allow the use of rates below 10 percent while another five countries have imputation rates above 21 percent.
4

Table 1.1: Rates for imputing tax base levied as a percentage of company car value, per annum, as of 2008 Tax rate (per year)
Country
0-10% Ireland: 6% list or acquisition price if business mileage 62,000km < m < 70,000km p.a. Portugal: 9% of acquisition cost United Kingdom: 10% of list price when CO2 emissions are 120 g CO2 / km or below.
11-20% Austria: 18% of acquisition cost incl. VAT, max €7,200 per year Czech Republic: 12% of list price, min. €432 Finland: 16.8% of replacement price + €3240 France: 12% of acquisition cost (if private fuel paid by employer) Germany: 12% of list price Ireland: 18% if business mileage 32,000 < m <=40,000km, 12% if business mileage 48,000 < m <=56,000km Luxembourg: 18% of acquisition cost Spain: 20% of acquisition cost United Kingdom: 15% of list price if emissions between 121-139 g CO2/km, increasing by 1% for each 5g CO2/km above 139g CO2/km , up to 35%
20-35% France: 20% of acquisition cost Denmark: 25% of list price below €40,000 (min. €21,333), 20% of list price above €40,000 Ireland: 30% if business mileage <=24,000 km, 24% if business mileage 24,000 < m <= 32,000 km Italy: 30% of ‘average cost of use’ based on 15,000km annual mileage, determined according to fixed km-rates The Netherlands: 25% of list price Slovakia: 19 % of acquisition cost Slovenia: 20 % of acquisition cost Romania: A*B*C*(100-D)/100 where A=cylinder capacity, B=tax in euro/1 cc, C=correlation coefficient, D=reduction ratio depending on the depreciation of the motor car/motor vehicle United Kingdom: 15% of list price if emissions between 121-139 g CO2/km, increasing by 1% for each 5g CO2/km above 139g CO2/km , up to 35%
Countries not applying imputed rates
Belgium: Schedule of fixed-km rates based on engine power and emissions, fixed mileage 5,000 km or 7500km p.a. Estonia: € 1,536 p.a. (fixed tax) Hungary: lump-sum tax based on schedule of car values Poland: Leasing costs of comparable cars Sweden: 9% of car value according to schedule + 31.7% of base amount + 2.168% of car value according to schedule Greece: No tax on benefit-in-kind received
Note: No information is available for Bulgaria, Cyprus, Latvia, Lithuania and Malta. Some of the countries are mentioned more than once in the table. The reason for this is that they offer more than one set of rules for calculating the employee tax base. Source: PWC (2006), PWC (2008) and Copenhagen Economics
As regards fuel costs, only a handful of countries actually ask employees to account for the fuels received from employers for private use, but proxies are often used that can take different forms. The simplest and most often used is to have higher general imputed rates for company cars with a high level of private use. The conclusion under this first practical part is that it makes no sense to calculate the specific potential subsidy associated with the tax treatment of each separate part of the principal company car fringe benefits (financing costs, depreciation, maintenance and fuel costs) as tax authorities combine various benefit categories and use rules-of-thumb to arrive at a imputed taxable income. Hence, only an overall evaluation of the net subsidy is feasible and meaningful, and then only subject to a number of conditionalities discussed below. As regards the second issue of defining the proper neutral benchmarks, a rather pragmatic approach is also suggested. Rather than proposing either a firm or opportunity cost approach we have done a sensitivity analysis that shows the consequences for the calculation of subsidies using assumptions that lean either in the direction of firm costs or opportunity costs. For example, there are a range of possible discount rates that could be used to calculate the financing costs that firms or alternatively households face, when they are to finance a new car. They can be very high for example for a household with a weak credit history (or a firm on the brink of bankruptcy). Or it can be very low for example for a household (or firm) with excess liquidity. Therefore, the use of high discount rate, and hence high level of required
5

imputed income related to financing costs, could then be said to represent an opportunity costs principle. The pragmatic approach is also linked to the fact that we have not tried to measure the specific (company) car market conditions in each Member States but rather have used some stylised facts within the EU, specifically on items such as financing costs, rates of depreciation, insurance and maintenance costs, etc. We have accounted for cross-country differences in fuel costs, however, as they differ considerably due to different tax rates on fuel.
Structure of tax subsidies While our subsidy estimates are only approximate, they provide a picture of substantial overall net tax subsidies to the private use of company cars. A company car in the medium segment enjoys subsidies above 10 percent relative to its list price in 18 out of the 19 countries for which subsidy calculation was possible cf. Table 1.2. The subsidy estimate is calculated here as the difference between the tax-neutral tax base and the actual imputed tax base relative to the incurred costs at the firm level, i.e. using the firm cost principle. On the high end, there are countries where tax rules include a ceiling on the amount on the tax base, such as Austria. Greece provides the extreme example of a country where there is no personal income tax on the use of company car. On the other hand, in Poland where personal income taxes are levied on the benefit-in-kind whose value is set at the actual cost of leasing a comparable car we observe the lowest subsidies as defined by the tax law3. Table 1.2: Subsidies to private use of company cars in 19 EU Member States, high mileage, p.a. Measured as the percentage gap in imputed tax base
Segment Small Segment Medium Segment Large
Group A: Subsidy up to 10% Finland, Poland Poland United Kingdom
Group B: Subsidy 11%-20% Denmark, Sweden Denmark, Finland, France, Netherlands, Sweden, United Kingdom
Denmark, Finland, France, Netherlands, Poland, Sweden
Group C: Subsidy 21%-30% France, Luxembourg, Netherlands, Spain
Austria, Luxembourg, Slovenia, Spain
Czech R., Germany, Italy, Luxembourg, Slovenia, Spain
Group D: Subsidy more than 30%
Austria, Belgium, Czech R., Germany, Greece, Hungary, Italy, Portugal, Slovakia, Slovenia, United Kingdom
Belgium, Czech Republic, Germany, Greece, Hungary, Italy, Portugal, Slovakia
Austria, Belgium, Greece, Hungary, Portugal, Slovakia,
Note: Main assumptions: firm cost principle, company discount rate 4.34%; employee discount rate 8.63%; acquisition cost = 85% of list price; depreciation 68-63% depending on segment; company car lifetime: 3 years; low private use = 10,000 km p.a.; high private use = 25,000 km p.a. Source: Copenhagen Economics
Subsidy rates appear rather uniform across segments, though with a slight tendency of higher subsidy rates for the smaller segments.4 However, this can be attributed to the higher share of
3 The Polish rules have been under review during the course of this study, with a proposal to switch to a fixed imputation rate based on car value. Despite their appeal as theoretically one of the most accurate method of assessing the benefit-in-kind, they appear to be difficult to implement by tax authorities in practice. 4 This is because the relative value of fuel provided by the employer is higher in the case of less expensive, smaller cars. In most of the EU Member States, company-provided fuel does not increase the taxable base for the employee, hence increases the subsidy.
6

employer-provided fuel relative to the list price of the car, in the case of smaller cars, and the fact that fuel is most often not declarable for income tax.
In the calculations above, we have implicitly assumed that there is no subsidy if the imputed rate is set at the right level, which is likely – other things equal – to lead to an underestimation of subsidy rates. The point is that gross labour income in many countries are subjected to social security contributions at the employer side while imputed fringe benefits are typically only subject to the tax rates that apply to wage income. As employers’ social security contribution rates in many EU countries exceed 10 percentage points, employees get an effective tax benefit even if the imputed tax base corresponds to the total costs of providing the benefits. However, the tax data that we had available for this study did not allow us to verify in a precise way across all countries the size of such effects.
1.2. MACRO EFFECTS: DIRECT FISCAL LOSSES AND CAR MARKET
Overall size of subsidies and direct fiscal revenue effects The bulk of any possible impact of the subsidies will be felt in small to medium segments of the car market which account for the overwhelming share of both the privately and company owned car market cf. figure 1.1. Sales of cars up to the medium segment (not including the premium segments: upper medium and large which contain e.g. Audi A6 and Audi A8) accounts for 93 percent of all registered cars (85 percent by value). 90 percent of company cars belong to this range (81 percent by value). Figure 1.1: Structure of registrations by segment in 18 EU countries, 2008, millions of cars registered (volume)
Note: The 18 EU Member States include Austria, Belgium, Czech Republic, Denmark, Finland, Germany, Greece, Hungary, Italy, Luxembourg, the Netherlands, Poland, Portugal, Slovakia, Slovenia, Spain, Sweden, and United Kingdom. Source: Polk (2009) and Copenhagen Economics
Another clear pattern is the dominance of the company car in the upper segments. More than 60 percent of all medium, upper medium and large cars are being company owned against 35 percent or less for mini or small cars. This is arguably linked to both company cars mainly being offered to persons with above average salaries and hence a natural demand for more up marked models and the very fact that a progressive tax system makes company cars more
7

attractive for employees in higher brackets of the tax system. The higher the marginal tax rate, the higher the net-of-tax value of low taxed fringe benefits. The direct fiscal consequences without taking into account any dynamic effects from the company car subsidies are substantial with a total revenue loss in the order of roughly ½ percent of EU GDP as an average for the countries included in the analysis, cf. Table 1.3., or €54 billion in total. The highest losses are found in countries with low imputation rates for calculating the benefits of company cars and, partly as a result, also a higher share of company cars in the overall economy. Our methods have been first to calculate the difference between the calculated tax base with current taxes rules and then compare that with the tax base resulting from a tax system with zero subsidies to company cars. This gap is then multiplied by the total tax wedge on labour income. It is a static calculation in not including dynamic affects: higher taxation of company cars would led to smaller and fewer cars being bought which lead to less revenues from fuel taxes as well as purchase and ownership related car taxes in EU which are substantial. Bearing in mind the relatively general manner the calculations have been done, we suggest that focus should be of magnitudes rather than precise country estimates. The latter would require further detail in terms of data and calculations. Table 1.3: Static tax revenue losses and their determinants, 2008
Rates for imputing tax base
Average marginal taxes rates, in
percent
Purchases of company car as percent of GDP
Loss, percent of GDP
Loss, billion €
0-15 percent 56 1.9 0.8 25
15-24 percent 52 1.2 0.4 8
Above 24 percent 55 1.3 0.4 16 Countries with other systems 58 1.3 0.6 5
Total (weighted average) 55 1.4 0.5 54
Note: In the weighted average for each group, the share of total GDP within the group is used as a weight. In the total weighted average, the share of total GDP (of the 18 countries) is used as a weight. Source: Copenhagen Economics
Effects on car stock, size of company cars and mileage Neither data availability nor well established methodologies allow us to draw very firm conclusions on how these strong subsides affect the sales of company cars, the entire stock of cars or the amount of miles being driven. The results presented below should thus rather be interpreted as possible orders of magnitude than precise estimates of effects. However, drawing upon a number of different sources, in particular two recent Dutch studies5, we suggest that the results could be significant. The structure of the Dutch economy is relatively close to the EU average, particularly EU15, in terms of car density, share of company cars, income per capita, tax rates and company car subsidies level to make this a not too heroic an endeavour. We scale up these two studies to EU level by combining the behavioural effects from these two studies with our estimates of subsidy levels at the EU level. Using alternative assumptions, we estimate that the stock of cars may increase between 8 and 21 million in EU, the price of company cars may be boosted with € 4.000 to 8.000 and fuel consumption may be 4 to 8 percent up.
5 Puigarnau and van Ommeren (2007, 2009)
8
1.3. WELFARE COSTS AND ADVERSE ENVIRONMENTAL IMPACT Providing subsidies to company cars on a scale such as suggested in this study represents serious distortions of consumer choice: in essence making it artificially attractive for consumers to take home their remuneration in the form of cars. In fact, evidence from Belgium and the Netherlands suggests that this may be the case in practice. Pure business use represents only 20-30 percent of company car use, the rest being pure private use and home-work commutes. Using the results from above and applying standard evaluation methods implies welfare losses in the order of €15 to 35 billion at the EU level (0.1 to 0.3 percent of GDP). The high estimates would follow from a direct application of the behavioural effects of company car subsidies from the Puigarnau and van Ommeren (2007, 2009) studies referred to above, while the lower and more conservative estimates is based on behavioural effects more in line with the general literature on the determinants of car purchase etc. The relatively high estimates of welfare costs reflect the simple fact that company cars receive a large subsidy, are a large part of consumer purchases and are relatively price elastic. The environmental impact can be split into two main parts. The first part relates to energy consumption and resulting effects on CO2 emissions, bearing in mind that cars today are mainly driven by fossil fuels with biofuels or electrical cars accounting for only a fraction of the total stock of cars. The incentive to buy more and larger cars as well as very large subsidy to drive more miles will increase fuel consumption. The estimates in this report lay in the range of fuel consumption increasing with the above mentioned 4 to 8 percent and CO2 emissions from car transport increasing by approximately the same amount corresponding to increases of 21 to 43 million tons, cf. Table 1.4. The two estimates are directly the result of the choice of the upper or lower estimate above. Most of the increase in fuel consumption in our study results from increases in the car stock and the size of cars; less from the large subsidy to fuel use. The second part relates to local adverse impacts such as increased noise and air pollution resulting mainly from particles from diesel engines etc. Undoubtedly, company car subsidies will have these effects, not the least as larger cars are being bought and more fuel is being used for commuting purposes, often in urban areas. Using our estimates of higher fuel consumption, would lead to resulting increases in NOx and HCs. In particular, when emitted in urban areas such emission result in increased health risks as evidence by studies on external costs of transport.6
6 Mayeres, I. et al. (2001)
9
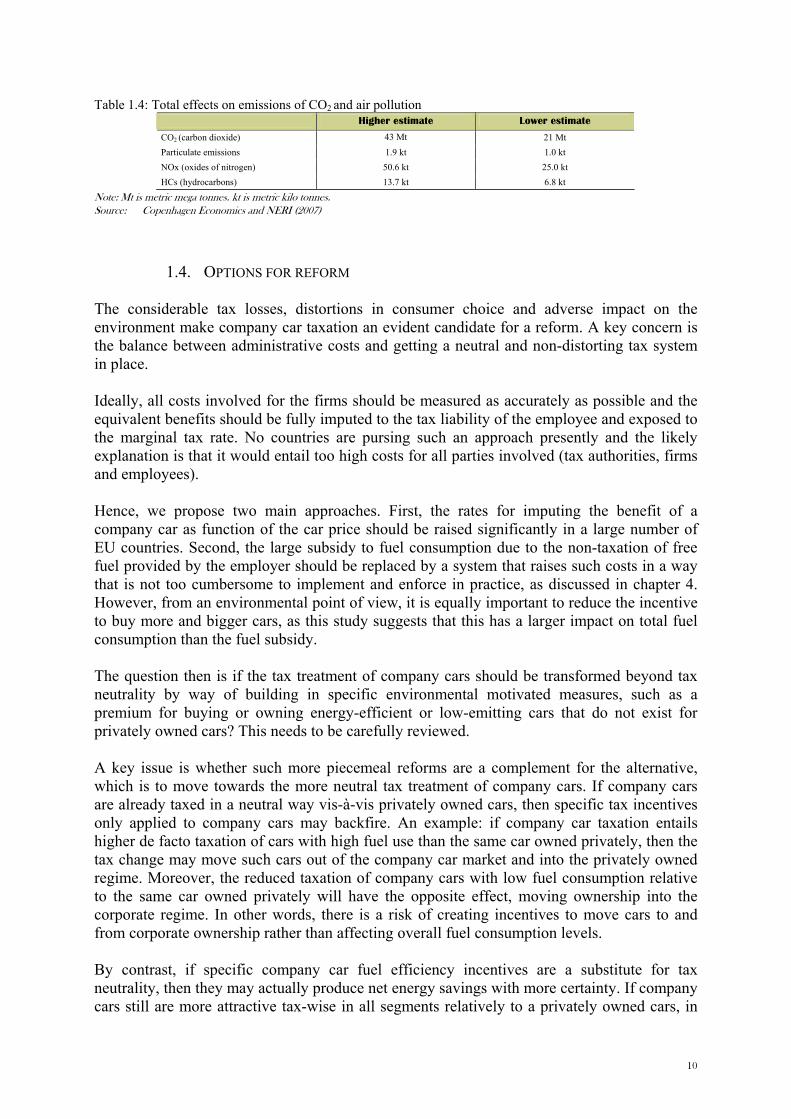
Table 1.4: Total effects on emissions of CO2 and air pollution Higher estimate Lower estimate
CO2 (carbon dioxide) 43 Mt 21 Mt Particulate emissions 1.9 kt 1.0 kt NOx (oxides of nitrogen) 50.6 kt 25.0 kt HCs (hydrocarbons) 13.7 kt 6.8 kt
Note: Mt is metric mega tonnes. kt is metric kilo tonnes. Source: Copenhagen Economics and NERI (2007)
1.4. OPTIONS FOR REFORM The considerable tax losses, distortions in consumer choice and adverse impact on the environment make company car taxation an evident candidate for a reform. A key concern is the balance between administrative costs and getting a neutral and non-distorting tax system in place. Ideally, all costs involved for the firms should be measured as accurately as possible and the equivalent benefits should be fully imputed to the tax liability of the employee and exposed to the marginal tax rate. No countries are pursing such an approach presently and the likely explanation is that it would entail too high costs for all parties involved (tax authorities, firms and employees). Hence, we propose two main approaches. First, the rates for imputing the benefit of a company car as function of the car price should be raised significantly in a large number of EU countries. Second, the large subsidy to fuel consumption due to the non-taxation of free fuel provided by the employer should be replaced by a system that raises such costs in a way that is not too cumbersome to implement and enforce in practice, as discussed in chapter 4. However, from an environmental point of view, it is equally important to reduce the incentive to buy more and bigger cars, as this study suggests that this has a larger impact on total fuel consumption than the fuel subsidy. The question then is if the tax treatment of company cars should be transformed beyond tax neutrality by way of building in specific environmental motivated measures, such as a premium for buying or owning energy-efficient or low-emitting cars that do not exist for privately owned cars? This needs to be carefully reviewed. A key issue is whether such more piecemeal reforms are a complement for the alternative, which is to move towards the more neutral tax treatment of company cars. If company cars are already taxed in a neutral way vis-à-vis privately owned cars, then specific tax incentives only applied to company cars may backfire. An example: if company car taxation entails higher de facto taxation of cars with high fuel use than the same car owned privately, then the tax change may move such cars out of the company car market and into the privately owned regime. Moreover, the reduced taxation of company cars with low fuel consumption relative to the same car owned privately will have the opposite effect, moving ownership into the corporate regime. In other words, there is a risk of creating incentives to move cars to and from corporate ownership rather than affecting overall fuel consumption levels. By contrast, if specific company car fuel efficiency incentives are a substitute for tax neutrality, then they may actually produce net energy savings with more certainty. If company cars still are more attractive tax-wise in all segments relatively to a privately owned cars, in
10
spite of tightening of taxation for the most fuel consuming cars, then such incentives lead to shifting towards more fuel efficient cars rather than opting out of the company car regime altogether. As company cars are typically provided to middle and in particular higher income families7, subsidies related to company car taxation are likely to benefit high-income employees more than low-income employees.8 Both a higher position and a higher income (which are obviously correlated) increase the chance of having access to a subsidised company car. In this sense, the tax system that favours company cars is not only environmentally harmful, but is also likely to have adverse distributional consequences. Chapter 2 PRINCIPLES OF COMPANY CAR TAXATION To assess whether taxation of company cars implies net subsidies, we go through a number of steps. First, we define why companies, also in the absence of specific tax benefits, might be interested in buying company cars to put at the disposal for the employees for both professional and private purposes (2.1). Secondly, we define some benchmarks for what could be considered a neutral treatment of the taxation of company cars with private use also (2.2). Thirdly, we review the actual tax rules applicable to company cars in EU both at the employee level (2.3) and the company level (2.4). Fourthly, we use this framework to provide estimates of net tax subsidies to company cars across countries and for different segments of the company car market (2.5).
2.1. REASONS FOR PROVIDING EMPLOYEES WITH COMPANY CARS In practice there are three main reasons which explain why the provision of a company car for private use as a fringe benefit is attractive for both the employee and the employer. The first reason is that companies can supply the fringe benefit at lower costs than the employee is able to achieve – and consequently pass it on to the employee. Secondly, the tax system itself can encourage in-kind fringe benefits over monetary remuneration. Thirdly, firms may want the employee to drive in a car of certain minimum standard. Firstly, firms are able to supply the fringe benefit at lower costs than the employee is able to achieve. There are two main areas where firms have an advantage: • lower costs of purchasing the car and fixed costs of insurance and maintenance9 • lower financing costs of car ownership (or lower leasing costs) With respect to the investment cost in the new car, the employer’s advantage comes from firms’ greater bargaining power vis-à-vis car dealers which results in lower costs of purchasing new cars. Firms, which operate fleets of passenger cars (for example distribution firms) are often granted significant discounts by car dealers. On the other hand, if the employee were to buy the car privately, he or she would have a more limited bargaining power to achieve reductions off the car dealer’s list prices. Next, corporate fleet clients are likely to obtain discounts off list prices for insurance and maintenance.
7 As evidenced in this study by the very high fraction of high value cars that are being sold as company cars as well as by a recent Italian study on the take-up of fringe benefits, D’Ambrosio, C. & Gigliarano, C. (2008), 8 D’Ambrosio & Gigliarano (2008) 9 Cf. e.g. van Ommeren et al. (2006)
11

Firms will also be able to finance these purchases at a lower cost. Due to their scale, firms are more likely to have access to better terms of financing of capital purchases with cash than individual employees. Due to higher free cash flows, the opportunity cost of cash for companies will be lower than for employees. Furthermore due to larger scale, firms are also likely to obtain better terms for alternative financing options, such as operating or financial lease arrangements. In this respect, the employee will face search costs for favourable credit offers and potentially also switching costs if financial institutions are to be changed.10 Secondly, firms may want the employee to drive in a car of a certain minimum standard. Firms may have a variety of reasons for that, such as to attract employees who face significant commuting costs, to help employees generate more turnover, to increase productivity or as a status symbol. Thirdly, the tax system may itself encourage the provision of company cars for private use over other kind of remuneration such as wages or salaries (irrespective of the companies’ ability to supply fringe benefits at lower costs). Evidence from Belgium and the Netherlands suggests that company cars are to a very large extent used for private purposes such as home-office commutes and other purely private purposes. According to these sources, pure business-related use constitutes only about 20 to 30 percent of company car use, measured by kilometres driven or frequency of trips, cf. Table 2.1.
Table 2.1. Purpose of company car usage Country Not business use Business use Belgium* 67% 33% Netherlands** 78% 22%
Note : No business use included private travel and work-home commutes (in Belgium) * proportions of business and not business trips in total annual mileage of company cars ** percentage of employees with a company car who have not used this car for any business purpose during a period of three months. Source: Belgium: Cornelis (2009), Netherlands: Puigarnau and van Ommeren (2009)
In sections 0 and 0 we outline the actual taxation rules in Member States and provide estimates of ‘under taxation’ of the private use of company cars.
2.2 BENCHMARKS FOR NEUTRAL TAXATION OF COMPANY CARS When the tax system favours private use of company cars, employees gain access to cars that they would not be able to afford themselves – typically more expensive, larger cars – and are likely to drive them more intensely than they otherwise would. Both of these effects increase the employee’s carbon footprint. On the other hand, a tax system that would not make driving in company cars more attractive than private cars would be neutral both from public finance and environmental points of view. What are the principles of such a neutral tax system? As a general rule, for a tax system to be neutral it must avoid subsidising specific kinds of consumption, i.e. the private use of company cars, in particular where the subsidised activity generates negative externalities. In this respect, car use gives raise not only to greenhouse gas and air polluting emissions, but also generates noise and congestion.
10 Literature gives evidence that both search costs and switching costs are likely to be important.
12

In practice, there may be two approaches to measure tax neutrality. One approach is to equate the value of taxable benefits for the employee (estimated by tax authorities) with the actual amount of costs borne by the employer providing the benefit. If the value of taxable benefits is less (greater) than firm costs, there is a subsidy (penalty) to the employee. We call this approach the ‘firm-cost principle’. Alternatively, the value of the taxable benefit declared by the employee should equal the before-tax cost for the employee of getting the same benefits. We call this the ‘opportunity cost principle’. The consequence of choosing either of these two approaches will be outlined below. But the basic concept is the same: it is the firm that owns or leases the car and provides it to the employee. The difference is essentially whether the firm has more buying power in the car or capital market that implies that it can get the service at a lower cost than the employee and what consequences this should have for taxation at the employee side. Three basic types of costs To estimate the extent to which current tax systems subsidies or penalise private usage of company cars, it is necessary to include all the costs incurred by companies in providing the benefit-in-kind. We split the basic costs of a company car into three elements: First, investment costs. These include the costs of purchasing the company car, including both financing costs – interest costs of loan or lost revenue from foregone investment – and the loss of value of the car over its life time (depreciation). The more a car depreciates over its lifetime, the lower the resale value and the greater the cost to the firm.11 Second, costs related to insurance, motoring taxes, maintenance and periodic repairs. This group of costs is incurred by the company as the owner of the car and is, as such, generally not directly related to private use by employees. In other words, insurance premiums do not typically depend on the amount of kilometres driven so that the company would pay the same premium irrespective of the employee’s private use of the car. Likewise, many aspects of maintenance are undertaken on a periodic basis, e.g. an annual technical check or a twice-weekly car wash, etc. There are indications that firms increasingly rely on leasing arrangements rather than ownership when providing cars to their employees. Essentially, it changes nothing vis-à-vis the employee. In a leasing arrangement, the firm deducts the annual fee from its gross income while with a company owned car it directly deducts costs of financing, depreciation, insurance, motoring taxes, maintenance and period repairs. Provided that the company and the leasing company face the same costs, then it changes nothing vis-à-vis the employee. Obviously, the firms use leasing contracts rather than ownership because it is more efficient: a leasing company can exploit market power and knowledge better than particularly smaller firms thus reducing costs of purchase and maintenance. But so can the private employee: lease the car rather than own it. The upshot is that we in this study in our subsidy calculations make no distinctions between company cars owned by the company or leased by the company and then put at the disposal of the employee. Third, fuel costs. The relevant fuel cost is the company cost of providing employees with fuel for private use, cf. Table 2.2. The size of this cost is directly related to the amount of private
11 Estimates of a company car lifetime by data providers Polk and Dataforce are between 3-5 years.
13

use. As opposed to the acquisition cost of the car, the costs of fuel are clearly variable. Commuting is an important border line case. In this study we have included commuting as part of business related travel. Table 2.2: Typology of fuel costs and tax implications
Fuel paid by Use of company car for
Company Employee
Business purposes No benefit-in-kind – No tax Not relevant
Private purposes Fuel use: benefit-in-kind – taxable Fuel use: no benefit-in-kind – no tax
Note: Member states are not unanimous on classifying commuting; tax rules treat commuting in a company car as private or business travel. Source: Copenhagen Economics
Our definition of a tax subsidy under alternative assumptions Having defined the relevant costs, we proceed with outlining our conceptual approach to estimating the subsidy levels using both the ‘firm cost’ and ‘opportunity cost’ principle. First, we calculate the annual equivalent value of overall costs to employer – and alternatively the opportunity costs for the employee – from the three categories of costs over the time the employee uses the car for private purposes which we assume is identical with the life time of the company car (three years in the basic example). Further assumptions include the price of the company car, the cost of insurance, taxes, maintenance and repairs and the intensity of private use which translates into the cost of fuel. The difference between the ‘firm cost’ and ‘opportunity cost’ approaches is outlined in Table 2.3. We use acquisition price when using ‘firm cost’ approach and the list price when applying the ‘opportunity cost’ approach; the latter typically being higher as the employee typically will have less buying power. In addition we use slightly higher interest rates for investment costs when applying the ‘opportunity costs,’ reflecting the weaker position of the average private consumer in the capital market relative to an average firm. In practice, we do not find that subsidy estimates are very sensitive to a change of the calculation approach, cf. chapter 3. Second, we calculate the annual equivalent value of calculated imputed taxable benefits to the employee over the same period. We use the same cost items and assumptions as above; however, the value of the taxable benefits depends directly on the specific tax rules of the Member State in question. We emphasise that business-related travel is not taxed at employee level - only the private travel should be taxed at this level. Likewise, only the company-paid fuel provided to the employee should be subject to tax – while the amount of fuel paid for privately from after-tax income should not. Neutrality is achieved when these two values are equal, i.e. when the company cost of providing the benefit-in-kind is equal in value to the increase in the tax base of the employee receiving the benefit. Should company costs be higher (lower) than employee tax bases, the employee receives a tax subsidy (penalty). This study use the opportunity cost principle for subsidy calculations. We have in chapter three inserted some sensitivity analysis that allows for some appreciation of the importance of the choice of benchmark principle: firm or opportunity cost principle.
14

2.3 . TAXATION RULES IN MEMBER STATES: EMPLOYEE SIDE It is difficult to follow the principles of neutral company car taxation in practice. This is primarily because the information they require does either not exist at the time of the tax obligation, e.g. the depreciation of the car, or cannot be known with certainty, e.g. opportunity costs. A tax system functioning in real life will most likely be structured around simple rules to approximate the values of employee tax base. It follows that such systems are seldom neutral. In particular, there are difficulties with knowing the following cost ingredients with certainty: • Depreciation: the value loss of a car over a three year period is not known to
firm/employee before the car has actually been sold. • Private fuel costs: At best, the kilometre breakdown between private and public driving
may be known, but this is not the case for real underlying fuel use. E.g. 100 km driven on the highway will amount to less fuel used than 100 km driven in the city.
• Financing costs: The precise discount rates are neither known for firms nor employees when buying a car.
Both our calculations as well as tax practice need to rely on simplified assumptions reflecting ‘average’ circumstances.
Tax rules at the employee side in EU: investment cost In this section we focus on the employee tax implications stemming from the part of the firm costs that have to do with car purchase (the investment costs). Most EU countries have tax elements on employee side which ‘mimic’ the investment costs of firms. Only in 4 Member States are investment costs not taken into account. In the case of many Member States, the annual taxable benefit is calculated as a percentage of the value of the company car. The value of the car is typically either the list price or the acquisition cost, i.e. the price actually paid by the company including discounts. Some countries use the concepts of ‘open market value’, ‘fair market value’ or ‘replacement cost’, cf. Table 2.3 for the explanation of these concepts and cf. Table 2.5. for the actual rules. Table 2.3: Concepts used in estimating value of company cars Concept Explanation List price Price that the employee would obtain when buying privately (opportunity cost approach) Acquisition cost Price paid by the company, typically less than list price (firm cost approach) (Fair) market value or replacement cost An amount estimated following a specific methodology of the tax authority.
Source: Copenhagen Economics
Where the employee is required to report the car value as its list price, the tax base may turn out higher than if acquisition cost were required to be reported. In this respect, tax systems which allow the use of the acquisition costs – as opposed to list prices – grant employees the opportunity to benefit from firms’ purchasing power. 9 Member States calculate taxes based on the acquisition cost, 5 Member States use list prices, 4 Member States use either the market value or replacement cost concepts; while in two Member States the tax is not related to the investment cost, cf. Table 2.4.
15

Table 2.4: Types of tax rules on the investment cost Car price not explicitly taxed
List Price Acquisition price Market value or replacement cost
List price and CO2 emissions per km
Belgium Estonia Greece (no tax) Poland
Denmark (cars < 3 yeas old) Germany The Netherlands Sweden
Austria Hungary France Portugal Romania Slovakia Slovenia Spain
Finland Ireland Italy Luxembourg
The United Kingdom.
Note: Missing countries are Cyprus, Latvia, Lithuania and Malta. It is not possible to identify the type of investment cost for: Bulgaria and Czech Republic. List price is the price paid by private customers to car listed. Acquisition price is the price paid by the company to the car dealer. Market value and replacement costs are calculated according to methodologies laid out by the respective tax authorities. Source: PWC (2006), PWC (2008)
In most countries the percentage of the value of the car (imputation rate) used to calculate the tax base is fixed, e.g. the tax base is calculated as 20 percent of the car’s acquisition cost. A fixed percentage is an example of simple ‘one-size-fits-all’ approach whose intension is ease of application rather than accuracy. In some countries, however, the percentage depends on the level of private usage such that the more intense the private usage, the greater the tax. The actual ratio of private to business travel is to be provided by a logbook, over monthly or annual intervals, cf. France. A variation of this approach is to adjust the percentage according to schedules with thresholds of the amount of business mileage. High business mileage gives rise to lower tax, while the actual level of private use is irrelevant, cf. Ireland. There are Member States, where the employee is not taxed explicitly on the value of the corporate car in private use: Belgium, Estonia, Italy and Poland. In Belgium, Italy and Poland the tax base is calculated using official schedules of fixed km-rates for private travel. The fixed km-rates are typically designed to approximate car depreciation per mile, fuel costs, and the remaining variable and fixed costs of ownership (insurance, repairs). In Belgium and Poland they apply universally to all cars irrespective of their value. In Italy, however, separate schedules are available for given car models. In Estonia, on the other hand, there is only a fixed amount tax due, which neither depends on the car value nor the amount of private or business driving.
16
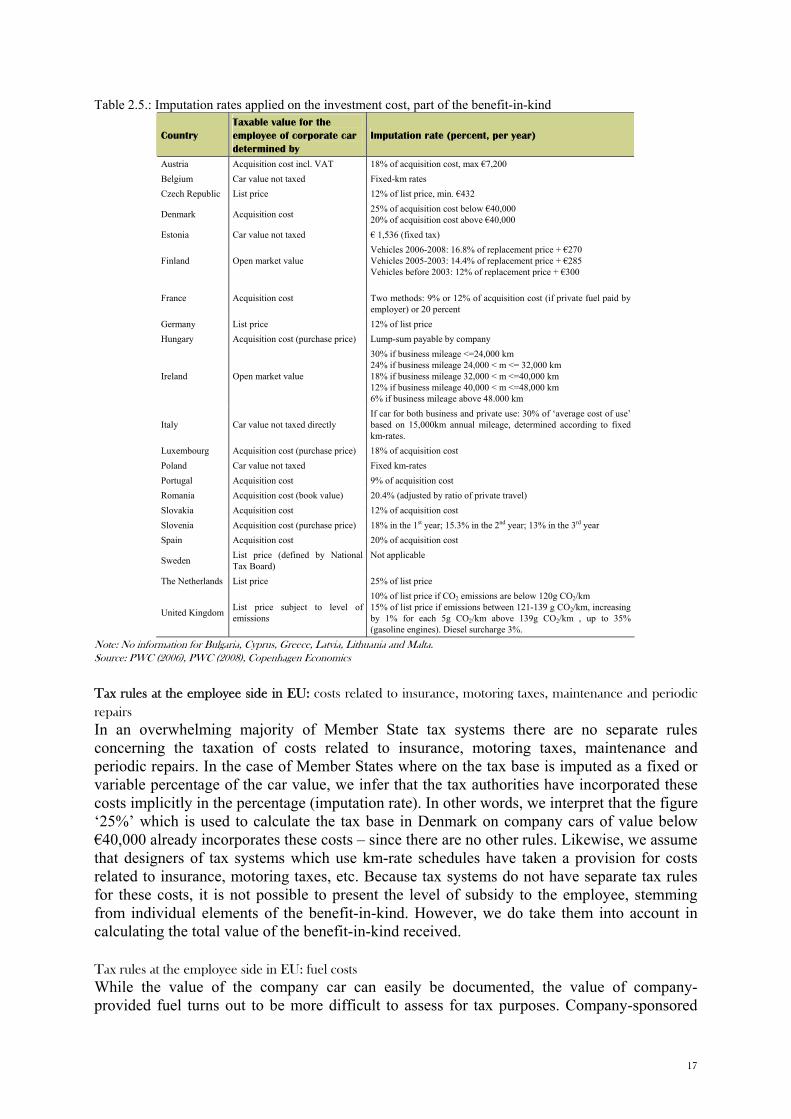
Table 2.5.: Imputation rates applied on the investment cost, part of the benefit-in-kind
Country Taxable value for the employee of corporate car determined by
Imputation rate (percent, per year)
Austria Acquisition cost incl. VAT 18% of acquisition cost, max €7,200 Belgium Car value not taxed Fixed-km rates Czech Republic List price 12% of list price, min. €432
Denmark Acquisition cost 25% of acquisition cost below €40,000 20% of acquisition cost above €40,000
Estonia Car value not taxed € 1,536 (fixed tax)
Finland Open market value Vehicles 2006-2008: 16.8% of replacement price + €270 Vehicles 2005-2003: 14.4% of replacement price + €285 Vehicles before 2003: 12% of replacement price + €300
France Acquisition cost Two methods: 9% or 12% of acquisition cost (if private fuel paid by employer) or 20 percent
Germany List price 12% of list price Hungary Acquisition cost (purchase price) Lump-sum payable by company
Ireland Open market value
30% if business mileage <=24,000 km 24% if business mileage 24,000 < m <= 32,000 km 18% if business mileage 32,000 < m <=40,000 km 12% if business mileage 40,000 < m <=48,000 km 6% if business mileage above 48.000 km
Italy Car value not taxed directly If car for both business and private use: 30% of ‘average cost of use’ based on 15,000km annual mileage, determined according to fixed km-rates.
Luxembourg Acquisition cost (purchase price) 18% of acquisition cost Poland Car value not taxed Fixed km-rates Portugal Acquisition cost 9% of acquisition cost Romania Acquisition cost (book value) 20.4% (adjusted by ratio of private travel) Slovakia Acquisition cost 12% of acquisition cost Slovenia Acquisition cost (purchase price) 18% in the 1st year; 15.3% in the 2nd year; 13% in the 3rd year Spain Acquisition cost 20% of acquisition cost
Sweden List price (defined by National Tax Board)
Not applicable
The Netherlands List price 25% of list price
United Kingdom List price subject to level of emissions
10% of list price if CO2 emissions are below 120g CO2/km 15% of list price if emissions between 121-139 g CO2/km, increasing by 1% for each 5g CO2/km above 139g CO2/km , up to 35% (gasoline engines). Diesel surcharge 3%.
Note: No information for Bulgaria, Cyprus, Greece, Latvia, Lithuania and Malta. Source: PWC (2006), PWC (2008), Copenhagen Economics
Tax rules at the employee side in EU: costs related to insurance, motoring taxes, maintenance and periodic repairs In an overwhelming majority of Member State tax systems there are no separate rules concerning the taxation of costs related to insurance, motoring taxes, maintenance and periodic repairs. In the case of Member States where on the tax base is imputed as a fixed or variable percentage of the car value, we infer that the tax authorities have incorporated these costs implicitly in the percentage (imputation rate). In other words, we interpret that the figure ‘25%’ which is used to calculate the tax base in Denmark on company cars of value below €40,000 already incorporates these costs – since there are no other rules. Likewise, we assume that designers of tax systems which use km-rate schedules have taken a provision for costs related to insurance, motoring taxes, etc. Because tax systems do not have separate tax rules for these costs, it is not possible to present the level of subsidy to the employee, stemming from individual elements of the benefit-in-kind. However, we do take them into account in calculating the total value of the benefit-in-kind received.
Tax rules at the employee side in EU: fuel costs While the value of the company car can easily be documented, the value of company-provided fuel turns out to be more difficult to assess for tax purposes. Company-sponsored
17

private fuel use can vary over time and is more difficult to document than a one-off purchase of a car. Member States have approached the issue of taxing company-provided fuel in several ways. One approach is to levy the tax according to km-rates which are calculated to approximate the actual fuel use, either for a representative vehicle or several specific vehicles. Another approach is to approximate fuel use by allowing employees to adjust the tax base due on the value of the car, i.e. the tax base is lowered when private use is low. The adjustment can be in ‘steps’ (the lump-sum method) or according to logbook (‘actual use’ method). A combination of the two is also possible in some countries. The last approach is to have no explicit rules on fuel use. Table 2.6 summarises the approaches to taxing fuel use. Table 2.6. : Summary of approaches to tax company provided fuel
Valuation method Definition
km-rates The value of the fuel is incorporated in km-rates. The value of the tax base increases directly in proportion to the number of km driven privately.
Lump-sum method only Tax authority defines thresholds for car usage intensity with respect to mileage – and values of taxable benefits to be declared in personal income tax. The system offers simplicity and may pay off with intensive private use.
Actual use method only Employee registers actual use in logbook. Value of taxable benefit determined by multiplying mileage by km-rates of tax. Benefit: lower tax when usage low. The UK is a special case where the actual value of fuel received is declarable.
Choice-dependent Employee chooses the most advantageous method from either lump-sum or actual use.
Fuel not taxed explicitly Tax authority does not explicitly take the benefit of the company provided fuel into account.
Source: Copenhagen Economics
Only 10 Member States have some rules on the taxation of the fuel part of the benefit-in-kind, with the intention to adjust the tax base to the actual use of the company car for private purposes. Those countries include the ones operating a km-rate system. Such tax systems require documentation of the actual km travelled in the form of a log book. Tax systems based solely on km-rates are not common, however. More often, countries combine this system with the possibility of adjusting the percentage relating to the car acquisition value according to pre-defined thresholds of private use. The latter approach is applied in cases where documentation of private travel in the form of e.g. log books cannot be or have not been kept. Under some circumstances, it may also be possible for the employee to choose the most advantageous tax method, e.g. in France and Germany. The ‘actual use’ method would then be preferred by employees with few privately driven kilometres (the burden of proof would fall on them) while the ‘lump-sum’ would be preferred by employees with many private kilometres. Sometimes, there are several imputation rates in the lump-sum method, e.g. 9% for low private use or 12% for high private use in France, or 5 percentage thresholds defined according to private use in Ireland, cf. Table 2.5. The more thresholds there are, the better the approximation of the actual level of private use – and hence the higher the precision of the tax base calculation. A large group consisting of 12 countries does not, however, have separate rules concerning the fuel part of the benefit-in-kind, cf. Table 2.7. In practice this means that the fuel part of the benefit-in-kind escapes taxation. This creates the incentive to use the car intensely for private purposes – as long as the employer provides free, untaxed fuel. Systems with such incentives are present e.g. in Denmark, Estonia and Germany, where tax authorities do not estimate the value of employer-provided fuel in calculating a tax base explicitly.
18

Table 2.7.: Fuel Cost (private use of company paid fuel) Fuel not taxed explicitly
Actual, log based dependent on fuel use (only)
Lump-sum dependent on fuel use (only)
Choice dependent
Austria Bulgaria Czech Rep. Estonia Denmark Hungary Poland Portugal Romania Slovakia Spain the Netherlands
No countries Italy United Kingdom (CO2
emission schedules) Slovenia Sweden
Belgium Luxembourg France Finland Germany Ireland
Note: No information for Cyprus, Greece, Latvia, Lithuania and Malta. Lump-sum tax is computed based on pre-defined level of usage in terms of km driven. Actual tax is based on documented level of usage in terms of km driven. Source: PWC (2008)
2.4. TAXATION RULES IN MEMBER STATES: COMPANY SIDE Company tax rules can offer subsidies to company cars in two cases. The first case involves the treatment of company car depreciation for corporate income tax purposes. The second case concerns the deductibility of input VAT at the time of purchasing the car. The two cases are important because both depreciation (the loss of car value over time) and the VAT account for the largest fractions of ownership costs to companies. Therefore, it is important to check whether, and to which extent, companies can deduct such expenses from their income tax obligations.
In what follows, we outline the mechanisms that lead to subsidising in both cases, and analyse the actual tax rules in the Member States to conclude whether subsides occur. We find that the depreciation rates specified in Member States’ accounting rules generally reflect well market depreciation rates, and therefore are not subsidising company cars. The lack of subsidy-generating distortions in depreciation rules is not surprising, given that accounting rules are designed on the basic premise of reflecting a truthful and accurate representation of company assets. Furthermore, national accounting rules in EU Member States are to an increasing extent based on international accounting standards such as the IAS, or the GAAP. The very fact that firms can deduct a leasing fee or a depreciation charge while an employee cannot is not by itself a subsidy. Any costs associated with gross remuneration of employees should be deductable provided it is taxed at the employee side. The problem arises from the fact that cost borne by the firm is not reflected fully in a corresponding raise of the tax base of the employee.
Deductibility of input VAT on company car and other car tax issues In certain Member States, corporate buyers of cars may be entitled to a VAT deduction of the price paid for the car whose purpose is dual, i.e. both business and for private employee use12. Most often, countries follow one of two models of determining how VAT is levied in the case of company cars. The first model is that the VAT is deductible for the company and typically 12 Countries typically distinguish between the use of the car (strictly business, or dual use) and the type of company that purchases it. VAT is nearly always deductible for companies for whom the cars are the main production assets, such as taxi companies or driving schools. For companies where cars are not the main productive assets, there can be restrictions on VAT deductibility.
19
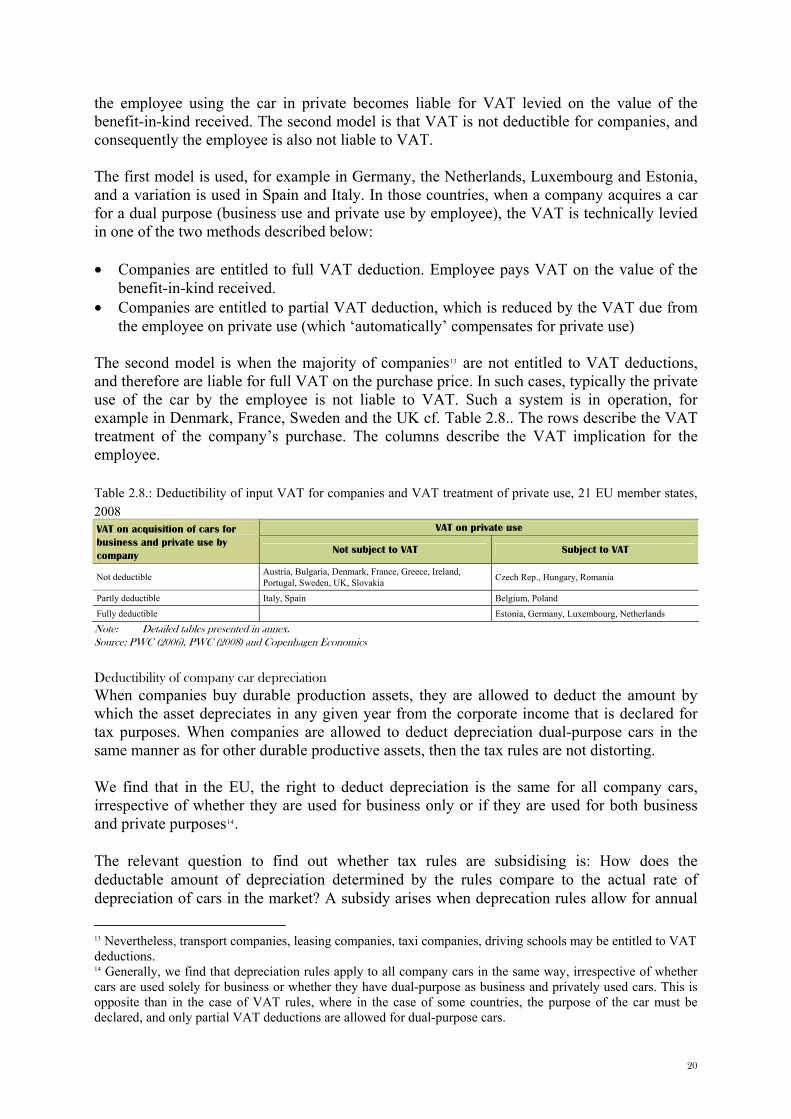
the employee using the car in private becomes liable for VAT levied on the value of the benefit-in-kind received. The second model is that VAT is not deductible for companies, and consequently the employee is also not liable to VAT. The first model is used, for example in Germany, the Netherlands, Luxembourg and Estonia, and a variation is used in Spain and Italy. In those countries, when a company acquires a car for a dual purpose (business use and private use by employee), the VAT is technically levied in one of the two methods described below: • Companies are entitled to full VAT deduction. Employee pays VAT on the value of the
benefit-in-kind received. • Companies are entitled to partial VAT deduction, which is reduced by the VAT due from
the employee on private use (which ‘automatically’ compensates for private use) The second model is when the majority of companies13 are not entitled to VAT deductions, and therefore are liable for full VAT on the purchase price. In such cases, typically the private use of the car by the employee is not liable to VAT. Such a system is in operation, for example in Denmark, France, Sweden and the UK cf. Table 2.8.. The rows describe the VAT treatment of the company’s purchase. The columns describe the VAT implication for the employee. Table 2.8.: Deductibility of input VAT for companies and VAT treatment of private use, 21 EU member states, 2008
VAT on private use VAT on acquisition of cars for business and private use by company Not subject to VAT Subject to VAT
Not deductible Austria, Bulgaria, Denmark, France, Greece, Ireland, Portugal, Sweden, UK, Slovakia Czech Rep., Hungary, Romania
Partly deductible Italy, Spain Belgium, Poland
Fully deductible Estonia, Germany, Luxembourg, Netherlands
Note: Detailed tables presented in annex. Source: PWC (2006), PWC (2008) and Copenhagen Economics
Deductibility of company car depreciation When companies buy durable production assets, they are allowed to deduct the amount by which the asset depreciates in any given year from the corporate income that is declared for tax purposes. When companies are allowed to deduct depreciation dual-purpose cars in the same manner as for other durable productive assets, then the tax rules are not distorting. We find that in the EU, the right to deduct depreciation is the same for all company cars, irrespective of whether they are used for business only or if they are used for both business and private purposes14.
The relevant question to find out whether tax rules are subsidising is: How does the deductable amount of depreciation determined by the rules compare to the actual rate of depreciation of cars in the market? A subsidy arises when deprecation rules allow for annual 13 Nevertheless, transport companies, leasing companies, taxi companies, driving schools may be entitled to VAT deductions. 14 Generally, we find that depreciation rules apply to all company cars in the same way, irrespective of whether cars are used solely for business or whether they have dual-purpose as business and privately used cars. This is opposite than in the case of VAT rules, where in the case of some countries, the purpose of the car must be declared, and only partial VAT deductions are allowed for dual-purpose cars.
20

deductions that exceed the actual depreciation in the market. The company would save on income tax essentially in the form of interest free loan15. Conversely, deductions which fall short of the actual market depreciation rate would increase the income tax liability of the company. Finally, the case when book depreciation equals market depreciation is neutral. To carry out the above analysis of tax rules, we require a comparison with the actual depreciation of cars in the market. The true market depreciation rates are notoriously hard to estimate, however approximate depreciation rates are compiled, among others, by fleet management companies.16 They suggest that company cars lose roughly 66 percent of their original value over the first three years of ownership, cf. Table 2.9.. This is equal to a yearly depreciation rate of about 22 percent. Table 2.9.: Market rates of depreciation, value lost after 1 year, in percent
Polk segment Percentage of original value lost after 1 year Large 22.1 Upper Medium 21.4 Lower Medium 22.7 Medium 21.9 Small 21.8 Mini 21.8 Average 21.9
Source: www.fleetnews.co.uk, Polk (2009) and Copenhagen Economics
When comparing the average annual market depreciation to the depreciation rates allowed by Member State accounting laws, we notice that in practice, rules give companies some flexibility to choose the appropriate depreciation rate. Specifically, companies are often allowed to apply a depreciation rate that reflects the pattern in which the car’s economic benefits are consumed by the enterprise.17 For example, some countries specify permissible intervals (e.g. Romania, 11-33 percent per annum). In such cases, we conclude that the annual rates of deprecation are similar to or below the market rates of depreciation (20-22 percent). Following this approach, we do not find that the most common fiscal depreciation rules exceed market depreciation in any Member State.18 On the contrary, we find that in the case of 10 Member States accounting depreciation rates are similar to market rates, while in another 10 Member States the rates can in fact be below the market rates, cf. Table 2.10.
15 If tax depreciations exceed the actual fall in market value, the difference will be added to the income tax base in the year where the car is sold. The advantage is then the excessive deductions in the tax base in the years up to the disposal which creates an interest free loan: the size of the loan is also determined by the size of company tax rate. 16 For an overview of the factors driving market depreciation rates in passenger cars, refer to: http://www.intellichoice.com/carBuying101/UnderstandingDepreciation. 17 This is consistent with the International Accounting Standards (IAS) rule 16. 18 In our review, we concentrated on the rules applying to the most commonly purchased company cars. In certain countries, depreciation rules may be designed so as to promote special cars, such as environmentally friendly cars. For example, in the UK, firms are allowed to fully depreciate environmentally friendly cars in the first year, which de facto constitutes the “interest free” loan provided by tax authorities for the purchase of such cars by firms.
21

Table 2.10: Tax deductibility of depreciation Deductibility of depreciation for tax purposes Country Tax deductible depreciation higher than market depreciation No countries Tax deductible depreciation similar to market depreciation Denmark, Estonia, Germany, Italy, Luxembourg,
Netherlands, Romania, Slovakia, Spain, Sweden Tax deductible depreciation lower than market rate Austria, Belgium, Czech R., France, Greece, Ireland, Poland,
Portugal, Slovenia, UK Not known Bulgaria, Cyprus, Hungary, Latvia, Lithuania, Malta
Note: In Finland, depreciation is only deductible for business use, however the rate is not known. Source: PWC (2006) and PWC (2008)
Chapter 3 SUBSIDIES AND WELFARE EFFECTS AT THE MACRO LEVEL Starting with the conclusion from above, that all segments of the company car market receive significant tax subsidies, we review in this chapter the size of overall tax subsidy and related fiscal and environmental implications. First, we provide some basic facts about the composition and size of the company car stock in EU (3.1). Second, we provide on this basis some macro-level estimates of the overall size of tax subsidies in Member States countries (3.2). Third, we present some ball park estimates of the subsidies effect on the size and composition of the company and other cars being sold in most recent years (3.3). Fourth, we outline the possible impact on CO2 emissions and energy use resulting from these effects (3.4).
3.1. NUMBER AND STRUCTURE OF COMPANY CARS In this section, we analyse the amount of cars in 18 EU Member States, and distinguish between private and company registrations within each of six identified segments. We base our analysis on the latest available registration statistics from 2008 provided by Polk and described in the appendix. The data covers vehicles registered as M1 type approval.
Company cars in the EU We find that company registrations account for about 50.5 percent of the 11.6 million passenger cars registered across the 18 EU Member States in 2008. Company sales accounted for 5.7 million passenger cars, while private sales accounted for 5.9 million cars, cf. Table 3.1.. The relatively large share of company cars means that company cars are de facto very common in the EU.19 Table 3.1: Passenger car registrations in 18 EU countries 2008
Registrations
Company Private Total Car sales, 2008 5.7 million 5.9 million 11.6 million Average of registrations to total sales 50.5% 49.5% 100%
Note: The countries included are Austria, Belgium, Czech Republic, Denmark, Finland, Germany, Greece, Hungary, Italy, Luxembourg, Netherlands, Poland, Portugal, Slovakia, Slovenia, Spain, Sweden and United Kingdom. Source: Copenhagen Economics and Polk (2009)
Company car segments in the EU Cars purchased by companies are predominantly in the small, lower medium and medium segment – collectively the three segments account for about 85 percent of company cars. 19 This is in line with similar observations reported in the literature, for example Puigarnau and van Ommeren (2007).
22

However, these three segments are also the most popular ones among private consumers, accounting for essentially the same proportion of registrations: 83 percent. However, differences in the shares of company and private cars become more pronounced when we look at the six individual segments. At that level, we find a strong tendency that the relative share of company cars increases with the size of the segment. For example, in the mini segment, company cars account for 31% of the approximately 1 million cars sold in the 18 EU countries in that segment. In the most popular lower medium segment, the share of company-registered cars rises to 48% out of the 4.25 million total registered cars in the 18 EU Member States. In the largest car segment (comprising the premium car models) the dominance of company registrations is overwhelming, with a share of 76 percent of sales. The size of the large segment, however, stands at 70,000 units in 2008 and is dwarfed by the remaining segments, cf. figure 3.1.. Figure 3.1: Structure of registrations by segment in 18 EU countries, 2008, millions of cars registered (volume)
Note: The 18 EU Member States include Austria, Belgium, Czech Republic, Denmark, Finland, Germany, Greece, Hungary, Italy, Luxembourg, the Netherlands, Poland, Portugal, Slovakia, Slovenia, Spain, Sweden, and United Kingdom. Source: Polk (2009) and Copenhagen Economics
Company cars at the country level The absolute number of company car registrations is correlated to the size of the total car market in a country. Not surprisingly, the largest amount of company car registrations, 1.23 million, is in the country with the largest number of total registrations, Germany. Likewise, the smallest number of company car registrations, approximately 20,000 units is in Luxembourg, the country with the lowest number of total registrations. However, the share of company cars in total registrations in 2008 varies substantially across the countries. The lowest share of company cars is in Greece, with only 24 percent company car registrations. The highest share of company cars is in Germany, 60 percent. On average across the 18 surveyed EU Member States, the share of company cars amounts to 49.5 percent, c.f. Table 3.2.
23
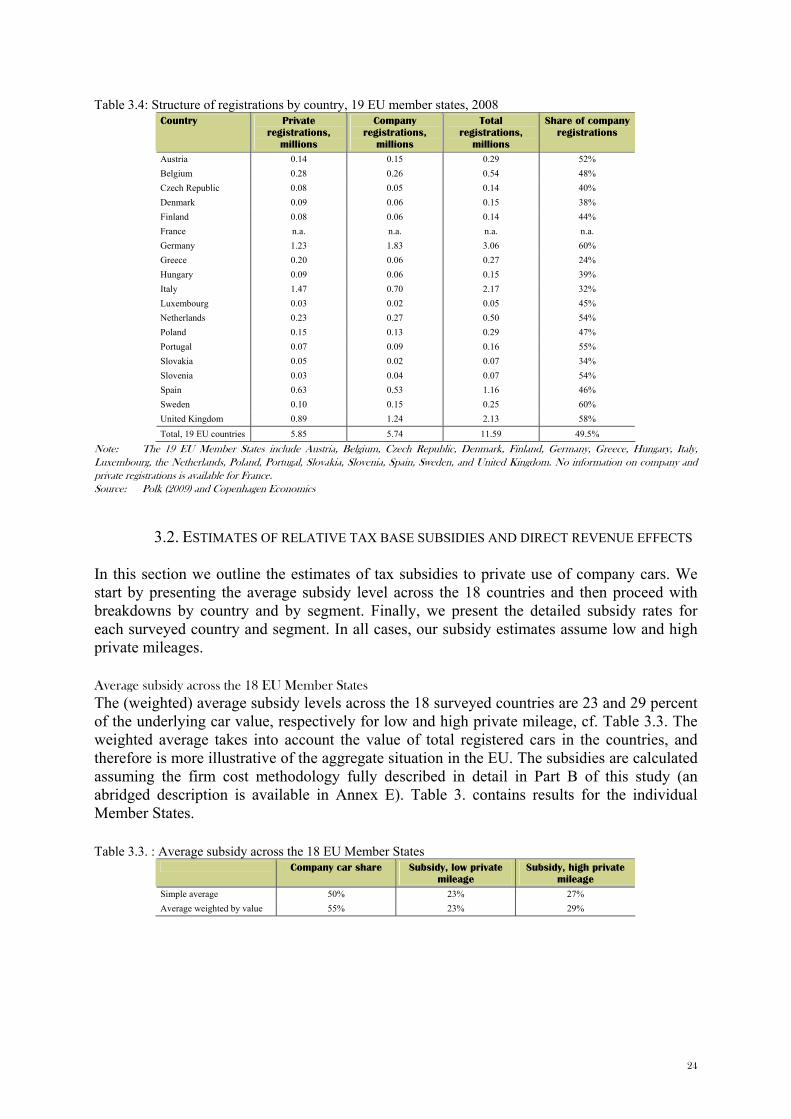
Table 3.4: Structure of registrations by country, 19 EU member states, 2008 Country Private
registrations, millions
Company registrations,
millions
Total registrations,
millions
Share of company registrations
Austria 0.14 0.15 0.29 52% Belgium 0.28 0.26 0.54 48% Czech Republic 0.08 0.05 0.14 40% Denmark 0.09 0.06 0.15 38% Finland 0.08 0.06 0.14 44% France n.a. n.a. n.a. n.a. Germany 1.23 1.83 3.06 60% Greece 0.20 0.06 0.27 24% Hungary 0.09 0.06 0.15 39% Italy 1.47 0.70 2.17 32% Luxembourg 0.03 0.02 0.05 45% Netherlands 0.23 0.27 0.50 54% Poland 0.15 0.13 0.29 47% Portugal 0.07 0.09 0.16 55% Slovakia 0.05 0.02 0.07 34% Slovenia 0.03 0.04 0.07 54% Spain 0.63 0.53 1.16 46% Sweden 0.10 0.15 0.25 60% United Kingdom 0.89 1.24 2.13 58% Total, 19 EU countries 5.85 5.74 11.59 49.5%
Note: The 19 EU Member States include Austria, Belgium, Czech Republic, Denmark, Finland, Germany, Greece, Hungary, Italy, Luxembourg, the Netherlands, Poland, Portugal, Slovakia, Slovenia, Spain, Sweden, and United Kingdom. No information on company and private registrations is available for France. Source: Polk (2009) and Copenhagen Economics
3.2. ESTIMATES OF RELATIVE TAX BASE SUBSIDIES AND DIRECT REVENUE EFFECTS In this section we outline the estimates of tax subsidies to private use of company cars. We start by presenting the average subsidy level across the 18 countries and then proceed with breakdowns by country and by segment. Finally, we present the detailed subsidy rates for each surveyed country and segment. In all cases, our subsidy estimates assume low and high private mileages.
Average subsidy across the 18 EU Member States The (weighted) average subsidy levels across the 18 surveyed countries are 23 and 29 percent of the underlying car value, respectively for low and high private mileage, cf. Table 3.3. The weighted average takes into account the value of total registered cars in the countries, and therefore is more illustrative of the aggregate situation in the EU. The subsidies are calculated assuming the firm cost methodology fully described in detail in Part B of this study (an abridged description is available in Annex E). Table 3. contains results for the individual Member States. Table 3.3. : Average subsidy across the 18 EU Member States
Company car share Subsidy, low private mileage
Subsidy, high private mileage
Simple average 50% 23% 27% Average weighted by value 55% 23% 29%
24
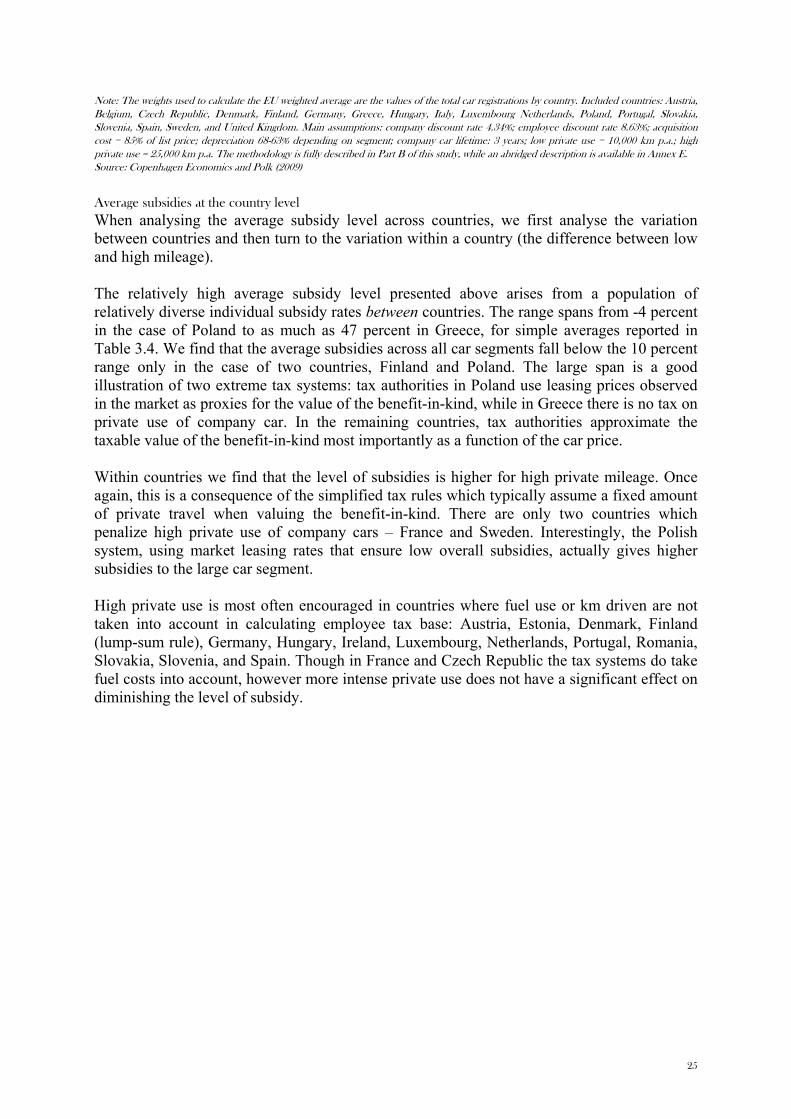
Note: The weights used to calculate the EU weighted average are the values of the total car registrations by country. Included countries: Austria, Belgium, Czech Republic, Denmark, Finland, Germany, Greece, Hungary, Italy, Luxembourg Netherlands, Poland, Portugal, Slovakia, Slovenia, Spain, Sweden, and United Kingdom. Main assumptions: company discount rate 4.34%; employee discount rate 8.63%; acquisition cost = 85% of list price; depreciation 68-63% depending on segment; company car lifetime: 3 years; low private use = 10,000 km p.a.; high private use = 25,000 km p.a. The methodology is fully described in Part B of this study, while an abridged description is available in Annex E. Source: Copenhagen Economics and Polk (2009)
Average subsidies at the country level When analysing the average subsidy level across countries, we first analyse the variation between countries and then turn to the variation within a country (the difference between low and high mileage). The relatively high average subsidy level presented above arises from a population of relatively diverse individual subsidy rates between countries. The range spans from -4 percent in the case of Poland to as much as 47 percent in Greece, for simple averages reported in Table 3.4. We find that the average subsidies across all car segments fall below the 10 percent range only in the case of two countries, Finland and Poland. The large span is a good illustration of two extreme tax systems: tax authorities in Poland use leasing prices observed in the market as proxies for the value of the benefit-in-kind, while in Greece there is no tax on private use of company car. In the remaining countries, tax authorities approximate the taxable value of the benefit-in-kind most importantly as a function of the car price. Within countries we find that the level of subsidies is higher for high private mileage. Once again, this is a consequence of the simplified tax rules which typically assume a fixed amount of private travel when valuing the benefit-in-kind. There are only two countries which penalize high private use of company cars – France and Sweden. Interestingly, the Polish system, using market leasing rates that ensure low overall subsidies, actually gives higher subsidies to the large car segment. High private use is most often encouraged in countries where fuel use or km driven are not taken into account in calculating employee tax base: Austria, Estonia, Denmark, Finland (lump-sum rule), Germany, Hungary, Ireland, Luxembourg, Netherlands, Portugal, Romania, Slovakia, Slovenia, and Spain. Though in France and Czech Republic the tax systems do take fuel costs into account, however more intense private use does not have a significant effect on diminishing the level of subsidy.
25

Table 3.4: Estimates of subsidies across 19 EU countries, high and low private mileage, 2008 Country Company
car share Subsidy (low)
Subsidy (high)
Company car share
Subsidy (low)
Subsidy (high)
Simple averages Weighted averages Austria 52% 25% 30% 58% 23% 27%
Belgium 48% 33% 38% 54% 33% 38%
Czech Republic 40% 28% 35% 48% 27% 33% Denmark 38% 12% 15% 46% 12% 15% Finland 44% 9% 13% 47% 8% 13% France N.A. 32% 21% N.A. 31% 20% Germany 60% 27% 33% 64% 27% 32% Greece 24% 42% 47% 26% 42% 47% Hungary 39% 33% 39% 46% 33% 38% Italy 32% 29% 33% 39% 28% 32% Luxembourg 45% 23% 27% 50% 22% 26% Netherlands 54% 13% 18% 61% 12% 17% Poland 47% -10% -4% 53% -12% -5% Portugal 55% 33% 37% 59% 32% 36% Slovakia 34% 31% 37% 42% 30% 36% Slovenia 54% 24% 29% 56% 23% 28% Spain 46% 22% 26% 47% 21% 25% Sweden 60% 16% 14% 64% 17% 16% United Kingdom 58% 16% 22% 61% 16% 22%
Simple average 67.15% 22% 26% Average weighted by value
55% 24% 27%
Note: The weights in the weighted average are the relative values of the segments, per country. To calculate the average across countries, we use the value of the company car registrations in the country as weight. Included countries: Austria, Belgium, Czech Republic, Denmark, Finland, Germany, Greece, Hungary, Italy, Luxembourg Netherlands, Poland, Portugal, Slovakia, Slovenia, Spain, Sweden, and United Kingdom. Main assumptions: company discount rate 4.34%; employee discount rate 8.63%; acquisition cost = 85% of list price; depreciation 68-63% depending on segment; company car lifetime: 3 years; low private use = 10.000 km p.a.; high private use = 25.000 km p.a. The data for France is partly missing. The methodology is fully described in Part B of this study, while an abridged description is available in Annex E. Source: Polk (2009) and Copenhagen Economics
26

Average subsidies across segments at the EU level Across the 18 EU Member States the level of subsidy tends to decline with the price of the car, i.e. lower subsidy rates for up-market segments. This is particularly noticeable for subsidies under high private mileage, c.f. Table 3.5. One explanation for this phenomenon lies in the fact that the increasing fuel costs are typically not taken into account in taxation systems based on imputed tax rates levied solely on the value of the car, while the value of company-provided fuel constitutes a larger share of the value of the benefit-in-kind for smaller car segments, whose value is lower.20 On the other hand, the rather uniform subsidy for the low private use may be a reflection of the fact that the level of imputation rates applied by tax authorities across the 18 EU Member States may assume a private use close to 10,000 kilometres per year – as assumed in low private mileage case in this study. Table 3.5: Estimates of subsidies in 6 segments across the EU, 2008 sales
Segment Company car share
Subsidy (low)
Subsidy (high)
Company car share
Subsidy (low)
Subsidy (high)
Simple averages Average weighted by values 1 Mini 31% 24% 31% 31% 29% 35% 2 Small 37% 23% 30% 37% 27% 32% 3 Lower Medium 51% 22% 27% 51% 25% 28% 4 Medium 65% 22% 25% 65% 23% 25% 5 Upper Medium 70% 22% 24% 70% 22% 23% 6 Large 76% 23% 24% 76% 22% 22% Simple average 67% 23% 27% Weighted average 50% 25% 29%
Note: The weights in the weighted average are the relative values of total sales of passenger cars by countries, within a segment. To calculate the average across countries, we use the value of the total car registrations in the country as weight. Included countries: Austria, Belgium, Czech Republic, Denmark, Finland, Germany, Greece, Hungary, Italy, Luxembourg Netherlands, Poland, Portugal, Slovakia, Slovenia, Spain, Sweden, and United Kingdom. Main assumptions: company discount rate 4.34%; employee discount rate 8.63%; acquisition cost = 85% of list price; depreciation 68-63% depending on segment; company car lifetime: 3 years; low private use = 10,000 km p.a.; high private use = 25,000 km p.a. Source: Polk (2009) and Copenhagen Economics
Fiscal losses While we repeat that the estimates should be interpreted with caution, our results indicate that the direct fiscal losses could approximate up to ½ percent of GDP for the EU as a whole cf.Table 3.6.. They tend naturally to be highest in countries with very low imputation rates and at the same time substantial yearly purchases of company cars such as in Germany and very small at the other end in such countries as Denmark. The methodology for calculating fiscal losses is explained in Annex D, the numbers should be seen as ball-park estimates given the many assumptions required to calculate them as described in chapter 2.
20 This is because the relative value of fuel provided by the employer is higher in the case of less expensive, smaller cars. In most of the EU Member States, company-provided fuel does not increase the taxable base for the employee, hence increases the subsidy.
27
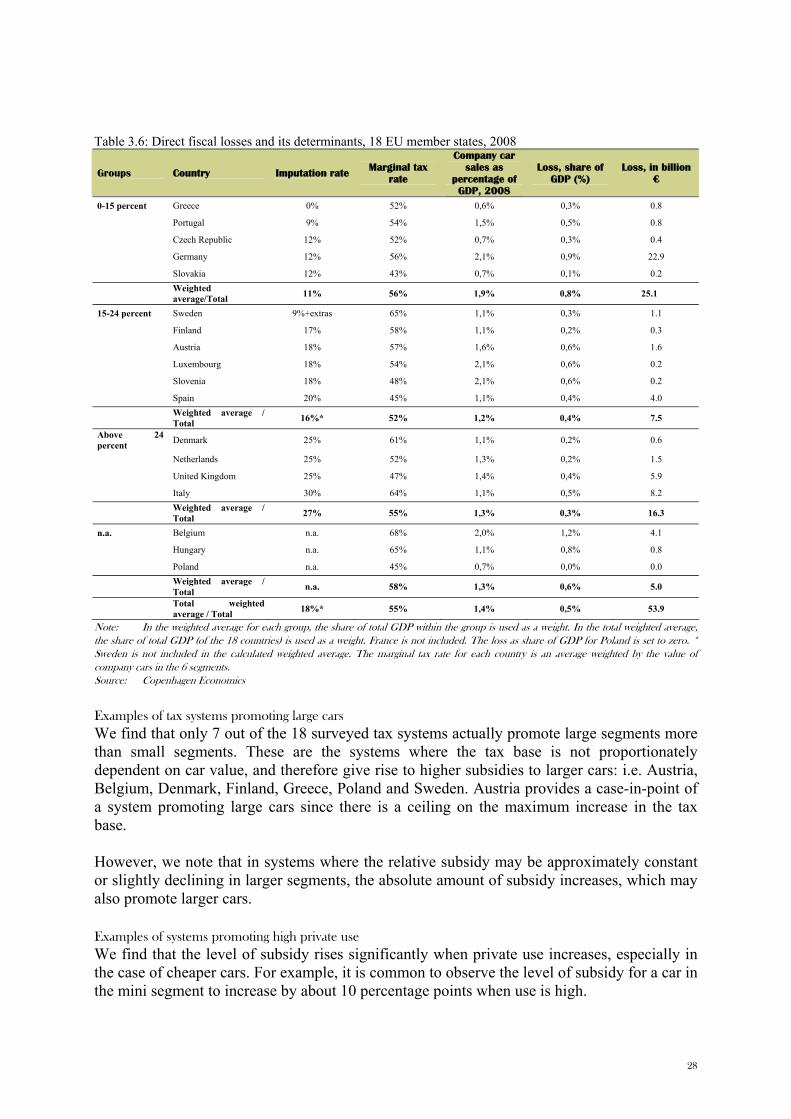
Table 3.6: Direct fiscal losses and its determinants, 18 EU member states, 2008
Groups Country Imputation rate Marginal tax rate
Company car sales as
percentage of GDP, 2008
Loss, share of GDP (%)
Loss, in billion
€
0-15 percent Greece 0% 52% 0,6% 0,3% 0.8
Portugal 9% 54% 1,5% 0,5% 0.8
Czech Republic 12% 52% 0,7% 0,3% 0.4
Germany 12% 56% 2,1% 0,9% 22.9
Slovakia 12% 43% 0,7% 0,1% 0.2
Weighted average/Total 11% 56% 1,9% 0,8% 25.1
15-24 percent Sweden 9%+extras 65% 1,1% 0,3% 1.1
Finland 17% 58% 1,1% 0,2% 0.3
Austria 18% 57% 1,6% 0,6% 1.6
Luxembourg 18% 54% 2,1% 0,6% 0.2
Slovenia 18% 48% 2,1% 0,6% 0.2
Spain 20% 45% 1,1% 0,4% 4.0
Weighted average / Total 16%* 52% 1,2% 0,4% 7.5
Above 24 percent Denmark 25% 61% 1,1% 0,2% 0.6
Netherlands 25% 52% 1,3% 0,2% 1.5
United Kingdom 25% 47% 1,4% 0,4% 5.9
Italy 30% 64% 1,1% 0,5% 8.2
Weighted average / Total 27% 55% 1,3% 0,3% 16.3
n.a. Belgium n.a. 68% 2,0% 1,2% 4.1
Hungary n.a. 65% 1,1% 0,8% 0.8
Poland n.a. 45% 0,7% 0,0% 0.0
Weighted average / Total n.a. 58% 1,3% 0,6% 5.0
Total weighted average / Total 18%* 55% 1,4% 0,5% 53.9
Note: In the weighted average for each group, the share of total GDP within the group is used as a weight. In the total weighted average, the share of total GDP (of the 18 countries) is used as a weight. France is not included. The loss as share of GDP for Poland is set to zero. * Sweden is not included in the calculated weighted average. The marginal tax rate for each country is an average weighted by the value of company cars in the 6 segments. Source: Copenhagen Economics
Examples of tax systems promoting large cars We find that only 7 out of the 18 surveyed tax systems actually promote large segments more than small segments. These are the systems where the tax base is not proportionately dependent on car value, and therefore give rise to higher subsidies to larger cars: i.e. Austria, Belgium, Denmark, Finland, Greece, Poland and Sweden. Austria provides a case-in-point of a system promoting large cars since there is a ceiling on the maximum increase in the tax base. However, we note that in systems where the relative subsidy may be approximately constant or slightly declining in larger segments, the absolute amount of subsidy increases, which may also promote larger cars.
Examples of systems promoting high private use We find that the level of subsidy rises significantly when private use increases, especially in the case of cheaper cars. For example, it is common to observe the level of subsidy for a car in the mini segment to increase by about 10 percentage points when use is high.
28

However, the increase in the subsidy is somewhat less pronounced for more expensive cars. The intuition is that the share of the fuel in the value of the benefit-in-kind is smaller for larger and more expensive cars. In general, however, there is evidence that a number of current EU tax systems favour more intensive private use of a company car.
Sensitivity of subsidy calculations In this section we investigate the sensitivity of subsidy calculations with respect to two aspects: • Case 1: the switch to an opportunity cost principle as opposed to the firm cost principle currently used in this
study. • Case 2: company purchase advantages with respect to more favourable purchase conditions and financing
costs. In the first case, we test for the influence of the measurement concept employed in the calculation of the subsidy. The calculations presented in the report are based on the firm cost principle meaning that the subsidy measures the difference between the value of the benefit-in-kind as provided by the firm (at a cost) and the imputed tax liability for the employee. The alternative discussed in Chapter 2 is to use the opportunity cost approach which measures the difference between the cost the employee would have incurred when buying the same car and the amount of fuel using after-tax personal income. While the firm costs always will be smaller than opportunity costs, the imputation rate will remain the same in both cases as they are exogenously determined by legislation. Hence, the first sensitivity analysis measures the impact of changing the concept of the subsidy.
Table 3.7 summarises the results of the sensitivity analysis. Table 3.7: Expected effects from the first sensitivity analysis
Countries following acquisition cost principle (i.e. discount off list price)
Countries following list price principle
Switching to opportunity cost approach Subsidy increases more, typically by 2-3%
Subsidy increases less typically by about 0-1%
Note: The countries following the acquisition cost principle are: Finland, Luxembourg, Austria, Hungary, France, Portugal, Slovakia, Slovenia, Spain. The countries following the list cost principle: Czech R., Denmark, Germany, the Netherlands, Sweden. The results are mixed for the rest of the countries. Source: Copenhagen Economics
The subsidy will increase in all countries, since opportunity costs are larger than firm costs as firms have purchasing advantages. Thus, moving to the opportunity cost approach for calculating the subsidy increases the value of the car but does not change the amount of tax declarable as this is determined by the tax rules. Hence the subsidy increases. In countries where the imputed tax is currently calculated with acquisition costs, the subsidy will increase more relative to countries where the list price is used as tax basis21.
21 Moving to the opportunity cost approach, there will still be an increase even in countries whose tax rules require stating list prices of the car. This is precisely a reflection of the fact that imputation rates can only approximately assess the correct (neutral) amount of the tax. The increase in the subsidy in this case is a sign of the “inability” of imputation rates to capture the correct amount of tax due.
29

In the second case, we test for the influence of the company purchasing advantage used in the calculation of the subsidy according to the firm cost approach. The company purchasing advantage manifests itself through two parameters, namely the amount of discount the company is able to obtain off the car list price and the financing cost advantage over the employee. Changing these parameters changes both the value of the firm cost as well as the imputed tax22. We measure sensitivity with two scenarios of parameters: • Scenario 2a: removal of company purchasing advantages, where the borrowing costs are
equalised across firms and employees and set to the average rate (6.5%) and the company discount off the list price is removed.
• Scenario 2b: large company purchase advantage: where the company borrowing cost is set at 2.5% while employee discount rate is 12.5%, and companies pay 75% of the list price.
Table 3.8.summarizes the results. Table 3.8: Expected effects from the second sensitivity analysis
Purchasing advantage and financing advantage Effect Valuation of benefit Decreases (scenario 2a) Increases (scenario 2b)
List price tax base countries Subsidy increases, by 2% Subsidy declines, by 2-3%
Acquisition cost tax base countries Subsidy unchanged Subsidy unchanged
Remaining countries Subsidy increases, by 2% Subsidy declines, by 2-3%
Source: Copenhagen Economics
Scenario 2a In countries following the list price principle, where the imputed tax is fixed, removing the company purchasing advantage increase the subsidy by about 2% (increase the value of the benefit-in-kind received while keeping the imputed tax unchanged). In countries following the acquisition cost principle, the subsidy remains essentially unchanged, as the imputed tax base changes in line with the company purchasing advantages. In the remaining countries, the subsidy also increases by about 2%. This is driven by the fact that in those countries the imputed tax does not react to the increased value of the benefit-in-kind, similar to the list price countries. Scenario 2b In countries following the list price principle, where the imputed tax is fixed, increasing the company purchasing advantage reduces the subsidy by 2-3% (higher company purchasing advantages mean lower value of the benefit-in-kind received while the imputed tax remains unchanged). For acquisition cost countries, the subsidy remains unchanged, for the same reason as before. Finally, the subsidy declines by 2-3% in the remaining countries.
3.3. EFFECT OF SUBSIDIES ON THE SIZE AND COMPOSITION OF COMPANY CARS AND TOTAL CAR MARKET
While this study has established the first (nearly) comprehensive estimates of the level of subsidies across the EU to company cars, it does not examine changes over time. Hence, it provides very limited ability to evaluate the effects of historical changes in the taxation of company cars and its effect on either the stock of company cars or the overall car market in 22 As opposed to the first sensitivity analysis where the imputed tax remains unchanged.
30

the Member States of EU. We have therefore embarked upon an evaluation strategy that uses primarily other sources to provide estimates of the effect of such subsidies while providing initially an overview of the car purchase pattern within EU including shares of company cars. The overall evaluation is thus empirically based on three elements: • Broad brush determinants of car purchase patterns in EU • Extrapolating the two studies by Puigarnau and van Ommeren (2007, 2009) on company
car subsidies in the Netherlands to EU level • Evaluations of changes in actual registrations of company cars due to changes in company
car taxation rules in UK and Denmark
Broad brush determinants of car purchase patterns in EU The main driver of car purchases within the EU is per capita income. The higher the income level the higher the spending on cars per capita cf. Figure 3.2. However, there are also other important determinants revealed by the fact that a large group of countries with roughly the same income per capita levels spend substantially different amounts on car purchases. This applies, in particular, on the countries with per capita income above the EU average. One of many determinants is of course the high purchase taxes, as in Denmark and the Netherlands (cf. figure 3.2. panel B). This pulls these countries below the dotted line, which depicts the average relation between per capita income and car purchases cf. panel A in figure 3.2.
31

Figure 3.2: Effects of per capita income and purchase tax on car purchases, 25 EU member states, 2008 Panel A: Per capita car purchase (net of one-off registration taxes) relative to income.
AT
BE
CY
CZ
DE
DK
EE
ES
FI
FR
GR
HU
IE
IT
LTLV MT
NL
PL
PT
RO
SE
SI
SK
UK
R² = 0,6054
0
100
200
300
400
500
600
700
800
900
1000
0 20 40 60 80 100 120 140 1
Expe
nditu
re o
n ca
rs in
cl. V
AT, e
xcl.
othe
r one
-off
taxe
s,€
per c
apita
GDP per capita, EU27 = 10060
Panel B: One-off taxes (excl. VAT) as percentage of car net price, 27 EU member states
0 0 0 0 0 0 0 0 0 2 3 3 3,4 3,5 4 9 9,751019 20
36 36 37 40 42
75
170
0
20
40
60
80
100
120
140
160
180
BGCZ DE EE LT LU SE SK UK LV IT PL FR ROBE SI ES AT HU CY IR NL PT EL FI MTDK
Perce
nt o
f car
net
pric
e
Source: Copenhagen Economics, Eurostat and ACEA (2008)
However, a question in this study is whether high subsidy rates for company cars could be one of the factors that explain why some countries spend relatively small amounts on cars relative to their income levels. Simple examination of the line in Figure 3.2. panel A provides some weak support for this. The share of company cars is the highest in the high income countries with high subsidies for company cars and also a relatively high level of total spending on cars (cf. figure 3.3.) We have chosen to focus on countries with fairly equal income levels to avoid structural factors linked to e.g. the stage of economic development to influence results. However, we would not hesitate to push this result too far since we essentially only have one observation of tax rules per country and a limited number of countries.
32

Figure 3.3: Relationship between size of subsidy and shares of company cars in total registrations, EU member states with above average GDP per capita, 2008
Note: The low mileage subsidy is presented. The new Member States: Czech Republic, Hungary, Poland, Slovenia and Greece have not been included. Source: Copenhagen Economics
Dutch studies on subsidies to company cars There are very few micro studies that actually look at the specific effects of company car subsidies over the most important range of effects for the purpose of this study. Two recent Dutch studies23, however, provide promising evaluations of effects using micro data of Dutch households from the period of 1995 to 2006 They are evaluating the effects on the • The total stock of cars • Price of cars being sold to households • Number of kilometres driven The study starts off by calculating the size of subsidies in the Dutch tax system. The imputed tax base is 22 percent of the value of the car at the time the studies were made; while the study suggests that a fully neutral system would require an imputed tax base of over 50 percent of the car value. Given high marginal tax rates in the Netherlands, this provides very substantial incentives to shift remuneration in the direction of company cars. The calculations in this study suggest that the level of tax subsidies are somewhat smaller, mainly as a result of this study not taking into account the advantage of repair and maintenance services being tax deductable at the firm level while not being added at employee level. Taking the study on its face value, it suggests that the company tax system as it existed before the raise of the rate of imputation from 22 to 25 lead to: • An increase in the stock of cars of 5 percent • Average company cars being bought being € 9,000 to 12,000 more expensive • Number of kilometres being driven increasing by 1,500 kilometres
23 Puigarnau and van Ommeren (2007, 2009)
33

The effects are very large; the study has estimated these effects on the basis of the implicit price elasticity from subsidy rate to price of car being bought as 2 (in numeric terms) which is very high. Likewise, the effects of company car subsidies on car ownership (cars per family) were also substantially above conventional estimates. However, Puigarnau and van Ommeren (2007) provides convincing evidence of strong effects of the high level of company car subsidies and we have hence used this study as the best gauge of effects at the EU level in the absence of specific studies of similar quality in other countries. Moreover, the overall company car environment in Netherlands is relatively close to other EU countries with respect to the importance of the company car market, income per capita (relative to EU15 at least) and overall tax rates. Based upon this evaluation, we have scaled up the Dutch results to EU level by doing essentially three things. First, we have scaled the results by comparing our estimates of the Dutch subsidies with our estimates of the EU level subsidies. This may lead to underestimations of effects as we have not included in our subsidy calculations that fringe benefits are typically taxed at lower rates than gross wage income24 Second, scaling the results by taking into account the size of the EU stock of cars, average prices of EU cars etc. Thirdly, baring in mind the high price elasticities in Puigarnau and van Ommeren (2007) we have also offered more conservative estimates using lower, conventional elasticities. Under such heroic assumptions, the effects at the EU level are (the effects are spelled out in more detail in annex): • Increase in the stock of cars of approximately 8 to 21 million cars • Increase in the average value of EU company car of perhaps € 4000 to 8000 • Increase in the total kilometres driven by each company car equivalent to an increase in
fuel consumption of 4 to 8 percent. Whether policy evaluation should put most faith in the upper or lower range depends on a number of factors. Low range estimates may be most prudent to use as upper end range come from a single study and as this study is also based upon a number of assumptions about company car markets. Arguments for using the upper end range could be that our study systematically underestimates the effective subsidy resulting from fringe benefits being taxed at lower rates than gross wage income as discussed earlier. Also, the fuel subsidy effect on mileage is likely underestimated in Puigarnau and van Ommeren (2009) as it does not include the effect on it may have on choice of residence: the fuel subsidy makes it less expensive to drive longer to work and hence less expensive to live further from the work place. As a final argument for upper end range, Puigarnau and van Ommeren (2007) assumes that the price effect on the company car can be scaled up to the whole car market by looking at ratio of the stock of company cars to the entire stock of cars. As company cars at some point become privately owned, typically after 3-5 years company ownership, so the effect on the overall car market are likely to be higher. If systematically half of all cars are being purchased for company car purposes, they will also more generally drive the composition and size of the secondary market through a number of 24 Gross wage income is also subject to employers social security contributions.
34
effects, some related to the functioning of the EU’s internal market. The secondary car market will tend to have larger and more cars than otherwise due to the subsidies. That will also affect fuel consumption. At the same time, the owners in the secondary market do not receive the same subsidies to own these cars, so the “oversupply” of more expensive, subsidy driven company cars to the secondary market should increase the market loss that companies – or leasing companies – face when offloading these cars, thus driving up the cost of providing company cars to employees. The size of this effect somewhat depends on how EUs internal market for secondary market works: will a high supply from Germany’s large company car market lead to net exports to other countries affecting secondary car prices both in Germany and importing countries? Answering these highly relevant questions though goes beyond the scope of this study, but may merit further attention.
Review of changes in actual sales of company cars to possible changes in taxation We have looked at two countries - UK and Denmark - with significant changes in company car ownership over the last 10 years and reviewed the role of changes in taxation of company car in that respect. The UK provides a case in point, where taxes on company cars have been substantially increased against the background of historically very large share of company cars in total registrations. According to an evaluation carried out by HM Revenue & Customs (2006) the large cut in tax subsidies appears to have changed the composition of company cars (promoting more CO2 efficient cars) rather than diminished the share of company cars in total registrations. In April 2002 the UK Government revised the company car tax regime in order to reduce the carbon emission (CO2) and protect the environment. The reform, announced already in 1999 and detailed in the budget of 2002, meant that the taxed benefit-in-kind arising from having a company car for private use would be calculated by referring to the car’s list price and CO2 emission. Prior to the reform, the employee had an incentive to drive more business miles that needed in order to exceed a threshold of either 2,500 miles or 18,000 miles. This would in turn lower the benefit-in-kind from 35 percent to respectively 25 or 15 percent of the list price. At the same time, company car owners which were allowed unlimited fuel use which are subjected to a surcharge – the Company Car Tax Fuel Benefit Charge - were also subjected to a tightening.25 Following the tax reform company cars are still taxed as a percentage of list price and mileage driven, however the exact percentage of tax is determined by the approved CO2 emissions figure of car. The outcome of the tax reform in the UK has been the increased efficiency of company cars as well as the reduction of the total number of company cars. In 2005 the number of company cars had been reduced by one third to 1.2 million cars since 2001, while the total number of registrations decreased approximately 1.5 per cent yearly to 2.7 million cars in 2004. The average CO2 emissions figures from company cars were close to 15 g CO2/km lower in 2004 that would have been the case if the reform had not taken place. The survey results suggest that around 60 percent of company car drivers, being able to choose the type of company car, were influenced by the tax reform and as a result chose cars with lower CO2 emission
25 House of Commons (2006), p. 47.
35

figures26. Moreover, there are clear signs that remuneration patterns have responded with more cash remuneration off-setting reduction in car benefits, suggesting that tax incentives have an impact on structure of employee compensation27. However, such reported effects should be seen in the context of at least two factors. First, the share of employees receiving free private fuel has been declining since the late 1990s, i.e. prior to this reform. Second, there are indications that the tightening of fuel standards within the company car taxation has shifted the purchase of fuel consuming cars to privately owned cars where penalties for driving cars with high fuel consumption are less28: this illustrates the perils of just. The Danish system for taxing company cars was tightened considerably from 2000. Until that year, the imputed tax base was calculated as 25 percent of the value of the car up to a price of DKK 400,000 with no imputed tax base calculated if the price of the car exceeded that level. Obviously, that provided a major incentive to provide remuneration for high income employees in the form of luxury cars bearing in mind that the top rate of income tax in Denmark at that point was above 60 percent for all full time employees. However, starting in 2000, the part of the car price that exceeded DKK 400,000 was included in the tax base with an imputation rate of 20 percent. No formal evaluation of this tightening has taken place, but our evaluations indicate that this major increase in effective taxation must have had a major effect. First, the sales of company cars costing more than 1 million DKK fell dramatically already in 2000 while the sales of company cars costing between ½ million DKK and 1 million DKK rose and those of the cars costing less than ½ million DKK were roughly unchanged. The price ranges should be viewed in the context of high Danish registration taxes and a 25 VAT rate that implies that the consumers pays roughly 3 times the factory price for a newly registered car. The latter category of cars costing less than ½ million DKK is by far the most important in volume in Denmark. At the same, comparable patterns were observable in the overall sales of cars in Denmark. Bearing in mind the dominance of company cars in the higher price segments that is perhaps not surprising, but it does suggest that higher taxation of high level company cars at least in Denmark led to a down-sizing of cars rather than simple switching from company to privately owned cars.
26 HM Revenue & Customs: (2006), Eurostat: New Registrations. 27 Puigarnau and van Ommeren (2007) 28 Anable and Bristow (2007)
36

Figure 3.4: Car sales in Denmark, 1999-2008 Panel A: Company car sales in Denmark, 1999-2008
Panel B: Total car sales in Denmark, 1999-2008
Panel C: Company car’s share of total sales, 1999-2008
Note: In Panel A and B the index is calculated so 1999=1. Source: Copenhagen Economics and De Danske Bilimportører As high value cars typically are more heavy and installed with more powerful motors, it suggest that the Danish tax reform in addition to removing a tax based incentive to shift remuneration in the direction of car consumption has also reduced fuel consumption.
3.4. EFFECT OF SUBSIDIES ON ENVIRONMENT: CO2 EMISSIONS AND ENERGY USE The estimations above suggest that subsidies to company cars lead both to more and larger cars being bought as well as more miles being driven. However, the effects cannot at this stage be assessed with large degrees of certainty. Despite large variations in subsidy rates to
37

company cars, there are no corresponding differences in shares of company cars. We do not take this as an indicator of company car subsidies having limited effect on actual behaviour; indeed the experiences from UK, Netherlands and Denmark does suggest that tax regimes for company cars may have strong effects on the composition of company cars as well as the total stock of cars. We conclude instead that other important country specific factors that we have not been able to isolate in this study accounts for this pattern. The two Dutch studies29 do provide some basis for providing an overall estimate of the effect of fuel consumption:
A higher stock of cars leads to more fuels being consumed. A highly simplified
approach is to scale up consumption with the increase in the stock. A more realistic assumption is to assume that the additional car is smaller and driven fewer miles than the primary and more expensive company car
A more expensive car also uses more fuel per driven kilometre all through its life time, i.e. also when it passed over to private ownership. We use a simple correlation between car price and car efficiency to calculate this effect while assuming that the overall share of company cars in new sales is the best proxy for the share of the present or former company cars in the total car stock
We use the direct estimates of more kilometres being driven per company car to evaluate the direct effects of fuel subsidies on fuel consumption.
Using such an approach, we find that total fuel consumption from cars may be increased by as much as 4 to 8 percent in EU, see annex C. This translates into an effect of CO2 emissions of a corresponding amount equalling 20 to 40 millions tonnes of CO2 for EU27 as explained in annex D. The lower and upper estimates follows directly from the lower and upper estimates on car stock, sizes of cars and kilometres driven per company car referred to earlier in this chapter.
Effects on congestion, accidents, noise and air pollution As opposed to CO2 emissions, modelling the impact of subsidies on congestion, air pollutants noise and accidents is more difficult to carry out in a meaningful fashion. This is, on the one hand because of the assumptions underlying the construction of externality coefficients, and on the other hand the localised and time-varying nature of the externalities. One approach to derive the contribution of the subsidy to the size of externality could be to use measures of the marginal social cost of an externality, such as provided in CE Delft (2008) and multiply them by the econometric estimate of the subsidy on the volume of car stock. However, there are a number of shortcomings which limit the usefulness of this approach in practice. In order to be used meaningfully, the externality coefficients require a number of separate econometric estimates, such as estimates in different areas – urban, small urban and rural areas. Furthermore, the coefficients require rather precise data on mileage – also at the local level. Even though the average number of business and private km driven by a private car can be proxied, it would not contain the required breakdown between the different areas. On the other hand, the application econometric estimates of subsidy effects on the composition of cars would not be meaningful given the assumptions embedded in the
29 Puigarnau and van Ommeren (2007, 2009)
38
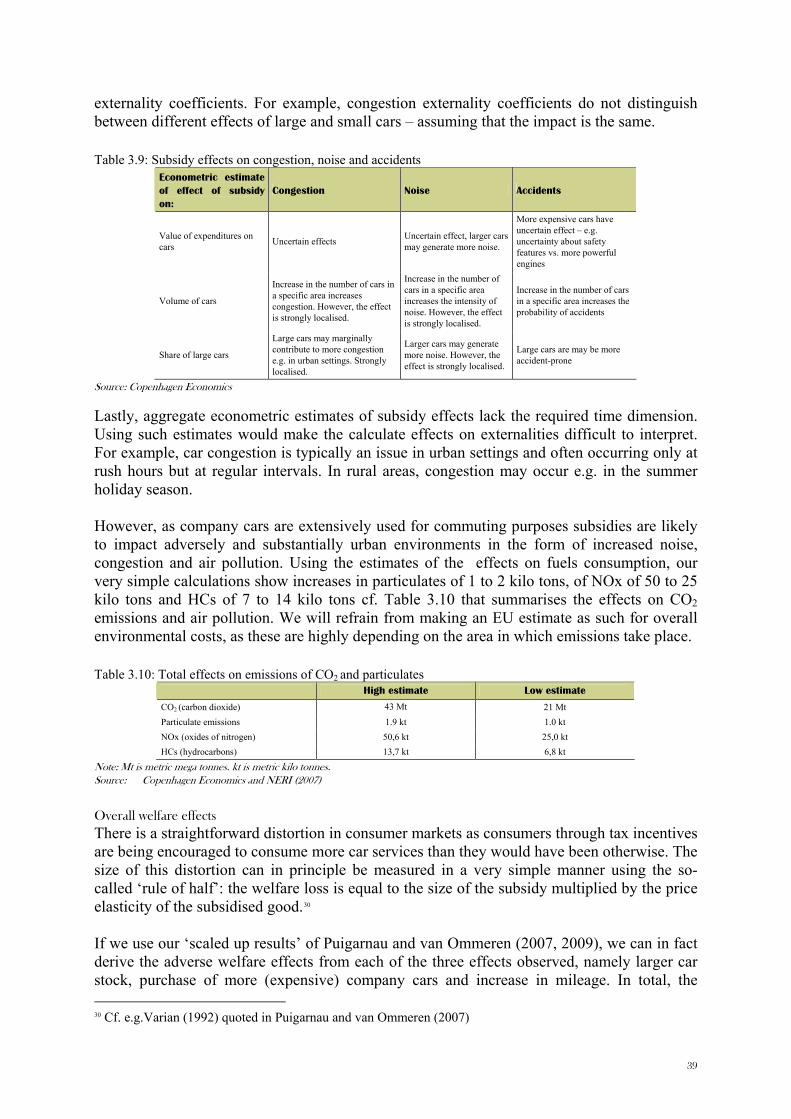
externality coefficients. For example, congestion externality coefficients do not distinguish between different effects of large and small cars – assuming that the impact is the same. Table 3.9: Subsidy effects on congestion, noise and accidents
Econometric estimate of effect of subsidy on:
Congestion Noise Accidents
Value of expenditures on cars Uncertain effects Uncertain effect, larger cars
may generate more noise.
More expensive cars have uncertain effect – e.g. uncertainty about safety features vs. more powerful engines
Volume of cars
Increase in the number of cars in a specific area increases congestion. However, the effect is strongly localised.
Increase in the number of cars in a specific area increases the intensity of noise. However, the effect is strongly localised.
Increase in the number of cars in a specific area increases the probability of accidents
Share of large cars
Large cars may marginally contribute to more congestion e.g. in urban settings. Strongly localised.
Larger cars may generate more noise. However, the effect is strongly localised.
Large cars are may be more accident-prone
Source: Copenhagen Economics
Lastly, aggregate econometric estimates of subsidy effects lack the required time dimension. Using such estimates would make the calculate effects on externalities difficult to interpret. For example, car congestion is typically an issue in urban settings and often occurring only at rush hours but at regular intervals. In rural areas, congestion may occur e.g. in the summer holiday season. However, as company cars are extensively used for commuting purposes subsidies are likely to impact adversely and substantially urban environments in the form of increased noise, congestion and air pollution. Using the estimates of the effects on fuels consumption, our very simple calculations show increases in particulates of 1 to 2 kilo tons, of NOx of 50 to 25 kilo tons and HCs of 7 to 14 kilo tons cf. Table 3.10 that summarises the effects on CO2 emissions and air pollution. We will refrain from making an EU estimate as such for overall environmental costs, as these are highly depending on the area in which emissions take place. Table 3.10: Total effects on emissions of CO2 and particulates
High estimate Low estimate
CO2 (carbon dioxide) 43 Mt 21 Mt Particulate emissions 1.9 kt 1.0 kt NOx (oxides of nitrogen) 50,6 kt 25,0 kt HCs (hydrocarbons) 13,7 kt 6,8 kt
Note: Mt is metric mega tonnes. kt is metric kilo tonnes. Source: Copenhagen Economics and NERI (2007)
Overall welfare effects There is a straightforward distortion in consumer markets as consumers through tax incentives are being encouraged to consume more car services than they would have been otherwise. The size of this distortion can in principle be measured in a very simple manner using the so-called ‘rule of half’: the welfare loss is equal to the size of the subsidy multiplied by the price elasticity of the subsidised good.30 If we use our ‘scaled up results’ of Puigarnau and van Ommeren (2007, 2009), we can in fact derive the adverse welfare effects from each of the three effects observed, namely larger car stock, purchase of more (expensive) company cars and increase in mileage. In total, the 30 Cf. e.g.Varian (1992) quoted in Puigarnau and van Ommeren (2007)
39

welfare loss can be calculated to be in the order of € 15 to 35 billion (or 0.1 to 0.3 percent of GDP) see Annex B. The results are strictly conditional on the assumption that no other imperfections such as other subsidies/taxes are affecting the results. In other words for such countries as Denmark and indeed the Netherlands with high and potentially distorting registration taxes, the increase in car purchases induced by company car subsidies may in principle be welfare enhancing. It does not imply that company car subsidies in those countries are a good idea: a shift to a lower registration tax, more taxation on kilometres driven, and also a reduction of the tax subsidies for company cars would be preferable in the Denmark and the Netherlands from a welfare economics perspective. A second proviso is the interaction with environmental objectives. If for example the pricing of carbon in the particular country was already below the level needed to deliver on agreed climate change objectives for that country, then a company car subsidy with a side effect on emissions de facto increases the welfare loss associated with this under pricing. The same applies in principle with countries that had at the outset over priced externalities. We will come back to this in the policy section. There is also a substantial tax loss resulting from the subsidy. Disregarding all dynamic affects, including effects on income from fuel taxes as well as taxes related to car ownership, such tax losses may amount to as much as ½ percent of EU GDP as described above. The tax loss requires compensating higher tax rates elsewhere which implies a potential reduction in labour supply and hence loss of output. Recent literature suggests that the loss of output exceeds easily 20 cents for every € 1 raised in taxes in countries with relatively high taxes rates such as EU countries31. While company car subsidies may increase labour mobility and may be seen as a carrot that induces more work effort for example to become eligible for (a larger) company car, it is unlikely that this compensates for the need to raise tax rates to pay for these subsidies. This is an issue that deserved further analysis as discussed below. However, as this study has demonstrated that lower taxes on company cars lead to more cars being bought and more miles being driven. This stems from the fact that car use – both ownership and fuel purchases – are taxed at higher rates than other consumption. This implies that the tax losses from the favourable tax treatment of company cars, when including dynamic effects, could be smaller than the estimates presented above (table 3.6.) indicate.
31 See for example Dahlby, B. and Ferede, E. (2009) which provides an estimate of an output loss of 10 to 30 per cent of the ex-ante tax revenue increase (page 27) or or Kleven, H. J. and Kreiner, C. T. (2003 that provides even higher estimates particularly for high tax countries within EU (table II).
40

Chapter 4 POLICY OPTIONS When considering policy options, we suggest that the first priority should be to focus on the most blatant distortion namely the incentive for employees to take home their overall remuneration in the form of car benefits. As suggested in this report this may give a welfare loss in the order of €50 billion. The second issue is to decide what instruments that should be applied to deal with this distortion bearing in mind the constraints that tax policies in this area are facing in practice. We are looking primarily at two kinds of distortions. First, the subsidies in place encourage employees to buy more expensive cars than they would have in the absence of the subsidy. Secondly, the widespread non- or low taxed use of fuel for the car means cars are being used more intensively than otherwise. This will, in turn, aggravate adverse environmental effects of the private car use (CO2 emissions, air pollution, noise and congestion). Ideally, we should put in place measures that accurately target both of these distortions. The first distortion calls forth a higher general imputed rate for calculating the tax base for the fixed costs of the car, while the latter would require that the employees pay litre per litre for actual consumption used for private purposes. While the choice of the appropriate imputation rate for the fixed costs (financing, depreciation and maintenance) requires some subjective assessment of the appropriate discount rates, costs of maintenance etc, it is relatively straightforward to implement in practice. However, the majority of EU countries apply too low rates. By contrast, requirements to register and control the number of kilometres driven for private consumption purposes may introduce substantial administrative costs for employees, firms and tax administrations that exceed the efficiency gains from a better taxation structure. This is an issue we have not investigated and where further examination is necessary. An important and binding constraint on reforms is the basic fact that it seems productive for society that cars are used for both private and business purposes. Flatly prohibiting the use of company owned cars from being used for private purposes would imply that the cars would not be used after business hours – are thus remaining underutilised, leading to efficiency losses. Moreover, a system that requires the employee to own the car when used for both business and private purpose also provides difficult questions. If the employee rented the car to the company when driving it for business purposes, the question would be: what rates of compensation per kilometre would be acceptable for the tax authorities? Should it depend on the price of the car i.e. implicitly assuming that the firm would get more value from the employee driving a BMW 520 than a FIAT 500 due to (1) reputation factors, (2) a more comfortable drive boosting productivity as well as (3) the capacity to occasionally transporting more passengers? Moreover, such a system would require the employee to register kilometres used for business trips instead of private trips which is no relief in practice relative to the car being owned by the company and the employee being taxed on private use. Total kilometres driven equal private plus business trip: counting one element is counting the total.
41

Our point here is that requiring a system change where the employee owns the car and rent it to the company rather than the company owning the car with employee being taxed on imputed income does not by it-self solve some basic choices that policy makers have to make about the purpose of company cars in the first place as well as the ability to control compliance in practice. From this perspective the best solution seems to be to increase the rates for imputing the tax base applied on fixed costs and increase considerably the taxation of free fuels provided by the employer. One option to achieve the latter would be to divide employees with a company car into two basic groups for tax purposes. The first group will not be allowed to receive any free fuel but may be reimbursed for fuel when the company car is used for declared and verifiably business purposes. If commuting is accepted as a business purpose, the compensation should be a flat rate subsidy based upon estimated travel length. This group will then fall into the same category as company employees that use their own car for this purpose. This regime would be applicable to a very large group of employees who rarely use the car for other purposes than commuting. The tax law could stipulate that employees who drive less than say 3,000 kilometres per year excluding commuting for business purpose could not receive free fuel. The second regime would be applicable to sales personnel and others with a very large number of kilometres driven. They could potentially choose between two options. Either accept filling in a log book and receive fuel consumption based upon that. Or get free fuel but accept then a higher imputed income base as a proxy for the more private mileage that would follow. At the same time it should bring the compensation that employees get for transportation costs when using their own car for either business-to-business travel or commuting into line with the taxation of company cars for the same purposes. Ideally, the tax system should not influence the choice between the use of a private car/public transportation or a company car for such purposes. In practice it implies that reforms of company car taxation needs to reflect such considerations of tax neutrality. So the bottom line in this first part of the policy option review is: • Remove distortions to consumer choice by getting taxation of car company fringe benefits
in line with basic wage remuneration. • Aim for tax neutrality between the use of a private car/public transportation and a
company owned car in the contact of pure business travel and commuting. The third issue to discuss is whether taxation of company cars should be used to deal with policy objectives going beyond distortions of consumer choice such as attaining EU and national environmental goals. Beyond doubt, a system that encourages the use of more and larger cars as well as driving more miles is at odds with EU and national efforts to promote energy savings, reduce greenhouse gases as well as local environmental damage related to noise, congestion and emissions of air polluting substances. This leads into a classical discussion of first, second and third best policy options. Once we have got rid of the specific incentive of overspending in company cars, should we ‘overtax’ company cars to attain environmental objectives. Some countries have moved along that
42

route. UK has for example embedded specific economic incentives for employees and hence also firms to buy company cars with low emissions as discussed above. Our recommendation is essentially to refrain from such measures for several reasons. The first and most simple reason is that there is a substantial risk of overkill and non-transparency in policy delivery. At present, Member States are moving forward with a number of initiatives that are far more effective in attaining environmental objectives than building additional, discretionary elements into the company car taxation. The first best approach is to tax the environmental objective at its root. The objectives of reducing CO2 emissions are best met by implementing CO2 taxes, as certainly countries have already done. Also in the transport sector several different types of taxes already exist (cf. Table 4.1.). Local adverse environmental impacts from cars in the form of noise, air pollution and congestion are perhaps most adequately addressed by road pricing. The Dutch and Danish government have already decided to implement such charges in 2010. Entry pricing in city centres, already implemented in Stockholm and London, for instance, represent a simple form of such road pricing. The second best approach to address the CO2 externality would be to include energy efficiency in the taxation of cars either at the purchase point or for the entire stock of cars through ownership charges. Moreover, the EU has adopted new legally binding emission targets for car manufacturers that de facto also imply internal incentives inside the firms to move the production into the direction of less fuel consuming cars. The inclusion of energy efficiency requirements into subset of the car market, such as company cars, therefore seems to us to be much less effective and also less cost-efficient than the solution described above. The UK experience also shows that tightening on part of the overall car tax system creates the risk of “leakage” to the private owned car market, as underlined in a recent evaluation of the UK system32 and also noted in chapter 3 on the UK tax changes. Table 4.1.: CO2 based user charges and registration taxes, selected 17 EU member states, 2008
Ownership tax Registration tax Bonus System Road Pricing
Austria, Portugal, Spain X X
Belgium X* X
Cyprus X X X
Denmark, Netherland
X X GPS-based
Finland, Ireland, Malta X X
France X* X X
Germany X
Italy X
Luxembourg X X
Romania X
Sweden X X Toll-based
United Kingdom X*
Note: X* implies specific incentives for company cars Source: ACEA (2008a) and Copenhagen Economics
32 Anable and Bristow (2007), page 75
43

ANNEX A: CALCULATING SUBSIDY EFFECTS ON CAR STOCK, CAR PRICES AND CAR TRAVEL.
Approach 1: Generalising the findings in Puigarnau and van Ommeren (2007, 2009) to the EU In two very exhaustive and well-documented papers, empirical evidence on the effect of company cars is presented for three types of effects: • Total stock of cars • Price of the (the most expensive) car households are using • Mileage The estimation methodologies are consistently the same. The demand for cars and travel are estimated using household micro data where the provision of a company car to the family is linked to that family’s overall car demand in these three dimensions. Total stock of cars (Puigarnau and van Ommeren 2007) The study finds that the subsidy-induced increase in the stock of cars in the Netherlands amounts to 365,000 cars, which corresponds to 5.4 percent of the total stock of cars in the Netherlands (6.8 million). Assuming that the subsidy effect on car ownership in the EU is the same as in the Netherlands, and given that the average subsidy level in the EU is 1.7 times higher than in the Netherlands, the corresponding increase in the car ownership due to subsidy amounts to 9.0 percent (5.37 percent multiplied by 1.68). In 2006, 9.0 percent of the EU car stock amounted to 20.8 million cars. Table 5.1 describes the details of this approach. Table 5.1: Effects of EU company car subsidies to stock of cars
Step Amount Approach Source
Effect of subsidy on car ownership +5.4%
The study finds the subsidy increases the car stock by 365 thousand cars. Given that the stock of cars in the Netherlands amounted to 6.8 million cars in 2002, the subsidy increased the car stock by 5 percent
Puigarnau and van Ommeren (2007) Eurostat for the stock of passenger cars in the Netherlands, in 2002.
Size of subsidy in the Netherlands 14%
Simple average of subsidies assuming low and high mileage found in this study for the Netherlands
The current study (Puigarnau and van Ommeren (2009) study substantially higher)
Size of EU subsidy 24% Simple average of subsidies assuming low and high mileage found in this study for the EU
The current study (Puigarnau and van Ommeren (2009) study substantially higher)
Effect of subsidy 9.0% (24/14) times 5.4 percent The current study
EU passenger car stock, 2006 230 million cars http://ec.europa.eu/:transport/publications/statistics/statistics en.htm
Generalised effect of subsidy on car ownership in the EU 20.8 million cars 9.0% of 230 million The current study
Note: The figures are rounded off to 1 decimal point. The figures are rounded off to 1 d.p. Source: Copenhagen Economics
Price of the most expensive car (Puigarnau and van Ommeren 2009) Using data from a Dutch household panel survey from 1995 to 2006 and a Dutch car panel survey from 1990 to 1993 the study search to estimate the effect of company car provision on household car demand. Controlling for many factors the study finds that the value of the most expensive car in the household increases by between € 9,000 to 12,000 which is very likely to
44
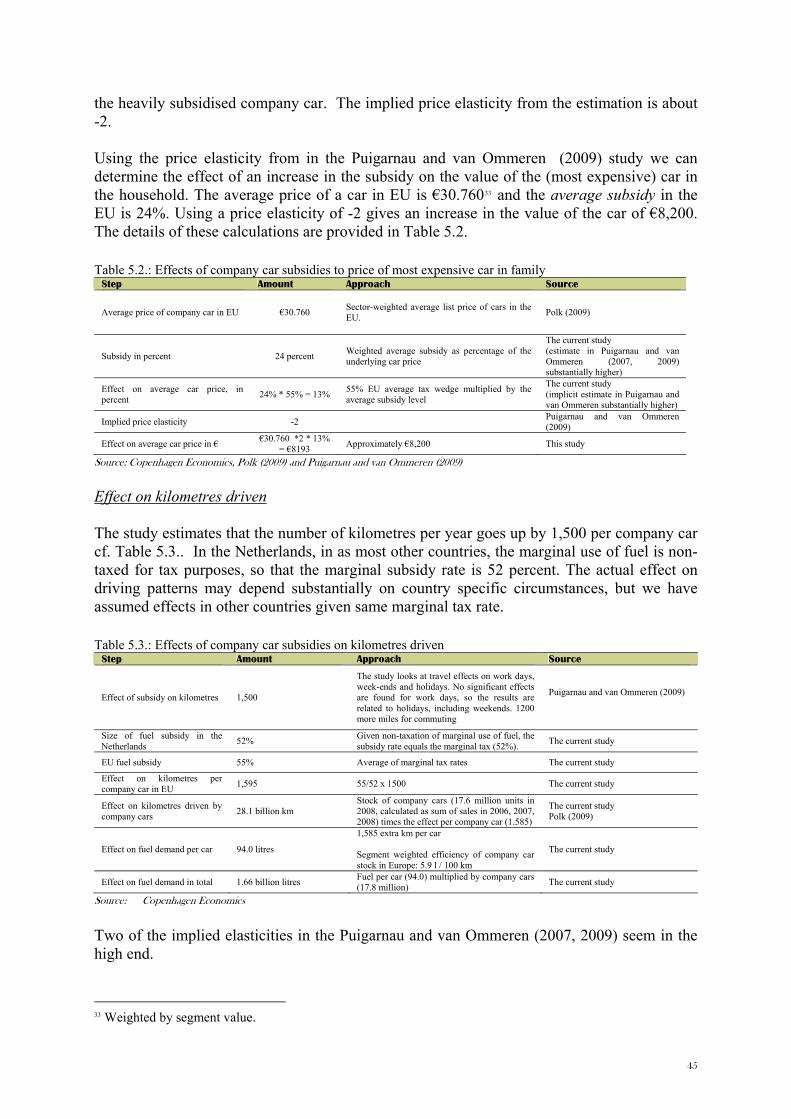
the heavily subsidised company car. The implied price elasticity from the estimation is about -2. Using the price elasticity from in the Puigarnau and van Ommeren (2009) study we can determine the effect of an increase in the subsidy on the value of the (most expensive) car in the household. The average price of a car in EU is €30.76033 and the average subsidy in the EU is 24%. Using a price elasticity of -2 gives an increase in the value of the car of €8,200. The details of these calculations are provided in Table 5.2. Table 5.2.: Effects of company car subsidies to price of most expensive car in family
Step Amount Approach Source
Average price of company car in EU €30.760 Sector-weighted average list price of cars in the EU. Polk (2009)
Subsidy in percent 24 percent Weighted average subsidy as percentage of the underlying car price
The current study (estimate in Puigarnau and van Ommeren (2007, 2009) substantially higher)
Effect on average car price, in percent 24% * 55% = 13% 55% EU average tax wedge multiplied by the
average subsidy level
The current study (implicit estimate in Puigarnau and van Ommeren substantially higher)
Implied price elasticity -2 Puigarnau and van Ommeren (2009)
Effect on average car price in € €30.760 *2 * 13% = €8193 Approximately €8,200 This study
Source: Copenhagen Economics, Polk (2009) and Puigarnau and van Ommeren (2009)
Effect on kilometres driven The study estimates that the number of kilometres per year goes up by 1,500 per company car cf. Table 5.3.. In the Netherlands, in as most other countries, the marginal use of fuel is non-taxed for tax purposes, so that the marginal subsidy rate is 52 percent. The actual effect on driving patterns may depend substantially on country specific circumstances, but we have assumed effects in other countries given same marginal tax rate. Table 5.3.: Effects of company car subsidies on kilometres driven
Step Amount Approach Source
Effect of subsidy on kilometres 1,500
The study looks at travel effects on work days, week-ends and holidays. No significant effects are found for work days, so the results are related to holidays, including weekends. 1200 more miles for commuting
Puigarnau and van Ommeren (2009)
Size of fuel subsidy in the Netherlands 52% Given non-taxation of marginal use of fuel, the
subsidy rate equals the marginal tax (52%). The current study
EU fuel subsidy 55% Average of marginal tax rates The current study
Effect on kilometres per company car in EU 1,595 55/52 x 1500 The current study
Effect on kilometres driven by company cars 28.1 billion km
Stock of company cars (17.6 million units in 2008, calculated as sum of sales in 2006, 2007, 2008) times the effect per company car (1.585)
The current study Polk (2009)
Effect on fuel demand per car 94.0 litres
1,585 extra km per car Segment weighted efficiency of company car stock in Europe: 5.9 l / 100 km
The current study
Effect on fuel demand in total 1.66 billion litres Fuel per car (94.0) multiplied by company cars (17.8 million) The current study
Source: Copenhagen Economics
Two of the implied elasticities in the Puigarnau and van Ommeren (2007, 2009) seem in the high end.
33 Weighted by segment value.
45

First, the effect on the stock of the cars seems high. In the Puigarnau and van Ommeren (2007) the empirical marginal effect of a company car on household car ownership is found to be 0.4634. In their dataset, a household without company car has on average 1.35 cars35. This gives a relative effect of company car of 34 percent (0.46/1.35). The study finds the implicit price subsidy for company cars in the Netherlands in the range of 30.3 percent and 24.6 percent36. We take the average of them, 27.5 percent. This gives an implicit price elasticity of -1.2, calculated as 0.34/0.275. This should be seen against a general literature of perhaps 0.5 percent for the joint effect of car purchase and fuel costs on car ownership, cf. Table 5.4.. Table 5.4.: Summary of long run elasticises for car ownership and car travel in literature Car travel Car ownership
Car purchase costs –0.42 a) -0.46 d)
-0.1 to -0.5 b) -0.08 e) -0.12 d)
Average -0.4 -0.2
Motor fuel costs –0.32 b) -0,29 e) -0.14 d)
-0.49 e) -0.25 c) -0.02 d)
Average -0.3 -0.3
Note: The upper and lower value is an interval of different studies results. Averages are calculated as simple averages of the available estimates. Sources: a) Goodwin (2003) b) Ubbels, (2006); Johansson and Schipper, (1997); Dargay and Vythoulkas, (1999); Goodwin et al., (2004) reported in Gutiérrez-i-Puigarnau and van Ommeren (2007) c) Goodwin et al., (2004); Brons et al., (2006) reported in Gutiérrez-i-Puigarnau and van Ommeren (2007) d) Dargay (2007) e) Goodwin et al. (2004) found in OECD (2008c) Second the effect on the most expensive car in the household i.e. the company car seems high. The Dutch itself suggest that general price elasticities for the demand for new cars are around unity, i.e. roughly half the size in the Puigarnau and van Ommeren (2009).37 By contrast, we do not find any reason to use conservative estimates for mileage. Puigarnau and van Ommeren (2009) do not explore the possibility that fuel and other company car subsidies reduces the cost of commuting and may lead to company car owners take residence further from the work place. So we stick with the estimates they have.
Summarising the results The overall range of effects used as ball park estimates in this study is summarised in Table 5.5 below. They are use also to calculate the welfare effects and effects on fuel consumption as described in annex B and C. Table 5.5: Summarising the results
Current study (EU) Impact on:
Puigarnau and van Ommeren (2007),(2009)
(the Netherlands) Direct application Conservative estimate
Total stock of cars 365,000 20,800,000 8,600,000
Value of the car €9,000 –€ 12,000 € 8,200 € 4,100
Extra kilometres driven per year per company car 1,500 1,595
Source: Copenhagen Economics
34 Puigarnau and van Ommeren (2007), p. 16. 35 Puigarnau and van Ommeren (2007), p. 7. 36 Puigarnau and van Ommeren (2009), p. 10. 37 Puigarnau and van Ommeren (2009), p. 11.
46

ANNEX B: CALCULATING WELFARE EFFECTS
Using the approach in Puigarnau and van Ommeren (2007, 2009) Figure 5.1: Deadweight loss of a subsidy or illustration of the ‘rule of half’
Deadweight Loss of subsidy Supply of
company cars
Demand for company cars
Subsidy to company cars
Market clearing quantity
Quantity effect of the subsidy
Market clearing
price
Source: Copenhagen Economics
In this section we calculate welfare loss from the subsidy by following the approach outlined in Puigarnau and van Ommeren (2007, 2009). Puigarnau and van Ommeren (2007) calculates welfare effects from the application of the subsidy by applying the standard theory. According to standard economic theory, the introduction of a subsidy will serve to lower the price paid by consumers which will increase output beyond the socially optimal level of production determined by market prices without subsidies. The presence of a subsidy means that the marginal benefit to consumers of extra cars purchased due to the subsidy are less than the society’s cost of producing these cars – hence a welfare loss. To calculate the welfare loss it is necessary to estimate the size of the subsidy and the increase in the number of cars that results from the subsidy. Welfare loss is then calculated as half of the product of the two quantities (hence, studies refer to ‘the rule of the half’).
Welfare effects from increased car stock Welfare loss due to car fixed costs:
• Average tax advantage to car fixed costs (in €, per car): €2,873 • Quantity effect, EU: • using the Puigarnau and van Ommeren (2007) approach: 20.8 million cars Welfare loss due to subsidy to car fixed costs:
½ × €2873 × 20.8 = €29.8 billion
47

The welfare loss due to company cars amounts about 0.2% of the cumulative GDP of the countries covered in this study.38 In comparison, Puigarnau and van Ommeren (2007) reports welfare costs in the range of €1.1 billion or about 0.2% of the Dutch GDP in 2008. Puigarnau and van Ommeren (2009) provides new evidence of an affect on the stock of cars by noting that households’ total demand for cars increase by €14.000 i.e. in excess of the increase of the most expensive car (page 34). This residual increase must by definition be linked to a combination of more expensive company cars and an effect of other cars in the families, most likely the likelihood of more cars. We rely though on the earlier study from (2007) for the effect on the stock of cars.
Welfare effects from increased car prices Following the notation in Puigarnau and van Ommeren we denote the unit price of holding one car faced by the household by p. If household i has a company car p is given by pc where pc is the unit price of the car minus the tax advantage otherwise the price is given by p. When a household receive a company car the price change from p to pc, denoted by . To calculate the welfare effect we need an estimate of the change in the household demand for car units, Δx, but this size is not observable. Δx refers to the tax-induced change in demand for car units. The Puigarnau and van Ommeren (2009) study assumes that the change in car demand is related to changes in the market value of the car, ΔV. More specific they assume that the annual car expenditures, px, is proportional to V, given by px = αV. The proportionality factor, α, is given by the ration between the annual price of using a car and the purchase price of the car. Given a linear demand function for cars the change in welfare from a change in the tax treatments of company cars can be measured by a half times the change in price times the change in demand:
Using the above assumption this can be written as:
Puigarnau and van Ommeren (2009) estimate that the possession of a company car increases the value of the (most expensive) car in the household by about €9,000 to €12,000. In assessing the welfare loss per company car they assume that ΔV equals €10,000. The study sets the proportionality factor to 0.40 (c.f. appendix A in Puigarnau and van Ommeren (2009)).
38 The cumulative GDP of the countries covered by this study amounted to €12.1 trillion in 2008.
48

reflects the income tax advantages given to company cars, where. The tax advantage in Puigarnau and van Ommeren (2009) is given by:
denotes the marginal income tax which they set to 52 percent. Based on their estimation the Puigarnau and van Ommeren (2009) study sets this size to 35 percent of the car unit price including the VAT tax advantage. Replicating the welfare loss per company car:
By rewriting the welfare loss we note that the tax advantages in the Puigarnau and van Ommeren (2009) study is equal to the subsidy defined in this report times the marginal income tax:
We then convert this approach to EU levels, using the study’s price elasticity along with our estimates of subsidies and car prices as documented in annex A39. Here we estimate that the average car price goes up by € 8.200. Hence the welfare loss per car is equal to:
There are 17.6 million company cars in EU. Hence the effect on EU level is equal to €3,8 billion or about 0.03% of GDP.
Welfare effects from increased travel The approach to estimating welfare costs from increased travel in Puigarnau and van Ommeren (2009) is the same as with the other elements. The tax subsidy results from the under-taxation of the value of free fuel and that the marginal depreciation from more private use of the car is borne by the firm. In Puigarnau and van Ommeren (2009) these two combined provides a subsidy of € 0.15 per kilometre. 39 In Puigarnau and van Ommeren (2007), the tax advantage is calculated without taking personal income tax into account. The difference between the value of the company provided benefit in kind and the imputed value for tax purposes amounts to €6100, while our calculations give €5200 for a car of similar price and mileage.
49

So we can again use the standard formula for calculating the welfare loss per company cars which equal:
Given 0.8 million company cars40 in Netherlands that equals a welfare loss of € 90 million. This can be scaled up to EU levels. We have restricted our calculation of the pure subsidy part to the direct fuel cost part, hence excluded the inherent subsidy related to the increased depreciation costs. Hence the subsidy equals the average price of fuel in EU multiplied by tax rate. This quantity effect is equal to the fuel effect per company car of 1,595/divided by fuel efficiency. Hence the EU welfare loss per car is equal to
We scale that up to EU level by multiplying with the number of company cars in the EU, i.e. 17.6 million; hence we get a welfare loss of € 0.6 billion or about 0.01% of GDP. This seems an underestimation bearing in mind that we have not included the depreciation subsidy as in Puigarnau and van Ommeren (2009). Table 5.6 summarises the results found in this section.
40 Calculated as the sum of non-private registrations in 2006, 2007 and 2008 in the Netherlands using Polk (2009).
50

Table 5.6: Summary of welfare effects Current study Puigarnau and van
Ommeren (2007), (2009) Direct application Conservative estimate
Welfare effect Absolute effect
Relative effect
Absolute effect
Relative effect
Absolute effect
Relative effect
EU: €44 billion
0.3% GDP**
NL: €1.8 billion
0.3% GDP**
EU: €34.3 billion
0.3% of GDP*
EU: €14.9 billion
0.3% of GDP* Total
€2300*** per company car
€1950 per company car
€848 per company car
€1.1 billion (total)
0.2% GDP**
€29.8 billion (total)
0.2% of GDP*
€ 12.4 billion
0.1% of GDP* From increased
car stock €1400 per company car**
€1694per company car
€ 706 per company car
€0.5 billion (total)**
0.1 % of GDP**
€3,8 billion (total)
0.03% of GDP* €1.9 billion
0.01% of GDP* From increased
car prices €700 per company car
€217 per company car
€108 per company car
€0.2 billion 0.03% GDP €0.6 billion (total)
0.01% of GDP*
€0.6 billion (total)
0.01% of GDP* From increased
fuel use €200 per company car
€35 per company car
€35 per company car
Note: *GDP of the countries covered in this study, excluding France (for which the stock of company cars is not available in the Polk (2009) data). Copenhagen Economics estimates exclude effects from the VAT. Puigarnau and van Ommeren (2009) estimates include effects from VAT. ** Calculated by Copenhagen Economics given 795,000 company cars in the Netherlands as given in Puigarnau and van Ommeren (2007). *** Calculated by adding up the effects from increased car stock, increased car prices and increased fuel use. Source: Copenhagen Economics
51
ANNEX C: IMPACT ON FUEL CONSUMPTION AND CO2 EMISSIONS • A higher stock of cars leads to more fuels being consumed. A highly simplified approach
is to scale up consumption with the increase in the stock. A more realistic assumption is to assume that the additional car is smaller and driven fewer miles than the primary and more expensive company car
• A more expensive car also uses more fuel per driven kilometre all through its life time, i.e.
also when it passed over to private owner ship. We use a simple correlation between car price and car efficiency to calculate this effect while assuming that the overall share of company cars in new sales is the best proxy for the share of the present or former company cars in the total car stock
• We use the direct estimates of more kilometres being driven per company car to evaluate
the direct effects of fuel subsidies on fuel consumption.
First effect: more cars We estimate that there are about 20.8 million more cars due to the subsidy, or 9 percent larger number of cars. Assuming that the extra cars have the same average efficiency and driving patterns as the cars in the total stock, fuel consumption is also 9 percent higher as a result of these extra cars. Bearing in mind that the additional car may well be substantially smaller than the main car in the household which is typically the company car, we rather arbitrarily reduce the effect to one third, also bearing in mind that the second car may be driven less intensively than the first. The Puigarnau and van Ommeren (2009) study supports this story. It suggests that the total value of the cars at the disposal of families with company cars, controlled for income and other variables, exceed that of other comparable families with € 14.000 while the most expensive car in the family increases by € 10.000. At the same time, such families increase on average their stock of cars from roughly 1 1/4 to 1 ¾, very few Dutch families have more than two cars. So to simplify further, we could essentially suggest that such results are consistent with two set of reactions. One half of families may stick to the number of cars they use but splash € 14.000 more on that car. The second half decides to have one more car and then only spend € 6.000 more on the most expensive car in the household. That will exactly reproduce the numbers of above, on average € 10.000 more on the most expensive car and half a car more. The point is then that that the there is only € 8000 money left for the second family to purchase that additional car to keep the remaining constraint, namely that total value of cars goes up by € 14000 per company car family. As the average car in the Netherlands had a price just exceeding € 20.000 in 2006 in our data that would just buy you a car at less than half that price. Moreover, it is likely that this secondary car would be driven less, for example commuting would be linked to the company car. That brings us to a ball park estimate of one third as referred to above.
Second effect: more expensive cars To calculate extra fuel used as a result of more expensive cars, we use the relationship between car segments and their emissions, measured by CO2 emissions per km, given in Figure 5.2. The relationship is positive close to linear, meaning that the larger the segment the larger the emissions. Because the larger the segment, the more expensive the average price of cars in it, we can use this to proxy the extra CO2 emissions from an increase in the price of
52

cars due to the subsidy which was estimated at €8,200. We find that the increase in emissions corresponds to 13.9 g CO2 / km which using standard conversion coefficients can be expressed as 0.48 litres per 100 km. Given that the EU average company car efficiency is 5.9 l / 100 km, the increase due to more expensive cars caused by the subsidy corresponds to 8 percent cf. Table 5.7. As roughly half of all cars are present or former company cars, we somewhat arbitrarily reduce this effect to 4 percent. Figure 5.2: Relationship between car price segments and emissions
Source: Copenhagen Economics and Polk (2009)
Table 5.7: Effects of fuel consumption from more expensive cars being used
Step Amount Approach Source Calculating increase in C02 emissions per extra 1 € of car value
0.001751727
Interpolation between the average price and emissions of segment 3 and 4 in the diagram. Polk (2009)
Calculating the counterfactual price of cars
23260
Average EU price €30760 – the effect of the subsidy, €7500
Calculating emission level at the counterfactual price 156.0 g CO2 / km
The counterfactual price is close to the price of segment 3 (€22822) meaning that linear extrapolation will give a good approximation of the emission factor. Given that the emission factor is 155.22 gCO2 / km for segment 3, emission for the counterfactual l is 156.0.
This study
Calculating the increase in emissions as a result from the price change
156.0 + (0,001751727 * 7500) = 169.9 169.9 – 156.0 = 13.9 g CO2 / km
Multiplying the factor measuring extra emissions per extra 1 € of car value times the price increase (€7500)
This study
Calculating the increase in fuel consumption as a result from the price change
13.9 g CO2 / km corresponds to an increase in 0.46 l / 100 km
Converting g CO2 / km into litres using a standard conversion coefficient This study
Calculating the effect on extra fuel due to more expensive cars 0.48 / 5.9 = 8%
Given that the average efficiency of the EU car fleet is 5.9 l / 100 km, we calculate the increase due to more expensive cars
This study
Source: Copenhagen Economics
Third effect: more km The European car fleet drives 28.2 billion extra km as a result of the fuel subsidy to company cars as estimated in annex A. This translates into an increase in fuel consumption of fuel
53

consumption of 28.2 divided by average fuel efficiency (kilometres per litre) of 17½ which is 1.7 billion litres.
Total fuel consumption effects in litres Having calculated the three partial effects above, our aim is to aggregate them to arrive at an estimate of increase in total fuel consumption due to the three effects (more cars, larger cars and more km driven). Our approach is as follows: We start by calculating the amount of fuel used by passenger cars in the EU. Then, we use the results to derive emission of CO2 and particulate matter. Total energy use by passenger cars in the EU amounted to 175,721 ktoe in 2005, equivalent to 7,380 PJ (peta joules) of energy. Of this, approximately one-third was from diesel and two-thirds from gasoline consumption.41 Using standard conversion coefficients, we convert the energy consumption into volumes of diesel and gasoline. We obtain 57 billion litres of diesel and 128 billion litres of gasoline, giving a total of 185 billion litres of fuel consumed by passenger cars in the EU in 2005. Our aim is to derive the extra amount of litres of fuel from the effects calculated above, and sum them to arrive at the total effect on fuel use from company car subsidies. This effect amounts to 14.7 billion litres or 8 percent more fuel use in the direct application scenario, while the conservative estimate is 4 percent. Table 5.8 summarises the result of this section. Table 5.8: Summarizing the effect on fuel use
Current study Origin of effect
Direct application Conservative estimate
More cars 3% more fuel use, or 5.6 billion litres 1% more fuel use, or 1.9 billion litres
More expensive cars 4% more fuel use, or 7.4 billion litres 2% more fuel use, or 3.7 billion litres
More kilometres driven 1% more fuel use or extra 1.7 billion litres of fuel
Total effect 8% more fuel or extra 14.7 billion litres 4% more fuel or extra 7.3 billion litres
Source: Copenhagen Economics
Calculating effect on emissions of CO2 and particulate emissions To calculate the effect on emissions, we convert the extra fuel consumed by company into CO2 assuming 3200g CO2 emissions per litre of diesel and 2800g CO2 emissions per litre of gasoline as well as a diesel to gasoline ratio of 1 to 2. The weighted average emission coefficient thus becomes 2933 g CO2 / l of the fuel mix. In Table 5.9, we show the effect on CO2 emissions in the “direct application” and “conservative” cases using the total effects on fuel use reported in Table 5.8 For particulate emissions, we use the coefficient of 0.025 g / km.42 European company cars on average require 5.9 l of fuel per 100 km. Therefore, we are able to restate the particulate
41 Cf. Figure 46 and Figure 47 in DG TREN (2007). 42 NERI (2007), p. 196. We assume that the newly sold diesel company cars fulfil the EURO4 norm for as regards particulate, NOx and HC emissions.
54

emissions coefficient as 0.42 g / l for the European company car fleet43. Using the coefficient and the diesel share (1/3) of the total effects on fuel consumption from Table 5.8, we are able to calculate particulate emissions44. The results are provided in Table 5.9 For NOx emissions, we use the coefficient of 0.25 g / km for diesel and 0.08 g / km for petrol45. We use 5.9 l of fuel per 100 km as average fleet efficiency, and calculate emissions of nitrogen oxides resulting from diesel and petrol use, respectively. The results are provided in Table 5.9. Finally, for HC (hydrocarbon) emissions, we use the coefficient of 0.10 g / km.46 The calculation proceeds in an analogous way as before, using petrol fuel only. The results are reported in Table 5.9. Table 5.9: Total effects on emissions of CO2 and particulates
Direct application Conservative estimate
CO2 (carbon dioxide) 43 Mt 21 Mt Particulate emissions 1.9 kt 1.0 kt NOx (oxides of nitrogen) 50.6 kt 25.0 kt HCs (hydrocarbons) 13.7 kt 6.8 kt
Note: Mt is metric mega tonnes. kt is metric kilo tonnes. Source: Copenhagen Economics and NERI (2007)
43 Calculated as 0.025 [g / km] * 100 [km] / 5.9[ l / 100 km]. 44 Note that particulate emissions are a feature of diesel company cars. 45 NERI (2007), p. 196, assuming the EURO4 norm. 46 NERI (2007), p. 196, assuming the EURO4 norm.
55

ANNEX D: FOREGONE TAX REVENUES (FISCAL LOSSES) In this section we describe our approach to calculate the monetary amount of foregone tax revenues. We use Germany and Spain as illustrations. Our approach is to calculate the ‘too small tax base’, i.e. the difference between the value of the benefit-in-kind received and the taxable base on that benefit. To calculate the former we use the assumptions given in Annex E, while the latter is found from the application of the rules governing the taxation of company cars received as part of employees’ private income. The ‘too small tax base’ is essentially equivalent to the before-tax monetary subsidy, i.e. it represents the part of the before-tax income received by the employee from the firm in the form of a company car that escapes personal income taxation.
Too small employee tax base, per car, € = annualised firm cost, per car, € - annualised employee tax base, per car, €
To calculate the foregone tax, we multiply the ‘too small tax base’ by the applicable personal income tax wedge. This gives the monetary amount of foregone taxes, per company car, or alternatively the after-tax subsidy to the recipient of the benefit-in-kind.
Foregone tax, per car, € = too small tax base, € × tax wedge Finally, we multiply the above amount by the number of cars to arrive at the total amount of foregone tax revenues from the tax collector’s point of view.
Foregone tax, total, € = foregone tax, per car, € × number of cars We carry out the above calculation for each of the six car segments identified in the Polk data using data from 2008. Moreover, since our subsidy calculations are based on two assumptions concerning the mileage (low and high, cf. Annex E), we calculate two estimates of foregone tax revenues per car segment. Table 5.10 presents the results for Germany. Our estimate of foregone revenues ranges from € 21.0 billion in the low mileage case to € 24.8 billion in the high mileage case. Assuming that true mileage is in-between the low and high estimates, this amounts to €22.9 billion in lost tax revenue in 2008. These numbers can be broadly verified by some back-of-the-envelope calculations. The total value cars sold for company cars per year in Germany approach €53 billion according to Polk data on registrations and prices for these cars. We assume that these cars remain as company cars for roughly 3 years and kept in good condition per high level of maintenance thus given a value of the company car stock of over €150 billion. Our estimates suggest that the users of these cars should face an increase of their tax base of 35-40 per cent of this sum to cover the yearly costs of depreciation, interest charges and maintenance of these cars. Yet, the rate for imputation is only 12 per cent. Hence, the taxable base is roughly €38 billion too low. In addition to that comes company-provided “free” and untaxed fuel for private use which may be worth between €5 and €11 billion, depending on assumptions on mileage. So in total, the
56

tax base is €43 to 50 billion too low, relative to a neutral benchmark. With a marginal tax rate around 50 per cent on average, that gives the approximately €23 billion in tax losses. Table 5.10: Foregone tax revenues in Germany
Segment Mini Small LowMed Medium UpMed Large
Private usage Low High Low High Low High Low High Low High Low High
Number of company cars (thousand) 279 279 938 938 2045 2045 1555 1555 663 663 82 82 Too little tax base, per car (€ thousand) 3.1 4.0 3.9 4.9 5.6 6.7 7.7 9.0 11.9 13.4 17.6 19.4
Tax wedge (%) 55.7 55.7 55.7 55.7 61.2 61.2 61.2 61.2 44.3 44.3 44.3 44.3 Foregone tax revenues (€ billion) 0.48 0.62 2.0 2.63 7.0 8.4 7.4 8.6 3.5 3.9 0.64 0.71 Foregone revenues: low mileage: 21.0 € billion Foregone revenues high mileage: 24.8 € billion Average: 22.9 € billion
Source: Copenhagen Economics, Polk (2009) and OECD (2009)
Repeating the same exercise for Spain gives the following results: € 3.7 billion foregone tax revenue in the low mileage case, € 4.4 billion revenue in the high mileage case, amounting to € 4.1 billion in the in-between case. Table 5.11: Foregone tax revenues in Spain
Segment Mini Small LowMed Medium UpMed Large
Private usage Low High Low High Low High Low High Low High Low High
Number of company cars (thousand) 88 88 493 493 743 743 365 365 150 150 11 11 Too little tax base, per car (€ thousand) 2.4 3.1 3,0 3.7 4.2 5.0 5.6 6.6 8.8 10.1 14.1 15.6
Tax wedge (%) 48,2 48,2 48,2 48,2 48,2 48,2 48,2 48,2 28,0 28,0 28,0 28,0 Foregone tax revenues (€ billion) 0.10 0.13 0.70 0.89 1.49 1.80 0.98 1.15 0.37 0.42 0.04 0.05 Foregone revenues: low mileage: € 3.7 billion Foregone revenues high mileage: € 4.4 billion Average: € 4.1 billion
Source: Copenhagen Economics, Polk (2009) and OECD (2009)
Using the above approach we calculate foregone tax revenues in each of the 18EU member states and express them as a percentage of their GDP. We find that the foregone tax revenues amount to about 0.5 percent of GDP, on average, cf. Table 5.12
57

Table 5.12: Direct fiscal losses and its determinants, 18 EU member states, 2008
Groups Country Imputed tax rate Marginal tax rate Company car share (of GDP), 2008
Loss, share of GDP (%)
0-15 percent Greece 0% 52% 0,6% 0,3%
Portugal 9% 54% 1,5% 0,5%
Czech Republic 12% 52% 0,7% 0,3%
Germany 12% 56% 2,1% 0,9%
Slovakia 12% 43% 0,7% 0,1%
Weighted average 11% 56% 1,9% 0,8%
15-24 percent Sweden 9%+extras 65% 1,1% 0,3%
Finland 17% 58% 1,1% 0,2%
Austria 18% 57% 1,6% 0,6%
Luxembourg 18% 54% 2,1% 0,6%
Slovenia 18% 48% 2,1% 0,6%
Spain 20% 45% 1,1% 0,4%
Weighted average 16%* 52% 1,2% 0,4%
Above 24 percent Denmark 25% 61% 1,1% 0,2%
Netherlands 25% 52% 1,3% 0,2%
United Kingdom 25% 47% 1,4% 0,4%
Italy 30% 64% 1,1% 0,5%
Weighted average 27% 55% 1,3% 0,3%
n.a. Belgium n.a. 68% 2,0% 1,2%
Hungary n.a. 65% 1,1% 0,8%
Poland n.a. 45% 0,7% 0,0%
Weighted average n.a. 58% 1,3% 0,6%
Total weighted average 18%* 55% 1,4% 0,5%
Note: In the weighted average for each group, the share of total GDP within the group is used as a weight. In the total weighted average, the share of total GDP (of the 18 countries) is used as a weight. France is not included. The loss as share of GDP for Poland is set to zero. * Sweden is not included in the calculated weighted average. The marginal tax rate for each country is an average weighted by the value of company cars in the 6 segments. Source: Copenhagen Economics
Calculating the neutral imputation rate The presence of fiscal loss implies that the currently used imputation rates are too low relative to the value of the benefit-in-kind provided by firms to employees. Knowing the latter, it is straightforward to calculate the size of the imputation rate that would equate the neutral personal income tax base. In what follows, we carry out a calculation of the neutral imputation rate using the example of a middle segment company car in Germany. We find that the imputation rate is in the order of 50 percent of car list price per annum, which is 38 percentage points more than the currently applied rate of 12 percent, cf. Table 5.13. This result is consistent with calculations performed by Puigarnau and van Ommeren (2009) for the Netherlands, and reproduced in Table 5.14. They obtain essentially the same neutral imputation rate of 50 percent, which is substantially higher than the 22 percent rate currently used in the Netherlands.
58

Table 5.13 Actual tax base and neutral tax base example, Germany, medium segment, high mileage Item Monetary values
actual, € Actual tax rate, %
Neutral tax rate, %
Car list price, actual 35314
Value of company-provided benefits Car value, annualised 11474 Fuel cost, annualised 2159 ITM, annualised 4316 Total benefit, annualised 17949
Value of employee tax base Car value, annualised 4382 12% of car list price 32% of car list price Fuel cost, annualised 0 0% 6% of car list price ITM cost, annualised 0 0% 12% of car list price
Total employee tax base 4382 12% of car list price 51% of car list price*
Note: The results are rounded off to whole figures Source: Copenhagen Economics
The Puigarnau and van Ommeren (2009) distinguish between 2 types of company cars: • Productive cars – used for private and business purposes by employees • Non-productive cars – used solely for private purposes by employees Productive cars are more expensive to buy. However, in the Netherlands most company cars are used for private purposes, so they are non-productive.47 The study identifies the following cost components. They are essentially the same as the assumptions in the current study: • Fixed costs: purchase cost (derived from lease cost), insurance, maintenance, road tax • Variable costs: fuel costs and depreciation cost per km Table 5.14 shows the calculation from the study using the setup developed for Germany, above (for comparison). Table 5.14 Actual tax base and neutral tax base example, Netherlands, non-productive car Item Monetary values
actual, € Actual tax rate, %
Neutral tax rate, %
Car list price, actual 17000
Value of company-provided benefits Car value, annualised 3700 Fuel cost, annualised 2550 ITM, annualised 2500 Total benefit, annualised 8750
Value of employee tax base Car value, annualised 4080 24% of car list price 22% Fuel cost, annualised 0 0% 15% ITM cost, annualised 0 0% 15%
Total employee tax base 24% of car list price 51% of car list price*
Note: The results are rounded off to whole figures. Note paper uses an actual imputation rate of 22% which recently has been changed to 24%. Source: Copenhagen Economics, Puigarnau and van Ommeren (2009) p. 9 and Appendix A.
47 Puigarnau and van Ommeren (2009) p. 3. In the Netherlands, 78% of employees with company car have NOT used this car for any business purpose during a period of 3 months, and another 12% have travelled less than 100km per week for business purposes.
59

ANNEX E: CALCULATING THE SUBSIDY TO PRIVATE USE OF COMPANY CARS IN FRANCE In this annex we use the French tax rules to illustrate a calculation of the subsidy received by employee using a company-provided car for private purpose. France provides two methods of calculating the tax: based on actual use and lump-sum. We assume that the employee can choose the most advantageous method given the intensity of private use. In this example, the employee drives 10,000 km p.a. while the business use of the car is 25,000 km p.a. which makes the lump-sum method most advantageous. The full methodology together with documentation is available in Part B to this study. To calculate the subsidy we use the company cost perspective. We start by calculating the net present value of the cost to the company of providing the employee with the car, which includes the acquisition cost of the vehicle, the cost of the fuel provided to the employee for private use and other costs incurred by the company, such as maintenance, repair, motoring taxes or parking fees. The calculation is based on assumptions illustrated below. The next step is to calculate the net present value of the increase in the tax base for the employee using the company-provided car, fuel and the remaining benefits (maintenance, repairs, parking, etc.). The calculation is also based on assumptions listed below. Once the two net present values are found, we convert them to annual equivalents and compare the difference between them to the acquisition cost of the car which under French rules is also taxable for the employee. The amount is presented as percentage.
Calculation of company cost
Assumptions: r: Segment list price reduced by 15% (company buying advantage)
Insurance, maintenance, running costs, p.a.: 12% of acquisition cost Employee private use: 10,000 km p.a. Business use: 25,000 km p.a. Derived from average segment emissions, g CO2 / km (Polk data) Fuel price: National annual average in 2008, 1.38 €/l Depreciation over 3 years: 61% Company cost of capital: 4.34%
60
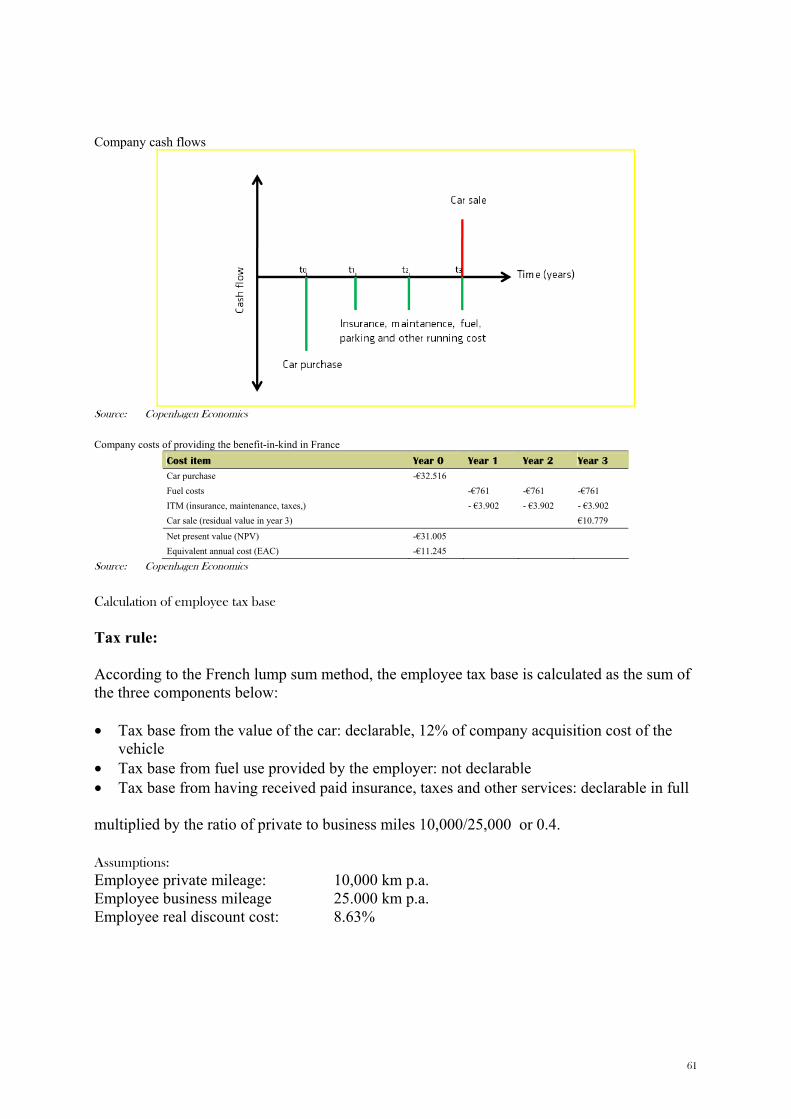
Company cash flows
Source: Copenhagen Economics
Company costs of providing the benefit-in-kind in France
Cost item Year 0 Year 1 Year 2 Year 3 Car purchase -€32.516 Fuel costs -€761 -€761 -€761 ITM (insurance, maintenance, taxes,) - €3.902 - €3.902 - €3.902 Car sale (residual value in year 3) €10.779
Net present value (NPV) -€31.005 Equivalent annual cost (EAC) -€11.245
Source: Copenhagen Economics
Calculation of employee tax base Tax rule: According to the French lump sum method, the employee tax base is calculated as the sum of the three components below: • Tax base from the value of the car: declarable, 12% of company acquisition cost of the
vehicle • Tax base from fuel use provided by the employer: not declarable • Tax base from having received paid insurance, taxes and other services: declarable in full multiplied by the ratio of private to business miles 10,000/25,000 or 0.4.
Assumptions: Employee private mileage: 10,000 km p.a. Employee business mileage 25.000 km p.a. Employee real discount cost: 8.63%
61

Employee cash flows
- €7.200 - €7.200 - €7.200
t0 t1 t2 t3 Time (years)
Cas
h flo
w, €
- €7.200 - €7.200 - €7.200
t0 t1 t2 t3 Time (years)
Cas
h flo
w, €
Source: Copenhagen Economics Calculation of employee tax base
Cost item Year 0 Year 1 Year 2 Year 3 Tax base: from car value, lump-sum method €€3.317 €3.317 €3.317 Tax base: from use of fuel provided by employer €0 €0 €0 Tax base: from use of ITM provided by employer €3.902 €3.902 €3.902
Net present value €18.393 Equivalent annual cost €7.218
Source: Copenhagen Economics
Calculation of subsidy To calculate the subsidy, we subtract the tax base declarable by the employee from the company cost of providing the benefit-in-kind and express this difference relative to the acquisition cost of the car. Equivalent annual cost for company: -€11.245 Equivalent annual cost for employee: €7,218 Car acquisition cost: €32,516 Subsidy = (|-€11.245| – €7,218 × 0.4) / €32,516 = 30%
62

REFERENCES ACEA (2006), European Automobile Industry Report, European Automobile Manufacturers’ Association, Brussels.
ACEA (2008), The automobile Industry Pocket Guide, European Automobile Manufacturers’ Association, Brussels.
ACEA (2009), Overview of CO2 Based Motor Vehicle Taxes in the EU, European automobile Manufacturers’ Association, Brussels, January 2009.
ACEA (2009), Tax Guide 08, European Automobile Manufacturers’ Association, Brussels, January 2008.
ACEA (2009), Tax Guide 09, European Automobile Manufacturers’ Association, Brussels, January 2009.
Ackerman, Peter (2007), “Deductibility of Car Expenses for Companies Linked to Emission of CO2”, International Tax Review, Vol. 18, Issue 7.
AEA Energy & Environment (2007), Combined Impact Assessment of Proposed Emissions Related Congestion Charging, A report to Transport for London.
Anable, J. and Bristow, A., L., (2007), Transport and Climate Change: Supporting document to the CfIT report, Report prepared for the Climate Change Working Group of the Commission for Integrated Transport.
Anfac (2009), European Motor Vehicle Parc 2007, February 2009.
Bennet, W. B. (1967), “Cross-Section Studies of the Consumption of Automobiles in the United States”, American Economic Review.
Bondsonline (2009), database of indicators on fixed income instruments, accessed May 2009, http://www.bondsonline.com/Todays_Market/Global-Bond-Spreads.php
Bouachera, Taoufik and Mazraati, Mohammad (2007), Fuel Modeling and Car Ownership Modeling in India, Organization of the Petroleum Exporting Countries.
BTE (1981), Energy Policies and Company Cars: An Application of Experimental Design Methods in Economics Research, Bureau of Transport Economics, Australia.
Cohen-Blankshtain, G. (2008), “Framing transport-environmental policy: The case of company car taxation in Israel”, Transportation Research Part D, 13 (2008), 65-74.
Coles, Sarah (2008), Market Trends – Company Car Manufacturers, Buyer’s Guide at www.employeebenefits.co.uk
Cornelis E. et al. (2009), Professional mobility and company car ownership “Promoco”. Final Report. Brussels, Belgian Science Policy 2009, Research Programme for a Sustainable Development
D’Ambrosio, C. & Gigliarano, C. (2008), Home Production and Fringe Benefits: an Estimation of their Distributional Impact on Italy, Euro Centre.
Dahlby, B. and Ferede, E. (2009), Tax Cuts, Economic Growth, and the Marginal Cost of Public Funds for Canadian Provincial Governments, Canada.
Dargay, J. (2001), “The effect of income on car ownership: evidence of asymmetry”, Transportation Research part A, 35 (2001), 807-821.
63

Dargay, J. (2007), “The effect of prices and income on car travel in the UK”, Transportation Research part A, 41 (2007) 949-960.
Dargay, J. and Gately, D. (1999), “Income’s effect on car and vehicle ownership, worldwide, 1960-2015”, Transportation Research part A, 33 (1999), 101-138.
De Borger, B. and Mayeres, I. (2007), “Optimal taxation of car ownership, car use and public transport: Insights derived from a discrete choice numerical optimization model”, European Economic Review, 51 (2007), 1177-1204.
DEFRA (2007), UK Energy Efficiency Action Plan 2007, Department For Environment, Food and Rural Affairs.
DG Competition (2007), Car Price Comparison 2006.
DG Environment (2002), Fiscal Measures to Reduce CO2 Emissions from New Passenger Cars, Main Report, prepared by COWI A/S, January 2002.
DG Environment (2009), Short note on registration of N1 and M1 vehicles, a note prepared by DG Environment for Copenhagen Economics in connection to this study.
DG TREN (2007), European Energy and Transport – Trends to 2030, update 2007, European Commission, Directorate-General for Energy and Transport.
DSF (2005), Analysis of Proposed Changes in Tax Treatment of Company Cars in Canada (Company Car Tax Shift), prepared for David Suzuki Foundation by MK Jaccard and Associates Inc., 19 December, 2005.
EC (2005), Proposal for a Council Directive on passenger car related taxes, COM (2005) 261 final, Brussels 5.7.2005.
EC (2009), Car Price Report, 1st of January 2009.
EC (2009), Monitoring Decision 1753/2000/EC. 7th Expert Group Meeting 12 March 2009.
Enoch, Marcus and Potter, Steven (2002), “Encouraging the Commercial Sector to Change their Travel Behaviour”, Transport Policy, 10, (2003) 51-58.
European Automobile Manufacturers Association (2008), The Automobile Industry Pocket Guide, ACEA Communications Department, Brussels, September 2008.
Fleetnews (2009). This webpage contains information for fleet managers, http://www.fleetnews.co.uk, Bauer Automotive, collected in May 2009.
Fowler, Steve (2008), “Honey I Shrank the Company Car”, Management Today, September 2008.
Fullerton, Don and West, Sarah E. (2001), “Can Taxes on Cars and Gasoline Mimic Unavailable Tax on Emissions?, Journal of Environmental Economics and Management 43, 135-157 (2002).
Goodwin, Phil (2003), Elasticities of Road Traffic and Fuel Consumption with Respect to Price and Income: A Review, University College London, London.
Graus, Wina and Worrel, Ernst (2008), “The Principal-Agent Problem and Transport Energy Use: Case Study of Company Lease Cars in the Netherlands”, Energy Policy.
HM Revenue & Customs (2006), Report on the Evaluation of the Company Car Tax Reform: Stage 2, Her Majesty’s Revenue & Customs, 22 March, 2006.
House of Commons (2006), Reducing Carbon Emissions from Transport, Ninth Report of Session 2005–06, Environmental Audit Committee.
64

IEA (2007), Quantifying the Effects of Market Failures in the End-use of Energy, Final Draft Report Prepared for IEA by the American Council for an Energy-Efficient Economy, Washington D.C.
Inland Revenue (2004), Report on the Evaluation of the Company Car Tax Reform, 29 April 2004.
Johansson-Stenman, O. (2002), “Estimating individual driving distance by car and public transport use in Sweden”, Applied Economics, 2002, 34, 959-967.
Kalinowska, Dominika, Kuhfeld, Hartmut and Kunvert Uwe (2006), Comparison of EU Truck Taxation, Presentation at the COST Action 355 Meeting, Piraeus, April 18-19 2006.
Kleven, H. J. and Kreiner, C. T. (2003), The Marginal Cost of Public Funds in OECD Countries: Hours of Work Versus Labor Force Participation, CES Working Paper No. 935.
Kohn, Robert E. (1995), “An Additive Tax and Subsidy for Controlling Automobile Pollution”, Applied Economic Letters, 1996, 3, 459-462.
Kunert, U. and Kuhfeld, H. (2007), “The diverse structures of passenger car taxation in Europe and the EU Commission’s proposal for reform”, Transport Policy, 14, 306-316.
Leicester, A. (2006), The UK Tax System and the Environment, The Institute for Fiscal Studies, London.
Matas, A., and Raymond, J. (2008), “Changes in the structure of car ownership in Spain”, Transportation Research Part A, 42 (2008), 187-202.
Mayeres, I. et al. (2001), The External Costs of Transportation – Final Report, Belgium.
Meyer, I., Leimbach M., Jaeger C.C. (2007), “International Passenger Transport and Climate Change and Associated CO2 emissions from 2000 to 2050”, Energy Policy, 35 (2007) 6332-6345.
Nelson, Randy A. (1997), “Price Changes, Maintenance, and the Rate of Depreciation”, Review of Economics & Statistics, Aug97, Vol. 79, Issue 3.
NERI (2007), Annexes to the annual Danish Emission Inventory Report to UNECE, Danish National Environmental Research Institute (NERI).
O’Herlihy, C. St. J. (1965), Demand for Cars in Great Britain, National Institute of Economic and Social Research.
OECD (2004), The OECD Classification of Taxes and Interpretative Guide.
OECD (2008a), Consumption Tax Trends 2008 – VAT/GST and Excise Rates, Trends and Administration issues.
OECD (2008b), Revenue Statistics 1965-2007, OECD Publications France.
OECD (2008c), Households Behaviour and the environment – Reviewing the Evidence, OECD Publications France. http://www.oecd.org/dataoecd/19/22/42183878.pdf
OECD (2009), OECD Tax Database, (Table I.1 – marginal personal income tax and social security contribution rates on gross labour income), available at http://www.oecd.org/ctp/taxdatabase
Polk (2009) Database on car registrations.
Potter, S. and Parkhurst, G. (unpublished), Transport Policy and Transport Tax Reform, The Open University, Milton Keynes.
65

66
Puigarnau and van Ommeren (2007), Welfare Effects of Distortionary Company Car Taxation, Tinbergen Institute Discussion Paper, TI 2007-060/3, www.tinbergen.nl (accessed December 2008).
Puigarnau and van Ommeren (2009), Welfare Effects of Distortionary Company Car Taxation, Tinbergen Institute Discussion Paper, TI 2007-060/3, www.tinbergen.nl (updated version, accessed September 2009).
PWC (2006), International Fleet Guide: Car Taxation in 25 Countries, PricewaterhouseCoopers, 2006.
PWC (2008), International Fleet Guide: Update on Car Taxation in 16 Countries – 2008, PricewaterhouseCoopers, 2008.
PWC (2009), Staying on Track. Car Expenses and Benefits – A Tax Guide 2009, PricewaterhouseCoopers, 2009.
Romankov, Marek (2002), Tax Issues put new Spin on Company Car Policies, PricewaterhouseCoopers, 2002.
Ryan, L. et al. (2009), “The impact of fiscal and other measures on new passenger car sales and CO2 emissions intensity: Evidence from Europe”, Energy Economics in press.
Seely, A. (2002), Taxing company cars, House of Commons Research Paper 02/10, 5 February 2002, House of Commons Library.
Steininger, K. et al. (2007), “Sustainability Impacts of Car Road Pricing: A Computable General Equilibrium Analysis for Austria”, Ecological Economics, 63 (2007), 59-69.
Storchmann, K. (2005), “Long-Run Gasoline Demand for Passenger Cars: the Role of Income Distribution”, Energy Economics, 27 (2005), 25-58.
TAXUD (2002), Study on Vehicle Taxation in the Member States of the European Union, Final Report. Prepared by TiS PT in cooperation with INFRAS-Consulting, Analysis & Research, Erasmus University Rotterdam and DIW, Brussels.
Tishler, Asher (1981), The Demand for Cars and the Price for Gasoline: The User Cost Approach, Tel-Aviv University.
UKERC (2009), What policies are effective at reducing carbon emissions from surface passenger transport? A review of interventions to encourage behavioral and technological change, A report produced by the Technology and Policy Assessment Function of the UK Energy Research Centre.
United Nations Statistics Division (2009), Miscellaneous Current Taxes, http://unstats.un.org/unsd/sna1993/tocLev8.asp?L1=8&L2=3, United Nations, collected in May 2009.
van Ommeren, J. et al. (2006), “Transport-Related Fringe Benefits: Implications for Moving and the Journey to Work”, Journal of Regional Science, 2006, 46 (3), 493-506.
Whelan, G. (2007), “Modelling car ownership in Great Britain”, Transportation Research part A, 41 (2007), 205-219.
Wirth, Heike and Wolf, Christof (2009), EU-LFS and EU-SILC: Official Microdata for Research Purposes, Mannheim, March 5-6, 2009.
Witt, Stephen F. and Johnson, Raymond S. (1986), An Econometric Model of New-Car Demand in the UK, University of Bradford, UK.

TAXATION PAPERS Taxation Papers can be accessed and downloaded free of charge at the following address: http://ec.europa.eu/taxation_customs/taxation/gen_info/economic_analysis/tax_papers/index_en.htm The following papers have been issued. Taxation Paper No 21 (2010): Taxation and the Quality of Institutions: Asymmetric Effects on FDI. Written by Serena Fatica. Taxation Paper No 20 (2010): The 2008 Financial Crisis and Taxation Policy. Written by Thomas Hemmelgarn and Gaëtan Nicodème. Taxation Paper No 19 (2009): The role of fiscal instruments in environmental policy.' Written by Katri Kosonen and Gaëtan Nicodème. Taxation Paper No 18 (2009): Tax Co-ordination in Europe: Assessing the First Years of the EU-Savings Taxation Directive. Written by Thomas Hemmelgarn and Gaëtan Nicodème. Taxation Paper No 17 (2009): Alternative Systems of Business Tax in Europe: An applied analysis of ACE and CBIT Reforms. Written by Ruud A. de Mooij and Michael P. Devereux. Taxation Paper No 16 (2009): International Taxation and multinational firm location decisions. Written by Salvador Barrios, Harry Huizinga, Luc Laeven and Gaëtan Nicodème. Taxation Paper No 15 (2009): Corporate income tax and economic distortions. Written by Gaëtan Nicodème. Taxation Paper No 14 (2009): Corporate tax rates in an enlarged European Union. Written by Christina Elschner and Werner Vanborren. Taxation Paper No 13 (2008): Study on reduced VAT applied to goods and services in the Member States of the European Union. Final report written by Copenhagen Economics. Taxation Paper No 12 (2008): The corporate income tax rate-revenue paradox: evidence in the EU. Written by Joanna Piotrowska and Werner Vanborren. Taxation Paper No 11 (2007): Corporate tax policy and incorporation in the EU. Written by Ruud A. de Mooij and Gaëtan Nicodème. Taxation Paper No 10 (2007): A history of the 'Tax Package': The principles and issues underlying the Community approach. Written by Philippe Cattoir. Taxation Paper No 9 (2006): The Delineation and Apportionment of an EU Consolidated Tax Base for Multi-jurisdictional Corporate Income Taxation: a Review of Issues and Options. Written by Ana Agúndez-García. Taxation Paper No 8 (2005): Formulary Apportionment and Group Taxation in the European Union: Insights from the United States and Canada. Written by Joann Martens Weiner. Taxation Paper No 7 (2005): Measuring the effective levels of company taxation in the new member States : A quantitative analysis. Written by Martin Finkenzeller and Christoph Spengel. Taxation Paper No 6 (2005): Corporate income tax and the taxation of income from capital. Some evidence from the past reforms and the present debate on corporate income taxation in Belgium. Written by Christian Valenduc.

Taxation Paper No 5 (2005): An implicit tax rate for non-financial corporations: Definition and comparison with other tax indicators. Written by Claudius Schmidt-Faber. Taxation Paper No 4 (2005): Examination of the macroeconomic implicit tax rate on labour derived by the European Commission. Written by Peter Heijmans and Paolo Acciari. Taxation Paper No 3 (2005): European Commission Staff Working Paper. Taxation Paper No 2 (2004): VAT indicators. Written by Alexandre Mathis. Taxation Paper No 1 (2004): Tax-based EU own resources: an assessment. Written by Philippe Cattoir.

European Commission
Taxation papers – Company Car Taxation
Luxembourg: Publications Office of the European Union
2010 — 68 pp. — 21 x 29.7 cm
ISBN 978-92-79-15863-6
doi: 10.2778/13821
HOW TO OBTAIN EU PUBLICATIONS
Free publications:
• via EU Bookshop (http://bookshop.europa.eu);
• at the European Commission’s representations or delegations. You can obtain their contact details on the Internet (http://ec.europa.eu) or by sending a fax to +352 2929-42758.
Priced publications:
• via EU Bookshop (http://bookshop.europa.eu).
Priced subscriptions (e.g. annual series of the Official Journal of the European Union and reports of cases before the Court of Justice of the European Union):
• via one of the sales agents of the Publications Office of the European Union (http://publications.europa.eu/others/agents/index_en.htm).

K
P-AC-10-022-EN-C