
Print : ISSN : 19-512X | Online : ISSN : 2454-6801 THE...
104
THE INDIAN JOURNAL OF COMMERCE Quarterly Publication of the Indian Commerce Association Vol.68 No.4 October-December 2015 Prof. H.K. Singh - Managing Editor With Vice Chancellor Secretariat at : Maharishi University of Information Technology Campus : Sitapur Road (IIM Byepass, Bhitauli Tiraha) Post : Maharishi Vidya Mandir, Lucknow 226013 (U.P.) Visit : www.icaindia.info, www.ijoc.in • Email : [email protected] Balla Appa Rao and D. Nagayya R.Ramachandran Akshita Goyal, Anshuman Kamila and Aishwarya Dayal Paramveer S. Chundawat Sathya Swaroop Debasish, Artta Bandhu Jena & Sabyasachi Dey Vinay K. Srivastava M.K. Singh & Sonal Sharma Gnyana Ranjan Bal and Amit Manglani Parikshat Singh Manhas and Rajani Kumari Sarangal B. Ramesh and Savia Mendes Kumud Chandra Goswami and Sarah Yasmin Hussain Bhagirath Singh, Manoj Meet and Somya Choubey Skill Development and Entrepreneurship for Micro and Small Enterprises Attrition of the Employees in Hotel Industry– A Comparative Analysis Estimation of the Gravity Model of Trade for India Critical Analysis of Operational Efficiency of Merger Activity in Banking Industry: A Case Study of HDFC Bank CRM and its Impact on Customer Loyalty: An Empirical Study on Private Banks in Odisha Testing Efficiency for S&P Nifty Securities in India Corporate Social Responsibility for a Sustainable Change: A Case of Hindustan Unilever Limited Dynamic Relationship Between Stock Price and Exchange Rate Changes: Evidence from Indian Market Internal Marketing Practices and Employee Job Satisfaction: A Case of Life Insurance Corporate Social Responsibility: A Comparative Study of Select Public and Private Sector Banks In India Contribution of Personal Life to the Work Life of the Employees of N.F. Railways Applicability of Two Factor Theory of Motivation on Private University Teachers : An Empirical Study Print : ISSN : 19-512X | Online : ISSN : 2454-6801
Transcript of Print : ISSN : 19-512X | Online : ISSN : 2454-6801 THE...

THE INDIAN JOURNAL OF COMMERCE
Quarterly Publication of the Indian Commerce AssociationVol.68 No.4 October-December 2015
Prof. H.K. Singh - Managing Editor
With Vice Chancellor Secretariat at : Maharishi University of Information TechnologyCampus : Sitapur Road (IIM Byepass, Bhitauli Tiraha)Post : Maharishi Vidya Mandir, Lucknow 226013 (U.P.)Visit : www.icaindia.info, www.ijoc.in • Email : [email protected]
Balla Appa Rao and D. Nagayya
R.Ramachandran
Akshita Goyal, Anshuman Kamila and Aishwarya Dayal
Paramveer S. Chundawat
Sathya Swaroop Debasish, Artta Bandhu Jena & Sabyasachi Dey
Vinay K. Srivastava
M.K. Singh & Sonal Sharma
Gnyana Ranjan Bal and Amit Manglani
Parikshat Singh Manhas and Rajani Kumari Sarangal
B. Ramesh and
Savia Mendes
Kumud Chandra Goswami and Sarah Yasmin Hussain
Bhagirath Singh, Manoj Meet and Somya Choubey
Skill Development and Entrepreneurship for Micro and Small Enterprises
Attrition of the Employees in Hotel Industry–A Comparative Analysis
Estimation of the Gravity Model of Trade for India
Critical Analysis of Operational Efficiency of Merger Activity in Banking Industry: A Case Study of HDFC Bank
CRM and its Impact on Customer Loyalty: An Empirical Study on Private Banks in Odisha
Testing Efficiency for S&P Nifty Securities in India
Corporate Social Responsibility for a Sustainable Change: A Case of Hindustan Unilever Limited
Dynamic Relationship Between Stock Price and Exchange Rate Changes: Evidence from Indian Market
Internal Marketing Practices and Employee Job Satisfaction: A Case of Life Insurance
Corporate Social Responsibility: A Comparative Study of Select Public and Private Sector Banks In India
Contribution of Personal Life to the Work Life of the Employees of N.F. Railways
Applicability of Two Factor Theory of Motivation on Private University Teachers : An Empirical Study
Print : ISSN : 19-512X | Online : ISSN : 2454-6801
MANAGING EDITORProf. H.K. SinghVice-Chancellor
Maharishi University of Information Technology, Lucknow, Uttar Pradesh, India
JOINT MANAGING EDITORSDr. Subhash Garg Dr. Ajay Kr. Singh Dr. Sanket VijDean & Director Associate Professor ProfessorCentre for Research, Innovation & Faculty of Commerce and Business Department of Management Training, The IIS University Delhi School of Economics, BPS Mahila Vishwavidyalaya Jaipur, Rajasthan University of Delhi, Delhi Sonepat, Haryana
ASSOCIATE EDITORSDr. S.B. Lall Dr. Meera Singh Dr. Shweta Kastiya Sapan AsthanaVanijya Mahavidyalaya UP Autonomous PG College The IIS University MUITPatna University, Patna Varanasi Jaipur Lucknow
EDITORIAL CONSULTANTS
The Indian Journal of Commerce is published four times in a year i.e., March, June, September and December. The Indian Journal of Commerce is freely distributed to all members.Membership to Indian Commerce Association Individual Institutional Annual Members ` 1,000 ` 1,000 Life Members ` 5,000 ` 25,000Subscriptions/ Membership fee is to be paid in the form of Demand Draft, drawn in favour of 'Indian Commerce Association', payable at Amritsar. Fee can also be directly deposited in Indian Commerce Association Account No: 14572191054283 in Oriental Bank of Commerce (Branch: MAJITHA, AMRITSAR-IFSC code: ORBC0101457). Every member will have to register online on www.icaindia.info/index.php/membership before sending the fee to Dr. Balwinder Singh, Secretary, Indian Commerce Association, Associate Professor, Department of Commerce, Guru Nanak Dev University, Amritsar-143001, Punjab, India.Advertisements : Limited space is available for advertisement on the following rates : Back Cover page Full ` 10,000 Inside Cover page Full ` 5,000 Full Page ` 3,000 Half Page ` 2,000Correspondence: All correspondence regarding publications and advertisement should be addressed to : Prof. H.K. Singh, The Managing Editor, Indian Journal of Commerce, Maharishi University of Information Technology, Campus : Sitapur Road (IIM Byepass Bhitauli Tiraha) Post : Maharishi Vidya Mandir, Lucknow 226 013 (U.P.), Email : [email protected], Web : www.ijoc.inThe views expressed in the articles and other material published in The Indian Journal of Commerce do not reflect the opinions of the ICA.
The Indian Journal of Commerce A Quarterly Refereed Journal
Aims and Objectives : Indian Journal of Commerce, started in 1947, is the quarterly publication of the All India Commerce Association to disseminate knowledge and information in the area of trade, commerce, business and management practices. The Journal focusses on theoretical, applied and disciplinary research in commerce, business studies and management. It provides a forum for debate and deliberations of academics, industrialists and practitioners.
Prof. David RossUniversity of Southern Queensland, AustraliaCurrently in HELP University, MalaysiaProf. Suneel MaheshwariIndiana University of Pennsylvania, Pennsylvania, USAProf. Ing. Elena HorskaProfessor of MarketingSlovak University of Agriculture in Nitra, Slovak RepublicProf. Walter Terry ParrishICE Academy, Smethwick (Birmingham) Campus, United KingdomProf. Doc. Ing. Petr SauerUniversity of Economics, Prague, Czech RepublicProf. M. SaeedMinot State University, North Dakota, USAProf. Andras NabradiUniversity of Debrecen, Debrecen, Hungary Prof. Syed Ahsan JamilDhofar Universtiy, OmanProf. B. Ramesh Ex Dean of Commerce, Goa UniversityDr. Subodh KesharwaniSMS,IGNOU, New DelhiProf. Coskun Can AktanDokuz Eylül University, Izmir, TurkeyProf. R.K. JenaUtkal University, Bhubaneswar, OdishaDr. R.U. SinghMagadh University, BiharProf. Popp JozsefDeputy Director, AERI, Budapest, HungaryProf. Hamid SaremiVice-Chancellor, Islamic Azad University, Quchan, IranDr. Rakesh GuptaGriffith University, Australia
Prof. B.P. SinghChairman, Delhi School of Professional Studies & Research (GGSIP University), Rohini, DelhiProf. L.N. DahiyaMD University Rohtak, HaryanaProf. O.P. RaiBanaras Hindu University (BHU), Varanasi, Uttar PradeshProf. D.P.S. VermaEx Professor, Faculty of Commerce & BusinessDelhi School of Economics, University of Delhi, DelhiProf. P. Purushottam RaoFormerly Professor, Osmania University, HyderabadProf. P.R. AgrawalVice- Chancellor, V.B.S. Purvanchal University, Jaunpur, U.P.Dr. Babban TaywadeDhanwate National College, Nagpur, MaharashtraDr. T.A. ShiwareKPB Hinduja College, Mumbai, MaharashtraProf. K. EresiBangalore University, Bengaluru, KarnatakaProf. K.S. JaiswalMG Kashi Vidyapeeth, Varanasi, Uttar PradeshProf. Sanjay BaijalDDU Gorakhpur University, Gorakhpur, Uttar PradeshProf. Sandip K. BhattSardar Patel University, VV Nagar, Anand, GujaratProf. Umesh HolaniEx Dean of Commerce, Jiwaji University, Gwalior, M.P.Prof. Debabrata MitraNorth Bengal University, Bardwan, West BengalProf. Bhagwan Das FM University, Balasore, Odisha

THE INDIAN JOURNAL OF COMMERCE
Quarterly Publication of the Indian Commerce AssociationVol.68 No.4 October-December 2015
CONTENTS
EDITORIALProf. H.K. Singh
Skill Development and Entrepreneurship for Micro and Small Enterprises 5-12Balla Appa Rao and D. Nagayya
Attrition of the Employees in Hotel Industry–A Comparative Analysis 13-22R.Ramachandran
Estimation of the Gravity Model of Trade for India 23-34Akshita Goyal, Anshuman Kamila and Aishwarya Dayal
Critical Analysis of Operational Efficiency of Merger Activity in Banking Industry: 35-41A Case Study of HDFC BankParamveer S. Chundawat
CRM and its Impact on Customer Loyalty: An Empirical Study on Private Banks in Odisha 42-48Sathya Swaroop Debasish, Artta Bandhu Jena & Sabyasachi Dey
Testing Efficiency for S&P Nifty Securities in India 49-56Vinay K. Srivastava
Corporate Social Responsibility for a Sustainable Change: A Case of Hindustan Unilever Limited 57-63M.K. Singh & Sonal Sharma
Dynamic Relationship Between Stock Price and Exchange Rate Changes: 64-70Evidence from Indian MarketGnyana Ranjan Bal and Amit Manglani
Internal Marketing Practices and Employee Job Satisfaction: A Case of Life Insurance 71-79Parikshat Singh Manhas and Rajani Kumari Sarangal
Corporate Social Responsibility: A Comparative Study of Select Public and 80-85Private Sector Banks In IndiaB. Ramesh and Savia Mendes
Contribution of Personal Life to the Work Life of the Employees of N.F. Railways 86-92Kumud Chandra Goswami and Sarah Yasmin Hussain
Applicability of Two Factor Theory of Motivation on Private University Teachers : 93-98An Empirical StudyBhagirath Singh, Manoj Meet and Somya Choubey
( 1 )

Our global and political environment is bubbling with great hopes and aspirations of pink health and rising graph of Trade, Industry and Commerce all around. As such, it becomes my humble and honest duty, belonging to the world of academics, to interact and share with some instrumental guidelines for the contributors and participants in the forthcoming issues of the Indian Journal of Commerce.
Research along with its practical implications and usage and utility in the field of business studies has great relevance today. It is therefore, suggested that Papers based on application oriented research are more welcome; especially in the fields of industry, commerce, business studies and management areas. The papers must include tables, diagrams, illustrations and such other tools to support the different and divergent viewpoints. As such, the length of a paper including all these has to be cautiously controlled and should not exceed 20 double space pages. Short communications relating to review articles, report of various conferences, summary/views on several governments' reports, database issues etc. should also not exceed more than 5 double spaced pages and are invited to be published. We also welcome book-reviews and summary of Ph. D. dissertations but not in more than two double spaced pages. Care should be taken that whatever manuscripts are sent for publication in this journal should not have been published elsewhere any time before.
As is the common practice, two copies of the manuscripts typed in double space on A4 size bond paper should be submitted and the electronic version of the paper must accompany 3.5 inch high density floppy diskette in PC compatible WORD 7.0 document format.Papers without floppy/CD will not be accepted. It is informed that all the papers/contributions submitted for publication in the journal will be subjected to peer reviews and the decision of the Editorial Committee will be final.
First page of the Paper should consist of the title of the paper, name(s), of the author(s) along with all the other required details and the abstract should not exceed more than150 words. Second page should start with the title of the paper again to be followed by the text. In the captions for the tables, figures and column headings in the tables, the first letter of the first word should be capitalised and all other words should be in lower case, except the proper nouns. Footnotes in the text should be numbered consecutively in plain Arabic superscripts. All the footnotes, if any, should be typed under the heading 'Footnotes' at the end of the paper immediately after Conclusion.
Follow the Author -date (Harvard) System in-text reference: e.g. Saurabh (2014) observed that….A Study (Shantanu et. L. 2015) found that…..When it is necessary to refer to a specific page(s), cite it in the text as: Saurabh (2014 P. 105) observed that…A study Saurabh 2014a, Saurabh 2014b, Saurabh 2014c, so on and so forth.
It is to be noted that only cited works should be included in the 'References' which should appear alphabetically at the end of the paper. Follow the reference citation strictly in accordance with the following examples.
Book : Singh, H. K. 2015. Mutual Funds Market. New Delhi: Kanishka publishers.
Journal Article : Singh, Meera 2015. Journal of Indian School of Political Economy. Jan-March,2015, Vol-22, Nos 1, pp 34-48.
Government Publication : Government of India, Ministry of Communications, Department of Telecommunications 2015. Annual report. New Delhi.
Chapter in a Book : Gilberto Mendoza, 2015, A Premier on Marketing Channels and Margins. Pages 257-276 in Prices, Products and People (Gregory J. Scott, ed.) London. Lynne Rienner Publishers.
All copyrights are with the Indian Commerce Association and the authors. The authors are responsible for copyright clearance for any part of the content of their articles. The opinions expressed in the articles of this journal are those of the authors, and do not reflect the objectives or opinion of the Association.
All the manuscripts should be sent to Prof. H.K.Singh, Vice-Chancellor and the Managing Editor, The Indian Journal of Commerce, Maharishi University of Information Technology , Sitapur Road, Near IIM, Lucknow, Uttar Pradesh, 226013, Mobile: 09415264509, E-mail: [email protected]
Published by Prof. H. K. Singh on behalf of the Indian Commerce Association
NOTES FOR CONTRIBUTORS
( 2 )
FROM THE MANAGING EDITOR DESK
It is with the sense of immense delight that we are presenting before you so
promptly, the Volume 68(Oct-Dec 2015 issue) of the Indian Journal of
Commerce. It was really a miracle of iconic coincidence of the independence
of our mother India along with the dawn of the coveted Indian Journal of
Commerce in 1947.We on behalf of the editorial board of the Indian
Commerce Association(ICA) affectionately welcome you all at 68th All India
Commerce Conference being hosted by V.B. University, Hazaribagh from 6-8
November, 2015 and we gracefully congratulate the entire organizing team
for the great success in their endeavour .The world economic spectrum has
undergone under tremendous transformation in the last few years in different aspects. The world
economy is in progression of resurgence and in our country we have witnessed a historic as well as
political transformation followed by revolutionary steps in trade, commerce and industry. Visionary
thrust of Government of India on Make in India ,Swachh Bharat, Namami Gange, Digital India, Skill
Development, Minimum government with Maximum Governance have instilled new roles and
responsibilies for transforming the national scenario from slums to stardom. Famous Poet Bashir
Badr has aptly said, “Zameen maa bhi hai, mehboob bhi hai, beti bhi zameen, chhorke jaoun koi sawal
nahi.” ICA is our Zameen (mother land) for academic purposes and we have to contribute our best for
it.
Present All India Commerce Conference is dedicated to efficacious, substantial and significant topics
such as- (a) Make in India (b) Skill Development (c) Behavioural Finance (d)E-Retailing (e)Social
media and (f) Environmental Management. Make in India is an effective motivational program of the
Government of India to encourage industrial units to manufacture their products in our country.
Hon'ble Prime Minister Narendra Modi ji launched the Make in India program on 25th September,
2014 in a grand function at the Vigyan Bhawan, New Delhi. The Modern world demands skillful
workplace and keeping in to mind this, the Union Budget 2015-16 has made specific provisions for
skill development. Skill Development intends developing the people with the necessary skill sets to
add value for the organization and for their career development. Fostering an attitude of appreciation
for lifelong learning is the key to workplace success. Social Media provides varied and unique
platform that allow people to create, share or exchange information, ideas in virtual communities and
networks, very fastly .Social media can make magnificent contribution to the social good if we are
honest towards our endeavors and have no ulterior motives in discharging our duties.
According to Bhagwad Geeta,“Anasritah karmaphalam, karyamkarma karotiyah, sa samnyasi ca
yogi ca, na niragnir na cakriyah.”This implies that he who performs his bounden duty without
depending on the fruits of action, he is a Sannyasy and a Yogi, not he who is without fire and without
( 3 )

action. It is a matter of great pride for ICA India has succeeded in getting allotment of a piece of
institutional attractive land at Greater Noida ,measuring 1000 sq. meters and now in near future
ICA building will be in possible due to the active support of all the well-wishers of ICA family.
Along with Prof. M.M. Shah Memorial Award for Excellence in Commerce and Business
Management and BBAY awards, we have started from the 68th AICC, Saurabh Shiware
Memorial Young Researcher Award in the memory of the beloved son of our past president of
ICA Dr. T.A. Shiware.We hope our journal will prove to be a significant academic contribution of
international repute and the research papers published in the journal, which are the outcome of
brain storming of scholarly minds ,will provide ample opportunity for all of us to find solutions
of the problems and guidelines for the business world.
We would also like to extend our sincere thanks to the Past Presidents specially Prof. B.P.Singh,
Prof. P. Purushottam Rao, Prof. B. Ramesh, Prof. B.Taywade, President of ICA Prof. J.K.Parida,
Conference Secretary Prof. M.K. Singh, Office bearers, EC members and life members of ICA for
offering their cooperation's in ways more than one to improve the quality of the journal. You are
cordially invited to browse our new website www.ijoc.in as on the basis of it we have been
allotted e-ISSN NUMBER: 2454-6801 by NISCAIR. We conclude with saying that we do not have
life to be bitter, we only have to learn how to live to be better:
Jameer jinda rakh, Kabeer jinda rakh,Sultan bhi ban jaye, Dil mein fakeer zinda rakh.
(H.K. Singh)
( 4 )

( 5 )( 5 )( 5 )( 5 )( 5 )
CONCEPT OF SKILL DEVELOPMENT
One of the expected outcomes of education is skill development. Skills are often
understood in the limited meaning of technical skills like mechanical, communication,
and behavioural skills. What are usually ignored are the intellectual skills, personality
development skills and all other forms of skills needed for group working, team building
and other areas where the individual has to take the initiative to realize a goal.
Intellectual skills form part of learning in all subjects, especially in liberal arts subjects.
In undergraduate colleges, even in professional colleges, and task oriented technical
and vocational training institutions, the focus is currently on knowledge acquisition,
and not so much on practising and acquiring experience in skill development. The
same holds good for management courses such as Master of Business Administration,
Masters courses in Human Resource Management, Financial Management, and
Appraisal of Proposals.
Skill acquisition and developing expertise in putting the skills to use in specific
programmes or activities has to be given greater weightage through practice and exposure
to multiple situations. In each field of work or specialization, the list of skills for which
there is scope for employability as well as in promoting self employment enterprises
needs to be identified, and opportunities given to the students to practise them from a
Key words:
FDI, FDI Culture, Economic
Reforms, Global Investors,
FDI Requirements
Skill Development and Entrepreneurship for Microand Small Enterprises
Balla Appa Rao and D. Nagayya
ABSTRACT
Skill development and Entrepreneurship for gainful self employment is an important direction for the
youth of the country, by taking advantage of demographic dividend of the nation. The task is not one of
providing employment, but increasing the employability of the labour force in the country. Employability
is contingent upon knowledge and skills developed through quality education and training. National
Skill Development Policy was formulated in 2009. This has been revisited in 2015, and made far more
focused and comprehensive towards promoting self employment through productive activities. The
National Skill Development and Entrepreneurship Policy of May 2015 is an integrated approach involving
coordination with Ministries and organizations covering various sectors which are implementing either
skill development or entrepreneurship programmes. These are now made complementary through the
paradigm shift from modular to motivational skills for acquiring expertise, and promoting productive and
innovative ventures in various sectors. The focus is on Micro and Small Enterprises as one important
direction for this programme. Through a well orchestrated structure, coordinated action is being taken
by the Central and State organizations to create innovation driven entrepreneurs. A number of schemes
are in operation for skill development and entrepreneurship. The most recent one is Pradhan Mantri
Kaushal Vikas Yojana started on July 15, 2015. In the micro, small and medium enterprise sector, a
number of schemes are in operation for entrepreneurship development by providing skills and motivation
to set up an enterprise. The article brings out a few suggestions for coordinated action through various
Ministries to accelerate the pace of implementation of the programme.
The Indian Journal of CommerceVol.68, No. 4, October-December 2015

( 6 )( 6 )( 6 )( 6 )( 6 )
young age in different institutions in their respective fields
of specialization. As part of the curriculum, spending a
minimum of six months to a year as interns or apprentices
to gain confidence in practising the skills is very necessary
for the candidates. A radical upgradation is to be
encouraged in teaching-learning methods, with the
teacher-oriented system to be replaced by learning-
oriented system. Opportunities are to be given to the
candidates to present their creative ability in the learning
process. Value system has to be made an integral part of
education in a progressive society.
DEMOGRAPHIC DIVIDEND AND NSSO SURVEY
RESULTS
India has a great opportunity to take advantage of the
demographic dividend. It is one of the youngest nations in
the world with more than 62 per cent of the population in
the working age group (15-59 years), and more than 54 per
cent of the population below 25 years of age. The
population is expected to ‘bulge’ across 15-59 age group
over the next decade. It is further estimated that the average
age of the population in India by 2020 will be 29 years as
against 37 years in China and USA, 45 years in West
Europe, and 48 years in Japan. Consequently, while the
global economy is expected to witness a shortage of young
population of around 56 million (Report on Education, Skill
Development and Labour Force, 2013-14). In fact, in the next
20 years, the labour force in the industrialized world will
decline by 4%, while in India, it will increase by 32%. The
country has a big challenge ahead, as it is estimated that
only 2.3% of the total workforce in India has undergone
formal skill training as compared to 68% in UK, 75% in
Germany, 52% in USA, 80% in Japan, and 96% in South
Korea. There is no disputing the fact that the range is of
massive proportions. (Source: NSSO 66th Round 2009-10).
This poses a challenge and an opportunity. To reap this
demographic dividend which is expected to last for the
next 25 years, India needs to equip its workforce with
employable skills and knowledge so that youth can
participate productively to make India a developed country.
The poor skill levels among India’s workforce are
attributed t9o dearth of a formal vocational education
framework with wide variation in quality, high school
dropout rates, inadequate skills training capacity, negative
perception towards skilling, and lack of ‘industry ready’
skills even in professional courses.
The main issue to be addressed is not just providing
employment but simultaneously increasing the
employability of the labour force in India. Employability
is contingent upon knowledge and skill developed through
quality education and training. Thus, any solution to the
problem lies in a well orchestrated education and training
regime that sets out to meet those objectives. The problem
of employability levels owing to poor quality of education
is accentuated by the fact that fewer people opt for higher
education and also for self employment. (Economic Survey
2014-15, Volume 2, Government of India, Ministry of
Finance - 2015).
The National Sample Survey Office (NSSO), New Delhi
released data for 2011-12 from its 68 round on education
and vocational training towards the end of September 2015
(source: The Hindu, September 24, 2015), it is surprising to
note the finding that only one in ten adults reported having
received any vocational training, and the bulk of its was
informal training. The numbers show that among persons
in the 15-59 age group, about 2.2 per cent reported
vocational training. The non-formal variety mainly
comprised the passing down of hereditary skills, or on-
the-job training. Among rural males who received formal
vocational training, the most common field was ‘driving
and motor mechanic work’ while among urban males it
was ‘computer trade’. Among rural females ‘textile–related
work’ was the most common, while among urban females
it was ‘computer trades’. Moreover, the rate of vocational
training has barely increased between 2004-05 when the
data was last collected and 2011-12. This was despite the
fact that the UPA government announced an ambitious
National Skill Policy in 2009, and created a National Skill
Development Coordination Board earlier. There is a lot of
corporate support for this mission. In July 2015, the NDA
government launched the Rs.1,500 crore Skill India
campaign, which aims to train 50 crore people by 2022.
Among those aged 15 and above, the NSS data shows,
only 2.4 per cent had technical degrees, diplomas or
certificates in fields like medicine, engineering or
agriculture. The proportion was 1.1 per cent in rural areas,
and 5.5 per cent in urban areas. Just over 60 per cent of
those aged 5-29 years were currently attending an
educational institution. To supplement household income
was the main reason for more than 70 per cent of males
currently not being enrolled in any educational institution,
while more than half of females not studying said they
had to attend to domestic chores.
Skill Development and Entrepreneurship for Micro and Small Enterprises

( 7 )( 7 )( 7 )( 7 )( 7 )
PARADIGM SHIFT FROM MODULAR TO
MOTIVATIONAL SKILLS FOR ENTREPRENEURSHIP
These is need for a paradigm shift from modular to
motivational training and support services for skilling and
entrepreneurship programmes. Earlier the main objective
of the scheme of Modular Employable Skills under Skill
Development Initiative Scheme (SDS) was to provide
employable skills to school leavers, existing workers, ITI
graduates, etc. Priority was given to those above the age of
14 years who have been or withdrawn as child labour to
enable them to learn employable skills in order to get
gainful employment. The focus was on modular skills as
the purpose was to meet the demand for specific skills of a
high order, under a public-private partnership initiative.
Motivational skills on the other hand, are embedded in
attitudes and perspectives of the individual. The sources
of motivation can be internal or external. One can feel
motivated internally when there is a burning desire to
achieve or what is referred to as achievement motivation.
This is the kingpin of entrepreneurship. External
motivation comes from external factors. Motivational skills
are those that enable a person to become motivated and
work towards achieving goals. Entrepreneurship and Skill
Development programmes of varying duration have been
conducted over years under the programmes of the Ministry
of Micro, Small and Medium Enterprises (MSMEs),
Department of Science and Technology (DST), and
Ministry of Food processing for entrepreneurship
development among youth of various backgrounds.
Inclusiveness has been an important objective. In the
present day environment, lot more effort is needed to
coordinate the work of various ministries, and intensify
the task under the National Policy of Skill Development
and Entrepreneurship 2015 of the Ministry of Skill
Development and Entrepreneurship.
VISION AND THRUST AREAS OF THE 2015 POLICY
The Vision of the National Policy for Skill Development
and Entrepreneurship 2015 is “to create an ecosystem of
empowerment by skilling on a large scale at speed with
high standards and to promote a culture of innovation
based entrepreneurship which can generate wealth and
employment so as to ensure Sustainable livelihoods for all
citizens in the country”.
To achieve the Vision, the Policy has four thrust areas. It
addresses key obstacles to skilling, including low
aspirational value, lack of integration with formal
education, lack of focus on outcomes, low quality of training
infrastructure and trainers, etc. Further, the Policy seeks to
align supply and demand for skills by bridging existing
skill gaps, promoting industry engagement,
operationalising a quality assurance framework, leverage
technology, and promoting greater opportunities for
apprenticeship training. Equity is also a focus of the Policy,
which targets skilling opportunities for socially/
geographically marginalized and disadvantaged groups.
Skill development and entrepreneurship programmes for
women are a specific focus of the Policy. In the
entrepreneurship domain, the Policy seeks to educate and
equip potential entrepreneurs, both within and outside
the formal education system. It also seeks to connect
entrepreneurs to mentors, incubators and credit markets,
foster innovation and entrepreneurial culture, improve ease
of doing business and promote a focus on social
entrepreneurship. (National Policy on Skill Development and
Entrepreneurship 2015).
The country presently faces a dual challenge of severe
paucity of highly-trained, quality labor, as well as non-
employability of large sections of the educated workforce
that possess little or no job skills. Ministry for Skill
Development and Entrepreneurship (earlier Department
of Skill Development and Entrepreneurship created in July
2014) has been set up in November 2014 to give fresh
impetus to the Skill India agenda and impart employable
skills to its growing workforce over the next few decades.
Apart from meeting its own demand, India has the potential
to provide skilled workforce to fill the expected shortfall in
the ageing developed world.
Skill development, however, cannot be viewed in isolation.
Skills are fundamental to, but not sufficient for, gaining
decent jobs. Improved productivity through skill
development must be complemented by economic growth
and employment opportunities. Skills need to be an
integral part of employment and economic growth
strategies. Coordination with other national
macroeconomic policies and strategies is, therefore critical.
National Skill Development and Entrepreneurship Policy
of 2015 supersedes the policy of 2009. The objective of this
policy is to meet the challenge of skilling at scale with
speed, standard (quality) and sustainability. It aims to
provide an umbrella framework to all skilling activities
being carried out within the country, to align them to
common standards and link skilling with demand centres.
Balla Appa Rao and D. Nagayya

( 8 )( 8 )( 8 )( 8 )( 8 )
In addition to laying down the objectives and expected
outcomes, the policy also identifies the various
institutional frameworks which will be the vehicles to reach
the expected outcomes. Skills development is the shared
responsibility of government, employers and individual
workers, with NGOs, community based organizations,
private training organizations, and other stakeholders
playing a critical role. The policy links skills development
to improved employability and productivity to pave the
way forward for inclusive growth in the country. The skill
strategy is complemented by specific efforts for promoting
Entrepreneurship to create enough opportunities for the
skilled workforce.
The establishment of the National Skills Development
Corporation (NSDC) in 2009 to promote private sector
participation via short duration courses has tied up with
more than 187 training providers, many of whom have
started scaling up their operations. They also supported
and incubated 31 Sector Skills Councils (SSCs) that is
intended to facilitate the much needed participation and
ownership of the industry to ensure needs-based training
programmes. The National Skills Development Agency
(NSDA) is working with the State governments to
rejuvenate and synergise skilling efforts in the State. The
National Skills Qualification Framework (NSQF) has been
anchored at NSDA, and efforts have been initiated to align
all skilling and education outcomes with the competency
based NSQF levels. These efforts build on the legacy of
vocational training infrastructure: close to 12,000 Industrial
Training Institutes and 3,200 polytechnics.
SKILL DEVELOPMENT MISSION
Skill development on a massive scale as a high priority
area was recognized in 2008 with the setting up of a Skill
Development Mission, with a three-tier structure: (1) Prime
Minister’s National Council on Skill Development (NCSD),
(ii) National Skill Development Coordination Board
(NSDCB), (iii) National Skill Development Corporation
(NSDC) established in the Public-Private-Partnership
(PPP) mode in October 2009. The National Council outlined
the core operating principles which, inter alia, advocate
the need for co-created solutions for skill development
based on partnerships between state, civil society and
community leaders. Equitable access to training or
inclusiveness for all youth of India is another benchmark
initiative of the Mission. The National Action Plan for Skill
Development aims at an ambitious goal of developing 500
million skilled and trained technicians in the country by
2022. Entrepreneurship and Skill Development
Programmes (ESDPs) organized by the Union Ministry of
MSME focus on developing entrepreneurial talent and trade
skills for promoting an enterprise. A few other Ministries
and a wide range of training institutions pursue a similar
direction focusing on self employment, along with
acquisition of skills. RUDSETIs (Rural Development and
Self Employment Training Institutes) and Rural
Development Institutes promoted by banks and non-
governmental organizations (NGOs) are popular
particularly for imparting skills in the non-farm sector.
At the state level, a few states have established a Skill
Development Corporation. These include Andhra Pradesh
and Rajasthan. Andhra Pradesh has also set up 17 skill
development centres in 13 districts from 2015 under the
supervision of the State Skill Development Corporation.
Leading Information Technology (IT) companies and major
industrial houses are extending support to this programme
in a number of ways, including sponsoring the Centre
itself. Incubation Centres are also being promoted by the
joint efforts of the State and industrial houses. Finding it
difficult in motivating people to opt for training
programmes in various skills imparted by the Andhra
Pradesh State Skill Development Corporation (APSSDC)
to the capital region of Andhra Pradesh, officials of the
Corporation have decided to set up counseling centres in
the 29 villages that constitute the Capital Region
Development Authority (CRDA). Capital Region cuts
across Guntur and Krishna districts.
The Corporation is planning to start counseling centres in
these villages at suitable locations. There are also plans to
establish Gram Tarang Employability Training Services.
To begin with, they want to start at least six such centres
through which the Corporation will impart training in
skills such as sewing, jute bag manufacturing, and
terracotta jewellery. Besides skilling through training, the
effort is also to help people find market for their products.
They also plan to implement Digital India drive in these
villages. They want to focus on training college students
who in turn will share their knowledge and expertise with
the villagers.
Gram Tarang is a social entrepreneurship initiative in skill
training working in largely an underdeveloped region,
and committed towards providing youth with employable
skills. The expected impact from Gram Tarang is to drive
self sufficiency and inclusive economic participation in
Skill Development and Entrepreneurship for Micro and Small Enterprises
( 9 )( 9 )( 9 )( 9 )( 9 )
local communities by ensuring sustainable employment
with an additional focus on empowering women and
marginalized classes, enduring development of local
solutions through micro entrepreneurship. To have a
strong domestic and international presence in training
and skill building, the Corporation has an annual target
to train one lakh people in the State with emphasis on the
poor and marginalized sections of society across the
disadvantaged areas in particular. Training centres are
planned to be set up in various districts in close
consultation with the concerned departments and
organizations of the State and the Centre. (Source: The
Hindu, Vijayawada edition, October 1, 2015).
Among innovative courses introduced recently, mention
may be made of Suryamitra Diploma programme of 3
months duration, organised by the College of Engineering
and Technology of Acharya Nagarjuna University (ANU),
Guntur. The focus is on equipping the students and any
others interested in acquiring skills in installation,
commissioning, sales and service of renewable energy
devices. Candidates with electrical or mechanical
engineering or those with ITI certificate or polytechnic
background are eligible for participation in this
programme. The devices for which training is being
imparted include solar water heater, solar lights, solar
pumps, etc. The programme is funded by National Institute
of Solar Energy and the Union Ministry of Renewable
Energy Resources.
ON-GOING SCHEMES
Under Prime Minister ’s Employment Generation
Programme (PMEGP) launched in 2008, the investment
level (project cost excluding land) for self employment
ventures in industry can go up to Rs.25 lakh, and for
services and businesses up to Rs.10 lakh. The thrust of the
programme is on rural areas and weaker sections
including women. Promoter’s contribution envisaged is
10 per cent in the general category, and 5 per cent in the
special category. Promoting Entrepreneurship
Development Centres (EDCs) through partner institutions
in the Public-Private Partnership (PPP) mode is another
scheme in operation from 2008.
A recent scheme introduced by the Ministry of MSME has
a number of components to help the candidates pursuing
self employment ventures after receiving adequate training
and skill acquisition. ASPIRE is the abbreviation of the
scheme for promotion of Innovation, Entrepreneurship,
and Agro-industry, launched on 18th March 2015. ASPIRE
has the objectives of creating new jobs to reduce
unemployment, promoting entrepreneurship culture
across regions in the country, achieving rural
industrialization in less developed regions as well, and
promoting innovative business solutions, and
strengthening the competitiveness of enterprises. The
scheme provides a framework for promotion of start-up
enterprises in agro and rural industries through forward
and backward linkages. Setting up of business incubators
and technology business centres, and guiding
entrepreneurs from selection of project ideas to the
implementation of the project are all covered at different
stages under this scheme. (www.msme.org)
Pradhan Mantri Kaushal Vikas Yojana (PMKVY)
The scheme was launched on 15th July 2015. The day is
celebrated as National Skills day. The National Skill
Development Corporation (NSDC) is implementing the
scheme with an outlay of Rs.1500 crore for imparting Skill
Training to youth for 24 lakh persons in a year. The scheme
endeavours to encourage acquisition and upgradation of
employable skills among the youth through monetary
rewards, to enhance the productivity of existing work force
and align the training and certification to the needs of
different sectors, and also to become skill provider to
developed and other developing countries. It is streamlined
to ensure standardization of certification. It is
implemented through public - private and public - public
partnerships.
A few special features of the scheme are as follows:
provision of training and certification under Recognition
of Prior Learning (RPL), which will be specifically oriented
for developing skills in specific growth sectors; training
conforming to National Occupational Standards (NOS)
and Qualification Packs (QPs) for specific job roles
formulated by industry – driven bodies – Sector Skills
Councils (SSCs); training targets to be based on skill gap
studies; creating a registry of skills to keep track of available
skill mass, and target to be aligned to demand from various
Central Government’s flagship programmes. Camp-based
approach through Kaushal Melas to be held at the district
level and organizing skill yatras through demonstration
of skills supplemented by communication packages
utilizing mass media and social media are the other
features for pursuing the programme at village, mandal
and district level.
Balla Appa Rao and D. Nagayya
( 10 )( 10 )( 10 )( 10 )( 10 )
Mudra Bank
MUDRA Bank – Micro Units Development Refinance
Agency Bank – has been set up as a subsidiary of Small
Industries Development Bank of India. It will be organized
in due course through a statutory enactment of the Pradhan
Mantri MUDRA Yojana (PMMY). The Bank has been
created with a corpus of Rs.20,000 crore, and a credit
guarantee fund of Rs.3,000 crore. The Bank has already
joined hands with 19 State and Regional level coordinators
so as to reach the self employment seekers in the interior
hamlets, facing the ordeal of limited branch presence. The
focus is on banking the unbanked and funding the
unfunded. These include activities and persons in the
unorganized sector such as vegetable vendors, hawkers,
wayside mechanics, and others with skill and
determination, but hardly any resources for organizing
the business.
The Bank will support activities through self help groups
and micro financial institutions, setting benchmarks for
best practices of lending and technology support. Credit
guarantee scheme is also in operation. Three products are
offered at present and more will be evolved in due course
for self employed persons – Shishu for loans up to Rs.
50,000 for start-ups; Kishor – with above Rs.50,000 and
up to Rs.5 lakh for mid-stage needs; Tarun – with above
Rs.5 lakh and up to Rs.10 lakh for growth seekers –
MUDRA card and credit enhancement are on the anvil for
inclusion later. The Bank is visualized as a boon to small
business enthusiasts particularly in rural and interior
parts of the country.
Box 1: Flexible Vocational Training Approach for
Career Development – the Case of an Australian
Institution
M/s. Australian Vocational Training and Employment
Group Pvt. Ltd. (AVTEG), Australia, promotes and
supports sustainable skill development as a strategic tool
for organic growth with competency skill development
programmes designed for specific sectors. They impart cost
effective, advanced learning experience through various
types of skill development initiatives. In India, they have
assisted several organizations by designing skill
development programmes which help to eliminate training
waste, bring training in line with the expectations of local
employers and industry associations, and resolve skilled
workforce shortage problems. AVTEG, being the partner
of Australian Universities, promoting Australian
Education Framework (AEF) having 10 levels, links
vocational and University education qualifications into
one national system. The Vocational skill programmes
encourage lifelong learning, and assist students to plan
their career and learning at whatever stage they are within
their lives and wherever they live; allows students to start
at the level that suits them, and then build up their
qualification as per their needs to develop & change over
time by allowing multiple entry & exit points at each level
of qualification (certificate courses, diploma courses, PG
diploma courses, PG courses, etc); offer recognition of prior
skills & learning to provide qualifications in a flexible and
supportive environment of training, strong labour market
outcomes, enterprise performance, etc. (Source: ni-msme
Bulletin, National Institute of Micro, Small and Medium
Enterprises, Hyderabad, October 2014)
Box 2: Illustrative List of Occupations for which Skill
Training is being Organized in Andhra Pradesh
Duration of Training: 2 to 6 weeks. Post-training support:
Handholding for self employment & placement as interns
is also pursued for select candidates who express keenness
to pursue the trade. Making available loan under various
programmes from institutional sources is also attempted
based on the project profile submitted by the candidate.
Business advisory services are available from training
institutions, consultancy and advisory services
organizations. In Computer applications and other areas,
there are programmes of shorter as well as longer duration
of one to two years. Advanced certificate course in
computer applications (ACCA) of six months duration,
and PG Diploma in Computer Applications (PGDCA) of
one year duration are offered by a number of specialized
computer institutions.
I. Information Technology (IT) Trades
Digital photography & Videography
Multi-media & animation
Web designing
Internet browsing
Desk Top Publishing (DTP) & Receptionist
SQL Server Data Base Administration
2-D/3-D Animation
CAD with Pro E
CAD/CAM with pro engineers
Hardware & Networking
Printed circuit boards
Skill Development and Entrepreneurship for Micro and Small Enterprises

( 11 )( 11 )( 11 )( 11 )( 11 )
MS Office
Advanced Java
C, C++, and OOPS
Computer accounting with talley
Leather products
Wireman training
Electronic mechanic
Medical transcription
MCP – CCNA
MS centred software Engineering
Linux Administration
II. Other Trades
Designing & making of Artificial Jewellery
UPS inverter repairing
Mobile repairs
2 wheeler maintenance & repairs
Motor winding & pumpset repairs
Electronic gadgets repairs
Food processing
Catering Technology
Dairy based products
Dealership in solar powered equipment
Tea powder packing unit
Mushroom cultivation
Interior design & decoration
Fashion designing
Cosmotology & beautician
Construction workers – electrician,
Mason, painter, decorator
SUGGESTIONS
A few suggestions are offered here to strengthen the skilling
drive as practised by a few Union ministries with focus on
self employment, and in a limited way wage employment.
1. The Ministry of MSME has taken the initiative to
standardize the curricula of skill development
programmes conducted by different institutions
under its purview. The programmes may be
harmonized to enable youth to participate in one
programme relevant to his immediate needs, and
subsequently pursue more advanced programmes
at the same or other institutions in the country.
Linkage of skill development programmes with the
proposed National Vocational Education
Qualification Framework (NVEQF) is planned to
provide certification for these programmes.
Accreditation of programmes from a national body
will benefit the candidates immensely, apart from
improving the standards of instruction and teaching
– learning methodologies followed by various
institutions.
2. The training capacity of the existing training
institutions needs to be augmented, and training
infrastructure also needs to be multiplied to cope
up with the demands of the Skill Development
Mission in various trades. Faculty development
programmes or trainers’ training programmes of a
repetitive nature need to be organized to orient the
faculty with innovative, and modern methods using
Information and Communication Technology (ICT)
tools, with internet, repositories of e-lessons, etc. ICT
can also be used for project work, and case studies,
creating new models in diverse subjects.
3. Ensuring high quality of the programmes conducted
is of utmost importance. Training curricula need to
be standardized for different courses in consultation
with the industry associations and leading
industrial houses. Faculty development
programmes will facilitate upgradation and
reorientation of the course content. Handholding of
trained entrepreneurs for setting up enterprises
through the provisions of Rajiv Gandhi Udyami
Mitra Yojana (RGUMY) with the support of various
implementing agencies will ensure higher success
rate of start-up enterprises.
4. Choice-based credit system in academic institutions
will facilitate youth to identity subjects of interest
and relevance to them apart from the core areas
covered in the course. These can be pursued in the
same institution or in any other nearby institutions.
Providing opportunities for learning and practising
skills in as many diversified areas as possible over
years during the academic career will equip the
youth to be transformed into well rounded
personalities.
CONCLUSION
Skill Development and Entrepreneurship for enterprise
promotion in various sectors by training the youth in
modular and motivational skills is the desirable direction
for developing employable skills among the youth.
Personality development skills should form part of the
Balla Appa Rao and D. Nagayya

( 12 )( 12 )( 12 )( 12 )( 12 )
training programmes. The National Policy for Skill
Development and Entrepreneurship 2015 offers an
integrated approach. This strengthens the role of training
and motivational programmes already in operation, and
creation of many more programmes and institutions to be
developed for undertaking the challenging task. Only 2.3%
of the total workforce in the country has undergone formal
skill training in India. As per the NSSO 68th round for the
reference year 2011-12, only 2.2 per cent of persons reported
having received formal vocational training, and 8.6 per
cent reported having received non-formal vocational
training, largely through acquiring hereditary skills or on-
the-job training. Illustrative list of trades is given for
organizing skill-cum-entrepreneurship programmes. The
youth are advised to take advantage of the wide variety of
schemes of short and long duration which are in operation
at the grass roots level. Institutional infrastructure needs
to be considerably strengthened; faculty development
programmes are to be organised; and certification and
standardization are to be introduced in each of the sectors.
Choice-based credit system can give enough motivation to
learn and practise a few skills of the candidate’s choice.
Skill India mission looks ahead for 2020 and beyond to
develop employable youth with necessary knowledge and
skills of benefit to India, and other developed and
developing countries.
REFERENCES
India. Ministry of Micro, Small and Medium Enterprises
(MSMEs) (2012). Report of the working group on
MSMEs growth for the 12th Five Year Plan (2012-17) –
Report of the sub-group on Skill Development and
Training (Chairman of the working group: R.K.
Mathur), New Delhi.
India. Ministry of Skill Development and Entrepreneurship
(May 2015). Draft National Policy for Skill Development
and Entrepreneurship 2015, New Delhi.
Institute of Small Enterprises and Development (ISED)
(2014 and 2015). India Micro, Small and Medium
Enterprises Reports 2014 and 2015, ISED, Kochi
(Kerala).
Yojana (2014). Special Issue on Technology, Innovation,
and Knowledge Economy, November 2014, Vol.58
no.11.
Yojana (2015). Special Issue on Skill India Initiative, October
2015, Vol.59 no.10.
Prof. Balla Appa Rao
UGC Emeritus Professor
Ex-Dean and Head
Dept. of Commerce and Management Studies
Andhra University, Visakhapatnam–03 (Andhra Pradesh)
E-mail: [email protected]
Prof. D. Nagayya
Consultant on Small and Medium Enterprises
Guntur; and Former Director (Industrial Development),
National Institute for Micro, Small and Medium
Enterprises (NI-MSME), Hyderabad.
E-Mail: [email protected]
Skill Development and Entrepreneurship for Micro and Small Enterprises

( 13 )( 13 )( 13 )( 13 )( 13 )
INTRODUCTION
Attrition is a separation of employees from an organization, due to resignation, retirement
etc. The organization has no direct role to pay in natural attrition. Attrition may also be
defined as the loss of workforce due to unavoidable circumstances. It refers to” the rate
of change in working staff members of a firm during a definite period” People now look
for job changes. Organizational commitments are at reduced levels these days. So, labour
leave one organization and join another. The rate of turnover, if higher, it indicates
growing dissatisfaction among people of the organization. Attrition may also mean the
instability of employment. Refers to” the rate of change in working staff members of a
firm during a definite period” People now look for job changes. Organizational
commitments are at reduced levels these days. So, labour leave one organization and
join another. The rate of turnover, if higher, it indicates growing dissatisfaction among
people of the organization. Attrition may also mean the instability of employment.
Refers to” the rate of change in working staff members of a firm during a definite period”
People now look for job changes. Organizational commitments are at reduced levels
these days. So, labour leave one organization and join another. The rate of turnover, if
higher, it indicates growing dissatisfaction among people of the organization. Attrition
may also mean the instability of employment.
Attrition is not a new problem and it is has existed earlier and will continue to exist in
any industry. However, there is a limit for everything .It is not easy to find out as to who
contributes and who has the control on the attrition of employees. Various studies/
survey conducted indicates that everyone is contributing to the prevailing attrition. It
does not happen for one or two reasons .The specific reasons for attrition are varied in
nature and it is interesting to know why the people changes job so quickly. Even today,
the main reason for changing job is for higher salary and better benefits. At the same
time the attrition cannot be attributed to employees alone.
Key words:
Attrition, India Tourism
Development Corporation,
Pondicherry Transport
Tourism Development
Corporation, Employees,
Hotel Industry
Attrition of the Employees in Hotel Industry–A Comparative Analysis
R.Ramachandran
ABSTRACT
The present study aims to find out the assessing attrition among the employees in hotel industry – a
comparative analysis. Primary data were collected by conducting direct interview using questionnaire.
All the respondents were asked the same questions in the same fashion and they were informed the
purpose of study. The tool of data collection to be used in this study is thro’ structured questionnaire
method; the necessary data is to be collected from 205 samples to be selected randomly in Puducherry
region from August to October 2013. The data will be selected as samples and the data so collected will
be analyzed using the appropriate statistical tools. The secondary data can be collected from the journals,
pamphlets and the concerned websites. For this study the samples were drawn using random sample
method. The data collected through questionnaires have been tabulated and analyzed. Result proves that
respondents differ in their assessing attrition among the employees in hotel industry.
The Indian Journal of CommerceVol.68, No. 4, October-December 2015

( 14 )( 14 )( 14 )( 14 )( 14 )
IDENTIFYING THE CAUSES OF ATTRITION
The tightening labour market for skilled employees and
further growth in the economy is starting to be seen in a
growing level of attrition in organizations. The result will
be increased costs associated with replacing employees
and a negative impact on profitability for those companies
that lose their top talent. The implications for companies
is clear, there will need to be greater focus on attracting
and retaining high quality employees.
Although the increase in available job options provides
employees with alternate employment options it is not the
key driver of why employees quit – it provides the
opportunity to do so without threatening income. This
paper looks at some of the identified causes of turnover in
organizations. Its purpose is to indicate to HR
professionals what may be driving turnover in their own
organizations. However, to be of relevance HR
professionals must identify the causes of turnover in their
own companies.
Some of the major factors affecting attrition include:
• Employee Demographics – how attributes such as
age and years of service can be a determinant of
someone’s likelihood of quitting.
• Organizational Commitment – where employees
that feel more connected to their company are less
likely to quit
• Job Satisfaction – the level of job dissatisfaction is
viewed as a major determinant of an employee’s
intention to quit.
• Promotional Opportunity – internal labour markets
are vital if employees are to believe that they have a
future with their organization.
• Job Motivation – the more important that work is to
a person the less likely that they will look elsewhere
for employment.
• Supervisor Support – employees with a greater level
of supervisor support are more likely to have greater
levels of job satisfaction and are less likely to quit.
• Procedural and Distributive Justice – the HR
processes that exist in a company are a critical
determinant of a persons perception of fairness and
equity. If these are low an employee is far more likely
to leave a company.
Some of these factors can be influenced directly through
HR policies and procedures – such as the development of
internal labour markets, management training for
supervisors and ensuring that processes are fair and
transparent – whilst others require a little more imagination
such as implementing strategies to retain employees at the
5 year hump as an example.
HR STRATEGY AND ATTRITION
One of the fundamental shifts in work culture has been
the demise of the old style ‘implied’ labour contract.
Employee commitment to the organization was not
founded upon a promise of stability of employment,
predictable career paths and incremental salary gains
which are no longer a reality nor are they feasible in today’s
business environment. This style of contract was viewed
as a problem and abandoned during a period of labour
surplus. However, in an environment where a shortage of
skills exists the challenge for HR will be to replace the old
style contract with a new implied contract which will
encourage the organizations ‘value creators’ to be
committed and remain with their organization.
The integration of human resource management into the
business strategy requires an understanding of the causes
and implications of high attrition rates. Many companies
rely on an ‘industrial model’ of service delivery. They have
organized work so as to tolerate low skills and short
employment tenures and concentrate on cutting costs rather
than adding value and failing to compete on quality”. This
low investment in human resources has helped generate
cost savings but has also resulted in high employee
turnover. In managing the attrition rate an organization to
optimal levels the business strategy and the accompanying
costs and benefits associated with attrition should be
accounted for. The plethora of research into the issue of
attrition is indicative of both the significance and the
complexity of the problem. Most studies have, however,
inadequately examined multi-factor explanations, and
have failed to consider turnover process complexities. The
purpose of this study is to develop an understanding of
the causes of turnover that may exist within an
organization.
The analysis presented here provides some practical
implications in terms of influences on turnover rates.
Attrition of the Employees in Hotel Industry–A Comparative Analysis

( 15 )( 15 )( 15 )( 15 )( 15 )
Traditionally, attrition has been viewed as an individual-
level behaviour explained by individual-level attitudes and
characteristics. However, as strategic human resource
planning grows in importance, organizational turnover
becomes a salient issue for intervention. Although, the
formulation and implementation of human resource
management policy cannot take place without
understanding the causes of an individual’s decision to
quit, the effectiveness of such policy may be enhanced by
understanding the structural content in which individual
turnover decisions are made, as well as the implications
of that decision on the business.
RELATED REVIEW OF PREVIOUS STUDIES
The study needs to understand the gap on research and
hence the following previous studies are gone: Nina
Varghese (2009) on his survey for Federation of Hotels
and Restaurants Association of India (FHRAI) has said
that the hotel industry is facing a manpower crunch
especially at the entry and junior management levels. More
than half of the students, who pass out from catering
institutes, are not interested in getting into the hospitality
industry. He says that about 10,000 catering graduates
come into the job market. Industry sources said that though
there is no official numbers available, these numbers would
have now gone up to about 15,000. These students are
opting for jobs on cruise liners, airlines, which offer
attractive remuneration. Both these industries have the
added incentives of glamour and travel. Lately, call centers
and business process outsourcing centers have also
become an option.
Maritz Hospitality Research Group (2009) on their survey
Surveying more than 1,700 meeting planners, for “2003
Meeting Planners: Choice, Experience, Loyalty Study”
found that establishing a perception of collaborative
partnership between the hotel and the planner throughout
the various phases of the meeting planning process was
crucial to securing future business. Additionally, being
responsive to the planner’s needs and doing simple things
like expressing appreciation for business during the post-
event phase were strongly linked to meeting planner
loyalty. More research showed that a significant
percentage of meetings do not go exactly as planned. The
quality of service a planner received both before and after
a problem occurred was a major factor in recovering from
these types of challenges. When problems occurred, 40
percent of those surveyed were less likely to return and 63
percent were less likely to recommend the property to other
planners. The study showed that even when problems
were fixed, planners often remained dissatisfied. Maritz
interviewed meeting planners in July and August 2003.
They were asked a series of questions about how they
choose a hotel, their experience while at the hotel and the
factors that influence their loyalty to a particular hotel or
brand.
David Radcliffe (2010), the former president of the Greater
Phoenix Convention & Visitors Bureau who heads Project
Attrition suggests packaging guestrooms with meeting
registration and local ground transportation. Incentives
that are offered through hotels and convention bureaus,
such as free or discounted hotel services and amenities,
along with discounts in a destination’s shops, restaurants,
and attractions, also can help bring attendees back into
official room blocks.
“Policies that limit the ability and motivation of attendees
to shop for rooms can help planners negotiate better
attrition clauses in their hotel contracts and thereby reduce
exposure to attrition liability,” said Radcliffe. If planners
hope to improve their block pick-up, they also must place
more financial responsibility for room reservations on
attendees and exhibitors, “A hotel room is generally the
only thing an attendee doesn’t pay for in advance,” he
said, pointing out that groups usually charge attendees
fees to cancel meeting registrations, and airlines charge
passengers fees for changing or canceling flights.
Educating attendees about other benefits block rooms pay
for — such as meeting space and shuttle service — and the
potential attrition liabilities groups face also can improve
block pick-up if combined with incentives, “In some cases,
an explanation is enough to recapture a sizable number of
attendees who were booking around the block,” he said.
“That and other policies seem to be working for some
groups. “In addition to incentives and education for
attendees, Radcliffe said, “The other big issue is just
educating planners to have a close understanding of their
own attendees.”In a half dozen presentations to meeting
planners in the past few months, Radcliffe found few
planners with a solid grip on attendee booking patterns.
“When I asked how many planners faced some attrition-
related problem, close to 100 percent raised their hands,”
he said. “But when I asked how many knew how many of
their attendees booked outside the block, only about 10
percent raised their hands. “The more planners know about
what motivates attendees, the better positioned they’ll be
R.Ramachandran

( 16 )( 16 )( 16 )( 16 )( 16 )
to negotiate good hotel contracts.” Some hotels have
produced and distributed online promotional pieces for
groups, he said, and a handful of hotels create event
websites with registration and room reservations
capabilities. Hotel service and sales staffs are conferring
more frequently with meeting planners about ways to
promote meetings attendance and induce attendees to book
inside room blocks. In addition, convention bureaus are
helping groups that hold city-wide meetings with
marketing materials and are putting together packages of
discounts on local attractions for attendees who book
inside official blocks. “I am optimistic that meeting
planners can reduce attrition liability with the help of
hotels and convention bureaus,” said Radcliffe.
E. Balaji, Executive Director (Staffing Solutions), Ma Foi
Management Consultants (2010) said the hospitality
industry had traditionally found cost effective talent by
grooming entry level intake over the years. He said that
when the industry grows in a scorching pace, it would
find itself in a difficult position to attract cost effective
talent. Hotel management graduates who gain two to three
years experience are also sought after for their people
managing skills. K.C. Tharyan, Executive Director,
Residency Group of Hotels (2011), said according to
information available on the Net, an assistant
housekeeping manager with two to three years experience
on the Cunard lines makes about $1,900 (Rs 82,650) a
month. An assistant purser front desk receptionist for the
same liner, with some experience, will get about $1,650
(Rs 71,775). Recently, Indian Airlines was hiring cabin
crew and the minimum salary offered was Rs 22,000,
including the flying allowance and other benefits such as
gratuity and provident fund.
M.O. Koshy, Vice-President of the Chennai-based GRT
Grand (2011), said that the average starting salary in the
hotel industry would be around Rs 6,000 a month for a
hotel management trainee. The entry level at a call centre
would range from Rs 6,000 to Rs 8,000. But faster
upgrades and promotions in the information technology-
enabled services industry make the difference. In just a
year or two, some of those working in the call centers could
become supervisors and earn over Rs 20,000 per month.
But such quick promotions and salary increases are
unheard off in the old economy jobs, according to industry
sources. They said that some years ago, hotel jobs were
associated with glamour. But now, it’s the money that
matters. Another problem in most of the major metros is
that a large number of hotel rooms are coming into the
market, so the need for trained staff has increased.
Manish Joyal (March, 2012, Caterer and Hotelkeeper),
Human Resource Manager, Chola Sheraton, Chennai
comments, “There are certain modules, which are in place
as far as training but it may not necessarily be to identify
leadership qualities in people. It is a part of the entire
process where we look at the standards of performance by
a team member, analyses his quality, his performance and
then decide on his ability as a leader. While leadership per
se is a vast subject, qualities like assertiveness, self-control,
confidence etc, are the factors which are noted to take a
decision. We conduct tests to get the best out of a member
apart from using technology to judge their capability.”
Vishnuvardhan Bhat (September, 2012, Caterer and
Hotelkeeper), a hospitality consultant, reveals, “In a sense,
great leaders have to be ambidextrous. On one hand, they
have to be able to execute capably within the current
business paradigm, ‘the way we do business.’ On the other
hand, they must be able to reflect on the current paradigm,
find ways to fundamentally improve it, and manage the
large-scale change to a successful conclusion. You need
two hands, and a lot of commitment, to change the
propeller on the airplane in mid-flight, but that capability
is the essence of successful leadership.”Thus, the present
concentrates on attrition of employees’ in hotel industry
with comparative study.
MATERIALS AND METHODS
Research design is purely and simply the framework or
plan for a study that guides the collection and analysis of
the data. The research design indicates the methods of
research i.e. the method of gathering information and the
method of sampling. Primary data were collected by
conducting direct structured interview using questionnaire.
All the respondents were asked the same questions in the
same fashion and they were informed the purpose of study.
OBJECTIVES OF THE STUDY
1. To assess attrition among the employees in hotel
industry – and comparative analysis on government
and private organization.
2. To understand perception and expectation of
employees with regard to the HRD and other related
HR activities.
Attrition of the Employees in Hotel Industry–A Comparative Analysis
( 17 )( 17 )( 17 )( 17 )( 17 )
3. To evaluate the reasons for attrition to the
organization.
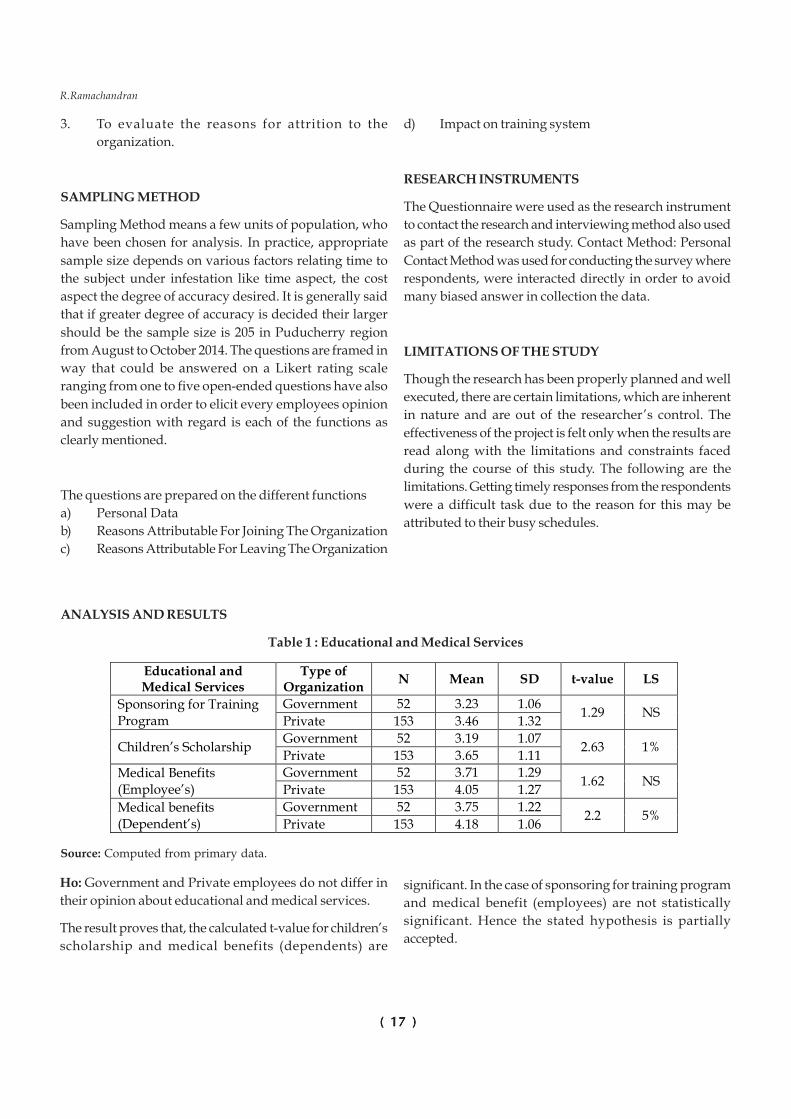
SAMPLING METHOD
Sampling Method means a few units of population, who
have been chosen for analysis. In practice, appropriate
sample size depends on various factors relating time to
the subject under infestation like time aspect, the cost
aspect the degree of accuracy desired. It is generally said
that if greater degree of accuracy is decided their larger
should be the sample size is 205 in Puducherry region
from August to October 2014. The questions are framed in
way that could be answered on a Likert rating scale
ranging from one to five open-ended questions have also
been included in order to elicit every employees opinion
and suggestion with regard is each of the functions as
clearly mentioned.
The questions are prepared on the different functions
a) Personal Data
b) Reasons Attributable For Joining The Organization
c) Reasons Attributable For Leaving The Organization
d) Impact on training system
RESEARCH INSTRUMENTS
The Questionnaire were used as the research instrument
to contact the research and interviewing method also used
as part of the research study. Contact Method: Personal
Contact Method was used for conducting the survey where
respondents, were interacted directly in order to avoid
many biased answer in collection the data.
LIMITATIONS OF THE STUDY
Though the research has been properly planned and well
executed, there are certain limitations, which are inherent
in nature and are out of the researcher’s control. The
effectiveness of the project is felt only when the results are
read along with the limitations and constraints faced
during the course of this study. The following are the
limitations. Getting timely responses from the respondents
were a difficult task due to the reason for this may be
attributed to their busy schedules.
ANALYSIS AND RESULTS
Table 1 : Educational and Medical Services
Educational and Medical Services
Type of Organization
N Mean SD t-value LS
Sponsoring for Training Program
Government 52 3.23 1.06 1.29 NS
Private 153 3.46 1.32
Children’s Scholarship Government 52 3.19 1.07
2.63 1% Private 153 3.65 1.11
Medical Benefits (Employee’s)
Government 52 3.71 1.29 1.62 NS
Private 153 4.05 1.27
Medical benefits (Dependent’s)
Government 52 3.75 1.22 2.2 5%
Private 153 4.18 1.06
Source: Computed from primary data.
Ho: Government and Private employees do not differ in
their opinion about educational and medical services.
The result proves that, the calculated t-value for children’s
scholarship and medical benefits (dependents) are
significant. In the case of sponsoring for training program
and medical benefit (employees) are not statistically
significant. Hence the stated hypothesis is partially
accepted.
R.Ramachandran

( 18 )( 18 )( 18 )( 18 )( 18 )
Table 2 : Availability Position and Designation
Position and Designation
Type of Organization
N Mean SD t-
value LS
Promotion Benefits Government 52 3.23 1.06
2.2 5% Private 153 3.63 1.20
Transfer Government 52 3.10 1.14
0.73 NS Private 153 2.95 1.37
Demotion and Dismissal Government 52 3.81 1.22
1.20 NS Private 153 4.05 1.27
Designation Available Government 52 3.69 1.20
2.41 5% Private 153 4.14 1.06
Career Development Government 52 3.96 1.31
3.76 1% Private 153 4.69 0.77
Source: Computed from primary data.
Ho: Employees do not differ in their opinion about position
and designation on the basis of type of organization.
The result reveals that regarding promotion benefits,
designation available and career development there is a
significant difference between government and private
organization. In the case of transfer, demotion and
dismissal, there is no significant difference. So, the stated
null hypothesis is partially accepted.
Table 3 : Reason for Attrition due to Stress
Stress Type of
Organization N Mean SD t-value LS
Physical Problem
Government 52 3.37 0.99 1.98 5%
Private 153 3.02 1.34
Psychological Problem
Government 52 3.56 1.13 1.98 5%
Private 153 3.93 1.27
Behavioral Problem
Government 52 3.02 1.15 2.01 5%
Private 153 2.63 1.39
Source: Computed from primary data.
Ho: Employees do not differ in their opinion on early
departure from organization due to stress on the basis of
type of organization.
It is evident from the obtained result that employees differ
in their opinion on early departure from organization –
stress. It is confirmed by the obtained t-values, which are
all significant at 5% and 1% level. So, the stated hypothesis
is rejected.
Attrition of the Employees in Hotel Industry–A Comparative Analysis

( 19 )( 19 )( 19 )( 19 )( 19 )
Table 4 : Reasons on Attrition due to Grievances
Grievances Type of
Organization N Mean SD t-value LS
Rumors Government 52 3.81 1.22
1.27 NS Private 153 4.06 1.26
Wages and Supervision
Government 52 3.33 1.04 1.2 NS
Private 153 3.58 1.23
Seniority Discharge Government 52 3.38 0.99
1.3 NS Private 153 3.58 1.20
General Working Condition
Government 52 3.96 1.15 1.07 NS
Private 153 4.16 1.06
Violation of Contract
Government 52 3.42 0.98 1.30 NS
Private 153 3.64 1.21
Change in pay structure
Government 52 3.50 1.04 0.99 NS
Private 153 3.67 1.22
De-motivation Government 52 3.33 0.90
1.50 NS Private 153 3.56 1.16
Employees Safely Measures
Government 52 3.38 1.32 3.20 1%
Private 153 4.05 1.17
Source: Computed from primary data.
Ho: Employees do not differ in their opinion about early
departure from organization grievance on the basis of type
of organization.
It is evident from the obtained result, the calculated t-
values, which are all not significant. Hence the stated
hypothesis is accepted. So, employees do not differ in their
opinion about early departure from organization grievance
on the basis of type of organization.
Path Analysis
A key idea in path analysis is that path effect coefficients
can be used to estimate the empirical correlation among
variables in the system. The figure shows path diagram
representing the causal relationship presumed to
underline the calculations reported in Table 4 and 5. The
path analysis model shows the effect of assessing attrition
employees. The decomposition of the association of the
independent variables with assessing attrition given in
Table 5 reveals the direct and indirect effect among the
hotel industry employees related to assessing attrition.
Table 5 : Decomposition of Association between Dependent and Independent Variables
Type of Effect
Assessing Attrition Direct Effect Indirect Effect Total Effect
Monetary Benefits -0.065 0.449 -0.1042
Educational and Medical Services
0.449 -0.284 0.5772
Social, Welfare and Security Payments
0.228 0.348 0.1538
Source: Computed from primary data.
It is also signifies that among the three groups of sample,
employees’ hotel industry is highly correlated (0.577) with
Assessing Attrition when compared with other. Because
they interact more with the employees. It is revealed that
the employees at hotel industry office operations have
more value creation channels especially communication.
R.Ramachandran
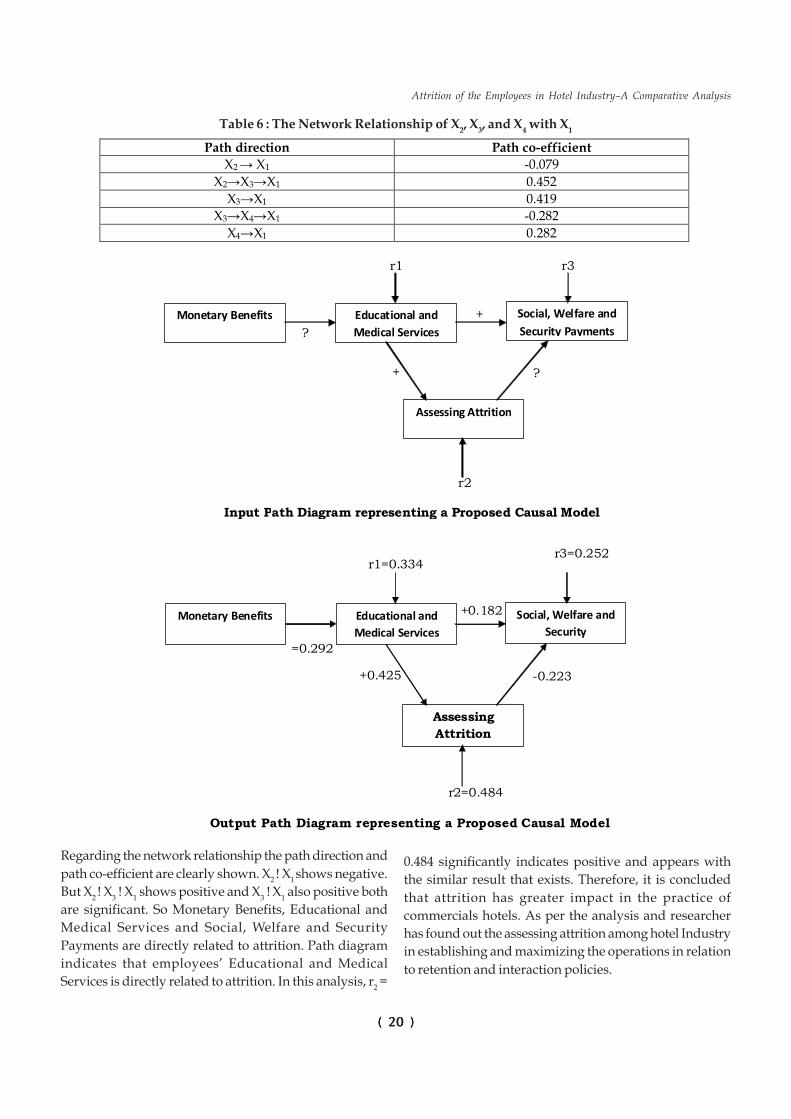
( 20 )( 20 )( 20 )( 20 )( 20 )
Table 6 : The Network Relationship of X2, X
3, and X
4 with X
1
Path direction Path co-efficient
X2 → X1 -0.079
X2→X3→X1 0.452
X3→X1 0.419
X3→X4→X1 -0.282
X4→X1 0.282
Monetary Benefits Educational and
Medical Services
Social, Welfare and
Security Payments
Assessing Attrition
r1 r3
r2
?
? +
+
Input Path Diagram representing a Proposed Causal Model
Monetary Benefits Educational and
Medical Services
Social, Welfare and
Security
Assessing
Attrition
r1=0.334
r2=0.484
=0.292
-0.223 +0.425
+0.182
Output Path Diagram representing a Proposed Causal Model
r3=0.252
Regarding the network relationship the path direction and
path co-efficient are clearly shown. X2 ! X
1 shows negative.
But X2 ! X
3 ! X
1 shows positive and X
3 ! X
1 also positive both
are significant. So Monetary Benefits, Educational and
Medical Services and Social, Welfare and Security
Payments are directly related to attrition. Path diagram
indicates that employees’ Educational and Medical
Services is directly related to attrition. In this analysis, r2 =
0.484 significantly indicates positive and appears with
the similar result that exists. Therefore, it is concluded
that attrition has greater impact in the practice of
commercials hotels. As per the analysis and researcher
has found out the assessing attrition among hotel Industry
in establishing and maximizing the operations in relation
to retention and interaction policies.
Attrition of the Employees in Hotel Industry–A Comparative Analysis

( 21 )( 21 )( 21 )( 21 )( 21 )
PROMINENT RESULTS
• Government and Private employees differ in their
opinion about educational and medical services.
• Employees differ in their opinion about position and
designation on the basis of type of organization.
• Employees differ in their opinion on early departure
from organization due to stress on the basis of type
of organization.
• Employees differ in their opinion about early
departure from organization grievance on the basis
of type of organization.
• So Monetary Benefits, Educational and Medical
Services and Social, Welfare and Security Payments
are directly related to attrition. Path diagram
indicates that employees’ Educational and Medical
Services is directly related to attrition.
MANAGERIAL IMPLICATIONS
From the finding, it is recommended that in order to reduce
the percentage of Attrition Rate the following steps are
suggested.
1. Management should ensure a safe and good work
environment.
2. Manpower should be increased in order to reduce
the workload of employees so that their work time
will also be reduced which in turn makes them
happy on spending more time with their family
members.
3. Bonus, Leave/traveling allowances and such things
may be included in their compensation package.
4. Awareness on the facilities available in the
organization must be created by providing them with
respective information in the offer letter while
joining.
5. Employees must be entertained at equal intervals in
order to reduce their stress. They may be taken to
occasional picnics or get together, so that they will
be refreshed and also conflicts among the peers will
also be reduced.
6. Lucrative promotional policies have to design in
order to enhance the employees’ satisfaction level.
Instead of going out for fresh entrants for higher
positions, the existing employees may be promoted
which is benefit for both organization and the
employees as the employee will have prior
knowledge and experience in the same field and the
same organization.
CONCLUSION
“There’s no panacea to the attrition problem. However, a
detailed plan employing many different tactics will help
planners drive attendees and exhibitors back into official
room blocks. Different things will work for different
organizations depending on the relationship the
organization has with its attendees and exhibitors.” Jamie
Romano (2001) for his research about attrition in room
reservation for The Produce Marketing Association (PMA)
said that those who book rooms at its annual convention
within its block must pay for their entire stay upon check-
in, with no refunds for early departures except for
verifiable family or medical emergencies. Thus, PMA does
not lose room nights for early departures.
Those booking sub-blocks of five or more rooms pay a one-
night deposit at cut-off and sign an agreement with PMA
that if they pick up less than 90 percent of their block held
at cut-off and PMA is penalized, they will be invoiced for
the difference. For PMA’s two smaller meetings held
annually, all those attending must pay for the rooms they
reserve within the blocks by cut-off, which is usually about
25 days prior to the start of the meeting. With this policy,
PMA discourages attendees from canceling their
reservations after cut-off. Changes to arrival and departure
dates are not allowed, but guest names can be changed.
Once again, refunds are given only to those with verifiable
family or medical emergencies.
While one might muse that such measures actually could
induce people to book outside the block, PMA implemented
this policy for its smaller meetings in 2001, and since then
pick-up has totaled no less than 85 percent, said Jamie
Romano, the group’s convention and meetings specialist.
By contract, the hotels keep the money from no-shows and
cancellations, plus they can resell the rooms. As a result,
the hotels agree to relieve PMA of attrition damages, an
easy decision since the hotels often make extra money from
the arrangement and there’s little danger that the group
will fail to meet its block commitments.
Sanjeev Sharma (January 2005) in an article for Times
News New Yorkhas written about Attrition Rate that has
caused certain problems to major IT sector and other BPO’s.
R.Ramachandran

( 22 )( 22 )( 22 )( 22 )( 22 )
As the labour market tightens, organizations will be faced
with the prospect of an increase in their staff attrition rates.
The cost of this, not only in replacement costs but also in
lost productivity can be significant. By understanding
which employees are leaving and the reasons why they
choose to leave the HR function can intervene by
implementing strategic policies and practices which will
increase the employees desire to stay with the organization.
The role of HR can be viewed as ‘guardian’ of the firm’s
intellectual assets. This requires policies which are
designed to target value creators by managing out non-
performers and retaining high performers. The issues
raised in this article serve to highlight the need to address
the rising rates of attrition and provide an indication of
why it is that employees quit. Primarily the research
examined indicates that the main drivers of intent to leave
are low levels of commitment, lack of job satisfaction, lack
of procedural and distributive justice and promotional
opportunity.
However, the research makes it clear that there can be no
simple solution. Each company has its own turnover
demographics which indicate that various groups of
employees have different reasons for leaving. Therefore,
each organization will need to research their own attrition
rates and implement policies to address the areas of
concern and which have the greatest impact upon the
business.
REFERENCES
Balaji, Executive Director (Staffing Solutions), Ma Foi
Management Consultants (2010) J. Black Labor In
The South: Richmond, Virginia.
David Radcliffe (2010), Greater Phoenix Convention &
Visitors Bureau who heads Project Attrition,
European Economic Review, June.
Dr. Jaghmohan Negi: Human Recourses Management for
hospitality industry, S.Chand & Co, 1986.
Indian journal of training & development-1999
Koshy, Vice-President of the Chennai-based GRT Grand
(2011). Organizational Culture And Performance,
M.D Publications Pvt. Ltd., 1989.
Luthans F. Organization Behaviour, Tokyo, Mcgraw-Hill
International Book Company, 1981.
Mamoria C.B: Personnel Management, Himalayan
Publishing House 1980.
Manish Joyal (March, 2012, Caterer and Hotelkeeper):
Services Management: An Insight Into Hospitality
Industry.
Maritz Hospitality Research Group (2009), “2003 Meeting
Planners: Choice, Experience, Loyalty Study”,
Perspectives on Labour and Income, Summer
Mohini Sethi. Surgeet Malhan: Catering Management, an
integrated approach, Tata McGraw Hill Publishing
Company.
Nina Varghese (2009) survey for Federation of Hotels and
Restaurants Association of India (FHRAI) Indian
journal of training & development.
Rohan Wickremasinghe: Management Theory And
Practice, By G. A. Cole, Elbs With Dp Publications
Tharyan, Executive Director, Residency Group of Hotels
(2011), Jr. Organization development, New Delhi,
Prentice Hall Of India Pvt. Ltd.
Vaid, K.N., Paresrs on absenteeism, Asia Publishing House,
Bombay, 1967.
Various office records, files & journals of hotels
Venkata Ratnam C.S. & Srivasta B.K. : Personnel
Management & Human Recources, Tata McGraw
Hill Publishing Company, 1980
Vishnuvardhan Bhat (September, 2012, Caterer and
Hotelkeeper), Human Relations And Organization
Behaviour, A Global Prespective, Fourth Edition,
Macmillan India Limited.
Dr. R.Ramachandran
Assistant Professor in Commerce, DDE,
Annamalai University, Annamalai Nagar – 608 002,
Tamilnadu, India
E-mail :[email protected]
Attrition of the Employees in Hotel Industry–A Comparative Analysis

( 23 )( 23 )( 23 )( 23 )( 23 )
INTRODUCTION
Foreign Trade is a vital sector of a country’s national economy, and contributes
substantially to the economic welfare of the people and the development of resources.
For an emerging economic powerhouse such as India, foreign trade is not only an
economic feature but a formidable weapon of diplomacy and international influence.
Economically, foreign trade contributes as much as 40.97% to GDP (2011). India’s foreign
trade has accelerated substantially in the past decade, growing faster than that of the
world.
India has emerged as a major stakeholder in world’s trade scenario. Its foreign trade
policy is of great consequence not only for the South Asian region, but for the whole of
globe’s trade participants. It is against this backdrop that we need to study to find out
factors guiding India’s trade, in order to gauge the implications of its trade policy and
to carve out prescriptions for future action.
Although theoretical foundations of foreign trade may be explained using a multitude
of models - comparative advantage, economies of scale, specialisation, inter alia.
However a study of the empirics of trade is better explored using the ‘gravity model’ of
trade. The advantage of using gravity model is that it abstracts away from using a
particular theory of trade in analysing trade between a pair of countries, focusing instead
on basic features such as economic mass, geographical separation, contiguity etc. This
paper looks at the India’s trade with its top 50 trading partners in 2008-09. The choice
of this year is explained by the fact that India’s trade peaked to its highest during this
period, falling prey to global economic downturn thereafter. The paper derives important
insights about India’s foreign trade, leading us to policy conclusions.
The paper is henceforth divided into five parts. The subsequent section sets the
theoretical tone for the exposition. The second section reviews the existing literature on
application of gravity model in empirical inquiries. The third spells out the methodology
Key words:
Gravity model of trade,
free trade agreement,
foreign trade
Estimation of the Gravity Model ofTrade for India
Akshita Goyal, Anshuman Kamila and Aishwarya Dayal
ABSTRACT
The paper tests the validity of the known determinants of a country’s trade with its major trading
partners. The authors first look at the theoretical background for the gravity model and then move on to
the econometric analysis. The four crucial factors like per capita income of the trade partner, distance,
free trade agreements and contiguity have been taken account of in the study. The authors further
decipher their conclusions, which turn out to be slightly off theoretical predictions, by using arguments
like development of technology, faster transportation networks and international bilateral relations. The
paper ends with certain policy suggestions for India in conduct of foreign trade policy.
The Indian Journal of CommerceVol.68, No. 4, October-December 2015

( 24 )( 24 )( 24 )( 24 )( 24 )
of our study, detailing the data sources used also. The
fourth reports on the econometric assessment of the theory
and interprets the coefficients, giving reasons for their signs
thereof. The fifth closes the paper with conclusions and
policy implications.
CONCEPTUAL FRAMEWORK
The Gravity Model is based on a very basic law of Physics,
known as Newton’s Law of Gravitation. This law states
that the gravitational force between two objects is directly
proportional to their masses, and inversely proportional
to the distance between them.
Analogously, the equation of the Gravity Model of Trade is
as follows:
α β
δ= i i
ij
ij
GY YF
D (1)
whereFij = trade flow between the two countries i and j; G
= proportionality constant; Yi = economic mass of country
i (in terms of Gross Domestic Product {GDP}); Yj = economic
mass of country j (in terms of GDP); Dij = geographical
distance between the two countries i and j, estimated by
the Great Circle formula.
Explanation of the great circle formula: Distance is almost
always measured using the “great circle” formula. This
formula approximates the shape of the earth as a sphere
and calculates the minimum distance along the surface.
To calculate great circle distances one needs the longitude
and latitude of the capital or “economic center” of each
economy in the study. Then the following formula is
applied to obtain the distance measure in miles:
Dij = 3962.6 arccos([sin(Yi) · sin(Yj )] + [cos(Yi) · cos(Yj ) ·
cos(Xi “ Xj )]),
where X is longitude in degrees multiplied by 57.3 to
convert it to radians and Y is latitude multiplied by “57.3
(assuming it is measured in degrees West)
The inspiration for our empirical study has been the primer
authored by Keith Head, 2003, titled “Gravity for
Beginners”. This dossier has offered a detailed analysis of
possible explanatory variables for the volume of trade
between any two countries, including a critical review of
these variables and the possible errors that may be
encountered.
To make (1)compatible with econometric estimation, as
OLS may be applied to models which are linear in
parameters, we apply log to both sides of equation (1),
getting the following functional form:
= + α + β − δij i j ijLnF ln G ln Y ln Y ln D , (2)
Where ln G now is the intercept term, and á, â, ä are now
the elasticities of Fij with respect to Y
i, Y
j and D
ij,
respectively.
Adding an error term to (2) makes it a model compatible
with OLS estimation procedures.
LITERATURE REVIEW
Robustness of the Gravity Model: A review of early
contributors to the empirical evidence of the Gravity model
for a period of 10 years (1999-2009) has been made by
Kepaptsoglou et al. (2010). These researchers have put
forward arguments in favour of the robustness and high
explanatory power of the Gravity Model in explaining
policy implications in international trade for a period over
40 years and more. The most common form of data used is
panel data.
Earliest works on the Gravity model date back to 1962, by
Jan Tinbergen, followed by Poyhonen (1963), Anderson
(1979), Caves (1981) and Toh (1982). All of them, in their
works, suggest geographical distance to be an important
determinant of the trade flows between countries, when
using the Gravity Model. These studies quote distance to
have a negative impact on Trade flows. Rightly so, before
the era of technological advancements that led to a
substantial reduction in transaction costs
Subsequent works by Eichengreen and Erwin (1998) and
Rauch (1999) have shown the importance of cultural factors
like common borders, language, etc. in determining the
volume of trade happening between 2 countries. The use
of dummy variables is suggested for capturing these
qualitative characteristics, in an econometric model.
Contiguity and cultural affinity have been empirically
proven to have affected trade in the positive direction.
Many other studies like Balasaa (1966), Balasaa and
Bauwens (1987), Frankel and Rose (1998) conclude the
same.
Recent Works: Looking at another panel data analysis, by
Bhattacharya and Banerjee (2006), which covers 177
countries that India had trade relations with over the period
Estimation of the Gravity Model of Trade for India

( 25 )( 25 )( 25 )( 25 )( 25 )
1950 to 2000 at least once, we find that India’s trade
responds less than proportionally to size and more than
proportionally to distance. But yet again we keep in mind
the usage of panel data for this result.
Analogously, Batra (2004) conducts OLS estimation for a
sample of 146 countries, for the year 2000, and gives the
result that India’s trade is positively related to economic
masses of the two countries in question and negatively
related to the distances between these countries.
Empirical work on the Gravity model has also been done
for Pakistan(An Empirical Analysis of Pakistan’s Bilateral
Trade: A Gravity Model Approach by Shaista
Khan,IhtishamulHaq and Dilawar Khan),but here the
results are contrary to what theory would have us believe.
They have found empirically that the Distance (Dij) and
contiguity (border sharing dummy) variables are
insignificant. Despite the fact that they used panel data,
the results have been explained in terms of whether the
relations with the countries sharing a border with them
have been friendly or not. We may be able to say something
similar for India.
RESEARCH PROCESS
APPLICATION
Estimating the gravity equation has the advantage of
estimating trade flows without having to any economic
theory. The reason was obvious; there was no economic
theory then to fall back upon, during the origins of the
gravity model. The reasons for sticking to the gravity model
in the presence of attendant economic theory are the
simplicity and the empirical success of themodel in
explaining the bilateral trade flows.
LIST OF VARIABLES
VARIABLE NAME VARIABLE DESCRIPTION
TYPE OF VARIABLE
l_Distance_by_great_circle_ form
Log of distance between India and the trade partner calculated using great circle formula
Explanatory variable
Contiguity Dummy for trade partners sharing border with India ={1 if border sharing 0 otherwise}
Explanatory variable
FTA Dummy for trade partners having Free Trade Agreement with India ={1 if FTA exists 0 otherwise}
Explanatory variable
l_Product_of_per_capita_ GDP
Log of product of Per Capita GDP of India (1224095.295 US Million $ in 20081) and of its trade Partner.
Explanatory variable
L_Trade_Volume Log of total value of trade between India and its trade partner
Explained Variable
1 Taken from data.worldbank.org
METHODOLOGY
Given the nature of the data that we are working with in
this paper, we consider a setup where we model bilateral
trade of India with the greatest of its trading partners in
the year 2008-09. Indexing the home country by I (for India,
which is the home country in theempirical exercise) and
taking logarithm of the basic gravity model we get:
= + α + β − δij i j ijLnF ln G ln Y ln Y ln D
where
1. Fij= value of trade between India and its trading
partner j in 2008-09 measured in current US $
2. ln G + lnYi= constants, since constant of
proportionality and log of economic mass of India
are constant throughout
3. lnYj= log of economic mass of the trading partner in
2008
4. lnDij=
log of geographical distance between India
and its trading partner, calculated by the Great Circle
Formula
Subsequent studies have suggested addition of dummies
to capture the specific effects of ‘Contiguity/Border
sharing’ and ‘Free Trade Agreement(FTA)’ on the volume
of trade between countries.
Akshita Goyal, Anshuman Kamila and Aishwarya Dayal

( 26 )( 26 )( 26 )( 26 )( 26 )
We have also considered these aspects in this
model.Accordingly, in our study, we have taken log of Trade
volume (sum of value of exports and imports) i.e.
l_Trade_Volume as the dependent variable which is
regressed on log of product of per capita incomes of India
and the jth trade partner in 2008-09 i.e.
l_Product_of_per_capita_GDP, log of the distance between
them i.e. l_Distance_by_great_circle_form and 2 dummies
- one for border sharing with the jth trade partner i.e.
Contiguity {which takes value 1 in case the trade partner
shares border with India, and 0 otherwise} and another
for existence of a preferential/free trade agreement with
the trade partner i.e. FTA. {which takes value 1 in case an
FTA is in force and 0 otherwise.}
We have considered the log of value of trade volume as the
log of sum of values of exports and imports in current US
$ as the dependent variable. Since the aggregate volume of
trade is effectively the sum of both exports as well as
imports, this was deemed proper and appropriate. Data
regarding this was accessed from the Export-Import Bank
of India’s statistics, Department of Commerce, Government
of India.1
Per capita Income is an indicator of the capacity to
participate in world trade - and has both supply and
demand characteristics. An economy that has high per
capita income demands more imports from the rest of the
world. Also per capita income carries the imprints of a
high GDP, and thereby reflects the economy’s production
capability and export potential. Having justified the point
in taking per capita income as a regressor, it is to be noted
that we have taken the log form of product of per capita
incomes of India and its trading partners in 2008-2009.
This is done for the sake of convenience. Therefore, the log
of India’s per capita GDP which would otherwise figure
in the constant has been included in the regressor. The
data pertaining to this statistic has been sourced from the
World Bank. Population figures have also been taken from
the same source.
‘Impedance factors’ include all those elements that affect
trade flows in a negative or positive manner.
Transportation costs are the main resistance factors; these
include actual freight transportation costs, tariffs, quality
of infrastructure2 etc. Typically, these are approximated by
the total distance between the countries’ economic centers, that
is, the great circle distance calculated by the longitudes
and latitudes of centers3. Preference was given to major
trading hubs over capital cities in taking economic centres.
In our case, the distance has been calculated from a
preprogrammed application available on the website listed
here.
Other impedance factors to trade included in our estimated
model are dummies for border sharing nations and countries
with which we have free trade agreements. Data for the border
sharing has been inferred from the map and subsequently
verified from The World Factbookof the CIA. Similarly, data
for existence of a free/preferential trade agreement has
been sourced primarily from the website of the Ministry of
Trade and Commerce, and cross-checked from sundry
sources.
Summary, our model estimated is of the following form:
l_Trade_Volume = A l_Product_of_per_capita_GDP + B
l_Distance_by_great_circle_form + C Contiguity + D FTA
+ ∈
Exclusion of the Constant term: Why was it done?
The proportionality constant is found to be a function of
the ratio between economic mass and distance5, hence
assumed to be subsumed when the economic mass and
distance variables are included. Also, as mentioned earlier,
the factors responsible for the constant term have all been
included as a constant multiplied in the regressors.
The Appendix lists in detail the argument for removal of
constant. However, if a model has no constant, OLS
estimation might lead to inaccurate results. The major
suspect is that expectation of the error term may not be
zero. This necessitated a closer look at the error values.
The same are listed here for ready reference.
uhat1
U ARAB EMTS 2.088410
CHINA P RP 1.454890
U S A 1.307616
SAUDI ARAB 1.504091
GERMANY 1.058840
SINGAPORE 0.725718
IRAN 1.888321
HONG KONG 1.044688
SWITZERLAND 0.620710
KOREA RP -0.219852
AUSTRALIA 0.621105
U K 0.576024
Estimation of the Gravity Model of Trade for India

( 27 )( 27 )( 27 )( 27 )( 27 )
JAPAN -0.389631
MALAYSIA 0.036327
NIGERIA 0.514024
KUWAIT 0.556890
BELGIUM 0.642889
INDONESIA 0.524020
NETHERLAND 0.229922
ITALY -0.023361
IRAQ 1.153602
FRANCE 0.101915
SOUTH AFRICA -0.749747
RUSSIA -0.434010
THAILAND -0.259380
VENEZUELA -0.827006
TAIWAN -0.226026
QATAR 0.065756
BRAZIL -0.571325
CANADA 0.082657
EGYPT A RP -0.146458
SPAIN -0.626156
ISRAEL -0.019996
TURKEY -0.393795
BANGLADESH PR -0.323540
SRI LANKA DSR -0.078474
SWEDEN -0.842434
MEXICO -1.643111
JORDAN 0.010652
VIETNAM SOC REP -0.227509
NEPAL -0.295728
OMAN -0.778205
UKRAINE -0.716834
CHILE -1.016031
PAKISTAN IR -0.835622
ANGOLA -1.017945
BAHARAIN IS -1.292109
ALGERIA -1.105301
YEMEN REPUBLC -0.419006
NORWAY -1.124769
The sum of these error terms is 0.205.
Assuming the approximation to 0, we can easily use OLS
method for estimating the model.
A few more caveats are in order, before the econometric
assessment of the model is attempted.
1. Data on GDP of South Korea could not be obtained
on the World Bank’s website and was taken from
tradingeconomics.com/south-korea/gdp.
2. Entry regarding the trade volume of one of the major
trading partners had to be dropped, since the data
source mentioned its name as ‘unspecified’.
ECONOMETRIC ANALYSIS
I. Estimation of Model and Tests
GRAVITY MODEL ESTIMATED IN LOG-LINEAR
FORM
After having explained the various independent variables
considered, it is now time to turn to estimating the
econometric model involved. The software ‘gretl’ was used
to conduct the econometric assessment. The results are
reported as below:
Model: OLS, using observations 1-50
Dependent variable: l_Trade_Volume
Coefficient Std. Error t-ratio p-value
l_Distance_by_great_circle_form
0.73589 0.135793 5.4192 <0.00001 ***
Contiguity 0.173513 0.487582 0.3559 0.72357
FTA 0.796243 0.265687 2.9969 0.00439 ***
l_Product_of_per_capita_GDP
0.131559 0.0705551 1.8646 0.06862 *
Mean dependent var
8.636154 S.D. dependent var
0.939460
Sum squared resid
35.05360 S.E. of regression 0.872946
R-squared 0.990708 Adjusted R-squared
0.990102
F(4, 46) 1226.109 P-value(F) 4.40e-46
Log-likelihood -62.06831 Akaike criterion 132.1366
Schwarz
criterion
139.7847 Hannan-Quinn 135.0491
The coefficients obtained herein are interpreted and
explained later in the document. It is worthwhile, however,
to note here that the obtained is very highly significant,
thus suggesting that the model fitted is an appropriate
one and captures the reality well.
Other tests, as detailed here were conducted to check for
the occurrence of several kinds of commonly encountered
problems in OLS estimation.
Akshita Goyal, Anshuman Kamila and Aishwarya Dayal

( 28 )( 28 )( 28 )( 28 )( 28 )
I.MULTICOLLINEARITY
Variance Inflation Factors
Minimum possible value = 1.0
Values > 10.0 may indicate a collinearity problem
l_Distance_by_great_circle_form 1.940
Contiguity 1.239
FTA 1.673
l_Product_of_per_capita_GDP 1.212
VIF(j) = 1/(1 - R(j)^2), where R(j) is the multiple correlation
coefficient between variable j and the other independent
variables
RESULT: NO EVIDENCE OF MULTICOLLINEARITY
II.HETEROSCEDASTICITY
A) Graphical Method:
-2
-1.5
-1
-0.5
0
0.5
1
1.5
2
2.5
12 13 14 15 16 17 18 19 20 21
resid
ual
l_Product_of_per_capita_GDP
Regression residuals (= observed - fitted l_Trade_Volume)
-2
-1.5
-1
-0.5
0
0.5
1
1.5
2
2.5
7 7.5 8 8.5 9 9.5
resid
ual
l_Distance_by_great_circle_form
Regression residuals (= observed - fitted l_Trade_Volume)
-2
-1.5
-1
-0.5
0
0.5
1
1.5
2
2.5
0 1
resid
ual
FTA
Regression residuals (= observed - fitted l_Trade_Volume)
-2
-1.5
-1
-0.5
0
0.5
1
1.5
2
2.5
0 1
resid
ual
Contiguity
Regression residuals (= observed - fitted l_Trade_Volume)
B) LM TEST FOR HETEROSCEDASTICITY
White’s test for heteroskedasticity
OLS, using observations 1-50
Dependent variable: uhat^2
Omitted due to exact collinearity: X2_X3
coefficient std. error t-ratio p-value
l_Distance_by_gr~ -6.35607 3.82760 -1.661 0.1048
Contiguity -12.1059 9.18429 -1.318 0.1952
FTA 1.37400 6.22667 0.2207 0.8265
l_Product_of_per~ 3.40494 2.09085 1.628 0.1115
sq_l_Distance_by~ 0.753706 0.441447 1.707 0.0957*
X1_X2 2.52369 0.999730 2.524 0.0158**
X1_X3 -0.570798 0.977438 -0.5840 0.5626
X1_X4 -0.384834 0.252521 -1.524 0.1356
X2_X4 -0.496003 0.356249 -1.392 0.1717
X3_X4 0.197935 0.218566 0.9056 0.3707
sq_l_Product_of_~ -0.00730528 0.0340630 -0.2145 0.8313
Estimation of the Gravity Model of Trade for India

( 29 )( 29 )( 29 )( 29 )( 29 )
Unadjusted R-squared = 0.536890
Test statistic: TR^2 = 26.844480,
with p-value = P(Chi-square(10) > 26.844480) = 0.002756
RESULT: NO EVIDENCE OF HETEROSCEDASTICITY
III.NORMALITY OF RESIDUAL
0
0.05
0.1
0.15
0.2
0.25
0.3
0.35
0.4
0.45
0.5
-2 -1 0 1 2
Density
uhat3
uhat3
N(0.0041141,0.87294)Test statistic for normality:
Chi-square(2) = 2.955 [0.2282]
IV.RESET RAMSEY’s TEST
Auxiliary regression for RESET specification test
OLS, using observations 1-50
Dependent variable: l_Trade_Volume
coefficient std. error t-ratio p-value
l_Distance_by_gr~ 0.402095 2.62979 0.1529 0.8792
Contiguity 0.0446853 0.791317 0.05647 0.9552 FTA 0.490895 2.87820 0.1706 0.8654
l_Product_of_per~ 0.0887890 0.502430 0.1767 0.8605 yhat^2 0.117037 0.828991 0.1412 0.8884
yhat^3 -0.00788944 0.0473724 -0.1665 0.8685
Test statistic: F = 0.221657,
with p-value = P(F(2,44) > 0.221657) = 0.802
RESULT: NO SPECIFICATION ERROR
V.LEVERAGE AND INFLUENCE
0
0.2
0.4
0.6
0.8
1
10 20 30 40 50
leverage
-0.6
-0.4
-0.2
0
0.2
0.4
0.6
10 20 30 40 50
influence
We close this section with submitting the summary
statistics of independent and dependent variables of our
model.
VI. SUMMARY STATISTICS
Summary Statistics, using the observations 1 - 50
Variable
Mean Median Minimum Maximum
l_Distance_by_great_circle_form 8.35419 8.41559 6.78173 9.65869
Contiguity 0.0800000 0.00000 0.00000 1.00000
FTA 0.420000 0.00000 0.00000 1.00000
l_Trade_Volume 8.63615 8.41632 7.32277 10.7845
l_Product_of_per_capita_GDP 16.2359 16.2728 11.6647 20.9882
Variable Std. Dev. C.V. Skewness Ex. Kurtosis
l_Distance_by_great_circle_form 0.601683 0.0720217 -0.200489 -0.0856372
Contiguity 0.274048 3.42559 3.09628 7.58696
FTA 0.498569 1.18707 0.324176 -1.89491
l_Trade_Volume 0.939460 0.108782 0.422654 -0.706809
l_Product_of_per_capita_GDP 1.92047 0.118286 -0.205830 -0.104886
II. RESULTS
A) SLOPE COEFFICIENT OF DISTANCE IS
SIGNIFICANTLY POSITIVE!
The most striking aspect of our finding is the positive
coefficient for geographical distance between India and
its trading partners. This is theoretically contrary to apriori
expectations and deserves attention and explanation.
A possible set of causes behind this ‘anomaly’ is the
following:
Akshita Goyal, Anshuman Kamila and Aishwarya Dayal

( 30 )( 30 )( 30 )( 30 )( 30 )
1. DISTANCE IS NO MORE A PROXY FOR
TRANSACTION COSTS:
Francis Cairncross (2002) suggests, and rightly so, that
internet has revolutionised the way communication and
hence trade takes place. The point of inclusion of distance
in the gravity model is to bring in the concept of
transactions cost in accounting for trade. And internet has
done a lot in beating down these transactions costs. Once
a basic framework for trade ties has been laid and a contract
been reached, subsequent interactions take place primarily
through the web – eliminating the physical separation
between involved parties as an impediment to trade. That
is to say, placing of orders, tracking of consignment and
payment of dues are now highly linked to the internet, no
longer needing physical movement of men or mail. On the
same plank, therefore, location of the parties which are
part of commercial ties globally does not matter in
influencing the volume of trade.
Air reigns over land and water: With the advent of mega
transport planes and other breakthroughs in shipping
lines, the transactions costs in trading with countries far
from India have come down considerably. So, what matters
for trade is specialisation of the country concerned in the
good being traded, regardless of the barriers to trade in
form of transport and transactions costs.
2. THE INTERACTIVE EFFECT OF POLITICS
AND ECONOMICS:
Increasingly, trade has been used as an effective
instrument of foreign policy. Trade is no longer confined
to the economics or cost-accounting framework, but has
transcended such concerns to depend substantially on
diplomatic relations of India with its trading partners. This
has the implication that trade disregards geographical
separation and the consequent CIF (costs-insurance-
freight) charges incurred and is primarily motivated by
diplomatic necessity and will.
For example, USA being too far from India should
predictably have lower value of trade (conditioned for its
large GDP) with India. However, the fact that it is a
superpower and is projected as a strategic partner for India
gives a major boost to trade with USA. An element of
disregard for economic argument can be explained
through an example – USA insists on sale of military
hardware through FMS (Foreign Military Sales – where
the US government selects a vendor and acts as a mediator
in the deals, often weakening India’s bargaining power)
while India would prefer the DCS (Direct Commercial Sales
– where only the private arms vendor, chosen through
competitive bidding, negotiates and hence India has
symmetric powers in bargaining). Despite that major
military purchases – such as C 17 Globemaster and
Hercules C 130 J aircrafts and aircraft engines for Tejas
LCA – were all made with the US.
3. GLOBAL INTEGRATION HELPING TO
REACH THE UNREACHEABLE:
Banerjee and Bhattacharya (2006) state that direction and
quantum of trade through the Gravity Model is an
argument against the working of trade policies. That is, to
say, that trade continues to be guided by conventional
reasons of economic masses of the trading partners and
impeded by the geographical distance between them. This
may have been the case for the period considered in studies
conducted so far, but certainly does not seem to hold for
the period of the current study 2011-12. An explanation
may be adduced as follows [Ministry of Trade and
Commerce, Government of India (2004)]: in the trade policy
announced August 31, 2004 a policy initiative to induce
trade to shift away from conventional trading partners
towards unexplored and untapped markets – such as
Chile, Nigeria, Mexico, Venezuela et al – through hike in
incentives offered under the Focus Market Scheme.
Correspondingly, transactions costs, proxied by the
‘distance’ factor were mitigated, and thereby rendered
distance ineffectual as a barrier to trade between India
and countries listed above.
Similarly, the purview of Market Linked Focus Product Scheme
(MLFPS) was also expanded greatly, bringing into its fold
multiple products such as pharmaceuticals, textiles fabrics,
goods of rubber and glass etc. The perceptible impact of
this program was to catalyse trade with countries such as
Algeria, Nigeria, South Africa, Ukraine, Australia inter
alia, owing to which trade with the countries named above
grew manifolds.
Additionally, other sops to spur trade with countries in
Africa, Latin America and CIS (Commonwealth of
Independent States) under the heads of Market Development
Assistance Scheme and Market Access Initiative Scheme have
greatly offset inherent disadvantage in such markets – viz.
higher trade costs and credit risks – and have led to an
increase in trade with this bunch of countries by over 15%
points from 2001 [EXIM Bank of India (2012)].
Estimation of the Gravity Model of Trade for India

( 31 )( 31 )( 31 )( 31 )( 31 )
B) COEFFICIENT OF CONTIGUITY IS
INSIGNIFICANTLY POSITIVE
The coefficient on contiguity is positive, but insignificant.
This is in line with our expectation. Being contiguous to a
country is another way of putting that the transactions
costs involved in trade is small or negligible.
These findings are in stark contrast to those in Banerjee
and Bhattacharya (2006), who found that being contiguous
to India hurts rather than helps in trade. The reason they
cited was that India’s trade with its neighbours was
insignificant. However, it is to be kept in mind that over
time the dynamics have evolved in a way that counters
this trend. Measures such as inception of the Integrated
Check Post at Attari-Wagah Border with Pakistan or
resumption of trade with China through the Nathu-La
pass have helped in realising part of untapped potential
trade with our neighbours. Consequently, partners have
realised the advantages of sharing borders - most
magnificiently evidenced in the case of China.In a study
by Khan,while border sharing boosts trade, the influence
has not been that significant. So proximity is beneficial for
trade but it continues to be dictated by considerations
beyond distance - such as economic potential of the trade
partner, its strategic significance etc.
C) COEFFICIENT FOR F.T.A. IS SIGNIFICANTLY
POSITIVE
The coefficient on dummy for FTA is found to be
significantly positive. This is as one would want to believe.
The empirical evidence on FTA is ambiguous, a majority of
which has been explored in Archana and Srinivasan
(2009). Previous results notwithstanding, FTAs have been
found to have been very potent and powerful in case of
India and its trading partners - that is to say that FTAs
have helped enhance trade with trade partners,
significantly too. This is of special importance in the debate
between multilateral trade liberalisation and selective
signing of FTAs within blocks of countries bound by
common economic interests. For India as well, FTAs seem
to be meeting the objective of giving a fillip to trade with
the concerned trade partner to a large extent.A positive
coefficient on the dummy variableindicating that two
countries, both of which participate in the same preferential
arrangement, trade more with one another than predicted
by their incomes, population, and distance is interpreted
as suggesting that the arrangement is trade-creating for
its members. In a separate study, negative coefficient on a
second dummy variable indicating when only one member
of the pair participates in a particular preferential
arrangement is taken as evidence of trade diversion vis-a-
vis the rest of the world(Eichengreen, B., Irwin, D. (1998).
The role of history in bilateral flows, In: Frankel, J. A. (Eds.),
The Regionalization of the World Economy, University of
ChicagoPress.)
For India, this statement can be applied in the case of Saudi
Arabia which has a bilateral trade agreement with ASEAN.
But Saudi Arabia’s membership in GCC Customs
Union,1981 of which it is a founding member and
PAFTA(Pan Arab Free-Trade Area, 1998)forms a larger %
of Saudi Arabia Trade leaving lesser space for Indian
exchanges. Due to this reason, despite having a bilateral
trade agreement with Saudi Arabia, we haven’t been able
to tap the potential. As seen in the graph below, Indian
Trade with Saudi Arabia is lesser than China (with whom
we also have a bilateral trade agreement like Saudi Arabia)
Policy Analysis
One of the primary purposes of this paper has been to
arrive at some pertinent policy conclusions and
prescriptions, for India’s foreign trade policy. The same
are outlined below:
A. DISCARD DISTANCE, PROMOTE POLICY:
Over the years the trend in international trade has defeated
the function of distance as a deterrent to trade. With
globalization and technological advancement it seems as
though the world has been stitched into a seamless tapestry.
This, coupled with the growing importance of trade in
foreign policy and global diplomacy, gives India reason to
try and expand trade ties with countries yet asuntapped.
Papers such as Batra(2004) have noted a huge unharnessed
potential in trade with countries such as Cambodia,
Kuwait, Qatar and Vietnam. As we’ve shown, distance
between such potential trade partners no longer matters.
So, emphasis should be laid on removing other bottlenecks,
Akshita Goyal, Anshuman Kamila and Aishwarya Dayal

( 32 )( 32 )( 32 )( 32 )( 32 )
such as improving turn-around times at our major ports,
extension of timely credit to exporters, etc. to expand the
reach and influence of ‘Made in India’ products. This,
places great emphasis on policy measures such as fiscal
incentives, institutional changes, procedural
rationalization and generates optimism in the ability of
such steps to overpower the hindrance due to distance.
B. F.T.A. AS A TRADE MULTIPLIER:
Directly flowing from our econometric analysis is the
unambiguous fact that free/preferential trade agreements
significantly boost trade with a trade partner. Therefore it
is imperative that India pursues its pending negotiations
with countries (marked in light green below) on an
immediate and urgent basis to fulfill its objectives of
diversifying trade and emerging as a major regional and
global economic power. Signing of FTAs consistent with
the rules and regulations of the WTO will expand India’s
trade volume and afford India a greater say at multilateral
forums. Initiatives such as trade fairs and road-shows and
cooperation programs, as major planks of FTAs, will go a
long way in this direction.
C. COMMON BORDER IS NO BARRIER:
There has been seen a transition from contiguity being an
impediment (Banerjee and Bhattacharya (2006)) to a
promoter of trade volume. Over the past half a decade, our
borders have become more permeable to merchandise trade
with our neighbours, as the analysis previously pointed
out. But certainly, we still have to walk a long way in
intensifying our economic relations with our neighbours
and reaping the benefits offered by contiguity. As brought
out in Taneja (2006) and Bhattacharya and Bhattacharya
(2007), current levels of trade with our immediate
neighbours China and Pakistan are far from what may be
expected. These are markets in great proximity to India
and most easy to log into. To quote Shashi Tharoor from
his book PaxIndica, “good fences make goodneighbours”
and the latter make great trade partners!
CONCLUSION
In the end, we would like to quote Paul Krugman who
says that world trade is like a moving target and so changes
in the above features of trade help us to explain how
distance no more determines the quantity of trade between
2 nations. After all, the globe is gradually getting
encapsulated in one globule!
Yet there are policy conclusions to be drawn and tactical
knowledge to be gained if we are to gauge the changing
dynamics of world trade and chisel our trade policy
accordingly. A simple empirical exercise such as this is
certainly a lodestone in our economic thinking of trade
policy formulation.
REFERENCES
Anderson, J.E., (1979). A Theoretical Foundation for the
Gravity Equation. The American Economic Review
69(1), 106-116
Archana, V and Srinivasan, TN (2009) India in the Global
and Regional Trade, ICRIER working paper 232
Balassa, B., (1966). Tariff reductions and trade in manufactures
among industrial countries. American Economic
Review 56(3), 466-473.
Balassa, B., Bauwens, L., (1987). Intra-industry Specialization
in Multi-country and Multi-industry Framework. The
Economic Journal 97 (388), 923-939.
Banerjee, T and Bhattacharya R (2006) Does the gravity
model explain India’s Direction of Trade: Panel Data
Approach, WP No 2006-09-01, IIM Ahmedabad
Batra, A., (2004). India’s global trade potential: the gravity
model approach. Working Paper No. 151, Indian
Council for Research on International Economic
Relations.
Bhattacharya, Swapan K.; Bhattacharyay, Biswa N. (2007)
: Gains and losses of India-China trade cooperation: a
gravity model impact analysis, CESifo working paper,
No. 1970
Estimation of the Gravity Model of Trade for India

( 33 )( 33 )( 33 )( 33 )( 33 )
Caves, R., (1981). Intra-industry Trade and Market Structure
in the Industrial Countries. Oxford Economic Papers
33 (2), 203-223
Caves, RE (1981) International Trade and Industrial
Organization: Problems, solved and unsolved
Eichengreen, B., Irwin, D. (1998) The role of history in
bilateral flows In: Frankel, J. A. (Eds.), The
Regionalization of the World Economy, University of
Chicago, Press.
EXIM Bank of India (2012) Catalysing India’s Trade and
Investment
Francis Cairncross (2002) The Death of Distances, RSA
Journal Vol 149 No. 5502 (2002) pp 40-42
Frankel, J. A., Rose, A. K., (1998). The endogeneity of the
optimum currency area criteria. The Economic Journal
108(449), 1009-1025
Head, K (2003) Gravity for Beginners
Kepaptsoglou, K., Karlaftis, MG. (2010) The Gravity Model
Specification for Modelling International Trade Flows
and Free Trade Agreement Effects: A 10-year Review of
Empirical Studies.
Khan, S., ul-Haq, I. and Khan, D. (2013) An Empirical
Analysis of Pakistan’s Bilateral Trade: A Gravity Model
Approach. The Romanian Economic Journal, Year
XVI No. 48.
Ministry of Trade and Commerce, Government of India
(2004) Foreign Trade Policy 2004-09
Poyhonen, P. (1963) A Tentative Model for the Volume of Trade
Between Countries
Rauch, J., (1999). Networks versus markets in international
trade. Journal of International Economics 48 (1), 7-
35.
Taneja, N (2006), India-Pakistan Trade, ICRIER Working
Paper no 182
Tinbergen, J (1962) Shaping the World Economy; suggestions
for an international economic Policy.
Toh, K., (1982). A Cross-section Analysis of Intra- industry
Trade in U.S Manufacturing industries.
Weltwirtschaftliches Archive 118 (2), 281-301
Akshita Goyal
Delhi School of Economics
Anshuman Kamila
Delhi School of Economics
E-mail : [email protected]
Aishwarya Dayal.
Akshita Goyal, Anshuman Kamila and Aishwarya Dayal

( 34 )( 34 )( 34 )( 34 )( 34 )
APPENDIX
The constant term in the Gravity model of trade is a complex
function of economic mass of the home country and its
distance from different trade partners.
We know that the flow of trade from a country is eventually
a proportion of total world trade. This proportion is
dependent on the number of goods produced by the nation
and the preference parameter.
( )( )µ
=Σ µℓ ℓ ℓ ℓ
i i ij
ij
j
g , n ,Ds
g ,n ,D
g() is a function of the following variables:
µi :- preference parameter i.e. is a measure of elasticity of
demand for the goods of the country’s goods
ni:- no. of goods by the exporter country
Dij :- Distance between the 2 nations
Assumptions to arrive at a simplified form of the function
g() are as follows :
• All firms are symmetric and of equal size (so the no
of firms is the total economic mass divided by
individual firm size). The more developed is a nation
the firm size is larger
• The free-on-board (origin prices) vary proportionally
to the country’s export prices and the ratio is a
constant k. The relation between the quality adjusted
price and the FOB price is dependent on the distance
as well. The prices rise as the distance increases
because of additional transportation costs
( )
−θ−
σ−= i
1
M Dg( )
gk (2)
On further simplification, the function
whereMi is the economic mass of the exporter country, D is
the geographical distance, q is the exporter firm size and k
is the ratio of the quality adjusted price and the origin
price.
Therefore, finally,
−θ=ij i ij js M D R
whereRj is a function of q and k.
As we know,
From (1), q is a function of Mi
From (2), k is a function of Mi and D
ij
Estimation of the Gravity Model of Trade for India

( 35 )( 35 )( 35 )( 35 )( 35 )
INTRODUCTION
Globally, bank mergers have increased for improving the structure and operational
efficiency of the banking industry. This phenomenon of bank merger is relatively recent
one in India. Mergers have gained importance on account of globalization, increasing
competition, technological changes and redefinition of takeovers. There are life cycle
reasons behind merger and acquisitions to seek specialized partner for growth and
achieving expertise of a large firm diversification, etc. In banking sector a large number
of mergers and acquisitions are going to be the order of the day. India is slowly moving
from regime of “large number of small number banks” to “small number of large banks”.
The merger candidates should be evaluated and investigated from the point of view of
number of perspectives. The engineering analysis will help in estimating the extent of
operating economies of scale, while the marketing analysis may be undertaken to
estimate the desirability of the resulting distribution network. However, the most
important of all is the financial analysis or financial evaluation of a target candidate.
Here only financial aspect has been considered. An acquiring firm should pursue a
merger only if operational efficiency of firm is increased. In order to examine the
operational efficiency of HDFC banks pre and post merger CAMEL accounting tool
have been used to achieve this objective of the present research work.
Key words:
CAMEL, Capital Adequacy,
Asset Quality, Management,
Earning and Liquidity
Critical Analysis of Operational Efficiency ofMerger Activity in Banking Industry: A Case Studyof HDFC Bank
Dr. Paramveer S. Chundawat
ABSTRACT
In banking sector a large number of mergers and acquisitions are going to be the order of the day. India
is slowly moving from regime of “large number of small number banks” to “small number of large
banks”. The merger candidates should be evaluated and investigated from the point of view of number of
perspectives. However, the most important of all is the financial analysis or financial operational appraisal
of a target candidate. Here only financial aspect has been considered. An acquiring firm should pursue
a merger only if operational efficiency of firm is increased. In order to examine the operational efficiency
of HDFC banks pre and post merger CAMEL accounting tool have been used to achieve this objective of
the present research work. The objective of present study is to evaluate operating efficiency and difficulties
in banking industry pre and post merger activity The operational efficiency of HDFC bank has been
analyzed through CAMEL technique. The twenty two ratios have been calculated relating to capital
adequacy, asset quality, management, earnings and liquidity. CAMEL model point of view our null
hypothesis is accepted i.e. merger and acquisition does not result in synergy significantly in terms of
operational efficiency and profitability. Because the calculated value of ‘t’ for all twenty two ratios of
CAMEL model for HDFC bank are less than table value. It clearly indicates the difference is due to
sampling fluctuation not due to merger activity.
The Indian Journal of CommerceVol.68, No. 4, October-December 2015

( 36 )( 36 )( 36 )( 36 )( 36 )
REVIEW OF LITERATURE
The issue of impact of mergers on the efficiency of banks
has been well studied in the literature. Most of the literature
related with the impact of mergers on the efficiency of banks
is found in European Countries and US. In India, literature
on bank merger is very scarce. Very few studies have been
conducted with the motive to appraisal of merger and
acquisition in banking industry. The present study makes
notable contribution to the existing literature on
operational efficiency of Indian banking industry.
Manoj P.K. (2010) checked the financial soundness of old
private sector banks operating in Kerala State through most
popular rating model CAMEL. He examined that due to
intense competition in the banking industry in the ongoing
era of financial sector deregulation initiated in the early
1990s, has put added pressure on the survey survival of
the old private sector banks in India. As financial
soundness has become vital for banks in India for their
survival and growth in the ongoing regime, his paper seek
to make a comparative analysis of the financial soundness
of banks in India and to benchmark with best in class.
Prajapat Sadhana (2010) analyzed various motivations
for mergers and acquisitions in the Indian banking sector.
She highlighted that India is slowly but surely moving
from a regime of large number of small banks to small
number of large banks. This paper analyzed some critical
issues of consideration in Indian banking with particular
emphasis on the views of two important stakeholders. She
conducted an event study analysis of banks stock return,
which reveals that in the cost of forced mergers, neither
the bidder nor the target banks shareholders have been
benefited.
Bodla and Richa (2009) analyzed the Indian Banks as per
CAMEL Model so as to catch up the comparative
performance of various banks in terms of their Earning
Quality. The authors concluded that foreign banks have
edge over their domestic counterparts in terms of operating
profits to average working funds ratio, spread to Total Asset
Ratio and Non Interest Income to Total Income Ratio,
Public sector Bank enjoy the same in terms of Net Profits to
Average Assets ratio and Interest Income to Total Income
Ratio. On the whole, the banks operating in India have
shown appreciable improvement in their fee based income.
Mantravadi and Reddy (2007) explained that how size of
the acquired and acquiring firms affect the outcomes of
merger their paper entitled, “Relative size in merger and
operating performance.” This paper studies the impact of
mergers on the operating performance of acquiring
company by examining some pre and post merger financial
ratios with a sample of firms chosen from all mergers
involving public limited and traded companies in India
between 1991 and 2003.
OBJECTIVE
• To critically analyse pre and post merger operational
efficiency in banking industry special reference to
HDFC bank
HYPOTHESIS
H0: Merger does not result in synergy significantly in terms
of operational efficiency
SOURCE OF DATA
This research study is based on secondary data. Secondary
data has been collected through annual reports of the
HDFC sample bank, Bombay stock exchange official
directory, electronic data base ACE ANALYZER MLSU,
UDAIPUR, government publications etc. The present
research work required a variety of data. Websites
likewww.rbi.org.in, http:// www.moneycontrol.com/
stocksmarketsindia/,http://www.bseindia.com/,http://
wwww.indiabulls.com/securities/, etc. have also been
used.
SELECTION OF BANK
HDFC bank has been randomly selected for present
research work because out of eleven banks whose merger
took place in between 1996 to 2008 one bank is selected
through lottery system that was HDFC bank. After
reviewing the existing literature it is found that Times Bank
and centurion Bank of Punjab have been merged with
HDFC bank in 2000 and 2008 respectively. The HDFC –
Times Bank merger took place in the year 2000. It was
driven by the market forces. The merger helped HDFC Bank
to become one of the largest private sector banks in the
Indian banking industry. The Bennett Coleman Group,
which promoted the Times Bank, had about 7.5% shares
in HDFC Bank after the merger. The merged entity
continued to function as HDFC Bank. The merger helped
Critical Analysis of Operational Efficiency of Merger Activity in Banking Industry: A Case Study of HDFC Bank

( 37 )( 37 )( 37 )( 37 )( 37 )
HDFC Bank to increase its customer base by 2,00,000. It
also provided cross-selling opportunities to the increased
customer population. The branch network increased from
68 to 107. With this merger, HDFC saved on costs associated
with technology up gradation, as Times Bank had
technology in place. Product complementarily was more
for ATM card networks. HDFC Bank had Visa network
while Times Bank had Master card network. On account
of the merger, the merged bank became part of both the
networks. In 2008 centurion bank of Punjab is also merged
with HDFC Bank.
Period of Study: A study of four years pre and post merger
of each bank has been taken into account.
Statistical and Accounting Tools & Techniques
In order to analyze financial data simple statistical
techniques mean has been used. The significance of
difference is tested by ‘t’ test. To evaluate the operational
efficiency of banking industry and examine the impact of
merger, CAMEL accounting techniques has been used.
CAMEL model is used for peer comparison and
benchmarking, regulatory reporting and shareholder
reporting purposes. Some banks have also linked these
parameters to the individual performance review process
and compensation of its employees. However these
financial measures are primarily indicators, a post-mortem
view of the business, rather than lead indicators that assess
the bank’s ability to create value in the future domestic
banks are rated on the CAMEL model of while foreign
banks are rated on the CACS (capital adequacy, asset
quality, compliance and systems). Here, the acronym
‘CAMELS’ stands for, Capital Adequacy (C), Asset Quality
(A), Management (M), Earnings (E), Liquidity (L)
CAMEL ANALYSIS OF HDFC BANK
The operational efficiency of HDFC bank has been
analyzed through CAMEL technique. The twenty two
ratios have been calculated relating to capital adequacy,
asset quality, management, earnings and liquidity. The
detail analysis and discussion have been given below:
(i) Capital Adequacy: Capital adequacy is measured
by the ratio of capital to risk-weighted assets
(CRAR). A sound capital base strengthens
confidence of depositors. Higher the value of CRAR,
stronger is considered a bank as it shows high safety
against bankruptcy. CRAR is arrived at by dividing
Tier 1 and Tier 11 and Tier 111 capital by risk
weighted assets.
Table 1 shows different capital adequacy related ratios of
HDFC Bank for pre and post merger periods. HDFC Bank
reported 12.56% total CAR during pre merger period and
on an average HDFC Bank reported 15.64% of total CAR
during post merger period. Significant improvement has
been seen in total CAR ratio during post merger period as
compared to pre merger period. The HDFC Bank could
able to maintain minimum requirement of capital adequacy
ratio throughout the study period. HDFC Bank reported
this ratio on an average 9.26%.
Table 1: Capital Adequacy (C) Related Ratios
Paramveer S. Chundawat

( 38 )( 38 )( 38 )( 38 )( 38 )
Tier 1 ratio during pre merger period and it enhanced to
11.32% on an average during post merger period. Tier 2
ratio increased to 4.32% in post merger period as compared
to pre merger period i.e. 3.31%. Overall HDFC Bank could
able to improve capital adequacy related ratios during post
merger period as compared to pre merger period. It clearly
indicates that merger activity left positive impact on
performance of capital adequacy ratio of HDFC Bank. No
significant difference has been found in mean values of all
the ratios during pre and post merger period, as it is evident
from ‘t’ value.
(ii) Asset Quality: In order to check the operational
efficiency in terms of asset quality yield on advances,
yield on investment and ROI ratios have been
calculated. Besides this, One of the indicators for
asset quality is the ratio of non-performing loans to
total loans The Net NPA to net advances is more
indicative of the quality of credit decisions made by
bankers. Higher NPA is indicative of poor credit
decision-making.
Figure 2: Asset quality related parameters
Table 2 highlights the asset quality related ratios of HDFC
Bank for 8 years. HDFC Bank generated on an average
13.74% yield on advances during pre merger period, while
in post merger period it generated 13.95% yield on
advances. It seems that there is not significance change in
yield on advances due to merger activity. It is proved by ‘t’
value. During pre merger period HDFC Bank yield at 6.22%
on investment and it slightly improved and reported at
6.98% yield on investments. HDFC Bank reported
approximately 1.4% return on investment throughout the
study period. On an average 1.4% returns on asset have
been noticed during pre merger period and it marked 1.53%
during post merger period. During the entire study period
net NPA to net advances were less than 0.5% except in
2009 (0.63). Due to merger, net NPA to net advances reduce
from 0.4% to 0.33% on an average during post merger period
as compared to pre merger period. Although the feasible
difference is found among all the ratios between pre merger
and post merger, yet it is not significant because the
calculated value of t test is much less than the table value.
(iii) Management:. In order to check the operational
efficiency of management in terms of financial
aspect, the following ratios have been calculated.
Figure 2: Management related parameters
Table 2: Asset Quality (A) Related Ratios
Critical Analysis of Operational Efficiency of Merger Activity in Banking Industry: A Case Study of HDFC Bank

( 39 )( 39 )( 39 )( 39 )( 39 )
Table 3 shows management related ratios of HDFC Bank
for both pre and post merger periods. HDFC Bank’s
employees generated ‘ 0.07 million per employee during
pre merger period but it came down to ‘ 0.06 million per
employee during post merger period. HDFC Bank could
able to generate ‘ 6.69 million business per employee during
pre merger period but it came down to ‘ 5.86 million during
post merger period. Although after the merger activity
HDFC Bank could not maintain business per employee
yet significant different is not observed as it is evident by
‘t’ value. During pre merger period the management of
HDFC limited could able to generate 18.35% return on
equity, while it came down to 17.23% in post merger period.
On an average 32.97% net profit growth has been observed
during pre merger period. HDFC Bank reported 34.32%
net profit growth in post merger period. HDFC Bank
recorded on an average 28.78% growth in advances during
pre merger period, while 33.11% growth has been observed
in advances during post merger period. It clearly indicates,
due to merger activity HDFC Bank could enhance in
advances in terms of growth ratio.In order to examine,
whether the difference between pre merger and post merger
period regarding different ratios is significant or not, ‘t’
test has been administered and ultimately it was found
that there was no significance difference between pre and
post merger period.
(iv) Earnings: Earnings of banks has got special
significance in the emerging scenario as the same is
growingly being determined by their non-core
activities like investments, treasury operations,
corporate advisory services and so on. It can be
measured in erms of the following ratios:.
Figure 3: Earning related parameters
Table 4 shows earning related ratios of HDFC Banks for 8
years. Due to merger significant improvement has been
seen in post merger period as compared to pre merger
period. The EPS touched ‘ 55.9 from ‘ 32.47 in post merger
period. HDFC Bank reported 47.3% cost income ratio during
pre merger period and it increased to 49.18% during post
Table 3: Management (M) Related Ratios
Table 4: Earning (E) Related Ratios
Paramveer S. Chundawat

( 40 )( 40 )( 40 )( 40 )( 40 )
merger period. The HDFC Bank failed to maintain
benchmark of 40% during the entire study period. In pre
merger period interest expended ratio is 45.45% of interest
earned and it increased to 51.18% during post merger
period. It clearly indicates that the spread squeezed during
post merger period and bank could able to generate interest
income @ 6.75% of total funds during pre merger period. It
further enhanced to 7.86% during post merger period. On
an average bank expended 3.08% of total funds in terms of
interest during pre merger period and bank reported 4.05%
interest expended to total funds during post merger period.
Net interest margin in terms of percentage has been
observed in the range of 3.60% to 4.24% during the entire
study period. On an average bank maintained 3.83% net
interest margin during pre merger period and 4.03% in
post merger period.
The calculated value of ‘t’ for all the earning related ratios
are less than the critical value of ‘t’, so it indicates that
there is no significance difference between pre and post
merger period analysis.
(v) Liquidity: Cash maintained by the banks and
balances with central bank, to total asset ratio (LQD)
is an indicator of bank’s liquidity. In general, banks
with a larger volume of liquid assets are perceived
safe, since these assets would allow banks to meet
unexpected withdrawals.
Figure 4: Liquidity related parameters
Table 5: Liquidity (L) Related Ratios
Table 6: CAMEL Ratios of HDFC Bank
Critical Analysis of Operational Efficiency of Merger Activity in Banking Industry: A Case Study of HDFC Bank

( 41 )( 41 )( 41 )( 41 )( 41 )
To judge banks liquidity position liquidity ratios are
calculated. All the liquidity related ratios of HDFC Bank
from 2005 to 2012 are given in the above table 5. HDFC
Bank maintained 0.08% cash to total deposit during pre
merger period. In post merger period the bank maintained
0.09% of deposits as cash, with a minor improvement in
cash deposit ratio. On an average HDFC Bank 0.49% of
deposits are invested in pre merger period, while it came
down to 0.37% during post merger period.
The data of HDFC Bank given in table reveals that 6.75%
of total deposits have been used to accommodate the credit
needs of the customers during pre merger period, while it
increased to 7.67% in post merger period. Increment in
this ratio indicates the lower liquidity because higher the
ratio of loans to deposits, lesser the bank will be capable to
make additional loans. HDFC Bank provided 66.21% of
total deposits in terms of credit facility during pre merger
period, while in post merger period this credit deposit ratio
touched mark 75.08%. All the ratios of liquidity shown in
the table explain that there is not significant difference
between pre and post merger situation as it is evident by
‘t’ value. All the five aspects of CAMEL analysis technique
have been elaborated in detail in above explanation. These
five aspects related ratios have been summarized in the
following table 6.
TESTING THE HYPOTHESIS
The above table 6 shows that all the ratios of different
parameters of CAMEL analysis indicate that there is no
significant impact of merger on bank performance. It has
been examined through‘t’ test. All the calculated‘t’ values
of all ratios are less than the critical table value @ 5% level
of significance at 4 d.f. is 3.355. CAMEL model point of
view our null hypothesis is accepted i.e. merger and
acquisition does not result in synergy significantly in terms
of operational efficiency and profitability. Because the
calculated value of ‘t’ for all twenty two ratios of CAMEL
model for HDFC bank are less than table value. It clearly
indicates the difference is due to sampling fluctuation not
due to merger activity.
CONCLUDING REMARK
The capital adequacy ratio group and asset quality related
ratios indicate that HDFC Bank could get benefit from
merger activities but statistically the difference between
pre and post merger is not significant as it is proved from‘t’
test. HDFC Bank could able to improve earnings per share
due to merger activity. Profit per employee and ROE are
declined slightly in post merger period compare to pre
merger period. It may be concluded that HDFC Bank could
not get benefit of merger in terms of effective productivity
of employees. Liquidity position of HDFC Bank is slightly
improved in post merger period.
REFERENCE
Bodla B.S. and Verma Richa (2009), “Earning Quality of
Scheduled Commercial Banks in India: Bank-wise
and Sector-wise Analysis”, Prajnan, Vol. XXXVII,
No.4, January-March 2009.
Manoj P.K. (2010), “Financial Soundness of old private
sector banks in India and benchmarking the Kerala
based OPBs : “A CAMEL Approach”, American
Journal of Scientific Research, ISSN 1450-223 X Issue
11, pp. 132-149.
Mantravadi Pramod and Reddy Vidyadhar (2007),
“Relative Size in Mergers and Operating
Performance: Indian Experience”, Economic and
Political Weekly, September 29, 2007.
Nayak, K.S.B., “Five steps to Successful Mergers and
Acquisitions,” Chartered Secretary, The Institute of
Company Secretaries of India, Vol. _, No. 10, October
2011.
Prajapati Sadhna (2010), “Merger and Acquisition in the
Indian Banking System – An Overview”,
International Journal Shodh Samiksha Aur
Mulyankan, August, ISSN-0974-2832 Vol. II Issue
19 pp. 1-3.
Weston J. Fred, Chung Kwang S., Hoag Susan E., “Mergers,
Restructuring, and Corporate Control,” PHP
Learning Private Ltd., New Delhi.
Dr. Paramveer S. Chundawat
Post Doctoral Research Scholar
Faculty of Management Studies, MLSU,
Udaipur
Paramveer S. Chundawat

( 42 )( 42 )( 42 )( 42 )( 42 )
INTRODUCTION
In the modern times, the existence of the civilized world cannot be imagined without
banks. The banking activities have become not only an integral part of the human
civilization but also have directed the flow of progress over the lifetime of human
civilization so far. In today’s competitive world, banks, like any other industry, are
struggling hard to maintain the old clientele while attracting new customers. Today’s
banking industry faces several challenges, increased competition, stricter regulation,
and customers who are increasingly sophisticated, price conscious and discriminating
in evaluating banking services (Beckett et al; 2000; Calik and Balta, 2006; Fandos Roig
et al, 2006; Goode and Moutinho, 1995: Ozdemir and Trott, 2009.)
The winner in the Indian banking sector will be the player who can be aware of the
customer, fulfil customer needs and attain high levels of customer retention (Kamath et
al, 2003, PP 85).Berry (1983) viewed relationship marketing as a strategy to attract,
maintain and enhance customer relationships. Relationship marketing is to establish,
maintain and enhance relationships with customers and other partners at a profit, so
that the objectives of the parties are involved are met (Gronroos, 1994). This research
has revealed the importance of customer relationship management. Customer retention
has a significant impact on banks profitability (Newman and Crowling, 1996) a 5
percent increase in customer retention adds 25-150 percent in bottom line (Rosenberg
and Czepiel,1983) small increase in customer retention rates can lead to dramatic
increases in profits (Reichheld, 1996). Hence, adopting customer-centric strategies aimed
at maintaining and enhancing relationship with existing customer is important for the
survival of Indian banks (Roy and Shekhar, 2010).
Key words:
Customer relationship
management, Customer
loyalty, ICICI Bank, HDFC
Bank, factor analysis.
CRM and its Impact on Customer Loyalty: AnEmpirical Study on Private Banks in Odisha
Sathya Swaroop Debasish, Artta Bandhu Jena & Sabyasachi Dey
ABSTRACT
The purpose of this paper is to determine the impact of customer relationship management on customer
loyalty. The data was collected from the customers of three private sector banks- ICICI Bank, HDFC Bank
and Axis Bank across the branches located at Bhubaneswar, Cuttack and Puri. The data was collected by
using a structured questionnaire with a five point Likert scale. Statistical tools such as multiple regression,
factor analysis were used for data analysis. The study shows that there is an impact on customer
relationship management and customer loyalty. The study also noticed that banks words and promises
are reliable and the bank is fulfilling its obligation towards the customers. It is also offering them valuable
advice on how to invest is the predominant variable which has impact on customer loyalty. So the
banking sector needs to focus more on these factors, thereby increasing customer loyalty. Hence the
concept of CRM may be emphasized so that the customers are treated royally in relation to banking
services. Thus the banks need to improve the customer satisfaction in the utilization of various modern
banking services and should provide more customer friendly services to make the modern banking
activity a delight for the customer.
The Indian Journal of CommerceVol.68, No. 4, October-December 2015
( 43 )( 43 )( 43 )( 43 )( 43 )
REVIEW OF LITERATURE
Customer Relationship Management (CRM) is no longer a
new term but a reality for many organizations. The long-
term business relationships provide many potential
benefits for banks and clients. It is generally less costly for
any service firm (bank) to maintain and develop an existing
client relationship (Berry 1983). Berry (1995) stresses that
attracting new customers should be viewed only as an
intermediate step in the marketing process. Bateman &
Snell (2007) observed that CRM is a business process which
results in optimized profitability and revenue generation,
while achieving customer satisfaction. Often also known
as relationship marketing by marketing academicians,
CRM is an information technology assisted process that
establishes a collaborative environment for businesses to
analyze the buying behaviour and product/service
requirements of an individual or group of existing as well
as potential customers.
Customer loyalty is critical to the success of business in
today’s competitive market place, and banks are no
exception (Ehigie 2006) .Customer loyalty is deeply held
commitment to re-buy is or re-patronize a preferred product
(or) service in the future despite there are situational
influence and marketing efforts having the potential to
cause switching behaviour (Oliver, 1999). Some researchers
have argued that the cost of gaining a new customer could
be as high as five to six times the cost of retaining the
existing one. (Desatnick, 1998; Boldgett et al, 1995; Fundin
and Bergman, 2003; Ndubisi, 2003b). Colgate and Hedge
(2001) insisted that losing customer could have a negative
effect on a banks market share. Hence banks should retain
the customers to continue to exist in the banking sectors.
Customer loyalty and retention is the central aim of
relationship marketing and is closely related to company
profitability (Heskelt et al, 2008; Rust and Zahorik, 1993).
Customer loyalty is the feeling of attachment or affection
for a company’s people, products and services (Jones and
Sasser (1995). Customer loyalty has been considered as an
important source of long-term business success (Rust and
Zahorik, 1993) and building a relationship with a
customer is a good way to retain loyal customers in the
long term (Sheaves and Barnes, 1996). According to
Reichheld and Sasser (1990), repeat customer cost less to
serve than new buyers, benefiting firms is cost structure.
Several studies have been conducted in big cities of India
but very few notable works have been done in Odisha.
This study is intended to fill the gap by studying the impact
of CRM on loyalty in the cities of Cuttack, Bhubaneswar
and Puri in the state of Odisha.
OBJECTIVES OF THE STUDY
The main objectives of this study are:
(i) To provide an insight on CRM and its importance
in the modern banking scenario.
(ii) To measure the impact of various dimensions of
customer relationship management and its impact
on customer loyalty.
RESEARCH METHODOLOGY
In this study a descriptive research design has been
adopted to measure the impact of various dimensions of
customer relationship management and its impact on
loyalty. The targeted population of the present study were
the customers of HDFC Bank, Axis Bank and ICICI Bank
in the cities of Cuttack, Bhubaneswar and Puri. Customers
from these are banks are selected for study because these
three private banks (ICICI, HDFC and Axis) are the leading
private banks in India as per market capitalization
(moneycontrol.com). Judgemental sampling method was
used to collect the data since this study was limited to the
customers of three private banks which have been already
mentioned above. The present study used primary data
collected through a questionnaire method. The
questionnaire items were adopted from different sources.
Communication, Commitment, Competence and conflict
handling was drawn from Dwyer et al., (1987), Anderson
and Weitz (1989), Morgan and Hunt (1994), Gundlach et
al. (1985) and Selnes (1998). Questionnaire item related to
trust were adopted from Churchill and Suprenant (1982),
Crosby et al., (1990) and Moorman et al, (1983).
The questionnaire consists of two parts. The first part
consists of demographic profile of the respondents and
second part consists of various dimensions of customer’s
relationship management and loyalty. The respondents
were asked to answer each statement at five point Likert
Scale. Sampling sizes of 330 questionnaires were
distributed to the respondents, out of which 166 were
assessed as usable, yielding a response rate of 50.30
percent. With this background, this study aims to identify
whether there is any impact of customer relationship
management dimensions on customer loyalty.
Sathya Swaroop Debasish, Artta Bandhu Jena & Sabyasachi Dey

( 44 )( 44 )( 44 )( 44 )( 44 )
DATA ANALYSIS
Demographic Profile of the Respondents
Table 1 : Demographic profile of Respondents
Variables Categories No. of Respondents
Percentage
Gender
Male 115 69.28
Female 51 30.72
Age 21-30 58 34.94
31-40 47 28.31
41-50 35 21.08
51 and above 26 15.67
Educational Qualification
Graduate 69 41.57
Post Graduate 72 43.37
PhD 15 9.03
Others 10 6.03
Occupation Student 14 8.43
Part time employee 25 15.06
Full time employee 82 49.40
Business 28 16.87
Home maker 17 10.24
Annual Income ( in Rs.)
<2 lakhs per annum 58 40.32
2-5 lakhs per annum 77 43.55
>5 lakhs per annum 31 16.13
Types of Bank account
Current account 29 17.47
Savings account 64 38.55
Fixed deposits 73 43.98
The profile of the sample respondents is shown in table 1
and revealed that 69.28 percent of them were male, 34.94
percent were between 21-30 years old and 43.37 percent
had postgraduate degree as educational qualifications.
49.40 percent of the respondents were full time employees,
43.55 percent have an annual income between Rs.2 lakhs
to Rs. 5 lakhs and 43.98 percent of respondents have fixed
deposits.
RELIABILITY ANALYSIS
Reliability analysis is done to check whether the variable
used to study whether customer relationship management
dimensions would produce consistent results or not. The
calculated Cronbach Alpha cut off rate of 0.70 can prove
good reliability (Hair et al., 2009). The Cronbach Alpha for
the current study was calculated to be 0.783. So it can be
concluded that all the factors used to measure the customer
relationship management are found to be reliable.
FACTOR ANALYSIS (COMPONENT ANALYSIS)
Table No 2 indicates that the analysis of the component
matrix’s of the total four factors and their components. It is
found that the factor loadings of all the components have
been greater than 0.5.
Table 2 : Component Matrix of factors
Component
1 2 3 4
Knowledge about markets 0.795
Confidence in bank’s services
0.779
Customized service to meet
consumer’s needs
0.765
Respect towards customers 0.762
Helps customers to plan their investment
0.754
Open discussing the solutions when the problems arise
0.693
Doing efficient sales promotion activities
0.658
Providing timely and accurate information
0.724
Flexibility in catering to customer’s needs.
0.673
Banks help to avoid conflicts.
0.606
Bank fulfils its promises. 0.567
Offers valuable advice on investment to the customers.
0.531
Tries to solve the conflicts before it creates problems.
0.806
Providing authenticated information.
0.787
Bank fulfils its obligation towards its customers.
0.719
Bank words and promises are kept.
0.792
Banks remain consistent in
providing services to customers.
0.645
Note: - Extraction Method: Principal Component Analysis.
The component matrix shows that knowledge about
markets, confidence in bank services, customized service
to meet consumer’s needs, showing respect towards
customers, helping customers to plan their investment,
openly discussing solution when problem arise and
providing efficient sales promotion can be grouped into
first factor which can be termed as competence. Providing
timely and accurate information, flexibility in catering to
customer’s needs, bank helping to avoid conflicts, bank
fulfils its promises and offering valuable advice on
investment to the customers can be grouped into second
factor which can be termed as relationship
communication. Bank tries to solve conflict before create
problems, providing authenticated information and fulfil
its obligation towards its customers can be put under third
factor which is caring. Banks words and promises are kept
and banks consistent in providing services to customers
can be grouped into fourth factor which is known as trust.
CRM and its Impact on Customer Loyalty: An Empirical Study on Private Banks in Odisha

( 45 )( 45 )( 45 )( 45 )( 45 )
MULTIPLE REGRESSION ANALYSIS
To identify whether different dimensions of CRM has
strong impact on customer loyalty, multiple regression was
used.
Table 3 : Contribution of variables in the dimensions of
competence Dependent variable: Customer loyalty
scores (Y)
Independent Variables Standardized Co-efficient
t-value
Significant
Constant (a) 1.732 5.081 0.000
Knowledge about markets (X1)
0.475 5.827 0.000
Confidence in bank’s services (X2)
0.386 4.618 0.017
Customized service to meet consumer’s needs (X3)
0.627 8.214 0.000
Respect towards customers (X4)
0.237 3.335 0.029
Helps customers to plan their investment (X5)
0.316 4.183 0.023
Open discussing the solutions when the problems arise (X6)
0.052 1.136 0.275
Doing efficient sales promotion activities (X7)
0.193 2.889 0.043
R2 0.528
Level of significance = 0.05, p < 0.05
The above table (table-3) attempted to explain the
contribution of “competence” dimensions of customer
relationship management to customer loyalty. The
regression equation is given below.
Y = 1.732 + 0.475 (X1) + 0.386 (X2) + 0.627 (X3) + 0.237 (X4)
+ 0.316 (X5) + 0.052 (X6) + 0.193 (X7); Where Y is the
estimated Customer Loyalty Score.
The above equation revealed the variables of “competence”
such as knowledge about markets (X1), Confidence in
bank’s services (X2), Customized service to meet
consumer’s needs (X3) and so on are having an impact on
customer loyalty. Out of the seven dimensions of
competence, the dimension “Customized service to meet
consumers needs (X3)” has been found to have maximum
powerful impact of CRM on customer loyalty since the
coefficient value was found to be 0.627. But however, the
dimension “Open discussing the solutions when the
problems arise (X6)” was the only dimension which was
found to be insignificant where as all the rest six
dimensions of “competence” were significant and R2
indicates 0.528 change in competence explained the
variation of 52.8 percent in customer loyalty.
Table 4 : Contribution of variables in the dimensions of
relationship communication Dependent variable:
Customer loyalty scores (Y)
Independent Variables Standardized Co-efficient
t-value
Significant
Constant (a) 1.213 4.781 0.000
Providing timely and accurate information (X1)
0.086 1.137 0.165
Flexibility in catering to customer’s needs (X2)
0.254 3.119 0.026
Banks help to avoid conflicts (X3)
0.065 1.141 0.281
Bank fulfils its promises (X4)
0.297 3.256 0.022
Offers valuable advice on investment to the customers (X5)
0.329 4.188 0.018
R2 0.551
Note: Level of significance = 0.05, p < 0.05
The above table attempted to explain the contribution of
“relationship communication” dimensions of customer
relationship management to customer loyalty. The
regression equation is given below.
Y = 1.213 + 0.086 (X1) + 0.254 (X2) + 0.065 (X3) + 0.297 (X4)
+ 0.329 (X5);
where Y is the estimated Customer Loyalty Score.
The above equation revealed the variables of relationship
communication such as Providing timely and accurate
information (X1), Flexibility in catering to customer’s needs
(X2), Banks help to avoid conflicts (X3), Bank fulfils its
promises (X4) and Bank offering valuable advice on
investment to the customers (X5) are having an impact on
customer loyalty. Out of the five dimensions of relationship
communication, the dimension “Bank offering valuable
advice on investment to the customers (X5)” has been
found to have maximum powerful impact of CRM on
customer loyalty since the coefficient value was found to
be 0.329. But however, the dimensions “Providing timely
and accurate information (X1)” and “Banks help to avoid
conflicts (X3)” were the dimensions of “relationship
communication” which were found to be insignificant
where as all the rest three dimensions of “relationship
communication” were significant and R2 indicates 0.551
change in “relationship communication” explained the
variation of 55.1 percent in customer loyalty.
Sathya Swaroop Debasish, Artta Bandhu Jena & Sabyasachi Dey

( 46 )( 46 )( 46 )( 46 )( 46 )
Table 5 : Contribution of variables in the dimensions of
caring Dependent variable: Customer loyalty scores (Y)
Independent Variables
Standardized Co-efficient
t-value
Significant
Constant (a) 1.624 5.262 0.000
Tries to solve the conflicts before it creates problems. (X1)
0.061 1.129 0.211
Providing authenticated information. (X2)
0.074 1.154 0.306
Bank fulfils its obligation towards its customers. (X3)
0.587 7.941 0.000
R2 0.597
Note:Level of significance = 0.05, p < 0.05
The above table (table-5) attempted to explain the
contribution of “caring” dimensions of customer
relationship management to customer loyalty. The
regression equation for “caring” factor is given below.
Y = 1.624 + 0.061 (X1) + 0.074 (X2) + 0.587 (X3);
where Y is the estimated Customer Loyalty Score.
The above equation revealed the variables of “caring” such
as “tries to solve the conflicts before it creates problems
(X1)”, “providing authenticated information (X2) and
Banks fulfils its obligation towards its customers (X3)”.
Banks fulfils its obligation towards its customers (X3) has
been found to have maximum powerful impact of CRM on
customer loyalty since the coefficient value was found to
be 0.587. But however, the dimensions “Tries to solve the
conflicts before it creates problems” and “Providing
authenticated information” were found to be insignificant
where as the dimension “bank fulfils its obligation towards
its customers” has been found significant and R2 indicates
0.597 change in “caring” explained the variation of 59.7
percent in customer loyalty.
Table 6 : Contribution of variables in the dimensions of
trust Dependent variable: Customer loyalty scores (Y)
Independent Variables Standardized Co-efficient
t-value
Significant
Constant (a) 1.957 5.794 0.000
Bank words and promises are kept (X1)
0.606 7.283 0.000
Banks remain consistent in providing services to customers. (X2)
0.359 5.015 0.000
R2 0.632
Note: Level of significance = 0.05, p < 0.05
The above table (table-6 ) attempted to explain the
contribution of “trust” dimensions of customer relationship
management to customer loyalty. The regression equation
for “trust” factor is given below.
Y = 1.957 + 0.617 (X1) + 0.359 (X2);
where Y is the estimated Customer Loyalty Score.
The above equation revealed the variables of “trust” which
includes “bank words and promises are kept (X1)” and
“banks remain consistent in providing services to
customers. (X2)”. Bank words and promises are kept (X1)
has been found to have maximum powerful impact of CRM
on customer loyalty since the coefficient value was found
to be 0.606. Here both the components of “trust” are found
to be significant and R2 indicates 0.632 changes in “caring”
explained the variation of 63.2 percent in customer loyalty.
IMPLICATIONS OF THE STUDY
This paper attempts highlight the impact of different
dimensions of customer relationship management to
customer loyalty. From the analysis, it is concluded that
bank designs customized service to meet consumer’s needs.
Banks are offering advice to customers on investment,
banks fulfil its obligation towards its customers and bank
words and promises are kept are the predominant
variables which is having maximum powerful impact on
customer loyalty. So the banking sector needs to focus more
attention in the above stated variables, thereby increasing
customer loyalty. In addition to the above stated variables
banks should also focus on the other variables which have
also been found significant in our study. Banks should
also try to improve its functions in the areas of prompt
conflict resolution and providing timely authenticated and
accurate information to the customers because in these
areas the private banks are lacking control as evident from
this research work. Banks should also interact with
customers and should be open to them in discussing
problems and their possible solutions.
CONCLUSION
As we all know that Indian banks are becoming more and
more innovative and gradually dominating the market.
They are capturing market share from their counterpart of
the foreign bank by offering services by an innovative way.
The observation and findings of the study have helped to
CRM and its Impact on Customer Loyalty: An Empirical Study on Private Banks in Odisha

( 47 )( 47 )( 47 )( 47 )( 47 )
give useful recommendations to bank. The implementation
of the suggestion can help to improve strategies and build
competencies over that of their competitors as a straight
forward opinion from a sample of customers have been
obtained to make observations. The present study
attempted to assess the impact of various dimensions of
CRM on customer loyalty with reference to private banks
in Odisha. In future, this study can be enhanced by
studying the impact of CRM dimensions of private sector
banks and public sector banks in a comparative manner.
Similarly a study can also be conducted to study about
impact of CRM on customer loyalty of foreign banks and
co-operative banks.
REFERENCES
Anderson,E and Weitz,B (1989), “Determinants of
Continuity in Conventional industrial channels
dyads”, Marketing science, Vol.8, No.4, PP 310-23.
Athanassopolos,A, Gounaris,S and Strathakopoulos V
(2001) “Behavioural Responses to customer
satisfaction: An empirical study” European Journal
of Marketing, Vol. 35, PP 687-707.
Beckett, A. Hewer,P and Howcroft, B (2000), “An
exposition of consumer behavior in the financial
services industry”, International Journal of Bank
marketing, Vol.18, No.1, PP 15-26.
Berry, L.L (1983), “Relationship Marketing”, in Berry, L.L
Shostack.G.L and Upah.,G.D (Eds), Emerging
perspectives of Service Marketing, American
Marketing Association, Chicago, IL, PP. 25-28.
Berry, L. L. (1983). Relationship Marketing. In Berry L.,
Shostack L.G. and Upah G. D.(Eds.). Emerging
Perspectives on Service Marketing. Chicago:
American Marketing Association, 28-30.
Boldgett, J.G; Wakefield, K.L and Barnes, J.H (1995), “The
effect of customer service on customer complaining
behavior”, Journal of Service marketing, Vol.9, No.4,
PP 31-42.
Calik.N and Batla, N.F (2006), “Consumer satisfaction and
Loyalty derived from the perceived quality of
individual banking services” a field study in
Eskisehir from Turkey”, Journal of financial services
marketing , Vol.10, No.4, PP 135-149.
Churchill, G.A. and Suprenant (1982), “An investigation
into the determinants of customer satisfaction”,
Journal of marketing research, Vol.19, No.4 PP 491-
504.
Colgate, M and Hedge, R (2001), “An investigation into
the switching process in retail banking services”.
International Journal of Bank Marketing, Vol.19,
No.5, PP 201-212.
Crosby, L.A, Evans, K.R and Cowles, D (1990),
“Relationship Quality in Services Selling: An
Interpersonal Influence Perspective”, The Journal
of marketing, Vol.54, NO.1, PP 68-81.
Dawes,J. and Swailes,S. (1999), “Retention San Frontiers:
Issues for Financial Service Retailers”, International
Journal of Bank Marketing, Vol.17, NO.1 PP. 36-43.
Desatnick, R.L (1998), Managing to keep the customer,
Houghton Mifflin, Boston, M.A
Dwyer, F.R, Schurr, P.H and OH.S (1987) “Developing
Buyer-Seller Relationships”, Journal of Marketing,
Vol.51, NO.2 PP.11-27.
Fandos Roig, J.C, Garcia, J.S and Moliner Tena, M.A (2006),
“Perceived value and customer loyalty in financial
services”, Service Industries Journal, Vol.29, No.6,
PP 775-789.
Fornell, C (1992), “A National Customer Satisfaction
Barometer -the Swedish experience”, Journal of
Marketing, Vol.56, PP 6-21.
Fundin A.P and Bergman, B.L.S (2003), “Exploring the
customer feedback process; Measuring Business
Excellence, Vol.7, No.2, PP 55-65.
Gilbert, D.C, & Choi, K.C (2003), “Relationship Marketing
Practice in Relation to different bank ownership: A
study of Banks in Hong Kong”, International Journal
of Bank Marketing, 21 (3), 137-146.
Goode,M and Moutinho,L(1995), “The effects of free
banking on overall satisfaction”, International
Journal of bank Marketing, Vol.13, NO.4, PP 33-40.
Gronroos.C (1994), “From Markeitng Mix to relationship
marketing: towards a paradigm shift in marketing”,
Management Decision, Vol.32, No.2. PP 4-20.
Hair, H.H, Jr, Black, W.C, Babin, B.J Anderson, R.E and
Tatham, R.K. (2009), Multivariate Data Analysis,
Sixth Edition, Pearson Education.
Sathya Swaroop Debasish, Artta Bandhu Jena & Sabyasachi Dey

( 48 )( 48 )( 48 )( 48 )( 48 )
Heskett, J.L and Schlesinger,L(1994), “Putting the service
profit chain to work”, Harvard Business review,
Vol.86, Nos. 7/8. PP 118-129.
Kamath, K.V, Kohli, S.S, Shenoy, P.S Kumar, R, Nayak, R.M.
Kuppuswamy, P.T and Ravichandran.N (2003),
“Indian banking sector: Challenges and
opportunities”, Vikalpa, Vol.28, No.3, PP 83-99.
Ndubisi, N.O (2003 b), “Service marketing; Are perceptions
of service quality predicators of behavioural
intentions?” Academy of marketing studies, Vol.8.
NO.1, PP 37-45.
Newman, K and Cowling,A (1996), “Service Quality in
retail banking: the experience of two British Clearing
Banks”, The International Journal of Bank
Marketing. Vol.14, No.6, PP 3-11.
Oliver, R (1980), “A conqnitive model of the antecedents
and consequences of satisfaction decisions”, Journal
of marketing Research, Vol.17, No.4, PP. 460-469.
Oliver, R.L. (1999), “Whence Customer Loyalty?” Journal
of Marketing, Vol.63, PP 34-44.
Reichheld, F and Sasser, W.E Jr (1990), Zero defections:
Quality comes to service”, Harvard Business review,
Vol.68, NO.5, PP 105-111.
Reichheld, F.E (1996), The Loyalty Effect, Harvard Business
School Press, Cambridge, M.A
Reichheld,F. and Kenny, D (1990), “The hidden advantages
of Customer Retention”, Journal of Retail Banking,
Vol. XII, No.4, PP 19-23.
Roserberg, L and Czepiel, J. (1983), A Marketing Approach
for Customer Retention”, Journal Consumer
Marketing, Vol.1, No.1, PP 45-51.
Roy.S.K and Shekhar.V (2010), “Dimensional Hierarchy
of trustworthiness of financial service providers”,
International Journal of bank marketing, Vol.28,
No.1, PP 47-64.
Rust, R.T and Zahorik, A.J (1993), “Customer satisfaction,
customer retention and market share”, Journal of
retailing, Vol 69, No.2 PP 193-215.
Dr. Sathya Swaroop Debasish
Reader
Department of Business Administration
Utkal University, Vani Vihar,
Bhubaneswar
Dr. Artta Bandhu Jena
Senior Lecturer
Dept. of Business Management
F.M.University,
Balasore
Mr. Sabyasachi Dey
Lecturer
Ravenshaw Business School
Ravenshaw University
Cuttack
CRM and its Impact on Customer Loyalty: An Empirical Study on Private Banks in Odisha
( 49 )( 49 )( 49 )( 49 )( 49 )
INTRODUCTION
The concept of an efficient capital market was first added to the literature of financial
economics in the mid-1960s by Eugene Fama. Put simply, the idea is that the intense
competition in the capital market leads to fair pricing of debt and equity securities.
According to the definition by Fama, a capital market is said to be efficient if security
prices adjust rapidly to the arrival of new information and current prices fully and
instantly reflect the available information about the security. Therefore, no profit
opportunity is left unexploited and nobody is able to get any extra profit by better
forecasting the security prices. A large number of tests on the relevance and applicability
of the random walk hypothesis or weak form of EMH in the USA, UK, Germany, Italy,
Netherlands, Belgium, Switzerland, Sweden, etc., have been performed during the past
four decades. In Fama’s original article he divided the overall Efficient Market
Hypothesis (EMH) into three sub hypotheses (Reilly (2003)).
Weak Form EMH: The weak-form efficient market hypothesis assumes that current
security prices fully reflect all market based information, including the historical
sequences of prices, rates of return, trading volume data, and other market-generated
information , such as odd-lot transactions, bock trades and transactions by exchange
specialists. Because it assumes that current market prices already reflect all past returns
and any other commodities market information, this hypothesis implies that past rates
of return and other market data should have no relationship with future rate of return.
Therefore, this hypothesis contends that an investor should gain little from using any
trading rule that decides whether to buy or sell a security based on past rates of return
or any other past market data.
Semi-strong Form EMH: The semi strong-form EMH asserts that security prices adjust
rapidly to the release of all public information i.e. current security prices fully reflect all
public information. The semi-strong hypothesis encompasses the weak-form hypothesis
Key words:
Customer relationship
management, Customer
loyalty, ICICI Bank, HDFC
Bank, factor analysis.
Testing Efficiency for S&P Nifty Securities in India
Vinay K. Srivastava
ABSTRACT
The investment theory in stock market states that it is not possible to beat the market because stock
market efficiency causes existing share prices to always incorporate and reflect all relevant information
and stocks always trade at their fair value on stock exchanges, making it impossible for investors to either
purchase undervalued stocks or sell stocks for inflated prices. As such, it should be impossible to
outperform the overall market through expert stock selection or market timing, and that the only way an
investor can possibly obtain higher returns is by purchasing riskier investments. The present study
tests the weak form of the EMH on the daily closing prices of S&P Nifty securities actively traded on the
NSE over there calendar years. The paper examines autocorrelation and randomness of returns. The
results indicate supportive evidence for the weak form of efficiency of the National Stock Exchange.
The Indian Journal of CommerceVol.68, No. 4, October-December 2015
( 50 )( 50 )( 50 )( 50 )( 50 )
because all the market information considered by the weak-
form hypothesis such as security prices, rates of return,
and trading volume is made public. Public information
also includes all non-market information which includes
news about the economy, and political news. This
hypothesis implies that investors who base their decisions
on any information after it is made public should not derive
above-average risk-adjusted profits from their transactions,
considering the cost of trading, because the commodity
prices already reflects all such new public information.
1.3 Strong form EMH: The strong-form EMH contends
that security prices fully reflect all information from both
public and private sources. This means that no group of
investors has monopolistic access to information relevant
to the formation of prices. Therefore, this hypothesis
contends that no group of investors should be able to
consistently derive above-average risk-adjusted rates of
return. The strong-form EMH encompasses both the weak-
form and the semi-strong EMH. Further, the strong-form
EMH extends the assumption of efficient markets that
prices adjust rapidly to the release of new public
information to assume the perfect markets, in which all
information is cost-free and available to everyone at the
same time.
REVIEW OF LITERATURE
The concept of market efficiency is central to finance.
Primarily, the term efficiency is used to describe a market
in which relevant information is impounded into the price
of financial assets. This is the primary focus of the present
study. Sometimes, however economists use this word to
refer to operational or allocational efficiency. Operational
efficiency means the way resources are employed to
facilitate the operation of the market. Allocational efficiency
refers to the way securities are efficiently distributing
among the providers of funds (Dismon-2000). The concept
of market efficiency had been anticipated at the beginning
of the 19th century in the dissertation submitted by
Bachelier (1900). Bachelier had concluded that prices
fluctuate randomly, and later studies by Working (1934)
and Cowles and Jones (1937) were to show that US stock
prices and other economic series also share these
characteristics. These studies were largely overlooked by
researchers until the late 1950s.
First time in the early 1950’s researchers were able to use
the electronic gadgets and computers to study the behavior
of lengthy price series. The assumption of the economist
that the analysis of the economic time series by extracting
from it a long-term movement, or trend, for separate study
and then scrutinizing the residual portion for short-term
study , could not hold for long. Kendall (1953) examined
22 UK stocks and commodity prices. He concluded that in
series of prices which are observed at fairly close intervals
the data move like wandering series. Gradually these
findings were labeled as “Random Walk Theory”. With a
better understanding of price formation in the competitive
markets, the random walk model came to be seen as a set
of observations that can be consistent with the efficient
market.
Samuelson (1956), who proof that properly anticipated
prices fluctuate randomly began with the observation that
in competitive markets there is a buyer for every seller.
Samuelson asserted that the arguments like this are used
to deduce that competitive prices must display price
changes that perform a random walk with no predictable
bias.
Fama (1970) tried to formalize the theory and organize the
growing empirical evidence to support the random walk
hypothesis. He presented the theory of efficient market in
a fair game model, stating that investors should be
confident that a current market price should fully reflects
all available information about a security.
Ramachandran (1985) tested for the weak form of EMH
using weekend prices of 60 scrip’ covering the period 1976-
81. He used filter rule tests in addition to runs and serial
correlation tests, and found support for the weak form of
EMH. For filter rules tests, the filters ranged from 1 per
cent to 49 per cent and assumed transaction costs of 2.5
per cent and carry forward charges of utilizes the carry
forward facility, he compared the filter returns from a buy-
and-hold strategy and a sell-and-hold strategy. He found
that filter rule strategy provided inferior returns.
Chaudhuri (1991a) also tested the log random walk model,
but he reached at different conclusions. He used daily price
quotations of 93 actively traded shares for the period
January 1988 to April 1990 and found that 70 shares had
have significant auto correlation for 1 day lag, 17 shares
were significant for a lag of 2 days or more. The results do
not seem to support the weak form of efficiency. Mittal
(1994-95) examined the weak form efficiency of Indian
Capital Market. Having used daily closing BSE sensitive
index and BSE National Index for the period January to
September 9, 1992, he concluded that share prices in
Testing Efficiency for S&P Nifty Securities in India

( 51 )( 51 )( 51 )( 51 )( 51 )
general follow a random behavior in India and are in weak
form of efficiency.
Vaidyanathan and Gali (1994) have tested for the weak
form of efficiency of the Indian Capital Market using the
runs test, serial correlation, and filter rule test based on
daily closing prices of 10 stocks actively trading on BSE.
Evidence from all the three tests supports the weak form of
efficient market hypothesis.
David Walsh (1997) in his study employed variance ratio
test to test the random walk in the Australian Stock
Exchange covering various sampling intervals and data
period during January 1980 to December 1995. His found
that many indices of the stock exchange returned to random
walk during October Crash 1987.
Pant, B. & Bishnoy (2002) studied the behavior of the daily
and weekly returns of five indices of Indian stock market
for random walk during April 1996 to June 2001.They
found that indices of Indian Stock Market did not follow
random walk.
Wayne E. Ferson & Tie Su Andrea Heuson (2005) analysed
in his study the variations occurring in the security returns
over time by comparing them with unconditional data.
They used sum of square decomposition and focused on
monthly stock returns. The semi-strong-form provided
more reliable evidence of time variation in monthly stock
returns than their weak-form tests.
Okpara, G. C. (2010) studied the random walk hypothesis
to explore whether the stock prices fully reflect historical
price or not on Nigerian stock market data. They found
that stock market follows a random walk process and
therefore, the study ruled out the opportunity of making
excess returns in the market.
OBJECTIVE OF THE STUDY
The security market has become one of the investment
sectors against money and forex market. It can also become
one of the investment sectors for the local investors against
other line of investment. Trading in Indian security market
is considered to be as inefficient stock market. In the present
study, the author has tested for the weak form of efficiency
of the S&P Nifty securities in India. That is, we have tested
randomness using the runs test, serial correlation on the
daily closing prices of all stocks actively traded on the
National Stock Exchange.
IMPLICATIONS OF EMH
The major implication of the EMH may be summarized in
the following ways:
For Fundamental Analysis: Fundamental analysis users
earnings and dividends prospects of the firm, expectations
of future interest rates, and risk evaluating of the firm to
determine proper commodity prices. It estimates that the
intrinsic value of a security provides buy or sell decisions
depending on whether the current market price is less than
or greater than the intrinsic value. If the semi strong-form
is true, standard commodity analysis based on the publicly
available information will be useful. It is not enough to do
a good analysis of a firm; you can make money only if your
analysis is better than of your competitors because the
market price will already reflect all commonly available
information.
For Technical Analysis: Technicians believe that stock
prices exhibit trends that persist across time, whereas the
weak-form EMH states that price data are already reflected
in the stock prices. EMH proponents believe that
information is disseminated rapidly and prices adjust
rapidly to this new information. If prices fully reflect the
available information, technical trading system that relies
on knowledge and use of past trading data cannot be of
value.
For Money Management: Another implication of the EMH
is that the portfolio manager has to perform some tasks in
the efficient market. He has to diversify the portfolio, he
must achieve a level of risk appropriate for the portfolio,
as well as maintain the desired level of risk, and he should
keep the tax situation in mind and he should seek to reduce
the transaction costs to the extent it is possible and
practical.
Market Anomalies: Anomalies refer to the techniques or
strategies that appear to be contrary to an efficient market.
By definition, an anomaly is an exception to a rule or model.
The results from these anomalies are in contrast to what
would be expected in a totally efficient market, and they
cannot easily be explained.
RESEARCH METHODOLOGY
The present study analyses the daily stock price data of
S&P Nifty Company for three calendar years, commencing
January 2011 through December 2013. On computing the
daily stock returns, the weak form of efficient market
Vinay K. Srivastava

( 52 )( 52 )( 52 )( 52 )( 52 )
hypothesis has been tested with the help of non-parametric
runs test and a more scientific autocorrelation and the LJung
Box Q statistics for a higher order serial correlation test. It
is not possible to study the semi-strong and strong-form of
hypothesis easily and accurately. Therefore we went only
for studying the weak-form hypothesis. Initially, the
sample size consisted of all the 50 scrip of S&P CNX Nifty,
which is considered to be the most representative index in
India. However, due to non-availability of daily price data
of three scrip, we had to rely on daily closing price data of
only 47 scrip obtained from the NSE website
(www.nseindia.com). At the outset daily security price
return has been computed through taking the difference
between natural logarithm of average price of a day and
average price of immediate previous day. If somehow data
is not available for the immediate previous day, data for
the prior to that day has been taken into account.
Return = −
tn
t 1
PL
P
Runs Test
A run is a sequence of identical occurrence preceded and
followed by different occurrences or by none at all. The
runs test is prefer to prove the randomness of stock prices
because the test ignores the properties distribution and
more so it is a strong test for randomness in investigating
serial dependence in share price movements. It also
compares expected number of runs from actual number of
runs given a sequence of observations. Runs test examine
whether the value of one observation influences the values
taken by later observations. Actual number of runs can be
compared to the expected number of runs using the
following equation as adopted from Islam et al (2005).
Many statistical tests assume that the observations in a
sample are independent, in other words, that the order in
which the data were collected is irrelevant. If order does
matter, then the sample is not random, and you cannot
draw accurate conclusions about the population from
which the sample was drawn. Therefore, it is prudent to
check the data for a violation of this important assumption.
We can use the Runs Test procedure to test whether the
order of values of a variable is random. The procedure first
classifies each value of the variable as falling above or
below a cut point and then tests to ensure that there is no
order to the resulting sequence. The cut point is based
either on a measure of central tendency (mean, median, or
mode) or a custom value. The number of runs or ‘r ’ is a
statistics with its own special sampling distribution and
its own test. Obviously runs may be of different lengths,
and various numbers of runs can occur in a time series.
Too many or too few runs indicate that something other
than chance was at work when the items were selected
and were not chosen randomly. The sampling distribution
of ‘r ’ can be closely approximated by the normal
distribution if sample size is sufficiently large (Levin
(2002)).
The z-statistics is calculated and in usual fashion the table
values are compared with the calculated values to derive
at a conclusion.
− µ=
rZ
T
Where r = no. of runs
µ= the mean of ‘r’ statistics
T = the standard error of the ‘r’ statistics
Null hypothesis will be accepted if the value of Z statistics
is found more than -1.96 and lesser to + 1.96.
Autocorrelation
Autocorrelation establish the relationship not between two
or more different variables but between successive values
for the same variable. Autocorrelation can be used to
measure the persistence or predictability of market prices
on the basis of past market prices. It is a reliable measure
for testing of either dependence or independence of random
variables in a series. Autocorrelation tests compute the
price changes at different lagged 1;2;3;4;5;6;7;8 time
periods. As defined by Gujarati (2004), auto correlation
has is as “correlation between members of series of
observations ordered in time or space”. The
autocorrelation of a series y at lag k is estimated by:
−
= +
−= +
− −
=
−
∑
∑
T
t t kt k 1
k T2
t kt k 1
(y y) (y y)
r
(y y)
Where w´ is the sample mean of y. T is the sample size.
This is the correlation coefficient for values of the series k
periods apart. If it is nonzero, it means that the series is
first order serially correlated. Autocorrelation has
following hypotheses.
Testing Efficiency for S&P Nifty Securities in India

( 53 )( 53 )( 53 )( 53 )( 53 )
If the value of coefficient lie between ± 1.96 1/T means
autocorrelation is significant, null is rejected and values
in that series is not randomized. Non-randomization
finally leads to rejection of weak-form hypothesis.
HYPOTHESIS OF THE STUDY
H0
S&P Nifty company’s securities in India follow a
random walk, i.e. S&P Nifty company’s securities
in India are weak-form efficient;
H1
S&P Nifty company’s securities in India do not
follow a random walk, i.e. S&P Nifty companies
securities in India are not weak-form efficient;
RESULTS AND DISCUSSION
Let us discuss the results and discussion of the present
study in the following sub-headings.
Runs Test
The results of runs test applied to various sample
companies have been presented in Table 1. Total number
of runs is approximately normal. It is evident from the
table that z statistics, which have been computed to test
the significance of the difference between the number of
actual runs and the expected runs, are significant at .01
level in case of only 4 stocks out of 47 (8.5 per cent), while
3 values (6.38 per cent) are so at 0.10 level of significance.
Thus, only 14.89 per cent of the z-values turn as significant
up to 5 per cent level of significance. The table further
pinpoints that of the 47 values of standardized variable z,
27 (i.e. 57.45) per cent) reveal negative signs. The negative
signs of z values indicate that actual numbers of runs have
fallen short of the expected number of runs, but the
differences, between the tow are not significant except in
the aforesaid cases. Thus, the runs test confirms
randomness in about 85 per cent of the companies. To
determine whether day-to-day price changes follow a
random walk, we have also applied runs test to the daily
closing S & P CNX Nifty Index. The results of runs test, as
shown at serial number 48 in Table 1, reject the null
hypothesis of independence, since the standardized
variable z is found significant at 1 per cent level in this
case. Thus, the market index hints that the market is not
efficient.
Table 1: Results of Runs Test
Scrip (Company) Name
Actual No. of Runs
Expected No. of Runs
Z value
2 tailed distribution
(Sign)
ACC Ltd. 386 376.78 0.659 0.510
Ambuja Cements Ltd. 361 376.98 -1.166 0.244
Asian Paints 365 376.26 -0.874 0.382
Axis Bank Ltd. 385 375.94 0.584 0.559
Bajaj Auto Ltd. 365 375.38 -0.873 0.383
Bank of Baroda 393 373.93 1.17 0.242
BHEL 387 377.00 0.733 0.464
BPCL 367 376.93 -0.73 0.466
Bharti Airtel 390 376.4 0.949 0.343
Cairn India Ltd. 385 375.27 0.6 0.549
Cipla Ltd. 375 376.32 -0.146 0.884
Coal India Ltd. 353 375.59 -1.751 0.080
DLF Ltd. 308 310.01 -0.424 0.611
Dr Reddy’s Ltd 62 55.28 1.252 0.211
GAIL India Ltd. 366 376.01 -0.803 0.422
Grasim Industries Ltd. 358 376.73 -1.387 0.166
HCL Technologies Ltd.
337 376.93 -2.915 0.004
HDFC Bank Ltd. 353 376.93 -1.747 0.081
Hero Moto Corp Ltd. 378 375.83 0.076 0.939
HUL 364 376.99 -0.949 0.343
HDFC Ltd 367 376.48 -0.729 0.466
ICICI Bank Ltd. 375 376.45 -0.143 0.886
IDFC Ltd. 378 376.99 0.076 0.939
Indusind Bank Ltd. 380 376.68 0.224 0.823
Infosys Ltd. 352 376.78 -1.81 0.070
ITC Ltd. 349 376.04 -2.039 0.041
Jaiprakash Associates Ltd
382 376.62 0.366 0.715
Jindal Steel & Power Ltd.
342 376.14 -2.55 0.011
Kotak Mahindra Bank Ltd
327 376.68 -3.645 0.000
L & T Ltd. 371 376.62 -0.429 0.668
Lupin Ltd. 381 376.96 0.295 0.768
Mahindra & Mahindra Ltd.
380 377.00 0.438 0.661
Maruti Suzuki India Ltd.
380 373.55 0.224 0.823
NMDC Ltd. 360 375.27 -1.24 0.215
NTPC Ltd. 385 376.47 0.585 0.559
ONGC Ltd. 381 376.23 0.292 0.770
Power Grid Corpo of India
377 376.78 0.003 0.998
Punjab National Bank 379 376.4 0.147 0.883
Ranbaxy Laboratories Ltd.
351 369.24 -1.36 0.174
Reliance Industries Ltd.
388 376.87 0.803 0.422
Sesa Goa Ltd. 359 376.93 -1.309 0.191
State Bank of India 331 375.83 -3.346 0.001
Sun Pharma Ltd. 340 376.96 -2.699 0.007
TCS Ltd. 347 376.32 -2.175 0.030
Tata Motors Ltd. 359 376.5 -1.313 0.189
Tata Power Co. Ltd. 380 376.4 0.219 0.827
Tata Steel Ltd. 374 376.78 -0.219 0.827
Ultra Tech Ltd. 372 376.98 0.076 0.935
S & P Nifty 333 374.28 -3.211 0.001
Serial Correlation or Autocorrelation
The other test for the independence of successive price
change is the autocorrelation test. The results of serial
correlation test have been given in table-2.
Vinay K. Srivastava
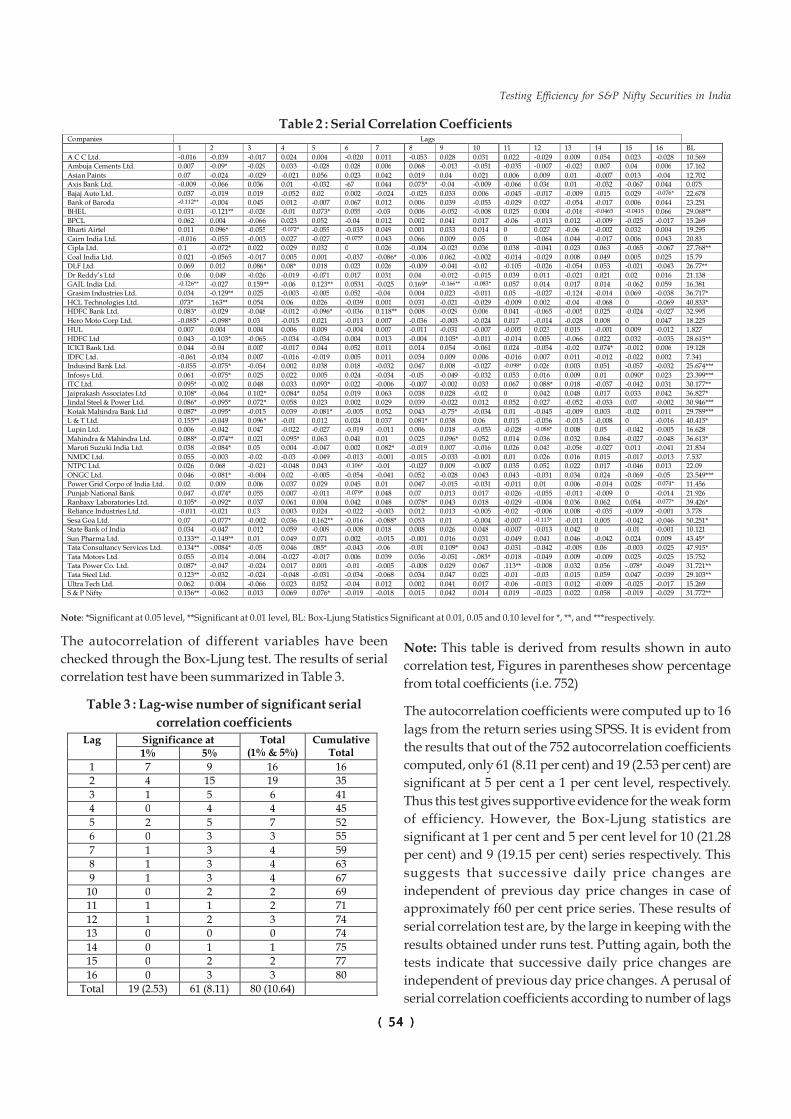
( 54 )( 54 )( 54 )( 54 )( 54 )
Table 2 : Serial Correlation Coefficients
Companies Lags
1 2 3 4 5 6 7 8 9 10 11 12 13 14 15 16 BL
A C C Ltd. -0.016 -0.039 -0.017 0.024 0.004 -0.020 0.011 -0.053 0.028 0.031 0.022 -0.029 0.009 0.054 0.023 -0.028 10.569
Ambuja Cements Ltd. 0.007 -0.09* -0.029 0.033 -0.028 0.028 0.006 0.068 -0.013 -0.051 -0.035 -0.007 -0.023 0.007 0.04 0.006 17.162
Asian Paints 0.07 -0.024 -0.029 -0.021 0.056 0.023 0.042 0.019 0.04 0.021 0.006 0.009 0.01 -0.007 0.013 -0.04 12.702
Axis Bank Ltd. -0.009 -0.066 0.036 0.01 -0.032 -67 0.044 0.075* -0.04 -0.009 -0.066 0.036 0.01 -0.032 -0.067 0.044 0.075
Bajaj Auto Ltd. 0.037 -0.019 0.019 -0.052 0.02 0.002 -0.024 -0.025 0.033 0.006 -0.045 -0.017 -0.009 0.015 0.029 -0.076* 22.678
Bank of Baroda -0.112** -0.004 0.045 0.012 -0.007 0.067 0.012 0.006 0.039 -0.053 -0.029 0.027 -0.054 -0.017 0.006 0.044 23.251
BHEL 0.031 -0.121** -0.026 -0.01 0.073* 0.055 -0.03 0.006 -0.052 -0.008 0.025 0.004 -0.016 -0.0465 -0.0415 0.066 29.068**
BPCL 0.062 0.004 -0.066 0.023 0.052 -0.04 0.012 0.002 0.041 0.017 -0.06 -0.013 0.012 -0.009 -0.025 -0.017 15.269
Bharti Airtel 0.011 0.096* -0.055 -0.072* -0.055 -0.035 0.049 0.001 0.033 0.014 0 0.027 -0.06 -0.002 0.032 0.004 19.295
Cairn India Ltd. -0.016 -0.055 -0.003 0.027 -0.027 -0.075* 0.043 0.066 0.009 0.05 0 -0.064 0.044 -0.017 0.006 0.043 20.83
Cipla Ltd. 0.1 -0.072* 0.022 0.029 0.032 0 0.026 -0.004 -0.023 0.036 0.038 -0.041 0.023 0.063 -0.065 -0.067 27.768**
Coal India Ltd. 0.021 -0.0565 -0.017 0.005 0.001 -0.037 -0.086* -0.006 0.062 -0.002 -0.014 -0.029 0.008 0.049 0.005 0.025 15.79
DLF Ltd. 0.069 0.012 0.086* 0.08* 0.018 0.023 0.026 -0.009 -0.041 -0.02 -0.105 -0.026 -0.054 0.053 -0.021 -0.043 26.77**
Dr Reddy’s Ltd 0.06 0.049 -0.026 -0.019 -0.071 0.017 0.031 0.04 -0.012 -0.015 0.039 0.011 -0.021 0.021 0.02 0.016 21.138
GAIL India Ltd. -0.126** -0.027 0.159** -0.06 0.123** 0.0531 -0.025 0.169* -0.166** -0.083* 0.057 0.014 0.017 0.014 -0.062 0.059 16.381
Grasim Industries Ltd. 0.034 -0.129** 0.025 -0.003 -0.005 0.052 -0.04 0.004 0.023 -0.011 0.05 -0.027 -0.124 -0.014 0.069 -0.038 36.717*
HCL Technologies Ltd. .073* .163** 0.054 0.06 0.026 -0.039 0.001 0.031 -0.021 -0.029 -0.009 0.002 -0.04 -0.068 0 -0.069 40.833*
HDFC Bank Ltd. 0.083* -0.029 -0.048 -0.012 -0.096* -0.036 0.118** 0.008 -0.029 0.006 0.041 -0.065 -0.005 0.025 -0.024 -0.027 32.995
Hero Moto Corp Ltd. -0.085* -0.098* 0.03 -0.015 0.021 -0.013 0.007 -0.036 -0.003 -0.024 0.017 -0.014 -0.028 0.008 0 0.047 18.225
HUL 0.007 0.004 0.004 0.006 0.009 -0.004 0.007 -0.011 -0.031 -0.007 -0.005 0.023 0.015 -0.001 0.009 -0.012 1.827
HDFC Ltd 0.043 -0.103* -0.065 -0.034 -0.034 0.004 0.013 -0.004 0.105* -0.011 -0.014 0.005 -0.066 0.022 0.032 -0.035 28.615**
ICICI Bank Ltd. 0.044 -0.04 0.007 -0.017 0.044 0.052 0.011 0.014 0.054 -0.061 0.024 -0.054 -0.02 0.074* -0.012 0.006 19.128
IDFC Ltd. -0.061 -0.034 0.007 -0.016 -0.019 0.005 0.011 0.034 0.009 0.006 -0.016 0.007 0.011 -0.012 -0.022 0.002 7.341
Indusind Bank Ltd. -0.055 -0.075* -0.054 0.002 0.038 0.018 -0.032 0.047 0.008 -0.027 -0.098* 0.026 0.003 0.051 -0.057 -0.032 25.674***
Infosys Ltd. 0.061 -0.075* 0.025 0.022 0.005 0.024 -0.034 -0.05 -0.049 -0.032 0.053 0.016 0.009 0.01 0.090* 0.023 23.399***
ITC Ltd. 0.095* -0.002 0.048 0.033 0.093* 0.022 -0.006 -0.007 -0.002 0.033 0.067 0.088* 0.018 -0.037 -0.042 0.031 30.177**
Jaiprakash Associates Ltd 0.108* -0.064 0.102* 0.084* 0.054 0.019 0.063 0.038 0.028 -0.02 0 0.042 0.048 0.017 0.033 0.042 36.827*
Jindal Steel & Power Ltd. 0.086* -0.095* 0.072* 0.058 0.023 0.002 0.029 0.039 -0.022 0.012 0.052 0.027 -0.052 -0.033 0.07 -0.002 30.946***
Kotak Mahindra Bank Ltd 0.087* -0.095* -0.015 0.039 -0.081* -0.005 0.052 0.043 -0.75* -0.034 0.01 -0.045 -0.009 0.003 -0.02 0.011 29.789***
L & T Ltd. 0.155** -0.049 0.096* -0.01 0.012 0.024 0.037 0.081* 0.038 0.06 0.015 -0.056 -0.015 -0.008 0 -0.016 40.415*
Lupin Ltd. 0.006 -0.042 0.047 -0.022 -0.027 -0.019 -0.011 0.006 0.018 -0.053 -0.028 -0.088* 0.008 0.05 -0.042 -0.005 16.628
Mahindra & Mahindra Ltd. 0.088* -0.074** 0.021 0.095* 0.063 0.041 0.01 0.025 0.096* 0.052 0.014 0.036 0.032 0.064 -0.027 -0.048 36.613*
Maruti Suzuki India Ltd. 0.038 -0.084* 0.05 0.004 -0.047 0.002 0.082* -0.019 0.007 -0.016 0.026 0.043 -0.056 -0.027 0.011 -0.041 21.834
NMDC Ltd. 0.055 -0.003 -0.02 -0.03 -0.049 -0.013 -0.001 -0.015 -0.033 -0.001 0.01 0.026 0.016 0.015 -0.017 -0.013 7.537
NTPC Ltd. 0.026 0.068 -0.021 -0.048 0.043 -0.106* -0.01 -0.027 0.009 -0.007 0.035 0.052 0.022 0.017 -0.046 0.013 22.09
ONGC Ltd. 0.046 -0.081* -0.004 0.02 -0.005 -0.054 -0.041 0.052 -0.028 0.043 0.043 -0.031 0.034 0.024 -0.069 -0.05 23.549***
Power Grid Corpo of India Ltd. 0.02 0.009 0.006 0.037 0.029 0.045 0.01 0.047 -0.015 -0.031 -0.011 0.01 0.006 -0.014 0.028 -0.074* 11.456
Punjab National Bank 0.047 -0.074* 0.055 0.007 -0.011 -0.079* 0.048 0.07 0.013 0.017 -0.026 -0.055 -0.011 -0.009 0 -0.014 21.926
Ranbaxy Laboratories Ltd. 0.105* -0.092* 0.037 0.061 0.004 0.042 0.048 0.078* 0.043 0.018 -0.029 -0.004 0.036 0.062 0.054 -0.077* 39.426*
Reliance Industries Ltd. -0.011 -0.021 0.03 0.003 0.024 -0.022 -0.003 0.012 0.013 -0.005 -0.02 -0.006 0.008 -0.035 -0.009 -0.001 3.778
Sesa Goa Ltd. 0.07 -0.077* -0.002 0.036 0.162** -0.016 -0.088* 0.053 0.01 -0.004 -0.007 -0.113* -0.011 0.005 -0.042 -0.046 50.251*
State Bank of India 0.034 -0.047 0.012 0.059 -0.009 -0.008 0.018 0.008 0.026 0.048 -0.007 -0.013 0.042 0 -0.01 -0.001 10.121
Sun Pharma Ltd. 0.133** -0.149** 0.01 0.049 0.071 0.002 -0.015 -0.001 0.016 0.031 -0.049 0.041 0.046 -0.042 0.024 0.009 43.45*
Tata Consultancy Services Ltd. 0.134** -.0084* -0.05 0.046 .085* -0.043 -0.06 -0.01 0.109* 0.043 -0.031 -0.042 -0.009 0.06 -0.003 -0.025 47.915*
Tata Motors Ltd. 0.055 -0.014 -0.004 -0.027 -0.017 0.006 0.039 0.036 -0.051 -.083* -0.018 -0.049 0.009 -0.009 0.025 -0.025 15.752
Tata Power Co. Ltd. 0.087* -0.047 -0.024 0.017 0.001 -0.01 -0.005 -0.008 0.029 0.067 .113** -0.008 0.032 0.056 -.078* -0.049 31.721**
Tata Steel Ltd. 0.123** -0.032 -0.024 -0.048 -0.031 -0.034 -0.068 0.034 0.047 0.025 -0.01 -0.03 0.015 0.059 0.047 -0.039 29.103**
Ultra Tech Ltd. 0.062 0.004 -0.066 0.023 0.052 -0.04 0.012 0.002 0.041 0.017 -0.06 -0.013 0.012 -0.009 -0.025 -0.017 15.269
S & P Nifty 0.136** -0.062 0.013 0.069 0.076* -0.019 -0.018 0.015 0.042 0.014 0.019 -0.023 0.022 0.058 -0.019 -0.029 31.772**
Note: *Significant at 0.05 level, **Significant at 0.01 level, BL: Box-Ljung Statistics Significant at 0.01, 0.05 and 0.10 level for *, **, and ***respectively.
The autocorrelation of different variables have been
checked through the Box-Ljung test. The results of serial
correlation test have been summarized in Table 3.
Table 3 : Lag-wise number of significant serial
correlation coefficients
Lag Significance at Total (1% & 5%)
Cumulative Total 1% 5%
1 7 9 16 16
2 4 15 19 35
3 1 5 6 41
4 0 4 4 45
5 2 5 7 52
6 0 3 3 55
7 1 3 4 59
8 1 3 4 63
9 1 3 4 67
10 0 2 2 69
11 1 1 2 71
12 1 2 3 74
13 0 0 0 74
14 0 1 1 75
15 0 2 2 77
16 0 3 3 80
Total 19 (2.53) 61 (8.11) 80 (10.64)
Note: This table is derived from results shown in auto
correlation test, Figures in parentheses show percentage
from total coefficients (i.e. 752)
The autocorrelation coefficients were computed up to 16
lags from the return series using SPSS. It is evident from
the results that out of the 752 autocorrelation coefficients
computed, only 61 (8.11 per cent) and 19 (2.53 per cent) are
significant at 5 per cent a 1 per cent level, respectively.
Thus this test gives supportive evidence for the weak form
of efficiency. However, the Box-Ljung statistics are
significant at 1 per cent and 5 per cent level for 10 (21.28
per cent) and 9 (19.15 per cent) series respectively. This
suggests that successive daily price changes are
independent of previous day price changes in case of
approximately f60 per cent price series. These results of
serial correlation test are, by the large in keeping with the
results obtained under runs test. Putting again, both the
tests indicate that successive daily price changes are
independent of previous day price changes. A perusal of
serial correlation coefficients according to number of lags
Testing Efficiency for S&P Nifty Securities in India

( 55 )( 55 )( 55 )( 55 )( 55 )
shows that out of 47 coefficients for price changes with
one day lag, 7 are significant at 1 per cent level and 9 at 5
per cent level. With two days lag, 4 coefficients out of 47
are significant at 1 per cent and 15 coefficients at 5 per cent
levels. However, only 6 coefficients with lag 3 are found
significant up to 5 per cent level of significance. In
aggregate, 41 929.08 per cent) coefficients from lag 1 to 3
are significant. A close look at the coefficients up to 3 lags
indicates that 67 coefficients (47.5 per cent) have negative
signs. The above finding also conforms to the random walk
theory. Further, it is noteworthy that merely 13 (3.95 per
cent) serial correlation coefficients are significant at 5
percent level with a lag 10 to 16. It indicates that prices
during the days of successive week are independent of the
price changes during the days of previous week.
CONCLUSION
The present study tasted the efficiency of 47 scrip of S&P
Nifty of national stock exchange in its weak form of efficient
market hypothesis during a period of three years from 2011
to 2013. The research employed the runs test and
autocorrelation test. The results confirmed with each other
that the NSE is efficient in the weak form. The results of the
runs test have given a clear-cut inkling of the existence of
weak form of market efficiency in the Indian securities
market. Similarly, the serial correlation analysis based on
its coefficients confirms the weak form hypothesis of
efficient market. However, the Box-Ljung (BL) statistics
gives mixed conclusions, as forty percent of the BL values
are significant, rejecting the joint hypothesis that all the
serial correlation coefficients are simultaneously equal to
zero. As the above hypothesis is accepted in case of
majority (60%) of the series, we may conclude that
successive price changes are independent of the previous
day price changes. Although, a few lower order serial
correlation coefficients of daily price changes as well as S
& P CNX Nifty disclosed some departure from random
walk hypothesis, the results of runs test conforms to the
results in favor of random-walk theory. The perception
that prices on the NSE fully reflect information reduces
the likelihood of continuously earning extra returns by
forecasting the security prices.
REFERENCES
Bachelier, L. (1900). Theory of Speculation. The Random
Character of Stock Market Prices, MIT Press, USA
Pant, B. & Bishnoy. (2002). Testing Random Walk
Hypothesis for Indian Stock Market Indices. Paper
presented at IICM conference. 1-15.
Books, C. (2002). Introductory Econometric for Finance.
Cambridge University Press, UK
Chowdhry, A. R. (1991a). Future Market Efficiency from
Cointegration Tests. The Journal of Futures Markets,
11, 577-589
Cowles, Alfred & Jones H. (1933). Some A Posteriori
Probabilities in Stock Market Action, Econometrica,
5, 309-324.
David, W. (1997).Variance Ratio tests of random walks in
Australian Stock Market Indices, University of
Western Australia, working paper,
www.af.ecel.uwa.edu.au/__data/page/9429/97-
074.pdf, pp 1-30.
Dimson E. (2000). Market Efficiency, The Current State of
Business Disciplines. 3(3), 959-970.
Fama, F. Eugene (1970). Efficient Capital Markets: A Review
of Theory & Empirical Work. Journal of Finance,
25(2), 383-417.
Fama, Eugene (1991a). Efficient Capital Markets II. Journal
of Finance, 46, 1575-617
Ferson, Wayne E., Andrea H. & Tie S. (2005). Weak-Form
and Semi-Strong-Form Stock Return Predictability
Revisited. Management Science, 51(10), 1582-1592.
Gujarati, D. N. (2004). Basic Econometrics. Tata McGraw-
Hill, Delhi
Islam S, & Watanapalachaikul S. (2005). Empirical Finance:
Modelling and Analysis of Emerging Financial and
Stock Market. Springer, Verlag, Heidelberg.
Kendall, M. (1953). The Analysis of Economic Time Series.
Journal of the Royal Statistics Society, Series A, 96,
11-25.
Levin, R. I. & David S. R. (2002). Statistics for Management.
Person Education, Delhi
Vinay K. Srivastava

( 56 )( 56 )( 56 )( 56 )( 56 )
Okpara, G. C. (2010). Stock market prices and the random
walk hypothesis: further evidence from Nigeria.
Journal of Economics and International Finance, 2(3),
49-57.
Reilly, F. K. & Brown, K. C. (2009). Investment Analysis
and Portfolio Management, Cengage Lerning, New
Delhi
Ramachandran, J. (1985). Behavior of Stock Prices: Trading
Rules, Information and Market Efficiency”. FPM
theses, IIM Ahmedabad
Vaidyanathan, R. & Gail, K. (1994). Efficiency of the Indian
capital market. Indian Journal of Finance and
Research, 5(2), 35.
Samuelson, P. (1965). Proof that Properly Anticipated Prices
Fluctuate Randomly. Industrial Management
Review, 6, 41-49.
Dr. Vinay K. Srivastava
Associate Professor
Raj Kumar Goel Institute of Technology
Ghaziabad, India
Email: [email protected]
Testing Efficiency for S&P Nifty Securities in India

( 57 )( 57 )( 57 )( 57 )( 57 )
INTRODUCTION
CSR is one of the very important aspects of a business concern because business is a
system surrounded by many sub-systems and each sub-system has its own sub-sub
system which makes a business system an entire one. Business system can’t separate it
from its sub systems which comprises of both internal and external environment of
business. Internal environment of business consisted of internal organization structure
and policies, on the other side external environment of business consists of consumers,
competitors, investors, shareholders, lenders, government, taxation authorities, stock
market, and public at large. Business is a part of the society being a profit-making
concern it has some obligation towards the society which ensures its existence in the
long-run. Sustainable development of a society makes a development of a nation possible
and CSR makes it attainable, by setting sustainable development goals by a business
enterprise within the ambit of companies act provisions regarding CSR.
OBJECTIVES OF STUDY
1. To study the concept of CSR
2. To study the significance of Sustainability
3. To study the role of CSR for Sustainability
4. To underline the importance of CSR for the Companies
5. To highlight the challenges of CSR before Corporate Sector
6. To provide recommendations and suggestions for the same
Key words:
Corporate Social
Responsibility,
Sustainability, Companies
Act, Amendment.
Corporate Social Responsibility for a SustainableChange: A Case of Hindustan Unilever Limited
M.K. Singh & Sonal Sharma
ABSTRACT
Corporate social responsibility the term comprises of corporate means company, social means community
and responsibility means obligation. Several people define this term in a several way. According to the
researchers, the corporate social responsibility is not merely a term; it shows a big responsibility cum
accountability of corporate houses towards the larger sections of the society being a part and parcel of the
society. In order to survive in a long- term in the market, companies have to fulfill their responsibilities
to the society. In an ever changing business environment and with the advent of globalization, the CSR
concept has achieved a greater importance among the corporate sector. The recent amendment in the
Companies Act, 2013 given a due importance to CSR activities by included it in the Schedule VII of the
act. This paper highlights the concept of CSR, the role, challenges before CSR projects and recommendation
for its proper implementation. The researchers, through this paper try to give the sustainability model of
corporate social responsibility by the reviews of CSR literatures. In this paper, the study mainly focuses
on the issue of sustainability for a better tomorrow.
The Indian Journal of CommerceVol.68, No. 4, October-December 2015
( 58 )( 58 )( 58 )( 58 )( 58 )
What is Corporate Social Responsibility?
Corporate Social Responsibility (CSR) is defined as “the
responsibility of corporate for their impacts on society”.
We can also define CSR as a Strategic Business
Management Concept, and charity, sponsorships or
philanthropy. To achieve CSR, Company requires
integration of social, environmental, ethical concerns into
their business operations and interactions with their
stakeholders.CSR in India has traditionally been seen as a
philanthropic activity. Philanthropic activities are only a
part of CSR, Now; the concept of CSR has changed, it has
moved from philanthropy to strategic business activity
and includes so many projects. The Companies Act, 2013
has introduced the idea of CSR by Schedule VII of the Act,
which lists out the CSR activities
THE COMPANIES ACT, 2013
Corporate Social Responsibility (Section 135)
(1) Every company having net worth of rupees five
hundred crore or more, or turnover of rupees one
thousand crore or more or a net profit of rupees five
crore or more during any financial year shall
constitute a Corporate Social Responsibility
Committee of the Board consisting of three or more
directors, out of which at least one director shall be
an independent director.
(2) The Board’s report under sub-section (3) of section
134 shall disclose the composition of the Corporate
Social Responsibility Committee.
(3) The Corporate Social Responsibility Committee
shall,—
(a) Formulate and recommend to the Board, a
Corporate Social Responsibility Policy which
shall indicate the activities to be undertaken
by the company as specified in Schedule VII;
(b) Recommend the amount of expenditure to be
incurred on the activities referred to in clause
(a); and
(c) Monitor the Corporate Social Responsibility
Policy of the company from time to time.
(4) The Board of every company referred to in sub-
section (1) shall,—
(a) After taking into account the
recommendations made by the Corporate
Social Responsibility Committee, approve the
Corporate Social Responsibility Policy for the
company and disclose contents of such Policy
in its report and also place it on the company’s
website, if any, in such manner as may be
prescribed; and
(b) Ensure that the activities as are included in
Corporate Social Responsibility Policy of the
company are undertaken by the company.
(5) The Board of every company referred to in sub-
section (1), shall ensure that the company spends,
in every financial year, at least two per cent of the
average net profits of the company made during the
three immediately preceding financial years, in
pursuance of its Corporate Social Responsibility
Policy:
Provided that the company shall give preference to the
local area and areas around it where it operates, for
spending the amount earmarked for Corporate Social
Responsibility activities:
Provided further that if the company fails to spend such
amount,
The Board shall, in its report made under clause (o) of sub-
section (3) of section 134, specify the reasons for not
spending the amount.
Explanation— for the purposes of this section “average
net profit” shall be calculated in accordance with the
provisions of section 198.
Schedule VII
COMPANIES ACT, 2013
Activities which may be included by companies in their
Corporate Social Responsibility Policies
Activities relating to: —
(i) Eradicating extreme hunger and poverty;
(ii) Promotion of education;
(iii) Promoting gender equality and empowering
women;
(iv) Reducing child mortality and improving maternal
health;
Corporate Social Responsibility for a Sustainable Change: A Case of Hindustan Unilever Limited

( 59 )( 59 )( 59 )( 59 )( 59 )
(v) Combating human immunodeficiency virus,
acquired immune deficiency syndrome, malaria and
other diseases;
(vi) Ensuring environmental sustainability;
(vii) Employment enhancing vocational skills;
(viii) Social business projects;
(ix) Contribution to the Prime Minister’s National Relief
Fund or any other fund set up by the Central
Government or the State Governments for socio-
economic development and relief and funds for the
welfare of the Scheduled Castes, the Scheduled
Tribes, other backward classes, minorities and
women; and
(x) Such other matters as may be prescribed.
ROLE OF CSR TO BUSINESS
• Business plays an important role in sustainable
development and CSR activities make it attainable.
• It makes corporate more responsible towards the
society by their consideration towards social and
environmental issues.
• When companies function in an economically,
socially and environmentally responsible manner,
and they do so transparently, it helps them to
succeed, in particular through encouraging shared
value and social permit.
• CSR acts as a driving force for an organization to
improve their actions towards the society.
• It is important for companies to understand the
importance of operating ethically and not just for
earning profits. CSR acts as competitive edge in a
today competitive business environment and
ensures survival of an organization in the long run.
CHALLENGES TO CSR PROJECTS IN INDIA
• Lack of community participation in CSR activities
• Need for capacity building of the local non-
governmental organizations
• Issues of transparency
• Promotion of CSR Activities through media- The role
of media in highlighting good cases of successful
CSR initiatives of companies among the population.
This helps to achieve recognizable factor.
Key Areas to be covered for CSR
• Health • Education • Women Empowerment • Child
Care and Development • Sanitation • Rural Development
• Agriculture • Safety and Security • Employment
• Reformation of Slums
WHAT IS SUSTAINABILITY?
Sustainability can be defined in many ways but the most
common definition is from Our Common Future, also known
as the Brundtland Report. According to this report
Sustainability means “Meets the needs of the present
without compromising the ability of future generations to
meet their own needs” (The classic definition of sustainable
development established by the U.N. Brundtland
Commission in Our Common Future (1987) ) . Sustainability
could be defined as an ability or capacity of something to
be maintained or to sustain itself. Sustainability creates
and maintains the conditions under which humans and
nature can exist in productive harmony, that permit
fulfilling the social, economic and other requirements of
present and future generations. Sustainability is important
to making sure that we have and will continue to have, the
water, materials, and resources to protect human health
and our environment.
Sustainability has emerged as a result of significant
concerns about the unintended social, environmental, and
economic consequences of rapid population growth,
economic growth and consumption of our natural
resources.
Sustainable Development Challenges before CSR
• Impact of Climate Change
• Hunger and Malnourishment
• Health and Safety Income Inequality
• Rapid Urbanization Waste Management
• Energy Requirements Financial System
The corporate managers should keep these key challenges
in mind at the time of formulation of business policies and
procedures in regard to its CSR activities for sustainability.
M.K. Singh & Sonal Sharma

( 60 )( 60 )( 60 )( 60 )( 60 )
CSR SUSTAINABILITY MODEL
Community Participation: CSR plays a very important
role in community development. Communities availed so
many benefits because of social commitments of the
corporations and thus can influence the corporations.
Their participation in CSR activities helps to develop active
and sustainable communities.
Role of Government: Government performs a significant
role in policy framework of CSR for or to achieve
sustainable development. Government creates a policy
environment which facilitates CSR activities and can make
it mandatory in order to achieve sustainable and inclusive
development of a society. Policy interventions and policy
instruments of government and the corporations need to
be coordinated for the effectiveness of CSR. Thus it helps
to achieve good corporate behavior.
Cooperation of Non-Governmental Organizations:
Increasing number of NGOs associated with the company
for CSR Activities shows their remarkable contribution
towards this area. They have played major role in solving
social and environmental issues.
Media Involvement: Social media plays a key role in how
companies shape their corporate social responsibility
(CSR) policies and present themselves as good corporate
citizens. Social media aid companies in being more socially
responsible. Company can use social media to influence
the behavior of consumers. Social media acts as an
informative mechanism to transmit the important messages
of social and environmental issues to the masses and thus
influence the community at large.
A CASE OF HINDUSTAN UNILEVER LIMITED
INTRODUCTION TO HUL
Hindustan Unilever Limited (HUL) is India’s largest Fast
Moving Consumer Goods Company with a heritage of over
80 years in India and touches the lives of two out of three
Indians. With over 35 brands spanning 20 distinct
categories such as soaps, detergents, shampoos, skin care,
toothpastes, deodorants, cosmetics, tea, coffee, packaged
foods, ice cream, and water purifiers. Its portfolio includes
leading household brands such as Lux, Lifebuoy, Surf
Excel, Rin, Wheel, Fair & Lovely, Pond’s, Vaseline, Lakme,
Dove, Clinic Plus, Sunsilk, Pepsodent, Closeup, Axe,
Brooke Bond, Bru, Knorr, Kissan, Kwality Wall’s and Pureit.
The Company has over 16,000 employees and has an
annual turnover of INR 27408 crores (financial year 2013
- 2014). HUL is a subsidiary of Unilever, one of the world’s
leading suppliers of fast moving consumer goods with
strong local roots in more than 100 countries across the
globe with annual sales of €49.8 billion in 2013. Unilever
has 67.25% shareholding in HUL.
HUL Contribution to Sustainability Unilever Sustainable
Living Plan
HUL Launched the Unilever Sustainable Living Plan in
2010, as a blueprint for Sustainable Growth. The plan sets
outs three main goals as are:
IMPROVING HEALTH AND WELL BEING
1. Health and Hygiene : Commitment
By 2020, they will help more than a billion people to
improve their health and hygiene. This will help
reduce the incidence of life-threatening diseases like
diarrhea.
Performance
• 303 million people reached by end 2013.
• 183 million people with Lifebuoy;
• 55 million with safe drinking water from Pureit;
• 52 million with toothpaste brands; and
• 13 million through Dove self-esteem programmes.
Corporate Social Responsibility for a Sustainable Change: A Case of Hindustan Unilever Limited

( 61 )( 61 )( 61 )( 61 )( 61 )
2. Improving Nutrition Commitment
By 2020, they will double the proportion of their
portfolio that meets the highest nutritional
standards, based on globally recognized dietary
guidelines. This will help hundreds of millions of
people to achieve a healthier diet.
PERFORMANCE
In 2013 31% of their portfolio by volume met the highest
nutritional standards, based on globally recognized
dietary guidelines.
Reducing Environmental Impact
1. Green House Gases Commitment
Halve the greenhouse gas impact of products across
the lifecycle by 2020. Performance
Greenhouse gas footprint impact per consumer use
has increased by around 5% since 2010.
2. Water Use Commitment
Halve the water associated with the consumer use
of their products by 2020. Performance
Water impact per consumer use has increased by
around 15% since 2010.
3. Waste and Packaging Commitment
Halve the waste associated with the disposal of
products by 2020. Performance
Waste impact has reduced by around 11% since
2010.
4. Sustainable Sourcing Commitment
By 2020 they will source 100% of agricultural raw
materials sustainably: 10% by 2010; 30% by 2012;
50% by 2015; 100% by 2020.
Performance
48% of agricultural raw materials were sustainably
sourced by the end of 2013, showing continued strong
progress towards interim milestone of 50% by 2015.
Enhancing Livelihoods
1. Fairness in the Work Place
Commitment By 2020, They will drive fairness by
further building human rights across their
operations and advancing human rights in their
extended supply chain, developing a continuous
improvement roadmap and promoting best practice.
They will create a framework for fair compensation,
and help employees take action to improve their
health (physical and mental), nutrition and well-
being. This will reduce workplace injuries and
accidents.
Performance
They will report on this commitment in 2015.
2. Opportunities for Women Commitment
By 2020, they will empower 5 million women by
advancing opportunities for women in their
operations; promoting safety; providing up-skilling;
and expanding opportunities in their retail
operations. Performance
They will report on this commitment in 2015.
3. Inclusive Business Commitments
By 2020, they will have a positive impact on the
lives of 5.5 million people by improving the
livelihoods of smallholder farmers, improving the
incomes of small-scale retailers and increasing the
participation of young entrepreneurs in our value
chain.
Performance
They will report on this commitment in 2015.
CONCLUDING REMARKS
The CSR is evolving concept includes corporate
responsibility, corporate accountability, corporate ethics,
corporate governance, sustainability and so on. Growing
recognition of corporate activities of companies and its
significant impact on its employees, customers, community
and environment leads to corporate sector to be more
concerned about its CSR. Effective implementation of
corporate social responsibility requires participation of
M.K. Singh & Sonal Sharma

( 62 )( 62 )( 62 )( 62 )( 62 )
all stakeholders who are directly or indirectly associated
with the company. The company should develop an
organizational culture which has a policy for socially
responsible behavior, and there should be a regular
monitoring mechanism for its continuous improvement.
The organization should evaluate the social and
environmental impact of its activities. The organization
should maintain a record of all its CSR activities for the
purpose of corrective and timely measures. For proper
implementation CSR policy, the organization should follow
inclusive policy. This process ensures the success of CSR.
Socially responsible behavior helps to achieve
sustainability. This in turn ensures the survival of business
in the long run.
RECOMMENDATIONS
• The corporate top level of management should
incorporate sustainable development goals to the
main goals of an organization in order to achieve
sustainability.
• Constitute a separate committee consisted of various
experts from different fields for innovation and
research in the area of sustainability with corporate
social responsibility.
• There must be inclusive policies in a business
enterprise in concerned to social and environmental
issues.
• The corporations has to define their role in regard to
sustainability, a major challenge before corporate
managers to meet the needs of the present generation
without compromising the ability of the next
generations to meet their own needs.
• The corporations should keep in touch with
changing business conditions and change their
plans and policies accordingly.
• Maintain a good and cordial relationship with
employees, customers, investors, suppliers, and
public at large to ensure its success.
• In order to achieve sustainability, a major
transformation is required in terms of leadership
role and approaches to effectively deal with this
global issue.
• Integrated strategy formulation is necessary for
dealing with variety of societal as well as business
issues.
• The corporations should view significant impact of
their business activities socially, economically and
ecologically being a responsible business concern.
• The corporations should be committed to their
social role and responsibility and also obliged for
that.
• Ethical behavior is a prerequisite for strategic CSR
to maintain its corporate identity.
• Corporate social responsibility acts as a movement
for sustainable development, so corporations should
understand the dynamics and set their drivers for
positive and significant results.
• In a global society, accountability is a key challenge
before corporations. CSR requires accountability by
all.
REFERENCES
BOK Derek Curtis (2009), “Beyond the Ivory Tower: Social
Responsibilities of the Modern University”, Harvard
University Press, ISBN: 0674028465,
9780674028463, 328 pages.
D’Amato Alessia Henderson Sybil Florence Sue (2009),
“Corporate Social Responsibility and Sustainable
Business: A Guide to Leadership Tasks and
Functions” Center for Creative Leadership, 102
pages, ISBN 978-1-60491-063-6.
Gabriel Odinioha Justin M., George Wadike (2013), “Social
Responsibility Performance of Educational
Institutions of Higher Learning in Nigeria”,
International Journal of Asian Social Science, Vol.No.3,
Issue No. 3, pp. 552-562.
Hasrouni Layal (2012), Cultivating Values How business
schools can plant the seeds of change, Responsible
Business, July - September, pp.56-65.
Hawkins David E. (2006), “Corporate Social
Responsibility: Balancing Tomorrow’s
Sustainability and Today’s Profitability”, Palgrave
Macmillan, ISBN: 0230625819, 9780230625815, 296
pages.
Corporate Social Responsibility for a Sustainable Change: A Case of Hindustan Unilever Limited

( 63 )( 63 )( 63 )( 63 )( 63 )
Hohnen Paul (2007), Corporate Social Responsibility An
Implementation Guide for Business, International
Institute for Sustainable Development (IISD), 115
pages, ISBN 978-1-895536-97-3.
Musharbash Deena (2012), “CSR Education in the UAE
Paving the way to sustainable change”, Responsible
Business, July - September, pp.66-67.
Nemerowicz Gloria, Rossi Eugene (2014), “Education for
Leadership and Social Responsibility”, Routledge,
ISBN: 1317856139, 9781317856139, 181 pages.
PWC (2013), Handbook on Corporate Social
Responsibility in India, India, 29 pgs.
Stark Wolfgang, Stockmann Kim & Tewes Stefan, “A Need
To Fill The Gap: Is There Enough Institutional Social
Responsibility (ISR) in German Universites?”
University of Duisburg-Essen, Germany.
Tschopp Daniel (2012), “The Institutional Promotion of
Corporate Social Responsibility Reporting: Second
Tier Institutions”, Las Vegas International Academic
Conference, Las Vegas, Nevada USA.
Tschopp Daniel, Barney Doug, Murphy Patrick Ryan
(2012), “The Institutional Promotion of Corporate
Social Responsibility Reporting: Second Tier
Institutions”, Journal of Academics and Business Ethics,
March, Vol. No. 5, pp. 1-17.
Waddock, Sandra. 2006. “Building the Institutional
Infrastructure for Corporate Social Responsibility.”
Corporate Social Responsibility Initiative, Working
Paper No. 32. Cambridge, MA: John F. Kennedy
School of Government, Harvard University.
Hindustan Unilever Limited (2013), Unilever Sustainable
Living Plan- India Progess 2013.
Hindustan Unilever Limited (2013), Annual Report 2013-
14 - Making Sustainable Living Commonplace.
Prof. (Dr.) M.K. Singh
Head & Dean
University Department of Commerce
and Business Management
Vinoba Bhave University Hazaribag
E-Mail- [email protected]
Dr. Sonal Sharma
Post Doctoral
Fellow University Grants Commission
New Delhi
Email: [email protected]
M.K. Singh & Sonal Sharma

( 64 )( 64 )( 64 )( 64 )( 64 )
INTRODUCTION
During last few years the linkage between exchange rates and stock prices has received
a significant attention of academician and policy makers, especially after adoption of
floating rate regime and opening of closed economy for cross border transactions.In
Indian context,Adoption of LPG (Liberalisation, Privatisation and Globalisation) Policy
in the year 1991 to save our economy from the great crisis has encouraged more cross-
border transactions. As a corollary,many Indian corporate have started their business
with cross border nations. This resulted their business transactions to be done in more
currencies. As the currency market is extremely volatile and highly unpredictable and
also tricky in nature, it exposes them to currency risk. Prior studies show a mix evidence
of this relationship between exchange rate and stock market. Like Bahmani-Oskooee
and Sohrabian (1992) found there is a bi-directional causality among the S&P 500
index and effective dollar exchange rate but there is absence of long run relationship
between two variables. In another study, Nautiyal and Kavidayal (2014) found that
there is absence of granger causality between these two variables; still these variables
are interrelated both in short run and long run in Indian market. During the Period of
Asian crisis, the stock price and currency depreciation has shown as bi-directional
causality (Granger, Huaong and Yang, 2000). Since then curiosity have raised to find
out both short and long run relation between proposed variables. In an interesting
study by Inci and Lee (2014) which examined the relation between stock return and
exchange rate changes in European countries along with the potential business cycle
effect and asymmetric effect of exchange rate changes on stock returns. Their finding
shows the lagged variables of exchange rate has a significant impact on the stock
prices. Also applying Granger causality test they found bi-directional causality between
these two variables.
In this context, another area of asymmetric cross market volatility spillover has also
received a significant attention these days. The recent fluctuations in exchange rate
Key words:
Exchange rate dynamics,
Indian Stock market, VAR,
Granger Causality, IRFs
Dynamic Relationship Between Stock Priceand Exchange Rate Changes: Evidence from IndianMarket
Gnyana Ranjan Bal and Amit Manglani
ABSTRACT
The modern era of finance is inter-twined with Global business pacts and relations. With the ever
increasing global trade and transactions, multi-national corporations are at greater exposure to exchange
rate risk. At the same time, their cross-border transactions also have impact on Stock market returns.
Both the stock prices and exchange rate changes have considerable effect on the corporate’s prospects and
hence, many of the modern day thinkers are trying to establish a relation between these two variables for
precise prediction and outright intelligence for decision-making. The present study tries to examine
relationship between these two variables in context of Indian market. For this, the Nifty Fifty returns
have been examined with three different exchange rates by using VAR, Granger Causality, and Impulse
Response Function.
The Indian Journal of CommerceVol.68, No. 4, October-December 2015

( 65 )( 65 )( 65 )( 65 )( 65 )
have a major effect on trading pattern & direct the
perception of investors due to global competitiveness of
the firms. This change has a major impact on multinational
firms. Also we can say that this exposure is not only limited
to MNCs also to domicile firms. Kanas (2000) finds evidence
of volatility spillover from stock market to exchange rate
changes in five countries US, the UK, Japan, France and
Canada (except Germany out of study of six countries) .
The studies finds that stock return spillover are symmetric
i.e. both good and bad news have same impact. Francis,
Hasan and Hunter (2002) studied volatility between the
equity and currency markets. Also they studied relation
between international equity markets underwent a change
because of changes in the volatility of the currency market.
In bi-directional analysis they found that volatility of
currency market is predicted by equity market but weak
relationship in case of reverse. After the year 1987 the cross-
correlations has been decreased between U.S and other
major equity markets. Dungey and Martin (2007) studied
spillovers and contagion across different equity and
currency markets during the East Asian crisis. By studying
transmission of volatility across the markets the study finds
evidence of larger spillover effect over contagion effect
during East Asian crisis. Another study by Abdalla and
Murinde (1997) found uni-directional causality from
exchange rate to stock prices in case of India, Korea and
Pakistan except Philippines. The similar uni-directional
causality is supported by Kose, Dogany and Karabacak
(2010) in case Turkish financial market.
Similar studies have been made in reference to Indian
market in this regard like, Panda and Deo (2014) studied
the cross market volatility among Indian stock and foreign
exchange market. By taking data from 2nd April 2004 to
30th March 2012,they find the bi-directional volatility
spillover is higher during the post subprime crisis period
as compared to pre-crisis period. Further their study shows
the causality is more significant in case of USD as
compared Euro currency.Apte (2001) studied the volatility
and spillover effect between stock returns and exchange
rates. The findings of the study show that volatility
spillover effect surprises from stock market to foreign
exchange market. Another study by Saha and Chakrabati
(2011) studies the volatility spillover and asymmetric effect
between Indian stock market and foreign exchange market.
They found evidence of volatility spillover among the
market. Also the similar evidence has been found by Ghosh
(2012) in the study of volatility spillover between stock
and foreign exchange market in India. With reference to
causality Nautiyal and Kavidayal (2014) found evidence
of no bi-direction causal relation among the stock market
return and exchange rates
The present paper attempts to revisit the dynamic relation
between stock market and foreign exchange market. We
use daily rate changes of Nifty fifty index and three
exchange rates that are USD, GBP and Japanese YEN. The
dynamic impact of lag exchange rate changes on stock
market has been analysed by estimating VAR. Further
Granger causality has been used to find out causal relation
among stock and foreign exchange market. In addition to
above Impulse response function has been implemented
to examine the shock of error terms of lag variables on
endogenous variables. We found the evidence of dynamic
relationship among exchange rate and stock market. The
results of granger causality shows the presence of bi-
direcational causality among the nifty fifty index and two
exchanges rates i.e. USD and GBP , with an exception to
YEN of uni-directional causality. The contribution of the
study is more significant especially for multi-nationals,
policy makers, and forex dealers who may be engaged in
hedging activities to mitigate their risk.
Dynamic Relationship between Exchange Rate and Stock
Market
The prior studies show a mix evidence of relationship
between exchange rates and stock market. Among different
studies the weak relationship was supported by Griffin
and Stulz (2001) etc. while other studies like Smith (1992)
and Dominguez and Tesar (2006) Doukas et al. (1999)
Canova and De nicolo’ (1995) support the strong
relationship. In this context there are two theories
explaining the relationship:
Classical or Traditional Economic Approach.
The Traditional approach says that the volatility in the
currency market will bring changes in balance of trade
and the gross output of the country. This change will affect
the present and future cash flows of the companies, as
result will affect the share prices. For example, the
depreciation of home currency will encourage the
companies to engage in export oriented activities and raise
the profit and as a consequent the stock price will rise and
vice versa (see for Dornbusch and Fisher, 1980).
Gnyana Ranjan Bal and Amit Manglani

( 66 )( 66 )( 66 )( 66 )( 66 )
Portfolio Approach of Exchange Rate Determination
As per portfolio balance approach to exchange rate
determination the exchange rate is trade-off between
demand and supply of asset allocation. Thus the change
in demand and supply of asset will change the equilibrium
point of exchange rate. Suppose the stock price of one
individual increases, then it will increase his total wealth
and demand for money, which will give rises to interest
rate. The rising rate will attract more foreign capital. Thus
domestic exchange rate will rise up because of higher
demand. It will cause transformation of return volatility
into volatility spillover (Phylaktis and Ravazzolo, 2002).
As per the support through economic theories, following
the same line with Inci and Lee (2014) we explain the
dynamic relation in the following equation (1).
k
it 1 1 t ij t j itj 0
R SM EX −=
= α + α + β + ε∑
In the above equation itR indicates stock return, tSM is
market return, t jEX − change in exchange rate, itε error
terms. In the equation (1) if we include the lagged variable
of exchange rate changes, then the equation can be rewrite:
k
it 1 1 t ij t j itj 1
R SM EX −=
= α + α + β + ε∑
DATA AND METHODOLOGY
The sample period ranges from 1st April, 2006 to 31st March,
2015. The daily returns of CNX Nifty fifty index has been
taken for the study. Three exchange rates namely USD,
GBP and YEN have been taken from the Bloomberg
database. The data for study have been standardized by
removing all the variables of such period in which any
one variable was found missing. All the variables have
been log-lineared by taking their natural log. The change
for different variables like Stock return( SMR), USD
changes (USDR), YEN changes (YENR) and GBP changes
(GBPR) has been calculated as follows, where Pt price at t
period and Pt-1
price at t-1 period and Ln natural log:
t
t 1
PLn
P −
In order to examine the dynamic relation between the
exchange rate and stock market, Vector Auto Regression
(VAR) estimates has been employed. According to Madalla
(2007), if yt is affected by its lag variables y
t-1, yt
-p, then a
VAR can be written as:
t 1 t 1 p t p ty A y ... A y− −= + + + ε (3)
In equation:3 VAR consists of three endogenous variables
and p lags where ty and its lagged values, and
tε are
1k × vectors and are k k× matrices of
constants to be estimated .In our case by taking lag of Stock
return (SM) and Exchange rate (EX) the following VAR
has been derived:
SM SM EX
(4)
VAR Lag Order Selection Criteria
Lag length on the basis of Schwarz information criterion
(SC) and Hannan-Quinn information criterion (HQ) is
being chosen for the study. Lag length is most important
factor as high lag length indicates more standard error as
it consumes more degree of freedom and lower indicates
biasness in result.
Granger Causality
The granger causality shows causal relationship between
variable. In granger causality we are taking null hypothesis
that there is no casual relation exists between the variables.
Here it will show whether the variables used above are
unidirectional or bidirectional causing each other.
j k j k
it i ij it j ij t j itj 1 j 1
SM SM EX= =
− −= =
= α + γ + β + µ∑ ∑ (5)
j k j k
it 1 ij it j ij t j itj 1 j 1
EX SM SM= =
− −= =
= α + δ + ϑ + ε∑ ∑ (6)
Here, SM is stock return, EX=Exchange rate, itµ and itε
are assumed to be serially uncorrelated with zero mean
and finite co-variance matrix.
Here, Null hypothesis is lagged exchange rates in the
equation is zero that is ij 0β = for J=1, 2 ….k. Here if the
null hypothesis is rejected (i.e. ij 0β ≠ ) then exchange rate
granger causes stock returns. Similarly in second equation
if the ij 0ϑ ≠ then stocks return granger causes exchange
rate.
Dynamic Relationship Between Stock Price and Exchange Rate Changes: Evidence from Indian Market

( 67 )( 67 )( 67 )( 67 )( 67 )
Impulse response function
In impulse response we come to know the whether one
variable is affected by the shock of another and when. It
will show the direction of changing of variables. Here, we
can analyze whether there is upward or downward
movement.
RESULT AND DISCUSSION
Unit Root test
Table 1 : Results of Unit Root Test
Variable ADF PP
SMR -44.38904*** -44.32736***
USDR -44.39708*** -44.59556***
GBPR -34.92066*** -44.70390***
YENR -44.35120*** -44.27833***
*** indicates significant @ 1% level
For estimating VAR, it is essential that all the variables
should be stationary. The study test stationarity of different
variables in the basis of ADF and PP test. In the table: 1. we
can see that all variables are stationary at 5% level of
significance. At level the statistical value is less than critical
value so the null hypothesis of non-stationarity has been
rejected in case of all variables, thus all variables are
stationary.
Lag length selection criteria
Table 2 : VAR Lag Order Selection Criteria
VAR Lag Order Selection Criteria
Endogenous variables: LN_SMR LN_USDR LN_YENR
LN_GBPR
Exogenous variables: C
Sample: 3/02/2006 3/31/2015
Included observations: 2200
Lag LogL LR FPE AIC SC HQ
0 40410.47 NA 1.31e-21 -36.73316 -36.72280* -36.72937*
1 40440.60 60.13090 1.29e-21 -36.74600 -36.69422 -36.72708
2 40456.39 31.44964 1.29e-21 -36.74581 -36.65260 -36.71175
3 40473.61 34.22092 1.29e-21* -36.74691* -36.61228 -36.69772
4 40485.66 23.92883 1.30e-21 -36.74333 -36.56727 -36.67900
5 40497.74 23.91619 1.30e-21 -36.73976 -36.52227 -36.66029
6 40513.84 31.83685 1.30e-21 -36.73985 -36.48093 -36.64524
7 40519.39 10.94788 1.31e-21 -36.73035 -36.43001 -36.62060
8 40535.80 32.32876* 1.31e-21 -36.73072 -36.38895 -36.60584
* indicates lag order selected by the criterion
LR: sequential modified LR test statistic (each test at 5%level) FPE: Final prediction error
AIC: Akaike information criterion
SC: Schwarz information criterion
HQ: Hannan-Quinn information criterion
The appropriate lag length is for applying different test
has decided in the basis of Schwarz information criterion
and Hannan-Quinn information criterion. In the above
table we can see that in the basis of SIC and HQ 0 lag is
appropriate for carrying the further analysis.
Granger Causality Test
Table 3 : Results of Granger CausalityENDOGENOUS
VARIABLE LAGGED ENDOGENOUS VARIABLE
SMR USDR GBPR YENR TOTAL
SMR 8.649887** 5.838682* 3.771450 16.66394**
USDR 7.566404** 6.152363** 1.368399 16.27835**
GBP 7.423969** 0.513991 2.754542 9.670856
YENR 4.135515 13.39786** 1.949794 26.65390***
***, **, and * indicates significance at 1%, 5% and 10%
respectively
The table: 3 show granger causality between different
variables. The granger causality shows whether one causes
other or not and also in direction of causality. In case SMR,
there is causal relation with USDR and GBPR. It means
both USDR and YENR causes Stock market return. In case
of USDR, both SMR and GBPR have causal relation. In
case of GBPR only SMR causes it in case of YENR only
USDR causes it. From above table it is clear that there is bi-
directional causality exists between SMR and USDR, SMR
and GBPR, but no causality in case SMR and YENR.
Impulse Response Function
The response of stock market to the shock of USDR can
observe in fig.1. from the period one to three but later on
the response does not seems to be significant. While the
response of stock market to GBP is seen up to fourth period.
Similarly both USDR and GBPR have reacts to the shock
of stock market. The same evidence we can see in granger
causality. Among other variables response seems to be less
significant.
Gnyana Ranjan Bal and Amit Manglani

( 68 )( 68 )( 68 )( 68 )( 68 )
-.0005
.0000
.0005
.0010
.0015
.0020
1 2 3 4 5 6 7 8 9 10
Response of LN_SMR to LN_USDR
-.0005
.0000
.0005
.0010
.0015
.0020
1 2 3 4 5 6 7 8 9 10
Response of LN_SMR to LN_YENR
-.0005
.0000
.0005
.0010
.0015
.0020
1 2 3 4 5 6 7 8 9 10
Response of LN_SMR to LN_GBPR
-.0008
-.0004
.0000
.0004
.0008
.0012
1 2 3 4 5 6 7 8 9 10
Response of LN_USDR to LN_SMR
-.0008
-.0004
.0000
.0004
.0008
.0012
1 2 3 4 5 6 7 8 9 10
Response of LN_USDR to LN_YENR
-.0008
-.0004
.0000
.0004
.0008
.0012
1 2 3 4 5 6 7 8 9 10
Response of LN_USDR to LN_GBPR
-.008
-.004
.000
.004
.008
.012
1 2 3 4 5 6 7 8 9 10
Response of LN_YENR to LN_SMR
-.008
-.004
.000
.004
.008
.012
1 2 3 4 5 6 7 8 9 10
Response of LN_YENR to LN_USDR
-.008
-.004
.000
.004
.008
.012
1 2 3 4 5 6 7 8 9 10
Response of LN_YENR to LN_GBPR
-.0004
.0000
.0004
.0008
.0012
.0016
1 2 3 4 5 6 7 8 9 10
Response of LN_GBPR to LN_SMR
-.0004
.0000
.0004
.0008
.0012
.0016
1 2 3 4 5 6 7 8 9 10
Response of LN_GBPR to LN_USDR
-.0004
.0000
.0004
.0008
.0012
.0016
1 2 3 4 5 6 7 8 9 10
Response of LN_GBPR to LN_YENR
Response to Cholesky One S.D. Innovations
Fig.1. Impulse Response Functions
Dynamic Relationship Between Stock Price and Exchange Rate Changes: Evidence from Indian Market

( 69 )( 69 )( 69 )( 69 )( 69 )
CONCLUSION
Our paper re-examines the relationship between Indian
stock market and foreign exchange market. For which the
rate changes of Nifty fifty and three exchange rates (USD,
GBP and YEN). We analyse both uni-directional and bi-
directional relationship between stock price and exchange
rate by applying granger causality. The findings of the
study shows the lagged variables of exchange rate have a
significant impact on stock market. We find evidence of bi-
directional causality exists between stock market and two
exchange rates namely USD and GBP. However there is an
exception to YEN. This may be because the select index
consists only some specific companies, so these companies
may not have significant dealings in this currency. In the
other hand second reason may be the company have
effectively hedged the exposure of dealing in YEN, so any
changes in exchange rate will not affect the profitability of
the companies, thus stock price may not be affected. Also
the study shows the impact shock of errors terms of one to
another through impulse response function. The paper
will significantly contribute to the existing literature in
this context. The study will help to different practitioner
in forex market and regulatory bodiessuch as MNCs,
government, Hedgers and other policy makers. With the
impact of this paper now the policy makers have to frame
forex policies very carefully as it will also affect the stock
market of the country. And especially those companies
having trading in multiple currencies have to carefully
diversify their forex exposure to avoid adverse impact of
exchange rate volatility.
REFERENCES
Abdalla, I., &Murinde, V. (1997). Exchange rate and stock
price interactions in emerging financial markets:
evidence on India, Korea, Pakistan and the
Philippines. Applied Financial Economics, 7(1), 25-
35.http://dx.doi.org/10.1080/096031097333826
Apte P (2001). The interrelationship between stock markets
and the foreign exchange market. IIM Bangalore,
Working Paper number 169. http://
www.iimb.ernet.in/research/ sites/default/files/
wp.iimb_.169.pdf.
Bahmani-Oskooee, M., &Sohrabian, A. (1992).Stock
prices and the effective exchange rate of the dollar.
Applied Economics, 24(4), 459-464.http://dx.doi.org/
10.1080/00036849200000020
Bartram, S., &Bodnar, G. (2009). No place to hide: The
global crisis in equity markets in 2008/2009. Journal
Of International Money And Finance, 28(8), 1246-1292.
http://dx.doi.org/10.1016/j.jimonfin.2009.08.005
Bonga-Bonga, L., &Hoveni, J. (2013). Volatility Spillovers
between the Equity Market and Foreign Exchange
Market in South Africa in the 1995-2010 Period.
South African Journal Of Economics, 81(2), 260-274.
http://dx.doi.org/10.1111/saje.12001
Canova, F., & De Nicolo’, G. (1995). Stock returns and real
activity: A structural approach.European Economic
Review, 39(5), 981-1015. http://dx.doi.org/10.1016/
0014-2921(95)00017-8
Clements, K., Izan, H., & Lan, Y. (2013). Volatility and
stock price indexes. Applied Economics,45(22), 3255-
3262. http://dx.doi.org/10.1080/
00036846.2012.703315
Dominguez, K.M.E. and Tesar, L.L. (2006). Exchange rate
exposure’, Journal of International Economics, Vol. 68,
pp. 188–218
Dornbusch, R., & Fischer, S. (1980). Exchange rates and
the current account.The American Economic Review,
960-971.
Doukas, J., Hall, P.H. and Lang, L.H.P. (1999).The pricing
of currency risk in Japan’, Journal of Banking and
Finance, Vol. 23, pp. 1–20.
Dungey, M., & Martin, V. (2007).Unravelling financial
market linkages during crises. J. Appl. Econ., 22(1),
89-119. http://dx.doi.org/10.1002/jae.936
Francis, B. B., Hunter, D.M. & Hasan, I. (2002). Return
Volatility Linkages in International Equity and
Currency Markets, Bank of Finland Discussion
Papers No. 9-2002
Ghosh, S. (2012) Volatility spillover in the foreign exchange
market: the Indian experience. Advanced studies in
international economic policy research. Kiel Institute
for the World economy Working Paper number 460,
pp 1–26.
Granger C, Huang B-N, Yang C-W (2000). A bivariate
causality between stock prices and exchange rates:
evidence from recent Asian flu. Q J Econ Financ
40:337–354.
Gnyana Ranjan Bal and Amit Manglani
( 70 )( 70 )( 70 )( 70 )( 70 )
Griffin, J.M. and Stulz, R.M. (2001). International
competition and exchange rate shocks: a cross-
country industry analysis of stock returns’, Review
of Financial Studies, Vol. 14, pp. 215–41.
Inci, A., & Lee, B. (2011).Dynamic Relations between Stock
Returns and Exchange Rate Changes. European
Financial Management, 20(1), 71-106. http://
dx.doi.org/10.1111/j.1468-036x.2011.00621.x
Islami, M., &Welfens, P. (2013).Financial market
integration, stock markets and exchange rate
dynamics in Eastern Europe. Int Econ Econ Policy,
10(1), 47-79. http://dx.doi.org/10.1007/s10368-
013-0229-8
Kanas, A. (2000). Volatility Spillovers Between Stock
Returns and Exchange Rate Changes: International
Evidence. J Bus Fin &Acc, 27(3-4), 447-467. http://
dx.doi.org/10.1111/1468-5957.00320
Kenourgios, D., &Padhi, P. (2012). Emerging markets and
financial crises: Regional, global or isolated shocks?.
Journal Of Multinational Financial Management, 22(1-
2), 24-38. http://dx.doi.org/10.1016/
j.mulfin.2012.01.002
Kose, Y., Dogany, M., & Karabacak, H. (2010). On the
causality between stock prices and exchange rates:
evidence from Turkish financial market. Problems
And Perspectives In Management, Volume 8(Issue 1).
Lee, B.S. and Suh, J. (2011). Exchange rate changes and
the performance of multinationals. European
Financial Management (forthcoming).
Madalla, G. S. (2007). Introduction to econometrics. New
Delhi: Wiley India Pvt. Ltd.
Md-Yusuf, M., & Rahman, H. (2013).Granger Causality
Relationship between Malaysia Equity Market and
Exchange Rate Volatility. International Journal Of
Trade, Economics And Finance, 19-24. http://
dx.doi.org/10.7763/ijtef.2013.v4.254
Mukherjee, K.N. & Mishra, R.K. (2008). Stock Market
Integration and Volatility Spillover:India and its Major
Asian Counterparts - Munich Personal RePEc Archive.
Retrieved 8 September 2015, from http://
mpra.ub.uni-muenchen.de/12788/
Nautiyal, N. & Kavidayal, P.C. (2014). Causal Nexus
Between Stock Market Returns and Exchange Rate:
Evidence from National Stock Exchange. Madras
University Journal of Business and Finance, Vol.2 No.1.
Panda, P., & Deo, M. (2014). Asymmetric cross-market
volatility spillovers: evidence from Indian equity and
foreign exchange markets. Decision, 41(3), 261-270.
doi:10.1007/s40622-014-0044-2
Phylaktis, K., &Ravazzolo, F. (2005).Stock prices and
exchange rate dynamics. Journal Of International
Money And Finance, 24(7), 1031-1053. http://
dx.doi.org/10.1016/j.jimonfin.2005.08.001
Rao, K. M. (2015). LINKAGES AMONG STOCK MARKETS:
BRICS COUNTRIES. Indian Journal Of Accounting,
VolXLVII (1), 60-70.
Rjoub, H. (2012). Stock prices and exchange rates
dynamics: Evidence from emerging markets. Afr. J.
Bus. Manage., 6(13). http://dx.doi.org/10.5897/
ajbm11.2761
Saha, S. & Chakrabrati, G. (2011) Financial crisis and
financial market volatility spill-over. IntJ Appl Econ
Financ 5(3):185–199.
Slimane, F., Mehanaoui, M., &Kazi, I. (2013). How Does
the Financial Crisis Affect Volatility Behavior and
Transmission Among European Stock Markets?
International Journal Of Financial Studies, 1(3), 81-101.
http://dx.doi.org/10.3390/ijfs1030081
Gnyana Ranjan Bal
Assistant Professor
Dept. of Commerce
Guru Ghasidas Vishwavidyalaya
Bilaspur (C.G.) 495 009
E-mail : [email protected]
Amit Manglani
Assistant Professor
Dept. of Commerce
Guru Ghasidas Vishwavidyalaya
Bilaspur (C.G.) 495 009
Dynamic Relationship Between Stock Price and Exchange Rate Changes: Evidence from Indian Market

( 71 )( 71 )( 71 )( 71 )( 71 )
INTRODUCTION
The service sector is considered as an important wheel of the Indian economy. According
to the Economic Survey for 2013-14, Indian service sector ranks second among the
fastest growing sectors with 9 per cent compound annual growth rate. In GDP 57 per
cent of share is contributed by service sector at factor cost (at current prices). During
1980s, in many countries the deregulation of service sector like in banking,
telecommunication, transport, healthcare, insurance, hospitality and education have
resulted in intensified and stiff competition among various businesses. Insurance
companies being important part of the country service institutions play a significant
role in improving society and accelerating economic activities.
As the employees in service organization have direct contact with their customers. So,
in order to achieve success in such an industry, organization pay particular attention to
their employee needs. Organizations make their profits aligned in accordance with
customer and employees’ satisfaction.
According to Liao (2009) in the recent years, many companies have been seeking to find
a key strategy for creating some methods to tend employees toward customer orientation
and internal marketing is considered as one of the significant strategy. Increased
competition, technological changes, higher expectations of customers as well as
employees and business needs have forced many service organizations to think of
innovative marketing approaches which will lead to higher satisfaction to its internal
and external customers. In order to operate in today’s dynamic environment business
requires the right type of personnel to survive. So, the concept of Internal Marketing and
internal customer satisfaction i.e. employee’s satisfaction arises. With increasing
expansion of service sector, organizations in order to make profits and maintain stable
competitive advantage are seeking new solutions for absorbing and keeping customers.
Key words:
Internal Marketing
Practices, Employee Job
Satisfaction, Life Insurance
Corporation of India
Internal Marketing Practices and Employee JobSatisfaction: A Case of Life Insurance
Parikshat Singh Manhas and Rajani Kumari Sarangal
ABSTRACT
The aim of this study is to examine the relationship and impact of Internal Marketing Practices and
Employee Job Satisfaction in Insurance Corporation of India (LIC). The independent variable is Internal
marketing which is studied through different factors namely Integrated Training and Communication
Programme, Perceived Organizational Support, Motivation System, Holistic Employee Development.
The dependent variable is Employee Job Satisfaction. The sample area of the study was divisional office
and all the branches of LIC operating within Jammu city. Total response rate was 89.167 per cent. The
statistical tools used were Mean, Standard Deviation, Factor Analysis, Correlation and Regression. The
research concluded that Internal Marketing Practices have significant relationship with Employee Job
Satisfaction and have positive impact on the same. Furthermore, the study recommends insurance
industry to prioritize the implementation of Internal Marketing Practices within their organizations as
a prominent tool for achieving higher Employee Job Satisfaction.
The Indian Journal of CommerceVol.68, No. 4, October-December 2015

( 72 )( 72 )( 72 )( 72 )( 72 )
One of the most important factors for achieving this goal
especially when talking about service organizations is the
quality of services which they offer to their customers
In today’s organizations, Internal Marketing has gained
considerable acceptance as a philosophy and as a
marketing tool. Internal Marketing refers to all the actions
that an organization has to perform in order to develop,
train and motivate its employees, so to enhance the quality
of the services provided to its customers (Chen et al., 2006).
Internal Marketing seeks to improve service performance
by focusing its efforts on employees. Internal Marketing
concept has been studied by various researchers and
adopted by different organizations as a new approach in
their organizations to achieve better performance through
employee satisfaction. This study examines the various
factors of Internal Marketing and impact of same on
Employee Job Satisfaction in context of Insurance Industry
specifically life insurance corporation of India. Findings
of this research will prove to be useful for service managers
in formulating appropriate Internal Marketing strategies
for their organizations and will leads to achieve higher
employee job satisfaction.
REVIEW OF LITERATURE
Berry (1981) first time introduced the concept of Internal
Marketing and he viewed “employees as customers’’ of
organization and just like external customers, internal
customers needs have to be satisfied. Internal Marketing
refers to all the actions that an organization (i.e., health
care organizations, hospitals, hotels, etc) has to perform
in order to develop, train and motivate its employees, so as
to enhance the quality of the services provided to its
customers (Chen et al., 2006). In addition to this, Woodruffe
(1995) also defined Internal Marketing as treating both
employees and customers with equal importance through
proactive programmes in order to achieve the objectives of
the organization. Varey and Lewis (2000) stated that the
concept of Internal Marketing is evolved from the idea that
employees constitute an internal market within the
organization, which needs to be informed, educated,
trained, rewarded and motivated to meet external
customers’ needs and expectations. Further Longbottom
et al. (2006) stated that the concept of Internal Marketing
notices employees as internal customers and their work
as internal “products” and consequently, dedicates efforts
to the design of products that better satisfy employee needs
and wants. According to Caruana and Calleya (1998)
Internal Marketing addresses all aims of the organization,
while satisfying desires and needs of the internal
customers. In other words, it is the philosophy of treating
the employees as a customer. Zeithaml and Bitner (2000)
quote Internal Marketing as the mechanism for enabling
the delivery of promises that are made via external
marketing. Employee must possess appropriate skills,
abilities, tools and motivation so as to deliver better services
to its customers. Promises can easily be made, but unless
the employees are not properly rewarded for their efforts
these promises may not be kept. Conduit and Mavondo
(2001) have divided Internal Marketing Practices into five
categories: employees’ education, management support,
internal communication, human resources and
employees’ intervention in external communication.
Dinham and Scott (2000) and Koustelios (2001) also
explored numerous factors of Internal Marketing (IM)
related to job satisfaction like vision, commitment,
employee relationship, feedback, employee’s needs,
working environment and training. Bodur (2002) also
suggests that working condition, co-workers, benefits and
training are some of the factors related to employee job
satisfaction. Preston and Steel (2002) wrote about issues
related to Internal Marketing and according to them
recruiting, training, development, team work and
motivating staff are some of the important variables of
Internal Marketing (IM) that has influence on employee
job satisfaction.
Kazemzadeh and Bashiri (2005) also explored the
relationship between Internal Marketing (IM) and
Employee Job Satisfaction. They identified following
variables: employee relationships with staff across different
departments, employee motivation, commitment, loyalty,
wage and salary, other welfare facilities, growth
opportunities, feedback and complaint handling,
organization’s systems and processes. A study (Ha et al.,
2007) found that Internal Marketing as an important
concept, where firms apply marketing tools to attract and
retain the best employees within organization which
enhance the business performance. They identified 12
constructs of Internal Marketing i.e. inter-functional
coordination and integration, customer orientation,
marketing like approach, job satisfaction, empowerment,
employee motivation, quality of service, employee
development, vision of the organization, strategic reward,
internal communication and senior leadership. Long and
Swortzel (2007) and Luthans (1998) also mention five
dimensions of Internal Marketing(IM) that directly
influence Employee Job Satisfaction, comprising attractive
Internal Marketing Practices and Employee Job Satisfaction: A Case of Life Insurance

( 73 )( 73 )( 73 )( 73 )( 73 )
benefits, characteristics of job, working environment, team
work and employee relationships. Masroor and Fakir (2009)
in their study examined the level of job satisfaction and
intention to leave among Malaysian nurses and result of
the study concluded that the nursing staffs were
moderately satisfied with supervisor, job variety, closure,
compensation, co-workers and HRM/management polices
and therefore clearly identified a perceived lower level of
their intention to leave the hospital and the job. As cited by
Rajyalakshmi and Kameswari (2012) a study in the retail
stores find out the impact of Internal Marketing factors on
job motivation and satisfaction .The study revealed that
working conditions and hours, hygiene and sanitation,
rest rooms, support from superior and attitude of colleagues
have the highest influence on job motivation and
satisfaction. Panigyrakis and Theodoridis (2009) in their
study reveals that vision, internal communication,
teamwork, quality of job, care about employee, reward
system, feedback, internal procedures and policies, internal
customer relationship with colleagues, senior staff and
other departments play a vital role in Employee Job
Satisfaction and their performance. Kameswari and
Rajyalakshmi (2012) conducted a study in SBI and found
that Internal Marketing dimensions (i.e. work content,
training, recognition, work environment, superior support,
co-worker) had a significant impact on the Employee Job
Satisfaction.
Internal Marketing and Employee Job Satisfaction in
Insurance Sector
A recent study by Martey (2014) in insurance industry of
Ghana explored that internal marketing has a significant
impact on employee’s job satisfaction. Shiua and Yub
(2010) in their study showed a significant correlation
among Internal Marketing, job satisfaction, organizational
culture and performance of non-life insurers in Taiwan.
Abbasi and Salehi (2011) in their research find out
relationship between the Internal Marketing and customer-
orientation with job satisfaction as a mediator. Rahmati et
al. (2013) studied impact of Internal Marketing on customer
loyalty in Iran insurance company. In the same year a study
was conducted by Poor et al. (2013) in Guilan private
insurance companies to evaluate the effect of Internal
Marketing on employee’s behaviour. Research indicated
positive relationship between Internal Marketing and
employee loyalty. Esfahani et al. (2013) examines the
impact of internal marketing on staff job satisfaction in
private insurance company in Isfahan city and results of
the study revealed significant positive effect of Internal
Marketing on personnel’s job satisfaction.
From the above mentioned literature it is concluded that
there exists a relationship between Internal Marketing and
Employee Job Satisfaction. The various Internal Marketing
dimensions were worked upon by different authors in the
past.
OBJECTIVES OF THE STUDY
To study the relationship and impact of Internal Marketing
Practices on Employee Job Satisfaction in LIC and to
suggest and recommend the effective Internal Marketing
strategies for life insurance companies.
RESEARCH HYPOTHESIS
Based on the above discussion the following hypotheses
are formed:
H1: There is a significant relationship between Internal
Marketing Practices and Employee Job Satisfaction
in Life Insurance Corporation of India (LIC).
H2: Internal Marketing Practices in Life Insurance
Corporation of India (LIC) have a significant impact
on Employee Job Satisfaction.
RESEARCH METHODOLOGY
Population and Sample
The target population of this study was the employees of
Life Insurance Corporation of India (LIC) in Jammu city.
All the three branches and one divisional office of LIC
with in Jammu city were covered in the survey. Total of 120
questionnaires were distributed to the employees of LIC in
Jammu city. Of the 120 questionnaires distributed, 107
questionnaires were returned and 13 questionnaires were
eliminated due to not properly filled. Thus, the overall
response rate was 89.167 per cent (107/120), which was
considered as satisfactory for further analysis. This study
is restrained to one of the largest public sector life
insurance company i.e. LIC. Self structured questionnaire
was developed based on the pervious literature review is
administered to all the employees working in LIC. For data
collection convenient sampling technique is used. The
questionnaire was divided into two sections: Section A
and Section B. Section A includes demographic information
of the employees. Section B has questions relating to
Internal Marketing and Employee Job Satisfaction.
Parikshat Singh Manhas and Rajani Kumari Sarangal

( 74 )( 74 )( 74 )( 74 )( 74 )
Statistical Package for Social Sciences (SPSS) version 16.0
is used.
RESULT AND DISCUSSION
Table1shows the demographic profile of the respondent.
Table:1 Demographic profile of respondents
Variables Frequency
Distribution(N) Percentage
(%)
Gender
Male 68 64
Female 39 36
Age
20-30 years 11 10
31-40 years 21 20
41-50 years 41 38
>50 years 34 32 Marital Status
Married 95 89
Unmarried 12 11 Job Profile
Class I 58 54
Class II 4 4
Class III 43 40
Class IV 2 2
Type of Job
Permanent 107 100
Temporary 0 Educational Qualification
Senior Secondary
7 7
Higher Secondary
14 13
Bachelors Degree 45 42
Masters Degree 41 38
Monthly Income
< Rs.25,000 17 16
Rs.25,001-35,000 13 12
Rs.35,001-45,000 20 19
Rs.45,001-55,000 4 4
> Rs.55,000 53 49
Work Experience
<1 year 3 3
1-5 years 17 16
6-10 years 8 7
11-15 years 5 5
16-20 years 8 7
21-25 years 29 27
>25 years 37 35
With the application of EFA on Internal Marketing scale
one item got deleted thereby retaining 20 items. Four factors
emerge out after applying EFA namely Integrated Training
and Communication Programme, Perceived
Organizational Support, Motivation system and Holistic
Employee Development (see Table 2). Finally internal
marketing scale contains four factors with 69.213 % of
variance explained.
Integrated Training and Communication Programme:-
The factor mean is 3.67.This factor contains 7 items namely
“Training and development programmes are clearly
directed at creating the competencies”, “ If any employee
is shifted from one department to another, the new
supervisor will personally train him/her for pre specified
period of time”, “My company provides us with good
official channels for vertical as well as horizontal
communication”, “When we have any thoughts or
suggestions we can express our opinions through a
specified way”, “The company often announces new
policies to employees by means of different formal
communication”, “Before any change in policy, employees
are informed in advance”. The item “Training and
development programmes are clearly directed at creating
the competencies” has the highest factor loading .780 and
therefore highly associated with this factor. The item
“Before any change in policy, employees are informed in
advance” has the lowest factor loading and therefore least
associated with this factor. The mean value of this factor
ranges from 3.44 to 3.70.The Eigen value of this factor is
10.052 and variance explained is 22.790.
Perceived Organizational Support:-The item “In my
organization superior often pays attention to the family
life of his/her subordinates” is having the highest factor
loading (.860) and the lowest is .581.The communalities of
all the items in this factor are greater than .5. The Eigen
value of this factor is 2.028 with 17.842 % of variance
explained.
Motivation System:- The item “The incentive and reward
systems encourage employees to work together for the
organization” has the highest mean value of 3.5140 with
standard deviation 1.09341. The item “My organization
offers good incentives and rewards to its employees for
better performance” has the lowest mean value.
Holistic Employee Development:- The fourth factor has
mean value 3.4081 with Eigen value 1.064 and 13.807 %
variance explained. Item “Our Company provides enough
Internal Marketing Practices and Employee Job Satisfaction: A Case of Life Insurance
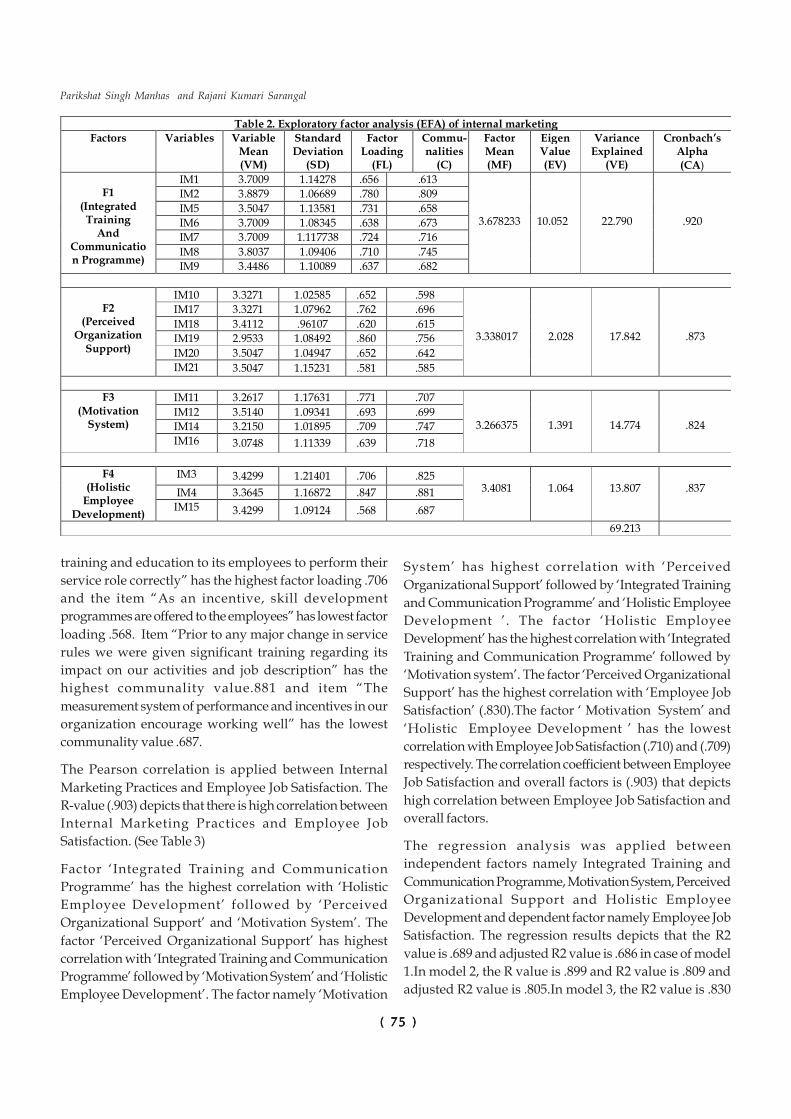
( 75 )( 75 )( 75 )( 75 )( 75 )
training and education to its employees to perform their
service role correctly” has the highest factor loading .706
and the item “As an incentive, skill development
programmes are offered to the employees” has lowest factor
loading .568. Item “Prior to any major change in service
rules we were given significant training regarding its
impact on our activities and job description” has the
highest communality value.881 and item “The
measurement system of performance and incentives in our
organization encourage working well” has the lowest
communality value .687.
The Pearson correlation is applied between Internal
Marketing Practices and Employee Job Satisfaction. The
R-value (.903) depicts that there is high correlation between
Internal Marketing Practices and Employee Job
Satisfaction. (See Table 3)
Factor ‘Integrated Training and Communication
Programme’ has the highest correlation with ‘Holistic
Employee Development’ followed by ‘Perceived
Organizational Support’ and ‘Motivation System’. The
factor ‘Perceived Organizational Support’ has highest
correlation with ‘Integrated Training and Communication
Programme’ followed by ‘Motivation System’ and ‘Holistic
Employee Development’. The factor namely ‘Motivation
System’ has highest correlation with ‘Perceived
Organizational Support’ followed by ‘Integrated Training
and Communication Programme’ and ‘Holistic Employee
Development ’. The factor ‘Holistic Employee
Development’ has the highest correlation with ‘Integrated
Training and Communication Programme’ followed by
‘Motivation system’. The factor ‘Perceived Organizational
Support’ has the highest correlation with ‘Employee Job
Satisfaction’ (.830).The factor ‘ Motivation System’ and
‘Holistic Employee Development ’ has the lowest
correlation with Employee Job Satisfaction (.710) and (.709)
respectively. The correlation coefficient between Employee
Job Satisfaction and overall factors is (.903) that depicts
high correlation between Employee Job Satisfaction and
overall factors.
The regression analysis was applied between
independent factors namely Integrated Training and
Communication Programme, Motivation System, Perceived
Organizational Support and Holistic Employee
Development and dependent factor namely Employee Job
Satisfaction. The regression results depicts that the R2
value is .689 and adjusted R2 value is .686 in case of model
1.In model 2, the R value is .899 and R2 value is .809 and
adjusted R2 value is .805.In model 3, the R2 value is .830
Table 2. Exploratory factor analysis (EFA) of internal marketing
Factors Variables Variable Mean (VM)
Standard Deviation
(SD)
Factor Loading
(FL)
Commu- nalities
(C)
Factor Mean (MF)
Eigen Value (EV)
Variance Explained
(VE)
Cronbach’s Alpha (CA)
F1
(Integrated Training
And Communication Programme)
IM1 3.7009 1.14278 .656 .613
3.678233
10.052
22.790
.920
IM2 3.8879 1.06689 .780 .809
IM5 3.5047 1.13581 .731 .658
IM6 3.7009 1.08345 .638 .673
IM7 3.7009 1.117738 .724 .716
IM8 3.8037 1.09406 .710 .745
IM9 3.4486 1.10089 .637 .682
F2
(Perceived Organization
Support)
IM10 3.3271 1.02585 .652 .598
3.338017
2.028
17.842
.873
IM17 3.3271 1.07962 .762 .696
IM18 3.4112 .96107 .620 .615
IM19 2.9533 1.08492 .860 .756
IM20 3.5047 1.04947 .652 .642
IM21 3.5047 1.15231 .581 .585
F3
(Motivation System)
IM11 3.2617 1.17631 .771 .707
3.266375
1.391
14.774
.824 IM12 3.5140 1.09341 .693 .699
IM14 3.2150 1.01895 .709 .747
IM16 3.0748 1.11339 .639 .718
F4 (Holistic
Employee Development)
IM3 3.4299 1.21401 .706 .825 3.4081
1.064
13.807
.837 IM4 3.3645 1.16872 .847 .881
IM15 3.4299 1.09124 .568 .687
69.213
Parikshat Singh Manhas and Rajani Kumari Sarangal

( 76 )( 76 )( 76 )( 76 )( 76 )
and adjusted R2 value is .825. In Model 4, the adjusted R2
value is .840 the R2 value is .846 and R value is .920.The
regression analysis result depicts that Internal Marketing
Practices has significant impact (.840) on Employee Job
Satisfaction (see Table 4).
Table 4 : Regression analysis between internal
marketing practices and employee job satisfaction
Model Summary
Model R R
Square
Adjusted R
Square
Std. Error of the
Estimate
1 .830a .689 .686 .49128
2 .899b .809 .805 .38704
3 .911c .830 .825 .36667
4 .920d .846 .840 .35024
a. Predictors: (Constant), F2
b. Predictors: (Constant), F2, F4
c. Predictors: (Constant), F2, F4, F3
d. Predictors: (Constant), F2, F4, F3, F1
TEST OF THE HYPOTHESIS
To test hypothesis (H1) person correlation was applied
between independent factors of IM practices and
dependent variable Employee Job Satisfaction. The result
depicts that there is positive correlation (.903) between
independent factors i.e. Internal Marketing Practices and
dependent factor i.e. Employee Job Satisfaction. The
hypothesis (H1) stands accepted.
To test hypothesis (H2) regression analysis was applied
between independent factors of IM practices and
dependent factor Employee Job Satisfaction. Result depicts
that Internal Marketing practices have a positive impact
on Employee Job Satisfaction. Therefore, the hypothesis
stands accepted as there is a significant positive impact
(.840).
It is clear from the above mentioned results that Internal
Marketing Practices have positive co-relation with
Employee Job Satisfaction and also have significant impact
on Employee Job Satisfaction. Satisfaction of the employees
Table 3. Correlation between internal marketing practices and employee job satisfaction
Factors
Integrated Training
and Communication
programme
Perceived Organization
Support
Motivation System
Holistic Employee
Development
Employee Job
Satisfaction
Over all
factor
Integrated Training
and Communication
programme
Pearson Correlation 1 .644** .571** .752** .790** .889**
Sig. (2-tailed) .000 .000 .000 .000 .000
N 107 107 107 107 107 107
Perceived Organization
Support
Pearson Correlation .644** 1 .611** .490** .830** .805**
Sig. (2-tailed) .000 .000 .000 .000 .000
N 107 107 107 107 107 107
Motivation System
Pearson Correlation .571** .611** 1 .537** .710** .807**
Sig. (2-tailed) .000 .000 .000 .000 .000
N 107 107 107 107 107 107
Holistic Employee
Development
Pearson Correlation .752** .490** .537** 1 .709** .846**
Sig. (2-tailed) .000 .000 .000 .000 .000
N 107 107 107 107 107 107
Employee Job
Satisfaction
Pearson Correlation .790** .830** .710** .709** 1 .903**
Sig. (2-tailed) .000 .000 .000 .000 .000
N 107 107 107 107 107 107
Over all Factor
Pearson Correlation .889** .805** .807** .846** .903** 1
Sig. (2-tailed) .000 .000 .000 .000 .000
N 107 107 107 107 107 107
**. Correlation is significant at the 0.01 level (2-tailed).
Internal Marketing Practices and Employee Job Satisfaction: A Case of Life Insurance

( 77 )( 77 )( 77 )( 77 )( 77 )
towards superiors support acts as a good motivator leading
to employee involvement and work orientation. Integrated
training and communication programme is another
internal marketing practice that increases satisfaction
among employees. The factor motivation system also exerts
influence on the Employee Job Satisfaction. The factor
holistic employee development has least effect on job
satisfaction of employees.
CONCLUSION AND RECOMMENDATIONS
Results showed that hypotheses of the study i.e. H1 and
H2 were confirmed. Employees have higher level of
satisfaction with their jobs. This research has made an
attempt to enhance the knowledge by examining
relationship between Internal Marketing Practices and
Employee Job Satisfaction and their impact on each other.
In addition to this, research contributes to service
marketing and human resource discipline in insurance
industry to find out the role of internal marketing in
increasing Employee Job Satisfaction. Study focuses on
factors of internal marketing as they have influence on
Employee Job Satisfaction. Contributions made by the
research will be valuable for both academics as well as
managers. Aim of present study is to focus scholarly
attention upon a much deserted area – Internal Marketing
and Employee Job Satisfaction among LIC’s employees
with in Jammu. Currently there is lack of studies in the
state of Jammu & Kashmir. In Indian economy insurance
industry is considered as a significant and rapidly
growing sector and LIC is considered as dominant segment
of the life insurance services provider. So, Insurance
administrators should realize the importance of internal
marketing in insurance industry as it will be helpful for
service employees to increase their job satisfaction. More
of the human resources practices in internal marketing
context should be employed within organization, as they
lead to greater level of satisfaction among employees.
Insurance industry is regarded as high labour intensive
industry, involving very frequent and face to face
interaction with its customers. Satisfied and loyal
employees will be committed to deliver better services to
their customers. Therefore, it is very important for employer
to satisfy its employee .Service managers must involve
themselves in providing better training, support,
motivation and holistic development to encourage their
employees in making better decisions making and better
handling of customers. This will improve employee’s
performance and eventually the satisfaction of the
customers. The result of this study is also consistent with
the result of previous studies (i.e. Hawng and Chi (2005);
Shiua and Yu (2010); Iliopoulos and Priporas (2011);
Abdullah et al., (2011); Khan et al., (2011); Al-Hawary et
al., (2013)). So, managers and policy-makers in service
organizations need to focus upon new ideas of internal
marketing and should apply these quality constructs in
their respective organizations in a more focused and
thorough manner for gaining the greater employee job
satisfaction .
MANAGERIAL IMPLICATIONS
Managers and decision makers of the company must
provide regular training courses and proper
communication system to the employees to make them
satisfied with their jobs. They must concentrate on
developing proficiency of employees and should also
encourage them to be innovative. Managers should design
different training courses that suits their employee’s skill
and his/her interest. In order to achieve greater satisfaction
among employees, managers must conduct timely
meetings with their employees to take notice of their views
and feedbacks and should also consider them. They should
follow a proper communication channel so that when
updated rules and regulations were announced, should
be followed by each employee working in organization.
Managers have to indulge their employees in decision
making process, so that they will better follow the rules
and regulations which will increase their satisfaction and
in turn will provide better services to their customers.
Employees should be asked about the different internal
marketing practices, which should be implemented to
increase their satisfaction.
LIMITATIONS AND FUTURE SCOPE
The study is limited to only one of the leading public sector
insurance company operating in Jammu city. So, its results
cannot be generalized to other service industries. Due to
time and cost constraint, the survey was conducted over
employees of LIC branches operating in Jammu city. So,
sample size considered for the study was very small.
The paper also presents the following avenues for future
researchers. Research should be conducted on other service
organizations. Further research can also be done in
organizations comprising larger number of employee from
Parikshat Singh Manhas and Rajani Kumari Sarangal

( 78 )( 78 )( 78 )( 78 )( 78 )
different industries. Future studies can be done in
manufacturing sector as there was hardly any study found
in this sector. Finally, a comparative analysis between the
public sector and private sector insurance companies can
be done that may enhance the generalization of the
findings. As we have identified that variance explained of
all the factor is 69.213 %, we can also add up more factors
in the study.
REFERENCES
Abbassi, M.R & Salehi, S 2011, ‘Internal marketing effect
on customer orientation on insurance industry
(case study: insurance companies in Tehran)’,
Insurance Research, vol.102, pp. 145-175.
Abdullah, R, Musa, M, Zahari, H, Rahman, R & Khalid, K
2011, ‘The study of employee satisfaction and its
effects towards loyalty in hotel industry in Klang
Valley, Malaysia’, International Journal of Business and
Social Science, vol.2 ,no.3, pp. 147-155.
Al-Hawary, S.I.S, Al-Qudah, K.A.M, Abutayeh, P.M &
Abutayeh, S.M 2013, ‘The impact of internal
marketing on employee’s job satisfaction of
commercial banks in Jordan’, Interdisciplinary Journal
of Contemporary Research in Business, vol.4, no.9.
Berry, L.L 1981, ‘The employee as customer’, Journal of Retail
Banking, vol. 3, pp.25-80.
Bodur, S 2002, ‘Job satisfaction of health care staff employed
at health centers in Turkey’, Occupational Medicine,
vol. 52, no.6, pp. 353-355.
Caruana, A & Calleya, P 1998, ‘The effect of internal
marketing on organizational commitment among
retail bank managers’, International Journal of Bank
Marketing, vol.16,no.3,pp. 108-116.
Chen, C.K, Lin, Y.H & Ho, C. S 2006,‘Research on the
relationship between internal marketing and
medical personnel’s turnover intension in the
situation of a dangerous outbreak of illness like
SARS. - A regional Hospital for example’, Cheng Chin
Med Journal, vol.2 no.4, pp.28-36.
Conduit, J & Mavondo, F.T 2001, ‘How critical is internal
customer orientation to market orientation’, Journal
of Business Research, vol. 51, no.1, pp. 11–24.
Coomber, B & Barriball, K.L 2007, ‘Impact of job satisfaction
components on intent to leave and turnover for
hospital-based nurses: A review of the research
literature’, International Journal of Nursing Studies, vol.
44, pp. 297–314.
Dinham, S & Scott, C 2000, ‘Moving into the third, outer
domain of teacher satisfaction’, Journal of Educational
Administration, vol.38, no.4, pp. 379-396.
Esfahani, A.N, Amirosadat, S.N, Rahimi, H.R & Marandi,
M.H 2013, ‘Investigating relationship between
internal marketing and job satisfaction with using
structural equation modeling. International Journal
of Academic Research in Economics and Management
Sciences, vol.2, no.3.
Ha, C.N, Bakar, R.A & Jaafar, S.I.S 2007, ‘Internal marketing
issues in service organization in Malaysia,
International Review of Business Research Papers,vol.
3, no.5, pp. 134 -145.
Hwang, I & Chi, D 2005, ‘Relationships among internal
marketing, employee job satisfaction and
international hotel performance: An empirical
study’ International Journal of Management, vol. 22,
no.2, pp.285.
Ibrahim, A.A & Dmour, H 2010, ‘The effect of internal
marketing implementation on job satisfaction of
sales people in Jordan telecom group, Jordan Journal
of Business Administration,vol. 6,no.1.
Iliopoulos, E& Priporas, C. 2011, ‘The effect of internal
marketing on job satisfaction in health services: a
pilot study in public hospitals in Northern
Greece’,BMC Health Services Research, vol.11, pp.261.
Kameswari, V.A & Rajyalakshmi, N 2012, ‘Role of internal
marketing in job satisfaction of employees in State
Bank of India’, Paper presented at the Ninth AIMS
International Conference on Management, Pune
,Maharashtra .
Kazemzadeh, R.B & Bashiri, M 2005, ‘Determination of
critical factors on employee satisfaction - a case
study on a financial institute’, Proceedings of IEEE
international Engineering Management Conference,
vol.1, no. pp.16-20.Available from: IEEE portal: IEEE
Xplore Digital Library.[20 January 2015].
Koustelios, A 2001, ‘Personal characteristics and job
satisfaction of Greek teachers’,The International
Internal Marketing Practices and Employee Job Satisfaction: A Case of Life Insurance

( 79 )( 79 )( 79 )( 79 )( 79 )
Journal of Education Management,vol. 15,no.7, pp.354-
358.
Liao, J.F 2009, ‘The effects of internal marketing on
customer orientation in the banking industry,
Doctoral Dissertation, Golden Gate University, United
States- California, viewed 2 January,2014, http://
gateway.proquest.com.
Longbottom, D, Osseo-Asare, E, Chourides, P and Murphy,
W. D 2006, ‘Real quality: Does the future of TQM
depend on internal marketing?’Total Quality
Management & Business Excellence ,vol.
17no.6,pp.709–732.
Long, J. L. & Swortzel, K. A. 2007,’Factors influencing job
satisfaction of extension agents in the Mississippi
State University extension service.,’ Paper presented
at AAAE Research Conference ,Minneapolis, MN:
Texas A&M University.
Luthans, F- 1998, Organizational Behaviour, 8th edn, India,
McGraw-Hill Publishing.
Martey, E.M 2014, ‘The impact of internal marketing on
employee performance in the insurance industry of
Ghana’, International Journal of Research, vol. 1, no.7.
Masroor, A.M & Fakir, M. J 2009, ‘Level of job satisfaction
and intent to leave among Malaysian nurses’,
Business Intelligence Journal, pp.123–137.
Panigyrakis, G.G. & Theodoridis, P. K 2009, ‘Internal
marketing impact on business performance in a
retail context’, International Journal of Retail &
Distribution Management, vol. 37,no.7,pp.600-628.
Poor, E.R, Akhlaq E.M & Akhavan, M. R 2013, ‘Evaluate
the effect of internal marketing on employees
behavior (Case study: Guilan private insurance
companies)’, International Journal of Research and
Reviews in Applied Sciences,vol. 16,no.1.
Preston, J.B & Steel, L 2002, ‘Employees, customers and
internal marketing strategies in LIS’, Library
Management, vol.23,no.8,pp. 384 – 393.
Rahmati,F, Falahati, A& Jamshedynavid, B 2013, ‘The
study impact of internal marketing on customer
loyalty (Case study: Iran Insurance Company -
Kermanshah province)’, International Research Journal
of Applied and Basic Sciences,vol. 4,no8,pp. 2018-2025.
Shiua, Y & Yub, T 2010, ‘Internal Marketing,
organizational culture, job satisfaction, and
organizational performance in non-life insurance’,
The Service Industries Journal, vol.30, no.6, pp.793-
809.
Tsigilis, N, Zachopoulou, E & Grammatikopoulos,V 2006,
‘Job satisfaction and burnout among Greek early
educators: A comparison between public and private
sector employees’, Journal of Educational Research and
Review,vol.1,no.8, pp.256-261.
Varey, R.J & Lewis, B.R 2000, Internal marketing: Directions
for Management, London: Routledge, Taylor & Francis
Group.
Woodruffe, H 1995, Services marketing, London: Pitman
Publishing.
Dr. Parikshat Singh Manhas
Director, School of Hospitality &
Tourism Management (SHTM),
Professor, The Business School (TBS)
Associate Dean (SW), University of Jammu, (J&K)
India – 180006
E-mail: [email protected],
Ms. Rajani Kumari Sarangal
UGC NET, JRF, Ph.D. Research Scholar
The Business School (TBS),
University of Jammu, J&K,
India – 180006
E-Mail: [email protected]
Parikshat Singh Manhas and Rajani Kumari Sarangal

( 80 )( 80 )( 80 )( 80 )( 80 )
INTRODUCTION
Banking Sector is considered as the strength of any Economy. The performance of this
sector influences the performance of the entire economy. With the advancement in
information technology and increasing dispersion of mobile in rural and remote areas,
Indian banks have reached to the unreached in last few years. Indian banks have been
giving back to the society through various welfare initiatives, donations and in-kind
support to charities for decades. Again, Social responsibility is not a novel term for the
Indian banking sector. After the enactment, Corporate Social Responsibility (CSR) has
become mandatory for a certain class of companies in India, It has forced the banks to
take their welfare activities more seriously and organize their activities at CSR front.
This paper aims to explore the spending pattern of Indian Banking Sector contributing
towards CSR activities; so as to know how much they have spent and need to spend
further with the mandatory CSR, which has been enforced from 1st April 2014 in India.
LITERATURE REVIEW
Literature has been reviewed to study the influence of CSR activities on the banking
sector. Md. Al Mamun et al. (2013) found that CSR expenditure does not necessarily
have a profit increasing or performance enhancing ability. An increase in CSR
expenditure in Bangladeshi banking industry can be considered as a real commitment
of these firms as corporate citizens to the society. Mona Kamal (2013) results imply a
Key words:
New Company Act 2013,
Net profit, CSR spending,
Public sector banks, Private
sector banks.
Corporate Social Responsibility:A Comparative Study of Select Public and PrivateSector Banks In India
B. Ramesh and Savia Mendes
ABSTRACT
Banking Sector is considered as the strength of any Economy. The performance of this sector influences
the performance of the entire economy. Indian banks have been giving back to the society through
various welfare initiatives, donations and in-kind support to charities for decades. Again, Social
responsibility is not a novel term for the Indian banking sector. After the enactment, Corporate Social
Responsibility (CSR) has become mandatory for a certain class of companies in India, This paper aims to
explore the spending pattern of Indian Banking Sector contributing towards CSR activities; so as to
know how much they have spent and need to spend further with the mandatory CSR, which has been
enforced from 1st April 2014 in India. This will help the bank management to project where they stand
when compared to their peers, thereby helping the CSR stakeholders to understand how Indian banks
have made their CSR spending, and also further aid banks to their future CSR project implementation.
The study is based on secondary data taken from the annual reports of banks, presented in graphs and
tables, collected from 19 banks; further divided into 12 public sector banks and 7 private sector banks in
India. The CSR spending analysis of the 12 banks selected from the public sector reveals that these banks
are not yet prepared for 2% of their three-year average net profit spending on CSR projects. Moreover,
the private sector banks have overall highest contribution in CSR activities as compared to the public
sector banks.
The Indian Journal of CommerceVol.68, No. 4, October-December 2015
( 81 )( 81 )( 81 )( 81 )( 81 )
negative and statistically significant relationship between
CSR-dimensions and banks’ profitability. The negative
signs of the coefficient attached to CSR dimensions were
consistent with the competitive disadvantages argument
by the neoclassical economists in explaining the CSR-FP
link. The empirical outcomes showed a unidirectional
causality from finance to the private sector to both financial
performance and banking density. Sharma (2011) made
an attempt to analyse CSR practices and CSR reporting in
India with special reference to banking sector and
concluded that banking sector in India is showing interest
in mixing sustainability into their business models but its
CSR reporting practices are far away from satisfaction.
Dheeraj Tiwari (2014) highlighted a proposal made by the
government of India to float a company to manage CSR
funds of all central public sector enterprises to ensure
efficient implementation of financial initiatives and free
companies from additional responsibilities under section
25. The unspent amount of the budget allocated for CSR
and sustainability activities for a year will be spent within
two financial years failing it would be transferred to a
sustainability fund. Since the guidelines were issues in
2013, we will have to wait till 2016 for sustainable fund to
take off. Ahmed et al. (2012) suggested that the CSR can
increase both long term profitability and sustainability of
the banks as well as enhance the reputation of the banks.
Margolis et al. (2007) performed various analyses and
found an overall positive effect between CSR and financial
performance. Suman et al. (2011) study reveals increasing
awareness about Corporate Social Responsibility,
Sustainable Development and Non-Financial Reporting
worldwide. The contribution of financial institutions
including banks to sustainable development is paramount,
considering the crucial role they play in financing the
economic and developmental activities of the world. Sanjay
Kanti Das (2012) the development of Corporate Social
Responsibility is very slow in India though it was started
a long time ago. There is a visible trend in the financial
sector in promoting environment friendly, socially
responsible lending and investment practices. Narwal
(2007) made a study to highlight the CSR initiatives taken
by the Indian Banking Industry. The findings suggest that
banks have an objective view-point about CSR activities.
They are concentrating mainly on education, balanced
growth (different strata of society), health, environmental
marketing and customer satisfaction as their core CSR
activities. Sharma (2013) observed that the public sector
banks have an overall highest contribution in CSR
activities, whereas, private sector banks and foreign banks
are still lagging in this area.
HIGHLIGHTS OF NEW COMPANY ACT
2013(SECTION 135): CORPORATE SOCIAL
RESPONSIBILITY
• All companies with a turnover of Rs.1,000 crore and
more – or a net worth of Rs.500 crore and more or
net profit of Rs.5 crore and more – will have to spend
at least two percent of their three-year average net
profit every year on CSR activities; and/or report
the reason for spending or non-expenditure Section
135(1).
• The institutional coverage is Indian Companies and
foreign companies operational in India.
• The activities undertaken by conducting CSR can
be undertaken through a registered society or trust/
NGO or a Section 8 Company or company self under
the Companies Act. However, the implementing
partner should have three years track record.
• Nature of expenditure incurred on specified
activities that are carried out in India will qualify as
CSR expenditure. Expenditure incurred in
undertaking normal course of business will not form
a part of the CSR expenditure. Any expenditure
incurred in providing such training up to a ceiling
of five percent in one financial year is permitted
under the CSR budget.
• Companies need to spend CSR money in project
mode with pre-defined indicators, budget, duration
etc. It is mandatory for companies to disclose their
CSR Policy, programs/projects undertaken and
amount spent in their report and the CSR Rules
provide for a separate format. The report containing
details of such activities and CSR policies have to
be made available on the company’s website for
informational purposes.
• The activities which may be included by companies
in their CSR policies according to Schedule VII
q eradicating extreme hunger and poverty and
malnutrition, promoting preventive
healthcare and sanitation and making
available safe drinking water;
q promotion of education; including special
education and employment enhancing
vocation skills especially among children,
woman, elderly and the differently abled and
livelihood enhancement projects;
B. Ramesh and Savia Mendes

( 82 )( 82 )( 82 )( 82 )( 82 )
q promoting gender equality and empowering
women; setting up homes and hostels for
women and orphans, setting up old age
homes, day care centres, and such other
facilities for senior citizens and measures for
reducing inequalities faced by socially and
economically backward groups;
q ensuring environmental sustainability
ecological balance, protection of flora and
fauna, animal welfare, agro forestry,
conservation of natural resources and
maintaining of quality of soil, air and water;
q protection of national heritage, art and
culture including restoration of buildings
and sites of historical importance and works
of art; setting up of public libraries; promotion
and development of traditional arts and
handicrafts;
q measures for the benefit of armed forces
veterans, war widows and their dependents;
q training to promote rural sports, nationally
recognized sports, and Paralympic sports
and Olympic sports;
q contribution to the Prime Minister’s National
Relief Fund or any other fund set up by the
Central Government or the State
Governments for socio-economic
development and relief and welfare of the
Scheduled Castes, the Scheduled Tribes, other
backward classes, minorities and women;
q contributions or funds provided to
technology incubators located within
academic institutions which are approved
by the Central Government;
q rural development projects;
q Slum development.
AIM AND OBJECTIVE OF THE STUDY
Keeping in view with the literature review and mandatory
CSR on selected companies in India, the paper aims to
explore the spending pattern of Indian Banking sector
contributing towards CSR activities. The objective is to
identify the present status on CSR spending on Indian
banks and to compare the corporate social responsibility
spending of Public sector & Private sector banks in India.
This will help the bank management to project where they
stand when compared to their peers, to help CSR
stakeholder to understand how Indian banks have made
their CSR spending and aid banks to their future CSR
project implementation.
METHODOLOGY
The study is based on secondary data taken from the
annual reports of banks, presented in graphs and tables,
collected from 19 banks; further divided into 12 public
sector banks and 7 private sector banks in India. The banks
have been selected on their ranking based on Economic
Times and availability of CSR information. The annual
reports with net Profit from Financial year 2010-2011, 2011-
2012, 2012-2013 and 2013- 2014 were considered
(Appendix I). The calculations are based on two percent of
their three-year average net profit to assess the difference
between actual and stipulated spending.
ANALYSIS & DISCUSSION
As seen in the graph 1, the CSR spending analysis of the
12 banks selected from the public sector reveals that these
banks are not yet prepared for 2% of their three-year average
net profit spending on CSR projects. It can perceive that
the top performing banks from the public sector are not
performing effectively in the CSR front. The State Bank of
India has a deficit of Rs 206.97 crore, Bank of Baroda of Rs
94.7 Crore on CSR front. Punjab National Bank, which
ranks third has contributed just Rs 2.94 crore and has a
deficit of Rs. 131.16 crore on CSR. The same is the case
with the rest of the banks in the public sector. They are
lagging behind on CSR front.
The graph 2, again reveals the spending pattern of the 7
banks selected from the private sector based on net profit,
have spent less than 2% CSR. The ICICI bank has emerged
as the best performing bank has deficit of only Rs 15.7
crore on CSR, whereas HDFC bank a deficit of Rs 83.54
crore. The same is the case with the rest of the banks in the
private sector.
The major thrust areas for CSR practice in Indian banks
are common in public and private sector banks. These areas
include children welfare, community welfare, education,
Corporate Social Responsibility: A Comparative Study of Select Public and Private Sector Banks In India

( 83 )( 83 )( 83 )( 83 )( 83 )
environment, healthcare, poverty eradication, rural
development, vocational training, women’s
empowerment, protection to girl child and employment.
The most surprising fact that the analysis brings out is
that some of the best performing PSUs have spent less
than 2% of the average net profit of previous three years
with SBI being the highest contributor with Rs. 148.93
crore. ICICI Bank emerges the best performing bank with
spending of close to Rs. 164 crore. It is really a big challenge
to these banks with the New Companies Act 2013. In many
cases, the reporting requirements have been diluted by
excessive descriptive text and avoiding statistics. There
are some banks which are not even meeting the regulatory
requirement.
The table 1 explores the overall CSR spending of the 19
banks. These banks have spent INR 535.85 Crore on CSR
activities in FY 2013-14 and they need to spend almost
three times of this amount viz. INR 1628.1 Crore, in FY
2014-15 to comply with the mandatory CSR clause of the
new Act. From the above discussion it is clear that banks
are not fully involved in the CSR activities. These banks
will have to work thrice on CSR activities for financial
year 2014-2015.
Graph 1
The table 2 exhibits that the 12 public sector banks have
spent just 21.43% in total of the 2% CSR for FY 2012-2013,
whereas the situation is better with the private sector. The
7 private sector banks analysed in this study have spent
just 58.46% in total of the 2% CSR for FY 2013-2014. Private
sector banks have been spending a lot more on CSR, than
their peers in public sector.
Table 1
No. Banks Actual CSR Spending
in 2013-14 (in Cr) 2% of net profit of FY11,
FY12 and FY13(in Cr)
CSR Spending Prerequisite for FY 2014-
15(in Cr)
PUBLIC SECTOR BANKS
1. State Bank of India 148.93 355.9 364.1
2. Bank of Baroda 15.3 110.0 109.0
3. Punjab National Bank 2.94 134.1 121.7
4. Bank of India 7.83 67.2 67.5
5. Union Bank 3.77 58.2 52.3
6. UCO Bank 3.32 18.3 23.5
7. Allahabad Bank 5.34 37.6 35.7
8. Indian Bank 2.42 44.8 37.1
9. IDBI Bank 12.2 50.2 46.6
10. Andhra Bank 2.4 35.7 28.9
11. Corporation Bank 2.71 36.8 25.5
12. Central bank of India 1.59 24.9 7.2
PRIVATE SECTOR BANKS
13. ICICI Bank 164 179.7 227.8
14. HDFC Bank 70.36 153.9 200.2
15. Axis Bank 62.1 126.5 154.6
16. Yes Bank 12.3 29.8 38.0
17. Kotak Mahindra Bank 3.6 31.7 39.0
18. Indusind Bank 12.69 24.3 32.6
19. ING Vysya Bank 2.05 13.6 16.9 TOTAL 535.85 1533.2 1628.2
B. Ramesh and Savia Mendes

( 84 )( 84 )( 84 )( 84 )( 84 )
Graph 2
Table 2
PUBLIC SECTOR BANKS (in Cr)
2% of Average Net Profit of FY 11, 12 and 13
973.7
Actual CSR Spending in FY 2014 208.75
CSR Spending Prerequisite in FY 2015 919.1
PRIVATE SECTOR BANKS (in Cr)
2% of Average Net Profit of FY 11, 12 and 13
559.5
Actual CSR Spending in FY 2014 327.1
CSR Spending Prerequisite in FY 2015 709.1
SUGGESTIONS
• With the Companies Act 2013, the banks will have
to work thrice on the CSR budgets for FY 2014-2015
than what they have spent in last year.
• The banks will have to assess and measure CSR
activities undertaken and will have to be in project
mode with pre-defined objectives, performance
indicators and an enhanced monitoring and
evaluation plan.
• Banks should look forward at trust formation, NGO
partnering to undertake CSR activities.
• Banks will have to provide appropriate training to
staff on CSR activities.
• These banks will have to streamline their CSR policy
and projects because most of their CSR spending
has been in donation or sponsorship form or
sporadic activities.
• The banks should be more transparent in reporting
CSR activities, by providing statistics and not mere
text and pictured description.
Table 3: BANKS AND THEIR NET PROFITS – FY 2011, 2012, 2013 AND 2014
No. Bank Net Profit (in Cr)
2013-14 (FY14)
2012-13 (FY13)
2011-12 (FY12)
2010-11 (FY11)
PUBLIC SECTOR BANKS
1. State Bank of India 16174 19951 18483 14954
2. Bank of Baroda 5497 4831 6025 5650
3. Punjab National Bank 4690 6521 7037 6563
4. Bank of India 3545 3007 3577 3495 5. Union Bank of India 2068 3064 2712 2955
6. UCO Bank 1724 646 1150 944 7. Allahabad Bank 1636 1552 2162 1930 8. Indian Bank 1475 1826 2267 2634
9. IDBI Bank 1741 2621 2629 2280 10. Andhra Bank 733 1771 1824 1767
11. Corporation Bank 241 1685 1905 1933
12. Central Bank of India -994 1319 758 1659 PRIVATE SECTOR BANKS
13. ICICI 13968 11,396 8,803 6,760
14. HDFC 12772 9750 7513 5819 15. Axis Bank 9348 7552 6287 5135
16. Yes Bank 2326 1925 1450 1092
17. Kotak Mahindra Bank Ltd. 2272 1972 1600 1187
18. Indusind Bank 2128 1576 1192 879 19. ING Vysya Bank 977 901 654 483
Corporate Social Responsibility: A Comparative Study of Select Public and Private Sector Banks In India

( 85 )( 85 )( 85 )( 85 )( 85 )
CONCLUSION
The CSR spending analysis of the selected 19 banks shows
their unpreparedness for 2% of their three-year average
net profit spending on CSR projects yet for the FY 2014-
2015. The analysis further shows, though the Indian banks
are making efforts in the CSR areas, still there is a
requirement of more emphasis on CSR. Moreover, the
private sector banks have overall highest contribution in
CSR activities in comparison to the public sector banks. It
can be inferred from the study that the top performers in
terms of profitability and growth are not toping in the CSR
activities. The banking institution which caters to all
sectors for business and financial products and services
have a lot of the scope to partner their activities for CSR
projects as they are not just limited to a particular
geography or sector.
ACKNOWLEDGMENT
• www.mca.gov.in,
• www.ngobig.org,
• Economic Times (ET 500 ranking),
• www.CSRidentity.com, and
• Websites of the all the banks taken as sample for this
study.
REFERENCES
Ahmed, Homayara Latifa, Alam, Md. Jahangir and Jafar,
Saeed Alamgir Zaman Sawlat Hilmi (2008), A
Conceptual Review on Corporate Governance and
its effect on Firm’s Performance: Bangladesh
Perspective, AIUB Bus Econ Working Paper Series,
Vol.2008- 10, pp.1-24.
Dheeraj Tiwari, (2014), Government plans to form New
Company to manage CSR funds of PSO’s, Economic
Times (19th Feb. 2014), Page 11.
Margolis, J. D., and Walsh, J. P. (2007), Misery loves
companies: Rethinking social initiatives by
business, Administrative Science Quarterly, Vol.48,
pp.268–305.
Md. Al Mamun, Kazi Sohog and Ayesha Akhter (2013), A
Dynamic Panel Analysis of the Financial
Determinants of CSR in Bangladeshi Banking,
Asian Economic and Financial Review, 3(5):560-578
560.
Mona Kamal (2013), The Role of Corporate Social
Responsibility (CSR) in the Egyptian Banking Sector,
http://ssrn.com/abstract=2227621.
Narwal Mahabir. (2007), CSR initiatives of Indian banking
industry, Social Responsibility Journal, Vol.3 (4), pp.
49-60.
Sanjay Kanti Das (2012), CSR Practices and CSR Reporting
in Indian Financial Sector, International Journal of
Business and Management Tomorrow, Vol. 2 No. 9.
Sharma Nishi. (2011), CSR practices and CSR reporting in
Indian banking sector, International Journal of
Advanced Economic and Business Management,
Vol.1 (2), pp.58-66.
Suman Kalyan Chaudhury, Sanjay Kanti Das and Prasanta
Kumar Sahoo (2011), Practices of Corporate Social
Responsibility (CSR) in Banking Sector in India: An
Assessment, Research Journal of Economics,
Business And ICT, Volume-4, Page 76.
Prof. Dr. B. Ramesh
Faculty of Commerce
Goa University, Goa, Former Dean & HOD
Goa University, Goa
Former President - Indian Commerce Association
& Indian Accounting Association.
Email: [email protected]
Ms. Savia Mendes
Research Scholar
Goa University, M.Com., M.Phil.,
Associate. Prof.
Dep. of Com., M.E.S. College of Arts &
Commerce, Zuarinagar, Goa
Email: [email protected]
B. Ramesh and Savia Mendes

( 86 )( 86 )( 86 )( 86 )( 86 )
INTRODUCTION
In recent years, work life balance has gained much importance. An employee has a dual
responsibility of maintaining both work at the office/work place and family/personal
life. Time may come when he/she is not able to give the required time and attention to
both at the same time. In such cases he/she faces a ‘role strain’ where performing his/
her duty in one role may lead to conflict in performing his/her duty in the other/s role.
Goode (1960 P. 483-496) put forward the classic theory entitled ‘A Theory of Role Strain’.
He defined role strain as “the felt difficulty in fulfilling role obligations.” Ideally Work-
Life Balance (WLB) can be attained when the employee can balance both the work
domains and non-work domains, without infringing the rights of one for the other. The
employees in N.F.Railways have a serious duty at work, which is linked to the safety
and welfare of the passengers. The smooth running of the trains depends on the vigilance
of the railway employees, where a small mistake due to distraction can cause grave
incidents. However, they have their family obligations and other societal obligations,
which too they need to perform, to lead a balanced life that is satisfying. The interaction
between the two domains and how the personal lives of the employees contribute to
their work life is examined in this study.
REVIEW OF LITERATURE
Netemyer et al. (1996 P.400-410) has stated that “Two important focal points of adult life
are family and work. However, the role expectations of these two domains are not
always compatible, creating conflicts between work and family life.” They further opined
based on the work of experts (as Frone et al., 1992; Rice et al., 1992) that there is an
Key words:
Personal and work life,
work and non-work
domains.
Contribution of Personal Life to the Work Life ofthe Employees of N.F. Railways
Kumud Chandra Goswami and Sarah Yasmin Hussain
ABSTRACT
Work and non-work domains are two very important domains of an employee’s life. The study focuses on
how personal life can contribute to the work-life of the employees of N.F.Railways. A survey method was
used to collect data. The population (railway employee) in the study area is 1363 and 248 employees are
selected as sample for data collection. Multi-stage stratified proportional probability sampling according
to Pareto principle has been followed. For the executives a census survey has been conducted. It has
been found that 79.03% of the respondents find it difficult to manage their work and non-work domains.
94.90% these respondents who find it difficult to balance their work and non-work domains, attribute
their ability to work well to their personal life. A moderate to strong association has been found between
time available for personal activities after work and the personal life of the employees. The study reveals
that though there is a tug and pull between the work and non-work domains of the employees’ life, still
a very high percentage (84.28%) of the respondents report that their work-life does not suffer due to
their personal activities.
The Indian Journal of CommerceVol.68, No. 4, October-December 2015
( 87 )( 87 )( 87 )( 87 )( 87 )
“inverse relationship between job satisfaction and WFC
AND FWC”(WFC: Work Family Conflict and FWC: Family
Work Conflict).
Hayman (2005 P85-91) elucidates how ‘work family
conflict’ has been widely circulating in modern
organizational behaviour literature. He emphasizes a
broader term Work Life Balance, which he explained as,
more comprehensive to the “work/non work conflict”. He
is of the opinion that work life balance “offers a more
inclusive approach to the study of work/non work conflict
compared to work family conflict.”
Frone et al. (1997 P.145–167) found “that if the obligations
of one role frequently interfere with the enactment of a
second one, the level of in-role performance associated
with the second role may suffer.” The experts also “suggest
that work-related support may reduce work-to-family
conflict primarily by reducing work distress and work
overload.” They emphasize that work-family interface ‘is
a pivotal concern of both work and family researches.”
They point to modern demographic trends in the work
force as increased number of mothers who are working,
and also dual/single earning people.
In 2000, the UK (United Kingdom) launched the Work-Life
Balance Campaign (P1-11), which gave a thrust to
‘monitoring of work-life balance practices.’ This campaign
encourages employers to introduce practices for their
employees which will help them to balance their work
and private lives more successfully.”
Lu et al. (2008 P.1-21) is of the opinion that according to
prior research by Bruck, Allen & Spector (2002), “the more
time a person spends on the job, the more conflict there is
between work and family.”
Greenhaus & Beutell (1985 P.76-88) in their article put
forward a good definition of work/family conflict, as “a
form of inter-role conflict in which the role pressures from
the work and family domains are mutually incompatible
in some respects.”
OBJECTIVES OF THE STUDY
• To determine the contribution of personal life to the
work life of the employees of N.F.Railways.
SCOPE OF THE STUDY
The study focuses on the work and non-work domains of
the employees of Tinsukia Railway Division, serving in
Tinsukia and New Tinsukia Railway Station including
the Divisional office, falling under the North East Frontier
Railways.
SIZE OF THE SAMPLE AND SAMPLING FRAME
Multi-stage stratified proportional probability sampling
according to Pareto principle has been followed. The total
population (employee as on 31st January, 2014) in the study
area is 1363 consisting1334 (non-executives) and
29(executives). In total, 10 departments (excluding two i.e.
the Medical and Railway Protection Force) have been
selected for the study covering both executives and non-
executives employees serving in the study area. For the
executives a census survey has been conducted as the size
of the population is not significant. Selection of the different
categories of employees is done randomly from the
employees register maintained in the concerned offices.
DATA COLLECTION AND TOOLS USED
The researchers visited NF Railway offices, railway
stations, sites etc in the study area and distributed the
questionnaires to the employees. Factors considered in the
study are related to work-life balance as personal life and
work life, time available for personal work and balancing
difficulty experienced by the employees. A structured
questionnaire was used based on Likert scale with the
values ranging from 1 to 5 (the options for the answers
ranging from ‘Strongly agree’ to ‘Strongly disagree’). The
questionnaire has been constructed by consulting the work
of Fisher-McAuley2 et al. (2003) and Hayman6 (2005).The
survey was made during May, 2014 to June, 2015.
ANALYSIS AND INTERPRETATION OF DATA
The data collected relating to the work and non-work
domains are of ordinal type as such Somers’d, Kendall’s
tau-b, Spearman’s Rank Correlation and cross-tabulations
(contingency tables), bar chart, line chart, scatter plot,
frequency tabulations etc., have been used to analyse the
data to determine the contribution of the personal life of
the employees to their work-life balance.
Kumud Chandra Goswami and Sarah Yasmin Hussain

( 88 )( 88 )( 88 )( 88 )( 88 )
DETERMINANTS OF WORK-LIFE BALANCE
In this study the factors considered are related to work-life
balance as the personal life and work life of the employees,
time available for personal work and balancing difficulty
experienced by the employees.
Table 1 : Experience in Balancing Work and Non-work
Domains
Sl.No. Balance difficulty level
(clubbed) Frequency Percent
1. Not difficult 49 19.76
2. Neutral 3 1.21
3. Difficult 196 79.03
Total 248 100.0
Source: Field survey.
Table-1 shows that 79.03% (196) of the 248 respondents
report that they find it difficult to manage their work and
non-work domains. Only 19.76% of them (248) report that
they do not find it difficult to manage their work and non-
work domains. The five (5) balance difficulty categories
have been clubbed into three (3) for clarity of analysis and
understanding.
RELATIONSHIP BETWEEN BALANCE DIFFICULTY
AND ABILITY TO WORK WELL DUE TO THEIR
PERSONAL LIFE
Table-2 shows that 79.03% (196) of the 248 respondents
find it difficult to balance their work and non-work
domains. Interestingly, 94.90% (186) out of these 196
respondents who find it difficult to balance their work
and non-work domains attribute their ability to work well
to their personal life. In comparison only 19.76% (49) of
248 respondents do not find it difficult to balance their
work and non-work domains. They too in majority (95.92%,
that is 47 out of 49 respondents), attribute their ability to
work well to their personal life. Both balance difficulty
and ability to work well due to personal life have been
clubbed into three (3) categories for clarity of analysis and
understanding.
TIME FOR PERSONAL LIFE AND ITS IMPACT ON
THE EMPLOYEES’ PERSONAL LIVES
Table-3 shows that 52.82% disagrees and 6.85% strongly
disagrees that time is available for their personal activities
after work. This means that 59.67% (that is 52.82% + 6.85%)
of the 248 respondents do not get enough time for their
personal activities after work. Only 31.45% agrees and
1.61 strongly agrees that they do get time for their personal
activities after work. This means that only 33.06% (that is
31.45% + 1.61%) of the 248 respondents get time for their
personal activities after work.
Table-4 shows that 74.36% (58) of the 78 respondents who
get time for their personal activities after work disagree
that their personal lives suffer due to their work. Whereas,
64.12% (84) out of 131 respondents who do not get enough
time for their personal activities after work agrees that their
personal lives suffer due to their work. This suggests that
there is an association between time available for their
personal activities after work and the personal life of the
employees. It can be understood that overall, 43.15% (that
is 97 + 10 = 107) out of 248 respondents report that their
personal lives suffer due to their work, and 47.18% (that is
101 + 16 = 117) out of the 248 respondents report that their
personal lives do not suffer due to their work.
Table 2 : Cross-tabulation between Balance Difficulty and Ability to Work Well Due to Their Personal Life
Ability to work well due to personal life
(clubbed) Total
Sl.No. Balance difficulty level
(clubbed) Disagree Neutral Agree
1. Not difficult 1 1 47 49
2. Neutral 0 0 3 3
3. Difficult 4 6 186 196
Total 5 7 236 248
Source: Field survey.
Contribution of Personal Life to the Work Life of the Employees of N.F. Railways
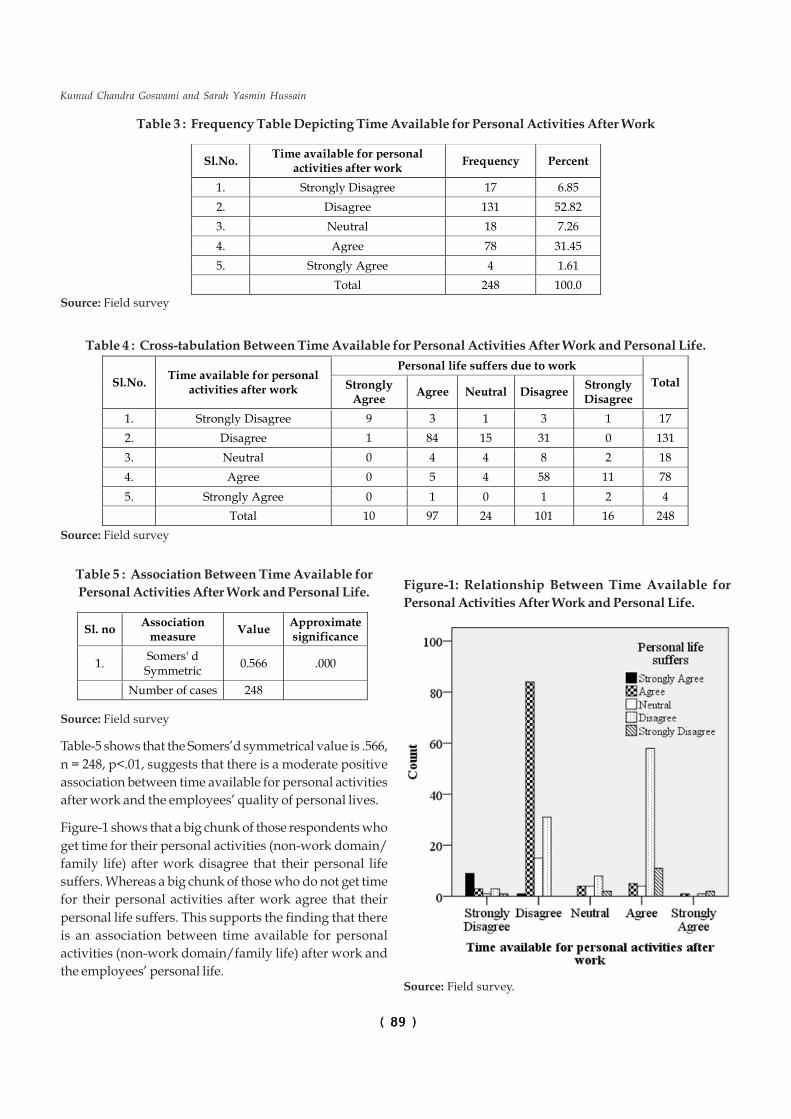
( 89 )( 89 )( 89 )( 89 )( 89 )
Table 5 : Association Between Time Available for
Personal Activities After Work and Personal Life.
Sl. no Association
measure Value
Approximate significance
1. Somers' d Symmetric
0.566 .000
Number of cases 248
Source: Field survey
Table-5 shows that the Somers’d symmetrical value is .566,
n = 248, p<.01, suggests that there is a moderate positive
association between time available for personal activities
after work and the employees’ quality of personal lives.
Figure-1 shows that a big chunk of those respondents who
get time for their personal activities (non-work domain/
family life) after work disagree that their personal life
suffers. Whereas a big chunk of those who do not get time
for their personal activities after work agree that their
personal life suffers. This supports the finding that there
is an association between time available for personal
activities (non-work domain/family life) after work and
the employees’ personal life.
Figure-1: Relationship Between Time Available for
Personal Activities After Work and Personal Life.
Source: Field survey.
Table 3 : Frequency Table Depicting Time Available for Personal Activities After Work
Sl.No. Time available for personal
activities after work Frequency Percent
1. Strongly Disagree 17 6.85
2. Disagree 131 52.82
3. Neutral 18 7.26
4. Agree 78 31.45
5. Strongly Agree 4 1.61
Total 248 100.0
Source: Field survey
Table 4 : Cross-tabulation Between Time Available for Personal Activities After Work and Personal Life.
Sl.No. Time available for personal
activities after work
Personal life suffers due to work
Total Strongly Agree
Agree Neutral Disagree Strongly Disagree
1. Strongly Disagree 9 3 1 3 1 17
2. Disagree 1 84 15 31 0 131
3. Neutral 0 4 4 8 2 18
4. Agree 0 5 4 58 11 78
5. Strongly Agree 0 1 0 1 2 4
Total 10 97 24 101 16 248
Source: Field survey
Kumud Chandra Goswami and Sarah Yasmin Hussain
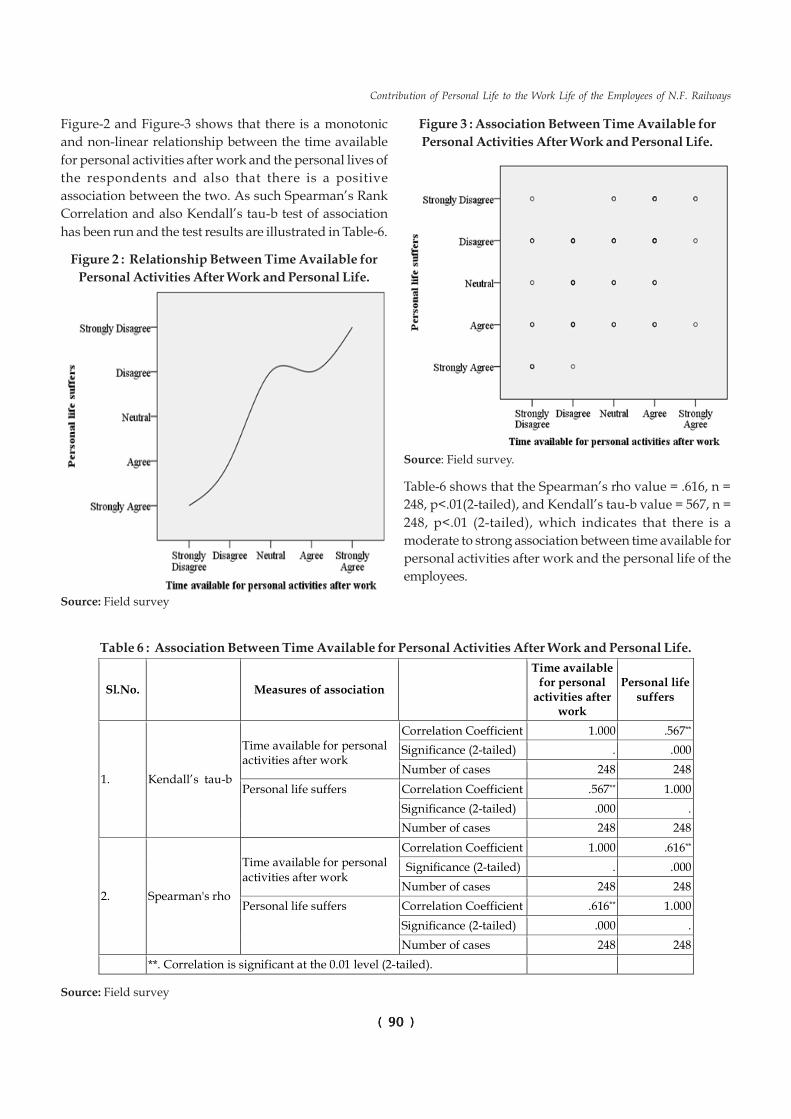
( 90 )( 90 )( 90 )( 90 )( 90 )
Figure-2 and Figure-3 shows that there is a monotonic
and non-linear relationship between the time available
for personal activities after work and the personal lives of
the respondents and also that there is a positive
association between the two. As such Spearman’s Rank
Correlation and also Kendall’s tau-b test of association
has been run and the test results are illustrated in Table-6.
Figure 2 : Relationship Between Time Available for
Personal Activities After Work and Personal Life.
Source: Field survey
Figure 3 : Association Between Time Available for
Personal Activities After Work and Personal Life.
Source: Field survey.
Table-6 shows that the Spearman’s rho value = .616, n =
248, p<.01(2-tailed), and Kendall’s tau-b value = 567, n =
248, p<.01 (2-tailed), which indicates that there is a
moderate to strong association between time available for
personal activities after work and the personal life of the
employees.
Table 6 : Association Between Time Available for Personal Activities After Work and Personal Life.
Sl.No. Measures of association
Time available for personal
activities after work
Personal life suffers
1. Kendall’s tau-b
Time available for personal activities after work
Correlation Coefficient 1.000 .567**
Significance (2-tailed) . .000
Number of cases 248 248
Personal life suffers
Correlation Coefficient .567** 1.000
Significance (2-tailed) .000 .
Number of cases 248 248
2. Spearman's rho
Time available for personal activities after work
Correlation Coefficient 1.000 .616**
Significance (2-tailed) . .000
Number of cases 248 248
Personal life suffers Correlation Coefficient .616** 1.000
Significance (2-tailed) .000 .
Number of cases 248 248
**. Correlation is significant at the 0.01 level (2-tailed).
Source: Field survey
Contribution of Personal Life to the Work Life of the Employees of N.F. Railways
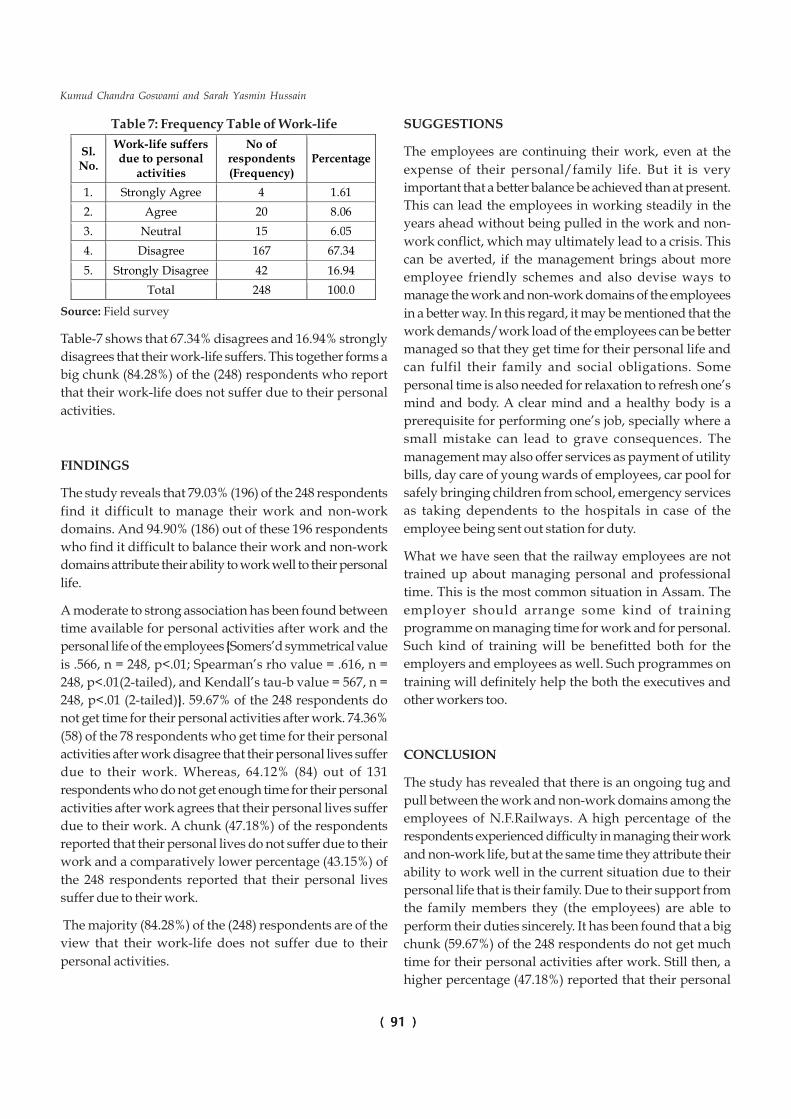
( 91 )( 91 )( 91 )( 91 )( 91 )
Table 7: Frequency Table of Work-life
Sl. No.
Work-life suffers due to personal
activities
No of respondents (Frequency)
Percentage
1. Strongly Agree 4 1.61
2. Agree 20 8.06
3. Neutral 15 6.05
4. Disagree 167 67.34
5. Strongly Disagree 42 16.94
Total 248 100.0
Source: Field survey
Table-7 shows that 67.34% disagrees and 16.94% strongly
disagrees that their work-life suffers. This together forms a
big chunk (84.28%) of the (248) respondents who report
that their work-life does not suffer due to their personal
activities.
FINDINGS
The study reveals that 79.03% (196) of the 248 respondents
find it difficult to manage their work and non-work
domains. And 94.90% (186) out of these 196 respondents
who find it difficult to balance their work and non-work
domains attribute their ability to work well to their personal
life.
A moderate to strong association has been found between
time available for personal activities after work and the
personal life of the employees {Somers’d symmetrical value
is .566, n = 248, p<.01; Spearman’s rho value = .616, n =
248, p<.01(2-tailed), and Kendall’s tau-b value = 567, n =
248, p<.01 (2-tailed)}. 59.67% of the 248 respondents do
not get time for their personal activities after work. 74.36%
(58) of the 78 respondents who get time for their personal
activities after work disagree that their personal lives suffer
due to their work. Whereas, 64.12% (84) out of 131
respondents who do not get enough time for their personal
activities after work agrees that their personal lives suffer
due to their work. A chunk (47.18%) of the respondents
reported that their personal lives do not suffer due to their
work and a comparatively lower percentage (43.15%) of
the 248 respondents reported that their personal lives
suffer due to their work.
The majority (84.28%) of the (248) respondents are of the
view that their work-life does not suffer due to their
personal activities.
SUGGESTIONS
The employees are continuing their work, even at the
expense of their personal/family life. But it is very
important that a better balance be achieved than at present.
This can lead the employees in working steadily in the
years ahead without being pulled in the work and non-
work conflict, which may ultimately lead to a crisis. This
can be averted, if the management brings about more
employee friendly schemes and also devise ways to
manage the work and non-work domains of the employees
in a better way. In this regard, it may be mentioned that the
work demands/work load of the employees can be better
managed so that they get time for their personal life and
can fulfil their family and social obligations. Some
personal time is also needed for relaxation to refresh one’s
mind and body. A clear mind and a healthy body is a
prerequisite for performing one’s job, specially where a
small mistake can lead to grave consequences. The
management may also offer services as payment of utility
bills, day care of young wards of employees, car pool for
safely bringing children from school, emergency services
as taking dependents to the hospitals in case of the
employee being sent out station for duty.
What we have seen that the railway employees are not
trained up about managing personal and professional
time. This is the most common situation in Assam. The
employer should arrange some kind of training
programme on managing time for work and for personal.
Such kind of training will be benefitted both for the
employers and employees as well. Such programmes on
training will definitely help the both the executives and
other workers too.
CONCLUSION
The study has revealed that there is an ongoing tug and
pull between the work and non-work domains among the
employees of N.F.Railways. A high percentage of the
respondents experienced difficulty in managing their work
and non-work life, but at the same time they attribute their
ability to work well in the current situation due to their
personal life that is their family. Due to their support from
the family members they (the employees) are able to
perform their duties sincerely. It has been found that a big
chunk (59.67%) of the 248 respondents do not get much
time for their personal activities after work. Still then, a
higher percentage (47.18%) reported that their personal
Kumud Chandra Goswami and Sarah Yasmin Hussain

( 92 )( 92 )( 92 )( 92 )( 92 )
lives do not suffer due to their work. Comparatively lower
percentage (43.15%) of the 248 respondents who reported
that their personal lives suffer due to their work. Also, it
has been found that time available for personal activities
impact on the personal lives of the employees. In fact, a
moderate to strong association has been found between
time available for personal activities after work and the
employees’ personal lives (meaning whether personal life
suffers/does not suffer). But a very high percentage
(84.28%) of the (248) respondents reported that their work-
life does not suffer due to their personal activities. The
findings suggest that due to employees’ personal lives they
are able to perform their duties faithfully and with a clear
mind.
REFERENCES
European Foundation for the Improvement of Living and
Working Conditions, 2007, “Work-life balance
attitudes and practices in British workplaces, p.1-
11.” http://www.eurofound.europa.eu, accessed on
24.11.2014.
Fisher-McAuley, Stanton, J.M., Jolton, J.A & Gavin, J. (2003),
“Modelling the relationship between work life
balance and organisational outcomes.” Paper
presented at the Annual Conference of the Society for
Industrial-Organisational Psychology. Orlando, 1-26.
Frone et al., (1997), “Developing and Testing an Integrative
Model of the Work-Family Interface.” Journal of
Vocational Behavior, 50, Article No.VB961577,
pp.145–167.
Goode,W.J.(1960), “ A Theory of Role Strain.” American
Sociological Review, Vol. 25, No. 4, pp. 483-496.
http://www.jstor.org/stable/2092933. Accessed
on 23.06.2014.
Greenhaus , J.H. & Beutell, N. J.(1985), “Sources of conflict
between of work and family roles.” Academy of
Management Review, Vol.10, No.1, pp.76-88. http:/
/www.jstor.org/stable/258214, accessed: 23/06/
2014.
Hayman, J. (2005), “Psychometric Assessment of an
Instrument Designed to Measure Work Life Balance.”
Research and Practice in Human Resource
Management, 13(1), pp85-91. http://
rphrm.curtin.edu.au/2005/issue1/balance.html.
Accessed on 11.12.2013.
Lu,L., Kao, S., Chang, T., & Cooper, C. (2008), “Work/Family
Demands, Work Flexibility, Work/Family Conflict,
and Their Consequences at Work: A National
Probability Sample in Taiwan.” International Journal
of Stress Management, Vol.15, No.1, pp.1-21
(WorkFamily Demands, Work Flexibility,
WorkFamily Conflict, and Their Consequences at
Work A National Probability Sample in Taiwan.pdf).
http://www.web.ba.ntu.edu.tw. Accessed on
19.11.2013.
Netemeyer, R.G, Boles, J.S. & McMurrian, R. (1996),
“Development and Validation of Work-Family
Conflict and Family-Work Conflict Scales.” Journal
of Applied Psychology, Vol. 81. No. 4, pp.400-410.
http://www.psychwiki.com. Accessed on
11.12.2013.
Dr. Kumud Chandra Goswami
Professor
Department of Commerce,
Dibrugarh University, Assam
India
Email:[email protected]
Sarah Yasmin Hussain
Research Scholar
Centre for Management Studies,
Dibrugarh University, Assam
India,
Email: [email protected].
Contribution of Personal Life to the Work Life of the Employees of N.F. Railways

( 93 )( 93 )( 93 )( 93 )( 93 )
INTRODUCTION
In today’s highly competitive business scenario, the human resource is the most critical
resource among all the resources any organization needs to produce. Every organization
wants to achieve success and have desire to get constant progress in their daily business
activities. An organization can have sustainable competitive advantages only when it
possesses a unique human capital. All the other resources such as financial,
technological or physical resources might prove wastage if the firm does not possess an
excellent group of people who will be handling these resources. The current trend in the
world today is highly competitive. Organizations regardless of their size, market share
and technology are facing employees (workers) retention challenges. The human
resource will become richer by passage of time and experience. This of course does not
happen automatically and the organization will have to invest in its human resources
in order to transform them into true resource that will add value to the organization.
There have been various ways to retain employees in job for a longer period of time –
from deferred payment to offer bonus related to their tenure in their job to even tying
them with bond or other types of financial contracts.
These days the management of an organization is facing two main challenges related to
motivation; the first challenge is to motivate workers towards helping the organization
to achieve its goal, while the second is to motivate workers to achieve their own personal
goals. Meeting the needs and achieving the goal of both the management and workers
is often a difficult task in all types of organizations all over the world. Any organization
can neither progress nor achieve success until and unless the employees of the
organization are satisfied with it, are motivated for the task fulfillment and goals
achievement and encouraged. Several studies on motivation and job performance in
India attempt to focus on typical organization like manufacturing sector, local
Key words:
Hygiene Factors, Motivational
Factors, Retention
Applicability of Two Factor Theory of Motivationon Private University Teachers : An EmpiricalStudy
Bhagirath Singh, Manoj Meet and Somya Choubey
ABSTRACT
Herzberg’s two factors theory describes the concepts of Hygiene/ Maintenance factors and Motivational
Factors/ Motivators were taken as a major component for this study. The purpose of this study is to
assess the applicability of two factor theory of motivation on private university teachers. In this research
paper, various theories based on motivation were taken into consideration. An attempt was made to
check whether all hygiene factors and motivational factors play the similar role in private universities.
This is an empirical study and data were collected through questionnaire using likert scale. Data were
analyzed by using various statistical tools like descriptive statistics, ANOVA and Correlation. The
findings of this study revealed that there is a strong desire of hygiene and motivational factors, which has
been propounded in Herzberg’s two factor theory among private university teachers. Salary and
retention rate are directly correlated. University teachers refrain from long working hour
The Indian Journal of CommerceVol.68, No. 4, October-December 2015

( 94 )( 94 )( 94 )( 94 )( 94 )
government and construction industry but, very few
researchers had studied various factors at different levels
which influence the behavior of the employees of higher
education particularly in the private universities. This
study is based on the mixed statistical method to evaluate
relationship between motivation and satisfaction level in
employees in private universities in NCR Region including
Delhi and Alwar District.
Four content theories of motivation propounded by various
psychologists such as Maslow need hierarchy theory,
Herzberg’s two factors theory, Alderfer’s ERG theory, Mc
Clelland’s achievement theory which explains various
factors which influences the level of motivation among
working individuals.
Aldefer (1969) too, in the tune of Maslow, proposes that
human needs are arranged in a hierarchical order and
individual progresses from lower level needs to the higher
order needs. However, he condensed the 5 levels of needs
as identified by Maslow into 3 basic categories. Thus, the
existence needs in Alderfer’s ERG model are concerned
with basic survival and sustenance needs and cover both
physiological and physical safety needs in the Maslow
model. The higher order is known as “Relatedness needs”
and concerned with relationship to the social environment
which is equivalent to the need for belongingness in
Maslow model. Growth needs, the last level of needs in
the echelon are concerned with the self-esteem and self
actualization needs in the need hierarchy model.
Douglas McGregor (1960) after analyzing the way
managers behave with their employees concluded that
managers might be categorized on the basis of their
assumptions about the human nature into two distinct
groups. Once set of assumptions called “theory X” by
McGregor, represents the lower order needs whereas
“theory Y” depicts the higher order needs of Maslow needs.
David C McClelland (1988) identified three needs or
motivators- Need for achievement, Need for power, and
Need for affiliation. He believes that each person has a
need for all the three but the people differ in the degree to
which the various need motivate their behavior.
Though the most widely discussed theory of motivation is
propounded by Abraham Harold Maslow (1954). Maslow
suggested that human needs may be categorized in five
broad areas, arranged in a definite order according to their
level of importance for the person or what is called
hierarchy. The foremost level of needs for an individual is
the physiological needs which include hunger, thirst, need
for oxygen, temperature regulation and so on, which are
essential for the survival of organism. Need for rest, sleep,
sensory pleasure, mental behavior and arguably sexual
desire also fall under this category. The next level need is
denoted by the safety needs that include need for safety
and security, freedom from pain or threat of physical attack,
protection from danger. These also include need for
predictability and a sense of security against uncertainty.
The third level is known as social needs. These arise when
physiological and safety needs are satisfied. These needs
include the sense of belongingness, friendliness,
acceptance and rejection. The fourth level as known as the
esteem needs, which include both self-esteem and esteem
from others. Self-esteem involves desire for confidence,
strength, autonomy and achievement. Esteem of other
involves reputation or prestige, status, recognition and
appreciation.
After fulfilling all the above four level of needs an individual
want to attain the highest level of needs in the hierarchy
that is self-actualization needs. It refers to the drive to
become what one is capable of becoming. These may take
many forms, which vary widely from one individual to
another from actualizing one’s potential talent to the
spiritual quest. According to Maslow, once a lower level
need gets reasonably satisfied, it is no longer a motivator
any more. Now the needs in the next higher level of the
hierarchy start to dominant influence on the individual.
This study is based on the Herzberg’s two factor motivation
theory. In 1959, Herzberg modified Maslow’s needs theory
and consolidated two areas of need that motivates
employees. The two factors are:
(i) Hygiene/Maintenance Factors: These were featured
as lower level motivations which consist of company
policy and administration, supervision,
interpersonal relationship between peers,
interpersonal relationship between superiors,
interpersonal relationship between subordinates,
working condition, salary, personal life, status and
security.
(ii) Motivation Factors/Motivators: He emphasized on
higher level factors of motivation and focused on
aspect of work such as achievement, recognition,
advancement, work itself, responsibility and growth
or advancement.
Applicability of Two Factor Theory of Motivation on Private University Teachers : An Empirical Study
( 95 )( 95 )( 95 )( 95 )( 95 )
The Herzberg theory emphasized on salary, working
conditions, job satisfaction, recognition and achievement
etc. as a factor that play vital role in motivating employees
to commit their effort on the task assigned by the
organization.
REVIEW OF LITERATURE
Motivation is considered to be a soul achievement of human
resources management practices as almost all the human
resource practices has fundamental aim which includes
job involvement and job satisfaction of an employee and
acquiring high level of work motivation (Jerris, 1999).
In today’s competitive environment, no organization can
sustain without increased workers’ motivation and this
activity has to be continued for a longer period. (Robbins
et. al., 2005) said that employee’s motivation is the
“willingness to exert high level of inspiration to reach
organizational goals, conditioned by the efforts ability to
satisfy some individual need”. This definition clearly states
that motivation is the willingness of employees to perform
work efficiently and voluntarily; this willingness is the
result of need satisfaction and it only comes when they
perceive that their efforts are recognized.
Employee’s motivation can only be attained by realizing
him/her that his/her individual needs or goals are very
crucial for the organizational success and their individual
efforts are aligned with organizational goals or
achievement. Organizations need to explore various
intrinsic and extrinsic motivators for its employees so that
they can contribute in the organizational success in the
long run.
(Nohria, 2008) revealed in a study that motivation is
measured by multidisciplinary indicators like engagement,
satisfaction, commitment and intention to quit.
(Rainey, 2001) emphasizes that work motivation refers to
the level of direction, persistence and excitement of effort
in work settings that a person tries to work hard and well.
Although money is influential factor at every stage but at
the same time it is not necessary that money alone can
increase the level of motivation of every employee, high
achievers they don’t get motivated by money but, they get
motivated by recognition, achievement, advancement,
instant feedbacks, moderate challenging work, etc. that
are primary motivators for the workers inspiration to
perform effectively (Fuhrmann, 2006).
OBJECTIVES OF THE STUDY
• To identify the prominent factors given by Herzberg
which influences the level of motivation among
teachers in private universities.
• To assess the relationship between employees
remuneration and retention rate in private
universities.
• To assess the relationship between working
conditions and retention rate in private universities.
HYPOTHESES
Keeping in view the objectives, the following hypotheses
have been formulated for the study
H01
There is no significant difference between the means
of various hygiene and motivational factors among
the private university teachers.
H02
There is no direct relationship between salary and
retention rate of employees in private universities.
SCOPE OF THE STUDY
Delhi NCR is considered as an education hub for the
higher education. The people of these areas have more
resources and means for educating their children; hence,
there is a lot of potential for private universities as there
are very few government universities located in these areas.
Alwar district is an ideal district because it is very much
near to the capital of the country. Thus, it has better
connectivity, infrastructure and communication facilities
due to which most of the private universities are interested
to operate their business in this area.
Thus, NCR Region including Delhi and Alwar district
had been selected for the sample study. Many renowned
and reputed private universities like Amity University, ITM
University, Raffles University, NIIT etc. have been covered
for generating the responses. The selection of sample
private universities has done by using convenience
sampling method.
SAMPLING TECHNIQUE
Universe: Private Universities across India.
Bhagirath Singh, Manoj Meet and Somya Choubey

( 96 )( 96 )( 96 )( 96 )( 96 )
Sampling Unit: Sampling unit is limited to the Delhi NCR
and Alwar district of Rajasthan.
Sample Size: 191 employees (teaching) of various private
universities from the sample region.
Sampling Design: Convenience sampling is adopted on
the ground of availability, convenience to access and level
of participation.
Almost equal numbers of respondents have been taken in
the age group of 25-35, 35-45 and above 45 years across
the different income levels and with different educational
background and qualifications.
DATA COLLECTION
Since the primary objective of this research work is to
identify various factors of motivation among employees
in private universities. The present study is mainly based
on the primary data collected with the help of the
structured questionnaire and disguised interactive method.
All the data for the purpose of the study and deep analysis
had been collected during the field work. Preliminary data
had been collected from 10 randomly selected universities.
During the survey in these areas, the researchers took
interviews on the basis of prepared standard questionnaire
of about 20-25 persons in every university.
Primary Data: The structured questionnaire and disguised
interactive method were used to collect the primary data.
The questionnaire has both open-ended and closed-ended
questions.
Secondary Data: Books, Journals, Magazines, Newsletters
of the various universities and Internet.
DATA ANALYSIS AND INTERPRETATION
The responses were generated from 207 respondents. The
elimination of questionnaire was done for 16
questionnaires as responses were not duly filled. Thus,
the responses in respect of 191 respondents could be
finally taken as sample size. The collected data was put
on Likert Scale as follows- Strongly Agree- 5, Agree- 4,
Neutral-3, Disagree-2, Strongly Disagree- 1. Data has been
analysed using different statistical tools like Descriptive
Statistics, ANOVA & Correlation.
Table 1 : Analysis of various factors of motivation
among employees in private universities
S. No.
Hygiene Factors and Motivators
Mean Std. Dev.
Coefficient of Variance
1 Job Security 4.62 0.69 14.94
2 Salary 4.86 0.80 16.46 3 Quality of
Supervision 4.55 0.66 14.51
4 Working Condition
4.65 0.64 13.76
5 Organization's Policy &Administration
4.61 0.71 15.40
6 Interpersonal Relation
3.91 0.78 19.95
7 Personal Life 3.78 0.84 22.22
8 Autonomy & Responsibility
4.09 0.72 17.60
9 Growth and Advancement
4.32 0.88 20.37
10 Achievement 4.43 0.72 16.25
11 Work Itself 4.00 0.84 21.00
12 Recognition 4.03 0.89 22.08
Table 2 : ANOVA
ANOVA
SS Df Variance F P
Between 230.5483 11 25.6165
45.826 0.0000
Within 1151.664 2060 0.5591
Total 1382.212 2071
Table 1 & 2 shows the descriptive statistics and & ANOVA
results comparing the effects of various Hygiene and
Motivational factors on the employees in Private
Universities. The values of descriptive statistics show that
various factors of motivation explored by Herzberg in the
Two Factor theory are desirable at the workplace in private
universities. This statistics confirms that the hygiene
factors excluding Interpersonal Relationships and
Personal life are used as maintenance factors because
calculated values of mean are extremely high and
coefficient of variance are respectively low. Also the
statistics reveal that the motivational factors are equally
desired at a moderate rate.
The Analysis of variance (ANOVA) is asserting that the p-
value is <0.05. This is evidencing that null hypothesis is
rejected and alternative hypothesis is accepted. The f-value
is prominently greater than the table value which indicates
that there is a significant difference between the means of
mentioned groups.
Applicability of Two Factor Theory of Motivation on Private University Teachers : An Empirical Study

( 97 )( 97 )( 97 )( 97 )( 97 )
Table 3 : Preference of Hygiene and Motivational
Factor
S.No Factors Frequencies of first preference
1 Hygiene 126
2 Motivational 65
Total 191
* Though the study was taken into consideration for 207
faculty members, but while analyzing the preferences of
hygiene and motivational factors only 191 responded to
the questionnaire where as 16 did not make their
preferences.
Table 4 : Relationship between salary and retention
rate of employees in private universities
R, R-squared value and S.E. Values
Correlation coefficient between salaries and tenure of job
0.9395
R-squared value 0.8826
Standard Error 0.4578
Table-4 depicts the coefficient of correlation between salary
and retention rate of employees in private universities in
the investigated population. Calculated coefficient of
correlation is 0.9395, which indicates that there is a high
degree of positive correlation between salary and retention
rate of employees. It further explains that salary plays an
important role in retaining and motivating the teaching
staff in the private universities. R-squared value which is
0.8826 also supports a proportionate linear relationship
between salary and retention rate. Therefore, second null
hypothesis is rejected, hence there is a direct relationship
between salary and retention rate of employees in private
universities.
FINDINGS AND CONCLUSION
The findings of this study state that hygiene factors such
as salary, job security, working conditions, quality of
supervision, organization’s policy & administration are
highly desirable and have a high degree of influence on
the teaching employees of private university. There is a
neutral view towards interpersonal relationship and
personal life in faculty members of private universities.
Motivational factors such as autonomy & responsibility,
growth and advancement, achievement and recognition
are strongly desirable at the work place. The hygiene
factors have a preference over the motivational factors by
the respondents.
There is a direct relationship between quantum of salaries
and tenure of retention. The retention rate of university
teachers in private universities is very low. Also the
teachers refrain from longer working hours and
unfavorable environment as large number of respondents
have given the above reasons for quitting the previous
colleges/ institutions.
The research also confirms the applicability of Herzberg’s
two factors theory in private universities. In fact, Herzberg
two factors theory is more relevant in current time as the
average respondents respond to the given option “strongly
desirable” in the questionnaire. The results show that the
two factor theory will be more applicable and will be of
great importance in this cut throat competitive world.
SUGGESTIONS
On the basis of the survey and the focus interviews during
the course of study, the researcher offers to make following
suggestions:
• Private universities should focus on maintaining
hygiene and motivational factors so that teachers
can work efficiently and can be able to contribute
towards the growth and development of private
universities.
• Policies regarding rewards and benefits to the
employees should be appropriate as there is a direct
relationship between salary and retention rate in
private universities.
• Private universities should keep in mind the factors
like working hours and conducive environment etc.
while formulating the curriculum of the institution.
• As the study depicts the low level of interpersonal
relationship and personal life activities. Therefore,
the university may give due importance to
interpersonal relationship while framing the policies
for the employees welfare.
REFERENCES
Kothari, C. R. (2004), Research Methodology Methods and
Techniques, New Age International Publishers.
Argyrous, G. (2011), Statistics For Research, SAGE
Publication India Pvt Ltd.
Bhagirath Singh, Manoj Meet and Somya Choubey

( 98 )( 98 )( 98 )( 98 )( 98 )
Dessler, G. (1980). Human Behavior: Improving
Performance at Work. Reston Publishing Company,
Inc.
Fuhrmann, T. D. (2006). Motivating Employees. Advances
in Diary Technology, 18, 93-101.
Herzberg, F. M., & Snyderman, B. (1959). The Motivation
of Works. New York: John Wileyand Sons.
Jerris, A. L. (1999). Human Resource Management for
Hospitality. New Jersy, USA,Upper Saddle River:
Prentice-Hall, Inc.
Prasad L M (2008). Organizational Behaviour. Sultan
Chand & Sons, New Delhi, 176-191.
Maslow, A. H. (1943). A Theory of Human Motivation. 50,
370.
Nohria, N., Groysberg, B., & Lee, L.-E. (2008). Employee
Motivation: A Powerful New Model. Harvard
Business Review, 1-8.
Robinns, S. P., & Coulter, M. Management (international
edition no 7 ed.). Prentice Hall Inc.
Lewin, K. L. (1936). Principles of topological psychology.
(F. Heider, & G. M. Heider, Trans.). New York:
mcgrawhill.
Mcclelland, D. C. (1987). Human motivation. Cambridge:
Cambridge University Press.
Mcclelland, D. C., & Boyatzis, R. E. (1982). Leadership
motive pattern and long-term success in
management. Journal of Applied Psychology, 67,
737-743.
Winter, D. G. (1992). Power motivation revisited. In C. P.
Smith (Ed.). Motivation and personality: Handbook
of thematic content analysis (pp. 301-310). New
York: Cambridge University.
Locke, E. A., & Latham, G. P. (1984). Goal setting: A
motivational technique that works. Englewood
Cliffs, NJ: Prentice Hall.
Prof. (Dr.) Bhagirath Singh
Vice Chancellor
Raffles University, Neemrana
Mr. Manoj Meet
Assistant Professor
Raffles University, Neemrana
Dr. Somya Choubey
Assistant Professor
Raffles University, Neemrana
Applicability of Two Factor Theory of Motivation on Private University Teachers : An Empirical Study

( 99 )( 99 )( 99 )( 99 )( 99 )
Sr. No. Year Venue of the Conference President
1 1947 Lucknow University, Lucknow Shri. Padmpat Singhania, Kanpur
2 1948 Calcutta University, Calcutta Prof. M.K. Ghose, Allahabad Unvierstiy, Allahabad
3 1949 Aligarh Muslim Unversity, Aligarh Sir Chunnilai B. Meheta, Bombay
4 1950 Allahabad University, Allahabad Prof. B.N. Dasgupta, Lucknow
5 1951 Madras University, Madras Sir R.K.Shanmukham Chetty
6 1952 Delhi Universtiy, Delhi Sri. V.K.R.V. Rao, New Delhi
7 1953 Banaras Hindu Universtiy, Varanasi Sir Shri Ram, Delhi
8 1954 University of Rajasthan, Jaipur Dr. B.R. Mishra, Patna University, Patna
9 1955 Osmania University, Hyderabad Sri, B.L. Jalan, Calcutta
10 1956 Bihar University, Ranchi Dr. S.K. Basu, Calcutta
11 1957 Nagpur Universtiy, Nagpur Sri L.M. Biria, Calcutta
12 1958 Hubli, Dharwad Prof. A.Dasgupta, New Delhi
13 1959 Punjab Universtiy, Chandigarh Sir Jahangir Gandhi, Jamshedpur
14 1960 Jabalpur University, Jabalpur Dr. A.N. Agarwal, Allahabad University, Allahabad
15 1961 Andhra University, Valtair Shir Madan Mohan, R.ruiya, Bombay
16 1962 Mysore University, Mysore Sri K.K. Das, Andhra University, Waltair
17 1963 Agra University, Agra Shri P.L. Tandon, Bombay
18 1964 Poona University, Poona Dr. A. N. Agrawala, Allahabad
19 1965 Vallabhabhai Vidyapith Prof. M.C. Shukla, Delhi
20 1966 Jiwaji University, Gwalior Dr. K.C. Sarkar, Lucknow
21 1967 Gorakhpur University, Gorakhpur Marathwada University, Aurangobad
22 1968 Marathwada Univesity, Aurangabad Dr. R.L. Agarwal, Gorakhpur University, Gorakhpur
23 1969 Ernakulam Shri, R.B. Shah, Calcutta
24 1970 B.Y.K. College, Nasik Shri R.B.Shah, Calcutta
25 1971 Karnataka University, Dharwar Dr. C.B. Gupta, S.R. College, Delhi
26 1972 Burdwan University Shri Kedar Nath Modi, Modinagar
27 1973 Shivaji University, Kolhapur Shri M.R. Tokei, Nagpur
28 1974 Andhra University, Waltair Shri Rama Krishna Bajaj Bombay
29 1975 Banaras Hindu University, Varanasi Prof. K.V. Sivayya, Andhra University, Visakhapatnam
30 1976 Patna University, Patna Prof. S.M. Tiwari, B.H.U., Varanasi
31 1977 University of Rajasthan, Jaipur Dr. N.L. Nadda, Patna University , Patna
32 1978 Gokhale Educational Society, Nasik Prof. Om Prakash, Rajasthan University,
Jaipur
33 1979 Shivaji University, Kolhapur Dr. M.S. Gosavi , Nasik
34 1980 Birla Institute of Technology, Ranchi Prof. A.D. Shinde, Shivaji University, Kolhapur
35 1981 Burdwan University Dr. C.D. Singh, Bhagalpur University, Bhagalpur
36 1982 Ravenshaw College , Cuttack Dr. D.S. Ganguli, Burdwan University
37 1983 Mysore University, Mysore Prof. B.K. Mohanty, Bhubaneshwar
38 1984 L.N.Mithila University, Darbhanaga Prof. B.K. Muniramappa, Mysore University, Mysore
39 1985 Banaras Hindu University, Varanasi Prof. Gopal Lall, L.N. Mithila University, Darbhanga
40 1986 Kerala University, Trivendrum Prof. R.A. Singh, B.H.U., Varanasi
LIST OF PAST PRESIDENTS ICA
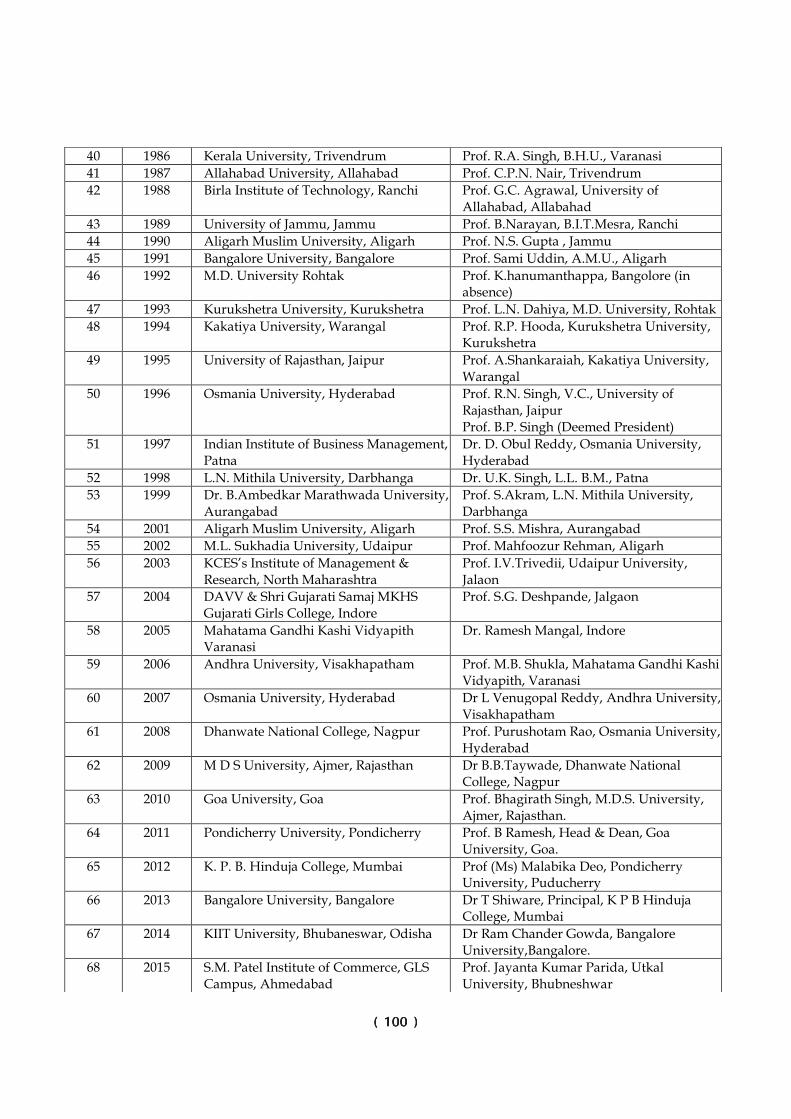
( 100 )( 100 )( 100 )( 100 )( 100 )
40 1986 Kerala University, Trivendrum Prof. R.A. Singh, B.H.U., Varanasi
41 1987 Allahabad University, Allahabad Prof. C.P.N. Nair, Trivendrum
42 1988 Birla Institute of Technology, Ranchi Prof. G.C. Agrawal, University of Allahabad, Allabahad
43 1989 University of Jammu, Jammu Prof. B.Narayan, B.I.T.Mesra, Ranchi
44 1990 Aligarh Muslim University, Aligarh Prof. N.S. Gupta , Jammu
45 1991 Bangalore University, Bangalore Prof. Sami Uddin, A.M.U., Aligarh
46 1992 M.D. University Rohtak Prof. K.hanumanthappa, Bangolore (in absence)
47 1993 Kurukshetra University, Kurukshetra Prof. L.N. Dahiya, M.D. University, Rohtak
48 1994 Kakatiya University, Warangal Prof. R.P. Hooda, Kurukshetra University, Kurukshetra
49 1995 University of Rajasthan, Jaipur Prof. A.Shankaraiah, Kakatiya University, Warangal
50 1996 Osmania University, Hyderabad Prof. R.N. Singh, V.C., University of Rajasthan, Jaipur Prof. B.P. Singh (Deemed President)
51 1997 Indian Institute of Business Management, Patna
Dr. D. Obul Reddy, Osmania University, Hyderabad
52 1998 L.N. Mithila University, Darbhanga Dr. U.K. Singh, L.L. B.M., Patna
53 1999 Dr. B.Ambedkar Marathwada University, Aurangabad
Prof. S.Akram, L.N. Mithila University, Darbhanga
54 2001 Aligarh Muslim University, Aligarh Prof. S.S. Mishra, Aurangabad
55 2002 M.L. Sukhadia University, Udaipur Prof. Mahfoozur Rehman, Aligarh
56 2003 KCES’s Institute of Management & Research, North Maharashtra
Prof. I.V.Trivedii, Udaipur University, Jalaon
57 2004 DAVV & Shri Gujarati Samaj MKHS Gujarati Girls College, Indore
Prof. S.G. Deshpande, Jalgaon
58 2005 Mahatama Gandhi Kashi Vidyapith Varanasi
Dr. Ramesh Mangal, Indore
59 2006 Andhra University, Visakhapatham Prof. M.B. Shukla, Mahatama Gandhi Kashi Vidyapith, Varanasi
60 2007 Osmania University, Hyderabad Dr L Venugopal Reddy, Andhra University, Visakhapatham
61 2008 Dhanwate National College, Nagpur Prof. Purushotam Rao, Osmania University, Hyderabad
62 2009 M D S University, Ajmer, Rajasthan Dr B.B.Taywade, Dhanwate National College, Nagpur
63 2010 Goa University, Goa Prof. Bhagirath Singh, M.D.S. University, Ajmer, Rajasthan.
64 2011 Pondicherry University, Pondicherry Prof. B Ramesh, Head & Dean, Goa University, Goa.
65 2012 K. P. B. Hinduja College, Mumbai Prof (Ms) Malabika Deo, Pondicherry University, Puducherry
66 2013 Bangalore University, Bangalore Dr T Shiware, Principal, K P B Hinduja College, Mumbai
67 2014 KIIT University, Bhubaneswar, Odisha Dr Ram Chander Gowda, Bangalore University,Bangalore.
68 2015 S.M. Patel Institute of Commerce, GLS Campus, Ahmedabad
Prof. Jayanta Kumar Parida, Utkal University, Bhubneshwar

Dr. Pushkarnath Professor, Deptt. of Commerce & Management, Gossner College, Ranchi-834008
Dr. Dharmendra K Tiwari Prof. & Dean ,PG Deptt.of Commerce, BKS University, Ara, Bihar
Dr. Sanjay Kr Sinha Head, Department of Financial Studies, VBS Purvanchal University, Jaunpur
Dr. S L Gupta Professor, Department of Management, Birla Institute of Technology, (Deemed University) Campus – Noida
Prof. H Venkateshwarlu Department of Commerce,Osmania University, Hyderabad - 500 007, Andhra Pradesh
Dr. S G Hundekar Professor, Department of Studies in Commerce, Karnatak University, Dharwad-580 003
Dr. T P Madhu Nair Dean, Faculty of Commerce,University of Mumbai, Principal, Nirmala Memorial Foundation College of Comm., Kandivali (East), Mumbai-400 101.
Prof. J P Sharma Department of Economic Administration and Financial Management, University of Rajasthan,Jaipur
Dr. Debabrata Mitra Professor, Department of Commmerce, University of North Bengal, PO. NBU, District Darjeeling-734013 (WB)
Dr. Ran Singh Dhaliwal Professor, School of Management Studies, Punjabi University, Patiala, Punjab
Dr. Sharada Gangwar Professor, Institute for Excellence in Higher Education, Bhopal
Dr. Shashank Bhushan Lall Associate Professor, Vanijya Mahavidyalay, Patna University, Patna
Prof. B. P. Saraswat Professor, Department of Commerce, MDS University, Ajmer
Dr. Sangale Babasaheb Rambhau Professor, BJS College, Wagholi, Pune
Prof. M. Jayappa RBANMS College, Bengaluru
Dr. Ramesh Agadi Professor of Management, Gulbarga University, Gulbarga
Dr. Gurcharan Singh Professor, School of Management Studies, Punjabi University Patiala – 147002, Punjab, India
Dr. Jasveen Kaur Assistant Professor, University Business School, Guru Nanak Dev University, Amritsar-143005
Prof. G P Prasain Department of Commerce, Manipur University,Canchipur, Imphal-795003, Manipur
Dr. Maheshwar Sahu Professor at P.G.Department of Commerce, Utkal University, Bhubaneswar
Dr. Laxman Kisan Karangale B B College, Lonar
Dr. S A Chintaman H K Commerce College, Ahmedabad
Prof. Indrasena Reddy Department of Commerce & Management, Kakatiya University, Warangal-506 009 (A.P).
Dr. M Shivalingegowda Associate Professor, Vidyavardhaka First Grade College,Sheshadri Iyer Road, Mysore-570 001.
Managing Trustee of ICA
Dr. Ajay Singh Associate Professor, Faculty of Commerce and Business, Delhi School of Economics, University of Delhi, Delhi
EXECUTIVE COMMITTEE MEMBERS FOR AICCth
68

Sessions Chairpersons Co-Chairpersons
I BEHAVIOURAL FINANCE : Dr. G. Raju Dr. K. Nirmala EMERGING DIMENSIONS Professor of Commerce, Assistant Professor School of Business Management Department of Commerce, & Legal Studies, University of Bangalore University, Kerala, Kariavattam P.O. Bengaluru 560001 Thiruvananthapuram 6950581, (M) 09481715304/09845415304 Kerala, India [email protected]. (M) 09496254542, [email protected]
II E-RETAILING : CHALLENGES Dr. Awadhesh Kumar Tiwari Dr. Rajeshwary G. & OPPORTUNITIES Professor, Department of Commerce Associate Professor IN GLOBAL SCENARIO D.D.U. Gorakhpur University, KPB Hinduja College of Gorakhpur (U.P.) 273 009. Commerce, 315, New (M) 09415339988 Charni Road, Mumbai, [email protected]. Maharashtra 400004 (M) 09930275540, [email protected]
III SOCIAL MEDIA : Dr. A.M. Gurav Dr. Shubhro Michael Gomes HR INTERVENTIONS Professor, Department of Commerce Professor under Colombo Plan & Management, Shivaji University, Gaeddu College Of Business Studies, Vidyanagar, Kolhapur 416004 Royal University Of Bhutan, Gedu, Maharashtra. - 21007Chukha, Bhutan (M) 09850012545 975-16911457 (M) + (Bhutan) +91-9883445529 (India)[email protected]. 123Email: smgomes @gmail.com
IV SKILL DEVELOPMENT IN Dr. Nawal Kishore Dr. Prabodha Kumar Hota BUSINESS EDUCATION Professor, School of Management , Reader & Head P.G. Dept. of Commerce, Studies, Indira Gandhi National Utkal University, Vanivihar, Open University, Maican Garhi 751 004Bhubaneswar- , Odisha New Delhi 110068 (M) 09861243258 (M) 0987124053 [email protected] [email protected].
Seminar MAKE IN INDIA : Prof. K. Eresi Dr. Ashish J. Dave THE ROAD AHEAD Former Chairman and Dean Associate Professor Dept. of Commerce, Smt. C.C. Mahila Arts & Sheth Central College Campus, C.N. Commerce College Bangalore University, Visnagar 394315 Mahesana, Bangalore 560001. Gujarat. (M) 09980424926 (M) 09328078001 [email protected] [email protected].
Manubhai M. Shah Memorial Research Gold Medal (Two) EMPIRICAL RESEARCHES IN ENVIRONMENTAL ISSUES VIS-À-VIS INDUSTRILISATION Chairperson Co-Chairperson Dr. Ram Sable Dr. Dalbir Singh Kaushik Professor and Head, Dept. Associate Professor, of Commerce, Former Dean, Dept. of Commerce, Gaur Faculty of Commerce, S.N.D.T. Brahman (PG) College, Women's University, Rohtak, Haryana 124001. Mumbai 4000120. (M) 09017213579 (M) 09890012069, [email protected] [email protected]
Managed on behalf of Managing Editor, Indian Journal of Commerce, ICA by The IIS University, SFS, Gurukul Marg, Mansarovar, Jaipur-302020Ph : 0141-2397906, 2400160, 2400161 • Fax : 0141-2395494 • Email : [email protected]•Web: www.iisuniv.ac.in
President Prof.Jayanta Kumar Parida, Utkal University, Bhubneshwar, 9437229465. [email protected]
Executive Dr.Ananth M. Deshmukh, Associate Professor, Dept. of Business Mgt., R. T. M. NagpurVice President University, Nagpur, 9823121458. [email protected]
Secretary Dr Balwinder Singh, Associate Professor, Dept of Commerce, Guru Nanak Dev University, Amritsar-143005, Punjab, 9417272232. [email protected]
Joint Secretary Dr. M. Muniraju, Professor, Department of Commerce, Bangalore University, Bengaluru, 9448686143. [email protected]
Managing Editor Prof. H. K. Singh, Vice Chancellor, Maharishi University of Information Technology, Lucknowcum Treasurer (U.P.) - 226013, India, 9415264509. [email protected]
Immediate Dr. M. Ramachandra Gowda, Professor, Department of Commerce, Bangalore University, Past President Bengaluru, 9448008278. [email protected]
Conference Secretary Prof. (Dr.) M.K. Singh, Head & Dean, Faculty of of Commerce University Deptt. of Commerce & Business Management, Vinoba Bhave University, Hazaribag -825 301, India, 9431332889. [email protected]
INDIAN COMMERCE ASSOCIATION
OFFICE BEARERS
th68 TOPICS FOR
ALL INDIA COMMERCE CONFERENCE06-08 November 2015
Regd. No. 4973/60 Cost is less than ` 34/-


![arXiv:2004.02307v2 [cs.CV] 19 May 2020 · 16 48x 512x 1024 1 Input 3x 1024x 2048 P 32 128x 64x128 32x64 DPC 1 256x 256x512 256x 64x128 128x256 24x 512x 1024 40x 256x 512 64x 128x](https://static.fdocuments.in/doc/165x107/5f5f8b0f55e2224c0b041178/arxiv200402307v2-cscv-19-may-2020-16-48x-512x-1024-1-input-3x-1024x-2048-p.jpg)
