Principles of Materials Processing ──Technology of plas...
31
2016/4/6 1 Principles of Materials Processing ──Technology of plasƟcity LIU Juan ([email protected], 62933955, 13818928215) Institute of Forming Technology & Equipment SMSE SJTU Outline Processing maps Dislocation & plastic deformation Plastic deformation of crystal Elements of plastic theory Recovery & recrystallization Introduction
Transcript of Principles of Materials Processing ──Technology of plas...
2016/4/6
1
Principles of Materials Processing ──Technology of plas city
LIU Juan
([email protected], 62933955, 13818928215)
Institute of Forming Technology & Equipment
SMSE SJTU
OutlineProcessing maps
Dislocation & plastic deformation
Plastic deformation of crystal
Elements of plastic theory
Recovery & recrystallization
Introduction

2016/4/6
2
Processing maps
Introduction
1
Plastic deformation of crystal
Elements of plastic theory
Recovery & recrystallization
1
1
1
General Review
Tensile Response of Materials
Effect of temperature & strain rate
1
Dislocation & plastic deformation 1
Reference books
Institute of Forming Technology & Equipment 4
• Mechanical Metallurgy *George E Dieter
McGraw‐Hill Book Company, London (1988)

2016/4/6
3
General Review
Institute of Forming Technology & Equipment
Mechanical Metallurgy
5
The central theme is structure ‐properties ‐ performance triangle.Changes in one are inseparably relatedto changes in the others; these changesare introduced by processing.
PROCESSING
STRUCTURE
PROPERTIESPERFORMANCE
mechanics
metallurgy
rationalizing
predicting
modifying
the response of metals to loads
PrincipleObjective
Problem
General Review
Institute of Forming Technology & Equipment
Overview of processes
6
Solidificationprocesses
Particulateprocesses
Deformation processes
Material removal
Heat treatment
Cleaning & surface treatments
Coating & deposition processes
Welding
Brazing & soldering
Adhesive bonding
Threaded fasteners
Permanent fastening methods
Manufacturingprocesses
Shaping processes
Property enhancing processes
Surface processing operations
Permanent joining processes
Mechanical fastening
Processing operations
Assembly operations

2016/4/6
4
General Review
Institute of Forming Technology & Equipment
Overview of metal forming
7
Metal forming: to change the shape of metal workpieces.
Plastic deformation: a permanent change of shape, i.e., the stress in materials
is larger than its yield strength.
Usually a die→ to force deformed metal into the shape of the die.
Metal forming is divided into:
(1) Bulk forming: large strain, small displacement, surface area to volume of
the work is small.
(2) Sheet forming: small strain, large displacement; Surface area to volume of
the work is large.
General Review
Institute of Forming Technology & Equipment
Bulk deformation processes
8
Rolling Forging
Extrusion Drawing
Traditionally Hot
2016/4/6
5
General Review
Institute of Forming Technology & Equipment
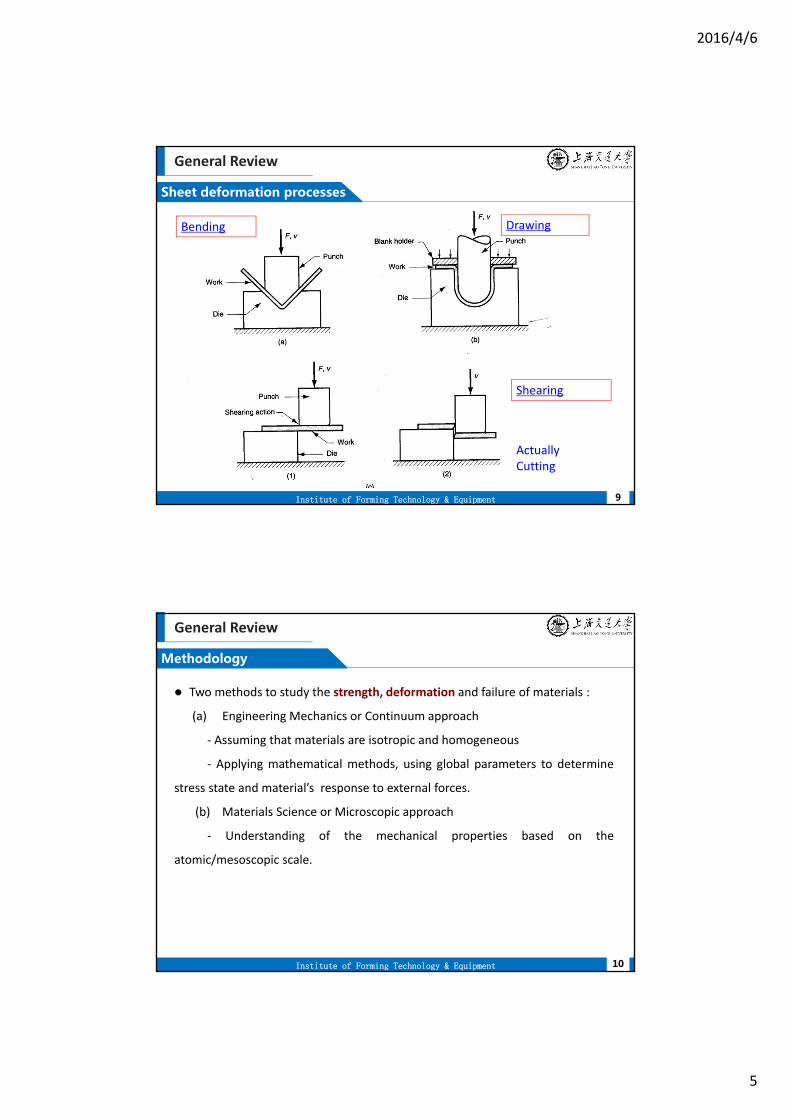
Sheet deformation processes
9
Bending Drawing
Shearing
Actually Cutting
General Review
Institute of Forming Technology & Equipment
Methodology
10
Two methods to study the strength, deformation and failure of materials :
(a) Engineering Mechanics or Continuum approach
‐ Assuming that materials are isotropic and homogeneous
‐ Applying mathematical methods, using global parameters to determine
stress state and material’s response to external forces.
(b) Materials Science or Microscopic approach
‐ Understanding of the mechanical properties based on the
atomic/mesoscopic scale.

2016/4/6
6
General Review
Institute of Forming Technology & Equipment
Methodology
11
Top‐down approach
Continuummechanics
Internal state variables
Constitutive equations
Bottom‐up approach
General Review
Institute of Forming Technology & Equipment
Important points to be kept in mind
12
Slip(Dislocation
motion)
Plastic Deformation in Crystalline Materials
Twinning Phase Transformation Creep Mechanisms
Grain boundary sliding
Vacancy diffusion
Dislocation climb
+ Other Mechanisms
Grain rotation
Phenomenological terms
No volume change
Shear stresses vs. Pure hydrostatic stresses
Fracture strain ← hydrosta c stresses.
slip vs. shear stresses at the slip plane.
Plastic deformation ↔ permanent deformation without external constraints

2016/4/6
7
General Review
Institute of Forming Technology & Equipment
Common modes of deformation
13
A body can be deformed using many modes:
Tension/Compression
Bending
Shear
Torsion Bending
Tension Compression
Deformed configuration
ShearTorsion
The Uniaxial Tension Test mechanical properties
Tensile Response of Materials
Institute of Forming Technology & Equipment
The Uniaxial Tension Test (UTT)
14
Stroke →
Load
→
e →
s →
→
→
Gauge Length → L0 Possible axes
Tensile specimen
Initial cross sectional area → A0
Note that L0 is NOT the length of the specimen, but
the gauge length
2016/4/6
8
Tensile Response of Materials
Institute of Forming Technology & Equipment
Stress and strain
15
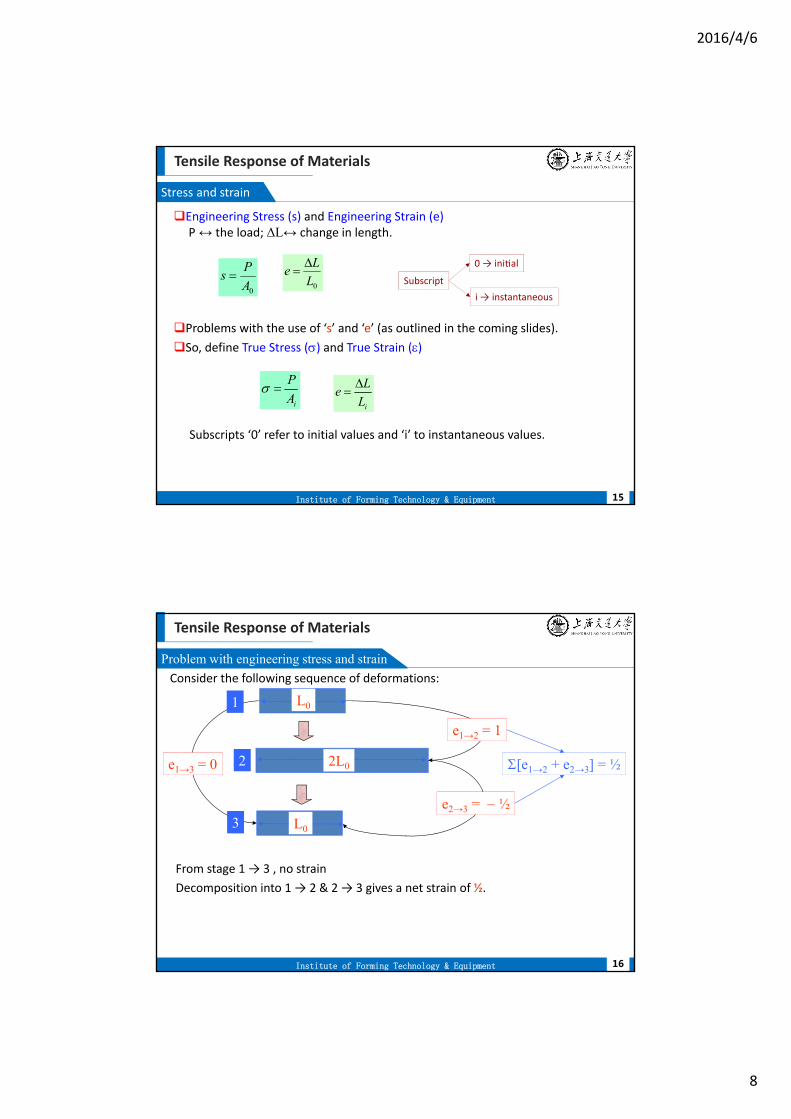
Engineering Stress (s) and Engineering Strain (e) P↔ the load; ΔL↔ change in length.
Problems with the use of ‘s’ and ‘e’ (as outlined in the coming slides).
So, define True Stress () and True Strain ()
0A
Ps
0L
Le
0 → ini al
i→ instantaneous
Subscript
i
P
A
i
Le
L
Subscripts ‘0’ refer to initial values and ‘i’ to instantaneous values.
Tensile Response of Materials
Institute of Forming Technology & Equipment
Problem with engineering stress and strain
16
Consider the following sequence of deformations:
L0
2L0
L0
e1→2 = 1
e2→3 = ½
e1→3 = 0
1
2
3
[e1→2 + e2→3] = ½
From stage 1 → 3 , no strain
Decomposition into 1 → 2 & 2 → 3 gives a net strain of ½.

2016/4/6
9
Tensile Response of Materials
Institute of Forming Technology & Equipment
True stress and strain
17
iA
P
0
ln0
L
L
L
dLL
L
The definitions of true stress and true strain
Ai → instantaneous area
Same sequence of deformations considered before:L0
2L0
L0
1→2 = Ln(2)
2→3 = Ln(2)
1→3 = 0
1
2
3
[ 1→2 + 2→3] = 0
True strains are additive, engineering strains are not.
Tensile Response of Materials
Institute of Forming Technology & Equipment
Schematic of s-e curve
18
O unloaded specimen
OY Elastic Linear Region (macroscopiclinear elastic region)
Y macroscopic yield point
The stress at this point is called yield strength
Note the increasing stress required for continued plastic deformation
(the stress to cause continued plastic deformation is called flow stress)
Neck

2016/4/6
10
Tensile Response of Materials
Institute of Forming Technology & Equipment
Schematic of s-e curve
19
YF Elastic + Plastic regime strain hardens flow stress increases with strain. be split into YN and NF
Neck
YN Stable region with uniform deformation along the gauge length
N Plastic Instability in tension Onset of necking
Tensile Response of Materials
Institute of Forming Technology & Equipment
Schematic of s-e curve
20
N True condition of uniaxialitybroken onset of triaxial state of stress (loading remains uniaxial but the state of stress in the cylindrical specimen is not).
Neck
NF most of the deformation is localized at the neck Specimen in a triaxial state of stress
F Fracture of specimen

2016/4/6
11
Tensile Response of Materials
Institute of Forming Technology & Equipment
Information obtained from UTT
21
I. Young’s modulus*→ slope of the OY (elas c part of the curve).
II. Yield stress (or proof stress)→ stress corresponding to point Y.
III. Ul mate Tensile Stress (UTS) → point N (maximum) in s‐e plot.
IV. Fracture stress→ stress corresponding to point F.
Tensile Response of Materials
Institute of Forming Technology & Equipment
Information obtained from UTT
22
IV. Ductility→ measured as: (a) strain at fracture (in %), (b) % reduction in area.
V. Resilience (area under the curve elastic portion‐ OY).
VI. Toughness (area under the curve total)→ has unit of Energy/volume [J/m3].
VII. Strain hardening exponent (from ‐ plot).

2016/4/6
12
Tensile Response of Materials
Institute of Forming Technology & Equipment
Q & A
23
What is meant by toughness?
The energy absorbed by the material up to failure.
By a uniaxial tension test or in an impact test (using a notched specimen).
Combined parameter involving strength and ductility.
What are the simple tests to evaluate their mechanical behaviour?
Uniaxial tension test.
Compression test.
Hardness test.
Bending test (3‐point, 4‐point bend tests).
Torsion test.
Tensile Response of Materials
Institute of Forming Technology & Equipment
Q & A
24
Why does the stress value drop after UTS in a “s‐e” plot?Why does this not happen in the “‐” plot?
After necking the load bearing area decreases,
Computation of ‘s’ using A0 → leading to a apparent drop in stress
‘apparent’ in reality the material continues to harden
In the “‐” plot using the instantaneous area
the hardening effect with deformation captured (even beyond the necking)
the necking event cannot be ‘captured’

2016/4/6
13
Tensile Response of Materials
Institute of Forming Technology & Equipment
Q & A
25
What is the difference between Stiffness and Young’s modulus?
Both relate to the elastic property of the material.
Stiffness: the structure/geometry (of sample) dependent property
e.g. the stiffness of a spring
Young’s modulus : a geometry independent material property
e.g. Young’s modulus of polycrystalline Cu
Tensile Response of Materials
Institute of Forming Technology & Equipment
Result of an actual stress‐strain plots
26
Specimen ID Aluminium
Cross Sectional Area 30.2 mm2
Gauge Length 28.44 mm
Cross head velocity 2 mm/min
Test mode Stroke
Peak Stress 193.0 MPa
Peak Load 5.83 kN
Specimen Mild Steel
Area 27.91 mm2
Gauge Length 28.24 mm
Cross head velocity 2 mm/min
Test mode Stroke
Note the ‘serrated’ yielding (yield point phenomenon)
Peak Stress 595.7 MPa
Peak Load 16.6 kN
• not good to calculate Young’s modulus from s‐e plot
• better to determine the Young’s modulus from sound propagation experiments.

2016/4/6
14
Tensile Response of Materials
Institute of Forming Technology & Equipment
Comparison between “Engineering” and “True” quantities
27
Comparison between true strain and engineering strain
True strain () 0.01 0.10 0.20 0.50 1.0 2.0 3.0 4.0
Engineering strain (e) 0.01 0.105 0.22 0.65 1.72 6.39 19.09 53.6
Note that for strains of about 0.4, ‘true’ and ‘engineering’ strains can be assumed to be equal. At large strains the deviations between the values are large.
iA
P
0
ln0
L
L
L
dLL
L
0
ln 1 1 ln(1+e)L
L
0
0 0 0
1 1 (1 )i i
i
A L LPs s s e
A A L L
00 0 i i
0
From volume constancy A L =A L i
i
A L
A L
Valid till necking starts
Tensile Response of Materials
Institute of Forming Technology & Equipment
Yielding
28
Microscopically, dislocations leave the crystal (grain) and cause microscopic plastic deformation (of unit ‘b’) determined from microstrain (~10–6 ) experiments on single crystals.
True elastic limit (microscopically and macroscopically elastic→ not microscopic yielding) ~10–6 [OA portion of the curve]
Microscopically plastic, macroscopically elastic→[AY portion of the curve]
Where does Yielding start?
2016/4/6
15
Tensile Response of Materials
Institute of Forming Technology & Equipment
Yielding
29
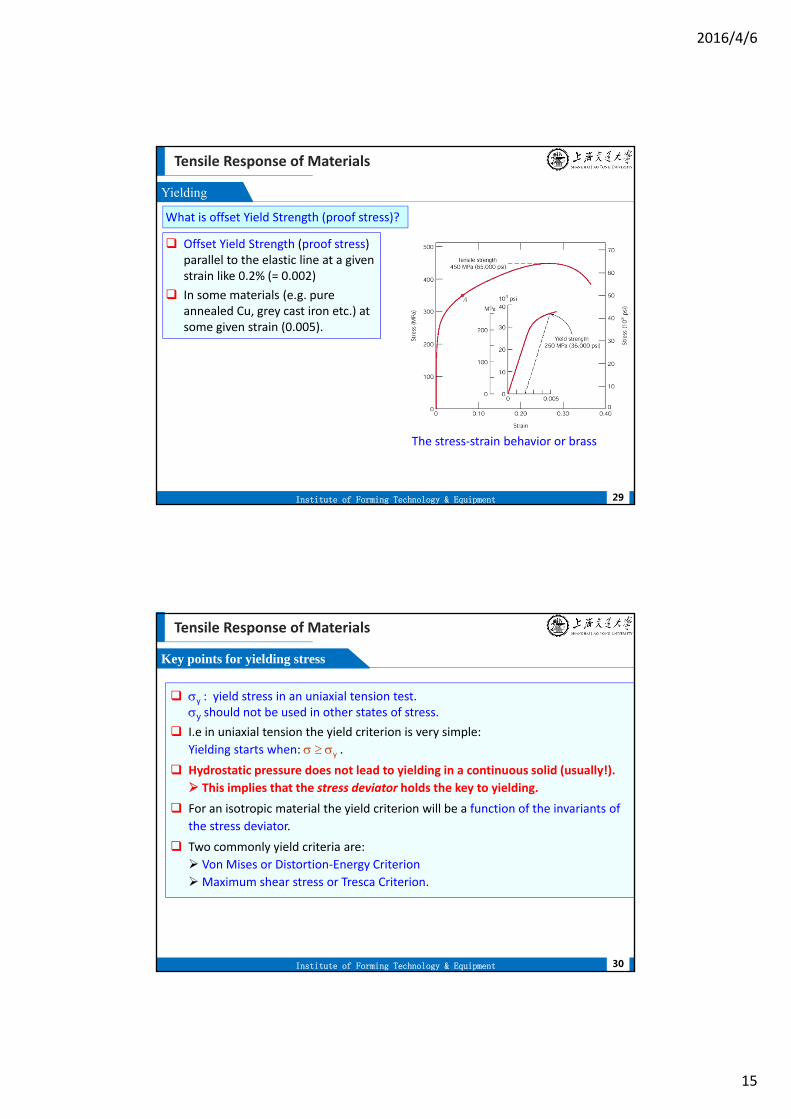
Offset Yield Strength (proof stress) parallel to the elastic line at a given strain like 0.2% (= 0.002)
In some materials (e.g. pure annealed Cu, grey cast iron etc.) at some given strain (0.005).
What is offset Yield Strength (proof stress)?
The stress‐strain behavior or brass
Tensile Response of Materials
Institute of Forming Technology & Equipment
Key points for yielding stress
30
y : yield stress in an uniaxial tension test.y should not be used in other states of stress.
I.e in uniaxial tension the yield criterion is very simple:
Yielding starts when: y .
Hydrostatic pressure does not lead to yielding in a continuous solid (usually!).
This implies that the stress deviator holds the key to yielding.
For an isotropic material the yield criterion will be a function of the invariants of
the stress deviator.
Two commonly yield criteria are:
Von Mises or Distortion‐Energy Criterion
Maximum shear stress or Tresca Criterion.
2016/4/6
16
Tensile Response of Materials
Institute of Forming Technology & Equipment
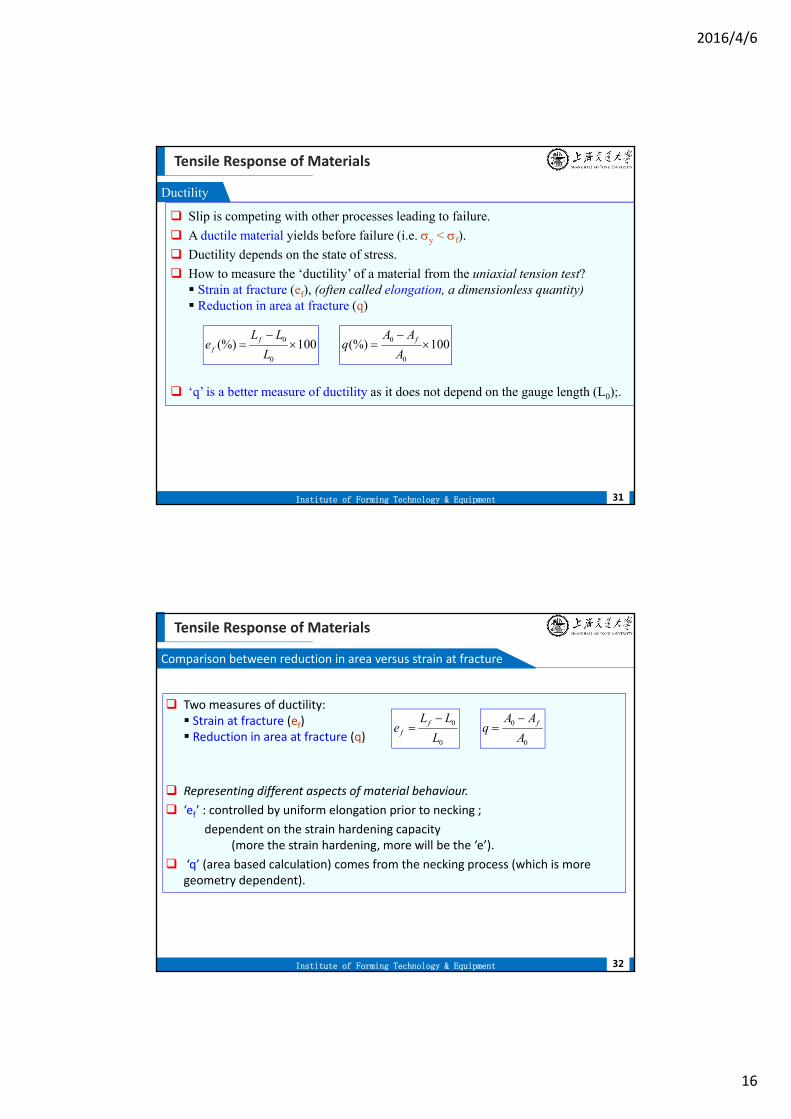
Ductility
31
Slip is competing with other processes leading to failure.
A ductile material yields before failure (i.e. y < f).
Ductility depends on the state of stress.
How to measure the ‘ductility’ of a material from the uniaxial tension test? Strain at fracture (ef), (often called elongation, a dimensionless quantity) Reduction in area at fracture (q)
‘q’ is a better measure of ductility as it does not depend on the gauge length (L0);.
0
0
(%) 100ff
L Le
L
0
0
(%) 100fA Aq
A
Tensile Response of Materials
Institute of Forming Technology & Equipment
Comparison between reduction in area versus strain at fracture
32
Two measures of ductility: Strain at fracture (ef) Reduction in area at fracture (q)
Representing different aspects of material behaviour.
‘ef’ : controlled by uniform elongation prior to necking ;
dependent on the strain hardening capacity(more the strain hardening, more will be the ‘e’).
‘q’ (area based calculation) comes from the necking process (which is more geometry dependent).
0
0
ff
L Le
L
0
0
fA Aq
A

2016/4/6
17
Tensile Response of Materials
Institute of Forming Technology & Equipment
Necking
33
What happens after necking?
Till necking the deformation is ~uniform.
Till necking points on the ‐ plot lie to the left and higher than the s‐e plot. After necking deformation is localized around the neck region.
i.e. Necking : an instability in tension.
Fractured surfaces
Neck
What happens after necking?
Tensile Response of Materials
Institute of Forming Technology & Equipment
Ductile material
34
A ductile material : y < f (i.e. on loading it yields before fracture).
(Microscopically, in yielding we drive dislocations,
in fracture we propagate cracks).
Two factors contribute to this fracture.
(i) Necking:
Which reduces the load bearing area
Which introduces a triaxial state of stress
(triaxial state of stress tends to suppress plasticity by slip).
(ii) work hardening, which makes y > f

2016/4/6
18
Tensile Response of Materials
Institute of Forming Technology & Equipment
Ductile vs. Brittle Behavior
35
Brittle
Moderate Ductility High
Ductility
The stress‐strain behavior of brittle materials compared with that of more ductile materials.
Tensile Response of Materials
Institute of Forming Technology & Equipment
Classifications of Stress-Strain Plots
36
The types of curves reflect different deformation characteristics
Type I completely elastic behavior Type II elastic behavior and homogeneous plastic deformation.
2016/4/6
19
Tensile Response of Materials
Institute of Forming Technology & Equipment
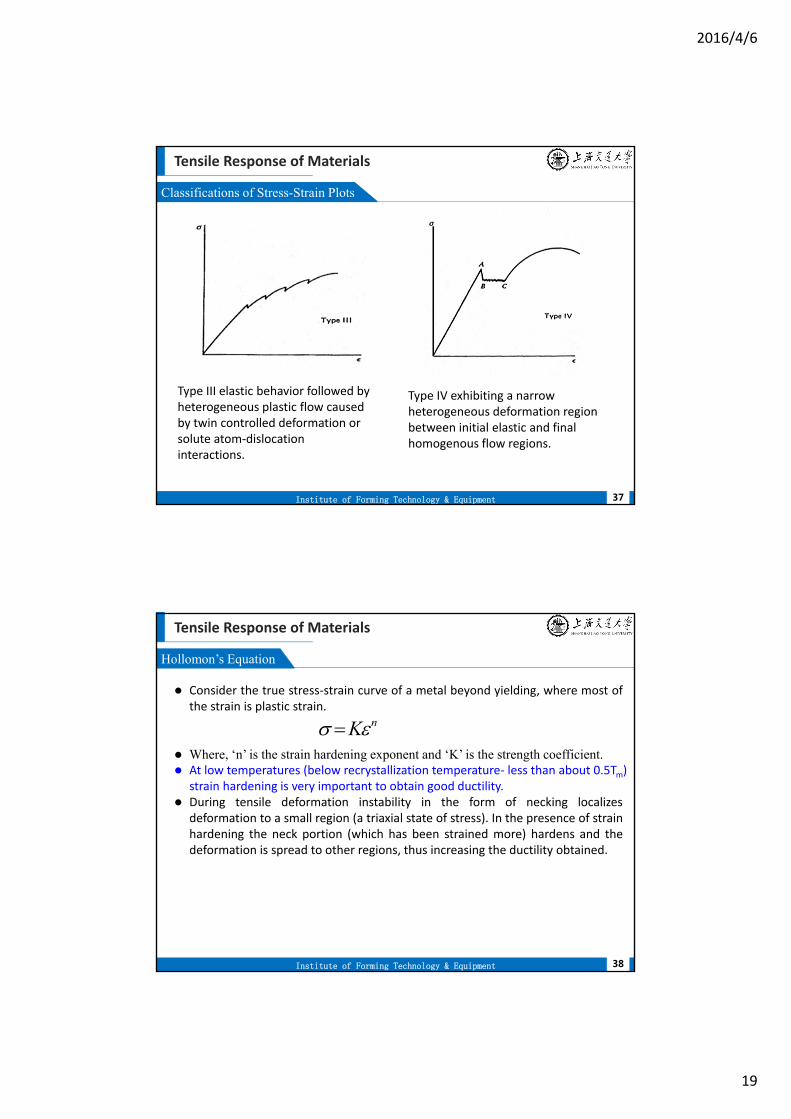
Classifications of Stress-Strain Plots
37
Type III elastic behavior followed by heterogeneous plastic flow caused by twin controlled deformation or solute atom‐dislocation interactions.
Type IV exhibiting a narrow heterogeneous deformation region between initial elastic and final homogenous flow regions.
Tensile Response of Materials
Institute of Forming Technology & Equipment
Hollomon’s Equation
38
Consider the true stress‐strain curve of a metal beyond yielding, where most ofthe strain is plastic strain.
Where, ‘n’ is the strain hardening exponent and ‘K’ is the strength coefficient. At low temperatures (below recrystallization temperature‐ less than about 0.5Tm)
strain hardening is very important to obtain good ductility. During tensile deformation instability in the form of necking localizes
deformation to a small region (a triaxial state of stress). In the presence of strainhardening the neck portion (which has been strained more) hardens and thedeformation is spread to other regions, thus increasing the ductility obtained.
nK

2016/4/6
20
Tensile Response of Materials
Institute of Forming Technology & Equipment
Hollomon’s Equation
39
,
n
TK
When true strain is less than 1, the smaller value of ‘n’ dominates over a larger value of ‘n’
K → strength coefficientn → strain/work hardening exponent◘ Cu and brass (n ~ 0.5) can be given large plastic strain (before
fracture) as compared to steels with n ~ 0.15.
Material n K (MPa)
Annealed Cu 0.54 320
Annealed Brass (70/30) 0.49 900
Annealed 0.5% C steel 0.26 530
0.6% carbon steel Quenched and Tempered (540C)
0.10 1570
‘n’ and ‘K’ for selected materials,
ln
ln T
n
Tensile Response of Materials
Institute of Forming Technology & Equipment
Average flow stress
40
• For many bulk deforming processes, rather than instantaneous stress, average stress is used (extrusion)
• The average flow stress can be obtained by integrating the flow stress along the trajectory of straining, from zero to the final strain value defining the range of interest
n
kY
n
f
1
Average flow stress
Max. strain during deformation
Strength Coefficient
Strain hardening exponent
2016/4/6
21
Tensile Response of Materials
Institute of Forming Technology & Equipment
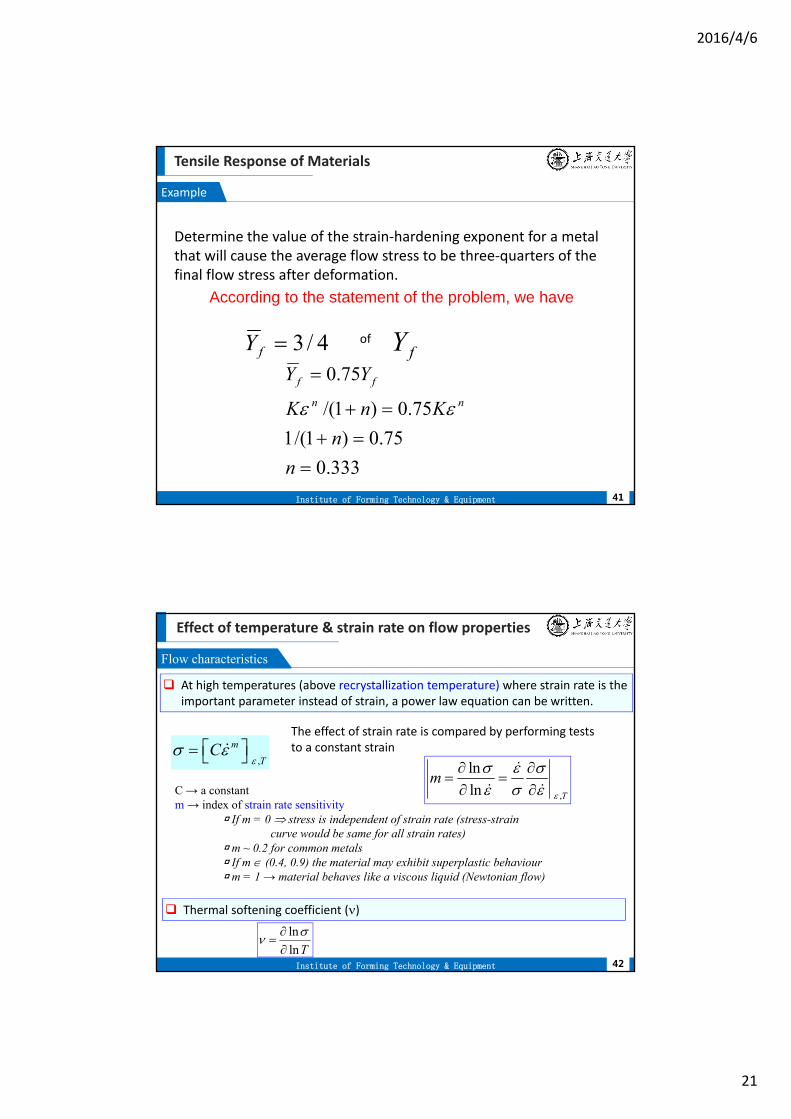
Example
41
Determine the value of the strain‐hardening exponent for a metal that will cause the average flow stress to be three‐quarters of the final flow stress after deformation.
According to the statement of the problem, we have
4/3fY of fY
333.0
75.0)1/(1
75.0)1/(
75.0
n
n
KnK
YYnn
ff
Effect of temperature & strain rate on flow properties
Institute of Forming Technology & Equipment
Flow characteristics
42
,
m
TC
C → a constantm → index of strain rate sensitivity
◘ If m = 0 stress is independent of strain rate (stress-strain curve would be same for all strain rates)
◘ m ~ 0.2 for common metals◘ If m (0.4, 0.9) the material may exhibit superplastic behaviour◘ m = 1 → material behaves like a viscous liquid (Newtonian flow)
The effect of strain rate is compared by performing tests to a constant strain
At high temperatures (above recrystallization temperature) where strain rate is the important parameter instead of strain, a power law equation can be written.
,
ln
ln T
m
Thermal softening coefficient ()
ln
lnT

2016/4/6
22
Effect of temperature & strain rate on flow properties
Institute of Forming Technology & Equipment
Flow characteristics
43
Slip is a thermally activated process. So increasing the temperature decreases the
flow stress.
Increasing the strain rate is like decreasing the temperature. The strength of the
material increases on increasing the strain rate (with decrease in ductility)
The effect of these two parameters on the stress‐strain curve is slightly different
for FCC and BCC metals.
Effect of temperature & strain rate on flow properties
Institute of Forming Technology & Equipment
Flow characteristics
44
What is the importance of ‘m’ and ‘n’ (strain hardening exponent and strain rate sensitivity)?
Below recrystallization temperature ‘n’ is ‘the’ important parameter.
Above recrystallization temperature it is ‘m’ which is important.
It is necking which limits the ductility in uniaxial tension.
Necking implies that there is locally more deformation (strain) and the strain rate is also higher locally.
Hence, if the ‘locally deformed’ material becomes harder (stronger) then the deformation will ‘spread’ to other regions along the gauge length and we will obtain more ductility.
Hence having a higher value of ‘n’ or ‘m’ is beneficial for obtaining good ductility.
2016/4/6
23
Effect of temperature & strain rate on flow properties
Institute of Forming Technology & Equipment
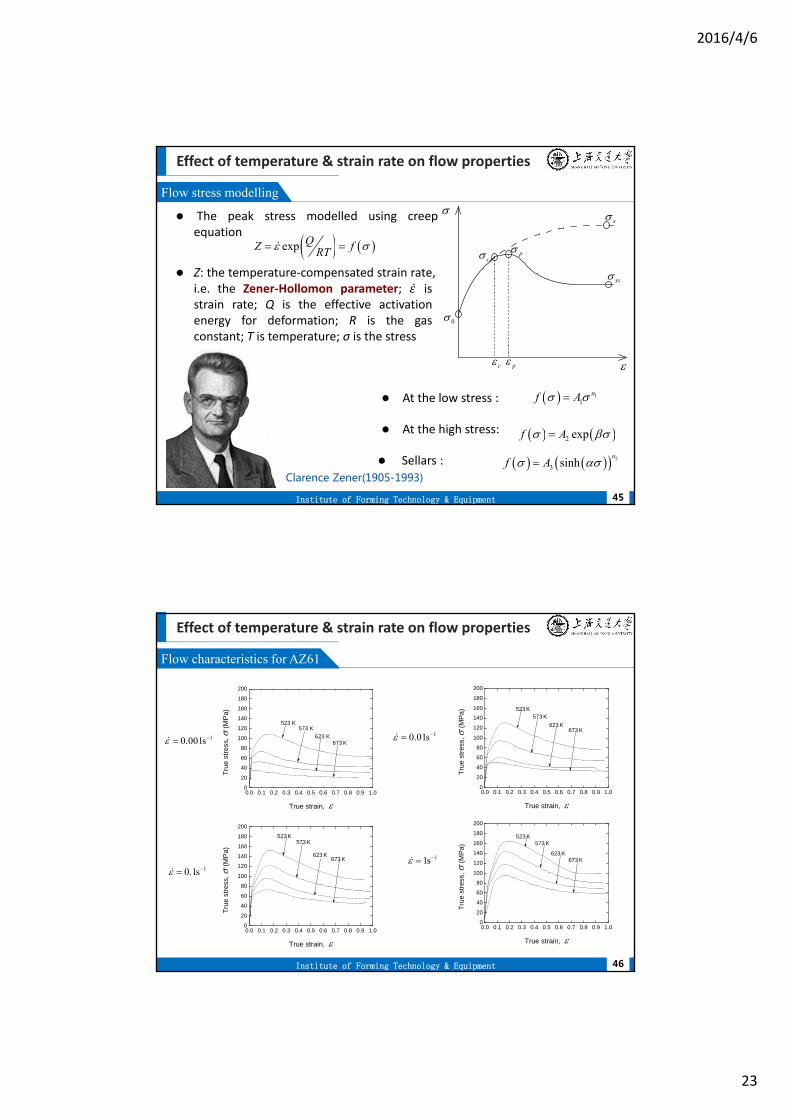
Flow stress modelling
45
At the high stress:
Sellars :
exp QZ fRT
2
3 sinhn
f A
11
nf A
2 expf A
At the low stress :
The peak stress modelled using creepequation
Clarence�Zener(1905-1993)
s
ss
c p
0
c p
Z: the temperature‐compensated strain rate,i.e. the Zener‐Hollomon parameter; isstrain rate; Q is the effective activationenergy for deformation; R is the gasconstant; T is temperature; σ is the stress
Effect of temperature & strain rate on flow properties
Institute of Forming Technology & Equipment
Flow characteristics for AZ61
46
10.001s 10.01s
10.1s 11s
0.0 0.1 0.2 0.3 0.4 0.5 0.6 0.7 0.8 0.9 1.00
20
40
60
80
100
120
140
160
180
200
673 K623 K
573 K
Tru
e st
ress
,
(MP
a)
True strain,
523 K
0.0 0.1 0.2 0.3 0.4 0.5 0.6 0.7 0.8 0.9 1.00
20
40
60
80
100
120
140
160
180
200
673 K623 K
573 K
Tru
e st
ress
, (
MP
a)
True strain,
523 K
0.0 0.1 0.2 0.3 0.4 0.5 0.6 0.7 0.8 0.9 1.00
20
40
60
80
100
120
140
160
180
200
673 K623 K
573 K
Tru
e st
ress
, (
MP
a)
True strain,
523 K
0.0 0.1 0.2 0.3 0.4 0.5 0.6 0.7 0.8 0.9 1.00
20
40
60
80
100
120
140
160
180
200
673 K623 K
573 K
Tru
e st
ress
, (
MP
a)
True strain,
523 K

2016/4/6
24
Effect of temperature & strain rate on flow properties
Institute of Forming Technology & Equipment
Flow stress modelling
47
3 5 7
sinh2 3! 5! 7!
x xe e x x xx x
0.5x sinh x x
2x sinh 2xx e
0 0.5 1 1.5 2 2.50
1
2
3
4
5
6
7
xf(
x)
f(x)=sinh(x)f(x)=x
f(x)=ex/2
(sinh(x))n xn (exp(x)/2)n E1 E2
x=0.5 0.5211 0.5 0.8244 4.05% 58.20%
x=2.0 3.6269 2 3.6945 44.86% 1.87%
1
sinh100%
sinh
n n
n
x xE
x
2
sinh100%
sinh
n nx
n
x eE
x
Effect of temperature & strain rate on flow properties
Institute of Forming Technology & Equipment
Peak stress modelling
48
1nf A
nZ A
ln ln lnZ A n
exp nQ ART
ln ln lnQ n ART ln
ln T
n
ln1
Q nR
T
At constant temperature:
At constant strain rate:
ln ln1 ln T
Q R
T
2016/4/6
25
Effect of temperature & strain rate on flow properties
Institute of Forming Technology & Equipment
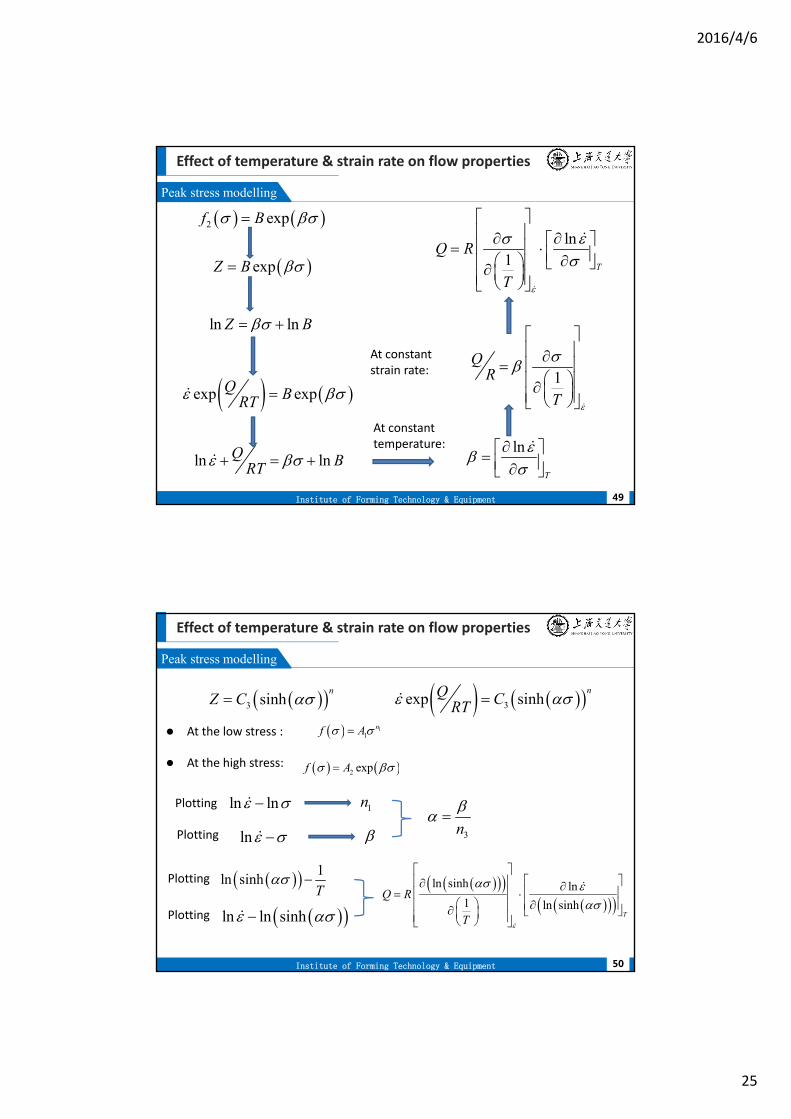
Peak stress modelling
49
2 expf B
expZ B
ln lnZ B
exp expQ BRT
ln lnQ BRT ln
T
1Q
R
T
ln1 T
Q R
T
At constant temperature:
At constant strain rate:
Effect of temperature & strain rate on flow properties
Institute of Forming Technology & Equipment
Peak stress modelling
50
3 sinhn
Z C 3exp sinhnQ CRT
At the high stress:
11
nf A
2 expf A
At the low stress :
ln ln Plotting 1n
Plotting
ln 3n
1ln sinh
T
Plotting
Plotting ln ln sinh
ln sinh ln1 ln sinh
T
Q R
T

2016/4/6
26
Effect of temperature & strain rate on flow properties
Institute of Forming Technology & Equipment
Example No. 1
51
For Magnesium alloy AZ61:
MPa 250℃
(513K)
300℃
(553K)
350℃
(593K)
400℃
(633K)
0.001 110 75 52 38
0.01 130 95 62 50
0.1 150 122 95 75
1 162 138 115 97
Peak stress for different temperatures and strain rates
Effect of temperature & strain rate on flow properties
Institute of Forming Technology & Equipment
Example No. 1
52
-8 -7 -6 -5 -4 -3 -2 -1 0 13.0
3.5
4.0
4.5
5.0
5.5
523K 573K 623K 673K
ln p
ln. -8 -7 -6 -5 -4 -3 -2 -1 0 1
0
40
80
120
160
200
523K 573K 623K 673K
p
ln.
Temperature, (K) n1 Mean value of n1
523 17.6518
11.0209573 11.0731
623 8.2007
673 7.1579
Table The values of n1 at different temperatures.
Temperature, (K) β Mean value of β
523 0.1308
0.1138573 0.1066
623 0.1037
673 0.1140
Table The values of β at different temperatures.
2016/4/6
27
Effect of temperature & strain rate on flow properties
Institute of Forming Technology & Equipment
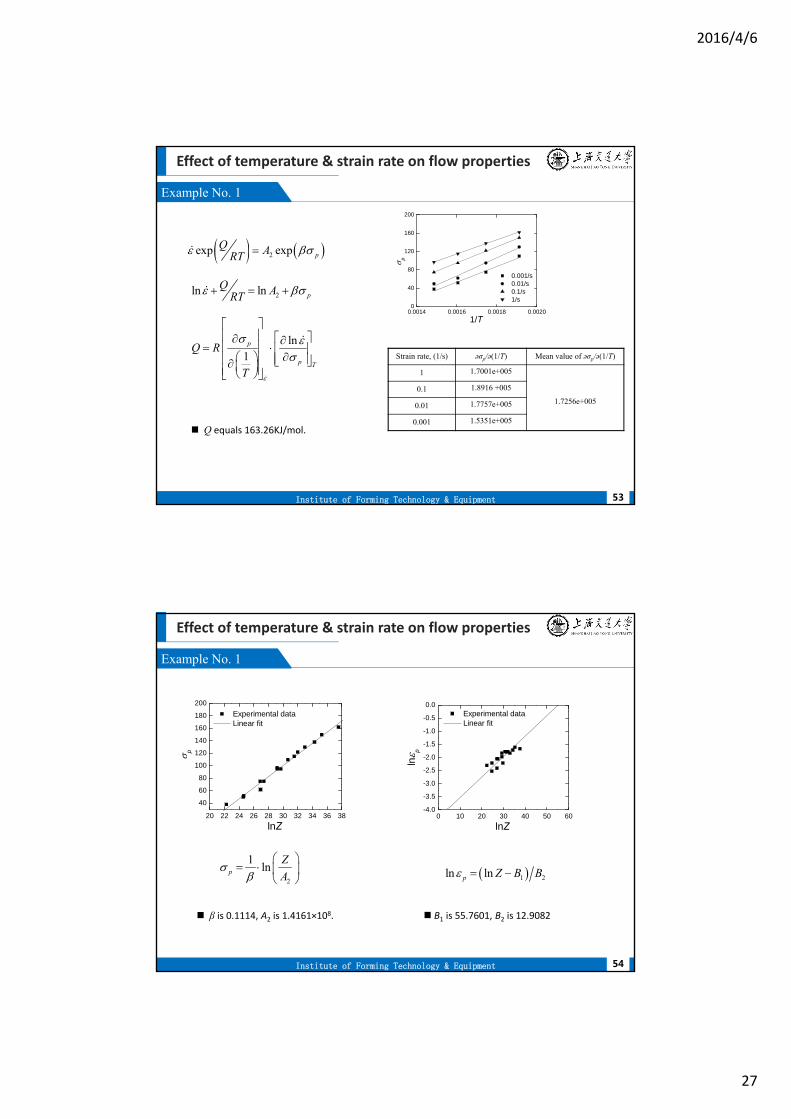
Example No. 1
53
2exp exp pQ ART
2ln ln pQ ART
ln1
p
p T
Q R
T
0.0014 0.0016 0.0018 0.00200
40
80
120
160
200
0.001/s 0.01/s 0.1/s 1/s
p
1/T.
Q equals 163.26KJ/mol.
Strain rate, (1/s) əσp/ə(1/T) Mean value of əσp/ə(1/T)
1 1.7001e+005
1.7256e+005
0.1 1.8916 +005
0.01 1.7757e+005
0.001 1.5351e+005
Effect of temperature & strain rate on flow properties
Institute of Forming Technology & Equipment
Example No. 1
54
20 22 24 26 28 30 32 34 36 38
40
60
80
100
120
140
160
180
200
lnZ
Experimental data Linear fit
p
2
1lnp
Z
A
β is 0.1114, A2 is 1.4161×10⁸.
0 10 20 30 40 50 60-4.0
-3.5
-3.0
-2.5
-2.0
-1.5
-1.0
-0.5
0.0
lnZ
Experimental data Linear fit
ln p
1 2ln lnp Z B B
B1 is 55.7601, B2 is 12.9082
2016/4/6
28
Effect of temperature & strain rate on flow properties
Institute of Forming Technology & Equipment
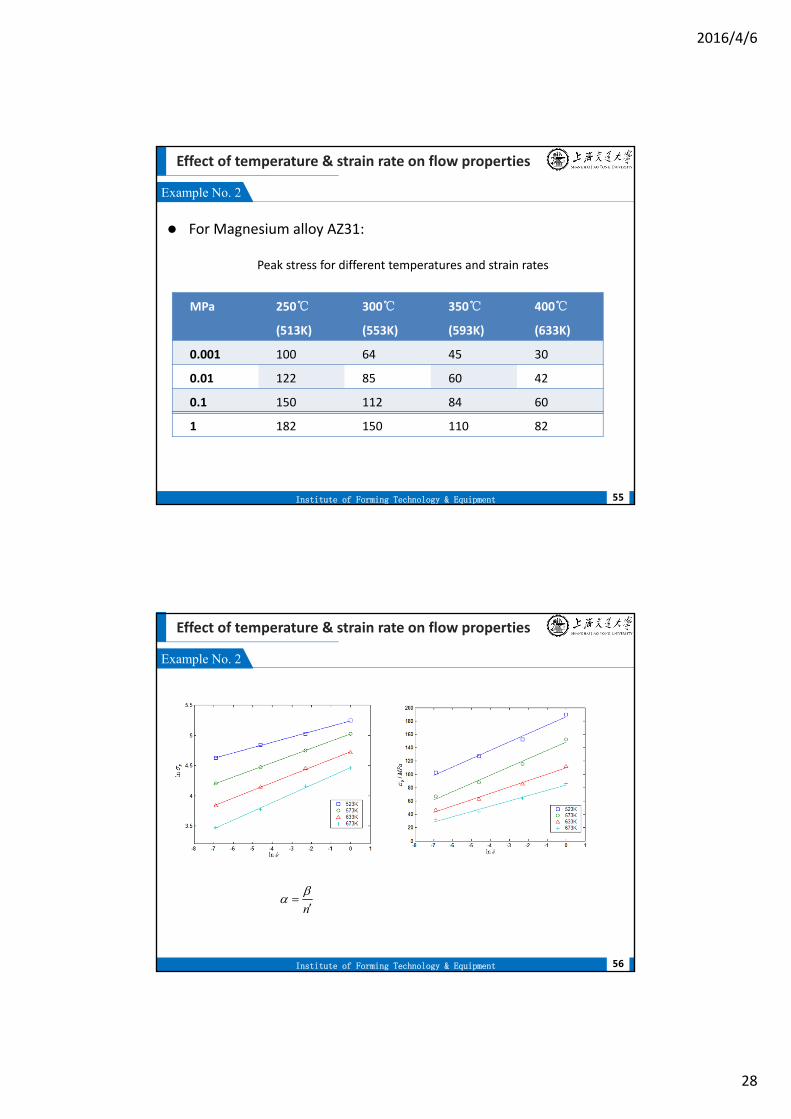
Example No. 2
55
For Magnesium alloy AZ31:
MPa 250℃
(513K)
300℃
(553K)
350℃
(593K)
400℃
(633K)
0.001 100 64 45 30
0.01 122 85 60 42
0.1 150 112 84 60
1 182 150 110 82
Peak stress for different temperatures and strain rates
Effect of temperature & strain rate on flow properties
Institute of Forming Technology & Equipment
Example No. 2
56
n

2016/4/6
29
Effect of temperature & strain rate on flow properties
Institute of Forming Technology & Equipment
Example No. 2
57
The approximate values of αand Q equal 0.0113 and158.7323KJ/mol.
ln sinh ln
1 ln sinhT
Q RT
Effect of temperature & strain rate on flow properties
Institute of Forming Technology & Equipment
Example No. 2
58
11 2 2
1ln 1
n n
p
Z Z
A A
1 2ln lnp Z B B
Where: n=6.178, A=9.8194E11, B1=47.5013, B2=9.7151
2016/4/6
30
Effect of temperature & strain rate on flow properties
Institute of Forming Technology & Equipment
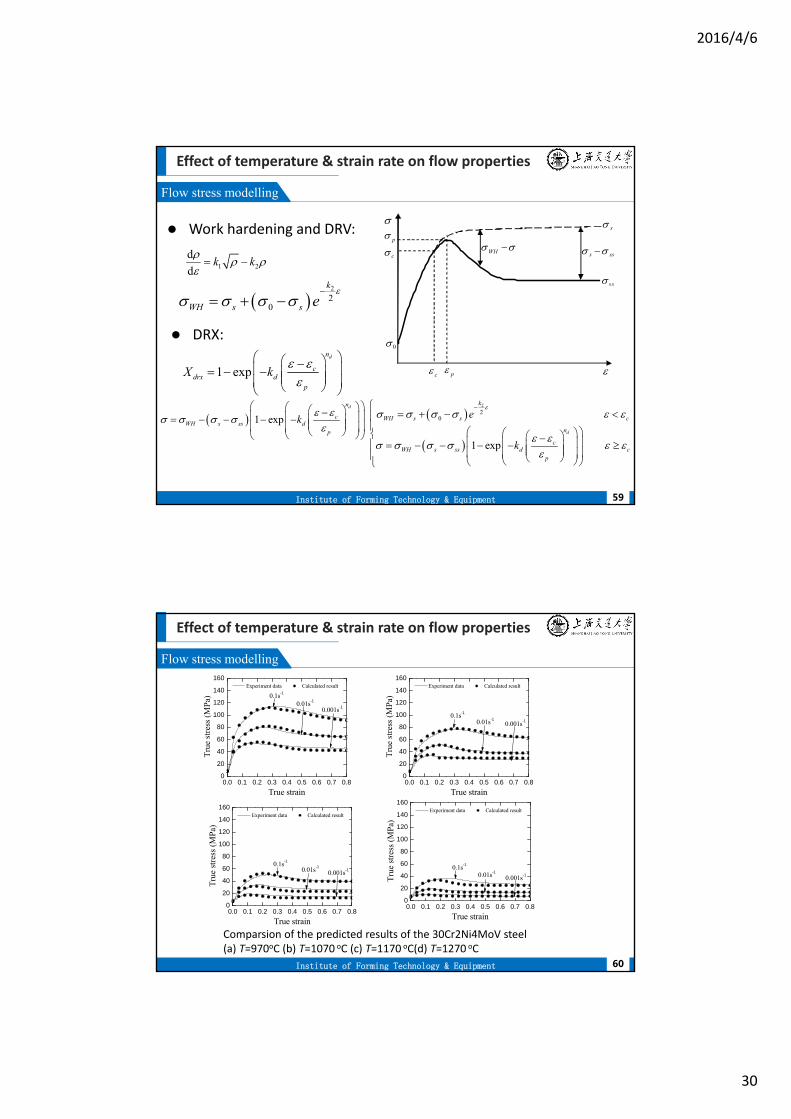
Flow stress modelling
59
ss
0
cp
s
c p
WH s ss
1 2
d
dk k
Work hardening and DRV:
DRX:
2
20
k
WH s s e
1 expdn
cdrx d
p
X k
1 expdn
cWH s ss d
p
k
2
20
1 expd
k
WH s s c
n
cWH s ss d c
p
e
k
Effect of temperature & strain rate on flow properties
Institute of Forming Technology & Equipment
Flow stress modelling
60
0.0 0.1 0.2 0.3 0.4 0.5 0.6 0.7 0.80
20
40
60
80
100
120
140
160
0.001s-10.01s-1
0.1s-1
True strain
Tru
e st
ress
(M
Pa)
Experiment data Calculated result
0.0 0.1 0.2 0.3 0.4 0.5 0.6 0.7 0.80
20
40
60
80
100
120
140
160
0.001s-10.01s-10.1s-1
True strain
Tru
e st
ress
(M
Pa)
Experiment data Calculated result
0.0 0.1 0.2 0.3 0.4 0.5 0.6 0.7 0.80
20
40
60
80
100
120
140
160
0.001s-10.01s-10.1s-1
True strain
Tru
e st
ress
(M
Pa)
Experiment data Calculated result
0.0 0.1 0.2 0.3 0.4 0.5 0.6 0.7 0.80
20
40
60
80
100
120
140
160
0.001s-10.01s-10.1s-1
True strain
Tru
e st
ress
(M
Pa)
Experiment data Calculated result
Comparsion of the predicted results of the 30Cr2Ni4MoV steel (a) T=970oC (b) T=1070 oC (c) T=1170 oC(d) T=1270 oC

2016/4/6
31
Thank you !