Principles of Data Visualization - Fish Grow on Trees d3. What makes a ... Visualizing Data. William...
38
Principles of Data Visualization Jeffrey Heer @jeffrey_heer University of Washington
Transcript of Principles of Data Visualization - Fish Grow on Trees d3. What makes a ... Visualizing Data. William...

Principles of Data Visualization
Jeffrey Heer @jeffrey_heer University of Washington

Data Analysis & Statistics, Tukey & Wilk 1966
Data Analysis & Statistics, Tukey & Wilk 1966
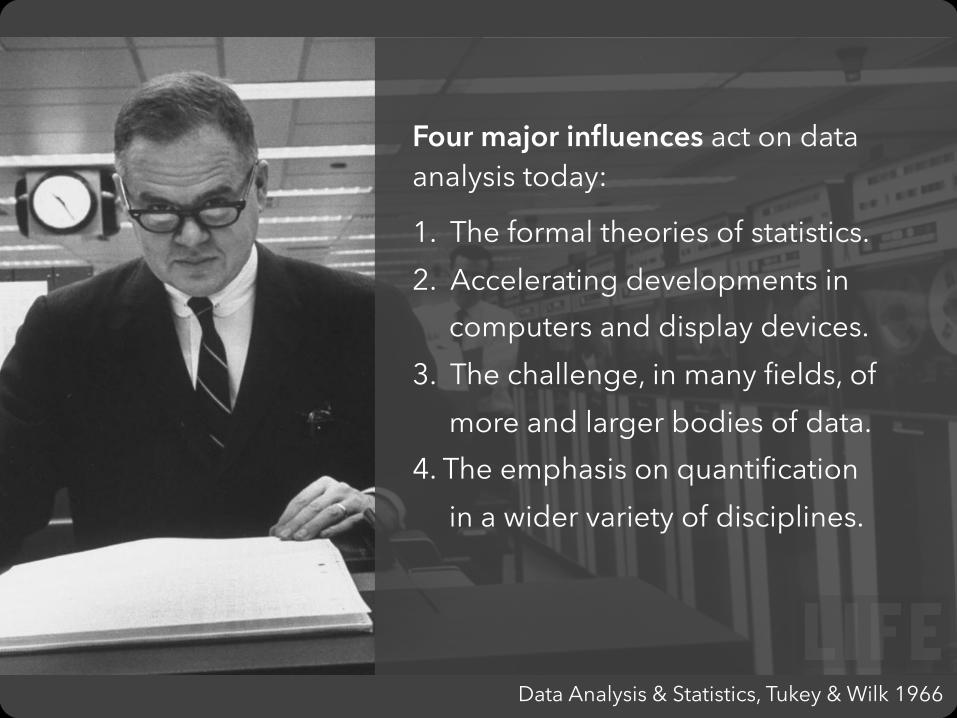
Four major influences act on data analysis today:
1. The formal theories of statistics. 2. Accelerating developments in computers and display devices. 3. The challenge, in many fields, of more and larger bodies of data. 4. The emphasis on quantification in a wider variety of disciplines.

Data Analysis & Statistics, Tukey & Wilk 1966
While some of the influences of statistical theory on data analysis have been helpful, others have not.

Data Analysis & Statistics, Tukey & Wilk 1966
Exposure, the effective laying open of the data to display the unanticipated, is to us a major portion of data analysis…
It is not clear how the informality and flexibility appropriate to the exploratory character of exposure can be fitted into any of the structures of formal statistics so far proposed.

Set A Set B Set C Set DX Y X Y X Y X Y
10 8.04 10 9.14 10 7.46 8 6.588 6.95 8 8.14 8 6.77 8 5.76
13 7.58 13 8.74 13 12.74 8 7.719 8.81 9 8.77 9 7.11 8 8.84
11 8.33 11 9.26 11 7.81 8 8.4714 9.96 14 8.1 14 8.84 8 7.04
6 7.24 6 6.13 6 6.08 8 5.254 4.26 4 3.1 4 5.39 19 12.5
12 10.84 12 9.11 12 8.15 8 5.567 4.82 7 7.26 7 6.42 8 7.915 5.68 5 4.74 5 5.73 8 6.89
Anscombe 1973
Summary Statistics Linear Regression uX = 9.0 σX = 3.317 Y2 = 3 + 0.5 X uY = 7.5 σY = 2.03 R2 = 0.67

Set A
Set C Set D
Set B
X X
Y
Y


Wikipedia History Flow [Viégas & Wattenberg ’04]


d3.js Data-Driven Documents
with Mike Bostock, Vadim Ogievetsky [InfoVis ’11]


d3 d3

What makes a visualization “good”?

Expressiveness A set of facts is expressible in a visual language if the sentences (i.e. the visualizations) in the language express all the facts in the set of data, and only the facts in the data.
Effectiveness A visualization is more effective than another visualization if the information conveyed by one visualization is more readily perceived than the information in the other visualization.
Design Principles [Mackinlay 86]

Expresses Facts Not in the Data
A length is interpreted as a quantitative value.

Expressiveness A set of facts is expressible in a visual language if the sentences (i.e. the visualizations) in the language express all the facts in the set of data, and only the facts in the data.
Effectiveness A visualization is more effective than another visualization if the information conveyed by one visualization is more readily perceived than the information in the other visualization.
Design Principles [Mackinlay 86]

Congruence The structure and content of the external representation should correspond to the desired structure and content of the internal representation.
Apprehension The structure and content of the external representation should be readily and accurately perceived and comprehended.
Design Principles [Tversky 02]

Tell the truth and nothing but the truth (don’t lie, and don’t lie by omission)
Use encodings that people decode better (where better = more accurate and/or faster)
Design Principles Translated

A quick experiment…

Compare area of circles

Compare length of bars

Steven’s Power Law
Graph from Wilkinson 99, based on Stevens 61
Perceived Sensation
Physical Intensity
Exponent (Empirically Determined)

Graphical Perception [Cleveland & McGill 84]

Log Absolute Estimation Error
Position 1 Position 2 Position 3 Length 1 Length 2 Angle Area (Circular) Area (Rect 1) Area (Rect 2)
Graphical Perception Experiments Empirical estimates of encoding effectiveness

Comparing Two QuantitiesMost accurate Position (common) scale Position (non-aligned) scale
Length Slope Angle Area
Volume Least accurate Color hue-saturation-density

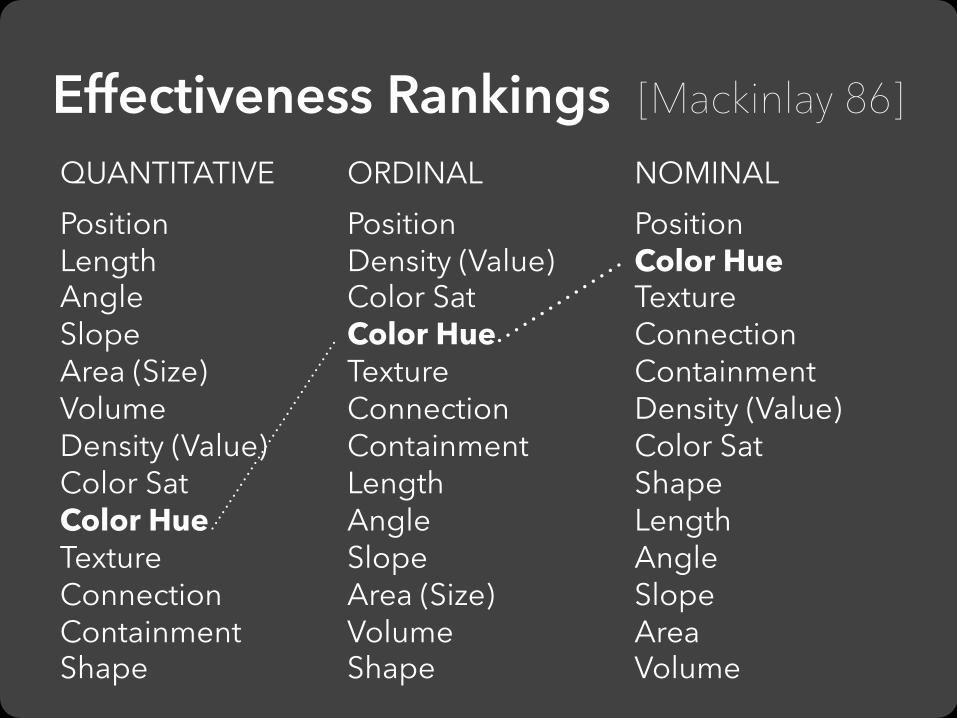
Effectiveness Rankings [Mackinlay 86]QUANTITATIVE ORDINAL NOMINAL Position Position Position Length Density (Value) Color Hue Angle Color Sat Texture Slope Color Hue Connection Area (Size) Texture Containment Volume Connection Density (Value) Density (Value) Containment Color Sat Color Sat Length Shape Color Hue Angle Length Texture Slope Angle Connection Area (Size) Slope Containment Volume Area Shape Shape Volume

Effectiveness Rankings [Mackinlay 86]QUANTITATIVE ORDINAL NOMINAL Position Position Position Length Density (Value) Color Hue Angle Color Sat Texture Slope Color Hue Connection Area (Size) Texture Containment Volume Connection Density (Value) Density (Value) Containment Color Sat Color Sat Length Shape Color Hue Angle Length Texture Slope Angle Connection Area (Size) Slope Containment Volume Area Shape Shape Volume
Effectiveness Rankings [Mackinlay 86]QUANTITATIVE ORDINAL NOMINAL Position Position Position Length Density (Value) Color Hue Angle Color Sat Texture Slope Color Hue Connection Area (Size) Texture Containment Volume Connection Density (Value) Density (Value) Containment Color Sat Color Sat Length Shape Color Hue Angle Length Texture Slope Angle Connection Area (Size) Slope Containment Volume Area Shape Shape Volume
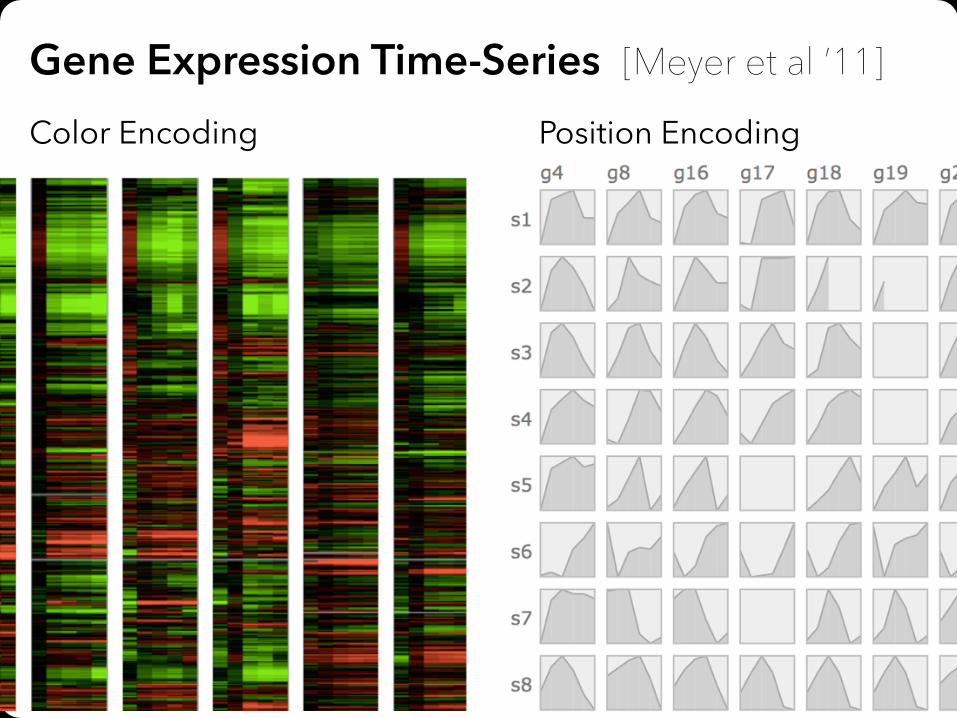
Gene Expression Time-Series [Meyer et al ’11]
Color Encoding Position Encoding

Artery Visualization [Borkin et al ’11]
Rainbow Palette Diverging Palette
2D
3D
92%62%
71%39%

Additional Resources
The Visual Display of Quantitative Information. Edward Tufte.
Show Me the Numbers. Stephen Few.
Visualizing Data. William S. Cleveland.
Perception for Design. Colin Ware.

Principles of Data Visualization
Jeffrey Heer @jeffrey_heer http://idl.cs.washington.edu