Principal Investigator: Gray Mullins, Ph.D., P.E. Post ...geotech.eng.usf.edu/Downloads/Cantilever...
139
Civil & Environmental Engineering INFLUENCE OF CANTILEVER SHEET PILE DEFLECTION ON ADJACENT ROADWAYS: BD-544-40 FINAL REPORT Principal Investigator: Gray Mullins, Ph.D., P.E. Post Doctorate Researcher Michael Stokes, Ph.D., P.E. May 2009
-
Upload
nguyenxuyen -
Category
Documents
-
view
218 -
download
1
Transcript of Principal Investigator: Gray Mullins, Ph.D., P.E. Post ...geotech.eng.usf.edu/Downloads/Cantilever...

Civil & Environmental Engineering
INFLUENCE OF CANTILEVER SHEET PILE DEFLECTION ON ADJACENT ROADWAYS: BD-544-40
FINAL REPORT
Principal Investigator:
Gray Mullins, Ph.D., P.E.
Post Doctorate Researcher Michael Stokes, Ph.D., P.E.
May 2009

i
EXECUTIVE SUMMARY Cantilevered sheet-pile walls are often used in the State of Florida to temporarily retain soil and prevent damage to nearby structures during construction. In the case of a cantilevered wall placed adjacent to an existing roadway, excessive horizontal wall displacement could result in a loss of confinement underneath the roadway, thereby causing vertical displacement and longitudinal cracking of the asphalt layer in the closest wheel path. This phenomenon has been experienced where the top of cantilevered walls have reached displacements upwards of 6 to 7 inches. As maintenance costs are an issue, horizontal wall displacements must be kept reasonably low to avoid milling and resurfacing these roadways after construction. This project investigated conditions that cause a roadway to experience displacement-induced distress using the results of numerical models. The model results were used to establish the sensitivity of the roadway subsoil conditions to various excavation-related variables, to include: insitu subsoil properties, sheet-pile properties, sheet-pile proximity to the roadway, and roadway loading. Although the model results indicate that there are some circumstances in which asphalt will not exhibit distress, the highly variable behavior of asphalt (due to temperature, age, etc.) will likely result in distress under most circumstances.

ii
TABLE OF CONTENTS
LIST OF TABLES ............................................................................................................. iii LIST OF FIGURES ........................................................................................................... iv 1. INTRODUCTION ...........................................................................................................1
1.1 Background ........................................................................................................1 1.2 Report Organization ...........................................................................................2
2. BACKGROUND .............................................................................................................3
2.1 Problem Statement .............................................................................................3 2.2 Wall Stability .....................................................................................................4 2.3 Wall Movement .................................................................................................6 2.4 Project Needs .....................................................................................................8
3. NUMERICAL MODELING .........................................................................................15
3.1 Numerical Analysis Software ..........................................................................15 3.2 Model Configuration ........................................................................................15 3.3 Constant Parameters .........................................................................................16 3.4 Variable Parameters .........................................................................................17 3.5 Model Calibration ............................................................................................21
4. MODEL RESULTS .......................................................................................................32
4.1 Data Regression Workbook .............................................................................32 4.2 Model Confirmation.........................................................................................32 4.3 Individual Excavation Results .........................................................................32 4.4 Combined Results ............................................................................................34
5. SUMMARY AND CONCLUSIONS ............................................................................45
5.1 Distress Criteria / Limiting Tension ................................................................45 5.2 Minimizing the Effects of Stress Induced Asphalt Distress ............................46 5.3 Conclusion .......................................................................................................47
6. GENERAL REFERENCES ...........................................................................................54

iii
LIST OF TABLES Table 2.1 Required wall movement to establish minimum lateral pressure (Bowles,
1985). .......................................................................................................................4 Table 3.1 Triaxial test results on asphalt and base material. .............................................16 Table 3.2 Roadway properties determined from the SMO triaxial tests............................16 Table 3.3 Interface properties. ...........................................................................................17 Table 3.4 Range of soil properties investigated. ................................................................18 Table 3.5 Range of wall sections investigated. ..................................................................18 Table 3.6 Modeling test matrix. .........................................................................................20 Table 3.7 Sheet Pile Properties from Plan Sheet 709. .......................................................21 Table 3.8 FLAC input properties determined from CPT data. ..........................................21

iv
LIST OF FIGURES
Figure 1.1 Cantilevered sheet pile wall adjacent State Road 39, Hillsborough County. .....1 Figure 2.1. Wall movement required to cause full passive or minimum active lateral pressure.. ..............................................................................................................................9 Figure 2.2. Simplified pressure diagram adapted from Whitlow (1990). ............................9 Figure 2.3 Simplified pressure diagram adapted from Bowles (1982). .............................10 Figure 2.4. Screen capture of CWALSHT software output results. ..................................10 Figure 2.5 Variation in predicted wall movement as embedment is varied in CWALSHT
(38ft embedment top, 20 ft embedment bottom). ..................................................11 Figure 2.6 SPW2006 screen capture of output graphs (metric units not defined). ............12 Figure 2.7 Output data from SPW2006 for same conditions shown in Figure 2.5 (top). ..12 Figure 2.8 Embedment depth / sensitivity comparison of CWALSHT and SPW2006. ......13 Figure 2.9. SPW2006 output for comparison with Chapter 4 results. ...............................13 Figure 2.10 CWALSHT soil pressure output showing full net pressure diagram used for
computations. .........................................................................................................14 Figure 3.1 Initial model geometry. ....................................................................................23 Figure 3.2 Refined mesh representing roadway surface. ...................................................23 Figure 3.3 Cross-section of roadway showing the layering of zones. ...............................24 Figure 3.4 Lane load applied over two infinite 10 ft wide strips. ......................................24 Figure 3.5 Cross-section showing details of lane loading. ................................................25 Figure 3.6 Cross-section showing details of truck loading. ...............................................25 Figure 3.7 Truck loading applied over four infinite 2 ft wide strips. .................................26 Figure 3.8 Cone penetration test sounding received from Commercial Blvd. construction
site. .........................................................................................................................27 Figure 3.9 Simplification of soil properties as calculated from soundings. .......................28 Figure 3.10 CPT correlations for relative density (left) and friction angle (right). ...........28 Figure 3.11 CPT correlations for tangent constrained modulus. .......................................29 Figure 3.12 Commercial Blvd. pre ]excavation survey. ....................................................29 Figure 3.13 Commercial Blvd. post ]excavation survey. ...................................................30 Figure 3.14 Pre-excavation model of Commercial Blvd. construction site. ......................30 Figure 3.15 Post-excavation model of Commercial Blvd. construction site. ....................31 Figure 4.1 Model excavation prior to the addition of a roadway (PZ-27 in stronger soil).35 Figure 4.2 Horizontal displacement contours after a 20 ft excavation with no roadway
(PZ-27 in stronger soil). .........................................................................................35 Figure 4.3 Moment distribution in the wall after a 20 ft excavation (PZ-27 in stronger
soil). .......................................................................................................................36 Figure 4.4 Horizontal wall movement throughout excavation (PZ-27 in stronger soil with
lane load). ...............................................................................................................37 Figure 4.5 Vertical roadway displacement during excavation (PZ-27 in stronger soil with
lane load). ...............................................................................................................37 Figure 4.6 Roadway profile showing a global and local failure after a 10 ft excavation
using a PZ-27 located 2 ft from the edge of the roadway in weaker soil. .............38 Figure 4.7 Localized roadway rutting in the lane nearest the wall after a 10 ft excavation
using a PZ-27 located 2 ft from the edge of the roadway in weaker soil. .............38

v
Figure 4.8 Lateral stress during excavation (1 psi increments) (left to right, top to bottom). ..................................................................................................................39
Figure 4.9 Tension in the asphalt throughout excavation (PZ-27 located at 2 ft in stronger soil). .......................................................................................................................40
Figure 4.10 Maximum tension developed in the roadway subjected to truck loading for a PZ ]27 located 2 ft from the edge of the roadway. ................................................40
Figure 4.11 Maximum tension developed in the roadway subjected to truck loading for a PZ ]27 at all locations. ...........................................................................................41
Figure 4.12 Maximum tension in the roadway for all loadings and locations (PZ-27 and stronger soil). .........................................................................................................41
Figure 4.13 Maximum tension in the roadway for all loadings and locations (PZ-40 and stronger soil). .........................................................................................................42
Figure 4.14 Maximum tension in the roadway for all loadings and locations (PZ-27 and weaker soil). ...........................................................................................................42
Figure 4.15 Maximum tension in the roadway for all loadings and locations (PZ-40 and weaker soil). ...........................................................................................................43
Figure 4.16 Asphalt strain distribution as a function of position and excavation depth (PZ-27, stronger soil). ............................................................................................44
Figure 5.1 Temperature effect on indirect tension test modulus (source FHWA). ............49 Figure 5.2 Results of IDT tests from FHWA and SMO. ...................................................49 Figure 5.3 Range of IDT strength at various temperatures (SMO). ..................................50 Figure 5.4 Air and asphalt temperatures (at increasing depths) measured on a typical
summer day in Florida. ..........................................................................................50 Figure 5.5 Modeled asphalt temperature variation with depth along with field
measurements. ........................................................................................................51 Figure 5.6 Location of peak stress in asphalt due to self weight of soil / wall system. .....52 Figure 5.7 Location of peak stress in asphalt due to self weight and truck loading. .........52 Figure 5.8 Summarized peak stresses for self weight and truck loaded systems (from
Figures 4.12 - 4.15). ...............................................................................................53 Figure A.1 Horizontal wall movement throughout excavation (PZ-27 wall in weaker soil
with lane load) 0 ft from wall. ........................................................................... A-1 Figure A.2 Horizontal wall movement throughout excavation (PZ-27 wall in weaker soil
with lane load) 2 ft from wall. ........................................................................... A-1 Figure A.3 Horizontal wall movement throughout excavation (PZ-27 wall in weaker soil
with lane load) 5 ft from wall. ........................................................................... A-2 Figure A.4 Horizontal wall movement throughout excavation (PZ-27 wall in weaker soil
with lane load) 10 ft from wall. ......................................................................... A-2 Figure A.5 Horizontal wall movement throughout excavation (PZ-27 wall in weaker soil
with no load) 0 ft from wall. .............................................................................. A-3 Figure A.6 Horizontal wall movement throughout excavation (PZ-27 wall in weaker soil
with no load) 2 ft from wall. .............................................................................. A-3 Figure A.7 Horizontal wall movement throughout excavation (PZ-27 wall in weaker soil
with no load) 5 ft from wall. .............................................................................. A-4 Figure A.8 Horizontal wall movement throughout excavation (PZ-27 wall in weaker soil
with no load) 10 ft from wall. ............................................................................ A-4

vi
Figure A.9 Horizontal wall movement throughout excavation (PZ-27 wall in weaker soil with truck load) 0 ft from wall. .......................................................................... A-5
Figure A.10 Horizontal wall movement throughout excavation (PZ-27 wall in weaker soil with truck load) 2 ft from wall. ................................................................... A-5
Figure A.11 Horizontal wall movement throughout excavation (PZ-27 wall in weaker soil with truck load) 5 ft from wall. ................................................................... A-6
Figure A.12 Horizontal wall movement throughout excavation (PZ-27 wall in weaker soil with truck load) 10 ft from wall. ................................................................. A-6
Figure A.13 Horizontal wall movement throughout excavation (PZ-40 wall in weaker soil with lane load) 0 ft from wall. ..................................................................... A-7
Figure A.14 Horizontal wall movement throughout excavation (PZ-40 wall in weaker soil with lane load) 2 ft from wall. ..................................................................... A-7
Figure A.15 Horizontal wall movement throughout excavation (PZ-40 wall in weaker soil with lane load) 5 ft from wall. ..................................................................... A-8
Figure A.16 Horizontal wall movement throughout excavation (PZ-40 wall in weaker soil with lane load) 10 ft from wall. ................................................................... A-8
Figure A.17 Horizontal wall movement throughout excavation (PZ-40 wall in weaker soil with no load) 0 ft from wall. ....................................................................... A-9
Figure A.18 Horizontal wall movement throughout excavation (PZ-40 wall in weaker soil with no load) 2 ft from wall. ....................................................................... A-9
Figure A.19 Horizontal wall movement throughout excavation (PZ-40 wall in weaker soil with no load) 5 ft from wall. ..................................................................... A-10
Figure A.20 Horizontal wall movement throughout excavation (PZ-40 wall in weaker soil with no load) 10 ft from wall. ................................................................... A-10
Figure A.21 Horizontal wall movement throughout excavation (PZ-40 wall in weaker soil with truck load) 0 ft from wall. ................................................................. A-11
Figure A.22 Horizontal wall movement throughout excavation (PZ-40 wall in weaker soil with truck load) 2 ft from wall. ................................................................. A-11
Figure A.23 Horizontal wall movement throughout excavation (PZ-40 wall in weaker soil with truck load) 5 ft from wall. ................................................................. A-12
Figure A.24 Horizontal wall movement throughout excavation (PZ-40 wall in weaker soil with truck load) 10 ft from wall. ............................................................... A-12
Figure A.25 Horizontal wall movement throughout excavation (PZ-27 wall in stronger soil with lane load) 0 ft from wall. ................................................................... A-13
Figure A.26 Horizontal wall movement throughout excavation (PZ-27 wall in stronger soil with lane load) 2 ft from wall. ................................................................... A-13
Figure A.27 Horizontal wall movement throughout excavation (PZ-27 wall in stronger soil with lane load) 5 ft from wall. ................................................................... A-14
Figure A.28 Horizontal wall movement throughout excavation (PZ-27 wall in stronger soil with lane load) 10 ft from wall. ................................................................. A-14
Figure A.29 Horizontal wall movement throughout excavation (PZ-27 wall in stronger soil with no load) 0 ft from wall. ..................................................................... A-15
Figure A.30 Horizontal wall movement throughout excavation (PZ-27 wall in stronger soil with no load) 2 ft from wall. ..................................................................... A-15
Figure A.31 Horizontal wall movement throughout excavation (PZ-27 wall in stronger soil with no load) 5 ft from wall. ..................................................................... A-16
vii
Figure A.32 Horizontal wall movement throughout excavation (PZ-27 wall in stronger soil with no load) 10 ft from wall. ................................................................... A-16
Figure A.33 Horizontal wall movement throughout excavation (PZ-27 wall in stronger soil with truck load) 0 ft from wall. ................................................................. A-17
Figure A.34 Horizontal wall movement throughout excavation (PZ-27 wall in stronger soil with truck load) 2 ft from wall. ................................................................. A-17
Figure A.35 Horizontal wall movement throughout excavation (PZ-27 wall in stronger soil with truck load) 5 ft from wall. ................................................................. A-18
Figure A.36 Horizontal wall movement throughout excavation (PZ-27 wall in stronger soil with truck load) 10 ft from wall. ............................................................... A-18
Figure A.37 Horizontal wall movement throughout excavation (PZ-40 wall in stronger soil with lane load) 0 ft from wall. ................................................................... A-19
Figure A.38 Horizontal wall movement throughout excavation (PZ-40 wall in stronger soil with lane load) 2 ft from wall. ................................................................... A-19
Figure A.39 Horizontal wall movement throughout excavation (PZ-40 wall in stronger soil with lane load) 5 ft from wall. ................................................................... A-20
Figure A.40 Horizontal wall movement throughout excavation (PZ-40 wall in stronger soil with lane load) 10 ft from wall. ................................................................. A-20
Figure A.41 Horizontal wall movement throughout excavation (PZ-40 wall in stronger soil with no load) 0 ft from wall. ..................................................................... A-21
Figure A.42 Horizontal wall movement throughout excavation (PZ-40 wall in stronger soil with no load) 2 ft from wall. ..................................................................... A-21
Figure A.43 Horizontal wall movement throughout excavation (PZ-40 wall in stronger soil with no load) 5 ft from wall. ..................................................................... A-22
Figure A.44 Horizontal wall movement throughout excavation (PZ-40 wall in stronger soil with no load) 10 ft from wall. ................................................................... A-22
Figure A.45 Horizontal wall movement throughout excavation (PZ-40 wall in stronger soil with truck load) 0 ft from wall. ................................................................. A-23
Figure A.46 Horizontal wall movement throughout excavation (PZ-40 wall in stronger soil with truck load) 2 ft from wall. ................................................................. A-23
Figure A.47 Horizontal wall movement throughout excavation (PZ-40 wall in stronger soil with truck load) 5 ft from wall. ................................................................. A-24
Figure A.48 Horizontal wall movement throughout excavation (PZ-40 wall in stronger soil with truck load) 10 ft from wall. ............................................................... A-24
Figure B.1 Vertical roadway displacement during excavation (PZ-27 wall in weaker soil with lane load) 0 ft from wall. .............................................................................B-1
Figure B.2 Vertical roadway displacement during excavation (PZ-27 wall in weaker soil with lane load) 2 ft from wall. ............................................................................B-1
Figure B.3 Vertical roadway displacement during excavation (PZ-27 wall in weaker soil with lane load) 5 ft from wall. ............................................................................B-2
Figure B.4 Vertical roadway displacement during excavation (PZ-27 wall in weaker soil with lane load) 10 ft from wall. ..........................................................................B-2
Figure B.5 Vertical roadway displacement during excavation (PZ-27 wall in weaker soil with no load) 0 ft from wall. ...............................................................................B-3
Figure B.6 Vertical roadway displacement during excavation (PZ-27 wall in weaker soil with no load) 2 ft from wall. ...............................................................................B-3
viii
Figure B.7 Vertical roadway displacement during excavation (PZ-27 wall in weaker soil with no load) 5 ft from wall. ...............................................................................B-4
Figure B.8 Vertical roadway displacement during excavation (PZ-27 wall in weaker soil with no load) 10 ft from wall. .............................................................................B-4
Figure B.9 Vertical roadway displacement during excavation (PZ-27 wall in weaker soil with truck load) 0 ft from wall. ...........................................................................B-5
Figure B.10 Vertical roadway displacement during excavation (PZ-27 wall in weaker soil with truck load) 2 ft from wall. ....................................................................B-5
Figure B.11 Vertical roadway displacement during excavation (PZ-27 wall in weaker soil with truck load) 5 ft from wall. ....................................................................B-6
Figure B.12 Vertical roadway displacement during excavation (PZ-27 wall in weaker soil with truck load) 10 ft from wall. ..................................................................B-6
Figure B.13 Vertical roadway displacement during excavation (PZ-40 wall in weaker soil with lane load) 0 ft from wall. ......................................................................B-7
Figure B.14 Vertical roadway displacement during excavation (PZ-40 wall in weaker soil with lane load) 2 ft from wall. ......................................................................B-7
Figure B.15 Vertical roadway displacement during excavation (PZ-40 wall in weaker soil with lane load) 5 ft from wall. ......................................................................B-8
Figure B.16 Vertical roadway displacement during excavation (PZ-40 wall in weaker soil with lane load) 10 ft from wall. ....................................................................B-8
Figure B.17 Vertical roadway displacement during excavation (PZ-40 wall in weaker soil with no load) 0 ft from wall. ........................................................................B-9
Figure B.18 Vertical roadway displacement during excavation (PZ-40 wall in weaker soil with no load) 2 ft from wall. ........................................................................B-9
Figure B.19 Vertical roadway displacement during excavation (PZ-40 wall in weaker soil with no load) 5 ft from wall. ......................................................................B-10
Figure B.20 Vertical roadway displacement during excavation (PZ-40 wall in weaker soil with no load) 10 ft from wall. ....................................................................B-10
Figure B.21 Vertical roadway displacement during excavation (PZ-40 wall in weaker soil with truck load) 0 ft from wall. ..................................................................B-11
Figure B.22 Vertical roadway displacement during excavation (PZ-40 wall in weaker soil with truck load) 2 ft from wall. ..................................................................B-11
Figure B.23 Vertical roadway displacement during excavation (PZ-40 wall in weaker soil with truck load) 5 ft from wall. ..................................................................B-12
Figure B.24 Vertical roadway displacement during excavation (PZ-40 wall in weaker soil with truck load) 10 ft from wall. ................................................................B-12
Figure B.25 Vertical roadway displacement during excavation (PZ-27 wall in stronger soil with lane load) 0 ft from wall. ....................................................................B-13
Figure B.26 Vertical roadway displacement during excavation (PZ-27 wall in stronger soil with lane load) 2 ft from wall. ....................................................................B-13
Figure B.27 Vertical roadway displacement during excavation (PZ-27 wall in stronger soil with lane load) 5 ft from wall. ....................................................................B-14
Figure B.28 Vertical roadway displacement during excavation (PZ-27 wall in stronger soil with lane load) 10 ft from wall. ..................................................................B-14
Figure B.29 Vertical roadway displacement during excavation (PZ-27 wall in stronger soil with no load) 0 ft from wall. ......................................................................B-15
ix
Figure B.30 Vertical roadway displacement during excavation (PZ-27 wall in stronger soil with no load) 2 ft from wall. ......................................................................B-15
Figure B.31 Vertical roadway displacement during excavation (PZ-27 wall in stronger soil with no load) 5 ft from wall. ......................................................................B-16
Figure B.32 Vertical roadway displacement during excavation (PZ-27 wall in stronger soil with no load) 10 ft from wall. ....................................................................B-16
Figure B.33 Vertical roadway displacement during excavation (PZ-27 wall in stronger soil with truck load) 0 ft from wall. ..................................................................B-17
Figure B.34 Vertical roadway displacement during excavation (PZ-27 wall in stronger soil with truck load) 2 ft from wall. ..................................................................B-17
Figure B.35 Vertical roadway displacement during excavation (PZ-27 wall in stronger soil with truck load) 5 ft from wall. ..................................................................B-18
Figure B.36 Vertical roadway displacement during excavation (PZ-27 wall in stronger soil with truck load) 10 ft from wall. ................................................................B-18
Figure B.37 Vertical roadway displacement during excavation (PZ-40 wall in stronger soil with lane load) 0 ft from wall. ....................................................................B-19
Figure B.38 Vertical roadway displacement during excavation (PZ-40 wall in stronger soil with lane load) 2 ft from wall. ....................................................................B-19
Figure B.39 Vertical roadway displacement during excavation (PZ-40 wall in stronger soil with lane load) 5 ft from wall. ....................................................................B-20
Figure B.40 Vertical roadway displacement during excavation (PZ-40 wall in stronger soil with lane load) 10 ft from wall. ..................................................................B-20
Figure B.41 Vertical roadway displacement during excavation (PZ-40 wall in stronger soil with no load) 0 ft from wall. ......................................................................B-21
Figure B.42 Vertical roadway displacement during excavation (PZ-40 wall in stronger soil with no load) 2 ft from wall. ......................................................................B-21
Figure B.43 Vertical roadway displacement during excavation (PZ-40 wall in stronger soil with no load) 5 ft from wall. ......................................................................B-22
Figure B.44 Vertical roadway displacement during excavation (PZ-40 wall in stronger soil with no load) 10 ft from wall. ....................................................................B-22
Figure B.45 Vertical roadway displacement during excavation (PZ-40 wall in stronger soil with truck load) 0 ft from wall. ..................................................................B-23
Figure B.46 Vertical roadway displacement during excavation (PZ-40 wall in stronger soil with truck load) 2 ft from wall. ..................................................................B-23
Figure B.47 Vertical roadway displacement during excavation (PZ-40 wall in stronger soil with truck load) 5 ft from wall. ..................................................................B-24
Figure B.48 Vertical roadway displacement during excavation (PZ-40 wall in stronger soil with truck load) 10 ft from wall. ................................................................B-24
Figure C.1 Tension in the asphalt throughout excavation (PZ-27 wall in weaker soil with lane load) 0 ft from wall. . ....................................................................................C-1
Figure C.2 Tension in the asphalt throughout excavation (PZ-27 wall in weaker soil with lane load) 2 ft from wall. . ....................................................................................C-1
Figure C.3 Tension in the asphalt throughout excavation (PZ-27 wall in weaker soil with lane load) 5 ft from wall. . ....................................................................................C-2
Figure C.4 Tension in the asphalt throughout excavation (PZ-27 wall in weaker soil with lane load) 10 ft from wall. . ..................................................................................C-2

x
Figure C.5 Tension in the asphalt throughout excavation (PZ-27 wall in weaker soil with no load) 0 ft from wall. . ......................................................................................C-3
Figure C.6 Tension in the asphalt throughout excavation (PZ-27 wall in weaker soil with no load) 2 ft from wall. . ......................................................................................C-3
Figure C.7 Tension in the asphalt throughout excavation (PZ-27 wall in weaker soil with no load) 5 ft from wall. . ......................................................................................C-4
Figure C.8 Tension in the asphalt throughout excavation (PZ-27 wall in weaker soil with no load) 10 ft from wall. . ....................................................................................C-4
Figure C.9 Tension in the asphalt throughout excavation (PZ-27 wall in weaker soil with truck load) 0 ft from wall. . ..................................................................................C-5
Figure C.10 Tension in the asphalt throughout excavation (PZ-27 wall in weaker soil with truck load) 2 ft from wall. . ..........................................................................C-5
Figure C.11 Tension in the asphalt throughout excavation (PZ-27 wall in weaker soil with truck load) 5 ft from wall. . ..........................................................................C-6
Figure C.12 Tension in the asphalt throughout excavation (PZ-27 wall in weaker soil with truck load) 10 ft from wall. . ........................................................................C-6
Figure C.13 Tension in the asphalt throughout excavation (PZ-40 wall in weaker soil with lane load) 0 ft from wall. . ...........................................................................C-7
Figure C.14 Tension in the asphalt throughout excavation (PZ-40 wall in weaker soil with lane load) 2 ft from wall. . ...........................................................................C-7
Figure C.15 Tension in the asphalt throughout excavation (PZ-40 wall in weaker soil with lane load) 5 ft from wall. . ...........................................................................C-8
Figure C.16 Tension in the asphalt throughout excavation (PZ-40 wall in weaker soil with lane load) 10 ft from wall. . .........................................................................C-8
Figure C.17 Tension in the asphalt throughout excavation (PZ-40 wall in weaker soil with no load) 0 ft from wall. . ..............................................................................C-9
Figure C.18 Tension in the asphalt throughout excavation (PZ-40 wall in weaker soil with no load) 2 ft from wall. . ..............................................................................C-9
Figure C.19 Tension in the asphalt throughout excavation (PZ-40 wall in weaker soil with no load) 5 ft from wall. . ............................................................................C-10
Figure C.20 Tension in the asphalt throughout excavation (PZ-40 wall in weaker soil with no load) 10 ft from wall. . ..........................................................................C-10
Figure C.21 Tension in the asphalt throughout excavation (PZ-40 wall in weaker soil with truck load) 0 ft from wall. . ........................................................................C-11
Figure C.22 Tension in the asphalt throughout excavation (PZ-40 wall in weaker soil with truck load) 2 ft from wall. . ........................................................................C-11
Figure C.23 Tension in the asphalt throughout excavation (PZ-40 wall in weaker soil with truck load) 5 ft from wall. . ........................................................................C-12
Figure C.24 Tension in the asphalt throughout excavation (PZ-40 wall in weaker soil with truck load) 10 ft from wall. . ......................................................................C-12
Figure C.25 Tension in the asphalt throughout excavation (PZ-27 wall in stronger soil with lane load) 0 ft from wall. . .........................................................................C-13
Figure C.26 Tension in the asphalt throughout excavation (PZ-27 wall in stronger soil with lane load) 2 ft from wall. . .........................................................................C-13
Figure C.27 Tension in the asphalt throughout excavation (PZ-27 wall in stronger soil with lane load) 5 ft from wall. . .........................................................................C-14

xi
Figure C.28 Tension in the asphalt throughout excavation (PZ-27 wall in stronger soil with lane load) 10 ft from wall. . .......................................................................C-14
Figure C.29 Tension in the asphalt throughout excavation (PZ-27 wall in stronger soil with no load) 0 ft from wall. . ............................................................................C-15
Figure C.30 Tension in the asphalt throughout excavation (PZ-27 wall in stronger soil with no load) 2 ft from wall. . ............................................................................C-15
Figure C.31 Tension in the asphalt throughout excavation (PZ-27 wall in stronger soil with no load) 5 ft from wall. . ............................................................................C-16
Figure C.32 Tension in the asphalt throughout excavation (PZ-27 wall in stronger soil with no load) 10 ft from wall. . ..........................................................................C-16
Figure C.33 Tension in the asphalt throughout excavation (PZ-27 wall in stronger soil with truck load) 0 ft from wall. . ........................................................................C-17
Figure C.34 Tension in the asphalt throughout excavation (PZ-27 wall in stronger soil with truck load) 2 ft from wall. . ........................................................................C-17
Figure C.35 Tension in the asphalt throughout excavation (PZ-27 wall in stronger soil with truck load) 5 ft from wall. . ........................................................................C-18
Figure C.36 Tension in the asphalt throughout excavation (PZ-27 wall in stronger soil with truck load) 10 ft from wall. . ......................................................................C-18
Figure C.37 Tension in the asphalt throughout excavation (PZ-40 wall in stronger soil with lane load) 0 ft from wall. . .........................................................................C-19
Figure C.38 Tension in the asphalt throughout excavation (PZ-40 wall in stronger soil with lane load) 2 ft from wall. . .........................................................................C-19
Figure C.39 Tension in the asphalt throughout excavation (PZ-40 wall in stronger soil with lane load) 5 ft from wall. . .........................................................................C-20
Figure C.40 Tension in the asphalt throughout excavation (PZ-40 wall in stronger soil with lane load) 10 ft from wall. . .......................................................................C-20
Figure C.41 Tension in the asphalt throughout excavation (PZ-40 wall in stronger soil with no load) 0 ft from wall. . ............................................................................C-21
Figure C.42 Tension in the asphalt throughout excavation (PZ-40 wall in stronger soil with no load) 2 ft from wall. . ............................................................................C-21
Figure C.43 Tension in the asphalt throughout excavation (PZ-40 wall in stronger soil with no load) 5 ft from wall. . ............................................................................C-22
Figure C.44 Tension in the asphalt throughout excavation (PZ-40 wall in stronger soil with no load) 10 ft from wall. . ..........................................................................C-22
Figure C.45 Tension in the asphalt throughout excavation (PZ-40 wall in stronger soil with truck load) 0 ft from wall. . ........................................................................C-23
Figure C.46 Tension in the asphalt throughout excavation (PZ-40 wall in stronger soil with truck load) 2 ft from wall. . ........................................................................C-23
Figure C.47 Tension in the asphalt throughout excavation (PZ-40 wall in stronger soil with truck load) 5 ft from wall. . ........................................................................C-24
Figure C.48 Tension in the asphalt throughout excavation (PZ-40 wall in stronger soil with truck load) 10 ft from wall. . ......................................................................C-24

1
1. INTRODUCTION Construction aside existing roadways (e.g., widening for additional lanes, etc.) often requires a temporary cantilevered sheet pile wall to maintain lateral stability while adjacent excavation is occurring (Fig. 1.1). Design of these wall systems must address both strength and service limit states. However, for geotechnical systems such as these, service limits often control the design whereby larger/stronger structural elements are needed to minimize settlement or in this case lateral movement. At present, FDOT guidelines require these sheet pile systems to withstand the lateral forces while limiting the maximum permissible displacement to one inch at the top of cantilever sheet pile walls if the roadway is not planned for subsequent repair or resurfacing. Larger displacements are tolerated when the existing roadway is planned for remediation after the temporary wall is removed. The focus of this study is to ascertain whether or not these displacement limits are reasonable; and if not, what value, range of values, and/or conditions control the selection of an appropriate service limit.
Figure 1.1 Cantilevered sheet pile wall adjacent State Road 39, Hillsborough County. 1.1 Background In the past, when walls have been limited to the one inch maximum lateral displacement, visible distress to adjacent roadways has not been noted. Conversely, in cases where excessive displacement (6 to 7 inches) was observed at the top of the wall, severe longitudinal cracking in the closest wheel path ensued. Prior to this study, a rationale for assigning an intermediate limiting displacement value was not in place, but it was understood that such a value was subject to conditions based on other factors. Factors that weighed heavily on an imposing service limits included: (1) whether or not the existing roadway integrity was to be maintained, (2) distance of wall from existing roadway, (3) type of existing roadway, (4) height of wall or depth of excavation in front

2
of the wall, (5) soil type retained by the wall and to some degree the type of soil removed from in front of the wall, (6) material and geometric properties of the wall, (7) wall systems ability to undergo distortion and retain re-use functionality, and (8) construction sequencing with regards to refurbishing/repaving the existing roadway if at all. Understanding the degree to which the above parameters affect the lateral displacement of a cantilevered wall has a cost saving benefit for the State; the ability to regulate certain controllable parameters and lead to lighter, less expensive steel sheet piles is therefore needed where greater deflections might possibly be tolerated. Setting criteria for wall movement involves identifying modes of failure and threshold values above which cause such modes (e.g., cracking, vertical or lateral displacement, etc.). As the preponderance of Florida roadways are asphalt, identifying the factors leading to their distress has lead this study to investigate the properties of asphalt and subsoil conditions that support it. To this end, a large number of numerical simulations were conducted involving a range of soil conditions and wall construction scenarios if an effort to isolate when asphalt is likely to experience excessive distress. Case studies were sought to calibrate/confirm the simulations from which one was obtained. Finally, as the strength of asphalt and its dependency on temperature provides the insight required to appropriate set the project criteria. 1.2 Report Organization The overall organization of this report is outlined below wherein four chapters identify the problem, the modeling approach, the results of the modeling, and recommendations for the useful application of the study findings. Chapter 2 introduces the original problem as outlined in the USF proposal submitted to the FDOT. A background in geotechnical theory of cantilevered walls, available methods to accurately compute displacement, and properties of asphalt pavement is also included as it pertains to identifying a solution to the problem statement. The development of the numerical model including the numerous variations and associated model runs are detailed in Chapter 3. Therein, 550 scenarios for cantilevered wall excavation and relative roadway position where evaluated. Results of the Chapter 3 models are presented and discussed in Chapter 4 with emphasis on mechanisms leading to excessive pavement distress. Based on the results in Chapter 4 and the available knowledge of asphalt strength variations with temperature, rational guidelines for establishing a safe displacement limit for lateral wall movement are provided in Chapter 5. Due to the enormous amount of data collected from the numerous numerical model runs, an appendix has been included for completeness.

3
2. BACKGROUND This chapter provides an overview of the understanding of cantilevered wall performance and the factors that are considered to play heavily thereon. A statement of the problem as identified by FDOT is provided followed by geotechnical theory commonly used to assess wall stability, displacement, and available free software that would complement FDOT needs. Finally, material properties of base course and asphalt as well as the effect of temperature are presented as they pertain to modeling input parameters (Chapter 3) and development of criteria/guidelines (Chapter 5). 2.1 Problem Statement This project stemmed from a RFP defined by FDOT therein the following was stated:
Current FDOT guidelines for sheet pile systems call for a maximum displacement of one inch at the top of cantilever sheet pile walls. The primary reason for this small displacement is to protect the integrity of a roadway retained by the wall. When sheets are driven next to an existing roadway before the soil in front of the sheets is excavated. Excessive wall deflections allow the retained soil to loosen, settle or even produce cracks in the shoulder, or wheel path of the travel lane. The one inch maximum displacement has been challenged as being too restrictive by District Structures Design Engineers; in order to limit deflections to one inch, heavier, more expensive sheets must be used to provide the required stiffness. It is recognized that the proper limiting deflection should not be the same for all cases. Factors for selecting the proper deflection limit include: the height of the wall, the distance between the wall and road, whether the road will be repaved after the wall deflects, and whether the wall will suffer damage at the joints due to the deflection. This project will study the influence of lateral wall deformation on the damage caused to a roadway in close proximity to the wall. The project will rely on finite element analysis principles and methods to study various scenarios pertaining to the construction of a temporary cantilever sheet pile near an existing roadway. The goal is to develop a set of rational guidelines for specifying the allowable deflection of sheet piles in FDOT projects.”
In response to this problem statement, an approach was initiated to identify accurate ways of predicting wall movement without finite element modeling (or similar complexity) as well as present understanding of pavement failure mechanisms. The following sections address commonly used geotechnical approaches to identify wall stability, flaws in estimating wall movement, free software for evaluating displacement, and pavement and soil properties used/provided by the State.

4
2.2 Wall Stability Cantilevered sheet pile walls are a category of retaining walls that use sufficient embedment below the bottom of excavation such that the wall is designed as a cantilevered beam with a unit width and sufficient section properties to resist the shear and bending. They are mostly used as temporary structures in cohesionless soils; typically used for relatively short wall heights (typically less than 15 ft) as increasing wall height has a drastic effect on the required section modulus. Therein, the bending moment at the base of the wall is proportional to the cube of the height (1/6KagH3). Commonly used classical approaches to establish required embedment depth use simplifying assumptions with regard to pressure as well as wall frictional interaction with the soil. Of the two most commonly used classical methods, the Coulomb approach includes friction whereas the Rankine approach does not. A wide variety of software packages is available capable of establishing the stability of cantilevered walls. Unless based on finite element, finite difference, or elasticity, they virtually all make use of classical approaches that identify a minimum embedment depth based on soil pressure and the direction of movement of the wall relative to the soil. A wall that moves away from the soil experiences the minimum lateral pressure in the form of active earth pressure, no movement produces at rest pressure, and a wall that is pressed against a soil can be subject to the maximum lateral pressure denoted as passive pressures. Classical methods of evaluating stability assign an on or off switch to wall pressure wherein the pressure is either the minimum active or the maximum passive. More correctly, lateral pressure on a wall is dependent on the location of wall with respect to its point of no translation and the degree to which that portion of the wall either engages the full passive or minimum active pressure. Although required movement values vary greatly depending on soil type, to develop the minimum lateral pressure, top of wall movement would need to be on the order of 0.001H to 0.05H, where H is the height of the wall. Otherwise, higher pressures would still exist. This implies that the entire active/failure wedge behind the wall must be engaged to create the active condition as it is a function of the wall height and not simply local displacement. Table 2.1 shows typical movement values to establish the minimum lateral pressure state.
Table 2.1 Required wall movement to establish minimum lateral pressure (Bowles, 1982).
Soil Type Required Movement Dense Sand 0.001 – 0.002 H Loose Sand 0.002 – 0.004 H Firm Clay 0.01 – 0.02 H Soft Clay 0.02 – 0.05 H

5
U.S. Army Corps of Engineers (1994) states that a movement of 0.3 - 0.4% H is sufficient to achieve minimum lateral pressure for medium dense to dense sand which corresponds to a 1” movement of a 20 ft wall. Loose sands require even more movement. The maximum lateral pressure obtainable (passive pressure limit) is many times higher than the active pressure and requires far more displacement (in the opposite direction toward the soil) to achieve. Where the coefficient of active earth pressure might range from 0.2 to 0.3 in sands, the coefficient of passive pressure could range from 3 to 14 (10 to 70 times higher). The displacement required to engage full passive pressure is similarly larger than the active case wherein 10 times the active movement is required for dense or medium dense sand. This would correspond to a 10 inch movement when compared to the 1 inch active movement in the same 20 ft wall cited above. Again, larger displacements are required in loose sands. Figure 2.1 shows the range of displacements required to achieve both the minimum and maximum earth pressure conditions at the mid-height of a 10 ft wall. Although not used in classical stability computations, the sub-grade modulus of the soil can be used to assign a pressure proportional to the actual movement. It can also be used to estimate the displacement required to develop full passive pressure by dividing the passive pressure by the sub-grade modulus. However, the relationship is non-linear (Figure 2.1) and therefore not truly reflected by this approach. Cantilevered retaining walls depend on developing passive pressure in front of the wall to provide stability. When computing stability, it is assumed that the wall rotates about a point just above the bottom of the wall beneath which passive pressure develops behind the wall. All regions above the point of rotation are assumed to be active pressure zones (behind the wall). Two closed form solutions to determining the required embedment depth are presented. The first method (Whitlow, 1990) assumes point C to be the point of no translation (Fig. 2.2) below which the passive region behind the wall is replaced by a single reaction force, R. By summing moments at that point the embedment depth, d (BC), can be represented by
d = H / ((K p) 2/3 – 1)
As the calculated embedment depth, d, is not the actual embedment depth (by omission of length CD), the cited reference suggests increasing d by 20% = 1.2d. A second method for establishing a stabile embedment depth for cantilevered retaining walls is presented by Bowles (1982). This method is more sophisticated than the first but still uses a somewhat simplified pressure distribution (Fig. 2.3c) when compared to the real pressure distribution shown in Fig. 2.3b. The required embedment depth, d, is

6
graphically shown as the sum of Y and a where Y is the root of the fourth order polynomial:
Y 4 – Y 2 (8Ra /C) – Y (12Ra y / C) – 4(Ra) 2 / C2 = 0 and
a = P3 / C where, P1 = C Y P2 = P3 + P1 P3 = gH P4 = g(H + a)Kp –g(aKa) C = g(Kp - Ka) Ra = 1/2g Ka H 2 + 1/2g Ka a2 and y = (1/2g Ka H 2(H/3 + a) + 1/2g Ka a2 2/3a) / Ra Comparing the two methods for an example scenario using sand (g = 100 pcf, F = 30 deg., H = 10ft) the calculated embedment would be 9.25 ft and 14.25 ft for the Whitlow and Bowles methods, respectively. The Whitlow method, however, requires an additional 20% length to compensate for the passive zone behind the wall replaced by a single force, R, at C (Fig. 2.2) making the comparison 11.1 ft and 14.25 ft, respectively. At this point, an additional 20 to 40 percent embedment would be typically applied to assure a sufficient safety factor. 2.3 Wall Movement Movement of cantilevered retaining walls requires more involved analysis and should be analyzed using finite element, finite difference, or elasticity approaches which generally require some form of software. When using these packages, the displacement or force is compared to a balanced condition based on an iterative evaluation of the wall, its stiffness, and the surrounding soil. If a given displacement is assumed in the soil, then a pressure is generated in the soil that in turn is applied to the wall. The wall stiffness (section properties) then is used to determine the corresponding force required to cause the same displacement. That force is then compared to the pressure developed in the soil. If the two forces do not agree a second choice for displacement is selected and iterated until the unbalanced forces approach an acceptably low level. Alternately, a wall force or soil pressure could be selected and the resultant displacement for each element compared and iterated accordingly.

7
Software packages that use the full passive and minimum active pressure to form the net pressure diagram tend to overestimate top of wall displacements. This effect stems from cumulative errors when integrating a larger than actual pressure diagram to the shear, bending moment, slope, and then displacement diagrams. A popular package that is plagued with this problem is the CWALSHT software developed and distributed by the Army Corps of Engineers. When using this software, larger embedment depths predict larger displacements due to the overestimated pressure values extending to the bottom of the wall. Figure 2.4 is a screen capture of the software outputted deflection results predicting almost 30 inches of displacement for a 50 ft PZ-27 sheet pile wall embedded in sand (117 pcf density and 33 deg friction angle) where 18 ft of the soil has been removed from one side (32 ft embedment depth). These values were chosen as they are similar to those modeled in Chapters 3 and 4 and serve as a source of comparison. The same section when embedded only 20 ft (still 18ft cantilevered), is predicted to displace only about 9 inches. Figure 2.5 shows the moment, shear, pressure, and displacement diagrams for the 32 ft and 20 ft embedment lengths. It is clear that the full passive pressure and not the mobilized pressure are being assumed in these computations. As a matter of predicting stability, the software is suitable, but for estimating displacement, it is not. There are, however, other free software packages that more accurately predict wall displacements and should be considered for future State projects. One such package is available throught and promoted by the Delft University of Technology in Holland. SPWALL or SPW2006 works on the combined principles of beam elasticity and elasto-plastic subgrade modulus (Verruijt, 2008). This is an inexpensive alternative to finite element or finite difference packages often times designed to handle more complex problems. As an example, the same problem set above has been reworked using SPW2006. Figures 2.6 and 2.7 show both a screen capture and the moment, shear, soil pressure, and deflection diagrams, respectively. The predicted deflection is more in line with that predicted by finite difference analyses presented later in Chapter 4. Comparing the output of both software packages, there is no safe limit defined by CWALSHT as the displacement decreases with embedment whereas SPW2006 shows a clear embedment depth at which lesser values cause excessive wall movement (approximate cantilever height). Figure 2.8 shows this comparison. From a wall stability stand point, the design mode of CWALSHT suggests an embedment depth of approximately 12 ft with safety factors of 1.0 for both passive and active pressure; the classical approaches discussed in Section 2.2 require 17.2 ft and 22.4 ft for the Whitlow and Bowles methods, respectively. SPW2006 indicates instability at embedment depths less than 18 feet. For all methods, an increase embedment depth would need to be assigned to assure a satisfactory level of assurance.

8
2.4 Project Needs It is clear that a reliable means for estimating wall movement is required, however, the effect of wall movement on pavement distress is the primary focus of the study. As a result, the loss of confinement associated with wall movement was determined to be a key modeling aspect (discussed in the ensuing chapters). A thorough overview of common sheet pile wall sections, pavement material properties (asphalt) and common base course materials was also deemed necessary. To this end, both State and Federal agencies were contacted in an effort to obtain these materials.

9
Figure 2.1 Wall movement required to cause full passive or minimum active lateral pressure.
Figure 2.2 Simplified pressure diagram adapted from Whitlow (1990).
0
0.5
1
1.5
2
2.5
-0.3 -0.25 -0.2 -0.15 -0.1 -0.05 0 0.05 0.1 0.15Wall Movement (ft)
Mid
-hei
ght L
ater
al S
oil P
ress
ure
(ksf
) .
Toward Backfill Away from Backfill
Passive Active
g H/2 Kp
g H/2 Ka
A
B
C
D
H
dds
A
B
C
D
active
passive
passive
Pa
Ppf
Ppb
A
B
C
Pa
Pp
R

10
Figure 2.3 Simplified pressure diagram adapted from Bowles (1982).
Figure 2.4 Screen capture of CWALSHT software output results.
b
H
dds
b
H
a
Y-z
z
Y
P1 P2
P3
P4
Ra
(a) (b) (c)

11
Figure 2.5 Variation in predicted wall movement as embedment is varied in CWALSHT
(38ft embedment top, 20 ft embedment bottom).
-40
-35
-30
-25
-20
-15
-10
-5
0
5
100 50 100
Moment (k-ft)
Dep
th (f
t)
-40
-35
-30
-25
-20
-15
-10
-5
0
5
10-20 -10 0 10
Shear (kips)
-40
-35
-30
-25
-20
-15
-10
-5
0
5
10-3 2 7 12
Soil Pressure (ksf)
0 10 20
Deflection (in)
-40
-35
-30
-25
-20
-15
-10
-5
0
5
100 50 100 150
Moment (k-ft)
Dep
th (f
t)
-40
-35
-30
-25
-20
-15
-10
-5
0
5
10-20 -10 0 10
Shear (kips)
-40
-35
-30
-25
-20
-15
-10
-5
0
5
10-3 2 7
Soil Pressure (ksf)
0 20 40
Deflection (in)

12
Figure 2.6 SPW2006 screen capture of output graphs (metric units not defined).
Figure 2.7 Output data from SPW2006 for same conditions shown in Figure 2.5 (top).
0
5
10
15
20
25
30
35
40
45
50
0 100 200
Moment (k-ft)
Dep
th (f
t)
0
5
10
15
20
25
30
35
40
45
50
-20 0 20
Shear(kips)
0
5
10
15
20
25
30
35
40
45
50
-1 0 1
Soil Pressure(ksf)
0
5
10
15
20
25
30
35
40
45
50
0 5
Deflection (in)

13
Figure 2.8 Embedment depth / sensitivity comparison of CWALSHT and SPW2006.
Figure 2.9 SPW2006 output for comparison with Chapter 4 results.
0
2
4
6
8
10
12
14
16
-0.14 -0.12 -0.1 -0.08 -0.06 -0.04 -0.02 0
Disp (m)
Dept
h (m
)
0
10
20
30
40
50
-6 -5 -4 -3 -2 -1
Disp (in)
Dept
h (ft
)
2 ft excavation4 ft excavation6 ft excavation8 ft excavation18 ft excavation
0
5
10
15
20
25
30
35
40
45
50
0 5 10 15 20 25 30 35Top of Wall Disp (in)
Em
bedm
ent (
ft)
CWALSHTSPW2006

14
Figure 2.10 CWALSHT soil pressure output showing full net pressure diagram used for computations.

15
3. NUMERICAL MODELING Parameters which affect the lateral displacement of cantilever sheet piles and are within the reasonable limit of numerical modeling can include: (1) the type and properties of the existing roadway, (2) the degree and type of vehicular loading, (3) the wall location from the roadway, (4) the depth of excavation in front of the wall, (5) the insitu soil properties, and (6) the material and geometric properties of the wall. In order to better understanding the role of each parameter, numerical analyses were performed on numerous combinations of scenarios. However, some of these parameters were held constant in order to reduce the testing matrix to a more manageable size. 3.1 Numerical Analysis Software The program chosen to perform the numerical modeling was FLAC (Fast Lagrangian Analysis of Continua). FLAC is a two-dimensional explicit finite difference program that proves particularly useful in simulating the plastic flow of materials (e.g. soil, rock, and concrete) upon yielding. This ability made the program ideal for modeling the lateral deflection of a sheet pile subjected to loading from an actively yielding soil wedge. The materials are represented as elements that form an interlocking mesh. Once material properties are assigned to each element, various loading and boundary conditions can be applied to the matrix and the response of each element recorded (Itasca Consulting Group, Inc., 2002). 3.2 Model Configuration Geometry. A plane-strain, two-dimensional model was chosen to represent the problem region. A grid composed on more than 4700 elements defined the pre-excavation state of a 152ft wide x 48ft deep region (Figure 3.1). The modeled region was contained by fixed displacement boundaries placed sufficiently far away to minimize boundary effects on the area of interest. A boundary-to-object ratio of 5 was maintained (average of model width and depth divided by the maximum anticipated excavation depth), as to reduce the calculated stress and displacement errors to within 6% (FLAC, 3-45). Though the large grid size significantly increased the number of necessary calculations per model run, a high speed computer performed the calculations effortlessly. Constitutive Model. A Mohr-Coulomb plasticity model was used throughout the grid to represent the insitu soil and the roadway. The constitutive model required the input of certain elastic and plastic properties, to include the mass density, bulk modulus, shear modulus, cohesion, and friction angle.
16
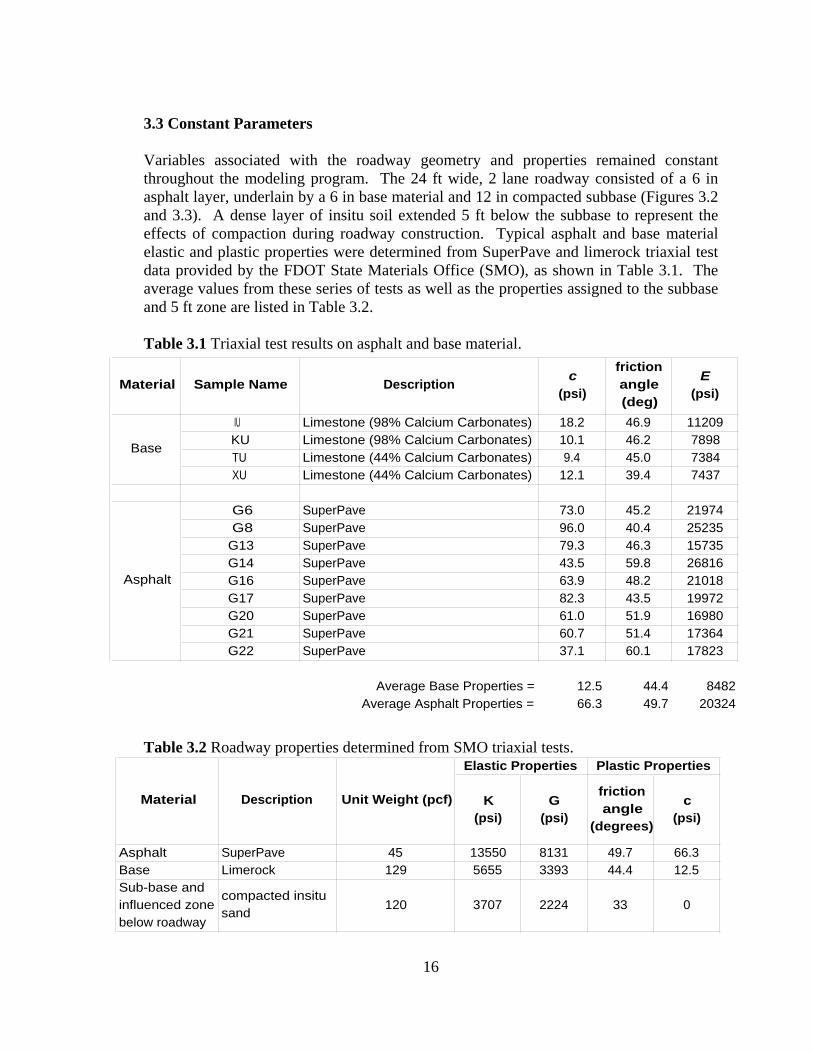
3.3 Constant Parameters Variables associated with the roadway geometry and properties remained constant throughout the modeling program. The 24 ft wide, 2 lane roadway consisted of a 6 in asphalt layer, underlain by a 6 in base material and 12 in compacted subbase (Figures 3.2 and 3.3). A dense layer of insitu soil extended 5 ft below the subbase to represent the effects of compaction during roadway construction. Typical asphalt and base material elastic and plastic properties were determined from SuperPave and limerock triaxial test data provided by the FDOT State Materials Office (SMO), as shown in Table 3.1. The average values from these series of tests as well as the properties assigned to the subbase and 5 ft zone are listed in Table 3.2. Table 3.1 Triaxial test results on asphalt and base material. Table 3.2 Roadway properties determined from SMO triaxial tests.
IU Limestone (98% Calcium Carbonates) 18.2 46.9 11209KU Limestone (98% Calcium Carbonates) 10.1 46.2 7898TU Limestone (44% Calcium Carbonates) 9.4 45.0 7384XU Limestone (44% Calcium Carbonates) 12.1 39.4 7437
G6 SuperPave 73.0 45.2 21974G8 SuperPave 96.0 40.4 25235
G13 SuperPave 79.3 46.3 15735G14 SuperPave 43.5 59.8 26816G16 SuperPave 63.9 48.2 21018G17 SuperPave 82.3 43.5 19972G20 SuperPave 61.0 51.9 16980G21 SuperPave 60.7 51.4 17364G22 SuperPave 37.1 60.1 17823
Average Base Properties = 12.5 44.4 8482Average Asphalt Properties = 66.3 49.7 20324
Description c (psi)
friction angle (deg)
E (psi)
Base
Asphalt
Sample NameMaterial
K (psi)
G (psi)
friction angle
(degrees)
c (psi)
Asphalt SuperPave 45 13550 8131 49.7 66.3Base Limerock 129 5655 3393 44.4 12.5Sub-base and influenced zone below roadway
compacted insitu sand 120 3707 2224 33 0
Elastic Properties Plastic Properties
Unit Weight (pcf)Material Description
17
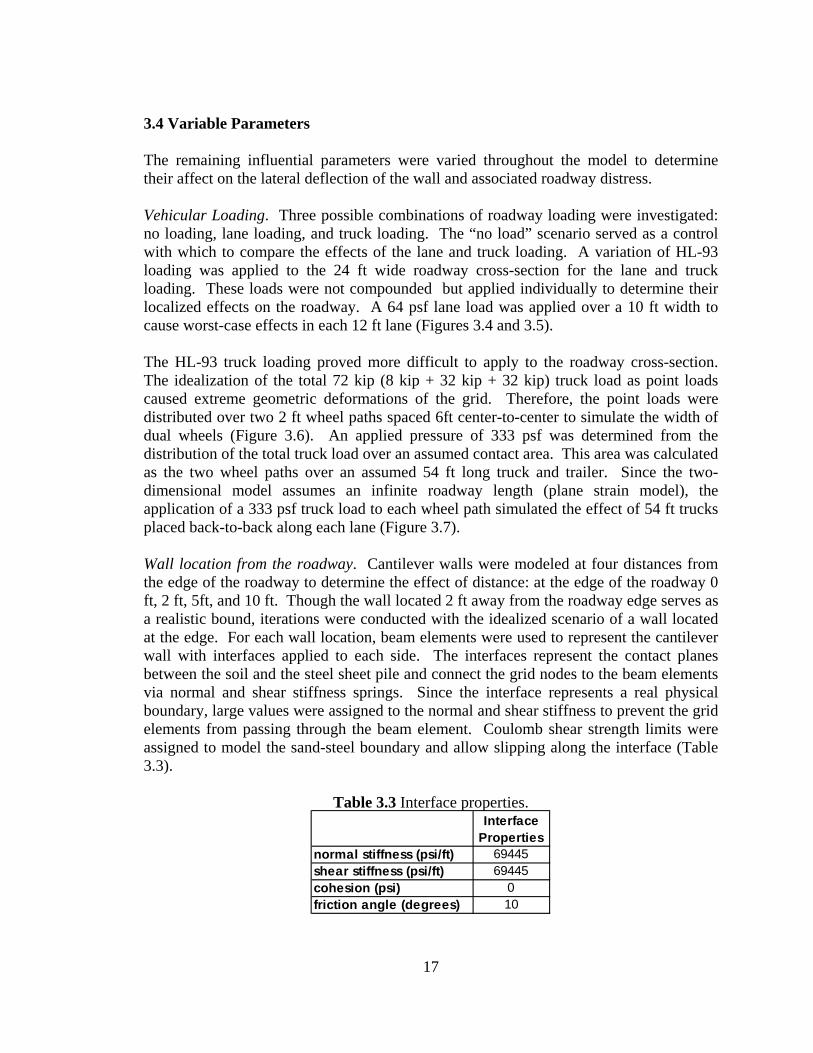
3.4 Variable Parameters The remaining influential parameters were varied throughout the model to determine their affect on the lateral deflection of the wall and associated roadway distress. Vehicular Loading. Three possible combinations of roadway loading were investigated: no loading, lane loading, and truck loading. The “no load” scenario served as a control with which to compare the effects of the lane and truck loading. A variation of HL-93 loading was applied to the 24 ft wide roadway cross-section for the lane and truck loading. These loads were not compounded but applied individually to determine their localized effects on the roadway. A 64 psf lane load was applied over a 10 ft width to cause worst-case effects in each 12 ft lane (Figures 3.4 and 3.5). The HL-93 truck loading proved more difficult to apply to the roadway cross-section. The idealization of the total 72 kip (8 kip + 32 kip + 32 kip) truck load as point loads caused extreme geometric deformations of the grid. Therefore, the point loads were distributed over two 2 ft wheel paths spaced 6ft center-to-center to simulate the width of dual wheels (Figure 3.6). An applied pressure of 333 psf was determined from the distribution of the total truck load over an assumed contact area. This area was calculated as the two wheel paths over an assumed 54 ft long truck and trailer. Since the two-dimensional model assumes an infinite roadway length (plane strain model), the application of a 333 psf truck load to each wheel path simulated the effect of 54 ft trucks placed back-to-back along each lane (Figure 3.7). Wall location from the roadway. Cantilever walls were modeled at four distances from the edge of the roadway to determine the effect of distance: at the edge of the roadway 0 ft, 2 ft, 5ft, and 10 ft. Though the wall located 2 ft away from the roadway edge serves as a realistic bound, iterations were conducted with the idealized scenario of a wall located at the edge. For each wall location, beam elements were used to represent the cantilever wall with interfaces applied to each side. The interfaces represent the contact planes between the soil and the steel sheet pile and connect the grid nodes to the beam elements via normal and shear stiffness springs. Since the interface represents a real physical boundary, large values were assigned to the normal and shear stiffness to prevent the grid elements from passing through the beam element. Coulomb shear strength limits were assigned to model the sand-steel boundary and allow slipping along the interface (Table 3.3).
Table 3.3 Interface properties.
Interface Properties
normal stiffness (psi/ft) 69445shear stiffness (psi/ft) 69445cohesion (psi) 0friction angle (degrees) 10

18
The beam element and interfaces began at the top of the grid and extended near the bottom boundary. Modeling such a long sheet pile section was a convenient method of ensuring fixity throughout the simulated excavation process. This was based on the assumption that no difference in lateral deflection would exist if the sheet pile were driven beyond the minimum depth of embedment. Depth of Excavation. Once the model was established and brought to rest under the initial pre-excavation conditions, grid elements were progressively removed from the front of the wall in 2ft layers. In some iterations, this simulated excavation process was repeated until lateral deflections approached 6in which corresponded to excavation depths as large as 22ft. Though most walls are rarely cantilevered beyond 12ft, the deeper excavations provided additional data with which to better identify any trends. Insitu Soil Properties. The zones used to model the surrounding insitu soil were assigned linear elastic, perfectly plastic characteristics with Mohr-Coulomb failure criteria. Two extremes of soil were investigated in the model. Properties indicative of weaker and stronger homogeneous sands (properties approximately correspond to SPT N-values of 15 and 35 respectively) were applied to both the active and passive sides of the wall (Table 3.4). Table 3.4 Range of soil properties investigated. Cantilever Wall Properties. Properties corresponding to PZ-40 and PZ-27 wall sections were chosen to represent the upper and lower bounds for typically used sections in the state. Since the plane strain model assumes infinite wall length, it was required that cross-sectional area and moment of inertia assigned to the model be converted to a “per foot of wall length” basis (Table 3.5). The elastic modulus is unaffected due to its independence of geometry.
Table 3.5 Range of wall sections investigated.
PZ-27 PZ-40Elastic modulus (ksi) 29000 29000Area (in 2/ft) 7.93 11.75Moment of Inertia (in 4/ft) 183 491
K (psi)
G (psi)
friction angle
(degrees)
c (psi)
weak well-graded sand (SPT N-value corresponding to 15)
107.5 1390 834 30 0
strong well-graded sand (SPT N-value corresponding to 35)
117.5 3243 1946 33 0
Elastic Properties Plastic Properties
Bulk Unit Weight (pcf)Material Description

19
The large number of possible combinations of variables led to 48 possible scenarios resulting in more than 550 model runs (Table 3.6). After the model geometry was established, material properties assigned, boundary condition imposed, and external forces applied; the model was allowed to solve to equilibrium. Data collected after each progressive excavation was recorded and compiled in a file for regression.

20
Table 3.6 Modeling test matrix.
2 4 6 8 10 12 14 16 18 20 22
No Load x x x x x x x x x xLane Load x x x x x x x x x xTruck Load x x x x x x x x x xNo Load x x x x x x x x x xLane Load x x x x x x x x x xTruck Load x x x x x x x x x xNo Load x x x x x x x x x xLane Load x x x x x x x x x xTruck Load x x x x x x x x x xNo Load x x x x x x x x x xLane Load x x x x x x x x x xTruck Load x x x x x x x x x xNo Load x x x x x x x x x xLane Load x x x x x x x x x xTruck Load x x x x x x x x x xNo Load x x x x x x x x x xLane Load x x x x x x x x x xTruck Load x x x x x x x x x xNo Load x x x x x x x x x xLane Load x x x x x x x x x xTruck Load x x x x x x x x x xNo Load x x x x x x x x x xLane Load x x x x x x x x x xTruck Load x x x x x x x x x xNo Load x x x x x x x x x x xLane Load x x x x x x x x x x xTruck Load x x x x x x x x x x xNo Load x x x x x x x x x x xLane Load x x x x x x x x x x xTruck Load x x x x x x x x x x xNo Load x x x x x x x x x x xLane Load x x x x x x x x x x xTruck Load x x x x x x x x x x xNo Load x x x x x x x x x x xLane Load x x x x x x x x x x xTruck Load x x x x x x x x x x xNo Load x x x x x x x x x x xLane Load x x x x x x x x x x xTruck Load x x x x x x x x x x xNo Load x x x x x x x x x x xLane Load x x x x x x x x x x xTruck Load x x x x x x x x x x xNo Load x x x x x x x x x x xLane Load x x x x x x x x x x xTruck Load x x x x x x x x x x xNo Load x x x x x x x x x x xLane Load x x x x x x x x x x xTruck Load x x x x x x x x x x x
Excavation Depth (ft)Location from
roadwayRoadway Loading
Wall Section Properties
Soil
0
2
5
weak sand
PZ-27
10
10
PZ-40
0
2
5
10
strong sand
PZ-40
0
2
5
10
PZ-27
0
2
5

21
3.5 Model Calibration Prior to the execution of the testing matrix, a calibration effort was undertaken to ensure that the modeled results were within reason. A construction site which was currently implementing a cantilevered wall was selected for the calibration. This wall was placed at an on-ramp leading from Commercial Blvd. to the Florida Turnpike near Ft. Lauderdale, Florida. The wall was driven to a depth of 25 ft and excavated to a depth of 8 ft. Table 3.7 lists the proposed sheet pile properties from the plans.
Table 3.7 Sheet Pile Properties from Plan Sheet 709. Cone Penetration Test data received from the construction site was used in the determining input for the soil properties (Figure 3.8). As seen in Figure 3.9, the soil profile was simplified for the modeling by dividing it into three layers. The upper, middle, and bottom layers were characterized by a medium dense, very dense, and loose sands respectively. Since the soundings suggested that the soil was predominantly a cohesionless material, CPT correlations for sand were used to determine the relative density, friction angle, and tangent constrained modulus (Figures 3.10 and 3.11). Densities were obtained using the relative density correlations and assuming a range of 70 to 110 pcf. Table 3.8 reports the strength and elastic properties implemented in the model. Table 3.8 FLAC input properties determined from CPT data. Density (pcf) φ (degrees) Modulus (psi)
Layer 1 (0-3ft) 92.2 39 8164
Layer 2 (3-8ft) 109.8 42 10807
Layer 3 (8-40ft) 84.7 38 6170 Surveying data received via Wing Hueng, the FDOT Turnpike Geotechnical Engineer, provided horizontal wall displacements and vertical roadway displacements with which to calibrate the model. The post-excavation survey shows no measurable vertical roadway displacements, but the top-of-wall horizontal displacement measures 0.01ft (0.12 in) (Figures 3.12 and 3.13).

22
A different model than the one described above was created which closely resembles the geometry of the jobsite (Figure 3.14). The pre-excavation survey indicated that very little soil was present in front of the wall prior to excavation. It was anticipated that a failure to consider the absence of this material would cause significantly higher lateral pressures after excavation, resulting in larger horizontal wall displacements. The model consisted of a wall placed 2.5 ft from the edge of a 25 ft asphalt roadway. The roadway asphalt, base, and subbase thicknesses were modeled as 6 in, 12 in, and 12 in thick layers respectively (dimensions suggested by the SMO). The average strength and elastic properties obtained from the SMO (presented earlier) were used for the asphalt and base material. A PZ-27 wall section was chosen for the model based on the minimum section modulus criteria outlined in Table 3.7. Once the geometry was created and properties assigned to the materials, the model was brought to equilibrium. A lane load of 64 psf was applied to the roadway and three successive excavations of the sloped embankment were performed on the passive side of the wall to a final depth of 7.5 ft (model geometry did not allow for a full 8 ft excavation) (Figure 3.15). Negligible horizontal wall displacements and vertical roadway displacements were computed. The model produced less horizontal wall displacement than the survey indicated, and though the modeled results appeared to suggest a stiffer system than what was measured, it was difficult to conclude from this particular case study whether the model was reasonably sufficient. Had more substantial effects been noted after excavation (due to either a smaller wall section or deeper excavation), this particular case study would have proven more useful for model calibration. Despite the inability of the chosen case study to provide useful information with which to calibrate the model, numerical modeling progressed in accordance with the testing matrix until a sufficient calibration site could be identified. Chapter 4 presents the results of the modeling.
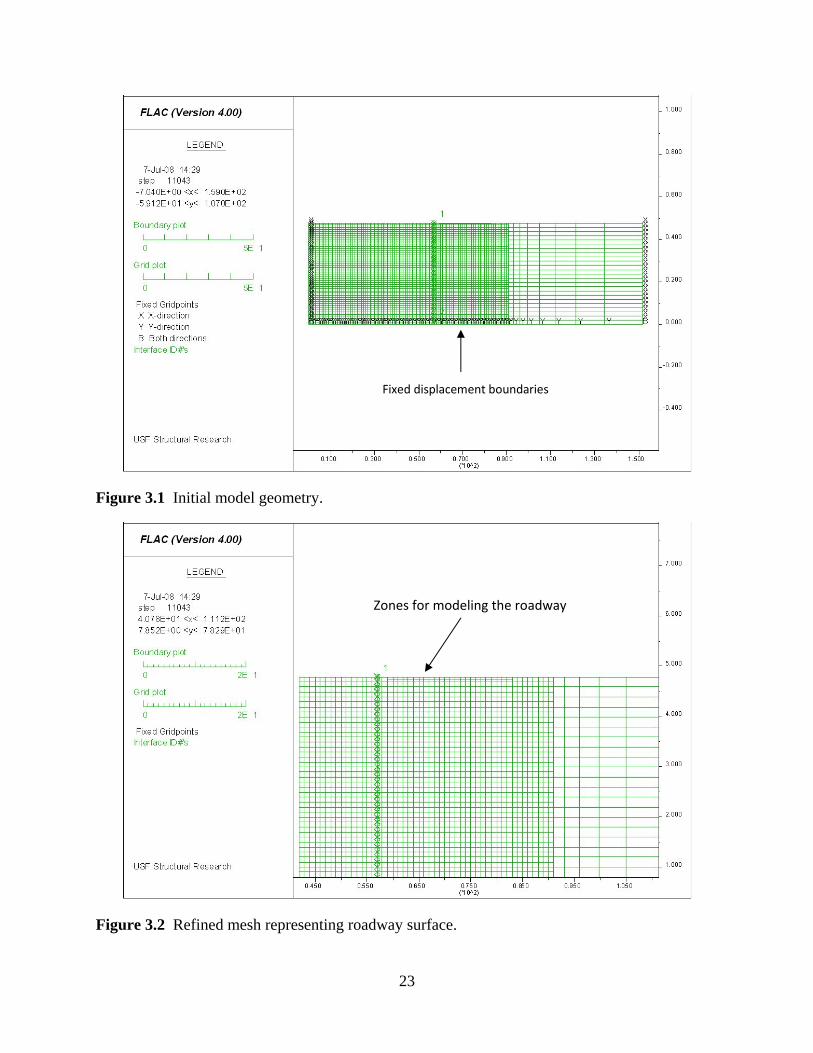
23
Figure 3.1 Initial model geometry.
Figure 3.2 Refined mesh representing roadway surface.
Fixed displacement boundaries
Zones for modeling the roadway

24
6" limerock base
variablewall
distance12" compacted insitu sub-base6" roadway
5' zone of denserinsitu soil
insitu soil
Figure 3.3 Cross-section of roadway showing the layering of zones.
10 ft
Infinite
Figure 3.4 Lane load applied over two infinite 10 ft wide strips.

25
wall
10 ft 2 ft
Figure 3.5 Cross-section showing details of lane loading.
2 ft
wall
6 ft 4 ft 2 ft
Figure 3.6 Cross-section showing details of truck loading.

26
2 ft
Infinite
Figure 3.7 Truck loading applied over four infinite 2 ft wide strips.

27
Figure 3.8 Cone penetration test sounding received from Commercial Blvd. construction site.

28
Figure 3.9 Simplification of soil properties as calculated from soundings.
Figure 3.10 CPT correlations for relative density (left) and friction angle (right).

29
Figure 3.11 CPT correlations for tangent constrained modulus.
Figure 3.12 Commercial Blvd. pre-excavation survey.

30
Figure 3.13 Commercial Blvd. post-excavation survey.
Figure 3.14 Pre-excavation model of Commercial Blvd. construction site.

31
Figure 3.15 Post-excavation model of Commercial Blvd. construction site.

32
4. MODEL RESULTS
Regions of interest within the model that were identified prior to the simulated sequential excavation were tagged for the recording of stresses and displacements. This information was written in a running log for later regression.
4.1 Data Regression Workbook
In order to regress the data recorded in the log for each excavation series, it was necessary to develop a Visual Basic workbook which imports and rearranges the data in a more useable format. The workbook was designed to automate the process of importing data, performing calculations, and plotting results. From this workbook, individual files were created for each excavation series. Results presented in the first sections of this chapter are from a few select excavations out of the 48 total possible excavation scenarios. Once each excavation series was analyzed, a master workbook was developed which extracted information of interest from each scenario for comparison.
4.2 Model Confirmation
Prior to initiation of the testing matrix, a basic model was developed which did not contain a roadway (Figure 4.1). This was performed so that a basic understanding of the systems behavior could be grasped prior to the addition of complexity. The results of model run indicated that the system was behaving as anticipated, thereby confirming the validity of the model input parameters. Shortly into excavation, an active soil wedge began to develop along a shear plane which extended from the bottom of the excavation upwards to the ground surface on the active side of the wall. This active wedge can be seen clearly in the horizontal displacement contours in Figure 4.2. At an excavation depth of 20 ft, the maximum horizontal wall displacement is 8.5 in with a PZ-27 wall section embedded in a stronger soil. The maximum moment developed in the wall section was 71 kip-ft/ft (Figure 4.3).
4.3 Individual Excavation Results
Once confidence was obtained in the model results which did not include a roadway, execution of the testing matrix began. Data recorded to and retrieved from each excavation series included: horizontal displacements of wall nodes; vertical displacements of the roadway; the lateral stresses in the region below the asphalt; and the maximum (tension) principal stresses and strains of roadway surface elements.
Horizontal Wall Displacement. The horizontal displacement of the wall was monitored since it is the most easily measurable indicator of roadway distress in the field. As in the model calibration efforts mentioned in the previous chapter, it is not too difficult to measure the top-of-wall horizontal displacement using standard surveying equipment.

33
Since this is an easily measurable quantity, the relationship between the top-of-wall displacement and the state of distress in the roadway was examined. Figure 4.4 shows a typical plot of the horizontal wall displacement as a function of wall depth and excavation depth. The individual lines in the plot represent the actual shape of the wall section at various levels of excavation up to 16 ft deep. The excavation increment between each line is 2 ft. Though the entire shape is captured, only the uppermost node (the top of the wall) is used in the determination of future relationships, since the top-of-wall experiences the greatest movement and is thereby the most ideal location for field monitoring.
Vertical Displacement. The vertical displacement of the roadway that was caused by the loss of confinement underneath the roadway was monitored. A typical plot of the roadway profile can be seen in Figure 4.5. This figure indicates that the closest 12 ft lane of the roadway experiences a more significant amount of vertical displacement than the farthest lane. Upon closer examination of a particular profile (Figure 4.6), it can be seen that the roadway is experiencing the combined effects of a global failure (drastic downward displacement as a result of an actively failing soil wedge), as well as a localized distress failure in the region of the truck wheel paths. The dashed line in the plot represents the profile of the roadway under the global failure of the active soil wedge. The solid line represents the roadway profile under the combined global and local effects. In order to isolate and determine the local effects, the difference between these two lines was computed and plotted in Figure 4.7. This plot shows a region of deeper vertical displacements close to the wall that corresponds to the wheel paths in the closest lane.
Loss of Confinement. The lateral stress distribution underneath the roadway was recorded during excavation and plotted in 1 psi increments in Figure 4.8. The disruption of confinement underneath the roadway is of particular concern, for a loss of confinement results in vertical displacement and cracking of the asphalt. Moving from left to right, then top to bottom throughout the figure, it can be seen how the confinement is initially uniform underneath the roadway (except for directly under the wheel locations). As excavation proceeds, the state of confinement is severely disturbed near the wall. The confinement appears to reach a maximum disruption at the 12 ft excavation depth.
Cracking. The minor principle stresses within the asphalt were recorded in order to determine whether it underwent tension during the excavation. The location of the maximum tensile stresses within the asphalt serves as a good indicator of the potential crack locations. Figure 4.9 is a typical plot of the tension developed in the asphalt as a function of location and excavation depth (truck loading). As the excavation progresses, the areas of maximum tension migrate from the edges of the wheel paths to the center of the roadway. The shift is most predominant between an excavation of 10 ft and 12 ft.

34
4.4 Combined Results
Upon completion of each excavation series, a master workbook was developed to import the results of each series for comparison. Since the top-of-wall displacement is the most practical indicator of confinement loss and resulting roadway distress, it was used as the independent variable in the comparison. Since the FDOT deemed cracking a higher concern than deformation, the maximum tension present in the roadway at a specified excavation depth was plotted as a function of its corresponding top-of-wall displacement (Figure 4.10). The maximum tension within the roadway rapidly increases up to an excavation depth of 12 ft, after which it significantly decreases. If the results from all wall locations are plotted simultaneously (Figure 4.11), it can be seen that a roadway develops less tension for a given horizontal displacement when the wall is located farther away. Superimposing all load scenarios indicates that the degree of loading is a more significant factor than wall location in stronger soils, regardless of the wall section (Figures 4.12 and 4.13). Figures 4.14 and 4.15 show that wall location is a more significant factor than the degree of loading early in the excavation process of weaker soils.
The results from Figure 4.11 (PZ-27 in stronger soil with truck loading) are re-plotted in terms of strain for the four roadway offsets in Figure 4.16. This shows the maximum (tension) principal strain within the asphalt surface as a function of position and excavation depth. For cases limited to 12 ft excavations, strains never exceed 0.01 (10,000 microstrain).

35
Figure 4.1 Model excavation prior to the addition of a roadway (PZ-27 in stronger soil).
Figure 4.2 Horizontal displacement contours after a 20 ft excavation with no roadway (PZ-27 in stronger soil).

36
Figure 4.3 Moment distribution in the wall after a 20 ft excavation (PZ-27 in stronger soil).

37
0
5
10
15
20
25
30
35
40
45
50
-7 -6 -5 -4 -3 -2 -1 0 1Horizontal Wall Disp. (in)
Wal
l Dep
th (f
t)
18 ft excavation(in 2 ft incerments)
Figure 4.4 Horizontal wall movement throughout excavation (PZ-27 in stronger soil with lane load).
-7
-6
-5
-4
-3
-2
-1
00 5 10 15 20 25 30
Distance along Roadway (ft)
Dis
p. (i
n)
18 ft excavation(in 2 ft incerments)
Figure 4.5 Vertical roadway displacement during excavation (PZ-27 in stronger soil with lane load).

38
Figure 4.6 Roadway profile showing a global and local failure after a 10 ft excavation using a PZ-27 located 2 ft from the edge of the roadway in weaker soil.
Figure 4.7 Localized roadway rutting in the lane nearest the wall after a 10 ft excavation using a PZ-27 located 2 ft from the edge of the roadway in weaker soil.

39
Figure 4.8 Lateral stress during excavation (1 psi increments) PZ-27 in stronger soil.
2 ft
6 ft 4 ft
8 ft 10 ft
12 ft 14 ft
1 psi increments (increasing from top to bottom)

40
Figure 4.9 Tension in the asphalt throughout excavation (PZ-27 located at 2 ft in stronger soil).
Figure 4.10 Maximum tension developed in the roadway subjected to truck loading for a PZ-27 located 2 ft from the edge of the roadway.

41
Figure 4.11 Maximum tension developed in the roadway subjected to truck loading for a PZ-27 at all locations.
Figure 4.12 Maximum tension in the roadway for all loadings and locations (PZ-27 and stronger soil).

42
Figure 4.13 Maximum tension in the roadway for all loadings and locations (PZ-40 and stronger soil).
Figure 4.14 Maximum tension in the roadway for all loadings and locations (PZ-27 and weaker soil).

43
Figure 4.15 Maximum tension in the roadway for all loadings and locations (PZ-40 and weaker soil).

44
Figure 4.16 Asphalt strain distribution as a function of position and excavation depth (PZ-27, stronger soil).

45
5. SUMMARY AND CONCLUSIONS
Design of cantilevered sheet pile wall systems must address both strength and service limit states. Strength considerations apply to both the bending and shear capacity of the wall elements as well as the soil behind and in front of the wall. When using adjacent displacement-sensitive structures service limits often control the design. As a result, larger/stronger structural elements are required to minimize lateral movement. At present, FDOT guidelines require these sheet pile systems to withstand the lateral forces while limiting the maximum permissible displacement to one inch at the top of cantilever sheet pile walls if the roadway is not planned for subsequent repair or resurfacing. Larger displacements are permitted when the existing roadway is planned for resurfacing after the temporary wall is removed. The focus of this study was to ascertain whether or not these displacement limits are reasonable; and if not, what value, range of values, and/or conditions control the selection of an appropriate service limit.
Numerical modeling using finite difference solutions was used to analyze a range of excavation depths and soil types in lieu of empirical field measurements. Although this is a practical approach to the problem which allows many conditions to be addressed, the results of the modeling should be verified with field measurements. Using the model results, the following sections discuss recommendations and limitations.
5.1 Distress Criteria / Limiting Tension
Though the results of the modeling suggest a relationship between the top-of-wall displacement and the maximum tension in the asphalt can be established, it is necessary to determine the maximum acceptable tension that can be present in the asphalt without causing detrimental effects. This limiting tension value may be determined using the strength parameters of the asphalt and a simple Mohr-Coulomb analysis, but the strength of asphalt is highly susceptible to temperature. Figure 5.1 shows the effect of temperature on indirect tension (IDT) test modulus provided by FHWA. However, most tensile strength is determined at lower temperatures (25C or less). Figure 5.2 shows the stress-strain response from IDT tests conducted at 25C (FHWA) and 10C (SMO). Tests from lower temperature are difficult to perform but the modulus (Figure 5.1) is attainable. Estimated values from SMO engineers are presented for strength as a function of temperature in Figure 5.3. These values are in keeping with FHWA and SMO test results (Figure 5.2).
Asphalt temperatures in Florida are known to vary greatly making a single asphalt tensile strength impractical. Further, the average 7 day high temperature for Florida pavement at 64C makes the limiting tensile strength at the surface extremely low. With this decrease

46
in strength, however, comes increased compliance but not for all depths. Even at elevated temperatures consistent with late summer, the asphalt temperature varies with depth as much as 50 degrees F.
Newly paved asphalt monitored during this study reached temperatures as high as 136oF while the air temperature near the asphalt surface did not exceed 98oF. Figure 5.4 shows the temperature variation for a thin asphalt layer as a function of depth. At the peak daily temperature, a temperature gradient is apparent showing lower temperatures with depth. At the minimum daily temperature, the gradient reverses. In the absence of data from more common roadway asphalt thicknesses, these measurements were used to model a thicker asphalt layer using the upper asphalt temperature as the upper boundary condition. The model results corresponding to September 13, 2008 at noon (Figure 5.4) are shown in Figure 5.5. This shows a relatively high variation in asphalt temperature (95 to 140F) but all are above cited strength testing temperatures. This makes the resultant tensile strength of summer roadway asphalt near zero when extrapolated from Figure 5.3. For cooler winter months, the asphalt temperature may not exceed the graph limit (≈90F) providing for some capacity.
More practically, the observed creep in temperature lab specimens due to self-weight bending suggests that there may be no reasonable tension capacity available. Furthermore, asphalt is highly strain rate dependent adding additional complication to a strength assignment. As a result, some degree of asphalt distress may be necessarily tolerated during construction using temporary sheet piling.
5.2 Minimizing the Effects of Stress Induced Asphalt Distress
Given that it is difficult to assign an acceptable wall movement to prevent roadway damage, there may be limits that can be set to minimize the effects given: (1) various temperatures (times of the year), (2) wall position relative to the roadway, and (3) magnitude of loading. The asphalt strength defined in Figure 5.3 provides a temperature-dependent strength that can be superimposed over Figures 5.6 – 5.8 based on the three parameters above.
The location of peak asphalt stress is directly related to the depth of excavation and is dependent on the active failure wedge that forms behind the wall. The magnitude of this stress is also related to the weight of the wedge with the respective failure surface terminating at that position on the roadway. This is analogous to an “anchored” system, but in this case the wall is not attached to the anchor but rather only the soil beneath the pavement is “anchored.” To this end, some strategic measures can be taken to minimize asphalt stress cracking if traffic restrictions can be implemented. Figures 5.6 and 5.7 show the magnitude of tensile stresses in the pavement with respect to position across the

47
pavement and depth of excavation for self-weight and truck loading, respectively. Figure 5.8 provides the wall movement associated with the peak stress obtained from Figures 5.6 and 5.7. Note the distance of the wall from the edge of roadway is 2 ft which was deemed the worst case. Also of interest, stress in the pavement is only slightly affected by the soil strength and wall section. Rather, the loss of confinement associated with movement is the most important parameter leading to asphalt stress.
To link the information from Figures 5.6 and 5.7 to Figure 5.8 it must be understood that the peak stress for a given excavation (from Figures 5.6 and 5.7) is plotted in Figure 5.8 relative to the top-of-wall displacement regardless of where the peak stress occurs. Therefore, the asphalt stress of 10 psi occurring at approximately 2” in Figure 5.8 (self weight case) corresponds to the peak stress (in Figure 5.6) 9ft from the wall when the excavation depth is about 10ft.
Taking this one step farther, assume that the asphalt strength is 15 psi from Figure 5.3 (cooler weather), Figure 5.6 shows that this stress would not be exceeded if self-weight only were applied (no traffic flow). In that case, only 12 psi would develop in the asphalt if the cut depth in front of the wall was 12 ft. The location of peak stress would occur between 11 and 13 ft away from the wall. However, Figure 5.8 shows that if wall movements were restricted to 2 inches, that level of stress would not be developed (only 8 psi).
Using the same approach for fully loaded conditions (truck loads), Figure 5.7 shows that a 12 ft excavation would exceed the 15 psi limit (but a 10ft excavation would not). At a location 11 ft from the wall, the asphalt stress reaches almost 20 psi. This corresponds to a wall movement of approximately 1 ¼”. If wall movement could be restricted to ½” the 15 psi limit would not be exceeded.
5.3 Conclusions
This project investigated conditions that cause a roadway to experience displacement-induced distress using the results of numerical models. It should be emphasized that the results are not calibrated against field measurements and many factors affect the performance of the wall / soil / pavement system. Further, modeling used average asphalt modulus values from triaxial compression tests conducted at nominal laboratory temperatures. This value has been shown to be highly variable. However, global stability of the wall soil system is insensitive to this value and would be representative for all asphalt temperature conditions. As a result, distress in the pavement may be difficult to assess, but wall movement and base material confinement can be assumed to be reasonably simulated. Further, the age of asphalt and the associated change in properties has not been address by this study.

48
Based on the examples discussed above (for walls limited to 12ft) it is reasonable to assume that only modest distress will be incurred in asphalt roadways adjacent cantilevered sheet pile walls if top-of-wall displacements are restricted using the present guidelines regardless of soil type and wall section selected. It is unlikely that the no-load (self weight) scenario will ever be a reasonable unless only briefly implemented. As a result it be assumed that asphalt adjacent these walls will require some repair especially if for prolonged periods.
Finally, the selection of the appropriate sheet pile sections is still important to restrict wall movement. It is recommended that a finite difference algorithms like the SPW2006 discussed in Chapter 2 (or similar) be used. Classical methods that assume full passive or active pressure diagrams tend to over-predict wall movements especially at deeper embedment depths.

49
0
200
400
600
800
1000
1200
1400
1600
1800
40 50 60 70 80 90 100 110Asphalt Temp (F)
IDT
Mod
ulus
(ksi
)4 9 14 19 24 29 34 39 44
Asphalt Temp (C)
Figure 5.1 Temperature effect on indirect tension test modulus (source FHWA).
0
100
200
300
400
500
600
0 1000 2000 3000 4000 5000 6000Tensile Microstrain
IDT
Tens
ile S
tress
(psi
)
SMO 0C (32F)SMO 10C (50F)SMO 10C (50F)SMO 20C (68F)FHWA 25C (77F)FHWA 25C (77F)FHWA 25C (77F)
Figure 5.2 Results of IDT tests from FHWA and SMO.

50
0
100
200
300
400
500
600
0 10 20 30 40 50 60
Asphalt Temp (C)
Asp
halt
Indi
rect
Ten
sile
Stre
ngth
(psi
)32 52 72 92 112 132
Asphalt Temp (F)
upper limit
lower limit
SMO IDT Data
FHWA IDT Data
Figure 5.3 Range of IDT strength at various temperatures (SMO).
60
70
80
90
100
110
120
130
140
150
9/12/0812:00 PM
9/13/0812:00 AM
9/13/0812:00 PM
9/14/0812:00 AM
9/14/0812:00 PM
9/15/0812:00 AM
9/15/0812:00 PM
9/16/0812:00 AM
Time
Tem
pera
ture
(F)
Air TempTop0.5"1.25"
Figure 5.4 Air and asphalt temperatures (at increasing depths) measured on a typical summer day in Florida.
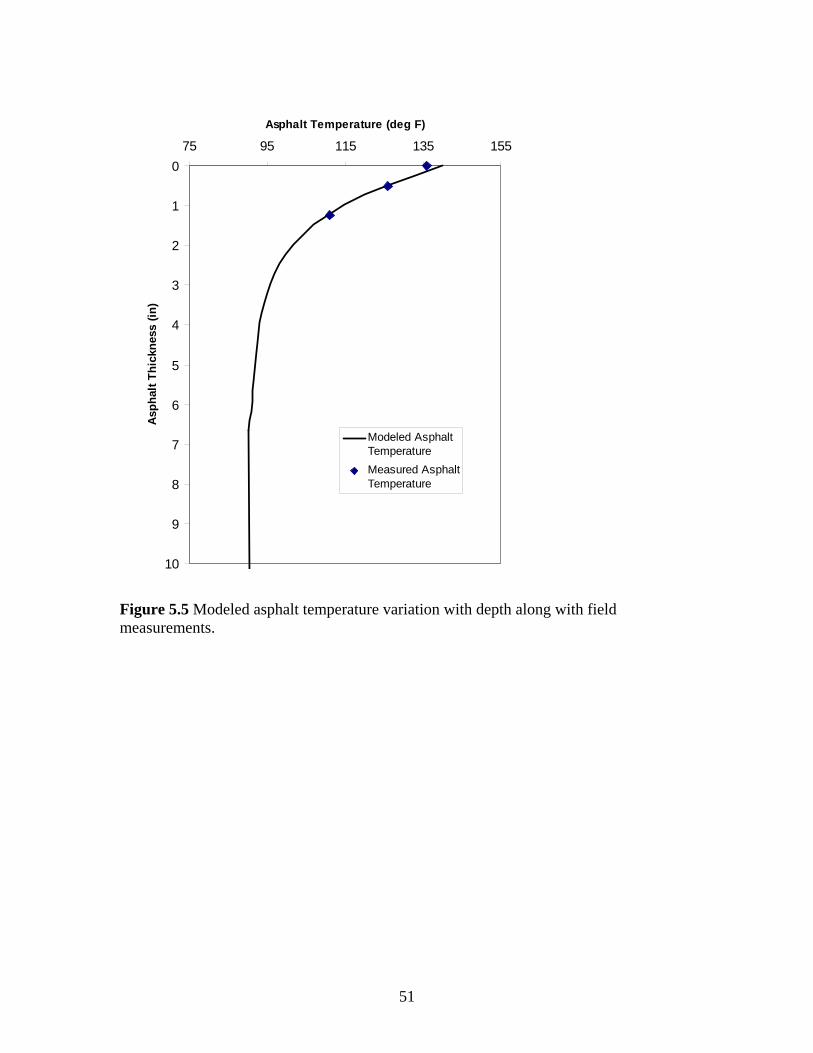
51
0
1
2
3
4
5
6
7
8
9
10
75 95 115 135 155
Asphalt Temperature (deg F)
Asph
alt T
hick
ness
(in)
Modeled AsphaltTemperatureMeasured AsphaltTemperature
Figure 5.5 Modeled asphalt temperature variation with depth along with field measurements.

52
-5
0
5
10
15
20
25
0 5 10 15 20 25Distance along Roadway (ft)
Tens
ion
(psi
) .
12 ft excavation depth(2 ft increments)
Edge of Pavement 2ft from wall
(PZ-27 stronger soil)
Figure 5.6 Location of peak stress in asphalt due to self weight of soil / wall system.
-5
0
5
10
15
20
25
0 5 10 15 20 25Distance along Roadway (ft)
Tens
ion
(psi
) .
12 ft excavation depth(2 ft increment)
Edge of Pavement 2ft from wall
(PZ-27 stronger soil)
Figure 5.7 Location of peak stress in asphalt due to self weight and truck loading.

53
0
5
10
15
20
25
30
35
0 1 2 3 4 5 6Wall Movement (in)
Pea
k A
spha
lt S
tress
(psi
)
PZ-27 N=35 (truck)
PZ-40 N=35 (truck)
PZ-27 N=15 (truck)
PZ-40 N=15 (truck)
PZ-27 N=35 (self)
PZ-40 N=35 (self)
PZ-27 N=15 (self)
PZ-40 N=15 (self)
Figure 5.8 Summarized peak stresses for self weight and truck loaded systems (from Figures 4.12 - 4.15).

54
6. GENERAL REFERENCES
Army Corps of Engineers, (1994). DESIGN OF SHEET PILE WALLS, Engineer Manual 1110-2-2504, CECW-ED, U.S. Army Corps of Engineers, Washington, DC 20314-1000 Bowles, Joseph E., (1982). FOUNDATION Analysis and Design, 3rd edition, McGraw-Hill Book Company, New York, New York, ISBN 0-07-006770-8. Mair, R. J. and Wood, D. M., (1987). Pressuremeter Tesing: Methods and Interpretation CIRIA, Buttersworth, London. Verruijt, Arnold. (2008). SPW 2006 Analysis of a sheet pile wall in a layered soil, http://geo.verruijt.net/, Delft University of Technology, Delft, Holland. Whitlow, Roy, (1990). Basic Soil Mechanics, 2nd edition, John Wiley & Sons, Inc. New York, New York, ISBN 0-470-21682-4, ISBN 0-582-04564-9.

A-1
PZ-27 wall located 0ft from roadway with lane loading in weaker soil
0
5
10
15
20
25
30
35
40
45
50
-4 -3.5 -3 -2.5 -2 -1.5 -1 -0.5 0 0.5
Horizontal Wall Disp. (in)W
all L
engt
h (ft
)
0 ft
2 ft
4 ft
6 ft
8 ft
10 ft
12 ft
14 ft
16 ft
Figure A.1 Horizontal wall movement throughout excavation (PZ-27 wall in weaker soil with lane load) 0 ft from wall.
PZ-27 wall located 2ft from roadway with lane loading in weaker soil
0
5
10
15
20
25
30
35
40
45
50
-4 -3.5 -3 -2.5 -2 -1.5 -1 -0.5 0 0.5
Horizontal Wall Disp. (in)
Wal
l Len
gth
(ft)
0 ft
2 ft
4 ft
6 ft
8 ft
10 ft
12 ft
14 ft
16 ft
Figure A.2 Horizontal wall movement throughout excavation (PZ-27 wall in weaker soil with lane load) 2 ft from wall.

A-2
PZ-27 wall located 5ft from roadway with lane loading in weaker soil
0
5
10
15
20
25
30
35
40
45
50
-4 -3.5 -3 -2.5 -2 -1.5 -1 -0.5 0 0.5
Horizontal Wall Disp. (in)W
all L
engt
h (ft
)
0 ft
2 ft
4 ft
6 ft
8 ft
10 ft
12 ft
14 ft
16 ft
Figure A.3 Horizontal wall movement throughout excavation (PZ-27 wall in weaker soil with lane load) 5 ft from wall.
PZ-27 wall located 10ft from roadway with lane loading in weaker soil
0
5
10
15
20
25
30
35
40
45
50
-4 -3.5 -3 -2.5 -2 -1.5 -1 -0.5 0 0.5
Horizontal Wall Disp. (in)
Wal
l Len
gth
(ft)
0 ft
2 ft
4 ft
6 ft
8 ft
10 ft
12 ft
14 ft
16 ft
Figure A.4 Horizontal wall movement throughout excavation (PZ-27 wall in weaker soil with lane load) 10 ft from wall.

A-3
PZ-27 wall located 0ft from roadway with no loading in weaker soil
0
5
10
15
20
25
30
35
40
45
50
-4 -3.5 -3 -2.5 -2 -1.5 -1 -0.5 0 0.5
Horizontal Wall Disp. (in)W
all L
engt
h (ft
)
0 ft
2 ft
4 ft
6 ft
8 ft
10 ft
12 ft
14 ft
16 ft
Figure A.5 Horizontal wall movement throughout excavation (PZ-27 wall in weaker soil with no load) 0 ft from wall.
PZ-27 wall located 2ft from roadway with no loading in weaker soil
0
5
10
15
20
25
30
35
40
45
50
-4 -3.5 -3 -2.5 -2 -1.5 -1 -0.5 0 0.5
Horizontal Wall Disp. (in)
Wal
l Len
gth
(ft)
0 ft
2 ft
4 ft
6 ft
8 ft
10 ft
12 ft
14 ft
16 ft
Figure A.6 Horizontal wall movement throughout excavation (PZ-27 wall in weaker soil with no load) 2 ft from wall.

A-4
PZ-27 wall located 5ft from roadway with no loading in weaker soil
0
5
10
15
20
25
30
35
40
45
50
-4 -3.5 -3 -2.5 -2 -1.5 -1 -0.5 0 0.5
Horizontal Wall Disp. (in)W
all L
engt
h (ft
)
0 ft
2 ft
4 ft
6 ft
8 ft
10 ft
12 ft
14 ft
16 ft
Figure A.7 Horizontal wall movement throughout excavation (PZ-27 wall in weaker soil with no load) 5 ft from wall.
PZ-27 wall located 10ft from roadway with no loading in weaker soil
0
5
10
15
20
25
30
35
40
45
50
-4 -3.5 -3 -2.5 -2 -1.5 -1 -0.5 0 0.5
Horizontal Wall Disp. (in)
Wal
l Len
gth
(ft)
0 ft
2 ft
4 ft
6 ft
8 ft
10 ft
12 ft
14 ft
16 ft
Figure A.8 Horizontal wall movement throughout excavation (PZ-27 wall in weaker soil with no load) 10 ft from wall.
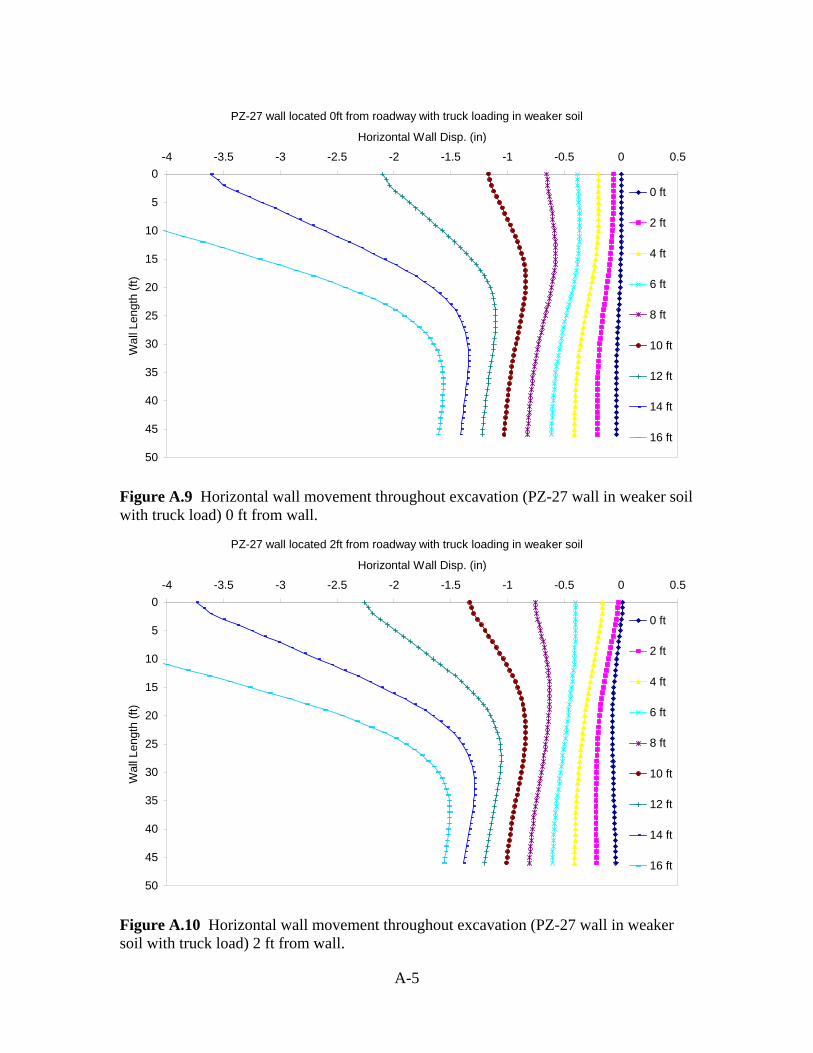
A-5
PZ-27 wall located 0ft from roadway with truck loading in weaker soil
0
5
10
15
20
25
30
35
40
45
50
-4 -3.5 -3 -2.5 -2 -1.5 -1 -0.5 0 0.5
Horizontal Wall Disp. (in)W
all L
engt
h (ft
)
0 ft
2 ft
4 ft
6 ft
8 ft
10 ft
12 ft
14 ft
16 ft
Figure A.9 Horizontal wall movement throughout excavation (PZ-27 wall in weaker soil with truck load) 0 ft from wall.
PZ-27 wall located 2ft from roadway with truck loading in weaker soil
0
5
10
15
20
25
30
35
40
45
50
-4 -3.5 -3 -2.5 -2 -1.5 -1 -0.5 0 0.5
Horizontal Wall Disp. (in)
Wal
l Len
gth
(ft)
0 ft
2 ft
4 ft
6 ft
8 ft
10 ft
12 ft
14 ft
16 ft
Figure A.10 Horizontal wall movement throughout excavation (PZ-27 wall in weaker soil with truck load) 2 ft from wall.

A-6
PZ-27 wall located 5ft from roadway with truck loading in weaker soil
0
5
10
15
20
25
30
35
40
45
50
-4 -3.5 -3 -2.5 -2 -1.5 -1 -0.5 0 0.5
Horizontal Wall Disp. (in)W
all L
engt
h (ft
)
0 ft
2 ft
4 ft
6 ft
8 ft
10 ft
12 ft
14 ft
16 ft
Figure A.11 Horizontal wall movement throughout excavation (PZ-27 wall in weaker soil with truck load) 5 ft from wall.
PZ-27 wall located 10ft from roadway with truck loading in weaker soil
0
5
10
15
20
25
30
35
40
45
50
-4 -3.5 -3 -2.5 -2 -1.5 -1 -0.5 0 0.5
Horizontal Wall Disp. (in)
Wal
l Len
gth
(ft)
0 ft
2 ft
4 ft
6 ft
8 ft
10 ft
12 ft
14 ft
16 ft
Figure A.12 Horizontal wall movement throughout excavation (PZ-27 wall in weaker soil with truck load) 10 ft from wall.

A-7
PZ-40 wall located 0ft from roadway with lane loading in weaker soil
0
5
10
15
20
25
30
35
40
45
50
-4 -3.5 -3 -2.5 -2 -1.5 -1 -0.5 0 0.5
Horizontal Wall Disp. (in)W
all L
engt
h (ft
)
0 ft
2 ft
4 ft
6 ft
8 ft
10 ft
12 ft
14 ft
16 ft
Figure A.13 Horizontal wall movement throughout excavation (PZ-40 wall in weaker soil with lane load) 0 ft from wall.
PZ-40 wall located 2ft from roadway with lane loading in weaker soil
0
5
10
15
20
25
30
35
40
45
50
-4 -3.5 -3 -2.5 -2 -1.5 -1 -0.5 0 0.5
Horizontal Wall Disp. (in)
Wal
l Len
gth
(ft)
0 ft
2 ft
4 ft
6 ft
8 ft
10 ft
12 ft
14 ft
16 ft
Figure A.14 Horizontal wall movement throughout excavation (PZ-40 wall in weaker soil with lane load) 2 ft from wall.

A-8
PZ-40 wall located 5ft from roadway with lane loading in weaker soil
0
5
10
15
20
25
30
35
40
45
50
-4 -3.5 -3 -2.5 -2 -1.5 -1 -0.5 0 0.5
Horizontal Wall Disp. (in)W
all L
engt
h (ft
)
0 ft
2 ft
4 ft
6 ft
8 ft
10 ft
12 ft
14 ft
16 ft
Figure A.15 Horizontal wall movement throughout excavation (PZ-40 wall in weaker soil with lane load) 5 ft from wall.
PZ-40 wall located 10ft from roadway with lane loading in weaker soil
0
5
10
15
20
25
30
35
40
45
50
-4 -3.5 -3 -2.5 -2 -1.5 -1 -0.5 0 0.5
Horizontal Wall Disp. (in)
Wal
l Len
gth
(ft)
0 ft
2 ft
4 ft
6 ft
8 ft
10 ft
12 ft
14 ft
16 ft
Figure A.16 Horizontal wall movement throughout excavation (PZ-40 wall in weaker soil with lane load) 10 ft from wall.

A-9
PZ-40 wall located 0ft from roadway with no loading in weaker soil
0
5
10
15
20
25
30
35
40
45
50
-4 -3.5 -3 -2.5 -2 -1.5 -1 -0.5 0 0.5
Horizontal Wall Disp. (in)W
all L
engt
h (ft
)
0 ft
2 ft
4 ft
6 ft
8 ft
10 ft
12 ft
14 ft
16 ft
Figure A.17 Horizontal wall movement throughout excavation (PZ-40 wall in weaker soil with no load) 0 ft from wall.
PZ-40 wall located 2ft from roadway with no loading in weaker soil
0
5
10
15
20
25
30
35
40
45
50
-4 -3.5 -3 -2.5 -2 -1.5 -1 -0.5 0 0.5
Horizontal Wall Disp. (in)
Wal
l Len
gth
(ft)
0 ft
2 ft
4 ft
6 ft
8 ft
10 ft
12 ft
14 ft
16 ft
Figure A.18 Horizontal wall movement throughout excavation (PZ-40 wall in weaker soil with no load) 2 ft from wall.

A-10
PZ-40 wall located 5ft from roadway with no loading in weaker soil
0
5
10
15
20
25
30
35
40
45
50
-4 -3.5 -3 -2.5 -2 -1.5 -1 -0.5 0 0.5
Horizontal Wall Disp. (in)W
all L
engt
h (ft
)
0 ft
2 ft
4 ft
6 ft
8 ft
10 ft
12 ft
14 ft
16 ft
Figure A.19 Horizontal wall movement throughout excavation (PZ-40 wall in weaker soil with no load) 5 ft from wall.
PZ-40 wall located 10ft from roadway with no loading in weaker soil
0
5
10
15
20
25
30
35
40
45
50
-4 -3.5 -3 -2.5 -2 -1.5 -1 -0.5 0 0.5
Horizontal Wall Disp. (in)
Wal
l Len
gth
(ft)
0 ft
2 ft
4 ft
6 ft
8 ft
10 ft
12 ft
14 ft
16 ft
Figure A.20 Horizontal wall movement throughout excavation (PZ-40 wall in weaker soil with no load) 10 ft from wall.

A-11
PZ-40 wall located 0ft from roadway with truck loading in weaker soil
0
5
10
15
20
25
30
35
40
45
50
-4 -3.5 -3 -2.5 -2 -1.5 -1 -0.5 0 0.5
Horizontal Wall Disp. (in)W
all L
engt
h (ft
)
0 ft
2 ft
4 ft
6 ft
8 ft
10 ft
12 ft
14 ft
16 ft
Figure A.21 Horizontal wall movement throughout excavation (PZ-40 wall in weaker soil with truck load) 0 ft from wall.
PZ-40 wall located 2ft from roadway with truck loading in weaker soil
0
5
10
15
20
25
30
35
40
45
50
-4 -3.5 -3 -2.5 -2 -1.5 -1 -0.5 0 0.5
Horizontal Wall Disp. (in)
Wal
l Len
gth
(ft)
0 ft
2 ft
4 ft
6 ft
8 ft
10 ft
12 ft
14 ft
16 ft
Figure A.22 Horizontal wall movement throughout excavation (PZ-40 wall in weaker soil with truck load) 2 ft from wall.

A-12
PZ-40 wall located 5ft from roadway with truck loading in weaker soil
0
5
10
15
20
25
30
35
40
45
50
-4 -3.5 -3 -2.5 -2 -1.5 -1 -0.5 0 0.5
Horizontal Wall Disp. (in)W
all L
engt
h (ft
)
0 ft
2 ft
4 ft
6 ft
8 ft
10 ft
12 ft
14 ft
16 ft
Figure A.23 Horizontal wall movement throughout excavation (PZ-40 wall in weaker soil with truck load) 5 ft from wall.
PZ-40 wall located 10ft from roadway with truck loading in weaker soil
0
5
10
15
20
25
30
35
40
45
50
-4 -3.5 -3 -2.5 -2 -1.5 -1 -0.5 0 0.5
Horizontal Wall Disp. (in)
Wal
l Len
gth
(ft)
0 ft
2 ft
4 ft
6 ft
8 ft
10 ft
12 ft
14 ft
16 ft
Figure A.24 Horizontal wall movement throughout excavation (PZ-40 wall in weaker soil with truck load) 10 ft from wall.

A-13
PZ-27 wall located 0ft from roadway with lane loading in stronger soil
0
5
10
15
20
25
30
35
40
45
50
-4 -3.5 -3 -2.5 -2 -1.5 -1 -0.5 0 0.5
Horizontal Wall Disp. (in)W
all L
engt
h (ft
)
0 ft
2 ft
4 ft
6 ft
8 ft
10 ft
12 ft
14 ft
16 ft
Figure A.25 Horizontal wall movement throughout excavation (PZ-27 wall in stronger soil with lane load) 0 ft from wall.
PZ-27 wall located 2ft from roadway with lane loading in stronger soil
0
5
10
15
20
25
30
35
40
45
50
-4 -3.5 -3 -2.5 -2 -1.5 -1 -0.5 0 0.5
Horizontal Wall Disp. (in)
Wal
l Len
gth
(ft)
0 ft
2 ft
4 ft
6 ft
8 ft
10 ft
12 ft
14 ft
16 ft
Figure A.26 Horizontal wall movement throughout excavation (PZ-27 wall in stronger soil with lane load) 2 ft from wall.

A-14
PZ-27 wall located 5ft from roadway with lane loading in stronger soil
0
5
10
15
20
25
30
35
40
45
50
-4 -3.5 -3 -2.5 -2 -1.5 -1 -0.5 0 0.5
Horizontal Wall Disp. (in)W
all L
engt
h (ft
)
0 ft
2 ft
4 ft
6 ft
8 ft
10 ft
12 ft
14 ft
16 ft
Figure A.27 Horizontal wall movement throughout excavation (PZ-27 wall in stronger soil with lane load) 5 ft from wall.
PZ-27 wall located 10ft from roadway with lane loading in stronger soil
0
5
10
15
20
25
30
35
40
45
50
-4 -3.5 -3 -2.5 -2 -1.5 -1 -0.5 0 0.5
Horizontal Wall Disp. (in)
Wal
l Len
gth
(ft)
0 ft
2 ft
4 ft
6 ft
8 ft
10 ft
12 ft
14 ft
16 ft
Figure A.28 Horizontal wall movement throughout excavation (PZ-27 wall in stronger soil with lane load) 10 ft from wall.

A-15
PZ-27 wall located 0ft from roadway with no loading in stronger soil
0
5
10
15
20
25
30
35
40
45
50
-4 -3.5 -3 -2.5 -2 -1.5 -1 -0.5 0 0.5
Horizontal Wall Disp. (in)W
all L
engt
h (ft
)
0 ft
2 ft
4 ft
6 ft
8 ft
10 ft
12 ft
14 ft
16 ft
Figure A.29 Horizontal wall movement throughout excavation (PZ-27 wall in stronger soil with no load) 0 ft from wall.
PZ-27 wall located 2ft from roadway with no loading in stronger soil
0
5
10
15
20
25
30
35
40
45
50
-4 -3.5 -3 -2.5 -2 -1.5 -1 -0.5 0 0.5
Horizontal Wall Disp. (in)
Wal
l Len
gth
(ft)
0 ft
2 ft
4 ft
6 ft
8 ft
10 ft
12 ft
14 ft
16 ft
Figure A.30 Horizontal wall movement throughout excavation (PZ-27 wall in stronger soil with no load) 2 ft from wall.

A-16
PZ-27 wall located 5ft from roadway with no loading in stronger soil
0
5
10
15
20
25
30
35
40
45
50
-4 -3.5 -3 -2.5 -2 -1.5 -1 -0.5 0 0.5
Horizontal Wall Disp. (in)W
all L
engt
h (ft
)
0 ft
2 ft
4 ft
6 ft
8 ft
10 ft
12 ft
14 ft
16 ft
Figure A.31 Horizontal wall movement throughout excavation (PZ-27 wall in stronger soil with no load) 5 ft from wall.
PZ-27 wall located 10ft from roadway with no loading in stronger soil
0
5
10
15
20
25
30
35
40
45
50
-4 -3.5 -3 -2.5 -2 -1.5 -1 -0.5 0 0.5
Horizontal Wall Disp. (in)
Wal
l Len
gth
(ft)
0 ft
2 ft
4 ft
6 ft
8 ft
10 ft
12 ft
14 ft
16 ft
Figure A.32 Horizontal wall movement throughout excavation (PZ-27 wall in stronger soil with no load) 10 ft from wall.

A-17
PZ-27 wall located 0ft from roadway with truck loading in stronger soil
0
5
10
15
20
25
30
35
40
45
50
-4 -3.5 -3 -2.5 -2 -1.5 -1 -0.5 0 0.5
Horizontal Wall Disp. (in)W
all L
engt
h (ft
)
0 ft
2 ft
4 ft
6 ft
8 ft
10 ft
12 ft
14 ft
16 ft
Figure A.33 Horizontal wall movement throughout excavation (PZ-27 wall in stronger soil with truck load) 0 ft from wall.
PZ-27 wall located 2ft from roadway with truck loading in stronger soil
0
5
10
15
20
25
30
35
40
45
50
-4 -3.5 -3 -2.5 -2 -1.5 -1 -0.5 0 0.5
Horizontal Wall Disp. (in)
Wal
l Len
gth
(ft)
0 ft
2 ft
4 ft
6 ft
8 ft
10 ft
12 ft
14 ft
16 ft
Figure A.34 Horizontal wall movement throughout excavation (PZ-27 wall in stronger soil with truck load) 2 ft from wall.

A-18
PZ-27 wall located 5ft from roadway with truck loading in stronger soil
0
5
10
15
20
25
30
35
40
45
50
-4 -3.5 -3 -2.5 -2 -1.5 -1 -0.5 0 0.5
Horizontal Wall Disp. (in)W
all L
engt
h (ft
)
0 ft
2 ft
4 ft
6 ft
8 ft
10 ft
12 ft
14 ft
16 ft
Figure A.35 Horizontal wall movement throughout excavation (PZ-27 wall in stronger soil with truck load) 5 ft from wall.
PZ-27 wall located 10ft from roadway with truck loading in stronger soil
0
5
10
15
20
25
30
35
40
45
50
-4 -3.5 -3 -2.5 -2 -1.5 -1 -0.5 0 0.5
Horizontal Wall Disp. (in)
Wal
l Len
gth
(ft)
0 ft
2 ft
4 ft
6 ft
8 ft
10 ft
12 ft
14 ft
16 ft
Figure A.36 Horizontal wall movement throughout excavation (PZ-27 wall in stronger soil with truck load) 10 ft from wall.

A-19
PZ-40 wall located 0ft from roadway with lane loading in stronger soil
0
5
10
15
20
25
30
35
40
45
50
-4 -3.5 -3 -2.5 -2 -1.5 -1 -0.5 0 0.5
Horizontal Wall Disp. (in)W
all L
engt
h (ft
)
0 ft
2 ft
4 ft
6 ft
8 ft
10 ft
12 ft
14 ft
16 ft
Figure A.37 Horizontal wall movement throughout excavation (PZ-40 wall in stronger soil with lane load) 0 ft from wall.
PZ-40 wall located 2ft from roadway with lane loading in stronger soil
0
5
10
15
20
25
30
35
40
45
50
-4 -3.5 -3 -2.5 -2 -1.5 -1 -0.5 0 0.5
Horizontal Wall Disp. (in)
Wal
l Len
gth
(ft)
0 ft
2 ft
4 ft
6 ft
8 ft
10 ft
12 ft
14 ft
16 ft
Figure A.38 Horizontal wall movement throughout excavation (PZ-40 wall in stronger soil with lane load) 2 ft from wall.

A-20
PZ-40 wall located 5ft from roadway with lane loading in stronger soil
0
5
10
15
20
25
30
35
40
45
50
-4 -3.5 -3 -2.5 -2 -1.5 -1 -0.5 0 0.5
Horizontal Wall Disp. (in)W
all L
engt
h (ft
)
0 ft
2 ft
4 ft
6 ft
8 ft
10 ft
12 ft
14 ft
16 ft
Figure A.39 Horizontal wall movement throughout excavation (PZ-40 wall in stronger soil with lane load) 5 ft from wall.
PZ-40 wall located 10ft from roadway with lane loading in stronger soil
0
5
10
15
20
25
30
35
40
45
50
-4 -3.5 -3 -2.5 -2 -1.5 -1 -0.5 0 0.5
Horizontal Wall Disp. (in)
Wal
l Len
gth
(ft)
0 ft
2 ft
4 ft
6 ft
8 ft
10 ft
12 ft
14 ft
16 ft
Figure A.40 Horizontal wall movement throughout excavation (PZ-40 wall in stronger soil with lane load) 10 ft from wall.
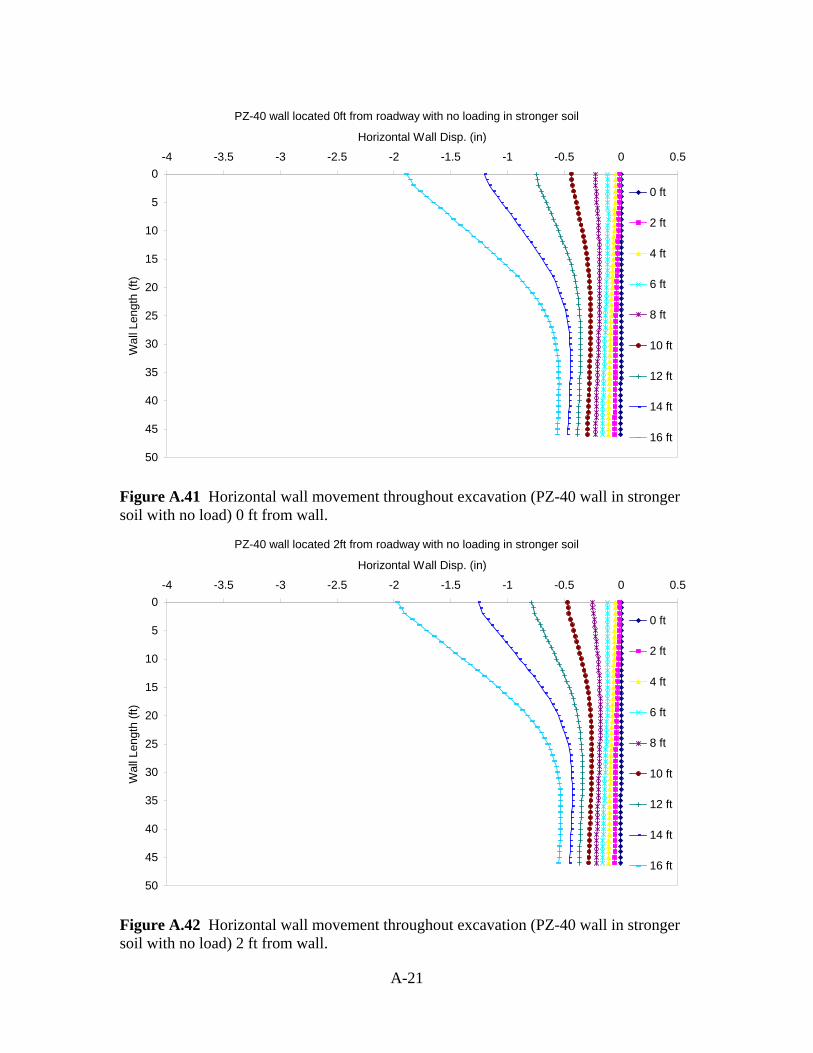
A-21
PZ-40 wall located 0ft from roadway with no loading in stronger soil
0
5
10
15
20
25
30
35
40
45
50
-4 -3.5 -3 -2.5 -2 -1.5 -1 -0.5 0 0.5
Horizontal Wall Disp. (in)W
all L
engt
h (ft
)
0 ft
2 ft
4 ft
6 ft
8 ft
10 ft
12 ft
14 ft
16 ft
Figure A.41 Horizontal wall movement throughout excavation (PZ-40 wall in stronger soil with no load) 0 ft from wall.
PZ-40 wall located 2ft from roadway with no loading in stronger soil
0
5
10
15
20
25
30
35
40
45
50
-4 -3.5 -3 -2.5 -2 -1.5 -1 -0.5 0 0.5
Horizontal Wall Disp. (in)
Wal
l Len
gth
(ft)
0 ft
2 ft
4 ft
6 ft
8 ft
10 ft
12 ft
14 ft
16 ft
Figure A.42 Horizontal wall movement throughout excavation (PZ-40 wall in stronger soil with no load) 2 ft from wall.

A-22
PZ-40 wall located 5ft from roadway with no loading in stronger soil
0
5
10
15
20
25
30
35
40
45
50
-4 -3.5 -3 -2.5 -2 -1.5 -1 -0.5 0 0.5
Horizontal Wall Disp. (in)W
all L
engt
h (ft
)
0 ft
2 ft
4 ft
6 ft
8 ft
10 ft
12 ft
14 ft
16 ft
Figure A.43 Horizontal wall movement throughout excavation (PZ-40 wall in stronger soil with no load) 5 ft from wall.
PZ-40 wall located 10ft from roadway with no loading in stronger soil
0
5
10
15
20
25
30
35
40
45
50
-4 -3.5 -3 -2.5 -2 -1.5 -1 -0.5 0 0.5
Horizontal Wall Disp. (in)
Wal
l Len
gth
(ft)
0 ft
2 ft
4 ft
6 ft
8 ft
10 ft
12 ft
14 ft
16 ft
Figure A.44 Horizontal wall movement throughout excavation (PZ-40 wall in stronger soil with no load) 10 ft from wall.

A-23
PZ-40 wall located 0ft from roadway with truck loading in stronger soil
0
5
10
15
20
25
30
35
40
45
50
-4 -3.5 -3 -2.5 -2 -1.5 -1 -0.5 0 0.5
Horizontal Wall Disp. (in)W
all L
engt
h (ft
)
0 ft
2 ft
4 ft
6 ft
8 ft
10 ft
12 ft
14 ft
16 ft
Figure A.45 Horizontal wall movement throughout excavation (PZ-40 wall in stronger soil with truck load) 0 ft from wall.
PZ-40 wall located 2ft from roadway with truck loading in stronger soil
0
5
10
15
20
25
30
35
40
45
50
-4 -3.5 -3 -2.5 -2 -1.5 -1 -0.5 0 0.5
Horizontal Wall Disp. (in)
Wal
l Len
gth
(ft)
0 ft
2 ft
4 ft
6 ft
8 ft
10 ft
12 ft
14 ft
16 ft
Figure A.46 Horizontal wall movement throughout excavation (PZ-40 wall in stronger soil with truck load) 2 ft from wall.

A-24
PZ-40 wall located 5ft from roadway with truck loading in stronger soil
0
5
10
15
20
25
30
35
40
45
50
-4 -3.5 -3 -2.5 -2 -1.5 -1 -0.5 0 0.5
Horizontal Wall Disp. (in)W
all L
engt
h (ft
)
0 ft
2 ft
4 ft
6 ft
8 ft
10 ft
12 ft
14 ft
16 ft
Figure A.47 Horizontal wall movement throughout excavation (PZ-40 wall in stronger soil with truck load) 5 ft from wall.
PZ-40 wall located 10ft from roadway with truck loading in stronger soil
0
5
10
15
20
25
30
35
40
45
50
-4 -3.5 -3 -2.5 -2 -1.5 -1 -0.5 0 0.5
Horizontal Wall Disp. (in)
Wal
l Len
gth
(ft)
0 ft
2 ft
4 ft
6 ft
8 ft
10 ft
12 ft
14 ft
16 ft
Figure A.48 Horizontal wall movement throughout excavation (PZ-40 wall in stronger soil with truck load) 10 ft from wall.

B-1
PZ-27 wall located 0ft from roadway with lane loading in weaker soil
-7
-6
-5
-4
-3
-2
-1
00 5 10 15 20 25 30
Distance along Roadway (ft)D
isp.
(in)
0 ft
2 ft
4 ft
6 ft
8 ft
10 ft
12 ft
14 ft
16 ft
Figure B.1 Vertical roadway displacement during excavation (PZ-27 wall in weaker soil with lane load) 0 ft from wall.
PZ-27 wall located 2ft from roadway with lane loading in weaker soil
-7
-6
-5
-4
-3
-2
-1
00 5 10 15 20 25 30
Distance along Roadway (ft)
Dis
p. (i
n)
0 ft
2 ft
4 ft
6 ft
8 ft
10 ft
12 ft
14 ft
16 ft
Figure B.2 Vertical roadway displacement during excavation (PZ-27 wall in weaker soil with lane load) 2 ft from wall.

B-2
PZ-27 wall located 5ft from roadway with lane loading in weaker soil
-6
-5
-4
-3
-2
-1
00 5 10 15 20 25 30
Distance along Roadway (ft)D
isp.
(in)
0 ft
2 ft
4 ft
6 ft
8 ft
10 ft
12 ft
14 ft
16 ft
Figure B.3 Vertical roadway displacement during excavation (PZ-27 wall in weaker soil with lane load) 5 ft from wall.
PZ-27 wall located 10ft from roadway with lane loading in weaker soil
-4
-3.5
-3
-2.5
-2
-1.5
-1
-0.5
00 5 10 15 20 25 30
Distance along Roadway (ft)
Dis
p. (i
n)
0 ft
2 ft
4 ft
6 ft
8 ft
10 ft
12 ft
14 ft
16 ft
Figure B.4 Vertical roadway displacement during excavation (PZ-27 wall in weaker soil with lane load) 10 ft from wall.
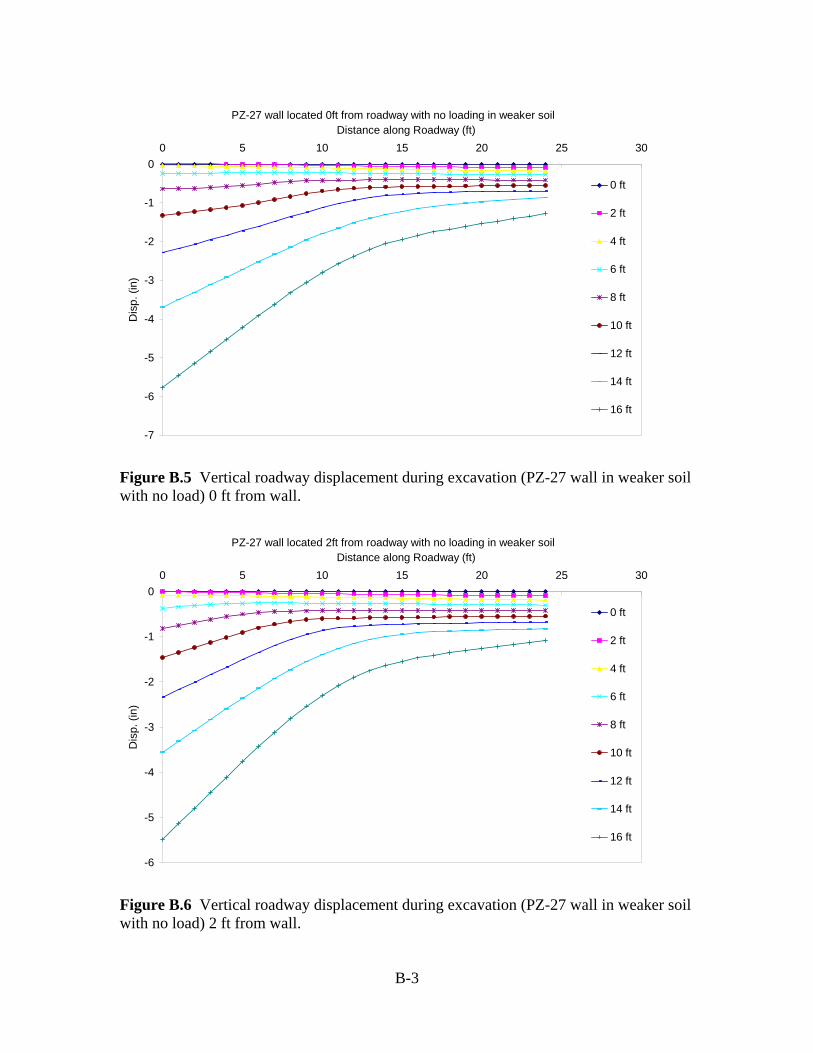
B-3
PZ-27 wall located 0ft from roadway with no loading in weaker soil
-7
-6
-5
-4
-3
-2
-1
00 5 10 15 20 25 30
Distance along Roadway (ft)D
isp.
(in)
0 ft
2 ft
4 ft
6 ft
8 ft
10 ft
12 ft
14 ft
16 ft
Figure B.5 Vertical roadway displacement during excavation (PZ-27 wall in weaker soil with no load) 0 ft from wall.
PZ-27 wall located 2ft from roadway with no loading in weaker soil
-6
-5
-4
-3
-2
-1
00 5 10 15 20 25 30
Distance along Roadway (ft)
Dis
p. (i
n)
0 ft
2 ft
4 ft
6 ft
8 ft
10 ft
12 ft
14 ft
16 ft
Figure B.6 Vertical roadway displacement during excavation (PZ-27 wall in weaker soil with no load) 2 ft from wall.

B-4
PZ-27 wall located 5ft from roadway with no loading in weaker soil
-5
-4.5
-4
-3.5
-3
-2.5
-2
-1.5
-1
-0.5
00 5 10 15 20 25 30
Distance along Roadway (ft)D
isp.
(in)
0 ft
2 ft
4 ft
6 ft
8 ft
10 ft
12 ft
14 ft
16 ft
Figure B.7 Vertical roadway displacement during excavation (PZ-27 wall in weaker soil with no load) 5 ft from wall.
PZ-27 wall located 10ft from roadway with no loading in weaker soil
-3.5
-3
-2.5
-2
-1.5
-1
-0.5
00 5 10 15 20 25 30
Distance along Roadway (ft)
Dis
p. (i
n)
0 ft
2 ft
4 ft
6 ft
8 ft
10 ft
12 ft
14 ft
16 ft
Figure B.8 Vertical roadway displacement during excavation (PZ-27 wall in weaker soil with no load) 10 ft from wall.

B-5
PZ-27 wall located 0ft from roadway with truck loading in weaker soil
-7
-6
-5
-4
-3
-2
-1
00 5 10 15 20 25 30
Distance along Roadway (ft)D
isp.
(in)
0 ft
2 ft
4 ft
6 ft
8 ft
10 ft
12 ft
14 ft
16 ft
Figure B.9 Vertical roadway displacement during excavation (PZ-27 wall in weaker soil with truck load) 0 ft from wall.
PZ-27 wall located 2ft from roadway with truck loading in weaker soil
-7
-6
-5
-4
-3
-2
-1
00 5 10 15 20 25 30
Distance along Roadway (ft)
Dis
p. (i
n)
0 ft
2 ft
4 ft
6 ft
8 ft
10 ft
12 ft
14 ft
16 ft
Figure B.10 Vertical roadway displacement during excavation (PZ-27 wall in weaker soil with truck load) 2 ft from wall.

B-6
PZ-27 wall located 5ft from roadway with truck loading in weaker soil
-6
-5
-4
-3
-2
-1
00 5 10 15 20 25 30
Distance along Roadway (ft)D
isp.
(in)
0 ft
2 ft
4 ft
6 ft
8 ft
10 ft
12 ft
14 ft
16 ft
Figure B.11 Vertical roadway displacement during excavation (PZ-27 wall in weaker soil with truck load) 5 ft from wall.
PZ-27 wall located 10ft from roadway with truck loading in weaker soil
-4
-3.5
-3
-2.5
-2
-1.5
-1
-0.5
00 5 10 15 20 25 30
Distance along Roadway (ft)
Dis
p. (i
n)
0 ft
2 ft
4 ft
6 ft
8 ft
10 ft
12 ft
14 ft
16 ft
Figure B.12 Vertical roadway displacement during excavation (PZ-27 wall in weaker soil with truck load) 10 ft from wall.

B-7
PZ-40 wall located 0ft from roadway with lane loading in weaker soil
-4.5
-4
-3.5
-3
-2.5
-2
-1.5
-1
-0.5
00 5 10 15 20 25 30
Distance along Roadway (ft)D
isp.
(in)
0 ft
2 ft
4 ft
6 ft
8 ft
10 ft
12 ft
14 ft
16 ft
Figure B.13 Vertical roadway displacement during excavation (PZ-40 wall in weaker soil with lane load) 0 ft from wall.
PZ-40 wall located 2ft from roadway with lane loading in weaker soil
-4.5
-4
-3.5
-3
-2.5
-2
-1.5
-1
-0.5
00 5 10 15 20 25 30
Distance along Roadway (ft)
Dis
p. (i
n)
0 ft
2 ft
4 ft
6 ft
8 ft
10 ft
12 ft
14 ft
16 ft
Figure B.14 Vertical roadway displacement during excavation (PZ-40 wall in weaker soil with lane load) 2 ft from wall.

B-8
PZ-40 wall located 5ft from roadway with lane loading in weaker soil
-3.5
-3
-2.5
-2
-1.5
-1
-0.5
00 5 10 15 20 25 30
Distance along Roadway (ft)D
isp.
(in)
0 ft
2 ft
4 ft
6 ft
8 ft
10 ft
12 ft
14 ft
16 ft
Figure B.15 Vertical roadway displacement during excavation (PZ-40 wall in weaker soil with lane load) 5 ft from wall.
PZ-40 wall located 10ft from roadway with lane loading in weaker soil
-3
-2.5
-2
-1.5
-1
-0.5
00 5 10 15 20 25 30
Distance along Roadway (ft)
Dis
p. (i
n)
0 ft
2 ft
4 ft
6 ft
8 ft
10 ft
12 ft
14 ft
16 ft
Figure B.16 Vertical roadway displacement during excavation (PZ-40 wall in weaker soil with lane load) 10 ft from wall.

B-9
PZ-40 wall located 0ft from roadway with no loading in weaker soil
-4
-3.5
-3
-2.5
-2
-1.5
-1
-0.5
00 5 10 15 20 25 30
Distance along Roadway (ft)D
isp.
(in)
0 ft
2 ft
4 ft
6 ft
8 ft
10 ft
12 ft
14 ft
16 ft
Figure B.17 Vertical roadway displacement during excavation (PZ-40 wall in weaker soil with no load) 0 ft from wall.
PZ-40 wall located 2ft from roadway with no loading in weaker soil
-4
-3.5
-3
-2.5
-2
-1.5
-1
-0.5
00 5 10 15 20 25 30
Distance along Roadway (ft)
Dis
p. (i
n)
0 ft
2 ft
4 ft
6 ft
8 ft
10 ft
12 ft
14 ft
16 ft
Figure B.18 Vertical roadway displacement during excavation (PZ-40 wall in weaker soil with no load) 2 ft from wall.

B-10
PZ-40 wall located 5ft from roadway with no loading in weaker soil
-3.5
-3
-2.5
-2
-1.5
-1
-0.5
00 5 10 15 20 25 30
Distance along Roadway (ft)D
isp.
(in)
0 ft
2 ft
4 ft
6 ft
8 ft
10 ft
12 ft
14 ft
16 ft
Figure B.19 Vertical roadway displacement during excavation (PZ-40 wall in weaker soil with no load) 5 ft from wall.
PZ-40 wall located 10ft from roadway with no loading in weaker soil
-2.5
-2
-1.5
-1
-0.5
00 5 10 15 20 25 30
Distance along Roadway (ft)
Dis
p. (i
n)
0 ft
2 ft
4 ft
6 ft
8 ft
10 ft
12 ft
14 ft
16 ft
Figure B.20 Vertical roadway displacement during excavation (PZ-40 wall in weaker soil with no load) 10 ft from wall.

B-11
PZ-40 wall located 0ft from roadway with truck loading in weaker soil
-5
-4.5
-4
-3.5
-3
-2.5
-2
-1.5
-1
-0.5
00 5 10 15 20 25 30
Distance along Roadway (ft)D
isp.
(in)
0 ft
2 ft
4 ft
6 ft
8 ft
10 ft
12 ft
14 ft
16 ft
Figure B.21 Vertical roadway displacement during excavation (PZ-40 wall in weaker soil with truck load) 0 ft from wall.
PZ-40 wall located 2ft from roadway with truck loading in weaker soil
-5
-4.5
-4
-3.5
-3
-2.5
-2
-1.5
-1
-0.5
00 5 10 15 20 25 30
Distance along Roadway (ft)
Dis
p. (i
n)
0 ft
2 ft
4 ft
6 ft
8 ft
10 ft
12 ft
14 ft
16 ft
Figure B.22 Vertical roadway displacement during excavation (PZ-40 wall in weaker soil with truck load) 2 ft from wall.

B-12
PZ-40 wall located 5ft from roadway with truck loading in weaker soil
-4
-3.5
-3
-2.5
-2
-1.5
-1
-0.5
00 5 10 15 20 25 30
Distance along Roadway (ft)D
isp.
(in)
0 ft
2 ft
4 ft
6 ft
8 ft
10 ft
12 ft
14 ft
16 ft
Figure B.23 Vertical roadway displacement during excavation (PZ-40 wall in weaker soil with truck load) 5 ft from wall.
PZ-40 wall located 10ft from roadway with truck loading in weaker soil
-2.5
-2
-1.5
-1
-0.5
00 5 10 15 20 25 30
Distance along Roadway (ft)
Dis
p. (i
n)
0 ft
2 ft
4 ft
6 ft
8 ft
10 ft
12 ft
14 ft
16 ft
Figure B.24 Vertical roadway displacement during excavation (PZ-40 wall in weaker soil with truck load) 10 ft from wall.

B-13
PZ-27 wall located 0ft from roadway with lane loading in stronger soil
-4
-3.5
-3
-2.5
-2
-1.5
-1
-0.5
00 5 10 15 20 25 30
Distance along Roadway (ft)D
isp.
(in)
0 ft
2 ft
4 ft
6 ft
8 ft
10 ft
12 ft
14 ft
16 ft
Figure B.25 Vertical roadway displacement during excavation (PZ-27 wall in stronger soil with lane load) 0 ft from wall.
PZ-27 wall located 2ft from roadway with lane loading in stronger soil
-4
-3.5
-3
-2.5
-2
-1.5
-1
-0.5
00 5 10 15 20 25 30
Distance along Roadway (ft)
Dis
p. (i
n)
0 ft
2 ft
4 ft
6 ft
8 ft
10 ft
12 ft
14 ft
16 ft
Figure B.26 Vertical roadway displacement during excavation (PZ-27 wall in stronger soil with lane load) 2 ft from wall.

B-14
PZ-27 wall located 5ft from roadway with lane loading in stronger soil
-3.5
-3
-2.5
-2
-1.5
-1
-0.5
00 5 10 15 20 25 30
Distance along Roadway (ft)D
isp.
(in)
0 ft
2 ft
4 ft
6 ft
8 ft
10 ft
12 ft
14 ft
16 ft
Figure B.27 Vertical roadway displacement during excavation (PZ-27 wall in stronger soil with lane load) 5 ft from wall.
PZ-27 wall located 10ft from roadway with lane loading in stronger soil
-2
-1.8
-1.6
-1.4
-1.2
-1
-0.8
-0.6
-0.4
-0.2
00 5 10 15 20 25 30
Distance along Roadway (ft)
Dis
p. (i
n)
0 ft
2 ft
4 ft
6 ft
8 ft
10 ft
12 ft
14 ft
16 ft
Figure B.28 Vertical roadway displacement during excavation (PZ-27 wall in stronger soil with lane load) 10 ft from wall.

B-15
PZ-27 wall located 0ft from roadway with no loading in stronger soil
-4
-3.5
-3
-2.5
-2
-1.5
-1
-0.5
00 5 10 15 20 25 30
Distance along Roadway (ft)D
isp.
(in)
0 ft
2 ft
4 ft
6 ft
8 ft
10 ft
12 ft
14 ft
16 ft
Figure B.29 Vertical roadway displacement during excavation (PZ-27 wall in stronger soil with no load) 0 ft from wall.
PZ-27 wall located 2ft from roadway with no loading in stronger soil
-3.5
-3
-2.5
-2
-1.5
-1
-0.5
00 5 10 15 20 25 30
Distance along Roadway (ft)
Dis
p. (i
n)
0 ft
2 ft
4 ft
6 ft
8 ft
10 ft
12 ft
14 ft
16 ft
Figure B.30 Vertical roadway displacement during excavation (PZ-27 wall in stronger soil with no load) 2 ft from wall.

B-16
PZ-27 wall located 5ft from roadway with no loading in stronger soil
-3
-2.5
-2
-1.5
-1
-0.5
00 5 10 15 20 25 30
Distance along Roadway (ft)D
isp.
(in)
0 ft
2 ft
4 ft
6 ft
8 ft
10 ft
12 ft
14 ft
16 ft
Figure B.31 Vertical roadway displacement during excavation (PZ-27 wall in stronger soil with no load) 5 ft from wall.
PZ-27 wall located 10ft from roadway with no loading in stronger soil
-1.8
-1.6
-1.4
-1.2
-1
-0.8
-0.6
-0.4
-0.2
00 5 10 15 20 25 30
Distance along Roadway (ft)
Dis
p. (i
n)
0 ft
2 ft
4 ft
6 ft
8 ft
10 ft
12 ft
14 ft
16 ft
Figure B.32 Vertical roadway displacement during excavation (PZ-27 wall in stronger soil with no load) 10 ft from wall.

B-17
PZ-27 wall located 0ft from roadway with truck loading in stronger soil
-4.5
-4
-3.5
-3
-2.5
-2
-1.5
-1
-0.5
00 5 10 15 20 25 30
Distance along Roadway (ft)D
isp.
(in)
0 ft
2 ft
4 ft
6 ft
8 ft
10 ft
12 ft
14 ft
16 ft
Figure B.33 Vertical roadway displacement during excavation (PZ-27 wall in stronger soil with truck load) 0 ft from wall.
PZ-27 wall located 2ft from roadway with truck loading in stronger soil
-4
-3.5
-3
-2.5
-2
-1.5
-1
-0.5
00 5 10 15 20 25 30
Distance along Roadway (ft)
Dis
p. (i
n)
0 ft
2 ft
4 ft
6 ft
8 ft
10 ft
12 ft
14 ft
16 ft
Figure B.34 Vertical roadway displacement during excavation (PZ-27 wall in stronger soil with truck load) 2 ft from wall.

B-18
PZ-27 wall located 5ft from roadway with truck loading in stronger soil
-3.5
-3
-2.5
-2
-1.5
-1
-0.5
00 5 10 15 20 25 30
Distance along Roadway (ft)D
isp.
(in)
0 ft
2 ft
4 ft
6 ft
8 ft
10 ft
12 ft
14 ft
16 ft
Figure B.35 Vertical roadway displacement during excavation (PZ-27 wall in stronger soil with truck load) 5 ft from wall.
PZ-27 wall located 10ft from roadway with truck loading in stronger soil
-2.5
-2
-1.5
-1
-0.5
00 5 10 15 20 25 30
Distance along Roadway (ft)
Dis
p. (i
n)
0 ft
2 ft
4 ft
6 ft
8 ft
10 ft
12 ft
14 ft
16 ft
Figure B.36 Vertical roadway displacement during excavation (PZ-27 wall in stronger soil with truck load) 10 ft from wall.

B-19
PZ-40 wall located 0ft from roadway with lane loading in stronger soil
-2.5
-2
-1.5
-1
-0.5
00 5 10 15 20 25 30
Distance along Roadway (ft)D
isp.
(in)
0 ft
2 ft
4 ft
6 ft
8 ft
10 ft
12 ft
14 ft
16 ft
Figure B.37 Vertical roadway displacement during excavation (PZ-40 wall in stronger soil with lane load) 0 ft from wall.
PZ-40 wall located 2ft from roadway with lane loading in stronger soil
-2.5
-2
-1.5
-1
-0.5
00 5 10 15 20 25 30
Distance along Roadway (ft)
Dis
p. (i
n)
0 ft
2 ft
4 ft
6 ft
8 ft
10 ft
12 ft
14 ft
16 ft
Figure B.38 Vertical roadway displacement during excavation (PZ-40 wall in stronger soil with lane load) 2 ft from wall.

B-20
PZ-40 wall located 5ft from roadway with lane loading in stronger soil
-2
-1.8
-1.6
-1.4
-1.2
-1
-0.8
-0.6
-0.4
-0.2
00 5 10 15 20 25 30
Distance along Roadway (ft)D
isp.
(in)
0 ft
2 ft
4 ft
6 ft
8 ft
10 ft
12 ft
14 ft
16 ft
Figure B.39 Vertical roadway displacement during excavation (PZ-40 wall in stronger soil with lane load) 5 ft from wall.
PZ-40 wall located 10ft from roadway with lane loading in stronger soil
-1.4
-1.2
-1
-0.8
-0.6
-0.4
-0.2
00 5 10 15 20 25 30
Distance along Roadway (ft)
Dis
p. (i
n)
0 ft
2 ft
4 ft
6 ft
8 ft
10 ft
12 ft
14 ft
16 ft
Figure B.40 Vertical roadway displacement during excavation (PZ-40 wall in stronger soil with lane load) 10 ft from wall.

B-21
PZ-40 wall located 0ft from roadway with no loading in stronger soil
-2
-1.8
-1.6
-1.4
-1.2
-1
-0.8
-0.6
-0.4
-0.2
00 5 10 15 20 25 30
Distance along Roadway (ft)D
isp.
(in)
0 ft
2 ft
4 ft
6 ft
8 ft
10 ft
12 ft
14 ft
16 ft
Figure B.41 Vertical roadway displacement during excavation (PZ-40 wall in stronger soil with no load) 0 ft from wall.
PZ-40 wall located 2ft from roadway with no loading in stronger soil
-2
-1.8
-1.6
-1.4
-1.2
-1
-0.8
-0.6
-0.4
-0.2
00 5 10 15 20 25 30
Distance along Roadway (ft)
Dis
p. (i
n)
0 ft
2 ft
4 ft
6 ft
8 ft
10 ft
12 ft
14 ft
16 ft
Figure B.42 Vertical roadway displacement during excavation (PZ-40 wall in stronger soil with no load) 2 ft from wall.

B-22
PZ-40 wall located 5ft from roadway with no loading in stronger soil
-1.8
-1.6
-1.4
-1.2
-1
-0.8
-0.6
-0.4
-0.2
00 5 10 15 20 25 30
Distance along Roadway (ft)D
isp.
(in)
0 ft
2 ft
4 ft
6 ft
8 ft
10 ft
12 ft
14 ft
16 ft
Figure B.43 Vertical roadway displacement during excavation (PZ-40 wall in stronger soil with no load) 5 ft from wall.
PZ-40 wall located 10ft from roadway with no loading in stronger soil
-1.2
-1
-0.8
-0.6
-0.4
-0.2
00 5 10 15 20 25 30
Distance along Roadway (ft)
Dis
p. (i
n)
0 ft
2 ft
4 ft
6 ft
8 ft
10 ft
12 ft
14 ft
16 ft
Figure B.44 Vertical roadway displacement during excavation (PZ-40 wall in stronger soil with no load) 10 ft from wall.

B-23
PZ-40 wall located 0ft from roadway with truck loading in stronger soil
-3
-2.5
-2
-1.5
-1
-0.5
00 5 10 15 20 25 30
Distance along Roadway (ft)D
isp.
(in)
0 ft
2 ft
4 ft
6 ft
8 ft
10 ft
12 ft
14 ft
16 ft
Figure B.45 Vertical roadway displacement during excavation (PZ-40 wall in stronger soil with truck load) 0 ft from wall.
PZ-40 wall located 2ft from roadway with truck loading in stronger soil
-2.5
-2
-1.5
-1
-0.5
00 5 10 15 20 25 30
Distance along Roadway (ft)
Dis
p. (i
n)
0 ft
2 ft
4 ft
6 ft
8 ft
10 ft
12 ft
14 ft
16 ft
Figure B.46 Vertical roadway displacement during excavation (PZ-40 wall in stronger soil with truck load) 2 ft from wall.

B-24
PZ-40 wall located 5ft from roadway with truck loading in stronger soil
-2.5
-2
-1.5
-1
-0.5
00 5 10 15 20 25 30
Distance along Roadway (ft)D
isp.
(in)
0 ft
2 ft
4 ft
6 ft
8 ft
10 ft
12 ft
14 ft
16 ft
Figure B.47 Vertical roadway displacement during excavation (PZ-40 wall in stronger soil with truck load) 5 ft from wall.
PZ-40 wall located 10ft from roadway with truck loading in stronger soil
-1.4
-1.2
-1
-0.8
-0.6
-0.4
-0.2
00 5 10 15 20 25 30
Distance along Roadway (ft)
Dis
p. (i
n)
0 ft
2 ft
4 ft
6 ft
8 ft
10 ft
12 ft
14 ft
16 ft
Figure B.48 Vertical roadway displacement during excavation (PZ-40 wall in stronger soil with truck load) 10 ft from wall.
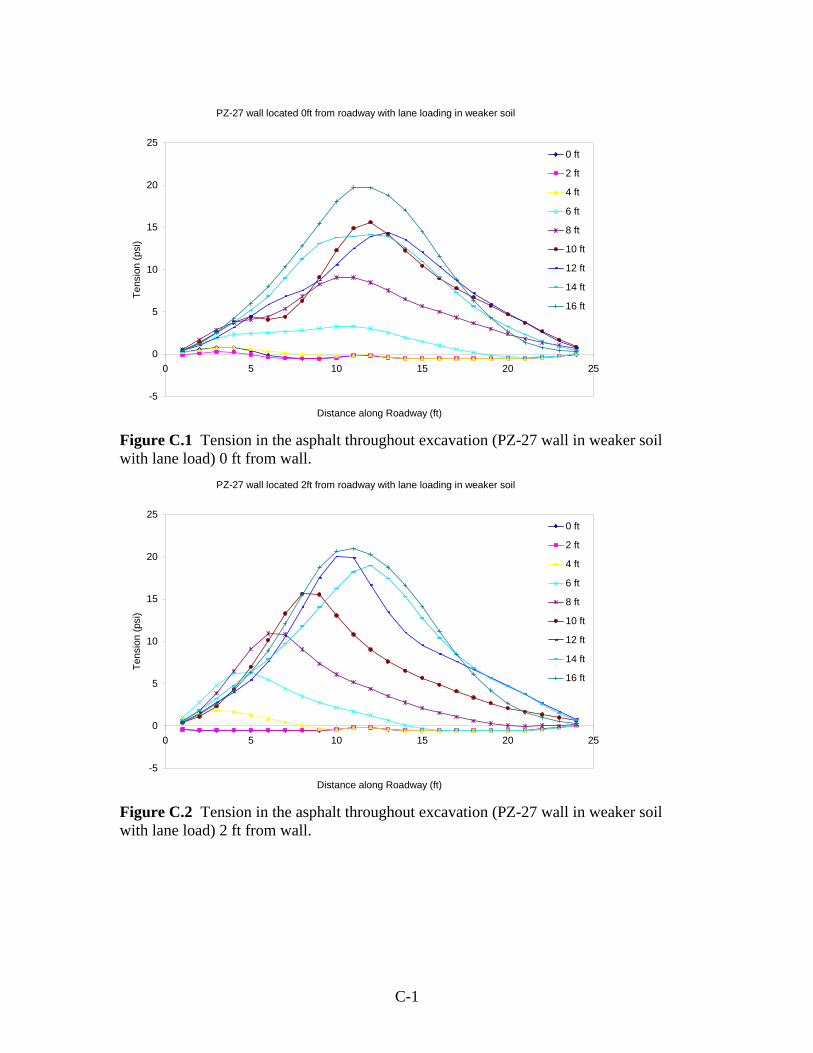
C-1
PZ-27 wall located 0ft from roadway with lane loading in weaker soil
-5
0
5
10
15
20
25
0 5 10 15 20 25
Distance along Roadway (ft)
Tens
ion
(psi
)
0 ft
2 ft
4 ft
6 ft
8 ft
10 ft
12 ft
14 ft
16 ft
Figure C.1 Tension in the asphalt throughout excavation (PZ-27 wall in weaker soil with lane load) 0 ft from wall.
PZ-27 wall located 2ft from roadway with lane loading in weaker soil
-5
0
5
10
15
20
25
0 5 10 15 20 25
Distance along Roadway (ft)
Tens
ion
(psi
)
0 ft
2 ft
4 ft
6 ft
8 ft
10 ft
12 ft
14 ft
16 ft
Figure C.2 Tension in the asphalt throughout excavation (PZ-27 wall in weaker soil with lane load) 2 ft from wall.

C-2
PZ-27 wall located 5ft from roadway with lane loading in weaker soil
-2
0
2
4
6
8
10
12
14
16
18
0 5 10 15 20 25
Distance along Roadway (ft)
Tens
ion
(psi
)
0 ft
2 ft
4 ft
6 ft
8 ft
10 ft
12 ft
14 ft
16 ft
Figure C.3 Tension in the asphalt throughout excavation (PZ-27 wall in weaker soil with lane load) 5 ft from wall.
PZ-27 wall located 10ft from roadway with lane loading in weaker soil
-5
0
5
10
15
20
25
0 5 10 15 20 25
Distance along Roadway (ft)
Tens
ion
(psi
)
0 ft
2 ft
4 ft
6 ft
8 ft
10 ft
12 ft
14 ft
16 ft
Figure C.4 Tension in the asphalt throughout excavation (PZ-27 wall in weaker soil with lane load) 10 ft from wall.

C-3
PZ-27 wall located 0ft from roadway with no loading in weaker soil
-2
0
2
4
6
8
10
12
14
16
0 5 10 15 20 25
Distance along Roadway (ft)
Tens
ion
(psi
)
0 ft
2 ft
4 ft
6 ft
8 ft
10 ft
12 ft
14 ft
16 ft
Figure C.5 Tension in the asphalt throughout excavation (PZ-27 wall in weaker soil with no load) 0 ft from wall.
PZ-27 wall located 2ft from roadway with no loading in weaker soil
-2
0
2
4
6
8
10
12
14
16
18
0 5 10 15 20 25
Distance along Roadway (ft)
Tens
ion
(psi
)
0 ft
2 ft
4 ft
6 ft
8 ft
10 ft
12 ft
14 ft
16 ft
Figure C.6 Tension in the asphalt throughout excavation (PZ-27 wall in weaker soil with no load) 2 ft from wall.

C-4
PZ-27 wall located 5ft from roadway with no loading in weaker soil
-2
0
2
4
6
8
10
12
14
0 5 10 15 20 25
Distance along Roadway (ft)
Tens
ion
(psi
)
0 ft
2 ft
4 ft
6 ft
8 ft
10 ft
12 ft
14 ft
16 ft
Figure C.7 Tension in the asphalt throughout excavation (PZ-27 wall in weaker soil with no load) 5 ft from wall.
PZ-27 wall located 10ft from roadway with no loading in weaker soil
-2
0
2
4
6
8
10
12
14
16
18
0 5 10 15 20 25
Distance along Roadway (ft)
Tens
ion
(psi
)
0 ft
2 ft
4 ft
6 ft
8 ft
10 ft
12 ft
14 ft
16 ft
Figure C.8 Tension in the asphalt throughout excavation (PZ-27 wall in weaker soil with no load) 10 ft from wall.

C-5
PZ-27 wall located 0ft from roadway with truck loading in weaker soil
-5
0
5
10
15
20
25
30
0 5 10 15 20 25
Distance along Roadway (ft)
Tens
ion
(psi
)
0 ft
2 ft
4 ft
6 ft
8 ft
10 ft
12 ft
14 ft
16 ft
Figure C.9 Tension in the asphalt throughout excavation (PZ-27 wall in weaker soil with truck load) 0 ft from wall.
PZ-27 wall located 2ft from roadway with truck loading in weaker soil
-5
0
5
10
15
20
25
30
0 5 10 15 20 25
Distance along Roadway (ft)
Tens
ion
(psi
)
0 ft
2 ft
4 ft
6 ft
8 ft
10 ft
12 ft
14 ft
16 ft
Figure C.10 Tension in the asphalt throughout excavation (PZ-27 wall in weaker soil with truck load) 2 ft from wall.

C-6
PZ-27 wall located 5ft from roadway with truck loading in weaker soil
-5
0
5
10
15
20
0 5 10 15 20 25
Distance along Roadway (ft)
Tens
ion
(psi
)
0 ft
2 ft
4 ft
6 ft
8 ft
10 ft
12 ft
14 ft
16 ft
Figure C.11 Tension in the asphalt throughout excavation (PZ-27 wall in weaker soil with truck load) 5 ft from wall.
PZ-27 wall located 10ft from roadway with truck loading in weaker soil
-5
0
5
10
15
20
25
30
0 5 10 15 20 25
Distance along Roadway (ft)
Tens
ion
(psi
)
0 ft
2 ft
4 ft
6 ft
8 ft
10 ft
12 ft
14 ft
16 ft
Figure C.12 Tension in the asphalt throughout excavation (PZ-27 wall in weaker soil with truck load) 10 ft from wall.
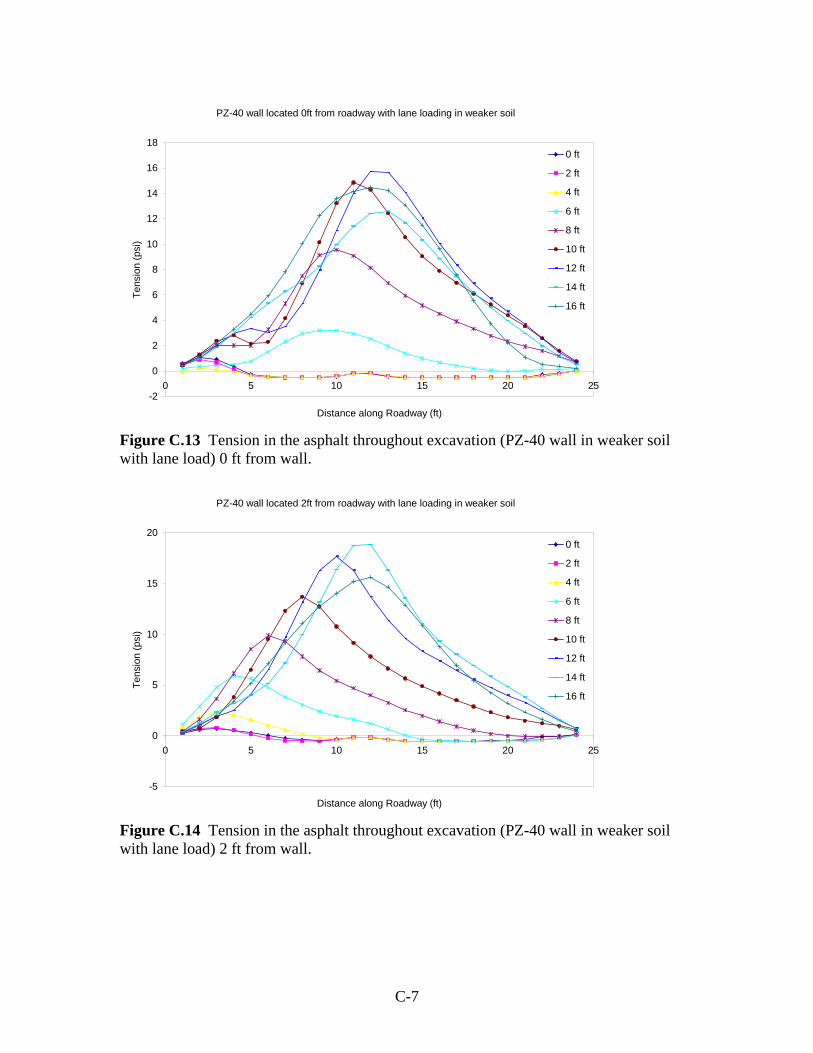
C-7
PZ-40 wall located 0ft from roadway with lane loading in weaker soil
-2
0
2
4
6
8
10
12
14
16
18
0 5 10 15 20 25
Distance along Roadway (ft)
Tens
ion
(psi
)
0 ft
2 ft
4 ft
6 ft
8 ft
10 ft
12 ft
14 ft
16 ft
Figure C.13 Tension in the asphalt throughout excavation (PZ-40 wall in weaker soil with lane load) 0 ft from wall.
PZ-40 wall located 2ft from roadway with lane loading in weaker soil
-5
0
5
10
15
20
0 5 10 15 20 25
Distance along Roadway (ft)
Tens
ion
(psi
)
0 ft
2 ft
4 ft
6 ft
8 ft
10 ft
12 ft
14 ft
16 ft
Figure C.14 Tension in the asphalt throughout excavation (PZ-40 wall in weaker soil with lane load) 2 ft from wall.

C-8
PZ-40 wall located 5ft from roadway with lane loading in weaker soil
-2
0
2
4
6
8
10
12
14
16
18
0 5 10 15 20 25
Distance along Roadway (ft)
Tens
ion
(psi
)
0 ft
2 ft
4 ft
6 ft
8 ft
10 ft
12 ft
14 ft
16 ft
Figure C.15 Tension in the asphalt throughout excavation (PZ-40 wall in weaker soil with lane load) 5 ft from wall.
PZ-40 wall located 10ft from roadway with lane loading in weaker soil
-5
0
5
10
15
20
25
0 5 10 15 20 25
Distance along Roadway (ft)
Tens
ion
(psi
)
0 ft
2 ft
4 ft
6 ft
8 ft
10 ft
12 ft
14 ft
16 ft
Figure C.16 Tension in the asphalt throughout excavation (PZ-40 wall in weaker soil with lane load) 10 ft from wall.

C-9
PZ-40 wall located 0ft from roadway with no loading in weaker soil
-2
0
2
4
6
8
10
12
14
0 5 10 15 20 25
Distance along Roadway (ft)
Tens
ion
(psi
)
0 ft
2 ft
4 ft
6 ft
8 ft
10 ft
12 ft
14 ft
16 ft
Figure C.17 Tension in the asphalt throughout excavation (PZ-40 wall in weaker soil with no load) 0 ft from wall.
PZ-40 wall located 2ft from roadway with no loading in weaker soil
-2
0
2
4
6
8
10
12
14
16
0 5 10 15 20 25
Distance along Roadway (ft)
Tens
ion
(psi
)
0 ft
2 ft
4 ft
6 ft
8 ft
10 ft
12 ft
14 ft
16 ft
Figure C.18 Tension in the asphalt throughout excavation (PZ-40 wall in weaker soil with no load) 2 ft from wall.

C-10
PZ-40 wall located 5ft from roadway with no loading in weaker soil
-2
0
2
4
6
8
10
12
14
16
0 5 10 15 20 25
Distance along Roadway (ft)
Tens
ion
(psi
)
0 ft
2 ft
4 ft
6 ft
8 ft
10 ft
12 ft
14 ft
16 ft
Figure C.19 Tension in the asphalt throughout excavation (PZ-40 wall in weaker soil with no load) 5 ft from wall.
PZ-40 wall located 10ft from roadway with no loading in weaker soil
-2
0
2
4
6
8
10
12
14
16
18
0 5 10 15 20 25
Distance along Roadway (ft)
Tens
ion
(psi
)
0 ft
2 ft
4 ft
6 ft
8 ft
10 ft
12 ft
14 ft
16 ft
Figure C.20 Tension in the asphalt throughout excavation (PZ-40 wall in weaker soil with no load) 10 ft from wall.

C-11
PZ-40 wall located 0ft from roadway with truck loading in weaker soil
-5
0
5
10
15
20
25
0 5 10 15 20 25
Distance along Roadway (ft)
Tens
ion
(psi
)
0 ft
2 ft
4 ft
6 ft
8 ft
10 ft
12 ft
14 ft
16 ft
Figure C.21 Tension in the asphalt throughout excavation (PZ-40 wall in weaker soil with truck load) 0 ft from wall.
PZ-40 wall located 2ft from roadway with truck loading in weaker soil
-5
0
5
10
15
20
25
30
0 5 10 15 20 25
Distance along Roadway (ft)
Tens
ion
(psi
)
0 ft
2 ft
4 ft
6 ft
8 ft
10 ft
12 ft
14 ft
16 ft
Figure C.22 Tension in the asphalt throughout excavation (PZ-40 wall in weaker soil with truck load) 2 ft from wall.

C-12
PZ-40 wall located 5ft from roadway with truck loading in weaker soil
-5
0
5
10
15
20
25
0 5 10 15 20 25
Distance along Roadway (ft)
Tens
ion
(psi
)
0 ft
2 ft
4 ft
6 ft
8 ft
10 ft
12 ft
14 ft
16 ft
Figure C.23 Tension in the asphalt throughout excavation (PZ-40 wall in weaker soil with truck load) 5 ft from wall.
PZ-40 wall located 10ft from roadway with truck loading in weaker soil
-5
0
5
10
15
20
0 5 10 15 20 25
Distance along Roadway (ft)
Tens
ion
(psi
)
0 ft
2 ft
4 ft
6 ft
8 ft
10 ft
12 ft
14 ft
16 ft
Figure C.24 Tension in the asphalt throughout excavation (PZ-40 wall in weaker soil with truck load) 10 ft from wall.

C-13
PZ-27 wall located 0ft from roadway with lane loading in stronger soil
-5
0
5
10
15
20
0 5 10 15 20 25
Distance along Roadway (ft)
Tens
ion
(psi
)
0 ft
2 ft
4 ft
6 ft
8 ft
10 ft
12 ft
14 ft
16 ft
Figure C.25 Tension in the asphalt throughout excavation (PZ-27 wall in stronger soil with lane load) 0 ft from wall.
PZ-27 wall located 2ft from roadway with lane loading in stronger soil
-5
0
5
10
15
20
25
0 5 10 15 20 25
Distance along Roadway (ft)
Tens
ion
(psi
)
0 ft
2 ft
4 ft
6 ft
8 ft
10 ft
12 ft
14 ft
16 ft
Figure C.26 Tension in the asphalt throughout excavation (PZ-27 wall in stronger soil with lane load) 2 ft from wall.

C-14
PZ-27 wall located 5ft from roadway with lane loading in stronger soil
-5
0
5
10
15
20
0 5 10 15 20 25
Distance along Roadway (ft)
Tens
ion
(psi
)
0 ft
2 ft
4 ft
6 ft
8 ft
10 ft
12 ft
14 ft
16 ft
Figure C.27 Tension in the asphalt throughout excavation (PZ-27 wall in stronger soil with lane load) 5 ft from wall.
PZ-27 wall located 10ft from roadway with lane loading in stronger soil
-5
0
5
10
15
20
0 5 10 15 20 25
Distance along Roadway (ft)
Tens
ion
(psi
)
0 ft
2 ft
4 ft
6 ft
8 ft
10 ft
12 ft
14 ft
16 ft
Figure C.28 Tension in the asphalt throughout excavation (PZ-27 wall in stronger soil with lane load) 10 ft from wall.

C-15
PZ-27 wall located 0ft from roadway with no loading in stronger soil
-2
0
2
4
6
8
10
12
14
16
0 5 10 15 20 25
Distance along Roadway (ft)
Tens
ion
(psi
)
0 ft
2 ft
4 ft
6 ft
8 ft
10 ft
12 ft
14 ft
16 ft
Figure C.29 Tension in the asphalt throughout excavation (PZ-27 wall in stronger soil with no load) 0 ft from wall.
PZ-27 wall located 2ft from roadway with no loading in stronger soil
-2
0
2
4
6
8
10
12
14
16
0 5 10 15 20 25
Distance along Roadway (ft)
Tens
ion
(psi
)
0 ft
2 ft
4 ft
6 ft
8 ft
10 ft
12 ft
14 ft
16 ft
Figure C.30 Tension in the asphalt throughout excavation (PZ-27 wall in stronger soil with no load) 2 ft from wall.

C-16
PZ-27 wall located 5ft from roadway with no loading in stronger soil
-2
0
2
4
6
8
10
12
14
16
0 5 10 15 20 25
Distance along Roadway (ft)
Tens
ion
(psi
)
0 ft
2 ft
4 ft
6 ft
8 ft
10 ft
12 ft
14 ft
16 ft
Figure C.31 Tension in the asphalt throughout excavation (PZ-27 wall in stronger soil with no load) 5 ft from wall.
PZ-27 wall located 10ft from roadway with no loading in stronger soil
-2
0
2
4
6
8
10
12
14
16
0 5 10 15 20 25
Distance along Roadway (ft)
Tens
ion
(psi
)
0 ft
2 ft
4 ft
6 ft
8 ft
10 ft
12 ft
14 ft
16 ft
Figure C.32 Tension in the asphalt throughout excavation (PZ-27 wall in stronger soil with no load) 10 ft from wall.

C-17
PZ-27 wall located 0ft from roadway with truck loading in stronger soil
-5
0
5
10
15
20
25
30
0 5 10 15 20 25
Distance along Roadway (ft)
Tens
ion
(psi
)
0 ft
2 ft
4 ft
6 ft
8 ft
10 ft
12 ft
14 ft
16 ft
Figure C.33 Tension in the asphalt throughout excavation (PZ-27 wall in stronger soil with truck load) 0 ft from wall.
PZ-27 wall located 2ft from roadway with truck loading in stronger soil
-5
0
5
10
15
20
25
30
0 5 10 15 20 25
Distance along Roadway (ft)
Tens
ion
(psi
)
0 ft
2 ft
4 ft
6 ft
8 ft
10 ft
12 ft
14 ft
16 ft
Figure C.34 Tension in the asphalt throughout excavation (PZ-27 wall in stronger soil with truck load) 2 ft from wall.

C-18
PZ-27 wall located 5ft from roadway with truck loading in stronger soil
-5
0
5
10
15
20
25
0 5 10 15 20 25
Distance along Roadway (ft)
Tens
ion
(psi
)
0 ft
2 ft
4 ft
6 ft
8 ft
10 ft
12 ft
14 ft
16 ft
Figure C.35 Tension in the asphalt throughout excavation (PZ-27 wall in stronger soil with truck load) 5 ft from wall.
PZ-27 wall located 10ft from roadway with truck loading in stronger soil
-5
0
5
10
15
20
25
0 5 10 15 20 25
Distance along Roadway (ft)
Tens
ion
(psi
)
0 ft
2 ft
4 ft
6 ft
8 ft
10 ft
12 ft
14 ft
16 ft
Figure C.36 Tension in the asphalt throughout excavation (PZ-27 wall in stronger soil with truck load) 10 ft from wall.
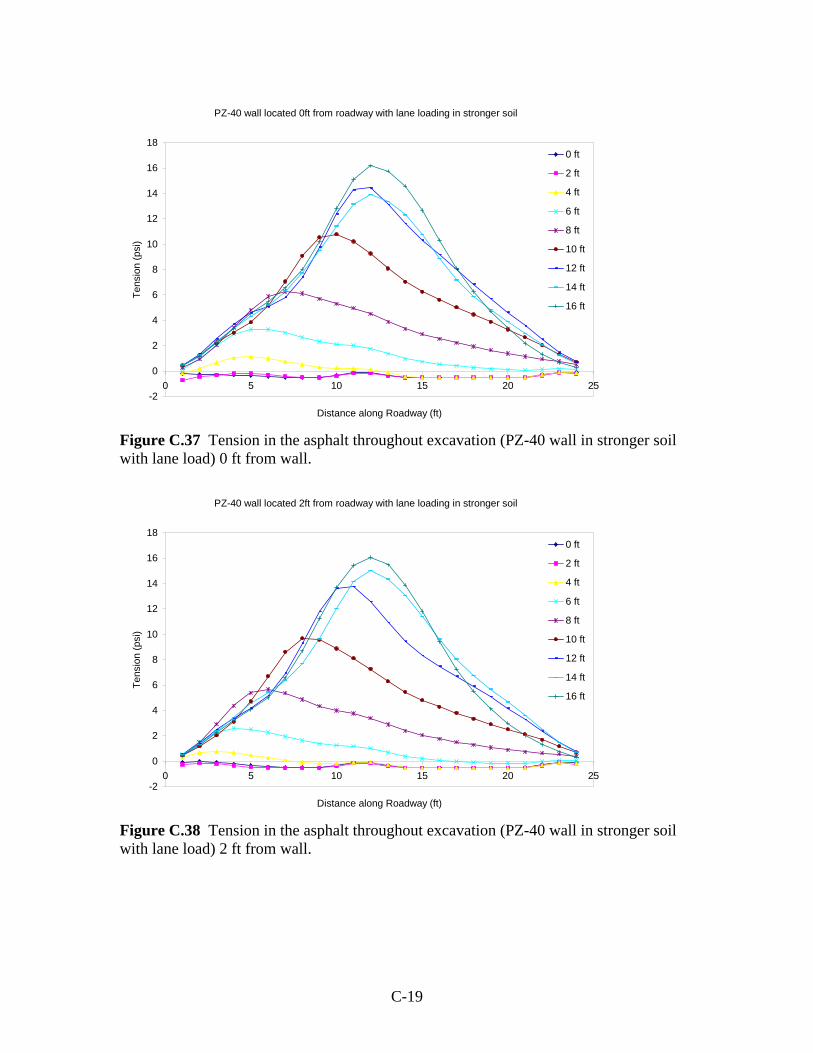
C-19
PZ-40 wall located 0ft from roadway with lane loading in stronger soil
-2
0
2
4
6
8
10
12
14
16
18
0 5 10 15 20 25
Distance along Roadway (ft)
Tens
ion
(psi
)
0 ft
2 ft
4 ft
6 ft
8 ft
10 ft
12 ft
14 ft
16 ft
Figure C.37 Tension in the asphalt throughout excavation (PZ-40 wall in stronger soil with lane load) 0 ft from wall.
PZ-40 wall located 2ft from roadway with lane loading in stronger soil
-2
0
2
4
6
8
10
12
14
16
18
0 5 10 15 20 25
Distance along Roadway (ft)
Tens
ion
(psi
)
0 ft
2 ft
4 ft
6 ft
8 ft
10 ft
12 ft
14 ft
16 ft
Figure C.38 Tension in the asphalt throughout excavation (PZ-40 wall in stronger soil with lane load) 2 ft from wall.

C-20
PZ-40 wall located 5ft from roadway with lane loading in stronger soil
-2
0
2
4
6
8
10
12
14
16
18
0 5 10 15 20 25
Distance along Roadway (ft)
Tens
ion
(psi
)
0 ft
2 ft
4 ft
6 ft
8 ft
10 ft
12 ft
14 ft
16 ft
Figure C.39 Tension in the asphalt throughout excavation (PZ-40 wall in stronger soil with lane load) 5 ft from wall.
PZ-40 wall located 10ft from roadway with lane loading in stronger soil
-2
0
2
4
6
8
10
12
14
16
18
0 5 10 15 20 25
Distance along Roadway (ft)
Tens
ion
(psi
)
0 ft
2 ft
4 ft
6 ft
8 ft
10 ft
12 ft
14 ft
16 ft
Figure C.40 Tension in the asphalt throughout excavation (PZ-40 wall in stronger soil with lane load) 10 ft from wall.

C-21
PZ-40 wall located 0ft from roadway with no loading in stronger soil
-2
0
2
4
6
8
10
12
0 5 10 15 20 25
Distance along Roadway (ft)
Tens
ion
(psi
)
0 ft
2 ft
4 ft
6 ft
8 ft
10 ft
12 ft
14 ft
16 ft
Figure C.41 Tension in the asphalt throughout excavation (PZ-40 wall in stronger soil with no load) 0 ft from wall.
PZ-40 wall located 2ft from roadway with no loading in stronger soil
-2
0
2
4
6
8
10
12
14
0 5 10 15 20 25
Distance along Roadway (ft)
Tens
ion
(psi
)
0 ft
2 ft
4 ft
6 ft
8 ft
10 ft
12 ft
14 ft
16 ft
Figure C.42 Tension in the asphalt throughout excavation (PZ-40 wall in stronger soil with no load) 2 ft from wall.
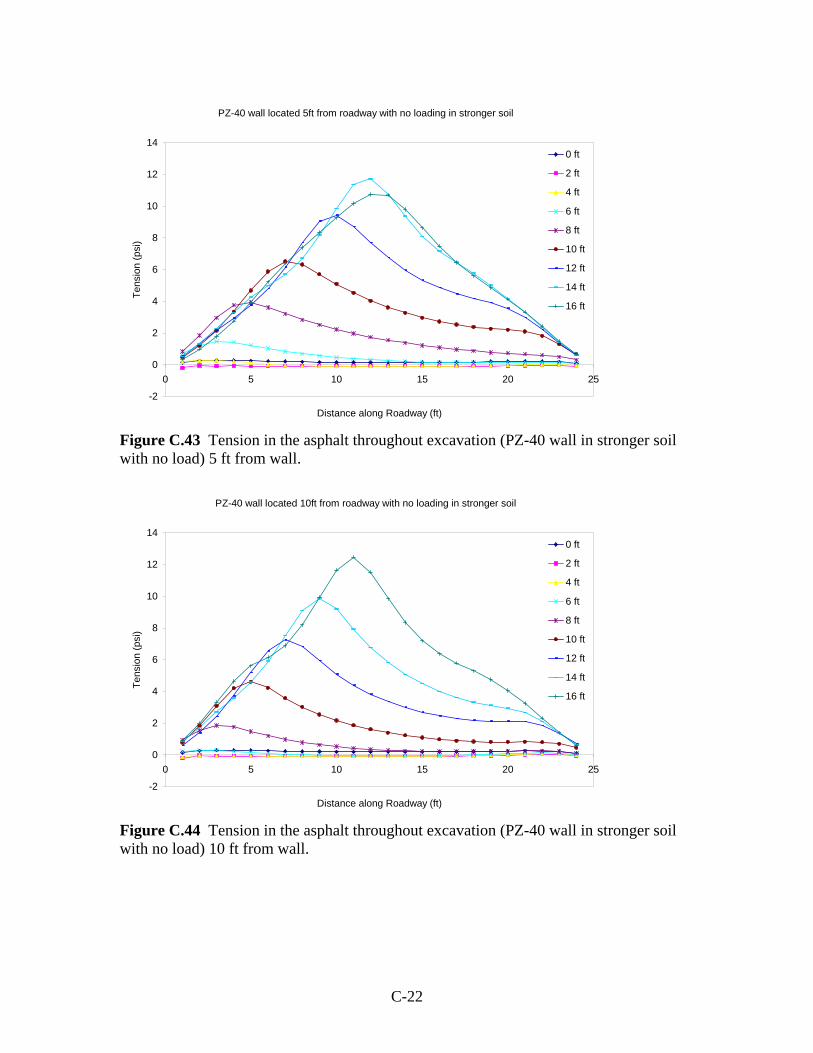
C-22
PZ-40 wall located 5ft from roadway with no loading in stronger soil
-2
0
2
4
6
8
10
12
14
0 5 10 15 20 25
Distance along Roadway (ft)
Tens
ion
(psi
)
0 ft
2 ft
4 ft
6 ft
8 ft
10 ft
12 ft
14 ft
16 ft
Figure C.43 Tension in the asphalt throughout excavation (PZ-40 wall in stronger soil with no load) 5 ft from wall.
PZ-40 wall located 10ft from roadway with no loading in stronger soil
-2
0
2
4
6
8
10
12
14
0 5 10 15 20 25
Distance along Roadway (ft)
Tens
ion
(psi
)
0 ft
2 ft
4 ft
6 ft
8 ft
10 ft
12 ft
14 ft
16 ft
Figure C.44 Tension in the asphalt throughout excavation (PZ-40 wall in stronger soil with no load) 10 ft from wall.

C-23
PZ-40 wall located 0ft from roadway with truck loading in stronger soil
-5
0
5
10
15
20
25
0 5 10 15 20 25
Distance along Roadway (ft)
Tens
ion
(psi
)
0 ft
2 ft
4 ft
6 ft
8 ft
10 ft
12 ft
14 ft
16 ft
Figure C.45 Tension in the asphalt throughout excavation (PZ-40 wall in stronger soil with truck load) 0 ft from wall.
PZ-40 wall located 2ft from roadway with truck loading in stronger soil
-5
0
5
10
15
20
25
0 5 10 15 20 25
Distance along Roadway (ft)
Tens
ion
(psi
)
0 ft
2 ft
4 ft
6 ft
8 ft
10 ft
12 ft
14 ft
16 ft
Figure C.46 Tension in the asphalt throughout excavation (PZ-40 wall in stronger soil with truck load) 2 ft from wall.
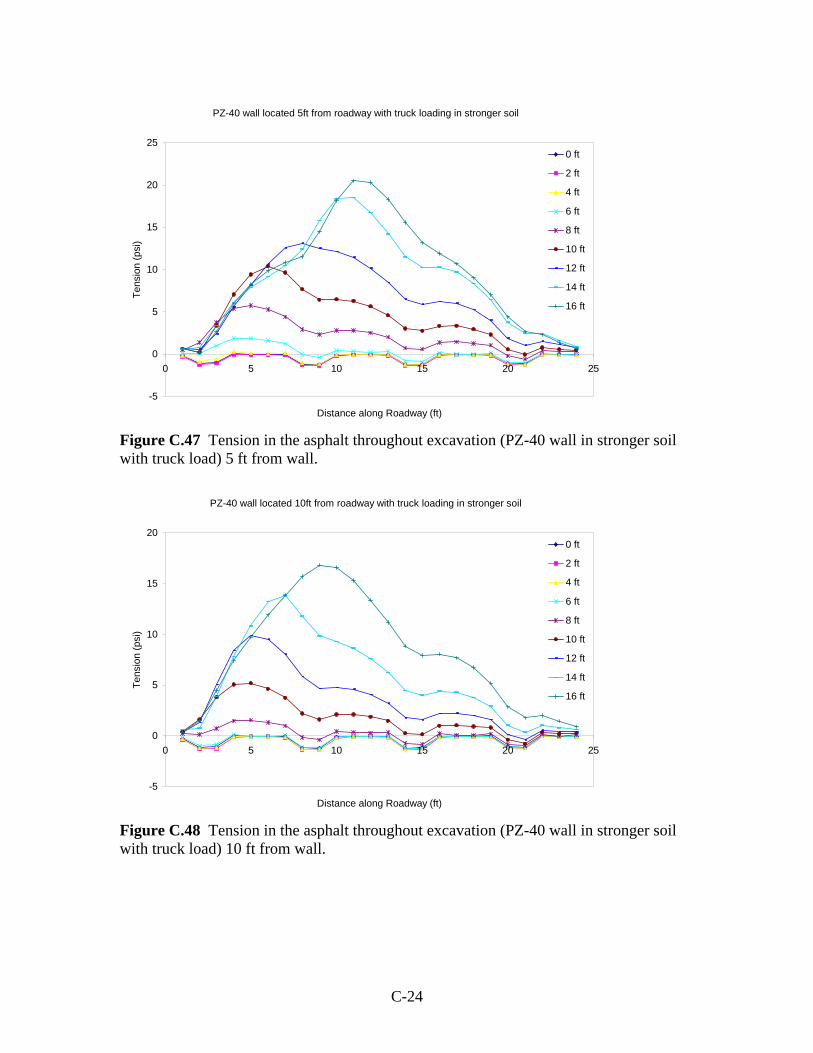
C-24
PZ-40 wall located 5ft from roadway with truck loading in stronger soil
-5
0
5
10
15
20
25
0 5 10 15 20 25
Distance along Roadway (ft)
Tens
ion
(psi
)
0 ft
2 ft
4 ft
6 ft
8 ft
10 ft
12 ft
14 ft
16 ft
Figure C.47 Tension in the asphalt throughout excavation (PZ-40 wall in stronger soil with truck load) 5 ft from wall.
PZ-40 wall located 10ft from roadway with truck loading in stronger soil
-5
0
5
10
15
20
0 5 10 15 20 25
Distance along Roadway (ft)
Tens
ion
(psi
)
0 ft
2 ft
4 ft
6 ft
8 ft
10 ft
12 ft
14 ft
16 ft
Figure C.48 Tension in the asphalt throughout excavation (PZ-40 wall in stronger soil with truck load) 10 ft from wall.