Principal Financial Group€¦ · Before-tax. Results exclude Corporate. 5 2 Assets under...
65
Principal Financial Group John Egan Vice President of Investor Relations A deep dive into our Principal International and Principal Global Investors Asian operations
Transcript of Principal Financial Group€¦ · Before-tax. Results exclude Corporate. 5 2 Assets under...
Principal Financial Group
John EganVice President of Investor Relations
A deep dive into our Principal International and Principal Global Investors Asian operations

A non-GAAP financial measure is a numerical measure of performance, financial position, or cash flows that includes adjustments from a comparable financial measure presented in accordance with U.S. GAAP.
The company uses a number of non-GAAP financial measures that management believes are useful to investors because they illustrate the performance of the company’s normal, ongoing operations which is important in understanding and evaluating the company’s financial condition and results of operations. While such measures are also consistent with measures utilized by investors to evaluate performance, they are not, however, a substitute for U.S. GAAP financial measures. Therefore, at the end of the presentation, the company has provided reconciliations of the non-GAAP financial measures to the most directly comparable U.S. GAAP financial measure. The company adjusts U.S. GAAP financial measures for items not directly related to ongoing operations. However, it is possible these adjusting items have occurred in the past and could recur in future reporting periods. Management also uses non-GAAP financial measures for goal setting, as a basis for determining employee and senior management awards and compensation, and evaluating performance on a basis comparable to that used by investors and securities analysts.
The company also uses a variety of other operational measures that do not have U.S. GAAP counterparts, and therefore do not fit the definition of non-GAAP financial measures. Assets under management is an example of an operational measure that is not considered a non-GAAP financial measure.
Use of Non-GAAP Financial Measures
2

Certain statements made by the company which are not historical facts may be considered forward-looking statements, including, without limitation, statements as to operating earnings, net income available to common stockholders, net cash flows, realized and unrealized gains and losses, capital and liquidity positions, sales and earnings trends, and management’s beliefs, expectations, goals and opinions. The company does not undertake to update these statements, which are based on a number of assumptions concerning future conditions that may ultimately prove to be inaccurate. Future events and their effects on the company may not be those anticipated, and actual results may differ materially from the results anticipated in these forward-looking statements. The risks, uncertainties and factors that could cause or contribute to such material differences are discussed in the company’s annual report on Form 10-K for the year ended Dec. 31, 2015 , and in the company’s quarterly report on Form 10-Q for the quarter ended June 30, 2016, filed by the company with the U.S. Securities and Exchange Commission, as updated or supplemented from time totime in subsequent filings. These risks and uncertainties include, without limitation: adverse capital and credit market conditions may significantly affect the company’s ability to meet liquidity needs, access to capital and cost of capital; conditions in the global capital markets and the economy generally; volatility or declines in the equity, bond or real estate markets; changes in interest rates or credit spreads or a sustained low interest rate environment; the company’s investment portfolio is subject to several risks that may diminish the value of its invested assets and the investment returns credited to customers; the company’s valuation of investments and the determination of the amount of allowances and impairments taken on such investments may include methodologies, estimations and assumptions that are subject to differing interpretations; any impairments of or valuation allowances against the company’s deferred tax assets; the company’s actual experience could differ significantly from its pricing and reserving assumptions; the pattern of amortizing the company’s DAC and other actuarial balances on its universal life-type insurance contracts, participating life insurance policies and certain investment contracts may change; the company may not be able to protect its intellectual property and may be subject to infringement claims; the company’s ability to pay stockholder dividends and meet its obligations may be constrained by the limitations on dividends or distributions Iowa insurance laws impose on Principal Life; changes in laws, regulations or accounting standards; results of litigation and regulatory investigations; from time to time the company may become subject to tax audits, tax litigation or similar proceedings, and as a result it may owe additional taxes, interest and penalties in amounts that may be material; applicable laws and the company’s certificate of incorporation and by-laws may discourage takeovers and business combinations that some stockholders might consider in their best interests; competition from companies that may have greater financial resources, broader arrays of products, higher ratings and stronger financial performance; a downgrade in the company’s financial strength or credit ratings; changes in investor preferences; inability to attract and retain qualified employees and sales representatives and develop new distribution sources; international business risks; fluctuations in foreign currency exchange rates; the company may need to fund deficiencies in its “Closed Block” assets that support participating ordinary life insurance policies that had a dividend scale in force at the time of Principal Life’s 1998 conversion into a stock life insurance company; the company’s reinsurers could default on their obligations or increase their rates; risks arising from acquisitions of businesses; and a computer system failure or security breach could disrupt the company’s business and damage its reputation.
Forward Looking Statements
3

Time Presentation Presenter
11:00 a.m. Total Company Overview John Egan
11:10 a.m. Principal International – Asian Operations
Renee Schaaf & Thomas Cheong
12:00 p.m. Working Lunch
12:20 p.m. Principal Global Investors – Asian Operations
Kirk West & Hitoshi Itagaki
1:10 p.m. Panel Discussion: PGI-PISynergies in Asia All presenters
PGI & PI Asian deep dive
Agenda
4

Fortune 500 company; 137 year history
1 Trailing Twelve Months. Before-tax. Results exclude Corporate.2 Assets under management by asset manager.5
Company overview
A leading financial services company
Operating Earnings1
$1,790.8 million as of Jun. 30, 2016
67%
24%
9%
Principal Global Investors
Principal International & Other PFG Entities
Assets Under Management2
$572.7 billion as of Jun. 30, 2016
Fee
Spread
Risk
25%
22%14%
14%
13%
12% RIS - Fee
Principal Global Investors
Principal International
RIS - Spread
Specialty Benefits
Individual Life

Principal Financial GroupDan Houston, CEO - 32/32
Terry Lillis, CFO – 34/34
Retirement & Income
Solutions (RIS)Nora Everett
President – 25/25
Principal Global Investors (PGI)
Jim McCaughanPresident – 42/14
U.S. Insurance Solutions (USIS)
Deanna StrablePresident – 27/22
Corporate
Management team averages 30 years of industry experience
PrincipalInternational (PI)
Luis ValdesPresident – 28/25
RIS – FeeRIS – Spread
Specialty BenefitsLife
6
Company overview
Segment reporting structure

(Year) = Principal entered country
AUM as of 06/30/2016
Principal Financial Group
Mexico (1993)• Annuities, Mutual
Funds, Pensions, Asset Management
• AUM of $10.3B• Wholly owned
Chile (1995)• Annuities, Mutual Funds, Asset
Management, Mandatory Pensions, Voluntary Pensions
• AUM of $41.5B• Wholly owned• Cuprum – a 98% majority owned
companyAUM of $35.5B
Brazil (1999)• Annuities, Pensions,
Mutual Funds, Asset Management
• Brasilprev – a 25% owned joint venture with Banco do Brasil
AUM of $54.9B• Claritas – 100% owned
mutual fund companyAUM of $1.1B
India (2000)• Asset Management,
Mutual Funds, Advisory Services
• AUM of $0.7B• 79% majority owned
company with Punjab National Bank
Malaysia (2003)• Conventional & Islamic
Asset Management, Mutual Funds, Pensions
• AUM of $12.3B• CIMB-Principal – 40%
owned joint venture with CIMB Group; 50% owned Islamic company with CIMB
China (2005)• Asset Management,
Mutual Funds • AUM of $101.0B• CCB-Principal – a 25%
owned joint venture with China Construction Bank
Hong Kong (1996)• Asset Management,
Mutual Funds, Pensions• AUM of $7.4B• AXA – Transaction closed
9/1/2015 adding AUM of $3.1B
• Wholly owned
Thailand (2010)• Asset Management, Mutual Funds• AUM of $2.3B• Wholly owned subsidiary of Malaysian JV
Indonesia (2007)• Asset Management,
Mutual Funds • AUM of $0.4B• Wholly owned
subsidiary of Malaysian JV
Singapore (2006)• Asset Management• AUM of $5.9M• Wholly owned
subsidiary of Malaysian JV
7
Principal International
Our locationsWe operate in emerging markets with a fast growing middle class

Principal Portfolio
Strategies
Principal Global
Equities
Principal Global Fixed
Income
Principal Real Estate Investors
Principal Global
Investors
Post Advisory
Group
Columbus Circle
Investors
Edge Asset Management
Macro Currency
Group
OriginAsset
Management
Morley Financial
Services, Inc.
Spectrum Finisterre
Capital LLP
• Unique hybrid boutique approach
• Distinct investment processes
• Leverage distribution; global institutional and funds
• Integrated business processes; drive scale and share best practices
8
Principal Global Investors
Specialized investment boutiques

Morningstar rankingsPercentage of funds in the top two quartiles
87% 87%91%
73%
91% 94%
72%
95% 93%
1-Year 3-Year 5-Year
06/30/2015 03/31/2016 06/30/2016
Principal “I” shares; if no “I” share class then “A” share class; separate accounts use “R6” rate level; Includes Principal mutual funds, separate accounts and collective investment trusts (CITs); Excludes money market, stable value and U.S. Property separate account.
4 OR 5 STARS = 39 FUNDS3 STARS 18 FUNDS
2 STARS 1 FUNDS
1 STAR 1 FUND
of rated funds have4 or 5 star rating
9
Principal Global Investors
Top tier investment performance

Principal InternationalAsia Investor DayTokyo, JapanSeptember 2016

Principal International Overview
Principal International

Help millions of middle class citizens in our chosen emerging markets plan and invest for their financial security through our retirement and long-term saving franchise.
12
Brazil s Chile s MexicoChina s Hong Kong s India s MalaysiaThailand s Indonesia s Singapore
Our missionPrincipal International

13
Latin America Pension LT Savings / Asset Management
Brazil ü ü
Chile ü ü
Mexico ü ü
North Asia Pension LT Savings / Asset Management
China ü
Hong Kong ü ü
South Asia Pension LT Savings / Asset Management
Southeast Asia ü
Malaysia ü ü
Thailand ü ü
Indonesia ü
Singapore ü
India ü
Latin AmericaComplete retirement franchise
AsiaLong-term savings and asset management franchise
Expand retirement franchise in Asia as markets develop
Principal International
Future opportunity

14
• Primary focus• Ability to leverage asset
management and retirement expertise across Principal
• Strong reputation with regulators for global pension expertise
+ +
• We’re in the right markets
• Strong foothold in key markets
• Marquee joint venture partners
• Broad distribution reach
Principal International
Competitive differentials
Retirement & long-term savings expert
Strongmarketgrowth
Strongpartners

15
5%
95%
2013
11%
89%
2015
2 year CAGR*PI
Total Asia Latin America
18% 47% 15%
Pre-tax Operating Earnings Contribution
Principal International
Diversified growth
V Asia
V Latin America
* Results normalized for encaje vs. expectation, the 3Q impairment of intangible assets in China and reflects 2015 FX rates

AsiaOverview
Principal International

SE Asia12%
India 1%
Hong Kong
6%
China81%
17
India• 79% majority owned joint venture with
Punjab National Bank• Products: mutual funds, asset
management, advisory services• Small but growing asset management
industry• Long-term strategic importance
Southeast Asia• Malaysia, Thailand, Indonesia, & Singapore• 40% owned joint venture with CIMB Group• 50% owned Islamic company with CIMB
Group• Products: Pension, mutual funds,
conventional & Islamic asset management• Ranked #2 in Private Retirement Scheme
(PRS) and unit trust in Malaysia
Hong Kong• Wholly owned company• Products: Pension, mutual funds, asset
management• Complete retirement franchise• 5th largest Mandatory Provident Fund
(MPF) provider
China• 25% owned joint venture with China
Construction Bank• Products: Mutual funds, asset
management• Pursuing complete retirement franchise• 9th largest retail mutual fund provider
$124 B
Long-term savings and asset management franchise
Principal International
Asia overview
Asia Combined AUMas of 6/30/2016

0
10
20
30
40
2012 2013 2014 2015
Pre-tax Operating Earnings(USD $Mn)
Constant currency CAGR adjust historical periods to 2015 FX rates18
Principal’s Asia operations are becoming an increasingly larger part of Principal and we expect the strong growth to continue
0
50
100
150
200
2012 2013 2014 2015
Combined Net Revenue (at PFG Share)(USD $Mn)
0
5
10
15
20
25
2012 2013 2014 2015
Reported AUM(USD $Bn)
10%
15%
20%
25%
2012 2013 2014 2015
Pre-tax Return on Net Revenue (at PFG share)
Principal International
Principal Asia growth

ChinaOverview
Principal International
0
500
1,000
1,500
2,000
2,500
2011 2012 2013 2014 2015 2016E 2017E 2018E 2019E 2020E
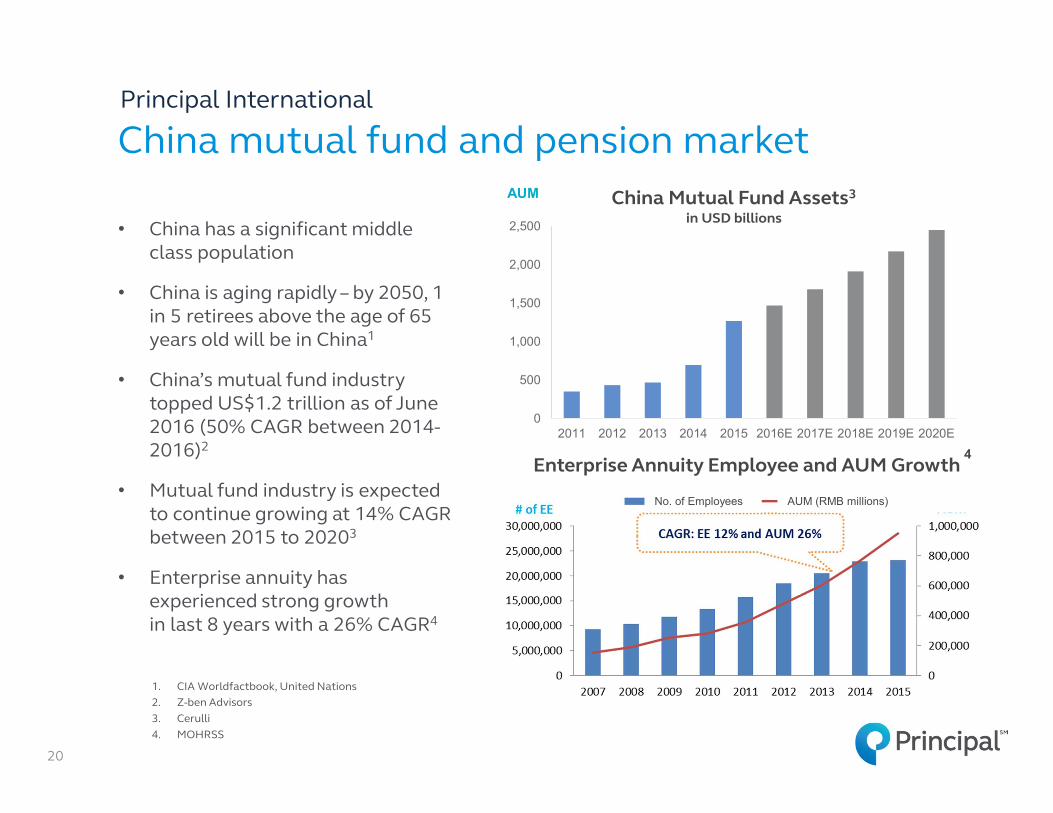
China Mutual Fund Assets3
in USD billions
20
• China has a significant middle class population
• China is aging rapidly – by 2050, 1 in 5 retirees above the age of 65 years old will be in China1
• China’s mutual fund industry topped US$1.2 trillion as of June 2016 (50% CAGR between 2014-2016)2
• Mutual fund industry is expected to continue growing at 14% CAGR between 2015 to 20203
• Enterprise annuity has experienced strong growth in last 8 years with a 26% CAGR4
1. CIA Worldfactbook, United Nations2. Z-ben Advisors3. Cerulli4. MOHRSS
4
AUM
Enterprise Annuity Employee and AUM Growth
AUM (RMB millions)No. of Employees
Principal International
China mutual fund and pension market

21
+ =Retirement and asset management expert
No. 2 bank in China with local expertise and
distribution strengthSuccessful joint venture
Principal International
Principal in China

22
• 25% joint venture partnership with China Construction Bank since 2005
• CCBPAM is the 9th largest retail mutual fund provider among the 108 in the industry as of June 2016
• Generated USD$34 million of pre-tax earnings over the TTM period ended 2Q16
• Pre-tax RONR of 49% during the TTM period ended 2Q16
• AUM of USD$101 billion as of 2Q16
Principal International
CCB-Principal Asset Management (CCBPAM)

23
China’s Three-Pillar System
PILLAR 1State Pension
PILLAR 2Occupational Pension /
Enterprise Annuity
PILLAR 3Personal Savings
(Mutual funds, bank savings, etc.)
~ US$ 0.7 trillion1 ~US$ 1.1 trillion2 ~US$ 28.5 trillion3
PAYG & Funded Individual Account Defined Contribution Voluntary Contribution
Manage global mandates and
offshore investments
Propose pension joint venture with CCB
Grow asset management and
mutual fund business in CCBPAM
1 Z-ben Advisors: As at end of 2013, PPF and NSSF AUM were at RMB3.13tr and 1.24tr. 2 Z-ben Advisors: As at end of 2013, EA and Pension insurance AUM were at RMB0.6tr and 6.33tr.3 Z-ben Advisors: As at end of 2013, total retail market size was at RMB176.77tr which include: Deposits, equity (floated cap), bond, mutual fund,
BWMP, trust, FMC SA, brokerage AM, insurance, property and PFM.
Principal’s Opportunity
Principal International
China pension system

24
• In exchange, CCB will advocate on Principal’s behalf to become partner in CCB’s pension company
• Significant long-term growth opportunity
• Signed Strategic Cooperation Agreement with CCB in March 2016 to develop a new asset management and pension partnership
• Principal is sharing pension expertise with CCB in following areas:o Operationso Product designo Investing
Principal CEO Dan Houston with Vice Governor Yuof CCB, who is also chairman of CCB Pension
Principal International
Spotlight on pension in China

Hong KongOverview
Principal International

26
• Mandatory Provident Fund (MPF) is a tax incentivized mandatory saving plan
• Approximately 2.5 million participants; 276,000 employers
• Hong Kong’s MPF industry reached US$78 billion as of June 20161
• Low contribution and cap has led to low average account balance of approximately US$30k
• Significant growth of voluntary contributions in the last 10 years –approximately 13% and 49% CAGRsin voluntary and special voluntary contributions, respectively
1. Gadbury MPF Market Share Report2. Cerulli
4657
6673 76 78
2011 2012 2013 2014 2015 2016 (Jun)
MPF AUM(USD bn)
69
93108
121 116 122137
154171
184
0
40
80
120
160
200
2011 2012 2013 2014 2015 2016E 2017E 2018E 2019E 2020E
Hong Kong Mutual Fund Assets2
in USD billions
Principal International
Hong Kong pension and mutual fund market

27
• Entered market in 1996
• 5th largest MPF provider following the acquisition of AXA’s MPF with AUM of USD$7.4 billion as of 2Q16
• AXA acquisition included an exclusive 15-year distribution agreement which complemented existing distribution
• AXA integration progressing as planned and distribution is already contributing strong net customer cash flows
• Administration of AXA’s block of business has shifted from BestServe to Principal which will result in expense synergies
Principal International
Principal Hong Kong

28
• Aging population:
• MPF contributions are insufficient to generate an adequate replacement rate
• MPF industry changes and reforms are likely:
2015 2041
Population age 65 and older 15% 32%
Dependency ratio 5 working adults to 1 senior above age 65
2 working adults to 1 senior above age 65
Default investment
strategy
Offsettingmechanism Full portability
Increase mandatory
contributions
Principal International
Future of Hong Kong pension system

29
Strengthen distribution
Growth in voluntary MPF savings
Long-term savings through robust mutual fund platform
Principal International
Opportunities for Principal Hong Kong

30
• Leverage China & Hong Kong footprints and partnership with CCB to access opportunities
• Examples: § China-Hong Kong Mutual Recognition Fund § Internationalizing CCB-Principal product lines§ Distribution of mutual funds and MPF via CCB(Asia)§ Tapping Chinese high net worth demand for overseas investment exposure via
CCB(Asia) etc.
Drivers for potential inflow into China Drivers for potential outflows from China• RMB internationalization• Access to China interbank bond market• Higher China weightage in major global
indices• China’s "new economy" offers interesting
opportunities• Estimated market size: US$ 1.8 trillion by
20211
• RMB internationalization• China’s foreign direct investment• Chinese investors seeking risk diversification• Estimated market size: US$ 1.3 trillion by 20211
1 Z-ben Advisors
Principal International
Spotlight on cross-border flows

31
+ +
Principal International
Positioned for success
Retirement & long-term savings expert
Strong marketgrowth Strong partners

Principal International Q&A

Please grab your lunch and join us at 12:20 p.m.

Principal Global Investors
Asia Investor Day
Tokyo, JapanSeptember 2016

What investors are seeking
Close-up on Japan
Today’s topics
35
PGI in the Asia-Pacific region
How we drive growth in the region
Q&A for PGI

To meet current and future needs of allinvestors we serve globally by providinginvestment management solutions andexpertise across a broad range ofcapabilities and investment vehicles.
36
Our missionPrincipal Global Investors

Principal Global Investors
A diversified investment manager
Well positioned to serve organizations and individuals, offering institutional and retirement expertise, guidance, and outcome-based strategies for real life challenges
A broad group of specialized investment boutiques, diverse set of asset classes, and comprehensive financial solutions
Principal Global Investors is the 30th largest U.S. money manager out of 300 managers profiled1 and the 36th largest manager of worldwide assets out of 600 managers profiled2
Alternatives$8.0 BReal Estate
$70.7 B
Fixed Income$186.7 B
Equity$137.1 B
Principal Global Investors$402.7 B
37

Principal International marketsPrincipal Global Investors portfolio management, research and tradingPrincipal Global Investors sales and service representatives
PGI has clients in 75 countries
We invest and work with clients globally
38

United States$324,793
Canada$998
Latin America$2,538
Europe$16,841
Japan$23,477
Middle East$823
Asia ex Japan$10,364
Australia / New Zealand$3,764
As of 6/30/2016. Based on client country of domicile
Client assets by region ($ millions)
39

Greater China• Pensions• Official Sector• Insurance• High Net Worth
Korea• Pensions• Official Sector• Insurance• Sub-advisory
Japan• Pensions• Financial Institutions• Sub-advisory
Australia / New Zealand• Superfunds• Institutions• Sub-advisory
SE Asia• Official Sector• Institutions• High Net Worth
Asia-Pacific target clients
40

What investors are seeking
• Income: monthly income payout is often preferred
• Diversification: away from US HY, and into assets like Preferred Securities
• Overseas investments: to capture yield, avoiding local low/negative yields
• Multi-asset solutions
• High Conviction Equity strategies
• Alternatives and Absolute Return: Real Estate and Private Equity
• Low Volatility solutions
• Niche strategies: diversification opportunities
• In Greater China, strong interest in US$-denominated strategies
• In Australia, gradual move toward Global Equities across all market segments
41

Capitalize on our broad range of capabilities
• Strong investment performance across boutiques and platforms
• Specialist investment capabilities – in demand despite pressure on traditional core managers
• Multi-asset, multi-manager capabilities
• Well-positioned in strategies forecast to see significant growth
• Income and yield-oriented
• Alternatives
• Multi-asset, multi-manager solutions
• Early entrant in Active and Smart Beta ETFs
• Capabilities offered in various legal vehicles based on client need
• Disciplined, market-driven product development
Our growth drivers
42
Take advantage of global leadership in funds
* As of 6/30/2016. Includes Principal Funds, PGI Trust CITs, PGI Dublin Funds, PGI Australia Funds, and various boutique-level funds.
Our growth drivers• PGI/Funds integration makes Principal a “global
destination for funds”
• $168B in AUM across U.S. and International platforms, as well as various private funds*
• Strong performance across boutiques and strategies
• Key functions aligned globally
• Distribution
• Governance
• Operations
• Centralized team coordinates product strategy, development, and management globally
• Work closely with PI in markets where they are present
43

The Principal Global Investors Funds (the Unit Trust)
established in 1992
Specialist boutiques
Innovative products relevant
to the new economic
environment
Over $4.7 B in assets under management1
Offshore UCITS and Alternative Investment Funds Platform
1As of 30 June 2016. Includes assets of all share classes of Principal Funds, Inc. and Principal Variable Contracts Funds, Inc.The funds referenced on this page are not available to U.S. investors and nothing in this document constitutes an invitation to invest in these funds.
A leading offshore funds provider
15 of our offshore funds/share classes are rated 4 or 5 stars by Morningstar
44

Leverage strong institutional and wealth advisory distribution
Our growth drivers• Institutional opportunities across client segments
• Private & Public Pension Plans
• Endowment & Foundations
• Insurance Companies
• Family Offices
• Official Sector Institutions
• Wealth Advisory activates and manages global firm-level relationships
Key Global Distributors
Credit Suisse Standard Chartered Bank
Banco Santander Deutsche Bank
Merrill Lynch HSBC
Morgan Stanley Barclays
Julius Baer BNP Paribus
UBS Credit Agricole
Citibank RBC
45
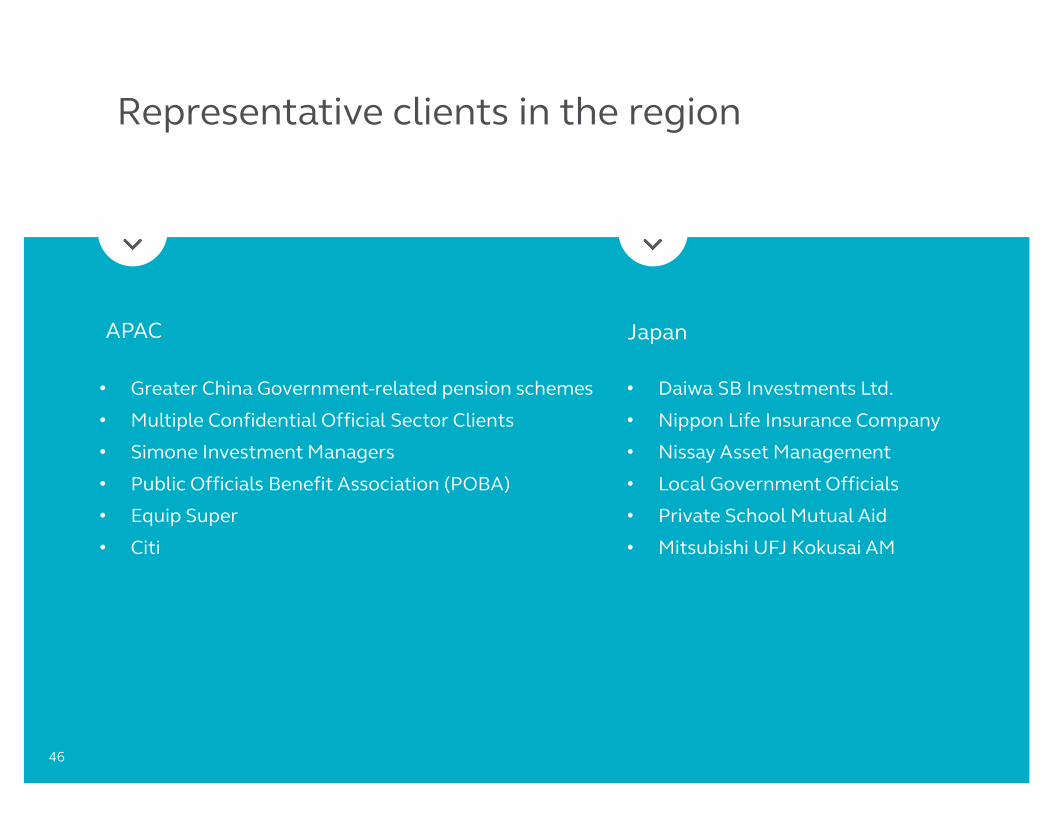
• Daiwa SB Investments Ltd.
• Nippon Life Insurance Company
• Nissay Asset Management
• Local Government Officials
• Private School Mutual Aid
• Mitsubishi UFJ Kokusai AM
• Greater China Government-related pension schemes
• Multiple Confidential Official Sector Clients
• Simone Investment Managers
• Public Officials Benefit Association (POBA)
• Equip Super
• Citi
Representative clients in the region
JapanAPAC
46

Close-up on Japan
• Asset management industry overview
• Historical growth of our business
• Opportunities going forward
47

0.5 10.0
45.7
0
20
40
60
80
100
120
140
160
180
Other Investment Securities (Fund Investment) Equities
Corporate Bonds Short-term Bonds
Municipal Bonds Government Bonds
-Japan Post Bank eyes more aggressive Investments and shiftsto riskier assets to boost profitability as negative interest rates shrink income from government bonds.
-As of June 30, 2016, Fund investment assets totaled JPY 46trn.
Japan Post Bank - Total Assets of Investment Securities (JPY trillion)
Source : Japan Post Bank
Asset management overview
Financial institutions – Japan Post Bank
48

34.4
13.8
52.4
3.9
6.3
1.6
8.8
10.8
5.4
17.1
34.9
9.0
33.4
31.5
29.9
2.3
2.8
1.8
0 20 40 60 80 100
Euro area
U.S.
Japan
Currency and Deposite
Debt Securities
Investment Funds (including MMF)
Equities
Life Insurance Reserves, Pension Entitlements
Others
-Investment trust fund’s share within household financial assets in Japan is smaller than the U.S. and Euro area.
-As of March 31, 2016, only 5.4% individuals owned investment trusts in Japan.
(%)
Net Assets as of March 31, 2016. Source : The Investment Trusts Association Japan
Asset management overview
Retail business in Japan
49

Net Assets as of March 31, 2016. Source : The Investment Trusts Association Japan
17,875
3,609
2,084 1,916 1,897 1,584 1,561 1,386 1,167 949
0
2,000
4,000
6,000
8,000
10,000
12,000
14,000
16,000
18,000
20,000
U.S. Lux Ireland Germany France Australia U.K. Japan China Canada
Total Net Assets (USD billion)
Asset management overview
Investment Trusts – net assets top10 countries
50

1.6 3.0 4.4 5.2 6.4 7.8
25.0
7.3 8.3
8.8 9.2 9.1 10.1
15.0
0
2
4
6
8
10
12
14
16
0
5
10
15
20
25
30
2014/06 2014/12 2015/03 2015/06 2015/12 2016/03 E 2020
Total amount of purchase (JPY trillion)
Number of accountsSource : Based on the Financial Services Agency’s survey on NISA
-In 2014, Japanese government established a new wealth- building incentive program ‘NISA’.
-Growth in investment trust business will be expected by NISAs plan.
-Individual money flows into retail funds with NISA.
Japanese Government targets JPY 25trn in 2020
‘NISA’ started in 2014
‘Junior NISA’ started in 2016
Annual contribution limit changed up to JPY1.2mn in 2016
Asset management overview
NISA – Nippon Individual Saving Account
51

200 200170 179
171 167176 184
201
100 90
7493 92 93
101109
117
0
50
100
150
200
250
300
350
2007/3 2008/3 2009/3 2010/3 2011/3 2012/3 2013/3 2014/3 2015/3
Public Pension Corporate Pension
Source : Bank of Japan
AUM (JPY trillion)
-Major growth in both GPIF and Corporate pension assets.
-Japanese pension assets totaled JPY 318trn, JPY 25trn increase from a year earlier.
Asset management overview
Pension business in Japan
52

Source : Trust companies association of Japan, Ministry of Health Labor and Welfare, PFA, SEREMA – The Smaller Enterprise Retirement Allowance Mutual Aid
0
20
40
60
80
100
120
2007/3 2008/3 2009/3 2010/3 2011/3 2012/3 2013/3 2014/3 2015/3 2016/3
SERAMA plans Corporate DC pension plansTax-Qualified pension plans Employees' pension fundsDB Corporate pension plans
-Dissolution of EPF and transfer into another type of corporate pension plan.
-Corporate DC pension assets will grow continuously.
AUM (JPY trillion)
Asset management overview
Corporate pension business in Japan
53

115 120 118 123 116 114 120 127 137 135
3.7
(4.6)
(7.6)
7.9
(0.3)
2.3
10.2 8.6
12.3
(3.8)
-20.0
-15.0
-10.0
-5.0
0.0
5.0
10.0
15.0
0
20
40
60
80
100
120
140
160
180
200
2007/3 2008/3 2009/3 2010/3 2011/3 2012/3 2013/3 2014/3 2015/3 2016/3
AUM (JPY trillion) Return (Annualized, %)Source : GPIF
-Public pensions are exhibiting a growing preference for distinctive investment products.
-GPIF, which is the world’s largest pension fund, manages $ 1.3trn.
-Over 90% of total public pension assets is managed by the GPIF.
Asset management overview
GPIF
54

25%
25%15%
35%21.8%
22.1%
5.1%13.5%
37.6%
Japanese Equity International Equity
Short-term Assets International Bond
Japanese Bond
As of Mar 31, 2016
Source : GPIF
As of Sep 30, 2014
JPY 135trillion
-New Policy Asset MixOn October 31, 2014, GPIF moved massive amounts of money from Japanese bonds into domestic and foreign stocks.
-Smart betaGPIF started factor investing, or smart beta as a third way of implementing equity mandates.
Inside : Target portfolio allocationOutside : Actual portfolio allocation
JPY 131trillion
12%
12%
5%
11%
60%
18.2%
17.4%
2.6%
12.1%
49.6%
Asset management overview
GPIF – Policy Asset Mix Change
55

AUM(JPY
trillion )
GPIF 135
CalPERS 33
CPPIB 24
GPF-G 96
AUM as of March 31, 2016. 1US$=JPY 112.40, 1CAD$=JPY 86.90, 1NOK=JPY 13.59Source : GPIF
-35%
-25%
-15%
-5%
5%
15%
25%
35%
2005/32006/32007/32008/32009/32010/32011/32012/32013/32014/32015/32016/3
GPIF CalPERS CPPIB GPF-G
On Sep 16th 2015, GPIF became a signatory to the United Nation’s for Responsible Investment (UN-PRI) to express their attitudes to ESG issues.
Annualized return (%)
Asset management overview
GPIF vs Global Public Pensions comparison
56

Business outlook in Japan• Japan’s asset management market does not have high growth potential. On the
other hand the size of the market is still dominant in Asia Pacific region. • At institutional market, the move from traditional asset class to non-traditional
asset class is irreversible. • Pension market is maturing and the money is now moving to individual market.
Asset management business for retail investors have growth potential.
Challenges• Japanese retail market is still dominated by large distributors and the affiliated
asset managers. So far we could not leverage our experience of fund business in US.
• Due to the historical low interest rate at developed countries, pressures to the margin is continuous.
Asset management overview
Summary
57

0.11 0.25 0.23 0.25
0.41
0.97
1.66
2.43 2.41
0.00
0.50
1.00
1.50
2.00
2.50
2008 2009 2010 2011 2012 2013 2014 2015 2016Q2
AUM (JPY trillion)
Established in 2006
First agreement with corporate pension client in 2008
First agreement with public pension client in 2009
Adopted the Japan Stewardship Code in 2014
AUM exceeded JPY 2trn in 2015
Historical growth of our business
Japan sourced AUM - proven track record
58

6.4%
93.3%
0.2%
Pension Financial Institutions Other
By Client TypeBroad and deepdistribution channels and sectors
ü Public pensionü Private pension (Autos,
Electronics, Utilities, Housing, Food, etc)
ü Financialsü Foundation
75.5%
24.5%
Institutional Retail
JPY 2.4trillion
AUM as of June 30, 2016
By Client Channel
JPY 2.4trillion
Historical growth of our business
Japan sourced AUM
59

PGIJ seeks multi-asset class distribution with unique hybrid boutique approach. Equity
9.0%
Fixed Income85.3%
Real Estate5.3%
Hedge Fund0.5%
AUM as of June 30, 2016
By Asset Class
JPY 2.4trillion
Edge0.2%
Finisterre0.5%
Origin0.8% PGI
Equity8.1%
PGI Fixed Income54.2%
Post Advisory
Group18.1%
PrinREI4.5%
Spectrum13.8%
By Boutique
JPY 2.4trillion
Historical growth of our business
Japan sourced AUM
60

• Principal’s multi boutiques are well matched to the institutional market demand. We will continue to attract clients with unique product line up such as credit products, real estate and alternative investments.
• In retail market, we accumulated good relationships with some of major investment trust managers who are subsidiaries of large distributors. We will keep leveraging these relationships with Principal’s multiple solutions.
Japan summary
Opportunities going forward
61

Principal Global Investors Q&A

PGI-PI Synergies in Asia
All Presenters
Panel Discussion

64
Activate & Support Distribution
Leverage Global & Local Market Expertise
Optimize Relationships
Focus areas for capturing synergies

65
Non-GAAP financial measure reconciliations
Operating earnings (losses)
Trailing twelve
months, 30-Jun-16
Pre-Tax Operating Earnings, Excluding Corporate $1,790.8Pre-Tax Operating Earnings - Corporate (216.6)Pre-Tax Operating Earnings - PFG 1,574.2
Pre-Tax Net Realized Capital Gains, As Adjusted 4.6Pre-Tax Other Adjustments (3.1)*
Certain Other Adjustments Related to Equity Method Investments and Noncontrolling Interest (57.8)Income Before Income Taxes $1,521.0* Exited group medical insurance business
Principal Asia Combined Net Revenue (at PFG share) 31-Dec-12 31-Dec-13 31-Dec-14 31-Dec-15
Principal Asia Combined Net Revenue (at PFG Share) $104.4 $117.6 $133.0 $181.2 Less: Principal Asia Combined Operating Expenses (at PFG Share) 88.2 100.1 109.7 144.6 Principal Asia Pre-Tax Operating Earnings $16.2 $17.5 $23.3 $36.6
Twelve months ended,