Principal Components Analysis to Summarize Microarray Experiments
12
PRINCIPAL COMPONENTS ANALYSIS TO SUMMARIZE MICROARRAY EXPERIMENTS: APPLICATION TO SPORULATION TIME SERIES Soumya Raychaudhuri * , Joshua M. Stuart * , and Russ B. Altman Ψ Stanford Medical Informatics Stanford University, 251 Campus Drive, MSOB X-215, Stanford CA 94305-5479 {sxr, stuart, altman} @smi.stanford.edu A series of microarray experiments produces observations of differential expression for thousands of genes across multiple conditions. It is often not clear whether a set of experiments are measuring fundamentally different gene expression states or are measuring similar states created through different mechanisms. It is useful, therefore, to define a core set of independent features for the expression states that allow them to be compared directly. Principal components analysis (PCA) is a statistical technique for determining the key variables in a multidimensional data set that explain the differences in the observations, and can be used to simplify the analysis and visualization of multidimensional data sets. We show that application of PCA to expression data (where the experimental conditions are the variables, and the gene expression measurements are the observations) allows us to summarize the ways in which gene responses vary under different conditions. Examination of the components also provides insight into the underlying factors that are measured in the experiments. We applied PCA to the publicly released yeast sporulation data set (Chu et al. 1998). In that work, 7 different measurements of gene expression were made over time. PCA on the time-points suggests that much of the observed variability in the experiment can be summarized in just 2 components—i.e. 2 variables capture most of the information. These components appear to represent (1) overall induction level and (2) change in induction level over time. We also examined the clusters proposed in the original paper, and show how they are manifested in principal component space. Our results are available on the internet at http://www.smi.stanford.edu/projects/helix/PCArray. 1 Introduction The study of gene expression has been greatly facilitated by DNA microarray technology (Schena et al. 1995). DNA microarrays measure the expression of thousands of genes simultaneously, and have been described elsewhere (Chee et al. 1996, Chen et al. 1998, Duggan et al. 1999, Schena et al. 1995). The anticipated flood of biological information produced by these experiments will open new doors into genetic analysis (Lander 1999). Expression patterns have already been used for a variety of inference tasks. For example, microarray data has been used to identify gene clusters based on co-expression (Eisen et al. 1998, Michaels et al. 1998), define metrics that measure a gene’s involvement in a particular cellular event or * These authors contributed equally to this communication. Ψ To whom correspondences should be addressed. Pacific Symposium on Biocomputing 5:452-463 (2000)
Transcript of Principal Components Analysis to Summarize Microarray Experiments
PRINCIPAL COMPONENTS ANALYSIS TO SUMMARIZE
MICROARRAY EXPERIMENTS:APPLICATION TO SPORULATION TIME SERIES
Soumya Raychaudhuri*, Joshua M. Stuart*, and Russ B. AltmanΨ
Stanford Medical InformaticsStanford University, 251 Campus Drive, MSOB X-215, Stanford CA 94305-5479
{sxr, stuart, altman} @smi.stanford.edu
A series of microarray experiments produces observations of differential expression forthousands of genes across multiple conditions. It is often not clear whether a set ofexperiments are measuring fundamentally different gene expression states or are measuringsimilar states created through different mechanisms. It is useful, therefore, to define a core setof independent features for the expression states that allow them to be compared directly.Principal components analysis (PCA) is a statistical technique for determining the keyvariables in a multidimensional data set that explain the differences in the observations, andcan be used to simplify the analysis and visualization of multidimensional data sets. We showthat application of PCA to expression data (where the experimental conditions are thevariables, and the gene expression measurements are the observations) allows us tosummarize the ways in which gene responses vary under different conditions. Examination ofthe components also provides insight into the underlying factors that are measured in theexperiments. We applied PCA to the publicly released yeast sporulation data set (Chu et al.1998). In that work, 7 different measurements of gene expression were made over time. PCAon the time-points suggests that much of the observed variability in the experiment can besummarized in just 2 components—i.e. 2 variables capture most of the information. Thesecomponents appear to represent (1) overall induction level and (2) change in induction levelover time. We also examined the clusters proposed in the original paper, and show how theyare manifested in principal component space. Our results are available on the internet athttp://www.smi.stanford.edu/projects/helix/PCArray.
1 Introduction
The study of gene expression has been greatly facilitated by DNA microarraytechnology (Schena et al. 1995). DNA microarrays measure the expression ofthousands of genes simultaneously, and have been described elsewhere (Chee et al.1996, Chen et al. 1998, Duggan et al. 1999, Schena et al. 1995). The anticipatedflood of biological information produced by these experiments will open new doorsinto genetic analysis (Lander 1999). Expression patterns have already been used fora variety of inference tasks. For example, microarray data has been used to identifygene clusters based on co-expression (Eisen et al. 1998, Michaels et al. 1998),define metrics that measure a gene’s involvement in a particular cellular event or
* These authors contributed equally to this communication.Ψ To whom correspondences should be addressed.
Pacific Symposium on Biocomputing 5:452-463 (2000)
process (Spellman et al. 1998), predict regulatory elements (Brazma et al. 1998),and reverse engineer transcription networks (D’Haeseleer et al. 1999, Liang et al.1998). The success of these efforts relies on the integrity of the expression data.Both experimental noise and hidden dependencies among a set of experimentalconditions may confound the inferential process. It is non-trivial to eliminate eitherof these complicating factors. One particular problem is that different experimentsthat seem different because of their biological context (heat shock, starvation, oroxygen deprivation, for example) may actually be identical or very similar in termsof the gene expression state that results. In such cases, a naïve analysis mightassociate some genes too tightly because multiple redundant measurements. Thus,it may be beneficial to pre-process the data before analysis in order to identify theindependent information content of different experimental conditions.
Principal Components Analysis (PCA) is an exploratory multivariate statisticaltechnique for simplifying complex data sets (Basilevsky 1994, Everitt & Dunn1992, Pearson 1901). Given m observations on n variables, the goal of PCA is toreduce the dimensionality of the data matrix by finding r new variables, where r isless than n. Termed principal components, these r new variables together accountfor as much of the variance in the original n variables as possible while remainingmutually uncorrelated and orthogonal. Each principal component is a linearcombination of the original variables, and so it is often possible to ascribe meaningto what the components represent. Principal components analysis has been used ina wide range of biomedical problems, including the analysis of microarray data insearch of outlier genes (Hilsenbeck et al. 1999) as well as the analysis of other typesof expression data (Vohradsky et al. 1997, Craig et al. 1997).
DNA microarray data sets are now appearing in the published literature, andmost initial analyses have focused on characterizing the waveform of geneepxression over time, and in clustering benes based on this waveform or otherfeatures. When clustering genes based on expression information, it can beimportant to determine if the experiments have independent information or arehighly correlated. Chu et al (1998) measured gene expression at seven time pointsduring sporulation in yeast, and in two mutant yeast strains. They identified 7clusters of key genes grouped based on the approximate times during whichmembers are up-regulated.
A PCA analysis of DNA microarray data can consider the genes as variables orthe experiments as variables or both. When genes are variables, the analysis createsa set of “principal gene components” that indicate the features of genes that bestexplain the experimental responses they produce. When experiments are thevariables, the analysis creates a set of “principal experiment components” thatindicate the features of the experimental conditions that best explain the genebehaviors they elicit. When both experiments and genes are analyzed together,there is a combination of these affects, the utility of which remains to be explored.This report focuses on consideration of the experiments as variables. We first create
Pacific Symposium on Biocomputing 5:452-463 (2000)

a covariance matrix to measure how each experiment contributes information to thedata set. We then summarize the information compactly with the principalexperimental components. Finally, we show that this analysis clarifies therelationship between previously reported clusters and is a starting point forexamining the detailed relationships and differences between genes.
2 Methods
We start with a matrix of expression data, A, where each row corresponds to adifferent gene and each column corresponds to one of several different conditions towhich the cells were exposed. The ait entry of the matrix contains the ith gene’srelative expression ratio with respect to a control population under condition t. Tomoderate the influence of gene expression ratios above and below one, we appliedthe natural log transform to all ratios (Eisen et al. 1998). Up-regulated genes thushave a positive log expression ratio, while down-regulated genes have a negativelog expression ratio. We did not normalize the conditions to norm 0, variance 1 assometimes recommended when attempting PCA on measurements that are not on acomparable scale (Everitt & Dunn 1992). The log ratios included in the analysis arecomparable, no further preprocessing was necessary.
To compute the principal components, the n eigenvalues and theircorresponding eigenvectors are calculated from the nxn covariance matrix ofconditions. Each eigenvector defines a principal component. A component can beviewed as a weighted sum of the conditions, where the coefficients of theeigenvectors are the weights. The projection of gene i along the axis defined by thejth principal component is:
∑=
=n
ttjitij vaa
1
’
Where vtj is the tth coefficient for the jth principal component; ait is the expressionmeasurement for gene i under the tth condition. A’ is the data in terms of principalcomponents. Since V is an orthonormal matrix, A’ is a rotation of the data from theoriginal space of observations to a new space with principal component axes.
The variance accounted for by each of the components is its associatedeigenvalue; it is the variance of a component over all genes. Consequently, theeigenvectors with large eigenvalues are the ones that contain most of theinformation; eigenvectors with small eigenvalues are uninformative.
Determining r, the true dimensionality of the data, and eliminating noisycomponents is often ad hoc and many heuristics exist. Eliminating low variancecomponents, while reducing noise, also discards information. We chose to use onecriterion that discards all components accounting for less than (70/n)% of theoverall variability (Everitt & Dunn 1992). The MatlabTM software package (TheMathWorks, Inc., Natick, MA) was used to conduct most of our calculations.
Pacific Symposium on Biocomputing 5:452-463 (2000)
3 Results
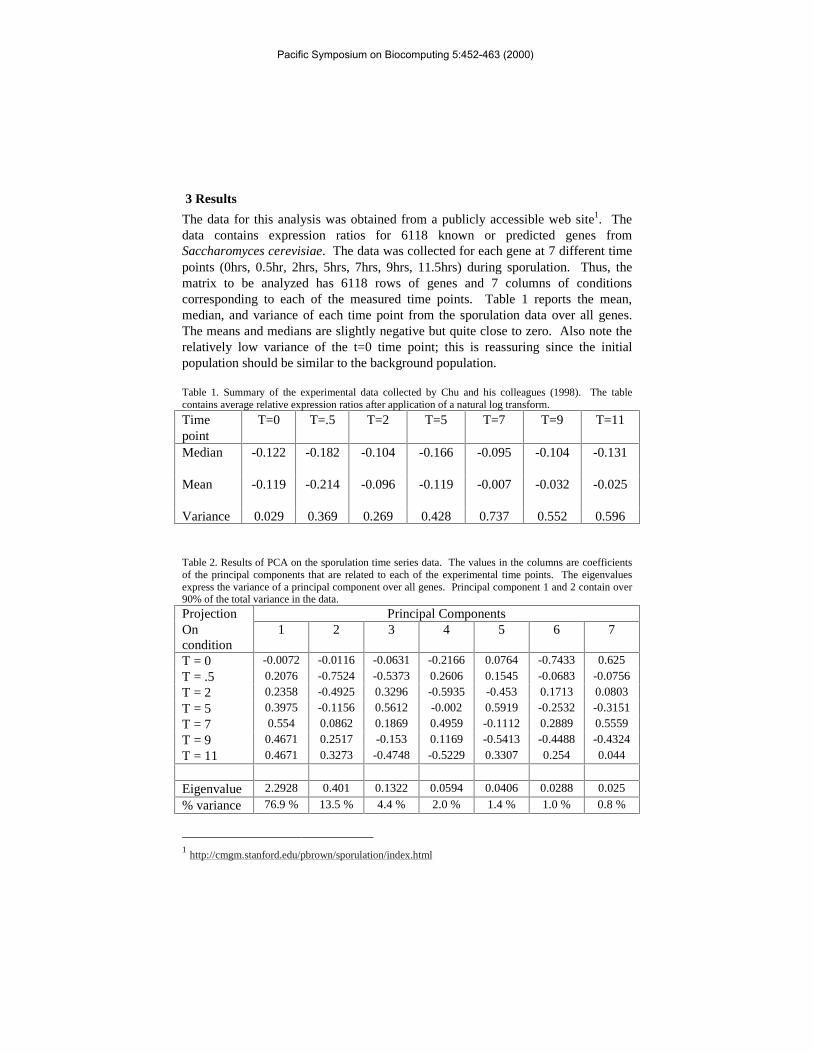
The data for this analysis was obtained from a publicly accessible web site1. Thedata contains expression ratios for 6118 known or predicted genes fromSaccharomyces cerevisiae. The data was collected for each gene at 7 different timepoints (0hrs, 0.5hr, 2hrs, 5hrs, 7hrs, 9hrs, 11.5hrs) during sporulation. Thus, thematrix to be analyzed has 6118 rows of genes and 7 columns of conditionscorresponding to each of the measured time points. Table 1 reports the mean,median, and variance of each time point from the sporulation data over all genes.The means and medians are slightly negative but quite close to zero. Also note therelatively low variance of the t=0 time point; this is reassuring since the initialpopulation should be similar to the background population.
Table 1. Summary of the experimental data collected by Chu and his colleagues (1998). The tablecontains average relative expression ratios after application of a natural log transform.
Timepoint
T=0 T=.5 T=2 T=5 T=7 T=9 T=11
Median -0.122 -0.182 -0.104 -0.166 -0.095 -0.104 -0.131
Mean -0.119 -0.214 -0.096 -0.119 -0.007 -0.032 -0.025
Variance 0.029 0.369 0.269 0.428 0.737 0.552 0.596
Table 2. Results of PCA on the sporulation time series data. The values in the columns are coefficientsof the principal components that are related to each of the experimental time points. The eigenvaluesexpress the variance of a principal component over all genes. Principal component 1 and 2 contain over90% of the total variance in the data.
Projection Principal ComponentsOncondition
1 2 3 4 5 6 7
T = 0 -0.0072 -0.0116 -0.0631 -0.2166 0.0764 -0.7433 0.625
T = .5 0.2076 -0.7524 -0.5373 0.2606 0.1545 -0.0683 -0.0756
T = 2 0.2358 -0.4925 0.3296 -0.5935 -0.453 0.1713 0.0803
T = 5 0.3975 -0.1156 0.5612 -0.002 0.5919 -0.2532 -0.3151
T = 7 0.554 0.0862 0.1869 0.4959 -0.1112 0.2889 0.5559
T = 9 0.4671 0.2517 -0.153 0.1169 -0.5413 -0.4488 -0.4324
T = 11 0.4671 0.3273 -0.4748 -0.5229 0.3307 0.254 0.044
Eigenvalue 2.2928 0.401 0.1322 0.0594 0.0406 0.0288 0.025
% variance 76.9 % 13.5 % 4.4 % 2.0 % 1.4 % 1.0 % 0.8 %
1 http://cmgm.stanford.edu/pbrown/sporulation/index.html
Pacific Symposium on Biocomputing 5:452-463 (2000)
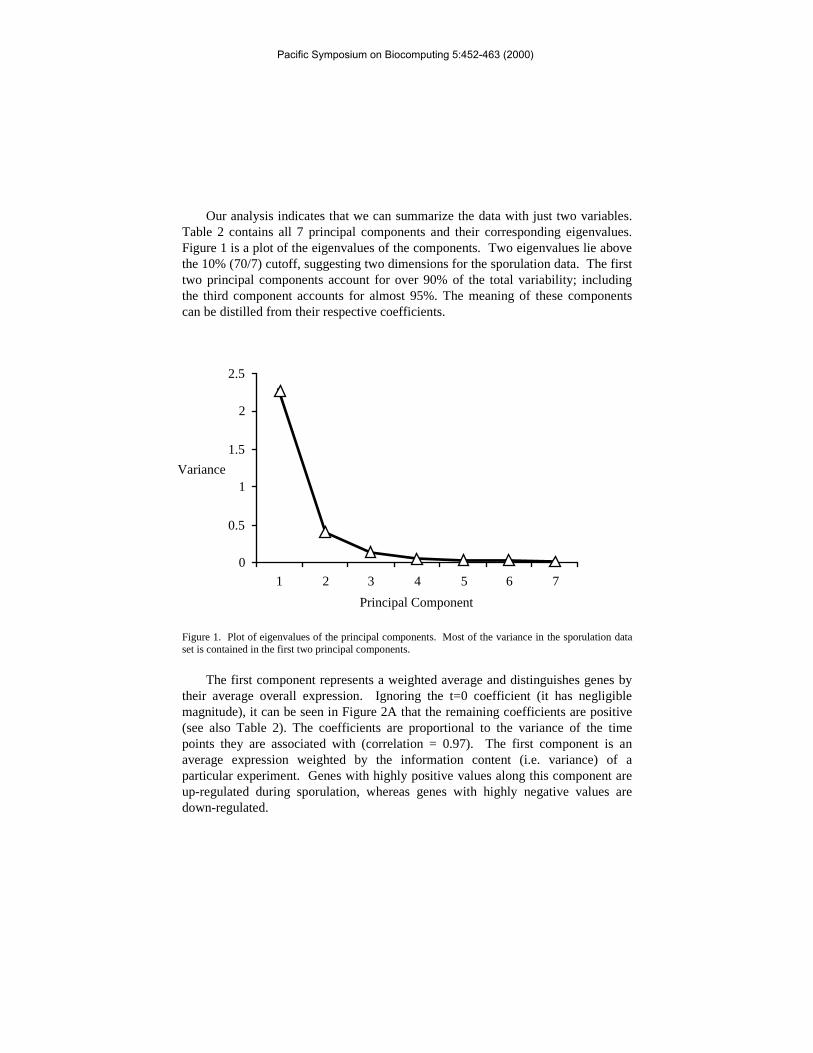
Our analysis indicates that we can summarize the data with just two variables.Table 2 contains all 7 principal components and their corresponding eigenvalues.Figure 1 is a plot of the eigenvalues of the components. Two eigenvalues lie abovethe 10% (70/7) cutoff, suggesting two dimensions for the sporulation data. The firsttwo principal components account for over 90% of the total variability; includingthe third component accounts for almost 95%. The meaning of these componentscan be distilled from their respective coefficients.
Figure 1. Plot of eigenvalues of the principal components. Most of the variance in the sporulation dataset is contained in the first two principal components.
The first component represents a weighted average and distinguishes genes bytheir average overall expression. Ignoring the t=0 coefficient (it has negligiblemagnitude), it can be seen in Figure 2A that the remaining coefficients are positive(see also Table 2). The coefficients are proportional to the variance of the timepoints they are associated with (correlation = 0.97). The first component is anaverage expression weighted by the information content (i.e. variance) of aparticular experiment. Genes with highly positive values along this component areup-regulated during sporulation, whereas genes with highly negative values aredown-regulated.
0
0.5
1
1.5
2
2.5
1 2 3 4 5 6 7
Principal Component
Variance
Pacific Symposium on Biocomputing 5:452-463 (2000)
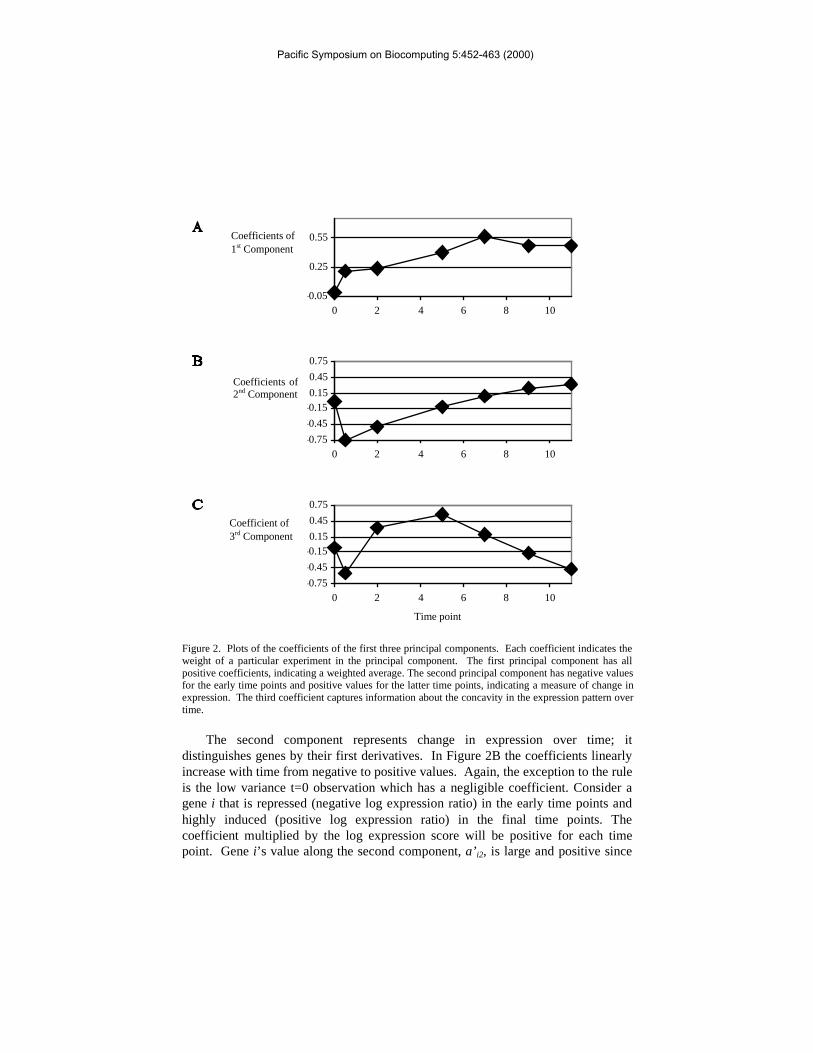
Figure 2. Plots of the coefficients of the first three principal components. Each coefficient indicates theweight of a particular experiment in the principal component. The first principal component has allpositive coefficients, indicating a weighted average. The second principal component has negative valuesfor the early time points and positive values for the latter time points, indicating a measure of change inexpression. The third coefficient captures information about the concavity in the expression pattern overtime.
The second component represents change in expression over time; itdistinguishes genes by their first derivatives. In Figure 2B the coefficients linearlyincrease with time from negative to positive values. Again, the exception to the ruleis the low variance t=0 observation which has a negligible coefficient. Consider agene i that is repressed (negative log expression ratio) in the early time points andhighly induced (positive log expression ratio) in the final time points. Thecoefficient multiplied by the log expression score will be positive for each timepoint. Gene i’s value along the second component, a’ i2, is large and positive since
-0.75
-0.45
-0.150.15
0.45
0.75
0 2 4 6 8 10
Time of Measurementof Condition
Projection of 3rd Principal Component
onto Experimental
Condition
-0.75
-0.45
-0.150.15
0.45
0.75
0 2 4 6 8 10
Projection of 2nd Principal Component
onto Experimental
Condition
-0.05
0.25
0.55
0 2 4 6 8 10
Projection of 1st Principal Component
onto Experimental
Condition
Coefficients of1st Component
Coefficients of2nd Component
Coefficient of 3rd Component
Time point
Pacific Symposium on Biocomputing 5:452-463 (2000)
every product in the sum is positive. Alternatively the second component for a genethat is induced early and repressed later will be large and negative. The expressionscores are multiplied with coefficients of the opposite sign, yielding a large negativescore. This component is positive for genes whose relative expression increasesthrough time, and negative for those whose relative expression decreases; itmeasures positive trend in expression.
The third component measures concavity—notice the parabolic nature of thecoefficients in Figure 2C (again ignore the negligible t=0 coefficient). Consider agene i that is expressed at background level in the early and middle time points, butinduced in the final time points—it has an expression profile that is concave up.Since the only non-zero expression levels occur at the final time points, only thelater negative coefficients contribute to the sum, a’ i3. Consequently this gene willhave a negative third component. Alternatively consider a gene with a similarprofile, but that is expressed in the middle time points also (concave down); in thiscase the middle time points with positive coefficients increase the score along thiscomponent. The score of the second gene will be less negative.
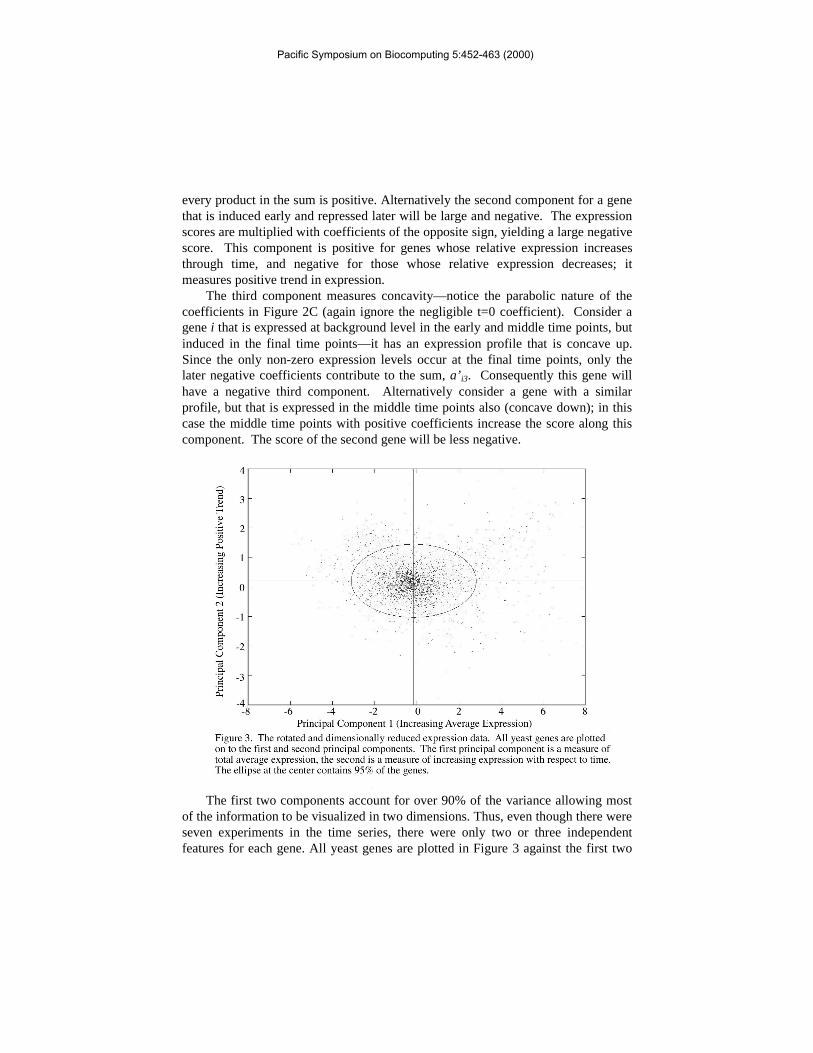
The first two components account for over 90% of the variance allowing mostof the information to be visualized in two dimensions. Thus, even though there wereseven experiments in the time series, there were only two or three independentfeatures for each gene. All yeast genes are plotted in Figure 3 against the first two
Pacific Symposium on Biocomputing 5:452-463 (2000)

principal components; an ellipse enclosing 95% of the genes is drawn to distinguishbetween high and low variance genes. The genes appear to be distributed in aunimodal distribution. The data has been made available as a VMRL source athttp://www.smi.stanford.edu/projects/helix/PCArray; the user can quickly navigatethrough two or three dimensional component space. Each data point is linked to itscorresponding entry in the Saccharomyces Genome Database (Cherry et al. 1998).
The transcription factor NDT80 is key to the induction of many genesexpressed in the middle of the sporulation process (Xu et al. 1995). The originaldataset also includes measurements of gene expression for a NDT80 knockoutmicroarray experiment and an ectopic NDT80 over-expression experiment.Including these extra experiments in the analysis offers an opportunity to test therobustness of our analysis. The coefficients for the first two components areconsistent with our understanding of the phenotype of these cells. In particular, theNDT80 knockout experiment traps cells in an early stage of sporulation;correspondingly, the coefficients in the first two components are most similar to thet=2 hour coefficients from the sporulation time series. Similarly, the NDT80 over-expression data yields coefficients most similar to the t=11 hour coefficients. SinceNDT80 is a sporulation promoting factor, the effects of over-expression may causea phenotype that mimics a late time point.
4 Discussion
Our results with the sporulation data confirm that PCA can find a reduced set ofvariables that are useful for understanding the experiments. The application of PCAto time series is somewhat controversial because of the problems with uneven timeintervals and the dependencies between data points. In this case, PCA identifiesbasic temporal patterns, such as magnitude, change, and the concavity of overallexpression as the important features that characterize genes. Application of PCA(unpublished result) to the publicly available cell division cycle data2 also revealsthat PCA can also identify periodic patterns in time series data (Spellman et al.1998). For example, the cell cycle data reveals a 110 min period for the cdc15synchronized experiment, consistent with the cell cycle duration.
Reduction of dimensionality in the sporulation data aids in data visualization;we can immediately see the unimodal quality of the sporulation data (Figure 3).The unimodal distribution of expression in the most informative two dimensionssuggests the genes do not fall into well-defined clusters.
2 http://genome-www.stanford.edu/cellcycle
Pacific Symposium on Biocomputing 5:452-463 (2000)

Pacific Symposium on Biocomputing 5:452-463 (2000)

In the initial presentation of the data the investigators used clusteringtechniques to identify several gene classes relevant to sporulation: “metabolic”,“early I”, “early II”, “middle early”, “middle”, “middle late”, and “late” (Chu et al.1998). For each class a canonical expression profile was calculated from a set ofsample genes. These classes are plotted in Figure 4A; each ellipse in the plotrepresents a class. The location and dimensions of each ellipse was calculated fromthe average and standard deviation of the sample genes of the class. They are drawnso that approximately 68% (+/- 1SD in both dimensions) of the genes in the classare enclosed; in Figure 4B they are drawn to enclose 95% (+/- 1.96SD) of the genesin the class.
An approximate understanding of a class’s expression dynamic can be obtainedquickly by looking at its location in space. For example, genes occupying the lowerright quadrant (high PCA1, low PCA2) are up-regulated early but return tobackground later in sporulation. These genes have expression levels that decreaseover time but maintain a high overall expression level relative to the control.Examples of these genes are ZIP1 (synaptonemal complex formation), IME2(meiosis regulator), and HOP1 (homologous chromosome pairing), classified as“early I” or ”metabolic” genes.
Exploring other quadrants can rapidly identify genes of potential interest.Genes with low overall expression levels that decrease over the course ofsporulation can be found in the lower left quadrant. Many genes involved inmetabolic or catabolic processes such as ERG6 (ergosterol synthesis), FBP1(gluconeogenesis), and SAM2 (methionine biosynthesis) are found in this quadrant.Genes in the upper left are initially repressed and return to normal. Many of thesegenes are involved in protein synthesis. Examples include ISF1 (RNA splicing),BAP3 (valine transporter), and DBP3 (RNA helicase). The early repression maycorrespond with the cells’ initial cessation of protein synthesis and growth; therenewed expression may function to pack the maturing spores with translationmachinery (Chu et al. 1998).
Principal components analysis is often used as a preprocessing step toclustering (Everitt 1993). However, our work suggests that clustering genes withcertain expression data sets may not be appropriate. In Figure 4A, the genes are notlocated in clusters - rather they are spread throughout this space. Focusing on theupper right quadrant in Figure 4B, it can be seen that the clusters presented in theoriginal publication have a considerable amount of overlap. For unimodal or othersmoothly varying distributions, distinctions drawn by clustering methodologiesmaybe more confusing than helpful. In particular, these clusters highlight thepotential biases used in analyzing clusters using traditional cognitive categories.This observation corroborates the original investigators’ finding that the clusters aresomewhat arbitrary; many genes were found to have high correlation with multiple
Pacific Symposium on Biocomputing 5:452-463 (2000)

cluster representatives (Chu et al. 1998). Perhaps it is more useful to determine theclosest neighbors of a gene, rather than to seek well defined clusters.
When we choose the largest principal components, we lose information aboutexperiments that explains the remaining variance in the data (5% of the sporulationvariability is not explained by the first three components). However, our analysisidentifies the variables that should be used for overall classification of genes, andthereby allows investigators to focus on the other, more subtle, variables whosevalues may be helpful in understanding the differences in gene expression underdifferent conditions.
Acknowledgements
The authors wish to thank Susan Holmes for many thoughtful discussions, andRaynee Chiang for her assistance in web development and visualization. S.R. issupported by NIH training grant GM-07365; J.M.S. is supported by NIH traininggrant LM-07033. This work was also supported by NIHLM06244, NSF DBI-9600637 and a grant from the Burroughs-Wellcome Foundation.
References
A. Basilevsky. Statistical Factor Analysis and Related Methods, Theory andApplications. 1994 John Wiley & Sons, New York, NY.
A. Brazma, I. Jonassen, J. Vilo, and E. Ukkonen. “Predicting gene regulatoryelements in silico on a genomic scale” Genome Research 8, 1202-1215 (1998)
M. Chee, R. Yang, E. Hubbel, A. Berno, X. C. Huang, D. Stern, J. Winkler, D.J.Lockhart, M.S. Morris,and S.P.A. Fodor. “Accessing Genetic Information withHigh-Density DNA Arrays” Science 274, 610-614 (1996)
J.J.W. Chen, R. Wu, P.-C. Yang, J.-Y. Huang, Y.-P. Sher, M.-H. Han, W.-C. Kao,P.-J. Lee, T.F. Chiu, F.Chang, Y.-W. Chu, C.-W. Wu, and K. Peck. “Profilingexpression patterns and isolating differentially expressed genes by cDNAmicroarray system with colorimetry detection” Genomics 51, 313-324 (1998)
J.M. Cherry, C. Adler, C. Ball, S.A. Chervitz, S.S. Dwight, E.T. Hester, Y. Jia, G.Juvik, T.Y. Roe, M. Schroeder, S. Weng, and D. Botstein. “SGD :Saccharomyces Genome Database” Nucleic Acids Research 26, 73-39 (1998)
S. Chu, J. DeRisi, M. Eisen, J. Mulholland, D. Botstein, P.O. Brown, and I.Herskowitz. “The transcriptional program of sporulation in budding yeast”.Science 282, 699-705 (1998)
J.C. Craig, J.H. Eberwine, J.A. Calvin, B. Wlodarczyk, G.D. Bennett, R. H. Finnell.“Developmental expression of morphoregulatory genes in the mouse embryo:an analytical approach using a novel technology.” Biochem Mol Med 60(2),81-91 (1997).
Pacific Symposium on Biocomputing 5:452-463 (2000)
P. D’Haeseleer, X. Wen, S. Fuhrman, and R. Somogyi. “Linear modeling of mRNAexpression levels during CNS development and injury” Pacific Symposium onBiocomputing 4, 41-52 (1999)
D.J. Duggan, M. Bittner, Y. Chen, P. Meltzer, and J.M. Trent. “Expression profilingusing cDNA microarrays” Nature Genetics 21, 10-14, (1999)
M.B. Eisen, P.T. Spellman, P.O. Brown, and D. Botstein. “Cluster analysis anddisplay of genome-wide expression patterns” Proc Natl Acad Sci U S A 95,14863-8 (1998)
B.S. Everitt. Cluster Analysis. 1993 John Wiley & Sons, New York, NY.B.S. Everitt and G. Dunn. Applied Multivariate Data Analysis. 1992 Oxford
University Press, New York, NY.S.G. Hilsenbeck, W.E. Friedrichs, R. Schiff, P. O'Connell, R.K. Hansen, C. K.
Osborne, S.A.W. Fuqua. "Statistical Analysis of Array Expression Data asApplied to the Problem of Tamoxifen Resistance" J Natl Cancer Institute 91,453-459 (1999)
E.S. Lander. “Array of hope” Nature Genetics 21, 3-4 (1999)S. Liang, S. Fuhrman, R. Somogyi. “REVEAL, a general reverse engineering
algorithm for inference of genetic network architectures” Pacific Symposium onBiocomputing 3, 18-29 (1998)
G.S. Michaels, D.B. Carr, M. Askenazi, S. Fuhrman, X. Wen, and R. Somogyi.“Cluster analysis and data visualization of large-scale gene expression data”Pacific Symposium on Biocomputing 3, 42-53 (1998)
K. Pearson, "On Lines and Planes of Closest Fit to Systems of Points in Space,"Phil. Mag. 2, 559-572 (1901)
M. Schena, D. Shalon, R.W. Davis, and P.O. Brown. “Quantitative monitoring ofgene expression patterns with a complementary DNA microarray” Science 270,467-470 (1995)
P.T. Spellman, G. Sherlock, M.Q. Zhang, V.R. Iyer, K. Anders, M.B. Eisen, P.O.Brown, D. Botstein, and B. Fucher. “Comprehensive Identification of CellCylce-regulated genes of the yeast saccharomyces cerevisiae by microarrayhybridization.” Molecular Biology of the Cell 9, 3273-3297 (1998)
J. Vohradsky, X.M. Li, C.J. Thompson. “Identification of procaryoticdevelopmental stages by statistical analyses of two-dimensional gel patterns.”Electrophoresis 18(8), 1418-28 (1997).
X. Wen, S. Fuhrman, G.S. Michaels, D.B. Carr, S. Smith, J. L. Barker, R. Somogyi."Large-scale temporal gene expression mapping of central nervous systemdevelopment" Proc Natl Acad Sci 95, 334-339 (1998).
L. Xu, M. Ajimura, R. Padmore, C. Klein, and N. Kleckner. “NDT80, a meiosis-specific gene required for exit from pachytene in Saccharomyces cerevisiae”Mol Cell Biol 15, 6572-6581 (1995)
Pacific Symposium on Biocomputing 5:452-463 (2000)