CENTURY II VARIABLE UNIVERSAL LIFE PROSPECTUS INDIVIDUAL FLEXIBLE
Principal Benefit Variable Universal Life II
ProspectusMay 1, 20122016


MM 2458-14 04/2016 Page 1 of 2 F445PS-16
PRIVACY NOTICE
This Notice is provided on behalf of the following
companies of the Principal Financial Group:
Principal Life Insurance Company Principal National Life Insurance Company
Principal Securities, Inc. Principal Trust Company
Principal Global Investors, LLC Principal Global Investors Trust
Principal Real Estate Investors, LLC Principal Commercial Acceptance, LLC
Principal Commercial Funding, LLC Principal Green Fund I, LP / PGF GP, LLC
Principal Green Property Fund Employees II, LLC Principal Real Estate Debt Fund I, LP
Principal Real Estate Debt Fund, GP, LLC Edge Asset Management, Inc. / Spectrum Asset Management, Inc.
Principal Variable Contracts Funds, Inc. Principal Life Insurance Company Variable Life Separate Account
Principal National Life Insurance Company Variable Life Separate Account Principal Life Insurance Company Separate Account B Principal Funds, Inc. / Principal Funds Distributor, Inc.
Employers Dental Services, Inc. / Principal Dental Services, Inc. First Dental Health
PROTECTING YOUR PRIVACY This Notice is required by law. It tells how we handle personal information. This Notice applies to: � people who own or apply for our products or services
for personal use. � employee benefit plan participants and beneficiaries.
Please note that in this Notice, “you” refers to only these people. The Notice does not apply to an employer plan sponsor or group policyholder.
WE PROTECT INFORMATION WE COLLECT ABOUT YOU We follow strict standards to safeguard personal information. These standards include limiting access to data and regularly testing our security technology.
HOW WE COLLECT INFORMATION We collect data about you as we do business with you. Some of the sources of this data are as follows: � Information we obtain when you apply or enroll for products or services. You may provide facts such as your name; address; Social Security number; financial status; and, when applicable, health history. � Information we obtain from others. This may include claim reports, medical records, when applicable, credit reports, property values and similar data. � Information we obtain through our transactions and experience with you. This includes your claims history, payment and investment records, and account values and balances. � Information we obtain through the Internet. This includes data from online forms you complete. It also includes data we collect when you visit our websites.
HOW WE SHARE INFORMATION We may share personal information about you or about former customers, plan participants or beneficiaries among companies within the Principal Financial Group for several reasons, including: � to assist us in servicing your account; � to help design and improve products; � to protect against potential identity theft or
unauthorized transactions; � in response to a subpoena or for other legal purposes; � to prevent fraud; � to comply with inquiries from government agencies or
other regulators; � with others that service your account, or that perform
services on our behalf; � with others with whom we may have joint marketing
agreements. These include financial services companies (such as other insurance companies, banks or mutual fund companies); and � with your consent, at your request or as allowed by law.
MEDICAL INFORMATION
We do not share medical information among companies of the Principal Financial Group or with others except:
� when needed to service your policies, accounts, claims or contracts;
� when laws protecting your privacy permit it; or � when you consent.

MM 2458-14 04/2016 Page 2 of 2 F456PS-16
ACCURACY OF INFORMATION
We strive for accurate records. Please tell us if you receive any incorrect materials from us. We will make the appropriate changes.
COMPANIES WITHIN THE PRINCIPAL FINANCIAL GROUP
Several companies within the Principal Financial Group are listed at the top of this Notice. The companies of the Principal Financial Group are leading providers of retirement savings, investment, and insurance products.
MORE INFORMATION
You may write to us if you have questions about our Privacy Notice. Contact our Privacy Officer at P.O. Box 14582, Des Moines, Iowa 50306-3582.
To contact us, please call 1-800-986-3343.
Receipt of this notice does not mean your application has been accepted.
We may change our privacy practices at times. We will give you a revised notice when required by law.
Our privacy practices comply with all applicable laws. If a state’s privacy laws are more restrictive than those stated in this Notice, we comply with those laws.
Your agent, broker, registered representative, consultant or advisor may have a different privacy policy.

BB 9338-13 04/2016 Page 1 of 2 F445CA-13
CALIFORNIA PRIVACY NOTICE This Notice is provided on behalf of the following
companies of the Principal Financial Group: Principal Life Insurance Company
Principal National Life Insurance Company Principal Securities, Inc. Principal Trust Company
Principal Global Investors, LLC Principal Global Investors Trust
Principal Real Estate Investors, LLC Principal Commercial Acceptance, LLC
Principal Commercial Funding, LLC Principal Green Fund I, LP / PGF GP, LLC
Principal Green Property Fund Employees II, LLC Principal Real Estate Debt Fund I, LP
Principal Real Estate Debt Fund, GP, LLC Edge Asset Management, Inc. / Spectrum Asset Management, Inc.
Principal Variable Contracts Funds, Inc. Principal Life Insurance Company Variable Life Separate Account
Principal National Life Insurance Company Variable Life Separate Account Principal Life Insurance Company Separate Account B Principal Funds, Inc. / Principal Funds Distributor, Inc.
Employers Dental Services, Inc. / Principal Dental Services, Inc. First Dental Health
PROTECTING YOUR PRIVACY This Notice is required by law. It tells how we handle personal information. This Notice applies to individual residents of California who: � own or apply for our products or services for personal
use. � are employee benefit plan participants and
beneficiaries. Please note that in this Notice, “you” refers to only these people. The Notice does not apply to an employer plan sponsor or group policyholder.
WE PROTECT INFORMATION WE COLLECT ABOUT YOU We follow strict standards to protect personal information. These standards include limiting access to data and regularly testing our security technology.
HOW WE COLLECT INFORMATION We collect data about you as we do business with you. Some of the sources of this data are as follows: � Information we obtain when you apply or enroll for products or services. You may provide facts such as your name; address; Social Security number; financial status; and, when applicable, health history. � Information we obtain from others. This may include claim reports, medical records, credit reports and similar data. � Information we obtain through our transactions and experience with you. This includes your claims history, payment and investment records, and account values.
� Information we obtain through the Internet. This includes data from online forms you complete. It also includes data we receive when you visit our websites. HOW WE SHARE INFORMATION We may share personal information about you or about former customers, plan participants or beneficiaries among companies within the Principal Financial Group or with others for several reasons, including: � to assist us in servicing your account; � to help design and improve products; � to protect against potential identity theft or
unauthorized transactions; � in response to a subpoena or for other legal purposes; � to prevent fraud; � to comply with inquiries from government agencies or other
regulators; � with others that service your account, or that perform
services on our behalf; or � with your consent, at your request or as allowed by law.
MEDICAL INFORMATION We do not share medical information among companies of the Principal Financial Group or with others except: � when needed to service your policies, accounts, claims
or contracts; � when laws protecting your privacy permit it; or � when you consent.

BB 9338-13 04/2016 Page 2 of 2 F445CA-13
ACCURACY OF INFORMATION We strive for accurate records. Please tell us if you receive any incorrect materials from us. We will make the appropriate changes.
COMPANIES WITHIN THE PRINCIPAL FINANCIAL GROUP
Several companies within the Principal Financial Group are listed at the top of this Notice. The companies of the Principal Financial Group are leading providers of retirement savings, investment, and insurance products.
MORE INFORMATION
You may write to us if you have questions about our Privacy Notice. Contact our Privacy Officer at P.O. Box 14582, Des Moines, Iowa 50306-3582.
To contact us, please call 1-800-986-3343.
Receipt of this notice does not mean your application has been accepted.
We may change our privacy practices at times. We will give you a revised notice when required by law. Our privacy practices comply with all applicable laws.
Your agent, broker, registered representative, consultant or advisor may have a different privacy policy.

PIMCO CommodityRealReturn® StrategyPortfolio
PVIT | SUMMARY PROSPECTUS
SUMMARY PROSPECTUSApril 29, 2016 (as supplemented December 7, 2016)§
Share Class: Administrative Summary Prospectus
Before you invest, you may want to review the Portfolio’s prospectus, which, assupplemented, contains more information about the Portfolio and its risks. You can find thePortfolio’s prospectus and other information about the Portfolio online at http://pvit.pimco-funds.com/FundReports.aspx. You can also get this information at no cost by calling1.800.927.4648 or by sending an email request to [email protected]. ThePortfolio’s prospectus and Statement of Additional Information, both dated April 29, 2016,as supplemented, along with the financial statements included in the Portfolio’s most recentannual report to shareholders dated December 31, 2015, are incorporated by reference intothis Summary Prospectus.
Investment ObjectiveThe Portfolio seeks maximum real return, consistent with prudentinvestment management.
Fees and Expenses of the PortfolioThis table describes the fees and expenses that you may pay if you buy andhold Administrative Class shares of the Portfolio. Overall fees and expensesof investing in the Portfolio are higher than shown because the table doesnot reflect variable contract fees and expenses.
Shareholder Fees (fees paid directly from your investment): None
Annual Portfolio Operating Expenses (expenses that you payeach year as a percentage of the value of your investment):
AdministrativeClass
Management Fees 0.74%
Distribution and/or Service (12b-1) Fees 0.15%
Other Expenses(1) 0.17%
Acquired Fund Fees and Expenses 0.11%
Total Annual Portfolio Operating Expenses(2) 1.17%
Fee Waiver and/or Expense Reimbursement(3) (0.11%)
Total Annual Portfolio Operating Expenses After Fee Waiver and/orExpenses Reimbursement(4)
1.06%
1 “Other Expenses” reflect interest expense and is based on the amount incurred duringthe Portfolio’s most recent fiscal year as a result of entering into certain investments,such as reverse repurchase agreements. Interest expense is required to be treated as aPortfolio expense for accounting purposes and is not payable to PIMCO. The amount ofinterest expense (if any) will vary based on the Portfolio’s use of such investments as aninvestment strategy.
2 Total Annual Portfolio Operating Expenses excluding interest expense is 1.00% forAdministrative Class shares.
3 PIMCO has contractually agreed to waive the Portfolio’s advisory fee and the supervisoryand administrative fee in an amount equal to the management fee and administrativeservices fee, respectively, paid by the PIMCO Cayman Commodity Portfolio I Ltd. (the“CRRS Subsidiary”) to PIMCO. The CRRS Subsidiary pays PIMCO a management fee andan administrative services fee at the annual rates of 0.49% and 0.20%, respectively, ofits net assets. This waiver may not be terminated by PIMCO and will remain in effect foras long as PIMCO’s contract with the CRRS Subsidiary is in place.
4 Total Annual Portfolio Operating Expenses After Fee Waiver and/or ExpenseReimbursement excluding interest expense is 0.89% for Administrative Class shares.
Example. The Example is intended to help you compare the cost ofinvesting in Administrative Class shares of the Portfolio with the costs ofinvesting in other mutual funds. The Example assumes that you invest$10,000 for the time periods indicated, and then redeem all your shares atthe end of those periods. The Example also assumes that your investmenthas a 5% return each year and that the Portfolio’s operating expensesremain the same. Although your actual costs may be higher or lower, theExample shows what your costs would be based on these assumptions. TheExample does not reflect fees and expenses of any variable annuity contractor variable life insurance policy, and would be higher if it did.
1 Year 3 Years 5 Years 10 Years
Administrative Class $108 $337 $585 $1,294
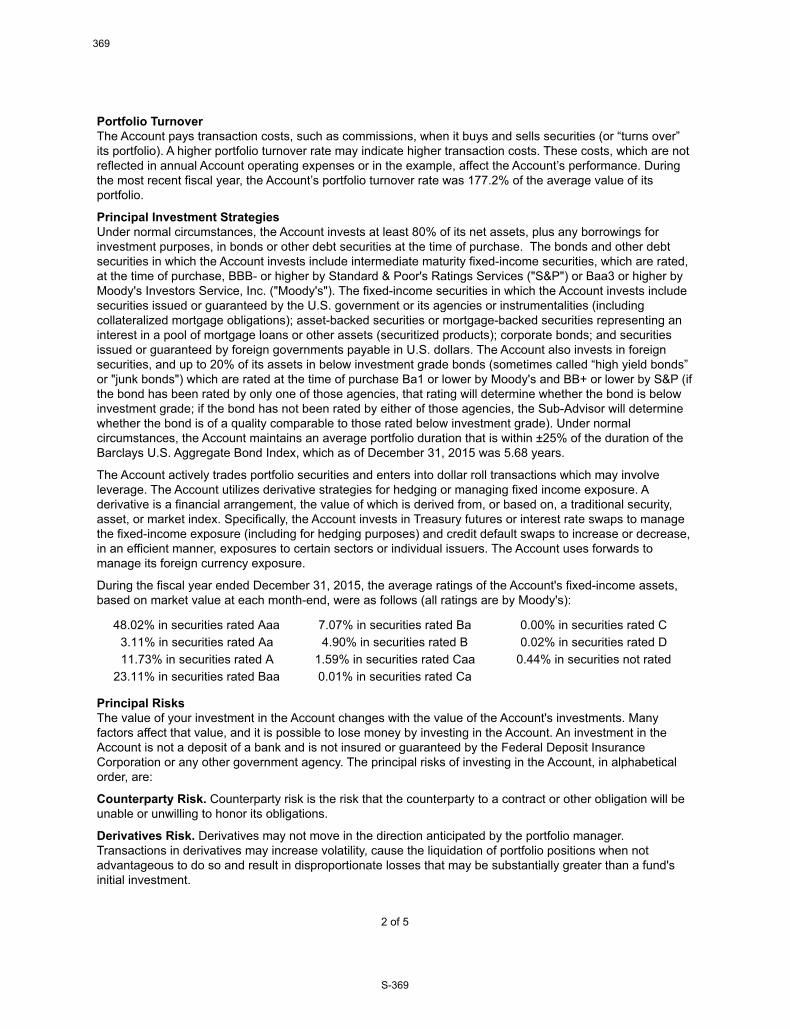
Portfolio TurnoverThe Portfolio pays transaction costs when it buys and sells securities (or“turns over” its portfolio). A higher portfolio turnover rate may indicatehigher transaction costs. These costs, which are not reflected in the AnnualPortfolio Operating Expenses or in the Example table, affect the Portfolio’sperformance. During the most recent fiscal year, the Portfolio’s portfolioturnover rate was 162% of the average value of its portfolio.
Principal Investment StrategiesThe Portfolio seeks to achieve its investment objective by investing undernormal circumstances in commodity-linked derivative instruments backed bya portfolio of inflation-indexed securities and other Fixed IncomeInstruments. “Fixed Income Instruments” include bonds, debt securities andother similar instruments issued by various U.S. and non-U.S. public- orprivate-sector entities. “Real Return” equals total return less the estimatedcost of inflation, which is typically measured by the change in an officialinflation measure. The Portfolio invests in commodity-linked derivativeinstruments, including commodity index-linked notes, swap agreements,commodity options, futures and options on futures, that provide exposureto the investment returns of the commodities markets, without investingdirectly in physical commodities. Commodities are assets that have tangibleproperties, such as oil, metals, and agricultural products. The value ofcommodity-linked derivative instruments may be affected by overall marketmovements and other factors affecting the value of a particular industry orcommodity, such as weather, disease, embargoes, or political and regulatorydevelopments. The Portfolio may also invest in common and preferredstocks as well as convertible securities of issuers in commodity-relatedindustries.
The Portfolio will seek to gain exposure to the commodity markets primarilythrough investments in leveraged or unleveraged commodity index-linkednotes, which are derivative debt instruments with principal and/or couponpayments linked to the performance of commodity indices, and throughinvestments in the PIMCO Cayman Commodity Portfolio I Ltd., a wholly-owned subsidiary of the Portfolio organized under the laws of the CaymanIslands (the “CRRS Subsidiary”). These commodity index-linked notes aresometimes referred to as “structured notes” because the terms of thesenotes may be structured by the issuer and the purchaser of the note. Thevalue of these notes will rise or fall in response to changes in the underlyingcommodity or related index of investment. The Portfolio may also gain
PIMCO CommodityRealReturn® Strategy Portfolio
. SUMMARY PROSPECTUS | PVIT2
exposure to commodity markets by investing in the CRRS Subsidiary. TheCRRS Subsidiary is advised by Pacific Investment Management CompanyLLC (“PIMCO”), and has the same investment objective as the Portfolio. Asdiscussed in greater detail elsewhere in this prospectus, the CRRSSubsidiary (unlike the Portfolio) may invest without limitation in commodity-linked swap agreements and other commodity-linked derivativeinstruments.
The derivative instruments in which the Portfolio and the CRRS Subsidiaryprimarily intend to invest are instruments linked to certain commodityindices. Additionally, the Portfolio or the CRRS Subsidiary may invest inderivative instruments linked to the value of a particular commodity orcommodity futures contract, or a subset of commodities or commodityfutures contracts. The Portfolio’s or the CRRS Subsidiary’s investments incommodity-linked derivative instruments may specify exposure tocommodity futures with different roll dates, reset dates or contract monthsthan those specified by a particular commodity index. As a result, thecommodity-linked derivatives component of the Portfolio’s portfolio maydeviate from the returns of any particular commodity index. The Portfolio orthe CRRS Subsidiary may over-weight or under-weight its exposure to aparticular commodity index, or a subset of commodities, such that thePortfolio has greater or lesser exposure to that index than the value of thePortfolio’s net assets, or greater or lesser exposure to a subset ofcommodities than is represented by a particular commodity index. Suchdeviations will frequently be the result of temporary market fluctuations,and under normal circumstances the Portfolio will seek to maintain notionalexposure to one or more commodity indices within 5% (plus or minus) ofthe value of the Portfolio’s net assets.
Assets not invested in commodity-linked derivative instruments or the CRRSSubsidiary may be invested in inflation-indexed securities and other FixedIncome Instruments, including derivative Fixed Income Instruments. Inaddition, the Portfolio may invest its assets in particular sectors of thecommodities market.
The average portfolio duration of the fixed income portion of this Portfoliowill vary based on PIMCO’s forecast for interest rates and under normalmarket conditions is not expected to exceed ten years. Duration is ameasure used to determine the sensitivity of a security’s price to changes ininterest rates. The longer a security’s duration, the more sensitive it will beto changes in interest rates. The Portfolio may invest up to 10% of its totalassets in high yield securities (“junk bonds”) rated B or higher by Moody’sInvestors Service, Inc. (“Moody’s”), or equivalently rated by Standard &Poor’s Ratings Services (“S&P”) or Fitch, Inc. (“Fitch”), or, if unrated,determined by PIMCO to be of comparable quality (except that within such10% limitation, the Portfolio may invest in mortgage-related securities ratedbelow B). The Portfolio may invest up to 30% of its total assets in securitiesdenominated in foreign currencies and may invest beyond this limit in U.S.dollar-denominated securities of foreign issuers. The Portfolio may invest upto 10% of its total assets in securities and instruments that areeconomically tied to emerging market countries (this limitation does notapply to investment grade sovereign debt denominated in the local currencywith less than 1 year remaining to maturity, which means the Portfolio mayinvest, together with any other investments denominated in foreigncurrencies, up to 30% of its total assets in such instruments). The Portfolio
will normally limit its foreign currency exposure (from non-U.S. dollar-denominated securities or currencies) to 20% of its total assets. ThePortfolio may, without limitation, seek to obtain market exposure to thesecurities in which it primarily invests by entering into a series of purchaseand sale contracts or by using other investment techniques (such as buybacks or dollar rolls). The Portfolio may also invest up to 10% of its totalassets in preferred stocks. The Portfolio may purchase and sell securities ona when-issued, delayed delivery or forward commitment basis and mayengage in short sales.
Principal RisksIt is possible to lose money on an investment in the Portfolio. Under certainconditions, generally in a market where the value of both commodity-linkedderivative instruments and fixed income securities are declining, thePortfolio may experience substantial losses. The principal risks of investing inthe Portfolio, which could adversely affect its net asset value, yield and totalreturn, are:
Interest Rate Risk: the risk that fixed income securities will decline invalue because of an increase in interest rates; a portfolio with a longeraverage portfolio duration will be more sensitive to changes in interest ratesthan a portfolio with a shorter average portfolio duration
Call Risk: the risk that an issuer may exercise its right to redeem a fixedincome security earlier than expected (a call). Issuers may call outstandingsecurities prior to their maturity for a number of reasons (e.g., declininginterest rates, changes in credit spreads and improvements in the issuer’scredit quality). If an issuer calls a security that the Portfolio has invested in,the Portfolio may not recoup the full amount of its initial investment andmay be forced to reinvest in lower-yielding securities, securities with greatercredit risks or securities with other, less favorable features
Credit Risk: the risk that the Portfolio could lose money if the issuer orguarantor of a fixed income security, or the counterparty to a derivativecontract, is unable or unwilling to meet its financial obligations
High Yield Risk: the risk that high yield securities and unrated securities ofsimilar credit quality (commonly known as “junk bonds”) are subject togreater levels of credit, call and liquidity risks. High yield securities areconsidered primarily speculative with respect to the issuer’s continuingability to make principal and interest payments, and may be more volatilethan higher-rated securities of similar maturity
Market Risk: the risk that the value of securities owned by the Portfoliomay go up or down, sometimes rapidly or unpredictably, due to factorsaffecting securities markets generally or particular industries
Issuer Risk: the risk that the value of a security may decline for a reasondirectly related to the issuer, such as management performance, financialleverage and reduced demand for the issuer’s goods or services
Liquidity Risk: the risk that a particular investment may be difficult topurchase or sell and that the Portfolio may be unable to sell illiquidsecurities at an advantageous time or price or achieve its desired level ofexposure to a certain sector. Liquidity risk may result from the lack of anactive market, reduced number and capacity of traditional marketparticipants to make a market in fixed income securities, and may bemagnified in a rising interest rate environment or other circumstances

Summary Prospectus
April 29, 2016 (as supplemented December 7, 2016) | SUMMARY PROSPECTUS .3
where investor redemptions from fixed income mutual funds may be higherthan normal, causing increased supply in the market due to selling activity
Derivatives Risk: the risk of investing in derivative instruments (such asfutures, swaps and structured securities), including liquidity, interest rate,market, credit and management risks, mispricing or valuation complexity.Changes in the value of the derivative may not correlate perfectly with, andmay be more sensitive to market events than, the underlying asset, rate orindex, and the Portfolio could lose more than the initial amount invested.The Portfolio’s use of derivatives may result in losses to the Portfolio, areduction in the Portfolio’s returns and/or increased volatility. Over-the-counter (“OTC”) derivatives are also subject to the risk that a counterpartyto the transaction will not fulfill its contractual obligations to the otherparty, as many of the protections afforded to centrally-cleared derivativetransactions might not be available for OTC derivatives. For derivativestraded on an exchange or through a central counterparty, credit risk resideswith the creditworthiness of the Portfolio’s clearing broker, or theclearinghouse itself, rather than to a counterparty in an OTC derivativetransaction. Changes in regulation relating to a mutual fund’s use ofderivatives and related instruments could potentially limit or impact thePortfolio’s ability to invest in derivatives, limit the Portfolio’s ability to employcertain strategies that use derivatives and/or adversely affect the value orperformance of derivatives and the Portfolio
Commodity Risk: the risk that investing in commodity-linked derivativeinstruments may subject the Portfolio to greater volatility than investmentsin traditional securities. The value of commodity-linked derivativeinstruments may be affected by changes in overall market movements,commodity index volatility, changes in interest rates, or factors affecting aparticular industry or commodity, such as drought, floods, weather, livestockdisease, embargoes, tariffs and international economic, political andregulatory developments
Equity Risk: the risk that the value of equity securities, such as commonstocks and preferred stocks, may decline due to general market conditionswhich are not specifically related to a particular company or to factorsaffecting a particular industry or industries. Equity securities generally havegreater price volatility than fixed income securities
Mortgage-Related and Other Asset-Backed Securities Risk: therisks of investing in mortgage-related and other asset-backed securities,including interest rate risk, extension risk, prepayment risk, and credit risk
Foreign (Non-U.S.) Investment Risk: the risk that investing in foreign(non-U.S.) securities may result in the Portfolio experiencing more rapid andextreme changes in value than a portfolio that invests exclusively insecurities of U.S. companies, due to smaller markets, differing reporting,accounting and auditing standards, increased risk of delayed settlement ofportfolio transactions or loss of certificates of portfolio securities, and therisk of unfavorable foreign government actions, including nationalization,expropriation or confiscatory taxation, currency blockage, or politicalchanges or diplomatic developments. Foreign securities may also be lessliquid and more difficult to value than securities of U.S. issuers
Emerging Markets Risk: the risk of investing in emerging marketsecurities, primarily increased foreign (non-U.S.) investment risk
Sovereign Debt Risk: the risk that investments in fixed incomeinstruments issued by sovereign entities may decline in value as a result ofdefault or other adverse credit event resulting from an issuer’s inability orunwillingness to make principal or interest payments in a timely fashion
Currency Risk: the risk that foreign (non-U.S.) currencies will decline invalue relative to the U.S. dollar and affect the Portfolio’s investments inforeign (non-U.S.) currencies or in securities that trade in, and receiverevenues in, or in derivatives that provide exposure to, foreign (non-U.S.)currencies
Leveraging Risk: the risk that certain transactions of the Portfolio, such asreverse repurchase agreements, loans of portfolio securities, and the use ofwhen-issued, delayed delivery or forward commitment transactions, orderivative instruments, may give rise to leverage, magnifying gains andlosses and causing the Portfolio to be more volatile than if it had not beenleveraged. This means that leverage entails a heightened risk of loss
Management Risk: the risk that the investment techniques and riskanalyses applied by PIMCO will not produce the desired results and thatlegislative, regulatory, or tax restrictions, policies or developments mayaffect the investment techniques available to PIMCO and the individualportfolio manager in connection with managing the Portfolio. There is noguarantee that the investment objective of the Portfolio will be achieved
Tax Risk: the risk that the tax treatment of swap agreements and otherderivative instruments, such as commodity-linked derivative instruments,including commodity index-linked notes, swap agreements, commodityoptions, futures, and options on futures, may be affected by futureregulatory or legislative changes that could affect whether income fromsuch investments is “qualifying income” under Subchapter M of the InternalRevenue Code, or otherwise affect the character, timing and/or amount ofthe Portfolio’s taxable income or gains and distributions
Subsidiary Risk: the risk that, by investing in the CRRS Subsidiary, thePortfolio is indirectly exposed to the risks associated with the CRRSSubsidiary’s investments. The CRRS Subsidiary is not registered under the1940 Act and may not be subject to all the investor protections of the 1940Act. There is no guarantee that the investment objective of the CRRSSubsidiary will be achieved
Short Sale Risk: the risk of entering into short sales, including thepotential loss of more money than the actual cost of the investment, andthe risk that the third party to the short sale may fail to honor its contractterms, causing a loss to the Portfolio
Please see “Description of Principal Risks” in the Portfolio’s prospectus for amore detailed description of the risks of investing in the Portfolio. Aninvestment in the Portfolio is not a deposit of a bank and is not insured orguaranteed by the Federal Deposit Insurance Corporation or any othergovernment agency.
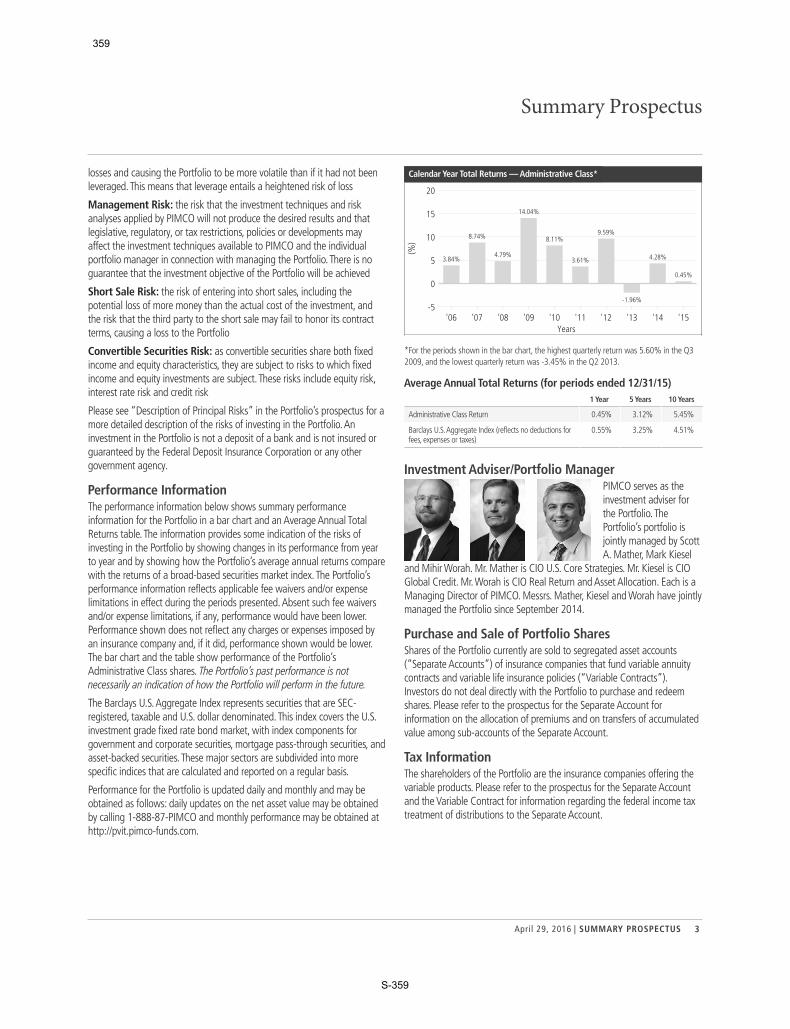
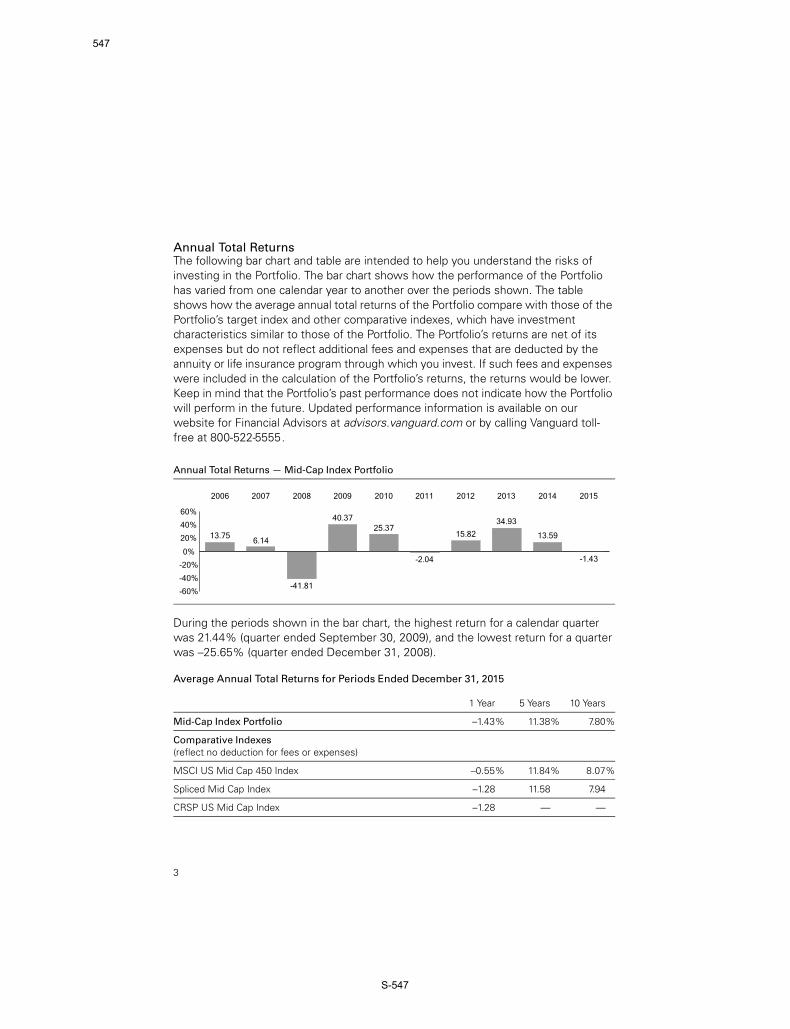
Performance InformationThe performance information below shows summary performanceinformation for the Portfolio in a bar chart and an Average Annual TotalReturns table. The information provides some indication of the risks ofinvesting in the Portfolio by showing changes in its performance from yearto year and by showing how the Portfolio’s average annual returns compare

PIMCO CommodityRealReturn® Strategy Portfolio
. SUMMARY PROSPECTUS | PVIT4
with the returns of a broad-based securities market index. The Portfolio’sperformance information reflects applicable fee waivers and/or expenselimitations in effect during the periods presented. Absent such fee waiversand/or expense limitations, if any, performance would have been lower.Performance shown does not reflect any charges or expenses imposed byan insurance company and if it did, performance shown would be lower.The bar chart and the table show performance of the Portfolio’sAdministrative Class shares. The Portfolio’s past performance is notnecessarily an indication of how the Portfolio will perform in the future.
The Bloomberg Commodity Index Total Return is an unmanaged indexcomposed of futures contracts on 20 physical commodities. The index isdesigned to be a highly liquid and diversified benchmark for commoditiesas an asset class. Prior to June 30, 2014, the Bloomberg Commodity IndexTotal Return was named Dow Jones-UBS Commodity Index Total Return.
Performance for the Portfolio is updated daily and monthly and may beobtained as follows: daily updates on the net asset value may be obtainedby calling 1-888-87-PIMCO and monthly performance may be obtained athttp://pvit.pimco-funds.com.
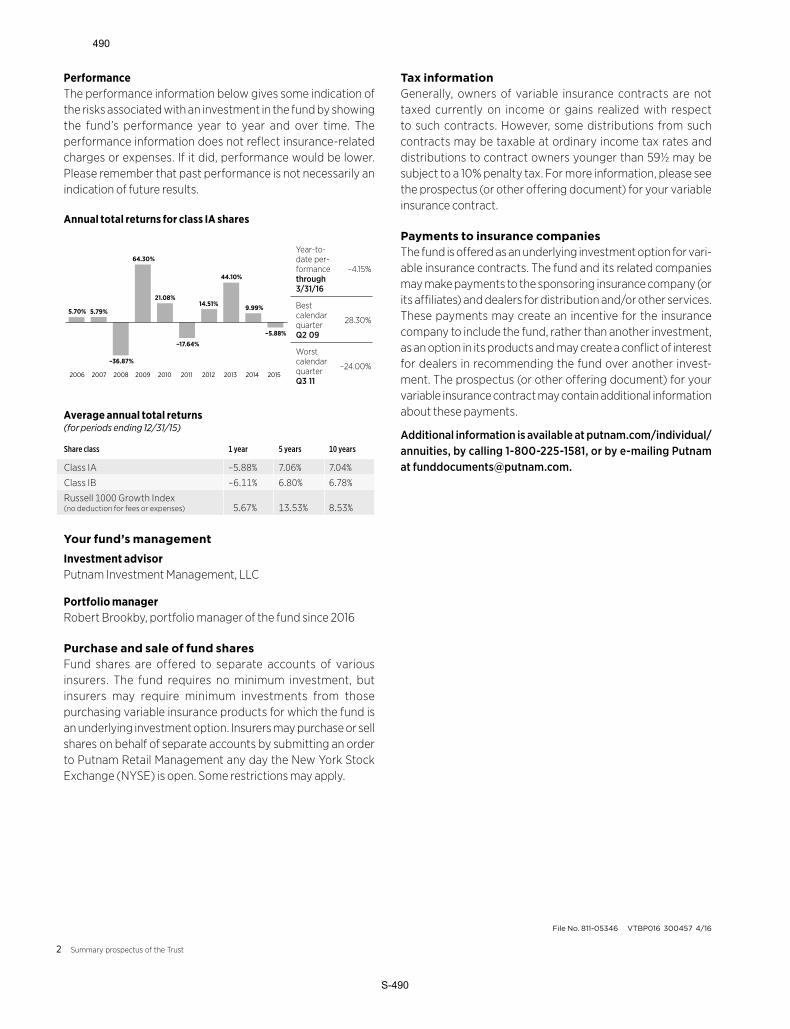
Calendar Year Total Returns — Administrative Class*
'06 '07 '08 '09 '10 '11 '12 '13 '14 '15-60
-40
-20
0
20
40
60
-3.10%
23.24%
-43.79%
41.53%
24.52%
-7.56%
5.39%
-14.70% -18.42%-25.70%
(%)
Years
*For the periods shown in the bar chart, the highest quarterly return was 15.60% in the Q22009, and the lowest quarterly return was -37.37% in the Q4 2008.
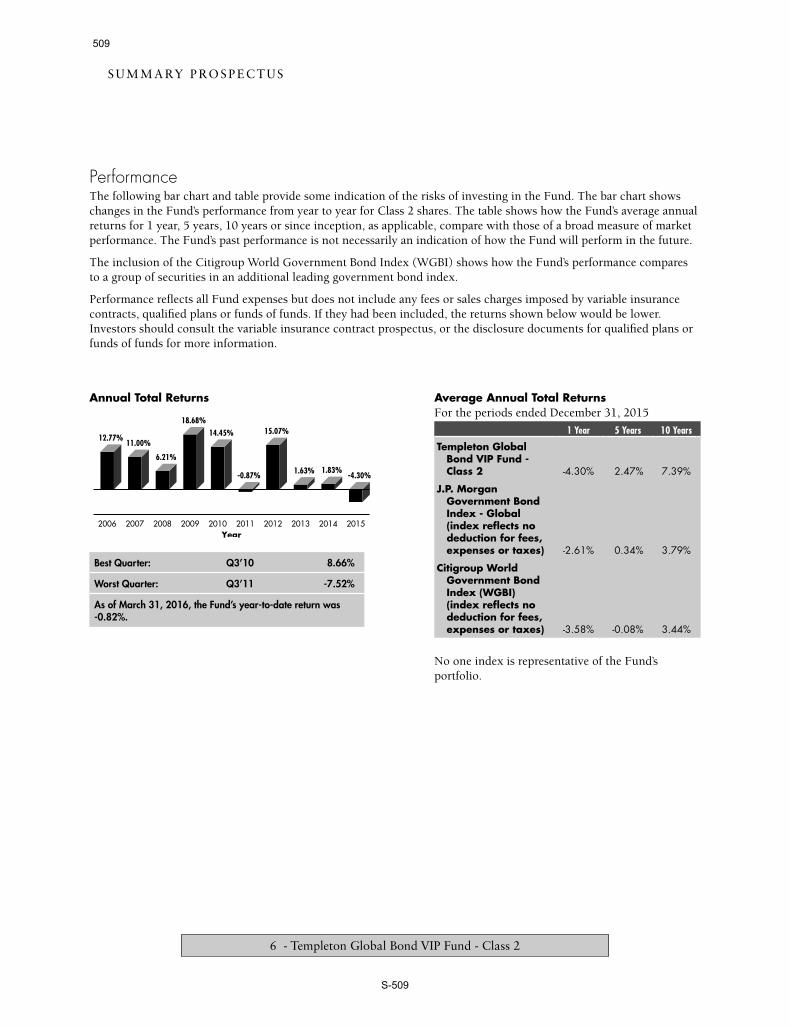
Average Annual Total Returns (for periods ended 12/31/15)1 Year 5 Years 10 Years
Administrative Class Return -25.70% -12.82% -5.05%
Bloomberg Commodity Index Total Return (reflects nodeductions for fees, expenses or taxes)
-24.66% -13.47% -6.43%
Investment Adviser/Portfolio ManagerPIMCO serves as theinvestment adviser forthe Portfolio. ThePortfolio’s portfolio isjointly managed by MihirWorah, Nicholas J.
Johnson and Jeremie Banet. Mr. Worah is CIO Real Return and AssetAllocation and Managing Director of PIMCO, and he has managedthe Portfolio since December 2007. Each of Messrs. Johnson and Banet isan Executive Vice President of PIMCO, and each has managed the Portfoliosince January 2015.
Purchase and Sale of Portfolio SharesShares of the Portfolio currently are sold to segregated asset accounts(“Separate Accounts”) of insurance companies that fund variable annuitycontracts and variable life insurance policies (“Variable Contracts”).Investors do not deal directly with the Portfolio to purchase and redeemshares. Please refer to the prospectus for the Separate Account forinformation on the allocation of premiums and on transfers of accumulatedvalue among sub-accounts of the Separate Account.
Tax InformationThe shareholders of the Portfolio are the insurance companies offering thevariable products. Please refer to the prospectus for the Separate Accountand the Variable Contract for information regarding the federal income taxtreatment of distributions to the Separate Account.
Payments to Insurance Companies and OtherFinancial IntermediariesThe Portfolio and/or its related companies (including PIMCO) may pay theinsurance company and other intermediaries for the sale of the Portfolioand/or other services. These payments may create a conflict of interest byinfluencing the insurance company or intermediary and your salesperson torecommend a Variable Contract and the Portfolio over another investment.Ask your insurance company or salesperson or visit your financialintermediary’s Web site for more information.
PVIT1850S_120716
LV612PCS-15 Accompanies EVUL, BVUL, EVUL II and BVUL II Prospectuses
0111STK1116
November 18, 2016
THE DREYFUS SOCIALLY RESPONSIBLE GROWTH FUND, INC.
Supplement to Summary Prospectus and Statutory Prospectusdated April 29, 2016
In connection with a recommendation by The Dreyfus Corporation (Dreyfus), the fund's investment adviser, to change the fund's investment strategy to focus on sustainable and environmental, social and governance (ESG) investing, the fund's board has approved, subject to shareholder approval, (1) changes to the fund's investment strategy, including removing the current fundamental social investment policy and related fundamental social considerations, and changes to the fund's fundamental investment objective, (2) the engagement of Newton Investment Management (North America) Limited (Newton), an affiliate of Dreyfus, as sub-adviser for the fund and (3) a "manager of managers" arrangement for the fund whereby Dreyfus, under certain circumstances, would be able to hire and replace affiliated and unaffiliated sub-advisers for the fund without obtaining shareholder approval. Shareholders of record at the close of business on January 4, 2017 will be asked to vote at a special meeting of shareholders, to be held on March 9, 2017. If approved by fund shareholders, these and other proposed changesdescribed below will become effective on or about May 1, 2017 (the Effective Date). To be consistent with the proposed change to the fund's investment strategy, as of the Effective Date, the fund's name will be changed to "The Dreyfus Sustainable U.S. Equity Portfolio, Inc."
As of the Effective Date, and subject to shareholder approval, the fund normally will invest in companies that, in the opinion of Newton, demonstrate attractive investment attributes and sustainable business practices and have no material unresolvable ESG issues. These are companies that have adopted, or are making progress towards, a sustainable business approach that Newton believes will create long-term shareholder value without compromising the needs of future generations. The fund normally will invest at least 80% of its net assets, plus any borrowings for investment purposes, in equity securities (or derivatives or other strategic instruments with similar economic characteristics) of U.S. companies.
Currently, to pursue its goals, the fund normally invests at least 80% of its net assets in the common stocks of companies that, in the opinion of the fund's management, meet traditional investment standards and conduct their business in a manner that contributes to the enhancement of the quality of life in America. This policy to so invest at least 80% of its net assets (the 80% Investment Policy) will be removed on or about February 10, 2017 irrespective of whether shareholders approve removing the current fundamental social investment policy and relatedfundamental social considerations and engaging Newton to serve as the fund's sub-adviser. However, if shareholders do not approve such proposals, the fund would continue to invest in accordance with the current fundamental social investment policy and related fundamental social considerations described in the prospectus notwithstanding the removal of the 80% Investment Policy.
******
If shareholders approve removing the current fundamental social investment policy and related fundamental social considerations and engaging Newton to serve as the fund's sub-adviser at the special meeting of shareholders, the following information will take effect for the fund as of the Effective Date.

2NY 76411518v2
Goal and Approach
The fund seeks long-term capital appreciation. To pursue its goal, the fund normally invests in companies that, in the opinion of Newton, demonstrate attractive investment attributes and sustainable business practices and have no material unresolvable ESG issues. These are companies that have adopted, or are making progress towards, a sustainable business approach that the fund's sub-adviser believes will create long-term shareholder value without compromising the needs of future generations. The fund normally invests at least 80% of its net assets, plus any borrowings for investment purposes, in equity securities (or derivatives or other strategic instruments with similar economic characteristics) of U.S. companies. The fund considers U.S. companies to be those companies organized or with their primary stock exchange listing, principal place of business, or majority of assets or business, in the United States. The fund's investment objective and policy with respect to the investment of 80% of its net assets may be changed by the fund's board, upon 60 days' prior notice to shareholders.
The fund invests principally in common stocks. The fund may invest in the stocks of companies with any market capitalization, but focuses on companies with market capitalizations of $5 billion or more at the time of purchase. The fund may invest up to 20% of its net assets in the stocks of foreign companies, including up to 10% of its net assets in the securities of issuers in emerging market countries, that demonstrate attractive investment attributes and sustainable businesspractices and have no material unresolvable ESG issues.
Newton employs a fundamental bottom-up investment process to select stocks for the fund's portfolio. The core of Newton's investment philosophy is the belief that no company, market or economy can be considered in isolation; each must be understood within a wider context. Newton uses a series of investment themes, which are designed to define the wider social, financial and political environment, as a framework for understanding events, trends and competitive pressures worldwide.
Fundamental proprietary research is at the heart of Newton's investment process. Newton's global industry analysts and responsible investment team consider the context provided by the investment themes. Newton then conducts rigorous analysis of the competitive position and valuation of potential investments, as well as an assessment of any material ESG issues. Using fundamental proprietary research that systematically integrates the consideration of ESG issues, Newton seeks attractively-priced companies with good products, strong management and strategic direction that have adopted, or are making progress towards, a sustainable business approach. These are companies that Newton believes should benefit from favorable long-term trends. When considering the financial attractiveness of a potential investment, Newton utilizes a variety of valuation techniques, which may include free cash flow and cost of capital measurements, asset valuation, and absolute and relative earnings ratios, and assesses the appropriateness of these valuations in the context of other fundamental factors, such as strategic positioning, the sustainability of the company's business model, return on invested capital and use of financial leverage.
Newton's systematically integrated ESG approach includes investment-led fundamental ESG research and analysis, controversy monitoring, company engagement and active proxy votingconsistent with Newton's investment and engagement priorities. Prior to investment, each company will receive a proprietary ESG quality review rating designed to ensure that any material ESG issues of the company are taken into consideration. Newton assigns an ESG quality review rating to a company based on a proprietary quality review that may include:

3NY 76411518v2
Environmental analysis, which includes an assessment of material environmental issues, such as carbon emissions, water management, energy sources and uses, hazardous materials, environmental benefits, natural resources, biodiversity, land rehabilitation and the risks presented by physical threats such as extreme weather events.
Social analysis, which includes an assessment of material social issues, such as human rights, human capital management, diversity and inclusion, supply chain management, labor standards, health and safety, business ethics, including consumer protection, and avoidance of corruption in all forms, including extortion and bribery.
Governance analysis, which includes an assessment of corporate governance structures and processes and takes into account the particular company circumstances and regulatory restrictions, guidelines and established best practices with respect to board structure, including the balance between executive and independent board representation, succession planning, capital structure, remuneration, risk management, internal controls, shareholder rights, ownership structure and transparency.
The fund will not purchase shares of a company whose primary business involves tobacco.
Newton monitors the fund's portfolio for emerging ESG controversies and issues and periodically reviews each company's ESG quality rating. This integrated investment process is intended to ensure that ESG issues are taken into account and that the fund invests in companies with attractive fundamental investment attributes that adopt, or are making progress towards, sustainable business practices. Once an investment has been made, any material but resolvable ESG issues identified in the ESG quality review process will be addressed with the company in an engagement plan in order to promote change. Newton typically votes at every shareholder meeting of every portfolio holding. This activity is undertaken in-house to ensure that the opinions expressed through Newton's voting record are in line with Newton's investment and engagement priorities. The fund will not invest in companies that Newton deems to have material unresolvable ESG issues.
The fund's portfolio managers typically will consider selling a security as a result of one or more of the following:
price movement and market activity have created an excessive valuation;the valuation of the company has become expensive relative to its peers;the company has encountered a material, unresolvable ESG issue;there has been a significant change in the prospects of the company;there has been a change in investment theme or strategy; orprofit-taking.
Although not a principal investment strategy, the fund may, but is not required to, use derivativesor other strategic instruments, principally options, futures and options on futures (including those relating to stocks, indices and foreign currencies), and forward contracts, as a substitute for investing directly in an underlying asset or currency, to increase returns, to manage foreigncurrency risk, as part of a hedging strategy or for other purposes related to the management of the fund. To the extent such instruments have similar economic characteristics to equity securities as described in the fund's policy with respect to the investment of at least 80% of its net assets, these investments will be considered investments included within such policy. Derivatives may be

4NY 76411518v2
entered into on established exchanges or through privately negotiated transactions referred to as over-the-counter derivatives. A derivatives contract will obligate or entitle the fund to deliver or receive an asset or cash payment based on the change in value of the underlying asset. When the fund enters into derivatives transactions, it may be required to segregate assets or enter into offsetting positions, in accordance with applicable regulations. Although not a principal investment strategy, the fund may invest in exchange-traded funds (ETFs), such as those that are designed to track the performance of an index, and real estate investment trusts (REITs), which are pooled investment vehicles that invest primarily in income-producing real estate or loans related to real estate.
The fund will not lend its portfolio securities.
Investment Risks
As of the Effective Date, an investment in the fund, as is currently the case, will be subject to the principal risk that the fund's investment approach may cause it to perform differently than similar funds that do not have such an investment approach. The fund's proposed investment approach that systematically integrates the consideration of ESG issues in the securities selection process may result in the fund forgoing opportunities to buy certain securities when it might otherwise be advantageous to do so, or selling securities when it might otherwise be disadvantageous for the fund to do so. The fund will vote proxies in a manner that is consistent with its investment approach, which may not always be consistent with maximizing the performance of the issuer in the short-term. In addition, to the extent the fund invests in large capitalization stocks, the fund may underperform funds that invest primarily in the stocks of lower quality, smaller capitalization companies during periods when the stocks of such companies are in favor. Compared to small-and mid-cap companies, large-cap companies may be less responsive to changes and opportunities affecting their business.
The fund also will be subject, as of the Effective Date, to the following additional risks that are not anticipated to be principal risks of investing in the fund:
Small- and mid-cap stock risk. To the extent the fund invests in small- and mid-cap companies, it will be subject to additional risks because the operating histories of these companies tend to be more limited, their earnings and revenues less predictable (and some companies may be experiencing significant losses), and their share prices more volatile than those of larger, more established companies. The shares of smaller companies tend to trade less frequently than those of larger, more established companies, which can adversely affect the pricing of these securities and the fund's ability to sell these securities. These companies may have limited product lines, markets or financial resources, or may depend on a limited management group. Some of the fund's investments will rise and fall based on investor perception rather than economic factors. Other investments may be made in anticipation of future products, services or events whose delay or cancellation could cause the stock price to drop.
Foreign investment risk. To the extent the fund invests in foreign securities, the fund's performance will be influenced by political, social and economic factors affecting investments in foreign issuers. Special risks associated with investments in foreign issuers include exposure to currency fluctuations, less liquidity, less developed or less efficient trading markets, lack of comprehensive company information, political and economic instability and differing auditing and legal standards. Investments denominated in foreign currencies are subject to the risk that such currencies will decline

5NY 76411518v2
in value relative to the U.S. dollar and affect the value of these investments held by the fund.
Emerging market risk. The securities of issuers located or doing substantial business in emerging market countries tend to be more volatile and less liquid than the securities of issuers located in countries with more mature economies. Emerging markets generally have less diverse and less mature economic structures and less stable political systems than those of developed countries. Investments in these countries may be subject to political, economic, legal, market and currency risks. The risks may include less protection of property rights and uncertain political and economic policies, the imposition of capital controls and/or foreign investment limitations by a country, nationalization of businesses and the imposition of sanctions by other countries, such as the United States.
Liquidity risk. When there is little or no active trading market for specific types of securities, it can become more difficult to sell the securities in a timely manner at or near their perceived value. In such a market, the value of such securities and the fund's share price may fall dramatically. Investments in foreign securities tend to have greater exposure to liquidity risk than domestic securities.
Derivatives risk. A small investment in derivatives could have a potentially large impact on the fund's performance. The use of derivatives involves risks different from, or possibly greater than, the risks associated with investing directly in the underlying assets, and the fund's use of derivatives may result in losses to the fund. Derivatives in which the fund may invest can be highly volatile, illiquid and difficult to value, and there is the risk that changes in the value of a derivative held by the fund will not correlate with the underlying assets or the fund's other investments in the manner intended. Certain derivatives have the potential for unlimited loss, regardless of the size of the initial investment. Certain types of derivatives, including over-the-counter transactions, involve greater risks than the underlying obligations because, in addition to general market risks, they are subject to liquidity risk, credit and counterparty risk (failure of the counterparty to the derivatives transaction to honor its obligation) and pricing risk (risk that the derivative cannot or will not be accurately valued).
ETF risk. The risks of investing in ETFs typically reflect the risks associated with the types of instruments in which the ETFs invest. When the fund invests in an ETF, shareholders of the fund will bear indirectly their proportionate share of the expenses of the ETF (including management fees) in addition to the expenses of the fund. ETFs are exchange-traded investment companies that are, in many cases, designed to provide investment results corresponding to an index. The value of the underlying securities can fluctuate in response to activities of individual companies or in response to general market and/or economic conditions. Additional risks of investments in ETFs include: (i) the market price of an ETF's shares may trade at a discount to its net asset value; (ii) an active trading market for an ETF's shares may not develop or be maintained; or (iii) trading may be halted if the listing exchanges' officials deem such action appropriate, the shares are delisted from the exchange, or the activation of market-wide "circuit breakers" (which are tied to large decreases in stock prices) halts trading generally. The fund will incur brokerage costs when purchasing and selling shares of ETFs.
REIT risk. Investments in REITs expose the fund to risks similar to investing directly in real estate. The value of securities issued by REITs is affected by tax and regulatory requirements and by perceptions of management skill. They also may be affected by general economic conditions and are subject to heavy cash flow dependency, defaults by borrowers or tenants, self-liquidation at an economically disadvantageous time, and the possibility of failing to qualify for favorable tax treatment under applicable U.S. or

6NY 76411518v2
foreign law and/or to maintain exempt status under the Investment Company Act of 1940, as amended.
Portfolio turnover risk. At times, the fund may engage in short-term trading, which could produce higher transaction costs and taxable distributions and lower the fund's after-tax performance.
******
If shareholders approve removing the current fundamental social investment policy and related fundamental social considerations of the fund and engaging Newton to serve as the fund's sub-adviser at the special meeting of shareholders, Dreyfus will seek to implement the changes to the fund's investment strategy in an orderly manner, taking into consideration such factors as market conditions, portfolio transaction costs and the potential tax implications to fund shareholders. Since the fund's shareholders are the Participating Insurance Companies and their separate accounts, the tax impact of the sale of such portfolio securities will depend on the tax status of the participating insurance company.
******
Portfolio Management
As of the Effective Date, Dreyfus will continue to be the fund's investment adviser and, subject to shareholder approval, Newton will serve as the fund's sub-adviser. Dreyfus, and not the fund, will compensate Newton out of the fee Dreyfus receives from the fund. If fund shareholders approve removing the current fundamental social investment policy and related fundamental social considerations of the fund and engaging Newton to serve as the fund's sub-adviser, Dreyfus will contractually reduce the annual rate of its management fee from 0.75% to 0.60% of the value of the fund's average daily net assets, effective as of the Effective Date. In addition, Dreyfus will contractually agree, effective as of the Effective Date and until May 1, 2018, to waive receipt of its fees and/or assume the direct expenses of the fund so that the expenses of none of the share classes (excluding Rule 12b-1 fees, shareholder services fees, taxes, interest, brokerage commissions, commitment fees on borrowings and extraordinary expenses) exceed 0.70%.
As of the Effective Date, and subject to shareholder approval described above, John Gilmore, Jeff Munroe and Terry Coles will be the fund's primary portfolio managers. Mr. Gilmore, who will be the fund's lead portfolio manager, is the lead manager of Newton's sustainable U.S. equity model and a member of its global equities team providing specialist insight into the North American market. He joined Newton in 2013; prior thereto, he was a portfolio manager at Kames Capital. Mr. Munroe is the investment leader of the global equities team at Newton, where he has been employed since 1993. Mr. Coles is a portfolio manager on the global equities team at Newton,where he has been employed since 2010. In addition, Newton's responsible investment team, led by Sandra Carlisle, will be responsible for the fund's fundamental ESG research and analysis, controversy monitoring, company engagement and active proxy voting. Ms. Carlisle joined Newton in 2013; prior thereto, she was a director at F&C Investments.
Newton is an indirect wholly-owned subsidiary of The Bank of New York Mellon Corporation(BNY Mellon), located at 160 Queen Victoria Street, London, EC4V 4LA, United Kingdom. Newton, a registered investment adviser, was formed in 1978 and, as of September 30, 2016, together with its affiliates that comprise the Newton group of companies, managed approximately $70.9 billion in discretionary separate accounts and other investment accounts. Newton, subject

7NY 76411518v2
to Dreyfus' supervision and approval, will provide the day-to-day management of the fund's assets as of the Effective Date. Newton is affiliated with Dreyfus.
******
As of the Effective Date, and subject to shareholder approval, the fund will implement a "manager of managers" arrangement whereby Dreyfus would be permitted to select one or more sub-advisers to manage the fund's portfolio in the future without obtaining shareholder approval. Dreyfus will evaluate and recommend to the fund's board sub-advisers for the fund. Dreyfus will monitor and evaluate the performance of the sub-advisers for the fund and will advise and recommend to the fund's board any changes to the fund's sub-advisers. Dreyfus has obtained from the Securities and Exchange Commission (SEC) an exemptive order, upon which the fund may rely, that permits Dreyfus, subject to certain conditions and approval by the fund's board, to enter into and materially amend sub-investment advisory agreements with one or more sub-advisers who are either unaffiliated with Dreyfus or are wholly-owned subsidiaries (as defined in the Investment Company Act of 1940, as amended) of Dreyfus' ultimate parent company, BNY Mellon, without obtaining shareholder approval. Dreyfus has applied for an exemptive order from the SEC, which would replace the existing order, and upon which the fund may rely if granted by the SEC, that would permit Dreyfus, subject to certain conditions and approval by the fund's board, to hire and replace one or more sub-advisers that are either unaffiliated or affiliated with Dreyfus (whether or not wholly-owned subsidiaries of BNY Mellon), without obtaining shareholder approval. The requested order, like the existing order, also relieves the fund from disclosing the sub-investment advisory fee paid by Dreyfus to an unaffiliated sub-adviser in documents filed with the SEC and provided to shareholders. In addition, pursuant to the existing order, it is not necessary to disclose the sub-investment advisory fee payable by Dreyfus separately to a sub-adviser that is a wholly-owned subsidiary of BNY Mellon in documents filed with the SEC and provided to shareholders; such fees are to be aggregated with fees payable to Dreyfus. The requested order would require the same disclosure with respect to the sub-investment advisory fee payable by Dreyfus separately to a sub-adviser that is an affiliate of Dreyfus (whether or not a wholly-owned subsidiary of BNY Mellon). Dreyfus has ultimate responsibility (subject to oversight by the fund's board) to supervise any sub-adviser and recommend the hiring, termination, and replacement of any sub-adviser to the fund's board. Currently, the fund has selected Newton, subject to shareholder approval, to manage all of the fund's assets. One of the conditions of the requested order, like the existing order, is that thefund's board, including a majority of the "non-interested" board members, must approve each new sub-adviser. In addition, the fund would be required under the requested order, as under the existing order, to provide shareholders with information about each new sub-adviser within 90 days of the hiring of any new sub-adviser. There is no guarantee that the requested order will be granted by the SEC.
******

LV614DFS-01 Acompanies EVUL, BVUL, EVUL II and BVUL II Prospectuses
Principal Life Insurance Company Variable Life Separate Account
Supplement dated November 16, 2016 to the Statutory Prospectus dated May 1, 2016
(as supplemented on May 19, 2016 and July 22, 2016) for:
Principal Variable Universal Life AccumulatorPrincipal Variable Universal Life Accumulator II
Principal Benefit Variable Universal Life Principal Benefit Variable Universal Life IIPrincipal Executive Variable Universal Life
Principal Executive Variable Universal Life IIPrincipal Flexible Variable Life
Principal Survivorship Flexible Premium Variable Universal LifePrincipal Variable Universal Life Income
Principal Variable Universal Life Income IIPrinFlex Life
This supplement updates information contained in the Statutory Prospectus for the variable life insurance policies referenced above. Please retain this supplement for future reference.
TABLE OF SEPARATE ACCOUNT DIVISIONS
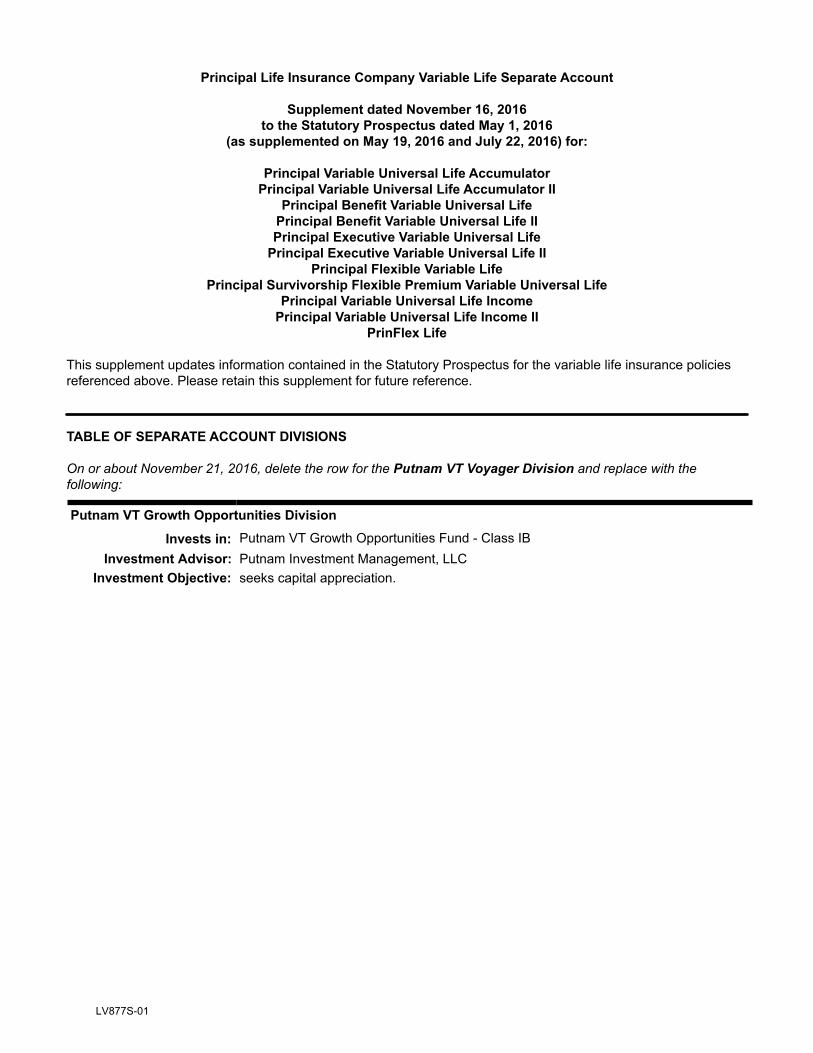
On or about November 21, 2016, delete the row for the Putnam VT Voyager Division and replace with the following:
Putnam VT Growth Opportunities Division
Invests in: Putnam VT Growth Opportunities Fund - Class IBInvestment Advisor: Putnam Investment Management, LLC
Investment Objective: seeks capital appreciation.
LV877S-01

1 of 5
Strategic Asset Management ("SAM") Strategic Growth Portfolio - Class 1 and Class 2 Shares
Principal Variable Contracts Funds, Inc. Summary Prospectus May 1, 2016 as amended June 30, 2016 and November 15, 2016
Before you invest, you may want to review the Account's prospectus, which contains more information about the Account and its risks. You can find the Account's prospectus and other information about the Account online at www.principalfunds.com/pvcprospectus. You can also get this information at no cost by calling 1 800-222-5852 or by sending an email request to [email protected].
This Summary Prospectus incorporates by reference the Statutory Prospectus dated May 1, 2016 as supplemented on June 17, 2016, June 30, 2016, July 29, 2016, November 2, 2016, and November 15, 2016, and the Statement of Additional Information dated May 1, 2016 as supplemented on June 17, 2016, July 29, 2016, September 16, 2016, October 28, 2016, and November 15, 2016 (which may be obtained in the same manner as the Prospectus).
Objective: The Portfolio seeks to provide long-term capital appreciation.
Fees and Expenses of the AccountThis table describes the fees and expenses that you may pay if you buy and hold shares of the Account. These fees and expenses do not reflect the fees and expenses of any variable insurance contract that may invest in the Account and would be higher if they did.
Annual Account Operating Expenses(expenses that you pay each year as a percentage of the value of your investment)
Class 1 Class 2Management Fees 0.23% 0.23%Distribution and/or Service (12b-1) Fees N/A 0.25%Other Expenses —% —%Acquired Fund Fees and Expenses 0.75% 0.75%Total Annual Account Operating Expenses 0.98% 1.23%
ExampleThis Example is intended to help you compare the cost of investing in the Account with the cost of investing in other mutual funds.
The Example assumes that you invest $10,000 in the Account for the time periods indicated and then redeem all of your shares at the end of those periods. The Example also assumes that your investment has a 5% return each year and that the Account’s operating expenses remain the same. If separate account expenses and contract level expenses were included, expenses would be higher. Although your actual costs may be higher or lower, based on these assumptions your costs would be:
Number of years you own your shares1 3 5 10
SAM Strategic Growth Portfolio - Class 1 $100 $312 $542 $1,201SAM Strategic Growth Portfolio - Class 2 125 390 676 1,489

2 of 5
Portfolio TurnoverAs a fund of funds, the Account does not pay transaction costs, such as commissions, when it buys and sells shares of underlying funds (or “turns over” its portfolio); however, the Account does pay such transaction costs when it buys and sells other investments. Also, an underlying fund pays transaction costs when it buys and sells portfolio securities, and a higher portfolio turnover for the underlying fund may indicate higher transaction costs. These costs, which are not reflected in annual account operating expenses or in the examples, affect the performance of the underlying fund and the Account. During its most recent fiscal year, the Account's portfolio turnover rate was 37.9% of the average value of its portfolio.
Principal Investment StrategiesThe SAM Portfolios operate as funds of funds and invest principally in Principal Funds, Inc. and Class 1 shares of Principal Variable Contracts Funds, Inc. equity funds, fixed-income funds and specialty funds (“Underlying Funds”); the Sub-Advisor generally categorizes the Underlying Fund based on the investment profile of the Underlying Fund. If an Underlying Fund offers multiple classes of shares, the SAM Portfolios will purchase shares of the class with the lowest expense ratio at the time of purchase. Each SAM Portfolio typically allocates its assets among Underlying Funds, and within predetermined percentage ranges, as determined by the Sub-Advisor in accordance with its outlook for the economy, the financial markets and the relative market valuations of the Underlying Funds.
The Portfolio:• Generally invests between 75% and 100% of its assets in equity funds that invest in small, medium, and
large market capitalization companies, and less than 50% in any one equity fund (equity funds that generally invest in domestic and foreign equity securities) and
• Generally invests less than 20% of its assets in specialty funds, and less than 20% in any one specialty fund (specialty funds that generally offer unique combinations of traditional equity securities and fixed-income securities or that use alternative investment strategies that aim to offer diversification beyond traditional equity and fixed-income securities and include investments in such assets as infrastructure, commodities, currencies, and public timber companies)
The Portfolio may temporarily exceed the applicable percentage ranges for short periods, and the Sub-Advisor may alter the percentage ranges when it deems appropriate.
Principal RisksThe broad diversification of the Portfolio is designed to cushion severe losses in any one investment sector and moderate overall price volatility. However, the Portfolio is subject to the particular risks of the Underlying Funds in which it invests, and its share prices and performance will fluctuate with the shares prices and performance of the Underlying Funds. The Portfolio operates as a fund of funds and thus bears both its own expenses and, indirectly, its proportionate share of the expenses of the Underlying Funds in which it invests. An investment in the Portfolio is not a deposit of a bank and is not insured or guaranteed by the Federal Deposit Insurance Corporation or any other government agency. If you sell your shares when their value is less than the price you paid, you will lose money.
The principal risks of investing in the Portfolio that are inherent in the fund of funds, in alphabetical order, are:
Asset Allocation Risk. A fund's selection and weighting of asset classes may cause it to underperform other funds with a similar investment objective.
Conflict of Interest Risk. The Advisor and its affiliates earn different fees from different underlying funds and may have an incentive to allocate more fund-of-fund assets to underlying funds from which they receive higher fees.
Fund of Funds Risk. The performance and risks of a fund of funds directly correspond to the performance and risks of the underlying funds in which the fund invests. Fund shareholders bear indirectly their proportionate share of the expenses of other investment companies in which the fund invests.

3 of 5
The principal risks of investing in the Portfolio that are inherent in the Underlying Funds, in alphabetical order, are:
Equity Securities Risk. The value of equity securities could decline if the issuer's financial condition declines or in response to overall market and economic conditions. A fund's principal market segment (such as market capitalization or style), may underperform other market segments or the equity markets as a whole.
• Growth Stock Risk. If growth companies do not increase their earnings at a rate expected by investors, the market price of the stock may decline significantly, even if earnings show an absolute increase. Growth company stocks also typically lack the dividend yield that can lessen price declines in market downturns.
• Small and Medium Market Capitalization Companies. Investments in small and medium sized companies may involve greater risk and price volatility than investments in larger, more mature companies.
• Value Stock Risk. Value stocks may continue to be undervalued by the market for extended periods, including the entire period during which the stock is held by a fund, or the events that the portfolio manager believed would cause the stock price to increase may not occur as anticipated or at all. Moreover, a stock judged to be undervalued actually may be appropriately priced at a low level.
Foreign Currency Risk. Risks of investing in securities denominated in, or that trade in, foreign (non-U.S.) currencies include changes in foreign exchange rates and foreign exchange restrictions.
Foreign Securities Risk. The risks of foreign securities include loss of value as a result of: political or economic instability; nationalization, expropriation or confiscatory taxation; settlement delays; and limited government regulation (including less stringent reporting, accounting, and disclosure standards than are required of U.S. companies).
Investment Company Securities Risk. Fund shareholders bear indirectly their proportionate share of the expenses of other investment companies in which the fund invests.
Redemption Risk. A fund that serves as an underlying fund for a fund of funds is subject to certain risks. When a fund of funds reallocates or rebalances its investments, an underlying fund may experience relatively large redemptions or investments. These transactions may cause the underlying fund to sell portfolio securities to meet such redemptions, or to invest cash from such investments, at times it would not otherwise do so, and may as a result increase transaction costs and adversely affect underlying fund performance.
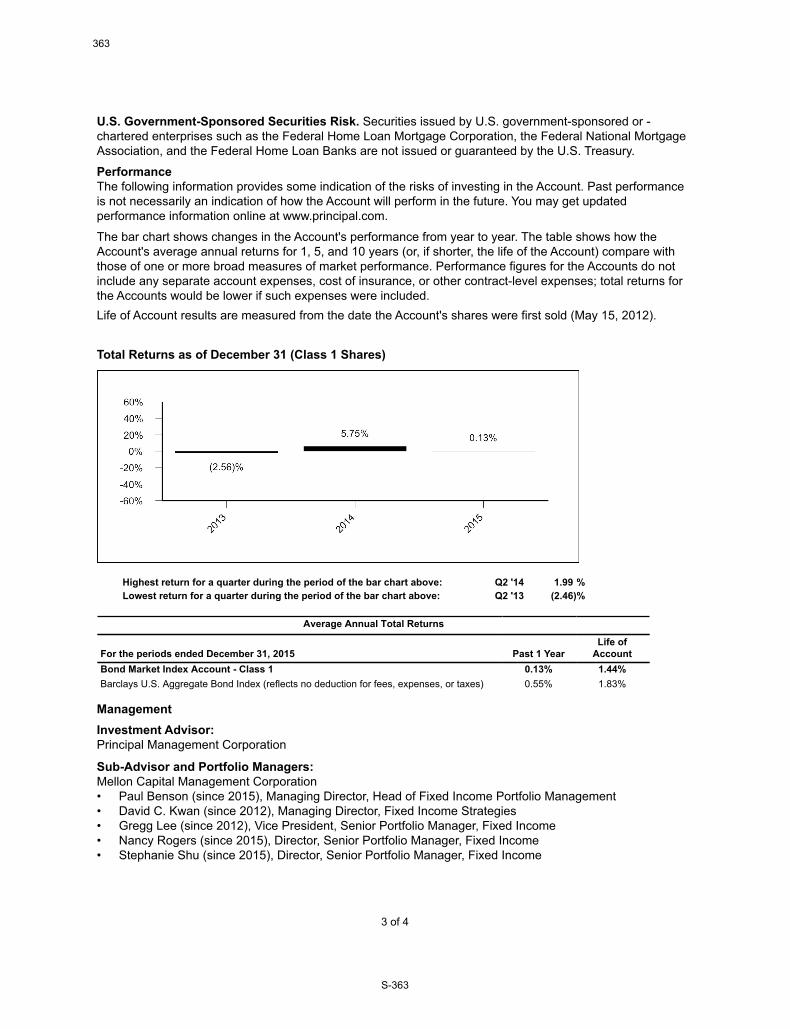
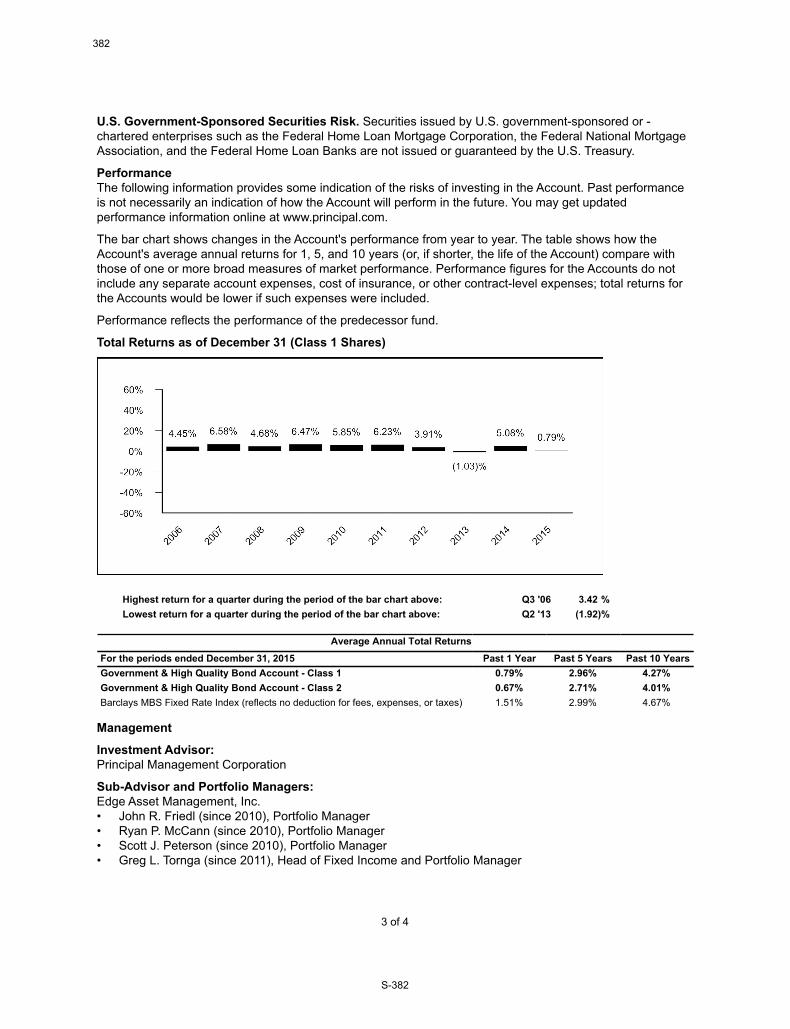
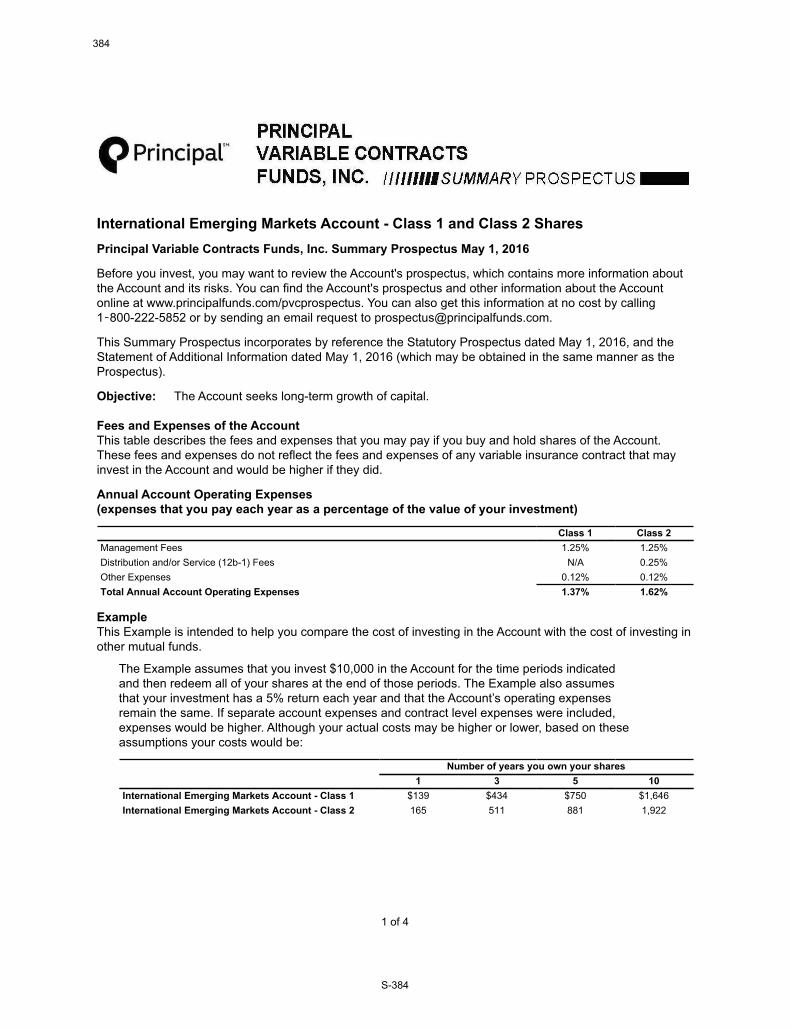
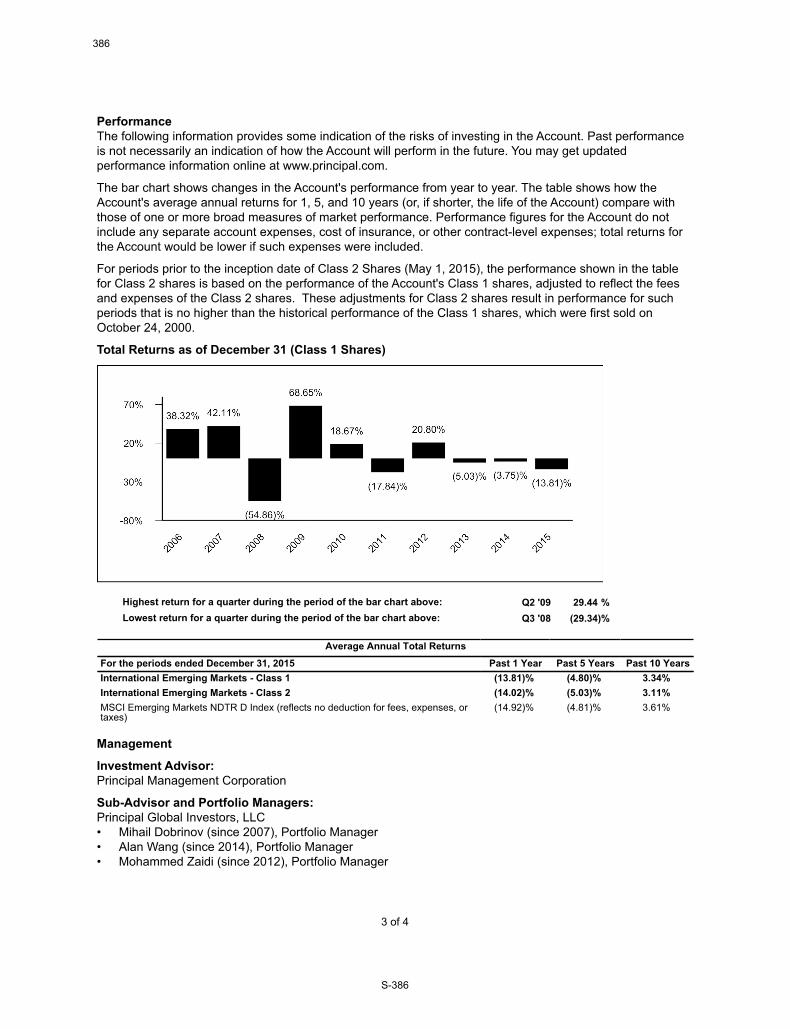
PerformanceThe following information provides some indication of the risks of investing in the Account. Past performance is not necessarily an indication of how the Account will perform in the future. You may get updated performance information online at www.principal.com.
The bar chart shows changes in the Account’s performance from year to year. The table shows how the Account’s average annual returns for 1, 5, and 10 years (or, if shorter, the life of the Account) compare with those of one or more broad measures of market performance. Performance figures for the Accounts do not include any separate account expenses, cost of insurance, or other contract-level expenses; total returns for the Accounts would be lower if such expenses were included.
Performance reflects the performance of the predecessor fund.

4 of 5
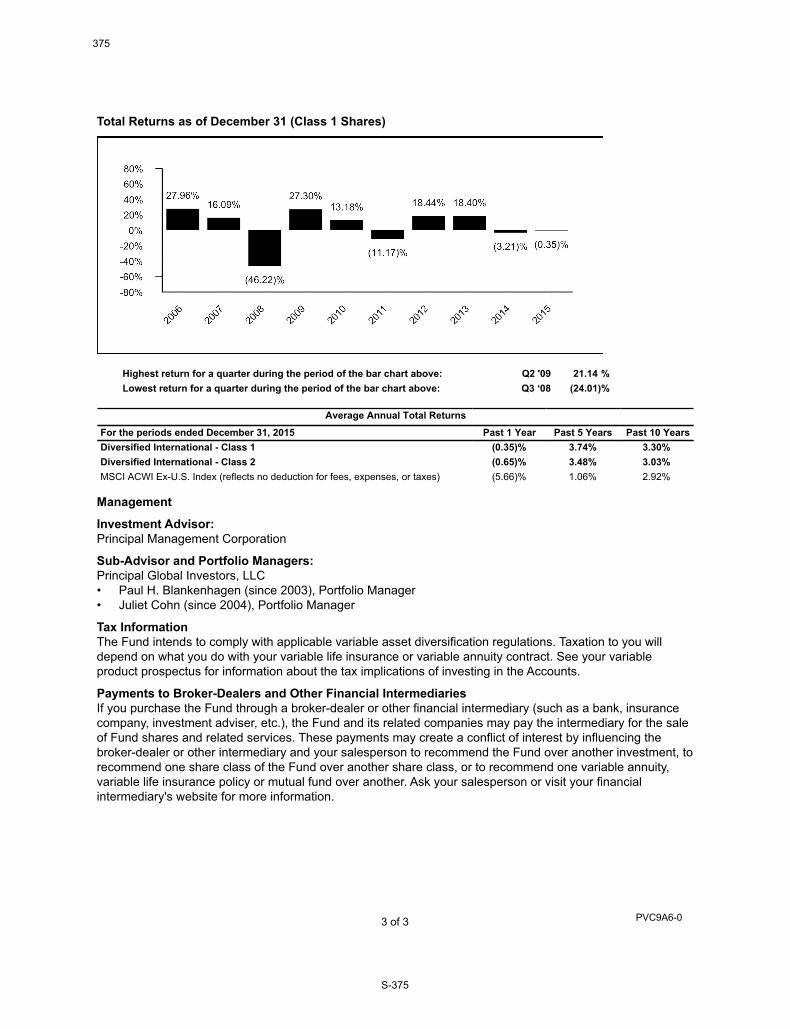
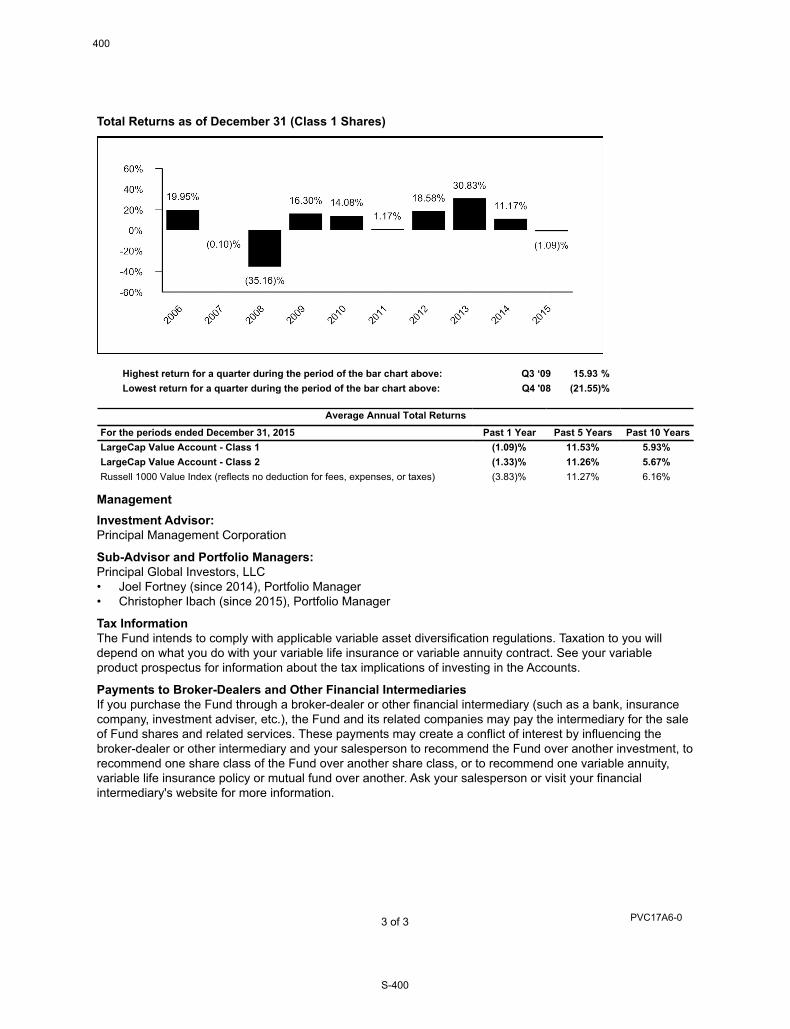
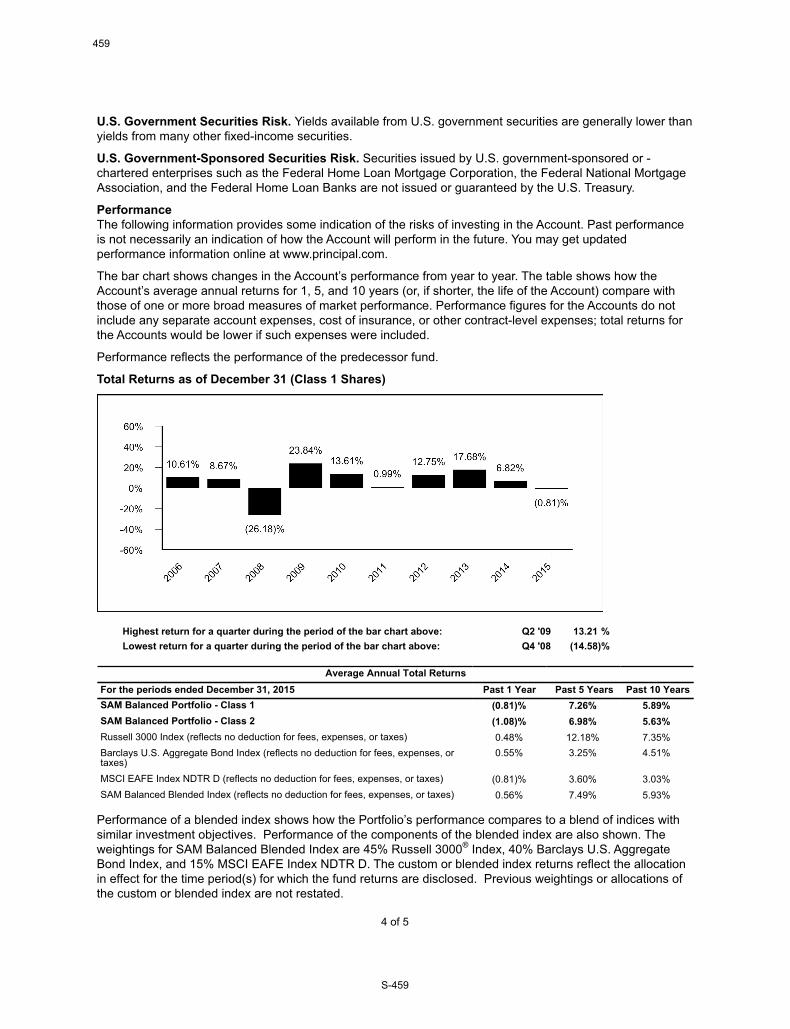
Total Returns as of December 31 (Class 1 Shares)
Highest return for a quarter during the period of the bar chart above: Q3 ‘09 15.95 %Lowest return for a quarter during the period of the bar chart above: Q4 '08 (22.38)%
Average Annual Total ReturnsFor the periods ended December 31, 2015 Past 1 Year Past 5 Years Past 10 YearsSAM Strategic Growth Portfolio - Class 1 (1.62)% 9.07% 5.91%SAM Strategic Growth Portfolio - Class 2 (1.87)% 8.79% 5.65%Russell 3000 Index (reflects no deduction for fees, expenses, or taxes) 0.48% 12.18% 7.35%MSCI EAFE Index NDTR D (reflects no deduction for fees, expenses, or taxes) (0.81)% 3.60% 3.03%Barclays U.S. Aggregate Bond Index (reflects no deduction for fees, expenses, or taxes) 0.55% 3.25% 4.51%
SAM Strategic Growth Blended Index (reflects no deduction for fees, expenses, ortaxes)
0.24% 9.62% 6.25%
Performance of a blended index shows how the Portfolio’s performance compares to a blend of indices with similar investment objectives. Performance of the components of the blended index are also shown. The weightings for SAM Strategic Growth Blended Index are 70% Russell 3000® Index, 25% MSCI EAFE Index NDTR D and 5% Barclays U.S. Aggregate Bond Index. The custom or blended index returns reflect the allocation in effect for the time period(s) for which the fund returns are disclosed. Previous weightings or allocations of the custom or blended index are not restated.
ManagementInvestment Advisor: Principal Management Corporation
Sub-Advisor and Portfolio Managers:Edge Asset Management, Inc. • Charles D. Averill (since 2010), Portfolio Manager• Todd A. Jablonski (since 2010), Portfolio Manager

5 of 5
Tax InformationThe Fund intends to comply with applicable variable asset diversification regulations. Taxation to you will depend on what you do with your variable life insurance or variable annuity contract. See your variable product prospectus for information about the tax implications of investing in the Accounts.
Payments to Broker-Dealers and Other Financial IntermediariesIf you purchase the Fund through a broker-dealer or other financial intermediary (such as a bank, insurance company, investment adviser, etc.), the Fund and its related companies may pay the intermediary for the sale of Fund shares and related services. These payments may create a conflict of interest by influencing the broker-dealer or other intermediary and your salesperson to recommend the Fund over another investment, to recommend one share class of the Fund over another share class, or to recommend one variable annuity, variable life insurance policy or mutual fund over another. Ask your salesperson or visit your financial intermediary's website for more information.

(This page left intentionally blank)

(This page left intentionally blank)

PVC33A6-02 Accompanies FVA, IPVA old, IPVA new, Freedom 2, Pivot, and all VL Product Prospectuses
1 of 5
Strategic Asset Management ("SAM") Flexible Income Portfolio - Class 1 and Class 2 Shares
Principal Variable Contracts Funds, Inc. Summary Prospectus May 1, 2016 as amended June 30, 2016 and November 15, 2016
Before you invest, you may want to review the Account's prospectus, which contains more information about the Account and its risks. You can find the Account's prospectus and other information about the Account online at www.principalfunds.com/pvcprospectus. You can also get this information at no cost by calling 1 800-222-5852 or by sending an email request to [email protected].
This Summary Prospectus incorporates by reference the Statutory Prospectus dated May 1, 2016 as supplemented on June 17, 2016, June 30, 2016, July 29, 2016, November 2, 2016, and November 15, 2016, and the Statement of Additional Information dated May 1, 2016 as supplemented on June 17, 2016, July 29, 2016, September 16, 2016, October 28, 2016, and November 15, 2016 (which may be obtained in the same manner as the Prospectus).
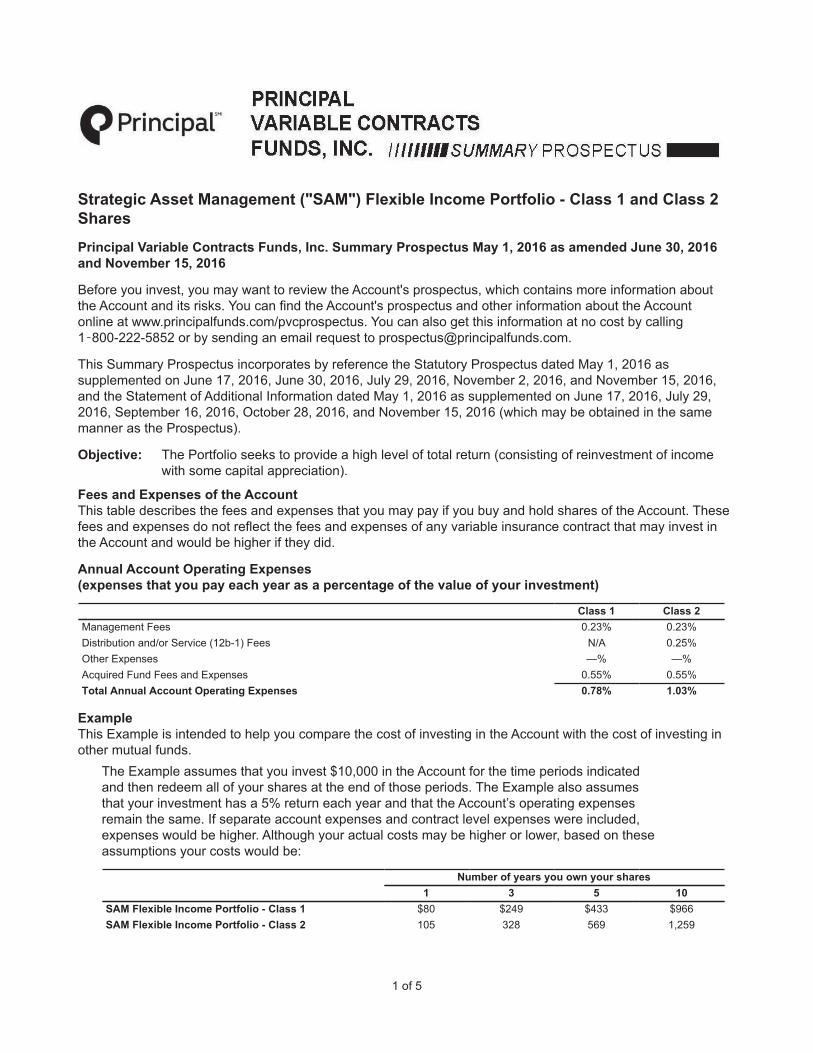
Objective: The Portfolio seeks to provide a high level of total return (consisting of reinvestment of income with some capital appreciation).
Fees and Expenses of the AccountThis table describes the fees and expenses that you may pay if you buy and hold shares of the Account. These fees and expenses do not reflect the fees and expenses of any variable insurance contract that may invest in the Account and would be higher if they did.
Annual Account Operating Expenses(expenses that you pay each year as a percentage of the value of your investment)
Class 1 Class 2Management Fees 0.23% 0.23%Distribution and/or Service (12b-1) Fees N/A 0.25%Other Expenses —% —%Acquired Fund Fees and Expenses 0.55% 0.55%Total Annual Account Operating Expenses 0.78% 1.03%
ExampleThis Example is intended to help you compare the cost of investing in the Account with the cost of investing in other mutual funds.
The Example assumes that you invest $10,000 in the Account for the time periods indicated and then redeem all of your shares at the end of those periods. The Example also assumes that your investment has a 5% return each year and that the Account’s operating expenses remain the same. If separate account expenses and contract level expenses were included, expenses would be higher. Although your actual costs may be higher or lower, based on these assumptions your costs would be:
Number of years you own your shares1 3 5 10
SAM Flexible Income Portfolio - Class 1 $80 $249 $433 $966SAM Flexible Income Portfolio - Class 2 105 328 569 1,259

2 of 5
Portfolio TurnoverAs a fund of funds, the Account does not pay transaction costs, such as commissions, when it buys and sells shares of underlying funds (or “turns over” its portfolio); however, the Account does pay such transaction costs when it buys and sells other investments. Also, an underlying fund pays transaction costs when it buys and sells portfolio securities, and a higher portfolio turnover for the underlying fund may indicate higher transaction costs. These costs, which are not reflected in annual account operating expenses or in the examples, affect the performance of the underlying fund and the Account. During its most recent fiscal year, the Account's portfolio turnover rate was 25.2% of the average value of its portfolio.
Principal Investment StrategiesThe SAM Portfolios operate as funds of funds and invest principally in Principal Funds, Inc. and Class 1 shares of Principal Variable Contracts Funds, Inc. equity funds, fixed-income funds and specialty funds (“Underlying Funds”); the Sub-Advisor generally categorizes the Underlying Fund based on the investment profile of the Underlying Fund. If an Underlying Fund offers multiple classes of shares, the SAM Portfolios will purchase shares of the class with the lowest expense ratio at the time of purchase. Each SAM Portfolio typically allocates its assets among Underlying Funds, and within predetermined percentage ranges, as determined by the Sub-Advisor in accordance with its outlook for the economy, the financial markets and the relative market valuations of the Underlying Funds.
The Portfolio:• Generally invests between 55% and 95% of its assets in fixed-income funds, and less than 40% in any one
fixed-income fund (fixed-income funds that generally invest in fixed income instruments such as high yield securities (or “junk” bonds), real estate securities, mortgage-backed securities (securitized products), government and government-sponsored securities, and corporate bonds)
• Generally invests between 5% and 45% of its assets in equity funds, and less than 30% in any one equity fund (equity funds that generally invest in domestic and foreign equity securities) and
• Generally invests less than 20% of its assets in specialty funds, and less than 20% in any one specialty fund (specialty funds that generally offer unique combinations of traditional equity securities and fixed-income securities or that use alternative investment strategies that aim to offer diversification beyond traditional equity and fixed-income securities and include investments in such assets as infrastructure, commodities, currencies, and public timber companies)
The Portfolio may temporarily exceed these percentage ranges for short periods, and the Sub-Advisor may alter the percentage ranges when it deems appropriate.
Principal RisksThe broad diversification of the Portfolio is designed to cushion severe losses in any one investment sector and moderate overall price volatility. However, the Portfolio is subject to the particular risks of the Underlying Funds in which it invests, and its share prices and performance will fluctuate with the shares prices and performance of the Underlying Funds. The Portfolio operates as a fund of funds and thus bears both its own expenses and, indirectly, its proportionate share of the expenses of the Underlying Funds in which it invests. An investment in the Portfolio is not a deposit of a bank and is not insured or guaranteed by the Federal Deposit Insurance Corporation or any other government agency. If you sell your shares when their value is less than the price you paid, you will lose money.
The principal risks of investing in the Portfolio that are inherent in the fund of funds, in alphabetical order, are:
Asset Allocation Risk. A fund's selection and weighting of asset classes may cause it to underperform other funds with a similar investment objective.
Conflict of Interest Risk. The Advisor and its affiliates earn different fees from different underlying funds and may have an incentive to allocate more fund-of-fund assets to underlying funds from which they receive higher fees.
Fund of Funds Risk. The performance and risks of a fund of funds directly correspond to the performance and risks of the underlying funds in which the fund invests. Fund shareholders bear indirectly their proportionate share of the expenses of other investment companies in which the fund invests.

3 of 5
The principal risks of investing in the Portfolio that are inherent in the Underlying Funds, in alphabetical order, are:
Equity Securities Risk. The value of equity securities could decline if the issuer's financial condition declines or in response to overall market and economic conditions. A fund's principal market segment (such as market capitalization or style), may underperform other market segments or the equity markets as a whole.
• Growth Stock Risk. If growth companies do not increase their earnings at a rate expected by investors, the market price of the stock may decline significantly, even if earnings show an absolute increase. Growth company stocks also typically lack the dividend yield that can lessen price declines in market downturns.
• Value Stock Risk. Value stocks may continue to be undervalued by the market for extended periods, including the entire period during which the stock is held by a fund, or the events that the portfolio manager believed would cause the stock price to increase may not occur as anticipated or at all. Moreover, a stock judged to be undervalued actually may be appropriately priced at a low level.
Fixed-Income Securities Risk. Fixed-income securities are subject to interest rate risk and credit quality risk. The market value of fixed-income securities generally declines when interest rates rise, and an issuer of fixed-income securities could default on its payment obligations.
Foreign Currency Risk. Risks of investing in securities denominated in, or that trade in, foreign (non-U.S.) currencies include changes in foreign exchange rates and foreign exchange restrictions.
Foreign Securities Risk. The risks of foreign securities include loss of value as a result of: political or economic instability; nationalization, expropriation or confiscatory taxation; settlement delays; and limited government regulation (including less stringent reporting, accounting, and disclosure standards than are required of U.S. companies).
High Yield Securities Risk. High yield fixed-income securities (commonly referred to as "junk bonds") are subject to greater credit quality risk than higher rated fixed-income securities and should be considered speculative.
Investment Company Securities Risk. Fund shareholders bear indirectly their proportionate share of the expenses of other investment companies in which the fund invests.
Portfolio Duration Risk. Portfolio duration is a measure of the expected life of a fixed-income security and its sensitivity to changes in interest rates. The longer a fund's average portfolio duration, the more sensitive the fund will be to changes in interest rates.
Real Estate Securities Risk. Investing in real estate securities subjects the fund to the risks associated with the real estate market (which are similar to the risks associated with direct ownership in real estate), including declines in real estate values, loss due to casualty or condemnation, property taxes, interest rate changes, increased expenses, cash flow of underlying real estate assets, regulatory changes (including zoning, land use and rents), and environmental problems, as well as to the risks related to the management skill and creditworthiness of the issuer.
Redemption Risk. A fund that serves as an underlying fund for a fund of funds is subject to certain risks. When a fund of funds reallocates or rebalances its investments, an underlying fund may experience relatively large redemptions or investments. These transactions may cause the underlying fund to sell portfolio securities to meet such redemptions, or to invest cash from such investments, at times it would not otherwise do so, and may as a result increase transaction costs and adversely affect underlying fund performance.
Securitized Products Risk. Investments in securitized products are subject to risks similar to traditional fixed income securities, such as credit, interest rate, liquidity, prepayment, extension, and default risk, as well as additional risks associated with the nature of the assets and the servicing of those assets. Unscheduled prepayments on securitized products may have to be reinvested at lower rates. A reduction in prepayments may increase the effective maturities of these securities, exposing them to the risk of decline in market value over time (extension risk).
U.S. Government Securities Risk. Yields available from U.S. government securities are generally lower than yields from many other fixed-income securities.
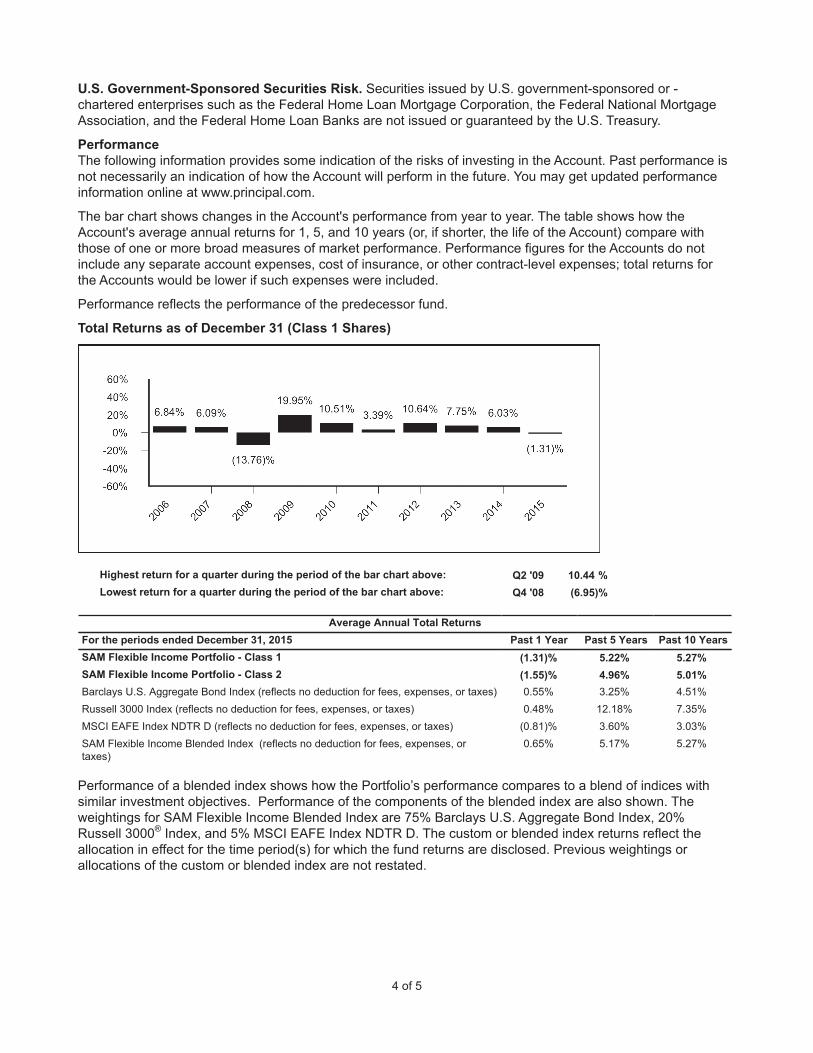
4 of 5
U.S. Government-Sponsored Securities Risk. Securities issued by U.S. government-sponsored or -chartered enterprises such as the Federal Home Loan Mortgage Corporation, the Federal National Mortgage Association, and the Federal Home Loan Banks are not issued or guaranteed by the U.S. Treasury.
PerformanceThe following information provides some indication of the risks of investing in the Account. Past performance is not necessarily an indication of how the Account will perform in the future. You may get updated performance information online at www.principal.com.
The bar chart shows changes in the Account's performance from year to year. The table shows how the Account's average annual returns for 1, 5, and 10 years (or, if shorter, the life of the Account) compare with those of one or more broad measures of market performance. Performance figures for the Accounts do not include any separate account expenses, cost of insurance, or other contract-level expenses; total returns for the Accounts would be lower if such expenses were included.
Performance reflects the performance of the predecessor fund.
Total Returns as of December 31 (Class 1 Shares)
Highest return for a quarter during the period of the bar chart above: Q2 '09 10.44 %Lowest return for a quarter during the period of the bar chart above: Q4 '08 (6.95)%
Average Annual Total ReturnsFor the periods ended December 31, 2015 Past 1 Year Past 5 Years Past 10 YearsSAM Flexible Income Portfolio - Class 1 (1.31)% 5.22% 5.27%SAM Flexible Income Portfolio - Class 2 (1.55)% 4.96% 5.01%Barclays U.S. Aggregate Bond Index (reflects no deduction for fees, expenses, or taxes) 0.55% 3.25% 4.51%Russell 3000 Index (reflects no deduction for fees, expenses, or taxes) 0.48% 12.18% 7.35%MSCI EAFE Index NDTR D (reflects no deduction for fees, expenses, or taxes) (0.81)% 3.60% 3.03%SAM Flexible Income Blended Index (reflects no deduction for fees, expenses, ortaxes)
0.65% 5.17% 5.27%
Performance of a blended index shows how the Portfolio’s performance compares to a blend of indices with similar investment objectives. Performance of the components of the blended index are also shown. The weightings for SAM Flexible Income Blended Index are 75% Barclays U.S. Aggregate Bond Index, 20% Russell 3000® Index, and 5% MSCI EAFE Index NDTR D. The custom or blended index returns reflect the allocation in effect for the time period(s) for which the fund returns are disclosed. Previous weightings or allocations of the custom or blended index are not restated.

5 of 5
Management
Investment Advisor: Principal Management Corporation
Sub-Advisor and Portfolio Managers:Edge Asset Management, Inc. • Charles D. Averill (since 2010), Portfolio Manager• Todd A. Jablonski (since 2010), Portfolio Manager
Tax InformationThe Fund intends to comply with applicable variable asset diversification regulations. Taxation to you will depend on what you do with your variable life insurance or variable annuity contract. See your variable product prospectus for information about the tax implications of investing in the Accounts.
Payments to Broker-Dealers and Other Financial IntermediariesIf you purchase the Fund through a broker-dealer or other financial intermediary (such as a bank, insurance company, investment adviser, etc.), the Fund and its related companies may pay the intermediary for the sale of Fund shares and related services. These payments may create a conflict of interest by influencing the broker-dealer or other intermediary and your salesperson to recommend the Fund over another investment, to recommend one share class of the Fund over another share class, or to recommend one variable annuity, variable life insurance policy or mutual fund over another. Ask your salesperson or visit your financial intermediary's website for more information.

(This page left intentionally blank)

(This page left intentionally blank)

PVC32A6-02 Accompanies FVA, IPVA old, IPVA new, Freedom 2, Pivot, and all VL Product Prospectuses

1 of 5
Strategic Asset Management ("SAM") Conservative Growth Portfolio - Class 1 and Class 2 Shares
Principal Variable Contracts Funds, Inc. Summary Prospectus May 1, 2016 as amended June 30, 2016 and November 15, 2016
Before you invest, you may want to review the Account's prospectus, which contains more information about the Account and its risks. You can find the Account's prospectus and other information about the Account online at www.principalfunds.com/pvcprospectus. You can also get this information at no cost by calling 1 800-222-5852 or by sending an email request to [email protected].
This Summary Prospectus incorporates by reference the Statutory Prospectus dated May 1, 2016 as supplemented on June 17, 2016, June 30, 2016, July 29, 2016, November 2, 2016, and November 15, 2016, and the Statement of Additional Information dated May 1, 2016 as supplemented on June 17, 2016, July 29, 2016, September 16, 2016, October 28, 2016, and November 15, 2016 (which may be obtained in the same manner as the Prospectus).
Objective: The Portfolio seeks to provide long-term capital appreciation.
Fees and Expenses of the AccountThis table describes the fees and expenses that you may pay if you buy and hold shares of the Account. These fees and expenses do not reflect the fees and expenses of any variable insurance contract that may invest in the Account and would be higher if they did.
Annual Account Operating Expenses(expenses that you pay each year as a percentage of the value of your investment)
Class 1 Class 2Management Fees 0.23% 0.23%Distribution and/or Service (12b-1) Fees N/A 0.25%Other Expenses —% —%Acquired Fund Fees and Expenses 0.76% 0.76%Total Annual Account Operating Expenses 0.99% 1.24%
ExampleThis Example is intended to help you compare the cost of investing in the Account with the cost of investing in other mutual funds.
The Example assumes that you invest $10,000 in the Account for the time periods indicated and then redeem all of your shares at the end of those periods. The Example also assumes that your investment has a 5% return each year and that the Account’s operating expenses remain the same. If separate account expenses and contract level expenses were included, expenses would be higher. Although your actual costs may be higher or lower, based on these assumptions your costs would be:
Number of years you own your shares1 3 5 10
SAM Conservative Growth Portfolio - Class 1 $101 $315 $547 $1,213SAM Conservative Growth Portfolio - Class 2 126 393 681 1,500
2 of 5
Portfolio TurnoverAs a fund of funds, the Account does not pay transaction costs, such as commissions, when it buys and sells shares of underlying funds (or “turns over” its portfolio); however, the Account does pay such transaction costs when it buys and sells other investments. Also, an underlying fund pays transaction costs when it buys and sells portfolio securities, and a higher portfolio turnover for the underlying fund may indicate higher transaction costs. These costs, which are not reflected in annual account operating expenses or in the examples, affect the performance of the underlying fund and the Account. During its most recent fiscal year, the Account's portfolio turnover rate was 29.1% of the average value of its portfolio.
Principal Investment StrategiesThe SAM Portfolios operate as funds of funds and invest principally in Principal Funds, Inc. and Class 1 shares of Principal Variable Contracts Funds, Inc. equity funds, fixed-income funds and specialty funds (“Underlying Funds”); the Sub-Advisor generally categorizes the Underlying Fund based on the investment profile of the Underlying Fund. If an Underlying Fund offers multiple classes of shares, the SAM Portfolios will purchase shares of the class with the lowest expense ratio at the time of purchase. Each SAM Portfolio typically allocates its assets among Underlying Funds, and within predetermined percentage ranges, as determined by the Sub-Advisor in accordance with its outlook for the economy, the financial markets and the relative market valuations of the Underlying Funds.
The Portfolio:• Generally invests between 0% and 40% of its assets in fixed-income funds, and less than 30% in any one
fixed-income fund (fixed-income funds that generally invest in fixed-income instruments such as government and government-sponsored securities and corporate bonds)
• Generally invests between 60% and 100% of its assets in equity funds that invest in small, medium, and large market capitalization companies, and less than 40% in any one equity fund (equity funds that generally invest in domestic and foreign equity securities) and
• Generally invests less than 20% of its assets in specialty funds, and less than 20% in any one specialty fund (specialty funds that generally offer unique combinations of traditional equity securities and fixed-income securities or that use alternative investment strategies that aim to offer diversification beyond traditional equity and fixed-income securities and include investments in such assets as infrastructure, commodities, currencies, and public timber companies)
The Portfolio may temporarily exceed the applicable percentage ranges for short periods, and the Sub-Advisor may alter the percentage ranges when it deems appropriate.
Principal RisksThe broad diversification of the Portfolio is designed to cushion severe losses in any one investment sector and moderate overall price volatility. However, the Portfolio is subject to the particular risks of the Underlying Funds in which it invests, and its share prices and performance will fluctuate with the shares prices and performance of the Underlying Funds. The Portfolio operates as a fund of funds and thus bears both its own expenses and, indirectly, its proportionate share of the expenses of the Underlying Funds in which it invests. An investment in the Portfolio is not a deposit of a bank and is not insured or guaranteed by the Federal Deposit Insurance Agency or any other government agency. If you sell your shares when their value is less than the price you paid, you will lose money.
The principal risks of investing in the Portfolio that are inherent in the fund of funds, in alphabetical order, are:
Asset Allocation Risk. A fund's selection and weighting of asset classes may cause it to underperform other funds with a similar investment objective.
Conflict of Interest Risk. The Advisor and its affiliates earn different fees from different underlying funds and may have an incentive to allocate more fund-of-fund assets to underlying funds from which they receive higher fees.
Fund of Funds Risk. The performance and risks of a fund of funds directly correspond to the performance and risks of the underlying funds in which the fund invests. Fund shareholders bear indirectly their proportionate share of the expenses of other investment companies in which the fund invests.

3 of 5
The principal risks of investing in the Portfolio that are inherent in the Underlying Funds, in alphabetical order, are:
Equity Securities Risk. The value of equity securities could decline if the issuer's financial condition declines or in response to overall market and economic conditions. A fund's principal market segment (such as market capitalization or style), may underperform other market segments or the equity markets as a whole.
• Growth Stock Risk. If growth companies do not increase their earnings at a rate expected by investors, the market price of the stock may decline significantly, even if earnings show an absolute increase. Growth company stocks also typically lack the dividend yield that can lessen price declines in market downturns.
• Small and Medium Market Capitalization Companies. Investments in small and medium-size companies may involve greater risk and price volatility than investments in larger, more mature companies.
• Value Stock Risk. Value stocks may continue to be undervalued by the market for extended periods, including the entire period during which the stock is held by a fund, or the events that the portfolio manager believed would cause the stock price to increase may not occur as anticipated or at all. Moreover, a stock judged to be undervalued actually may be appropriately priced at a low level.
Fixed-Income Securities Risk. Fixed-income securities are subject to interest rate risk and credit quality risk. The market value of fixed-income securities generally declines when interest rates rise, and an issuer of fixed-income securities could default on its payment obligations.
Foreign Currency Risk. Risks of investing in securities denominated in, or that trade in, foreign (non-U.S.) currencies include changes in foreign exchange rates and foreign exchange restrictions.
Foreign Securities Risk. The risks of foreign securities include loss of value as a result of: political or economic instability; nationalization, expropriation or confiscatory taxation; settlement delays; and limited government regulation (including less stringent reporting, accounting, and disclosure standards than are required of U.S. companies).
Investment Company Securities Risk. Fund shareholders bear indirectly their proportionate share of the expenses of other investment companies in which the fund invests.
Portfolio Duration Risk. Portfolio duration is a measure of the expected life of a fixed-income security and its sensitivity to changes in interest rates. The longer a fund's average portfolio duration, the more sensitive the fund will be to changes in interest rates.
Redemption Risk. A fund that serves as an underlying fund for a fund of funds is subject to certain risks. When a fund of funds reallocates or rebalances its investments, an underlying fund may experience relatively large redemptions or investments. These transactions may cause the underlying fund to sell portfolio securities to meet such redemptions, or to invest cash from such investments, at times it would not otherwise do so, and may as a result increase transaction costs and adversely affect underlying fund performance.
U.S. Government Securities Risk. Yields available from U.S. government securities are generally lower than yields from many other fixed-income securities.
U.S. Government-Sponsored Securities Risk. Securities issued by U.S. government-sponsored or -chartered enterprises such as the Federal Home Loan Mortgage Corporation, the Federal National Mortgage Association, and the Federal Home Loan Banks are not issued or guaranteed by the U.S. Treasury.
PerformanceThe following information provides some indication of the risks of investing in the Account. Past performance is not necessarily an indication of how the Account will perform in the future. You may get updated performance information online at www.principal.com.
The bar chart shows changes in the Account’s performance from year to year. The table shows how the Account’s average annual returns for 1, 5, and 10 years (or, if shorter, the life of the Account) compare with those of one or more broad measures of market performance. Performance figures for the Accounts do not include any separate account expenses, cost of insurance, or other contract-level expenses; total returns for the Accounts would be lower if such expenses were included.

4 of 5
Performance reflects the performance of the predecessor fund.
Total Returns as of December 31 (Class 1 Shares)
Highest return for a quarter during the period of the bar chart above: Q2 '09 14.61 %Lowest return for a quarter during the period of the bar chart above: Q4 '08 (19.24)%
Average Annual Total ReturnsFor the periods ended December 31, 2015 Past 1 Year Past 5 Years Past 10 YearsSAM Conservative Growth Portfolio - Class 1 (1.09)% 8.25% 5.85%SAM Conservative Growth Portfolio - Class 2 (1.34)% 7.99% 5.59%Russell 3000 Index (reflects no deduction for fees, expenses, or taxes) 0.48% 12.18% 7.35%Barclays U.S. Aggregate Bond Index (reflects no deduction for fees, expenses, or taxes) 0.55% 3.25% 4.51%MSCI EAFE Index NDTR D (reflects no deduction for fees, expenses, or taxes) (0.81)% 3.60% 3.03%SAM Conservative Growth Blended Index (reflects no deduction for fees, expenses, ortaxes)
0.41% 8.79% 6.19%
Performance of a blended index shows how the Portfolio’s performance compares to a blend of indices with similar investment objectives. Performance of the components of the blended index are also shown. The weightings for SAM Conservative Growth Blended Index are 60% Russell 3000® Index, 20% Barclays U.S. Aggregate Bond Index and 20% MSCI EAFE Index NDTR D. The custom or blended index returns reflect the allocation in effect for the time period(s) for which the fund returns are disclosed. Previous weightings or allocations of the custom or blended index are not restated.
Management
Investment Advisor: Principal Management Corporation
Sub-Advisor and Portfolio Managers:Edge Asset Management, Inc. • Charles D. Averill (since 2010), Portfolio Manager• Todd A. Jablonski (since 2010), Portfolio Manager

5 of 5
Tax InformationThe Fund intends to comply with applicable variable asset diversification regulations. Taxation to you will depend on what you do with your variable life insurance or variable annuity contract. See your variable product prospectus for information about the tax implications of investing in the Accounts.
Payments to Broker-Dealers and Other Financial IntermediariesIf you purchase the Fund through a broker-dealer or other financial intermediary (such as a bank, insurance company, investment adviser, etc.), the Fund and its related companies may pay the intermediary for the sale of Fund shares and related services. These payments may create a conflict of interest by influencing the broker-dealer or other intermediary and your salesperson to recommend the Fund over another investment, to recommend one share class of the Fund over another share class, or to recommend one variable annuity, variable life insurance policy or mutual fund over another. Ask your salesperson or visit your financial intermediary's website for more information.

(This page left intentionally blank)

(This page left intentionally blank)

PVC31A6-02 Accompanies FVA, IPVA old, IPVA new, Freedom 2, Pivot, and all VL Product Prospectuses
1 of 5
Strategic Asset Management ("SAM") Conservative Balanced Portfolio - Class 1 and Class 2 Shares
Principal Variable Contracts Funds, Inc. Summary Prospectus May 1, 2016 as amended June 30, 2016 and November 15, 2016
Before you invest, you may want to review the Account's prospectus, which contains more information about the Account and its risks. You can find the Account's prospectus and other information about the Account online at www.principalfunds.com/pvcprospectus. You can also get this information at no cost by calling 1 800-222-5852 or by sending an email request to [email protected].
This Summary Prospectus incorporates by reference the Statutory Prospectus dated May 1, 2016 as supplemented on June 17, 2016, June 30, 2016, July 29, 2016, November 2, 2016, and November 15, 2016, and the Statement of Additional Information dated May 1, 2016 as supplemented on June 17, 2016, July 29, 2016, September 16, 2016, October 28, 2016, and November 15, 2016 (which may be obtained in the same manner as the Prospectus).
Objective: The Portfolio seeks to provide a high level of total return (consisting of reinvestment of income and capital appreciation), consistent with a moderate degree of principal risk.
Fees and Expenses of the AccountThis table describes the fees and expenses that you may pay if you buy and hold shares of the Account. These fees and expenses do not reflect the fees and expenses of any variable insurance contract that may invest in the Account and would be higher if they did.
Annual Account Operating Expenses(expenses that you pay each year as a percentage of the value of your investment)
Class 1 Class 2Management Fees 0.23% 0.23%Distribution and/or Service (12b-1) Fees N/A 0.25%Other Expenses —% —%Acquired Fund Fees and Expenses 0.65% 0.65%Total Annual Account Operating Expenses 0.88% 1.13%
ExampleThis Example is intended to help you compare the cost of investing in the Account with the cost of investing in other mutual funds.
The Example assumes that you invest $10,000 in the Account for the time periods indicated and then redeem all of your shares at the end of those periods. The Example also assumes that your investment has a 5% return each year and that the Account’s operating expenses remain the same. If separate account expenses and contract level expenses were included, expenses would be higher. Although your actual costs may be higher or lower, based on these assumptions your costs would be:
Number of years you own your shares1 3 5 10
SAM Conservative Balanced Portfolio - Class 1 $90 $281 $488 $1,084SAM Conservative Balanced Portfolio - Class 2 115 359 622 1,375

2 of 5
Portfolio TurnoverAs a fund of funds, the Account does not pay transaction costs, such as commissions, when it buys and sells shares of underlying funds (or “turns over” its portfolio); however, the Account does pay such transaction costs when it buys and sells other investments. Also, an underlying fund pays transaction costs when it buys and sells portfolio securities, and a higher portfolio turnover for the underlying fund may indicate higher transaction costs. These costs, which are not reflected in annual account operating expenses or in the examples, affect the performance of the underlying fund and the Account. During its most recent fiscal year, the Account's portfolio turnover rate was 28.2% of the average value of its portfolio.
Principal Investment StrategiesThe SAM Portfolios operate as funds of funds and invest principally in Principal Funds, Inc. and Class 1 shares of Principal Variable Contracts Funds, Inc. equity funds, fixed-income funds and specialty funds (“Underlying Funds”); the Sub-Advisor generally categorizes the Underlying Fund based on the investment profile of the Underlying Fund. If an Underlying Fund offers multiple classes of shares, the SAM Portfolios will purchase shares of the class with the lowest expense ratio at the time of purchase. Each SAM Portfolio typically allocates its assets among Underlying Funds, and within predetermined percentage ranges, as determined by the Sub-Advisor in accordance with its outlook for the economy, the financial markets and the relative market valuations of the Underlying Funds.
The Portfolio:• Generally invests between 40% and 80% of its assets in fixed-income funds, and less than 40% in any one
fixed-income fund (fixed-income funds that generally invest in fixed income instruments such as high yield securities (or “junk” bonds), real estate securities, mortgage-backed securities (securitized products), government and government-sponsored securities, and corporate bonds)
• Generally invests between 20% and 60% of its assets in equity funds, and less than 30% in any one equity fund (equity funds that generally invest in domestic and foreign equity securities) and
• Generally invests less than 20% of its assets in specialty funds, and less than 20% in any one specialty fund (specialty funds that generally offer unique combinations of traditional equity securities and fixed-income securities or that use alternative investment strategies that aim to offer diversification beyond traditional equity and fixed-income securities and include investments in such assets as infrastructure, commodities, currencies, and public timber companies)
The Portfolio may temporarily exceed these percentage ranges for short periods, and the Sub-Advisor may alter the percentage ranges when it deems appropriate.
Principal RisksThe broad diversification of the Portfolio is designed to cushion severe losses in any one investment sector and moderate overall price volatility. However, the Portfolio is subject to the particular risks of the Underlying Funds in which it invests, and its share prices and performance will fluctuate with the shares prices and performance of the Underlying Funds. The Portfolio operates as a fund of funds and thus bears both its own expenses and, indirectly, its proportionate share of the expenses of the Underlying Funds in which it invests. An investment in the Portfolio is not a deposit of a bank and is not insured or guaranteed by the Federal Deposit Insurance Corporation or any other government agency. If you sell your shares when their value is less than the price you paid, you will lose money.
The principal risks of investing in the Portfolio that are inherent in the fund of funds, in alphabetical order, are:
Asset Allocation Risk. A fund's selection and weighting of asset classes may cause it to underperform other funds with a similar investment objective.
Conflict of Interest Risk. The Advisor and its affiliates earn different fees from different underlying funds and may have an incentive to allocate more fund-of-fund assets to underlying funds from which they receive higher fees.
Fund of Funds Risk. The performance and risks of a fund of funds directly correspond to the performance and risks of the underlying funds in which the fund invests. Fund shareholders bear indirectly their proportionate share of the expenses of other investment companies in which the fund invests.

3 of 5
The principal risks of investing in the Portfolio that are inherent in the Underlying Funds, in alphabetical order, are:
Equity Securities Risk. The value of equity securities could decline if the issuer's financial condition declines or in response to overall market and economic conditions. A fund's principal market segment (such as market capitalization or style), may underperform other market segments or the equity markets as a whole.
• Growth Stock Risk. If growth companies do not increase their earnings at a rate expected by investors, the market price of the stock may decline significantly, even if earnings show an absolute increase. Growth company stocks also typically lack the dividend yield that can lessen price declines in market downturns.
• Value Stock Risk. Value stocks may continue to be undervalued by the market for extended periods, including the entire period during which the stock is held by a fund, or the events that the portfolio manager believed would cause the stock price to increase may not occur as anticipated or at all. Moreover, a stock judged to be undervalued actually may be appropriately priced at a low level.
Fixed-Income Securities Risk. Fixed-income securities are subject to interest rate risk and credit quality risk. The market value of fixed-income securities generally declines when interest rates rise, and an issuer of fixed-income securities could default on its payment obligations.
Foreign Currency Risk. Risks of investing in securities denominated in, or that trade in, foreign (non-U.S.) currencies include changes in foreign exchange rates and foreign exchange restrictions.
Foreign Securities Risk. The risks of foreign securities include loss of value as a result of: political or economic instability; nationalization, expropriation or confiscatory taxation; settlement delays; and limited government regulation (including less stringent reporting, accounting, and disclosure standards than are required of U.S. companies).
High Yield Securities Risk. High yield fixed-income securities (commonly referred to as "junk bonds") are subject to greater credit quality risk than higher rated fixed-income securities and should be considered speculative.
Investment Company Securities Risk. Fund shareholders bear indirectly their proportionate share of the expenses of other investment companies in which the fund invests.
Portfolio Duration Risk. Portfolio duration is a measure of the expected life of a fixed-income security and its sensitivity to changes in interest rates. The longer a fund's average portfolio duration, the more sensitive the fund will be to changes in interest rates. .
Real Estate Securities Risk. Investing in real estate securities subjects the fund to the risks associated with the real estate market (which are similar to the risks associated with direct ownership in real estate), including declines in real estate values, loss due to casualty or condemnation, property taxes, interest rate changes, increased expenses, cash flow of underlying real estate assets, regulatory changes (including zoning, land use and rents), and environmental problems, as well as to the risks related to the management skill and creditworthiness of the issuer.
Redemption Risk. A fund that serves as an underlying fund for a fund of funds is subject to certain risks. When a fund of funds reallocates or rebalances its investments, an underlying fund may experience relatively large redemptions or investments. These transactions may cause the underlying fund to sell portfolio securities to meet such redemptions, or to invest cash from such investments, at times it would not otherwise do so, and may as a result increase transaction costs and adversely affect underlying fund performance.
Securitized Products Risk. Investments in securitized products are subject to risks similar to traditional fixed income securities, such as credit, interest rate, liquidity, prepayment, extension, and default risk, as well as additional risks associated with the nature of the assets and the servicing of those assets. Unscheduled prepayments on securitized products may have to be reinvested at lower rates. A reduction in prepayments may increase the effective maturities of these securities, exposing them to the risk of decline in market value over time (extension risk).
U.S. Government Securities Risk. Yields available from U.S. government securities are generally lower than yields from many other fixed-income securities.

4 of 5
U.S. Government-Sponsored Securities Risk. Securities issued by U.S. government-sponsored or -chartered enterprises such as the Federal Home Loan Mortgage Corporation, the Federal National Mortgage Association, and the Federal Home Loan Banks are not issued or guaranteed by the U.S. Treasury.
PerformanceThe following information provides some indication of the risks of investing in the Account. Past performance is not necessarily an indication of how the Account will perform in the future. You may get updated performance information online at www.principal.com.
The bar chart shows changes in the Account's performance from year to year. The table shows how the Account's average annual returns for 1, 5, and 10 years (or, if shorter, the life of the Account) compare with those of one or more broad measures of market performance. Performance figures for the Accounts do not include any separate account expenses, cost of insurance, or other contract-level expenses; total returns for the Accounts would be lower if such expenses were included.
Performance reflects the performance of the predecessor fund.
Total Returns as of December 31 (Class 1 Shares)
Highest return for a quarter during the period of the bar chart above: Q2 '09 11.00 %Lowest return for a quarter during the period of the bar chart above: Q4 '08 (10.39)%
Average Annual Total ReturnsFor the periods ended December 31, 2015 Past 1 Year Past 5 Years Past 10 YearsSAM Conservative Balanced Portfolio - Class 1 (0.78)% 5.98% 5.53%SAM Conservative Balanced Portfolio - Class 2 (0.93)% 5.71% 5.27%Barclays U.S. Aggregate Bond Index (reflects no deduction for fees, expenses, or taxes) 0.55% 3.25% 4.51%Russell 3000 Index (reflects no deduction for fees, expenses, or taxes) 0.48% 12.18% 7.35%MSCI EAFE Index NDTR D (reflects no deduction for fees, expenses, or taxes) (0.81)% 3.60% 3.03%SAM Conservative Balanced Blended Index (reflects no deduction for fees, expenses,or taxes)
0.63% 6.13% 5.57%
Performance of a blended index shows how the Portfolio’s performance compares to a blend of indices with similar investment objectives. Performance of the components of the blended index are also shown. The weightings for SAM Conservative Balanced Blended Index are 60% Barclays U.S. Aggregate Bond Index, 30% Russell 3000® Index, and 10% MSCI EAFE Index NDTR D. The custom or blended index returns reflect the allocation in effect for the time period(s) for which the fund returns are disclosed. Previous weightings or allocations of the custom or blended index are not restated.

5 of 5
ManagementInvestment Advisor: Principal Management Corporation
Sub-Advisor and Portfolio Managers:Edge Asset Management, Inc. • Charles D. Averill (since 2010), Portfolio Manager• Todd A. Jablonski (since 2010), Portfolio Manager
Tax InformationThe Fund intends to comply with applicable variable asset diversification regulations. Taxation to you will depend on what you do with your variable life insurance or variable annuity contract. See your variable product prospectus for information about the tax implications of investing in the Accounts.
Payments to Broker-Dealers and Other Financial IntermediariesIf you purchase the Fund through a broker-dealer or other financial intermediary (such as a bank, insurance company, investment adviser, etc.), the Fund and its related companies may pay the intermediary for the sale of Fund shares and related services. These payments may create a conflict of interest by influencing the broker-dealer or other intermediary and your salesperson to recommend the Fund over another investment, to recommend one share class of the Fund over another share class, or to recommend one variable annuity, variable life insurance policy or mutual fund over another. Ask your salesperson or visit your financial intermediary's website for more information.

(This page left intentionally blank)

(This page left intentionally blank)

PVC30A6-02 Accompanies FVA, IPVA old, IPVA new, Freedom 2, Pivot, and all VL Product Prospectuses
1 of 5
Strategic Asset Management ("SAM") Balanced Portfolio - Class 1 and Class 2 Shares
Principal Variable Contracts Funds, Inc. Summary Prospectus May 1, 2016 as amended June 30, 2016 and November 15, 2016
Before you invest, you may want to review the Account's prospectus, which contains more information about the Account and its risks. You can find the Account's prospectus and other information about the Account online at www.principalfunds.com/pvcprospectus. You can also get this information at no cost by calling 1 800-222-5852 or by sending an email request to [email protected].
This Summary Prospectus incorporates by reference the Statutory Prospectus dated May 1, 2016 as supplemented on June 17, 2016, June 30, 2016, July 29, 2016, November 2, 2016, and November 15, 2016, and the Statement of Additional Information dated May 1, 2016 as supplemented on June 17, 2016, July 29, 2016, September 16, 2016, October 28, 2016, and November 15, 2016 (which may be obtained in the same manner as the Prospectus).
Objective: The Portfolio seeks to provide as high a level of total return (consisting of reinvested income and capital appreciation) as is consistent with reasonable risk.
Fees and Expenses of the AccountThis table describes the fees and expenses that you may pay if you buy and hold shares of the Account. These fees and expenses do not reflect the fees and expenses of any variable insurance contract that may invest in the Account and would be higher if they did.
Annual Account Operating Expenses(expenses that you pay each year as a percentage of the value of your investment)
Class 1 Class 2Management Fees 0.23% 0.23%Distribution and/or Service (12b-1) Fees N/A 0.25%Other Expenses —% —%Acquired Fund Fees and Expenses 0.70% 0.70%Total Annual Account Operating Expenses 0.93% 1.18%
ExampleThis Example is intended to help you compare the cost of investing in the Account with the cost of investing in other mutual funds.
The Example assumes that you invest $10,000 in the Account for the time periods indicated and then redeem all of your shares at the end of those periods. The Example also assumes that your investment has a 5% return each year and that the Account’s operating expenses remain the same. If separate account expenses and contract level expenses were included, expenses would be higher. Although your actual costs may be higher or lower, based on these assumptions your costs would be:
Number of years you own your shares1 3 5 10
SAM Balanced Portfolio - Class 1 $95 $296 $515 $1,143SAM Balanced Portfolio - Class 2 120 375 649 1,432
2 of 5
Portfolio TurnoverAs a fund of funds, the Account does not pay transaction costs, such as commissions, when it buys and sells shares of underlying funds (or “turns over” its portfolio); however, the Account does pay such transaction costs when it buys and sells other investments. Also, an underlying fund pays transaction costs when it buys and sells portfolio securities, and a higher portfolio turnover for the underlying fund may indicate higher transaction costs. These costs, which are not reflected in annual account operating expenses or in the examples, affect the performance of the underlying fund and the Account. During its most recent fiscal year, the Account's portfolio turnover rate was 26.1% of the average value of its portfolio.
Principal Investment StrategiesThe SAM Portfolios operate as funds of funds and invest principally in Principal Funds, Inc. and Class 1 shares of Principal Variable Contracts Funds, Inc. equity funds, fixed-income funds and specialty funds (“Underlying Funds”); the Sub-Advisor generally categorizes the Underlying Fund based on the investment profile of the Underlying Fund. If an Underlying Fund offers multiple classes of shares, the SAM Portfolios will purchase shares of the class with the lowest expense ratio at the time of purchase. Each SAM Portfolio typically allocates its assets among Underlying Funds, and within predetermined percentage ranges, as determined by the Sub-Advisor in accordance with its outlook for the economy, the financial markets and the relative market valuations of the Underlying Funds.
The Portfolio:• Generally invests between 20% and 60% of its assets in fixed-income funds, and less than 40% in any one
fixed-income fund (fixed-income funds that generally invest in fixed income instruments such as real estate securities, mortgage-backed securities (securitized products), government and government-sponsored securities, and corporate bonds)
• Generally invests between 40% and 80% of its assets in equity funds that invest in small, medium, and large market capitalization companies, and less than 30% in any one equity fund (equity funds that generally invest in domestic and foreign equity securities) and
• Generally invests less than 20% of its assets in specialty funds, and less than 20% in any one specialty fund (specialty funds that generally offer unique combinations of traditional equity securities and fixed-income securities or that use alternative investment strategies that aim to offer diversification beyond traditional equity and fixed-income securities and include investments in such assets as infrastructure, commodities, currencies, and public timber companies)
The Portfolio may temporarily exceed the applicable percentage ranges for short periods, and the Sub-Advisor may alter the percentage ranges when it deems appropriate.
Principal RisksThe broad diversification of the Portfolio is designed to cushion severe losses in any one investment sector and moderate overall price volatility. However, the Portfolio is subject to the particular risks of the Underlying Funds in which it invests, and its share prices and performance will fluctuate with the shares prices and performance of the Underlying Funds. The Portfolio operates as a fund of funds and thus bears both its own expenses and, indirectly, its proportionate share of the expenses of the Underlying Funds in which it invests. An investment in the Portfolio is not a deposit of a bank and is not insured or guaranteed by the Federal Deposit Insurance Corporation or any other government agency. If you sell your shares when their value is less than the price you paid, you will lose money.
The principal risks of investing in the Portfolio that are inherent in the fund of funds, in alphabetical order, are:
Asset Allocation Risk. A fund's selection and weighting of asset classes may cause it to underperform other funds with a similar investment objective.
Conflict of Interest Risk. The Advisor and its affiliates earn different fees from different underlying funds and may have an incentive to allocate more fund-of-fund assets to underlying funds from which they receive higher fees.
Fund of Funds Risk. The performance and risks of a fund of funds directly correspond to the performance and risks of the underlying funds in which the fund invests. Fund shareholders bear indirectly their proportionate share of the expenses of other investment companies in which the fund invests.

3 of 5
The principal risks of investing in the Portfolio that are inherent in the Underlying Funds, in alphabetical order, are:
Equity Securities Risk. The value of equity securities could decline if the issuer's financial condition declines or in response to overall market and economic conditions. A fund's principal market segment (such as market capitalization or style), may underperform other market segments or the equity markets as a whole.
• Growth Stock Risk. If growth companies do not increase their earnings at a rate expected by investors, the market price of the stock may decline significantly, even if earnings show an absolute increase. Growth company stocks also typically lack the dividend yield that can lessen price declines in market downturns.
• Small and Medium Market Capitalization Companies. Investments in small and medium sized companies may involve greater risk and price volatility than investments in larger, more mature companies.
• Value Stock Risk. Value stocks may continue to be undervalued by the market for extended periods, including the entire period during which the stock is held by a fund, or the events that the portfolio manager believed would cause the stock price to increase may not occur as anticipated or at all. Moreover, a stock judged to be undervalued actually may be appropriately priced at a low level.
Fixed-Income Securities Risk. Fixed-income securities are subject to interest rate risk and credit quality risk. The market value of fixed-income securities generally declines when interest rates rise, and an issuer of fixed-income securities could default on its payment obligations.
Foreign Currency Risk. Risks of investing in securities denominated in, or that trade in, foreign (non-U.S.) currencies include changes in foreign exchange rates and foreign exchange restrictions.
Foreign Securities Risk. The risks of foreign securities include loss of value as a result of: political or economic instability; nationalization, expropriation or confiscatory taxation; settlement delays; and limited government regulation (including less stringent reporting, accounting, and disclosure standards than are required of U.S. companies).
Investment Company Securities Risk. Fund shareholders bear indirectly their proportionate share of the expenses of other investment companies in which the fund invests.
Portfolio Duration Risk. Portfolio duration is a measure of the expected life of a fixed-income security and its sensitivity to changes in interest rates. The longer a fund's average portfolio duration, the more sensitive the fund will be to changes in interest rates.
Real Estate Securities Risk. Investing in real estate securities subjects the fund to the risks associated with the real estate market (which are similar to the risks associated with direct ownership in real estate), including declines in real estate values, loss due to casualty or condemnation, property taxes, interest rate changes, increased expenses, cash flow of underlying real estate assets, regulatory changes (including zoning, land use and rents), and environmental problems, as well as to the risks related to the management skill and creditworthiness of the issuer.
Redemption Risk. A fund that serves as an underlying fund for a fund of funds is subject to certain risks. When a fund of funds reallocates or rebalances its investments, an underlying fund may experience relatively large redemptions or investments. These transactions may cause the underlying fund to sell portfolio securities to meet such redemptions, or to invest cash from such investments, at times it would not otherwise do so, and may as a result increase transaction costs and adversely affect underlying fund performance.
Securitized Products Risk. Investments in securitized products are subject to risks similar to traditional fixed income securities, such as credit, interest rate, liquidity, prepayment, extension, and default risk, as well as additional risks associated with the nature of the assets and the servicing of those assets. Unscheduled prepayments on securitized products may have to be reinvested at lower rates. A reduction in prepayments may increase the effective maturities of these securities, exposing them to the risk of decline in market value over time (extension risk).
U.S. Government Securities Risk. Yields available from U.S. government securities are generally lower than yields from many other fixed-income securities.

4 of 5
U.S. Government-Sponsored Securities Risk. Securities issued by U.S. government-sponsored or -chartered enterprises such as the Federal Home Loan Mortgage Corporation, the Federal National Mortgage Association, and the Federal Home Loan Banks are not issued or guaranteed by the U.S. Treasury.
PerformanceThe following information provides some indication of the risks of investing in the Account. Past performance is not necessarily an indication of how the Account will perform in the future. You may get updated performance information online at www.principal.com.
The bar chart shows changes in the Account’s performance from year to year. The table shows how the Account’s average annual returns for 1, 5, and 10 years (or, if shorter, the life of the Account) compare with those of one or more broad measures of market performance. Performance figures for the Accounts do not include any separate account expenses, cost of insurance, or other contract-level expenses; total returns for the Accounts would be lower if such expenses were included.
Performance reflects the performance of the predecessor fund.
Total Returns as of December 31 (Class 1 Shares)
Highest return for a quarter during the period of the bar chart above: Q2 '09 13.21 %Lowest return for a quarter during the period of the bar chart above: Q4 '08 (14.58)%
Average Annual Total ReturnsFor the periods ended December 31, 2015 Past 1 Year Past 5 Years Past 10 YearsSAM Balanced Portfolio - Class 1 (0.81)% 7.26% 5.89%SAM Balanced Portfolio - Class 2 (1.08)% 6.98% 5.63%Russell 3000 Index (reflects no deduction for fees, expenses, or taxes) 0.48% 12.18% 7.35%Barclays U.S. Aggregate Bond Index (reflects no deduction for fees, expenses, or taxes) 0.55% 3.25% 4.51%MSCI EAFE Index NDTR D (reflects no deduction for fees, expenses, or taxes) (0.81)% 3.60% 3.03%SAM Balanced Blended Index (reflects no deduction for fees, expenses, or taxes) 0.56% 7.49% 5.93%
Performance of a blended index shows how the Portfolio’s performance compares to a blend of indices with similar investment objectives. Performance of the components of the blended index are also shown. The weightings for SAM Balanced Blended Index are 45% Russell 3000® Index, 40% Barclays U.S. Aggregate Bond Index, and 15% MSCI EAFE Index NDTR D. The custom or blended index returns reflect the allocation in effect for the time period(s) for which the fund returns are disclosed. Previous weightings or allocations of the custom or blended index are not restated.

5 of 5
Management
Investment Advisor: Principal Management Corporation
Sub-Advisor and Portfolio Managers:Edge Asset Management, Inc. • Charles D. Averill (since 2010), Portfolio Manager• Todd A. Jablonski (since 2010), Portfolio Manager
Tax InformationThe Fund intends to comply with applicable variable asset diversification regulations. Taxation to you will depend on what you do with your variable life insurance or variable annuity contract. See your variable product prospectus for information about the tax implications of investing in the Accounts.
Payments to Broker-Dealers and Other Financial IntermediariesIf you purchase the Fund through a broker-dealer or other financial intermediary (such as a bank, insurance company, investment adviser, etc.), the Fund and its related companies may pay the intermediary for the sale of Fund shares and related services. These payments may create a conflict of interest by influencing the broker-dealer or other intermediary and your salesperson to recommend the Fund over another investment, to recommend one share class of the Fund over another share class, or to recommend one variable annuity, variable life insurance policy or mutual fund over another. Ask your salesperson or visit your financial intermediary's website for more information.

(This page left intentionally blank)

(This page left intentionally blank)

PVC29A6-02 Accompanies Premier, FVA, IPVA old, IPVA new, Freedom 2, Pivot, and all VL Product Prospectuses

Fidelity® Variable Insurance Products
Initial Class, Service Class, and Service Class 2Contrafund® Portfolio
Summary ProspectusApril 28, 2016
As Revised November 10, 2016
Before you invest, you may want to review the fund’s prospectus, which contains more information about the fund and its risks. You can find the fund’s prospectus and other information about the fund (including the fund’s SAI) online at advisor.fidelity.com/vipfunddocuments. You can also get this information at no cost by calling 1-866-997-1254 or by sending an e-mail request to [email protected]. The fund’s prospectus dated April 28, 2016, as supplemented on November 10, 2016, and SAI dated April 28, 2016, as supplemented on October 18, 2016, are incorporated herein by reference.
245 Summer Street, Boston, MA 02210
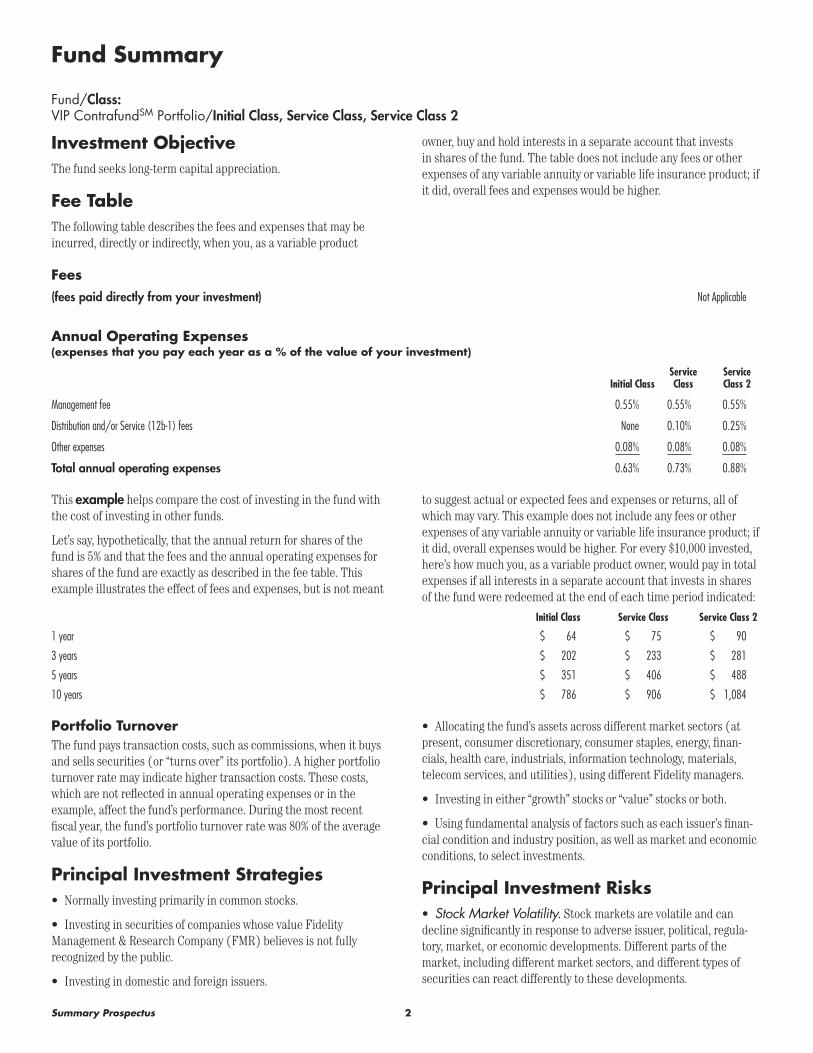
2Summary Prospectus
Fund Summary
Fund/Class:VIP ContrafundSM Portfolio/Initial Class, Service Class, Service Class 2
Investment ObjectiveThe fund seeks long-term capital appreciation.
Fee TableThe following table describes the fees and expenses that may be incurred, directly or indirectly, when you, as a variable product
owner, buy and hold interests in a separate account that invests in shares of the fund. The table does not include any fees or other expenses of any variable annuity or variable life insurance product; if it did, overall fees and expenses would be higher.
Fees(fees paid directly from your investment) Not Applicable
Annual Operating Expenses(expenses that you pay each year as a % of the value of your investment)
Initial ClassService Class
Service Class 2
Management fee 0.55% 0.55% 0.55%
Distribution and/or Service (12b-1) fees None 0.10% 0.25%
Other expenses 0.08% 0.08% 0.08%
Total annual operating expenses 0.63% 0.73% 0.88%
This example helps compare the cost of investing in the fund with the cost of investing in other funds.
Let’s say, hypothetically, that the annual return for shares of the fund is 5% and that the fees and the annual operating expenses for shares of the fund are exactly as described in the fee table. This example illustrates the effect of fees and expenses, but is not meant
to suggest actual or expected fees and expenses or returns, all of which may vary. This example does not include any fees or other expenses of any variable annuity or variable life insurance product; if it did, overall expenses would be higher. For every $10,000 invested, here’s how much you, as a variable product owner, would pay in total expenses if all interests in a separate account that invests in shares of the fund were redeemed at the end of each time period indicated:
Initial Class Service Class Service Class 2
1 year $ 64 $ 75 $ 90
3 years $ 202 $ 233 $ 281
5 years $ 351 $ 406 $ 488
10 years $ 786 $ 906 $ 1,084
Portfolio TurnoverThe fund pays transaction costs, such as commissions, when it buys and sells securities (or “turns over” its portfolio). A higher portfolio turnover rate may indicate higher transaction costs. These costs, which are not reflected in annual operating expenses or in the example, affect the fund’s performance. During the most recent fiscal year, the fund’s portfolio turnover rate was 80% of the average value of its portfolio.
Principal Investment Strategies• Normally investing primarily in common stocks.
• Investing in securities of companies whose value Fidelity Management & Research Company (FMR) believes is not fully recognized by the public.
• Investing in domestic and foreign issuers.
• Allocating the fund’s assets across different market sectors (at present, consumer discretionary, consumer staples, energy, finan-cials, health care, industrials, information technology, materials, telecom services, and utilities), using different Fidelity managers.
• Investing in either “growth” stocks or “value” stocks or both.
• Using fundamental analysis of factors such as each issuer’s finan-cial condition and industry position, as well as market and economic conditions, to select investments.
Principal Investment Risks• Stock Market Volatility. Stock markets are volatile and can decline significantly in response to adverse issuer, political, regula-tory, market, or economic developments. Different parts of the market, including different market sectors, and different types of securities can react differently to these developments.
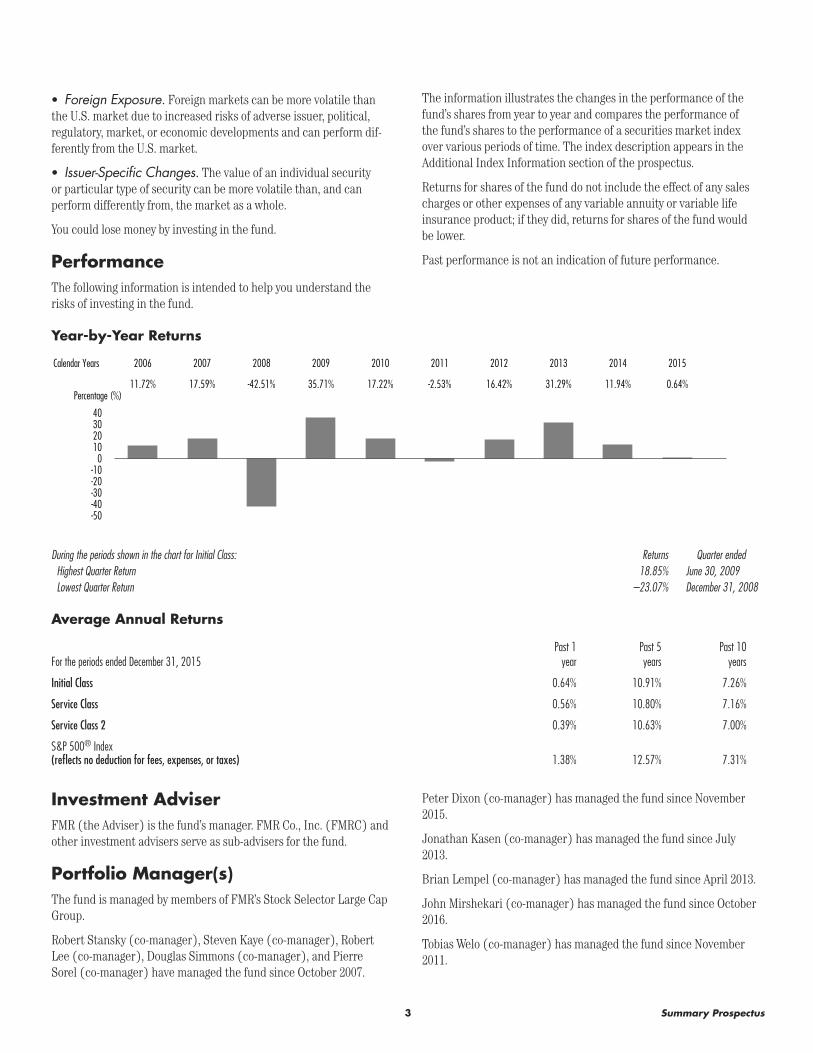
3 Summary Prospectus
• Foreign Exposure. Foreign markets can be more volatile than the U.S. market due to increased risks of adverse issuer, political, regulatory, market, or economic developments and can perform dif-ferently from the U.S. market.
• Issuer-Specific Changes. The value of an individual security or particular type of security can be more volatile than, and can perform differently from, the market as a whole.
You could lose money by investing in the fund.
PerformanceThe following information is intended to help you understand the risks of investing in the fund.
The information illustrates the changes in the performance of the fund’s shares from year to year and compares the performance of the fund’s shares to the performance of a securities market index over various periods of time. The index description appears in the Additional Index Information section of the prospectus.
Returns for shares of the fund do not include the effect of any sales charges or other expenses of any variable annuity or variable life insurance product; if they did, returns for shares of the fund would be lower.
Past performance is not an indication of future performance.
Year-by-Year Returns
403020100
-10-20-30-40-50
2015201420132012201120102009200820072006
0.64%11.94%31.29%16.42%-2.53%17.22%35.71%-42.51%17.59%11.72%
Calendar Years
Percentage (%)
During the periods shown in the chart for Initial Class: Returns Quarter endedHighest Quarter Return 18.85% June 30, 2009Lowest Quarter Return –23.07% December 31, 2008
Average Annual Returns
For the periods ended December 31, 2015Past 1
yearPast 5 years
Past 10 years
Initial Class 0.64% 10.91% 7.26%
Service Class 0.56% 10.80% 7.16%
Service Class 2 0.39% 10.63% 7.00%
S&P 500® Index (reflects no deduction for fees, expenses, or taxes) 1.38% 12.57% 7.31%
Investment AdviserFMR (the Adviser) is the fund’s manager. FMR Co., Inc. (FMRC) and other investment advisers serve as sub-advisers for the fund.
Portfolio Manager(s)The fund is managed by members of FMR’s Stock Selector Large Cap Group.
Robert Stansky (co-manager), Steven Kaye (co-manager), Robert Lee (co-manager), Douglas Simmons (co-manager), and Pierre Sorel (co-manager) have managed the fund since October 2007.
Peter Dixon (co-manager) has managed the fund since November 2015.
Jonathan Kasen (co-manager) has managed the fund since July 2013.
Brian Lempel (co-manager) has managed the fund since April 2013.
John Mirshekari (co-manager) has managed the fund since October 2016.
Tobias Welo (co-manager) has managed the fund since November 2011.
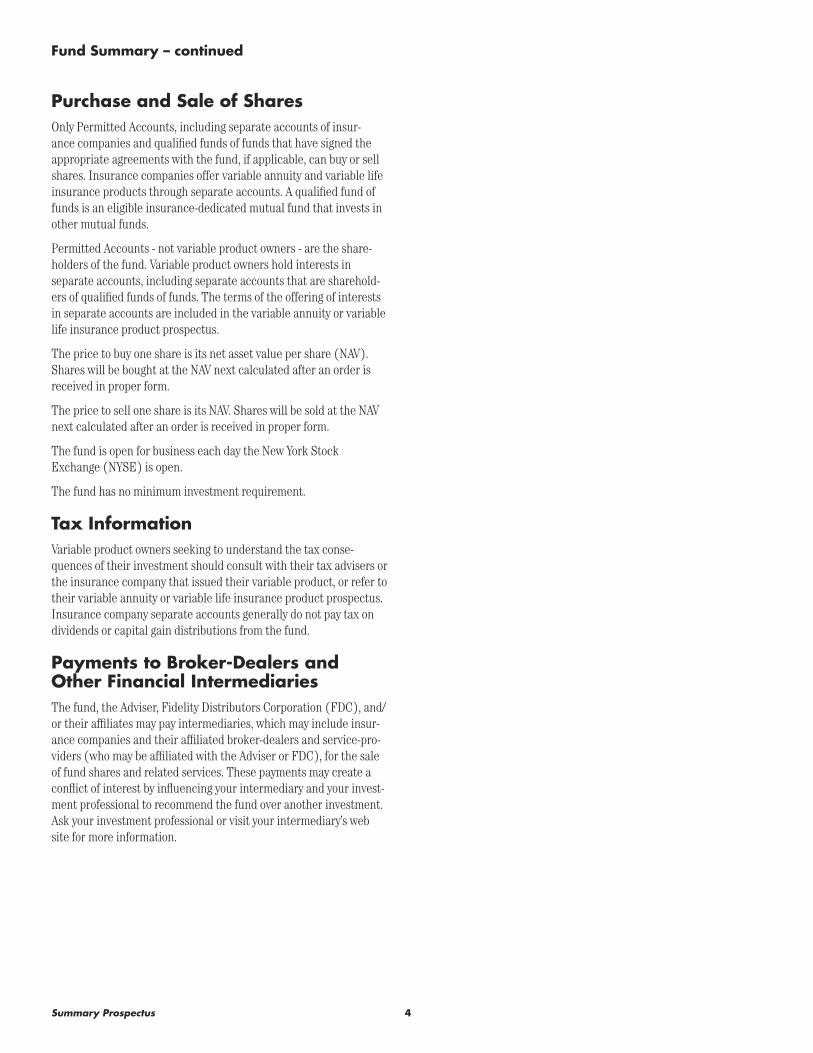
4Summary Prospectus
Fund Summary – continued
Purchase and Sale of SharesOnly Permitted Accounts, including separate accounts of insur-ance companies and qualified funds of funds that have signed the appropriate agreements with the fund, if applicable, can buy or sell shares. Insurance companies offer variable annuity and variable life insurance products through separate accounts. A qualified fund of funds is an eligible insurance-dedicated mutual fund that invests in other mutual funds.
Permitted Accounts - not variable product owners - are the share-holders of the fund. Variable product owners hold interests in separate accounts, including separate accounts that are sharehold-ers of qualified funds of funds. The terms of the offering of interests in separate accounts are included in the variable annuity or variable life insurance product prospectus.
The price to buy one share is its net asset value per share (NAV). Shares will be bought at the NAV next calculated after an order is received in proper form.
The price to sell one share is its NAV. Shares will be sold at the NAV next calculated after an order is received in proper form.
The fund is open for business each day the New York Stock Exchange (NYSE) is open.
The fund has no minimum investment requirement.
Tax InformationVariable product owners seeking to understand the tax conse-quences of their investment should consult with their tax advisers or the insurance company that issued their variable product, or refer to their variable annuity or variable life insurance product prospectus. Insurance company separate accounts generally do not pay tax on dividends or capital gain distributions from the fund.
Payments to Broker-Dealers and Other Financial IntermediariesThe fund, the Adviser, Fidelity Distributors Corporation (FDC), and/or their affiliates may pay intermediaries, which may include insur-ance companies and their affiliated broker-dealers and service-pro-viders (who may be affiliated with the Adviser or FDC), for the sale of fund shares and related services. These payments may create a conflict of interest by influencing your intermediary and your invest-ment professional to recommend the fund over another investment. Ask your investment professional or visit your intermediary’s web site for more information.


FDC is a member of the Securities Investor Protection Corporation (SIPC). You may obtain information about SIPC, including the SIPC brochure, by visiting www.sipc.org or calling SIPC at 202-371-8300.
Fidelity, Contrafund, and Fidelity Investments & Pyramid Design are registered service marks of FMR LLC. © 2016 FMR LLC. All rights reserved.
VIP Contrafund is a service mark of FMR LLC.
Any third-party marks that may appear above are the marks of their respective owners.
The term “VIP” as used in this document refers to Fidelity® Variable Insurance Products.
1.907822.113 VCON-SUM-0416-02
LV638FIS-03 Accompanies FVA, IPVA old, IPVA new, Pivot and all VL Prospectuses

PIMCO All Asset Portfolio
PVIT | SUMMARY PROSPECTUS
SUMMARY PROSPECTUSApril 29, 2016 (as supplemented November 7, 2016)§
Share Class: Administrative Summary Prospectus
Before you invest, you may want to review the Portfolio’s prospectus, which, assupplemented, contains more information about the Portfolio and its risks. You can find thePortfolio’s prospectus and other information about the Portfolio online at http://pvit.pimco-funds.com/FundReports.aspx. You can also get this information at no cost by calling1.800.927.4648 or by sending an email request to [email protected]. ThePortfolio’s prospectus and Statement of Additional Information, both dated April 29, 2016,as supplemented, along with the financial statements included in the Portfolio’s most recentannual report to shareholders dated December 31, 2015, are incorporated by reference intothis Summary Prospectus.
Investment ObjectiveThe Portfolio seeks maximum real return, consistent with preservation ofreal capital and prudent investment management.
Fees and Expenses of the PortfolioThis table describes the fees and expenses that you may pay if you buy andhold Administrative Class shares of the Portfolio. Overall fees and expensesof investing in the Portfolio are higher than shown because the table doesnot reflect variable contract fees and expenses.
Shareholder Fees (fees paid directly from your investment): None
Annual Portfolio Operating Expenses (expenses that you payeach year as a percentage of the value of your investment):
AdministrativeClass
Management Fees 0.425%
Distribution and/or Service (12b-1) Fees 0.15%
Acquired Fund Fees and Expenses(1) 0.83%
Total Annual Portfolio Operating Expenses(2)(3) 1.405%
Fee Waiver and/or Expense Reimbursement(4) (0.16%)
Total Annual Portfolio Operating Expenses After Fee Waiver and/orExpenses Reimbursement(5)
1.245%
1 Acquired Fund Fees and Expenses include interest expense of 0.03%. Interest expense isbased on the amount incurred during an Underlying PIMCO Fund’s most recent fiscalyear as a result of entering into certain investments, such as reverse repurchaseagreements. Interest expense is required to be treated as an expense of the UnderlyingPIMCO Fund for accounting purposes and is not payable to PIMCO. The amount ofinterest expense (if any) will vary based on the Underlying PIMCO Fund’s use of suchinvestments as an investment strategy.
2 Total Annual Portfolio Operating Expenses excluding interest expense of the UnderlyingPIMCO Funds is 1.375% for the Administrative Class shares.
3 Total Annual Portfolio Operating Expenses do not match the Ratio of Expenses toAverage Net Assets excluding Waivers of the Portfolio as set forth in the FinancialHighlights table of the prospectus, because the Ratio of Expenses to Average Net Assetsexcluding Waivers reflects the operating expenses of the Portfolio and does not includeAcquired Fund Fees and Expenses.
4 PIMCO has contractually agreed, through May 1, 2017, to reduce its advisory fee to theextent that the Underlying PIMCO Fund Expenses attributable to advisory andsupervisory and administrative fees exceed 0.64% of the total assets invested inUnderlying PIMCO Funds. PIMCO may recoup these waivers in future periods, notexceeding three years, provided total expenses, including such recoupment, do not
exceed the annual expense limit. The fee reduction is implemented based on acalculation of Underlying PIMCO Fund Expenses attributable to advisory and supervisoryand administrative fees that is different from the calculation of Acquired Fund Fees andExpenses listed in the table above.
5 Total Annual Portfolio Operating Expenses After Fee Waiver and/or ExpenseReimbursement excluding interest expense of the Underlying PIMCO Funds is 1.215%for the Administrative Class shares.
Example. The Example is intended to help you compare the cost ofinvesting in Administrative Class shares of the Portfolio with the costs ofinvesting in other mutual funds. The Example assumes that you invest$10,000 for the time periods indicated, and then redeem all your shares atthe end of those periods. The Example also assumes that your investmenthas a 5% return each year and that the Portfolio’s operating expensesremain the same. Although your actual costs may be higher or lower, theExample shows what your costs would be based on these assumptions. TheExample does not reflect fees and expenses of any variable annuity contractor variable life insurance policy, and would be higher if it did.
1 Year 3 Years 5 Years 10 Years
Administrative Class $127 $429 $753 $1,671
Portfolio TurnoverThe Portfolio pays transaction costs when it buys and sells securities (or“turns over” its portfolio). A higher portfolio turnover rate may indicatehigher transaction costs. These costs, which are not reflected in the AnnualPortfolio Operating Expenses or in the Example table, affect the Portfolio’sperformance. During the most recent fiscal year, the Portfolio’s portfolioturnover rate was 41% of the average value of its portfolio.
Principal Investment StrategiesThe Portfolio seeks to achieve its investment objective by investing undernormal circumstances substantially all of its assets in Institutional Class orClass M shares of any funds of the PIMCO Funds and PIMCO Equity Series,affiliated open-end investment companies, except other funds of funds, orshares of any actively-managed funds of the PIMCO ETF Trust, an affiliatedinvestment company (collectively, “Underlying PIMCO Funds”). The Portfolioinvests its assets in shares of the Underlying PIMCO Funds and does notinvest directly in stocks or bonds of other issuers. Research Affiliates, LLC,the Portfolio’s asset allocation sub-adviser, determines how the Portfolioallocates and reallocates its assets among the Underlying PIMCO Funds. Indoing so, the asset allocation sub-adviser seeks concurrent exposure to abroad spectrum of asset classes.
The Portfolio may invest in any or all of the Underlying PIMCO Funds, butwill not normally invest in every Underlying PIMCO Fund at any particulartime. The Portfolio’s investment in a particular Underlying PIMCO Fundnormally will not exceed 50% of its total assets. The Portfolio will not investin the Short Strategy Underlying PIMCO Funds, which seek to gain anegative exposure to an asset class such as equities or commodities. ThePortfolio’s combined investments in the Equity-Related Underlying PIMCOFunds will not exceed 50% of its total assets. In addition, the Portfolio’scombined investments in Inflation-Related Underlying PIMCO Funds, whichseek to gain exposure to an asset class such as U.S. Treasury Inflation-
PIMCO All Asset Portfolio
. SUMMARY PROSPECTUS | PVIT2
Protected Securities (“TIPS”), commodities, or real estate, normally will notexceed 75% of its total assets.
The Portfolio’s assets are not allocated according to a predetermined blendof shares of the Underlying PIMCO Funds. Instead,when making allocationdecisions among the Underlying PIMCO Funds, the Portfolio’s assetallocation sub-adviser considers various quantitative and qualitative datarelating to the U.S. and foreign economies and securities markets. Such dataincludes projected growth trends in the U.S. and foreign economies,forecasts for interest rates and the relationship between short-and long-term interest rates (yield curve), current and projected trends in inflation,relative valuation levels in the equity and fixed income markets and varioussegments within those markets, the outlook and projected growth ofvarious industrial sectors, information relating to business cycles, borrowingneeds and the cost of capital, political trends, data relating to tradebalances and labor information. The Portfolio’s asset allocation sub-adviserhas the flexibility to reallocate the Portfolio’s assets among any or all of theasset class exposures represented by the Underlying PIMCO Funds basedon its ongoing analyses of the equity, fixed income and commodity markets.While these analyses are performed daily, material shifts in asset classexposures typically take place over longer periods of time.
The Portfolio is a “fund of funds,” which is a term used to describe mutualfunds that pursue their investment objective by investing in other mutualfunds. In addition to investing in the Underlying PIMCO Funds, at thediscretion of Pacific Investment Management Company LLC (“PIMCO”) andwithout shareholder approval, the Portfolio may invest in additionalUnderlying PIMCO Funds created in the future.
Principal RisksIt is possible to lose money on an investment in the Portfolio. The principalrisks of investing in the Portfolio, which could adversely affect its net assetvalue, yield and total return, are:
Allocation Risk: the risk that a Portfolio could lose money as a result ofless than optimal or poor asset allocation decisions as to how its assets areallocated or reallocated. The Portfolio could miss attractive investmentopportunities by underweighting markets that subsequently experiencesignificant returns and could lose value by overweighting markets thatsubsequently experience significant declines
Fund of Funds Risk: the risk that a Portfolio’s performance is closelyrelated to the risks associated with the securities and other investmentsheld by the Underlying PIMCO Funds and that the ability of a Portfolio toachieve its investment objective will depend upon the ability of theUnderlying PIMCO Funds to achieve their investment objectives
The principal risks of investing in the Underlying PIMCO Funds, andconsequently the Portfolio, which could adversely affect its net asset value,yield and total return, are:
Market Trading Risk: the risk that an active secondary trading market forshares of an Underlying PIMCO Fund that is an exchange-traded fund doesnot continue once developed, that such Underlying PIMCO Fund may notcontinue to meet a listing exchange’s trading or listing requirements, or thatsuch Underlying PIMCO Fund’s shares trade at prices other than the Fund’snet asset value
Municipal Project-Specific Risk: the risk that an Underlying PIMCOFund may be more sensitive to adverse economic, business or politicaldevelopments if it invests a substantial portion of its assets in the bonds ofspecific projects (such as those relating to education, health care, housing,transportation, and utilities), industrial development bonds, or in bondsfrom issuers in a single state
Municipal Bond Risk: the risk that an Underlying PIMCO Fund may beaffected significantly by the economic, regulatory or political developmentsaffecting the ability of issuers of debt securities whose interest is, in theopinion of bond counsel for the issuer at the time of issuance, exempt fromfederal income tax (“Municipal Bonds”) to pay interest or repay principal
Interest Rate Risk: the risk that fixed income securities will decline invalue because of an increase in interest rates; a portfolio with a longeraverage portfolio duration will be more sensitive to changes in interest ratesthan a portfolio with a shorter average portfolio duration
Call Risk: the risk that an issuer may exercise its right to redeem a fixedincome security earlier than expected (a call). Issuers may call outstandingsecurities prior to their maturity for a number of reasons (e.g., declininginterest rates, changes in credit spreads and improvements in the issuer’scredit quality). If an issuer calls a security that the Portfolio has invested in,the Portfolio may not recoup the full amount of its initial investment andmay be forced to reinvest in lower-yielding securities, securities with greatercredit risks or securities with other, less favorable features
Credit Risk: the risk that the Portfolio could lose money if the issuer orguarantor of a fixed income security, or the counterparty to a derivativecontract, is unable or unwilling to meet its financial obligations
High Yield Risk: the risk that high yield securities and unrated securities ofsimilar credit quality (commonly known as “junk bonds”) are subject togreater levels of credit, call and liquidity risks. High yield securities areconsidered primarily speculative with respect to the issuer’s continuingability to make principal and interest payments, and may be more volatilethan higher-rated securities of similar maturity
Distressed Company Risk: the risk that securities of distressedcompanies may be subject to greater levels of credit, issuer and liquidity riskthan a portfolio that does not invest in such securities. Securities ofdistressed companies include both debt and equity securities. Debtsecurities of distressed companies are considered predominantly speculativewith respect to the issuers’ continuing ability to make principal and interestpayments
Market Risk: the risk that the value of securities owned by the Portfoliomay go up or down, sometimes rapidly or unpredictably, due to factorsaffecting securities markets generally or particular industries
Issuer Risk: the risk that the value of a security may decline for a reasondirectly related to the issuer, such as management performance, financialleverage and reduced demand for the issuer’s goods or services
Liquidity Risk: the risk that a particular investment may be difficult topurchase or sell and that the Portfolio may be unable to sell illiquidsecurities at an advantageous time or price or achieve its desired level ofexposure to a certain sector. Liquidity risk may result from the lack of anactive market, reduced number and capacity of traditional market
Summary Prospectus
April 29, 2016 (as supplemented November 7, 2016) | SUMMARY PROSPECTUS .3
participants to make a market in fixed income securities, and may bemagnified in a rising interest rate environment or other circumstanceswhere investor redemptions from fixed income mutual funds may be higherthan normal, causing increased supply in the market due to selling activity
Derivatives Risk: the risk of investing in derivative instruments (such asfutures, swaps and structured securities), including liquidity, interest rate,market, credit and management risks, mispricing or valuation complexity.Changes in the value of the derivative may not correlate perfectly with, andmay be more sensitive to market events than, the underlying asset, rate orindex, and the Portfolio could lose more than the initial amount invested.An Underlying PIMCO Fund’s use of derivatives may result in losses to thePortfolio, a reduction in the Portfolio’s returns and/or increased volatility.Over-the-counter (“OTC”) derivatives are also subject to the risk that acounterparty to the transaction will not fulfill its contractual obligations tothe other party, as many of the protections afforded to centrally-clearedderivative transactions might not be available for OTC derivatives. Forderivatives traded on an exchange or through a central counterparty, creditrisk resides with the creditworthiness of the Portfolio’s clearing broker, orthe clearinghouse itself, rather than to a counterparty in an OTC derivativetransaction. Changes in regulation relating to a mutual fund’s use ofderivatives and related instruments could potentially limit or impact thePortfolio’s ability to invest in derivatives, limit the Portfolio’s ability to employcertain strategies that use derivatives and/or adversely affect the value orperformance of derivatives and the Portfolio
Futures Contract Risk: the risk that, while the value of a futures contracttends to correlate with the value of the underlying asset that it represents,differences between the futures market and the market for the underlyingasset may result in an imperfect correlation. Futures contracts may involverisks different from, and possibly greater than, the risks associated withinvesting directly in the underlying assets. The purchase or sale of a futurescontract may result in losses in excess of the amount invested in the futurescontract
Model Risk: the risk that an Underlying PIMCO Fund’s investment modelsused in making investment allocation decisions may not adequately takeinto account certain factors and may result in a decline in the value of aninvestment in the Underlying PIMCO Fund
Commodity Risk: the risk that investing in commodity-linked derivativeinstruments may subject the Portfolio to greater volatility than investmentsin traditional securities. The value of commodity-linked derivativeinstruments may be affected by changes in overall market movements,commodity index volatility, changes in interest rates, or factors affecting aparticular industry or commodity, such as drought, floods, weather, livestockdisease, embargoes, tariffs and international economic, political andregulatory developments
Equity Risk: the risk that the value of equity securities, such as commonstocks and preferred stocks, may decline due to general market conditionswhich are not specifically related to a particular company or to factorsaffecting a particular industry or industries. Equity securities generally havegreater price volatility than fixed income securities
Mortgage-Related and Other Asset-Backed Securities Risk: therisks of investing in mortgage-related and other asset-backed securities,including interest rate risk, extension risk, prepayment risk, and credit risk
Foreign (Non-U.S.) Investment Risk: the risk that investing in foreign(non-U.S.) securities may result in the Portfolio experiencing more rapid andextreme changes in value than a portfolio that invests exclusively insecurities of U.S. companies, due to smaller markets, differing reporting,accounting and auditing standards, increased risk of delayed settlement ofportfolio transactions or loss of certificates of portfolio securities, and therisk of unfavorable foreign government actions, including nationalization,expropriation or confiscatory taxation, currency blockage, or politicalchanges or diplomatic developments. Foreign securities may also be lessliquid and more difficult to value than securities of U.S. issuers
Real Estate Risk: the risk that a Portfolio’s investments in Real EstateInvestment Trusts (“REITs”) or real estate-linked derivative instruments willsubject the Portfolio to risks similar to those associated with directownership of real estate, including losses from casualty or condemnation,and changes in local and general economic conditions, supply and demand,interest rates, zoning laws, regulatory limitations on rents, property taxesand operating expenses. A Portfolio’s investments in REITs or real estate-linked derivative instruments subject it to management and tax risks. Inaddition, privately traded REITs subject a Portfolio to liquidity and valuationrisk
Emerging Markets Risk: the risk of investing in emerging marketsecurities, primarily increased foreign (non-U.S.) investment risk
Sovereign Debt Risk: the risk that investments in fixed incomeinstruments issued by sovereign entities may decline in value as a result ofdefault or other adverse credit event resulting from an issuer’s inability orunwillingness to make principal or interest payments in a timely fashion
Currency Risk: the risk that foreign (non-U.S.) currencies will decline invalue relative to the U.S. dollar and affect the Portfolio’s investments inforeign (non-U.S.) currencies or in securities that trade in, and receiverevenues in, or in derivatives that provide exposure to, foreign (non-U.S.)currencies
Leveraging Risk: the risk that certain transactions of the Portfolio, such asreverse repurchase agreements, loans of portfolio securities, and the use ofwhen-issued, delayed delivery or forward commitment transactions, orderivative instruments, may give rise to leverage, magnifying gains andlosses and causing the Portfolio to be more volatile than if it had not beenleveraged. This means that leverage entails a heightened risk of loss
Smaller Company Risk: the risk that the value of securities issued by asmaller company may go up or down, sometimes rapidly and unpredictablyas compared to more widely held securities, due to narrow markets andlimited resources of smaller companies. A Portfolio’s investments in smallercompanies subject it to greater levels of credit, market and issuer risk
Issuer Non-Diversification Risk: the risks of focusing investments in asmall number of issuers, including being more susceptible to risksassociated with a single economic, political or regulatory occurrence than amore diversified portfolio might be. Portfolios that are “non-diversified”may invest a greater percentage of their assets in the securities of a single

PIMCO All Asset Portfolio
. SUMMARY PROSPECTUS | PVIT4
issuer (such as bonds issued by a particular state) than portfolios that are“diversified”
Management Risk: the risk that the investment techniques and riskanalyses applied by PIMCO will not produce the desired results and thatlegislative, regulatory, or tax restrictions, policies or developments mayaffect the investment techniques available to PIMCO and the individualportfolio manager in connection with managing the Portfolio. There is noguarantee that the investment objective of the Portfolio will be achieved
Short Sale Risk: the risk of entering into short sales, including thepotential loss of more money than the actual cost of the investment, andthe risk that the third party to the short sale may fail to honor its contractterms, causing a loss to the Portfolio
Tax Risk: the risk that the tax treatment of swap agreements and otherderivative instruments, such as commodity-linked derivative instruments,including commodity index-linked notes, swap agreements, commodityoptions, futures, and options on futures, may be affected by futureregulatory or legislative changes that could affect whether income fromsuch investments is “qualifying income” under Subchapter M of the InternalRevenue Code, or otherwise affect the character, timing and/or amount ofthe Portfolio’s taxable income or gains and distributions
Subsidiary Risk: the risk that, by investing in certain Underlying PIMCOFunds that invest in a subsidiary (each a “Subsidiary”), the Portfolio isindirectly exposed to the risks associated with a Subsidiary’s investments.The Subsidiaries are not registered under the 1940 Act and may not besubject to all the investor protections of the 1940 Act. There is no guaranteethat the investment objective of a Subsidiary will be achieved
Value Investing Risk: a value stock may decrease in price or may notincrease in price as anticipated by PIMCO if it continues to be undervaluedby the market or the factors that the portfolio manager believes will causethe stock price to increase do not occur
Arbitrage Risk: the risk that securities purchased pursuant to an arbitragestrategy intended to take advantage of a perceived relationship betweenthe value of two securities may not perform as expected
Convertible Securities Risk: as convertible securities share both fixedincome and equity characteristics, they are subject to risks to which fixedincome and equity investments are subject. These risks include equity risk,interest rate risk and credit risk
Please see “Description of Principal Risks” in the Portfolio’s prospectus for amore detailed description of the risks of investing in the Portfolio. Aninvestment in the Portfolio is not a deposit of a bank and is not insured orguaranteed by the Federal Deposit Insurance Corporation or any othergovernment agency.
Performance InformationThe performance information below shows summary performanceinformation for the Portfolio in a bar chart and an Average Annual TotalReturns table. The information provides some indication of the risks ofinvesting in the Portfolio by showing changes in its performance from yearto year and by showing how the Portfolio’s average annual returns comparewith the returns of a broad-based securities market index and an index of
similar funds. The Portfolio’s performance information reflects applicable feewaivers and/or expense limitations in effect during the periods presented.Absent such fee waivers and/or expense limitations, if any, performancewould have been lower. Performance shown does not reflect any charges orexpenses imposed by an insurance company and if it did, performanceshown would be lower. The bar chart and the table show performance ofthe Portfolio’s Administrative Class shares. The Portfolio’s past performanceis not necessarily an indication of how the Portfolio will perform in thefuture.
The Portfolio measures its performance against two benchmarks. TheBarclays U.S. TIPS: 1-10 Year Index, the primary benchmark, is anunmanaged index comprised of U.S. Treasury Inflation-Protected securitieshaving a maturity of at least 1 year and less than 10 years. The CPI + 500Basis Points benchmark, the secondary benchmark is created by adding 5%to the annual percentage change in the Consumer Price Index (“CPI”). Theindex reflects seasonally adjusted returns. The CPI is an unmanaged indexrepresenting the rate of inflation of the U.S. consumer prices as determinedby the U.S. Bureau of Labor Statistics. There can be no guarantee that theCPI or other indexes will reflect the exact level of inflation at any given time.
Performance for the Portfolio is updated daily and monthly and may beobtained as follows: daily updates on the net asset value may be obtainedby calling 1-888-87-PIMCO and monthly performance may be obtained athttp://pvit.pimco-funds.com.
Calendar Year Total Returns — Administrative Class*
'06 '07 '08 '09 '10 '11 '12 '13 '14 '15-30
-20
-10
0
10
20
30
4.66%8.33%
-15.84%
21.57%
13.09%
1.95%
14.95%
0.27% 0.47%
-8.99%
(%)
Years
*For the periods shown in the bar chart, the highest quarterly return was 12.11% in the Q22009, and the lowest quarterly return was -8.74% in the Q3 2015.
Average Annual Total Returns (for periods ended 12/31/15)1 Year 5 Years 10 Years
Administrative Class Return -8.99% 1.45% 3.49%
Barclays U.S. TIPS: 1-10 Year Index (reflects nodeductions for fees, expenses or taxes)
-0.52% 1.64% 3.51%
Consumer Price Index + 500 Basis Points (reflects nodeductions for fees, expenses or taxes)
5.66% 6.53% 6.85%
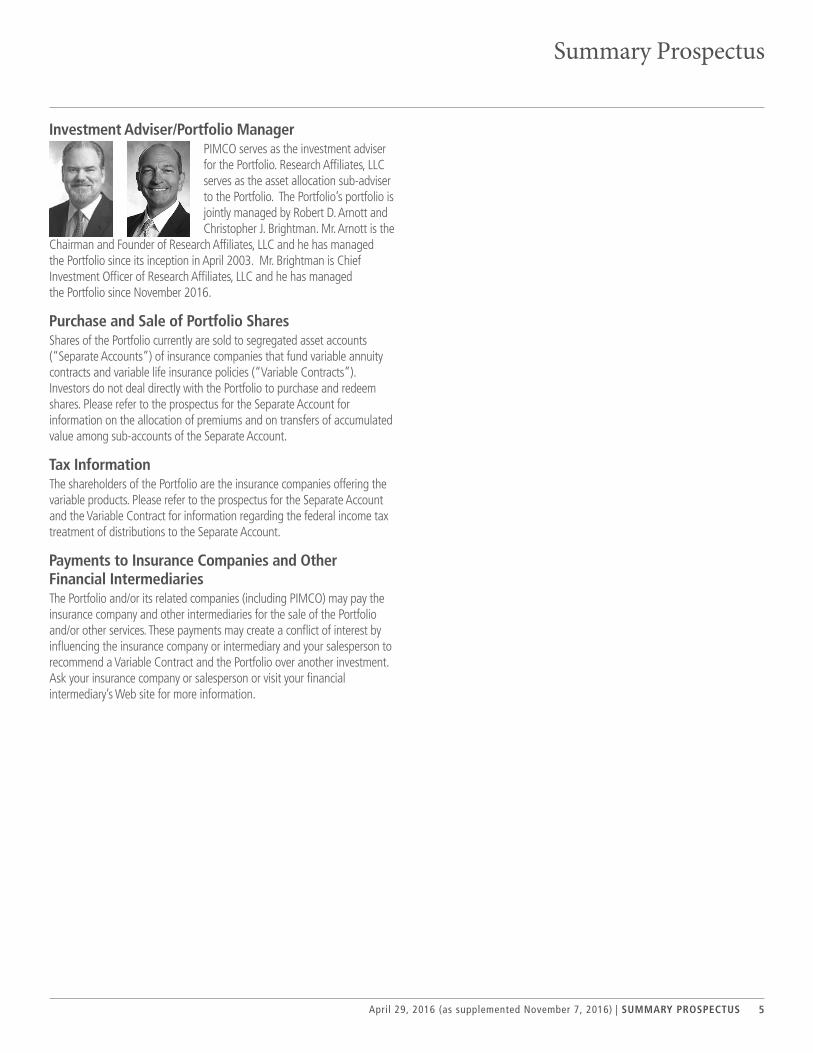
Summary Prospectus
April 29, 2016 (as supplemented November 7, 2016) | SUMMARY PROSPECTUS .5
Investment Adviser/Portfolio ManagerPIMCO serves as the investment adviserfor the Portfolio. Research Affiliates, LLCserves as the asset allocation sub-adviserto the Portfolio. The Portfolio’s portfolio isjointly managed by Robert D. Arnott andChristopher J. Brightman. Mr. Arnott is the
Chairman and Founder of Research Affiliates, LLC and he has managedthe Portfolio since its inception in April 2003. Mr. Brightman is ChiefInvestment Officer of Research Affiliates, LLC and he has managedthe Portfolio since November 2016.
Purchase and Sale of Portfolio SharesShares of the Portfolio currently are sold to segregated asset accounts(“Separate Accounts”) of insurance companies that fund variable annuitycontracts and variable life insurance policies (“Variable Contracts”).Investors do not deal directly with the Portfolio to purchase and redeemshares. Please refer to the prospectus for the Separate Account forinformation on the allocation of premiums and on transfers of accumulatedvalue among sub-accounts of the Separate Account.
Tax InformationThe shareholders of the Portfolio are the insurance companies offering thevariable products. Please refer to the prospectus for the Separate Accountand the Variable Contract for information regarding the federal income taxtreatment of distributions to the Separate Account.
Payments to Insurance Companies and OtherFinancial IntermediariesThe Portfolio and/or its related companies (including PIMCO) may pay theinsurance company and other intermediaries for the sale of the Portfolioand/or other services. These payments may create a conflict of interest byinfluencing the insurance company or intermediary and your salesperson torecommend a Variable Contract and the Portfolio over another investment.Ask your insurance company or salesperson or visit your financialintermediary’s Web site for more information.

THIS PAGE WAS INTENTIONALLY LEFT BLANK

THIS PAGE WAS INTENTIONALLY LEFT BLANK

PVIT0328S_110716
LV612PCS-13 Accompanies IPVA old, IPVA new, EVUL, BVUL, EVUL II and BVUL II Prospectuses

SUPPLEMENT TO:
Calvert Variable Products Index Prospectus (Class I and Single Class)dated May 1, 2016
Calvert Variable Products Prospectus (Class F)dated May 1, 2016
Calvert VP EAFE International Index Portfolio Summary Prospectus (Class I)dated May 1, 2016
Calvert VP EAFE International Index Portfolio Summary Prospectus (Class F)dated May 1, 2016
Date of Supplement: November 3, 2016
The information in this Supplement updates information in each Prospectus and Summary Prospectus, supersedes any contrary information included therein or in any prior supplement, and should be read in conjunction with each Prospectus and Summary Prospectus.
The information in this Supplement is subject to the closing of the Transaction (the “Closing”) that is described in the Supplement dated October 24, 2016 to each Prospectus and Summary Prospectus. It is anticipated that, upon the Closing, the Fund listed below will be managed by a new portfolio manager.
Calvert VP EAFE International Index Portfolio
Anticipated Portfolio Manager:
Thomas Seto is Head of Investment Management at the Seattle Investment Center of Parametric Portfolio Associates LLC (“Parametric”), an affiliate of Calvert Research and Management. Mr. Seto has been an employee of Parametric since 1998 and manages other funds and portfolios.
Investors Should Retain This Supplement for Future Reference
LV6 CAS-02 Accompanies Pivot, EVUL II and BVUL II Prospectuses


LV610CAS-01 Accompanies Pivot and all VL Prospectuses

DELAWARE VIP® TRUST
Delaware VIP High Yield Series (the “Series”)
Supplement to the Series’ Standard Class and Service Class Summary Prospectuses dated April 29, 2016
Effective as of the date of this supplement, the following replaces the information in the summary prospectus section entitled “Who manages the Series? – Investment manager”: Investment manager Delaware Management Company, a series of Delaware Management Business Trust (a Delaware statutory trust)
Portfolio managers Title with Delaware Management Company Start date on the Series
John P. McCarthy Senior Vice President, Senior Portfolio Manager, Co-Head of Credit Research December 2012
Adam H. Brown, CFA Senior Vice President, Senior Portfolio Manager November 2014
Craig C. Dembek, CFA Senior Vice President, Co-Head of Credit Research, Senior Research Analyst December 2012
Paul A. Matlack, CFA Senior Vice President, Senior Portfolio Manager, Fixed Income Strategist December 2012
Delaware Management Company (Manager) is an indirect wholly owned subsidiary of Macquarie Group Limited (MGL). Neither the Manager nor its affiliates referred to in this document are authorized deposit-taking institutions for the purposes of the Banking Act 1959 (Commonwealth of Australia). The obligations of these entities do not represent deposits or other liabilities of Macquarie Bank Limited (MBL), a subsidiary of MGL and an affiliate of the Manager. MBL does not guarantee or otherwise provide assurance in respect of the obligations of these entities, unless noted otherwise. The Series is governed by U.S. laws and regulations.
Please keep this Supplement for future reference. This Supplement is dated October 12, 2016.
PS-VHYPMCHG2 [--] PDF 10/16 PO21291
LV621DES-01 Accompanies EVUL, BVUL, EVUL II and BVUL II Prospectuses

Janus Aspen SeriesBalanced PortfolioEnterprise Portfolio
Flexible Bond PortfolioForty Portfolio
Global Allocation Portfolio – ModerateGlobal Bond Portfolio
Global Research PortfolioGlobal Technology Portfolio
Global Unconstrained Bond PortfolioJanus Aspen INTECH U.S. Low Volatility PortfolioJanus Aspen Perkins Mid Cap Value Portfolio
Janus PortfolioOverseas Portfolio
(collectively, the “Portfolios”)
Supplement dated October 11, 2016to Currently Effective Prospectuses
On October 3, 2016, Janus Capital Group Inc. (“JCGI”), the direct parent of Janus Capital Management LLC, the investmentadviser to the Portfolios (“Janus Capital”), and Henderson Group plc (“Henderson”) announced that they had entered into anAgreement and Plan of Merger (“Merger Agreement”) relating to the business combination of Henderson and JCGI (the“Merger”). Pursuant to the Merger Agreement, a newly formed, direct wholly-owned subsidiary of Henderson will merge withand into JCGI, with JCGI as the surviving corporation and a direct wholly-owned subsidiary of Henderson. The Merger isexpected to close in the second quarter of 2017, subject to requisite shareholder and regulatory approvals.
The consummation of the Merger will be deemed to be an “assignment” (as defined in the Investment Company Act of 1940, asamended) of the advisory agreements between the Portfolios and Janus Capital. In addition, the consummation of the Mergerwill be deemed to be an assignment of the subadvisory agreements between Janus Capital and each of Perkins InvestmentManagement LLC (“Perkins”) and INTECH Investment Management LLC (“INTECH”), the subadvisers to certain of thePortfolios. As a result, the consummation of the Merger will cause such advisory and subadvisory agreements to terminateautomatically in accordance with their respective terms. It is anticipated that the Board of Trustees of the Portfolios (the“Trustees”) will consider new advisory agreements with Janus Capital and new subadvisory agreements with each of Perkins andINTECH, as applicable, after taking into consideration the potential post-merger ownership structure of Janus Capital. Ifapproved by the Trustees, the new agreements will be presented to the Portfolios’ shareholders for approval, and, if so approvedby shareholders, will take effect upon the consummation of the Merger or such later time as shareholder approval is obtained.
Please retain this Supplement with your records.109-31-69611 10-16109-31-69612 10-16
LV599JAS-10 Accompanies FVA, IPVA Old, IPVA New, Pivot, FVLI , PFLX, SVUL, Accum, EVUL, BVUL, VULI II, EVUL II, BVUL II and VULI III Prospectuses

VK VIAMFR SUMPRO 2 SUP 1
VK VIAMFR SUMPRO 2 SUP 1
Summary Prospectus Supplement dated October 3, 2016
The purpose of this supplement is to provide you with changes to the current Summary Prospectus for Series II shares of the Fund listed below:
Invesco V.I. American Franchise Fund
The following information replaces in its entirety the information appearing under the heading “Fees and Expenses of the Fund” in the prospectus:
“This table describes the fees and expenses that are incurred, directly or indirectly, when a variable product owner buys, holds,or redeems interest in an insurance company separate account that invests in the Series II shares of the Fund but does not represent the effect of any fees or other expenses assessed in connection with your variable product, and if it did, expenses would be higher. ------------------------------------------------------------------------------------------------------------------------------------------------------------------------
Shareholder Fees (fees paid directly from your investment) Series II shares
Maximum Sales Charge (Load) Imposed on Purchases (as a percentage of offering price) None
Maximum Deferred Sales Charge (Load) (as a percentage of original purchase price or redemption proceeds, whichever is less) None
Annual Fund Operating Expenses (expenses that you pay each year as a percentage of the value of your investment) ------------------------------------------------------------------------------------------------------------------------------------------------------------------------
Series II shares Management Fees 0.67% Distribution and/or Service (12b-1) Fees 0.25Other Expenses1 0.21Total Annual Fund Operating Expenses 1.13
1 “Other Expenses” have been restated to reflect current fees.
Example. This Example is intended to help you compare the cost of investing in the Fund with the cost of investing in other mutual funds.
This Example does not represent the effect of any fees or expenses assessed in connection with your variable product, and if it did, expenses would be higher.
The Example assumes that you invest $10,000 in the Fund for the time periods indicated and then redeem all of your shares at the end of those periods. The Example also assumes that your investment has a 5% return each year and that the Fund’s operating expenses remain the same.
Although your actual costs may be higher or lower, based on these assumptions your costs would be:
1 Year 3 Years 5 Years 10 Years
Series II shares $115 $359 $622 $1,375
Portfolio Turnover. The Fund pays transaction costs, such as commissions, when it buys and sells securities (or “turns over” its portfolio). A higher portfolio turnover rate may indicate higher transaction costs. These costs, which are not reflected in annualFund operating expenses or in the example, affect the Fund’s performance. During the most recent fiscal year, the Fund’s portfolio turnover rate was 68% of the average value of its portfolio.”
LV601INS-09 Accompanies the Accum II, VULI, VULI II, VULI III,EVUL II, and BVUL II Prospectuses

VK VIAMVA SUMPRO 1 SUP 1
VK VIAMVA SUMPRO 1 SUP 1
Summary Prospectus Supplement dated October 3, 2016
The purpose of this supplement is to provide you with changes to the current Summary Prospectus for Series I shares of the Fund listed below:
Invesco V.I. American Value Fund
The following information replaces in its entirety the information appearing under the heading “Fees and Expenses of the Fund” in the prospectus:
“This table describes the fees and expenses that are incurred, directly or indirectly, when a variable product owner buys, holds,or redeems interest in an insurance company separate account that invests in the Series I shares of the Fund but does not represent the effect of any fees or other expenses assessed in connection with your variable product, and if it did, expenses would be higher. ------------------------------------------------------------------------------------------------------------------------------------------------------------------------
Shareholder Fees (fees paid directly from your investment) Series I shares
Maximum Sales Charge (Load) Imposed on Purchases (as a percentage of offering price) None
Maximum Deferred Sales Charge (Load) (as a percentage of original purchase price or redemption proceeds, whichever is less) None
Annual Fund Operating Expenses (expenses that you pay each year as a percentage of the value of your investment) ------------------------------------------------------------------------------------------------------------------------------------------------------------------------
Series I shares Management Fees 0.72% Distribution and/or Service (12b-1) Fees NoneOther Expenses1 0.20Acquired Fund Fees and Expenses 0.11Total Annual Fund Operating Expenses 1.03
1 “Other Expenses” have been restated to reflect current fees.
Example. This Example is intended to help you compare the cost of investing in the Fund with the cost of investing in other mutual funds.
This Example does not represent the effect of any fees or expenses assessed in connection with your variable product, and if it did, expenses would be higher.
The Example assumes that you invest $10,000 in the Fund for the time periods indicated and then redeem all of your shares at the end of those periods. The Example also assumes that your investment has a 5% return each year and that the Fund’s operating expenses remain the same.
Although your actual costs may be higher or lower, based on these assumptions your costs would be:
1 Year 3 Years 5 Years 10 Years
Series I shares $105 $328 $569 $1,259
Portfolio Turnover. The Fund pays transaction costs, such as commissions, when it buys and sells securities (or “turns over” its portfolio). A higher portfolio turnover rate may indicate higher transaction costs. These costs, which are not reflected in annualFund operating expenses or in the example, affect the Fund’s performance. During the most recent fiscal year, the Fund’s portfolio turnover rate was 26% of the average value of its portfolio.”
LV601INS-10 Accompanies all VL Prospectuses

VICEQ SUMPRO 2 SUP 1
VICEQ SUMPRO 2 SUP 1
Summary Prospectus Supplement dated October 3, 2016
The purpose of this supplement is to provide you with changes to the current Summary Prospectus for Series II shares of the Fund listed below:
Invesco V.I. Core Equity Fund
The following information replaces in its entirety the information appearing under the heading “Fees and Expenses of the Fund” in the prospectus:
“This table describes the fees and expenses that are incurred, directly or indirectly, when a variable product owner buys, holds,or redeems interest in an insurance company separate account that invests in the Series II shares of the Fund but does not represent the effect of any fees or other expenses assessed in connection with your variable product, and if it did, expenses would be higher. ------------------------------------------------------------------------------------------------------------------------------------------------------------------------
Shareholder Fees (fees paid directly from your investment) Series II shares
Maximum Sales Charge (Load) Imposed on Purchases (as a percentage of offering price) None
Maximum Deferred Sales Charge (Load) (as a percentage of original purchase price or redemption proceeds, whichever is less) None
Annual Fund Operating Expenses (expenses that you pay each year as a percentage of the value of your investment) ------------------------------------------------------------------------------------------------------------------------------------------------------------------------
Series II shares Management Fees 0.61% Distribution and/or Service (12b-1) Fees 0.25Other Expenses1 0.20Acquired Fund Fees and Expenses 0.01Total Annual Fund Operating Expenses 1.07Fee Waiver and/or Expense Reimbursement2 0.01Total Annual Fund Operating Expenses After Fee Waiver and/or Expense Reimbursement 1.061 “Other Expenses” have been restated to reflect current fees.
2 Invesco Advisers, Inc. (Invesco or the Adviser) has contractually agreed to waive a portion of the Fund’s management fee in an amount equal to the net management fee that Invesco earns on the Fund’s investments in certain affiliated funds, which will have the effect of reducing the Acquired Fund Fees and Expenses. Unless Invesco continues the fee waiver agreement, it will terminate on June 30, 2017. During its term, the fee waiver agreement cannot be terminated or amended to reduce the advisory fee waiver without the approval of the Board of Trustees.
Example. This Example is intended to help you compare the cost of investing in the Fund with the cost of investing in other mutual funds.
This Example does not represent the effect of any fees or expenses assessed in connection with your variable product, and if it did, expenses would be higher.
The Example assumes that you invest $10,000 in the Fund for the time periods indicated and then redeem all of your shares at the end of those periods. The Example also assumes that your investment has a 5% return each year and that the Fund’s operating expenses remain equal to the Total Annual Fund Operating Expenses After Fee Waiver and/or Expense Reimbursement in the first year and the Total Annual Fund Operating Expenses thereafter.
Although your actual costs may be higher or lower, based on these assumptions your costs would be:
1 Year 3 Years 5 Years 10 Years
Series II shares $108 $339 $589 $1,305

VICEQ SUMPRO 2 SUP 1
VICEQ SUMPRO 2 SUP 1
Portfolio Turnover. The Fund pays transaction costs, such as commissions, when it buys and sells securities (or “turns over” its portfolio). A higher portfolio turnover rate may indicate higher transaction costs. These costs, which are not reflected in annualFund operating expenses or in the example, affect the Fund’s performance. During the most recent fiscal year, the Fund’s portfolio turnover rate was 45% of the average value of its portfolio.”
LV601INS-12 Accompanies the Accum II, VULI, VULI II, EVUL II,BVUL II, and VULI III Prospectuses.
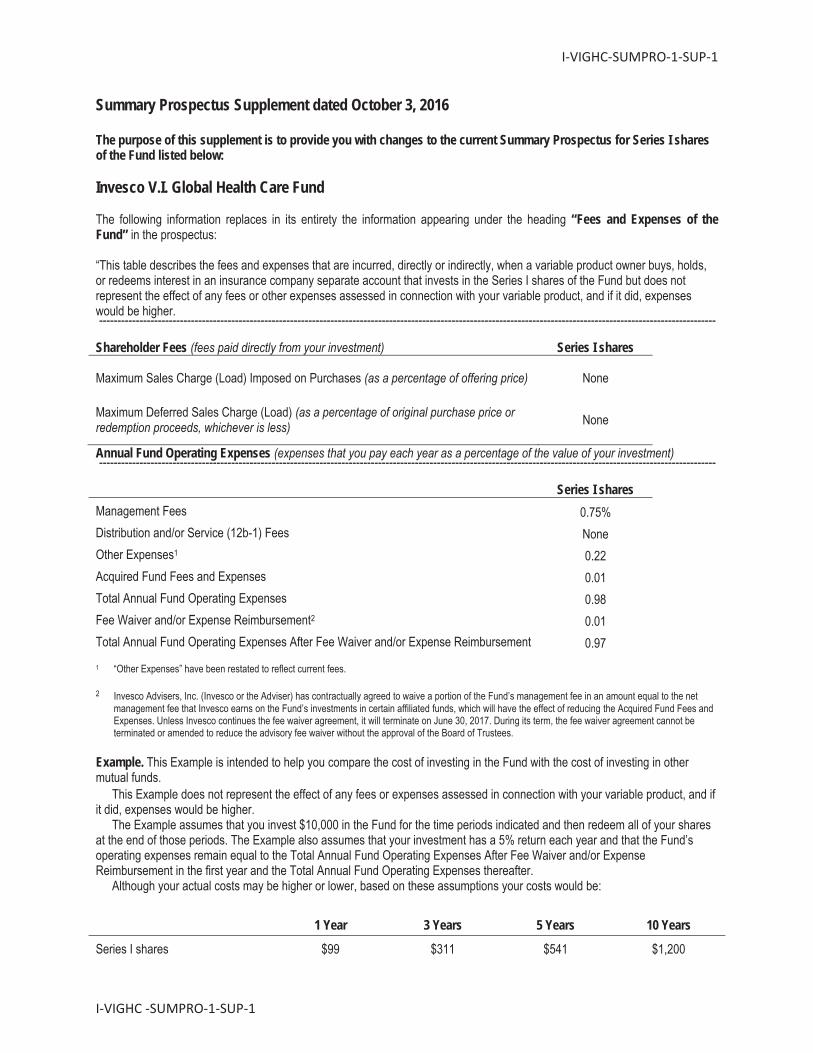
I VIGHC SUMPRO 1 SUP 1
I VIGHC SUMPRO 1 SUP 1
Summary Prospectus Supplement dated October 3, 2016
The purpose of this supplement is to provide you with changes to the current Summary Prospectus for Series I shares of the Fund listed below:
Invesco V.I. Global Health Care Fund
The following information replaces in its entirety the information appearing under the heading “Fees and Expenses of the Fund” in the prospectus:
“This table describes the fees and expenses that are incurred, directly or indirectly, when a variable product owner buys, holds,or redeems interest in an insurance company separate account that invests in the Series I shares of the Fund but does not represent the effect of any fees or other expenses assessed in connection with your variable product, and if it did, expenses would be higher. ------------------------------------------------------------------------------------------------------------------------------------------------------------------------
Shareholder Fees (fees paid directly from your investment) Series I shares
Maximum Sales Charge (Load) Imposed on Purchases (as a percentage of offering price) None
Maximum Deferred Sales Charge (Load) (as a percentage of original purchase price or redemption proceeds, whichever is less) None
Annual Fund Operating Expenses (expenses that you pay each year as a percentage of the value of your investment) ------------------------------------------------------------------------------------------------------------------------------------------------------------------------
Series I shares Management Fees 0.75% Distribution and/or Service (12b-1) Fees NoneOther Expenses1 0.22Acquired Fund Fees and Expenses 0.01Total Annual Fund Operating Expenses 0.98Fee Waiver and/or Expense Reimbursement2 0.01Total Annual Fund Operating Expenses After Fee Waiver and/or Expense Reimbursement 0.971 “Other Expenses” have been restated to reflect current fees.
2 Invesco Advisers, Inc. (Invesco or the Adviser) has contractually agreed to waive a portion of the Fund’s management fee in an amount equal to the net management fee that Invesco earns on the Fund’s investments in certain affiliated funds, which will have the effect of reducing the Acquired Fund Fees and Expenses. Unless Invesco continues the fee waiver agreement, it will terminate on June 30, 2017. During its term, the fee waiver agreement cannot be terminated or amended to reduce the advisory fee waiver without the approval of the Board of Trustees.
Example. This Example is intended to help you compare the cost of investing in the Fund with the cost of investing in other mutual funds.
This Example does not represent the effect of any fees or expenses assessed in connection with your variable product, and if it did, expenses would be higher.
The Example assumes that you invest $10,000 in the Fund for the time periods indicated and then redeem all of your shares at the end of those periods. The Example also assumes that your investment has a 5% return each year and that the Fund’s operating expenses remain equal to the Total Annual Fund Operating Expenses After Fee Waiver and/or Expense Reimbursement in the first year and the Total Annual Fund Operating Expenses thereafter.
Although your actual costs may be higher or lower, based on these assumptions your costs would be:
1 Year 3 Years 5 Years 10 Years
Series I shares $99 $311 $541 $1,200

I VIGHC SUMPRO 1 SUP 1
I VIGHC SUMPRO 1 SUP 1
Portfolio Turnover. The Fund pays transaction costs, such as commissions, when it buys and sells securities (or “turns over” its portfolio). A higher portfolio turnover rate may indicate higher transaction costs. These costs, which are not reflected in annualFund operating expenses or in the example, affect the Fund’s performance. During the most recent fiscal year, the Fund’s portfolio turnover rate was 42% of the average value of its portfolio.”
LV601INS-13 Accompanies the FVA, IPVA old, IPVA new, and all VL Prospectuses.

VI GRE SUMPRO 1 SUP 1
VI GRE SUMPRO 1 SUP 1
Summary Prospectus Supplement dated October 3, 2016
The purpose of this supplement is to provide you with changes to the current Summary Prospectus for Series I shares of the Fund listed below:
Invesco V.I. Global Real Estate Fund
The following information replaces in its entirety the information appearing under the heading “Fees and Expenses of the Fund” in the prospectus:
“This table describes the fees and expenses that are incurred, directly or indirectly, when a variable product owner buys, holds,or redeems interest in an insurance company separate account that invests in the Series I shares of the Fund but does not represent the effect of any fees or other expenses assessed in connection with your variable product, and if it did, expenses would be higher. ------------------------------------------------------------------------------------------------------------------------------------------------------------------------
Shareholder Fees (fees paid directly from your investment) Series I shares
Maximum Sales Charge (Load) Imposed on Purchases (as a percentage of offering price) None
Maximum Deferred Sales Charge (Load) (as a percentage of original purchase price or redemption proceeds, whichever is less) None
Annual Fund Operating Expenses (expenses that you pay each year as a percentage of the value of your investment) ------------------------------------------------------------------------------------------------------------------------------------------------------------------------
Series I shares Management Fees 0.75% Distribution and/or Service (12b-1) Fees NoneOther Expenses1 0.26Total Annual Fund Operating Expenses 1.01
1 “Other Expenses” have been restated to reflect current fees.
Example. This Example is intended to help you compare the cost of investing in the Fund with the cost of investing in other mutual funds.
This Example does not represent the effect of any fees or expenses assessed in connection with your variable product, and if it did, expenses would be higher.
The Example assumes that you invest $10,000 in the Fund for the time periods indicated and then redeem all of your shares at the end of those periods. The Example also assumes that your investment has a 5% return each year and that the Fund’s operating expenses remain the same.
Although your actual costs may be higher or lower, based on these assumptions your costs would be:
1 Year 3 Years 5 Years 10 Years
Series I shares $103 $322 $558 $1,236
Portfolio Turnover. The Fund pays transaction costs, such as commissions, when it buys and sells securities (or “turns over” its portfolio). A higher portfolio turnover rate may indicate higher transaction costs. These costs, which are not reflected in annualFund operating expenses or in the example, affect the Fund’s performance. During the most recent fiscal year, the Fund’s portfolio turnover rate was 72% of the average value of its portfolio.”
LV601INS-15 Accompanies EVUL, BVUL, EVUL II, BVUL II Prospectuses
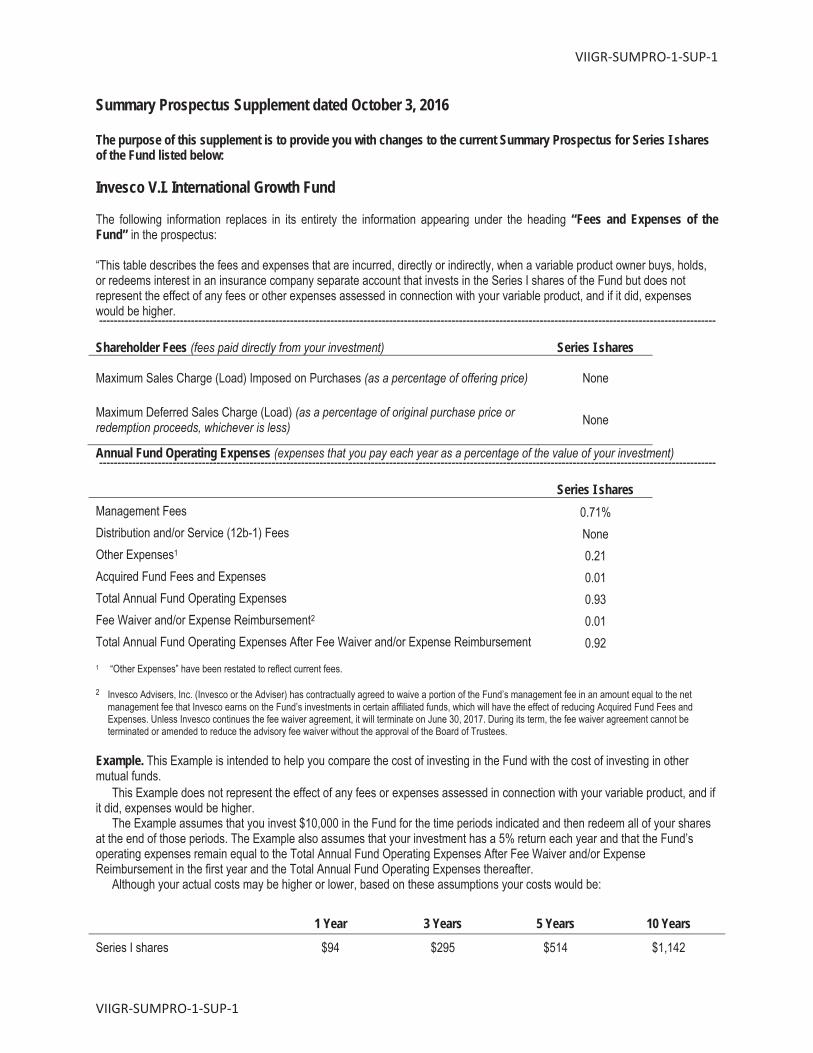
VIIGR SUMPRO 1 SUP 1
VIIGR SUMPRO 1 SUP 1
Summary Prospectus Supplement dated October 3, 2016
The purpose of this supplement is to provide you with changes to the current Summary Prospectus for Series I shares of the Fund listed below:
Invesco V.I. International Growth Fund
The following information replaces in its entirety the information appearing under the heading “Fees and Expenses of the Fund” in the prospectus:
“This table describes the fees and expenses that are incurred, directly or indirectly, when a variable product owner buys, holds,or redeems interest in an insurance company separate account that invests in the Series I shares of the Fund but does not represent the effect of any fees or other expenses assessed in connection with your variable product, and if it did, expenses would be higher. ------------------------------------------------------------------------------------------------------------------------------------------------------------------------
Shareholder Fees (fees paid directly from your investment) Series I shares
Maximum Sales Charge (Load) Imposed on Purchases (as a percentage of offering price) None
Maximum Deferred Sales Charge (Load) (as a percentage of original purchase price or redemption proceeds, whichever is less) None
Annual Fund Operating Expenses (expenses that you pay each year as a percentage of the value of your investment) ------------------------------------------------------------------------------------------------------------------------------------------------------------------------
Series I shares Management Fees 0.71% Distribution and/or Service (12b-1) Fees NoneOther Expenses1 0.21Acquired Fund Fees and Expenses 0.01Total Annual Fund Operating Expenses 0.93Fee Waiver and/or Expense Reimbursement2 0.01Total Annual Fund Operating Expenses After Fee Waiver and/or Expense Reimbursement 0.921 “Other Expenses” have been restated to reflect current fees.
2 Invesco Advisers, Inc. (Invesco or the Adviser) has contractually agreed to waive a portion of the Fund’s management fee in an amount equal to the net management fee that Invesco earns on the Fund’s investments in certain affiliated funds, which will have the effect of reducing Acquired Fund Fees and Expenses. Unless Invesco continues the fee waiver agreement, it will terminate on June 30, 2017. During its term, the fee waiver agreement cannot be terminated or amended to reduce the advisory fee waiver without the approval of the Board of Trustees.
Example. This Example is intended to help you compare the cost of investing in the Fund with the cost of investing in other mutual funds.
This Example does not represent the effect of any fees or expenses assessed in connection with your variable product, and if it did, expenses would be higher.
The Example assumes that you invest $10,000 in the Fund for the time periods indicated and then redeem all of your shares at the end of those periods. The Example also assumes that your investment has a 5% return each year and that the Fund’s operating expenses remain equal to the Total Annual Fund Operating Expenses After Fee Waiver and/or Expense Reimbursement in the first year and the Total Annual Fund Operating Expenses thereafter.
Although your actual costs may be higher or lower, based on these assumptions your costs would be:
1 Year 3 Years 5 Years 10 Years
Series I shares $94 $295 $514 $1,142

VIIGR PRO 1 SUMSUP 1
VIIGR SUMPRO 1 SUP 1
Portfolio Turnover. The Fund pays transaction costs, such as commissions, when it buys and sells securities (or “turns over” its portfolio). A higher portfolio turnover rate may indicate higher transaction costs. These costs, which are not reflected in annualFund operating expenses or in the example, affect the Fund’s performance. During the most recent fiscal year, the Fund’s portfolio turnover rate was 22% of the average value of its portfolio.”
LV601INS-16 Accompanies IPVA new, IPVA old, EVUL, BVUL, EVUL II, BVUL II Prospectuses

VIMCCE SUMPRO 2 SUP 1
VIMCCE SUMPRO 2 SUP 1
Summary Prospectus Supplement dated October 3, 2016
The purpose of this supplement is to provide you with changes to the current Summary Prospectus for Series II shares of the Fund listed below:
Invesco V.I. Mid Cap Core Equity Fund
The following information replaces in its entirety the information appearing under the heading “Fees and Expenses of the Fund” in the prospectus:
“This table describes the fees and expenses that are incurred, directly or indirectly, when a variable product owner buys, holds,or redeems interest in an insurance company separate account that invests in the Series II shares of the Fund but does not represent the effect of any fees or other expenses assessed in connection with your variable product, and if it did, expenses would be higher. ------------------------------------------------------------------------------------------------------------------------------------------------------------------------
Shareholder Fees (fees paid directly from your investment) Series II shares
Maximum Sales Charge (Load) Imposed on Purchases (as a percentage of offering price) None
Maximum Deferred Sales Charge (Load) (as a percentage of original purchase price or redemption proceeds, whichever is less) None
Annual Fund Operating Expenses (expenses that you pay each year as a percentage of the value of your investment) ------------------------------------------------------------------------------------------------------------------------------------------------------------------------
Series II shares Management Fees 0.73% Distribution and/or Service (12b-1) Fees 0.25Other Expenses1 0.20Acquired Fund Fees and Expenses 0.02Total Annual Fund Operating Expenses 1.20Fee Waiver and/or Expense Reimbursement2 0.02Total Annual Fund Operating Expenses After Fee Waiver and/or Expense Reimbursement 1.18
1 “Other Expenses” have been restated to reflect current fees.
2 Invesco Advisers, Inc. (Invesco or the Adviser) has contractually agreed to waive a portion of the Fund’s management fee in an amount equal to the net management fee that Invesco earns on the Fund’s investments in certain affiliated funds, which will have the effect of reducing Acquired Fund Fees and Expenses. Unless Invesco continues the fee waiver agreement, it will terminate on June 30, 2017. During its term, the fee waiver agreement cannot be terminated or amended to reduce the advisory fee waiver without the approval of the Board of Trustees.
Example. This Example is intended to help you compare the cost of investing in the Fund with the cost of investing in other mutual funds.
This Example does not represent the effect of any fees or expenses assessed in connection with your variable product, and if it did, expenses would be higher.
The Example assumes that you invest $10,000 in the Fund for the time periods indicated and then redeem all of your shares at the end of those periods. The Example also assumes that your investment has a 5% return each year and that the Fund’s operating expenses remain equal to the Total Annual Fund Operating Expenses After Fee Waiver and/or Expense Reimbursement in the first year and the Total Annual Fund Operating Expenses thereafter.
Although your actual costs may be higher or lower, based on these assumptions your costs would be:
1 Year 3 Years 5 Years 10 Years
Series II shares $120 $379 $658 $1,453

VIMCCE SUMPRO 2 SUP 1
VIMCCE SUMPRO 2 SUP 1
Portfolio Turnover. The Fund pays transaction costs, such as commissions, when it buys and sells securities (or “turns over” its portfolio). A higher portfolio turnover rate may indicate higher transaction costs. These costs, which are not reflected in annualFund operating expenses or in the example, affect the Fund’s performance. During the most recent fiscal year, the Fund’s portfolio turnover rate was 44% of the average value of its portfolio.”
LV601INS-18 Accompanies all VL Prospectuses

VISCE SUMPRO 1 SUP 2
VISCE SUMPRO 1 SUP 2
Summary Prospectus Supplement dated October 3, 2016
The purpose of this supplement is to provide you with changes to the current Summary Prospectus for Series I shares of the Fund listed below:
Invesco V.I. Small Cap Equity Fund
The following information replaces in its entirety the information appearing under the heading “Fees and Expenses of the Fund” in the prospectus:
“This table describes the fees and expenses that are incurred, directly or indirectly, when a variable product owner buys, holds,or redeems interest in an insurance company separate account that invests in the Series I shares of the Fund but does not represent the effect of any fees or other expenses assessed in connection with your variable product, and if it did, expenses would be higher. ------------------------------------------------------------------------------------------------------------------------------------------------------------------------
Shareholder Fees (fees paid directly from your investment) Series I shares
Maximum Sales Charge (Load) Imposed on Purchases (as a percentage of offering price) None
Maximum Deferred Sales Charge (Load) (as a percentage of original purchase price or redemption proceeds, whichever is less) None
Annual Fund Operating Expenses (expenses that you pay each year as a percentage of the value of your investment) ------------------------------------------------------------------------------------------------------------------------------------------------------------------------
Series I shares Management Fees 0.74% Distribution and/or Service (12b-1) Fees NoneOther Expenses1 0.21Total Annual Fund Operating Expenses 0.951 “Other Expenses” have been restated to reflect current fees.
Example. This Example is intended to help you compare the cost of investing in the Fund with the cost of investing in other mutual funds.
This Example does not represent the effect of any fees or expenses assessed in connection with your variable product, and if it did, expenses would be higher.
The Example assumes that you invest $10,000 in the Fund for the time periods indicated and then redeem all of your shares at the end of those periods. The Example also assumes that your investment has a 5% return each year and that the Fund’s operating expenses remain the same.
Although your actual costs may be higher or lower, based on these assumptions your costs would be:
1 Year 3 Years 5 Years 10 Years
Series I shares $97 $303 $525 $1,166
Portfolio Turnover. The Fund pays transaction costs, such as commissions, when it buys and sells securities (or “turns over” its portfolio). A higher portfolio turnover rate may indicate higher transaction costs. These costs, which are not reflected in annualFund operating expenses or in the example, affect the Fund’s performance. During the most recent fiscal year, the Fund’s portfolio turnover rate was 31% of the average value of its portfolio.”
LV601INS-19 Accompanies FVA, IPVA Old, IPVA New, FVLI, PFLX, SVUL, Accum, EVUL, BVUL, EVUL II and BVUL II Prospectuses
Supplement dated September 28, 2016
to the Prospectuses dated May 1, 2016 for the following Funds:
The Prospectuses for the Funds are hereby supplemented, effective immediately, by replacing the second “FUNDamentals” box that appears in the About Fund Shares and Transactions — Share Price Determination section of the Prospectuses with the following:
Shareholders should retain this Supplement for future reference.
C-1466-4A (9/16)
Funds WANGER ADVISORS TRUST Wanger International Wanger USA Wanger Select
FUNDamentals
Business Days
A business day is any day that the New York Stock Exchange (NYSE) is open. A business day ends at (i) the scheduled close of the NYSE for such day (usually 4:00 p.m. Eastern Time or such other time as the NYSE may schedule), (ii) the scheduled close of the NYSE (usually 4:00 p.m. Eastern Time) on any business day on which the NYSE has an unscheduled close or intraday trading halt or other disruption, regardless of the time of such unscheduled close, halt or disruption or whether trading resumes, or (iii) such other time as the Board may from time to time determine. On holidays and other days when the NYSE is closed, the Fund’s NAV is not calculated and the Fund does not accept buy or sell orders. However, the value of the Fund’s assets may still be affected on such days to the extent that the Fund holds foreign securities that trade on days that foreign securities markets are open.
LV853WAS-01 Accompanies All VL Prospectuses

MAY 1, 2016, AS AMENDED SEPTEMBER 28, 2016
Before you invest, you may want to review the Fund’s prospectus, which contains more information about the
Fund and its risks. You can find the Fund’s prospectus, statement of additional information and other information
about the Fund online at franklintempleton.com/ftviptfunds. You can also get this information at no cost by calling
1-888-FRANKLIN or by sending an e-mail request to [email protected]. The Fund’s
prospectus and statement of additional information, both dated May 1, 2016, as may be amended from time to
time, are incorporated by reference into this Summary prospectus, which means that they are legally a part of this
Summary prospectus. Shares of the insurance funds of Franklin Templeton Variable Insurance Products Trust are
not offered to the public; they are offered and sold only to: (1) insurance company separate accounts to serve as the
underlying investment vehicles for variable contracts; (2) certain qualified plans; and (3) other mutual funds (fund
of funds). This Summary prospectus is not intended for use by other investors. Please check with your insurance
company for availability. Please read this Summary prospectus together with your variable annuity or variable life
insurance product prospectus.
SUMMARY PROSPECTUSFRANKLIN TEMPLETON VARIABLE INSURANCE PRODUCTS TRUST | CLASS 2
Franklin Mutual Global Discovery
VIP Fund

SUMMARY PROSPECTUS
2 - Franklin Mutual Global Discovery VIP Fund - Class 2
Investment GoalCapital appreciation.
Fees and Expenses of the FundThis table describes the fees and expenses that you may pay if you buy and hold shares of the Fund. The table and the example do not include any fees or sales charges imposed by variable insurance contracts, qualified retirement plans or funds of funds. If they were included, your costs would be higher.
Annual Fund Operating Expenses(expenses that you pay each year as a percentage of the value of your investment)
Class 2
Management fees 0.94%
Distribution and service (12b-1) fees 0.25%
Other expenses 0.08%
Total annual Fund operating expenses 1.27%
ExampleThis Example is intended to help you compare the cost of investing in the Fund with the cost of investing in other mutual funds. The Example assumes that you invest $10,000 in the Fund for the time periods indicated and then redeem all of your shares at the end of the period. The Example also assumes that your investment has a 5% return each year and that the Fund’s operating expenses remain the same. The Example reflects adjustments made to the Fund’s operating expenses due to the fee waivers and/or expense reimbursements by management for the 1 Year numbers only. Although your actual costs may be higher or lower, based on these assumptions your costs would be:
1 Year 3 Years 5 Years 10 Years
Class 2 $129 $403 $697 $1,534
Portfolio TurnoverThe Fund pays transaction costs, such as commissions, when it buys and sells securities (or “turns over” its portfolio). A higher portfolio turnover rate may indicate higher transaction costs. These costs, which are not reflected in annual Fund operating expenses or in the example, affect the Fund’s
performance. During the most recent fiscal year, the Fund’s portfolio turnover rate was 21.88% of the average value of its portfolio.
Principal Investment StrategiesUnder normal market conditions, the Fund invests primarily in equity securities (including securities convertible into, or that the investment manager expects to be exchanged for, common or preferred stock) of U.S. and foreign companies that the investment manager believes are available at market prices less than their value based on certain recognized or objective criteria (intrinsic value). Following this value-oriented strategy, the Fund invests primarily in undervalued securities (securities trading at a discount to intrinsic value). The equity securities in which the Fund invests are primarily common stock. To a lesser extent, the Fund also invests in merger arbitrage securities and the debt and equity of distressed companies.
The Fund is not limited to pre-set maximums or minimums governing the size of the companies in which it may invest. However, the Fund currently invests the equity portion of its portfolio primarily to predominantly in mid- and large-cap companies, with the remaining portion of its equity portfolio in smaller companies.
The Fund may invest substantially and potentially up to 100% of its assets in foreign securities, which may include sovereign debt and participations in foreign government debt. The Fund presently does not intend to invest more than a portion (no more than 25%) of its assets in securities of issuers located in emerging market countries.
The Fund regularly attempts to hedge (protect) against currency risks, largely using currency forward contracts and currency futures contracts (including currency index futures contracts) when, in the investment manager’s opinion, it would be advantageous to the Fund to do so. The Fund may also, from time to time, attempt to hedge against market risk using a variety of derivatives.
Portfolio SelectionThe investment manager employs a research driven, fundamental value strategy for the Fund. Investments are generally selected based on the investment

SUMMARY PROSPECTUS
3 - Franklin Mutual Global Discovery VIP Fund - Class 2
manager’s own analysis of the security’s intrinsic value, including for equity securities, an analysis of book value, cash flow potential, long-term earnings and multiples of earnings. The investment manager examines each investment separately and there are no set criteria as to specific value parameters, asset size, earnings or industry type.
Principal RisksYou could lose money by investing in the Fund. Mutual fund shares are not deposits or obligations of, or guaranteed or endorsed by, any bank, and are not insured by the Federal Deposit Insurance Corporation, the Federal Reserve Board, or any other agency of the U.S. government.
Market The market values of securities or other investments owned by the Fund will go up or down, sometimes rapidly or unpredictably. The market value of a security or other investment may be reduced by market activity or other results of supply and demand unrelated to the issuer. This is a basic risk associated with all securities. When there are more sellers than buyers, prices tend to fall. Likewise, when there are more buyers than sellers, prices tend to rise.
Stock prices tend to go up and down more dramatically than those of debt securities. A slower-growth or recessionary economic environment could have an adverse effect on the prices of the various stocks held by the Fund.
Value Style Investing A value stock may not increase in price as anticipated by the investment manager if other investors fail to recognize the company’s value and bid up the price, the markets favor faster-growing companies, or the factors that the investment manager believes will increase the price of the security do not occur.
Foreign Securities Investing in foreign securities typically involves more risks than investing in U.S. securities, and includes risks associated with: internal and external political and economic developments – e.g., the political, economic and social policies and structures of some foreign countries may be less stable and more volatile than those in the U.S. or some foreign countries may be subject to trading restrictions or economic sanctions; trading practices – e.g., government supervision and regulation of foreign
securities and currency markets, trading systems and brokers may be less than in the U.S.; availability of information – e.g., foreign issuers may not be subject to the same disclosure, accounting and financial reporting standards and practices as U.S. issuers; limited markets – e.g., the securities of certain foreign issuers may be less liquid (harder to sell) and more volatile; and currency exchange rate fluctuations and policies. The risks of foreign investments may be greater in developing or emerging market countries.
Regional Focus Because the Fund may invest at least a significant portion of its assets in companies in a specific region, including Europe, the Fund is subject to greater risks of adverse developments in that region and/or the surrounding regions than a fund that is more broadly diversified geographically. Political, social or economic disruptions in the region, even in countries in which the Fund is not invested, may adversely affect the value of securities values held by the Fund. Current political uncertainty surrounding the European Union (EU) and its membership, including the 2016 referendum in which the United Kingdom voted to exit the EU, may increase market volatility. The financial instability of some countries in the EU, including Greece, Italy and Spain, together with the risk of that impacting other more stable countries may increase the economic risk of investing in companies in Europe.
Smaller and Midsize Companies Securities issued by smaller and midsize companies may be more volatile in price than those of larger companies, involve substantial risks and should be considered speculative. Such risks may include greater sensitivity to economic conditions, less certain growth prospects, lack of depth of management and funds for growth and development, and limited or less developed product lines and markets. In addition, smaller and midsize companies may be particularly affected by interest rate increases, as they may find it more difficult to borrow money to continue or expand operations, or may have difficulty in repaying any loans.
Derivative Instruments The performance of derivative instruments depends largely on the performance of an underlying instrument, such as a currency, security, interest rate or index, and such instruments often have risks similar to the underlying instrument, in addition to other risks. Derivatives involve costs and

SUMMARY PROSPECTUS
4 - Franklin Mutual Global Discovery VIP Fund - Class 2
can create economic leverage in the Fund’s portfolio which may result in significant volatility and cause the Fund to participate in losses (as well as gains) in an amount that exceeds the Fund’s initial investment. Other risks include illiquidity, mispricing or improper valuation of the derivative instrument, and imperfect correlation between the value of the derivative and the underlying instrument so that the Fund may not realize the intended benefits. When a derivative is used for hedging, the change in value of the derivative may also not correlate specifically with the currency, security, interest rate, index or other risk being hedged. Derivatives also may present the risk that the other party to the transaction will fail to perform.
Merger Arbitrage Securities and Distressed Companies A merger or other restructuring, or a
tender or exchange offer, proposed or pending at the time the Fund invests in merger arbitrage securities may not be completed on the terms or within the time frame contemplated, which may result in losses to the Fund. Debt obligations of distressed companies typically are unrated, lower-rated, in default or close to default and are generally more likely to become worthless than the securities of more financially stable companies.
Management The Fund is subject to management risk because it is an actively managed investment portfolio. The Fund’s investment manager applies investment techniques and risk analyses in making investment decisions for the Fund, but there can be no guarantee that these decisions will produce the desired results.

SUMMARY PROSPECTUS
5 - Franklin Mutual Global Discovery VIP Fund - Class 2
PerformanceThe following bar chart and table provide some indication of the risks of investing in the Fund. The bar chart shows changes in the Fund’s performance from year to year for Class 2 shares. The table shows how the Fund’s average annual returns for 1 year, 5 years, 10 years or since inception, as applicable, compare with those of a broad measure of market performance. The Fund’s past performance is not necessarily an indication of how the Fund will perform in the future.
The inclusion of the S&P 500® Index shows how the Fund’s performance compares to a group of securities in an additional leading equity index.
Performance reflects all Fund expenses but does not include any fees or sales charges imposed by variable insurance contracts, qualified plans or funds of funds. If they had been included, the returns shown below would be lower. Investors should consult the variable insurance contract prospectus, or the disclosure documents for qualified plans or funds of funds for more information.
Annual Total Returns
Best Quarter: Q2’09 11.12%
Worst Quarter: Q3’11 -15.71%
As of March 31, 2016, the Fund’s year-to-date return was -2.07%.
-3.65%
5.71%
27.62%
13.36%
-2.96%
11.96%
23.32%
-28.45%
11.85%
23.06%
2015201420132012201120102009200820072006Year
Average Annual Total ReturnsFor the periods ended December 31, 2015
1 Year 5 Years 10 Years
Franklin Mutual Global Discovery VIP Fund - Class 2 -3.65% 7.41% 6.87%
MSCI World Index (index reflects no deduction for fees, expenses or taxes) -0.32% 8.20% 5.56%
S&P 500® Index (index reflects no deduction for fees, expenses or taxes) 1.38% 12.57% 7.31%
No one index is representative of the Fund’s portfolio.

SUMMARY PROSPECTUS
6 - Franklin Mutual Global Discovery VIP Fund - Class 2
Investment ManagerFranklin Mutual Advisers, LLC (Franklin Mutual)
Portfolio ManagersPeter A. LangermanChairman, President and Chief Executive Officer of Franklin Mutual and portfolio manager of the Fund since 2009.Philippe Brugere-TrelatExecutive Vice President of Franklin Mutual and portfolio manager of the Fund since 2009.Timothy Rankin, CFAPortfolio Manager of Franklin Mutual and portfolio manager of the Fund since 2010.
Purchase and Sale of Fund SharesShares of the Fund are sold to insurance companies’ separate accounts (Insurers) to fund variable annuity or variable life insurance contracts and to qualified plans. Insurance companies offer variable annuity and variable life insurance products through separate accounts. Shares of the Fund may also be sold to other mutual funds, either as underlying funds in a fund of funds or in other structures. In addition, Fund shares are held by a limited number of Insurers, qualified retirement plans and, when applicable, funds of funds. Substantial withdrawals by one or more Insurers, qualified retirement plans or funds of funds could reduce Fund assets, causing total Fund expenses to become higher than the numbers shown in the fees and expenses table above.
The terms of the offering of interests in separate accounts are included in the variable annuity or variable life insurance product prospectus. The terms of offerings of funds of funds are included in those funds’ prospectuses. The terms of offering of qualified
retirement plans are described in their disclosure documents. Investors should consult the variable contract prospectus, fund of fund prospectus, or plan disclosure documents for more information on fees and expenses imposed by variable insurance contracts, funds of funds or qualified retirement plans, respectively.
TaxesBecause shares of the Fund are generally purchased through variable annuity contracts or variable life insurance contracts, the Fund’s distributions (which the Fund expects, based on its investment goals and strategies to consist of ordinary income, capital gains or some combination of both) will be exempt from current taxation if left to accumulate within the variable contract. You should refer to your contract prospectus for more information on these tax consequences.
Payments to Sponsoring Insurance Companies and Other Financial IntermediariesThe Fund or its distributor (and related companies) may pay broker/dealers or other financial intermediaries (such as banks and insurance companies, or their related companies) for the sale and retention of variable contracts which offer Fund shares and/or for other services. These payments may create a conflict of interest for an intermediary or be a factor in the insurance company’s decision to include the Fund as an investment option in its variable contract. For more information, ask your financial advisor, visit your intermediary’s website, or consult the Contract prospectus or this Fund prospectus.

[THIS PAGE INTENTIONALLY LEFT BLANK]

Investment Company Act file #811-05583
© 2016 Franklin Templeton Investments. All rights reserved. 754 PSUM 09/16
LV607FTS-11 Accompanies the EVUL, BVUL, EVUL II, BVUL II, VULI II and VULI III Prospectuses

MAY 1, 2016, AS AMENDED SEPTEMBER 28, 2016
Before you invest, you may want to review the Fund’s prospectus, which contains more information about the
Fund and its risks. You can find the Fund’s prospectus, statement of additional information and other information
about the Fund online at franklintempleton.com/ftviptfunds. You can also get this information at no cost by calling
1-888-FRANKLIN or by sending an e-mail request to [email protected]. The Fund’s
prospectus and statement of additional information, both dated May 1, 2016, as may be amended from time to
time, are incorporated by reference into this Summary prospectus, which means that they are legally a part of this
Summary prospectus. Shares of the insurance funds of Franklin Templeton Variable Insurance Products Trust are
not offered to the public; they are offered and sold only to: (1) insurance company separate accounts to serve as the
underlying investment vehicles for variable contracts; (2) certain qualified plans; and (3) other mutual funds (fund
of funds). This Summary prospectus is not intended for use by other investors. Please check with your insurance
company for availability. Please read this Summary prospectus together with your variable annuity or variable life
insurance product prospectus.
SUMMARY PROSPECTUSFRANKLIN TEMPLETON VARIABLE INSURANCE PRODUCTS TRUST | CLASS 2
Templeton Foreign
VIP Fund

SUMMARY PROSPECTUS
2 - Templeton Foreign VIP Fund - Class 2
Investment GoalLong-term capital growth.
Fees and Expenses of the FundThis table describes the fees and expenses that you may pay if you buy and hold shares of the Fund. The table and the example do not include any fees or sales charges imposed by variable insurance contracts, qualified retirement plans or funds of funds. If they were included, your costs would be higher.
Annual Fund Operating Expenses(expenses that you pay each year as a percentage of the value of your investment)
Class 2
Management fees 0.75%
Distribution and service (12b-1) fees 0.25%
Other expenses 0.03%
Total annual Fund operating expenses 1.03%
ExampleThis Example is intended to help you compare the cost of investing in the Fund with the cost of investing in other mutual funds. The Example assumes that you invest $10,000 in the Fund for the time periods indicated and then redeem all of your shares at the end of the period. The Example also assumes that your investment has a 5% return each year and that the Fund’s operating expenses remain the same. The Example reflects adjustments made to the Fund’s operating expenses due to the fee waivers and/or expense reimbursements by management for the 1 Year numbers only. Although your actual costs may be higher or lower, based on these assumptions your costs would be:
1 Year 3 Years 5 Years 10 Years
Class 2 $105 $328 $569 $1,259
Portfolio TurnoverThe Fund pays transaction costs, such as commissions, when it buys and sells securities (or “turns over” its portfolio). A higher portfolio turnover rate may indicate higher transaction costs. These costs, which are not reflected in annual Fund operating expenses or in the example, affect the Fund’s
performance. During the most recent fiscal year, the Fund’s portfolio turnover rate was 15.15% of the average value of its portfolio.
Principal Investment StrategiesUnder normal market conditions, the Fund invests at least 80% of its net assets in investments of issuers located outside the U.S., including those in emerging markets. Under normal market conditions, the Fund invests predominantly in equity securities, primarily to predominantly in common stock. While there are no set percentage targets, the Fund invests predominantly in large to medium capitalization companies and may invest a portion in smaller companies. The Fund also invests in American, European and Global Depositary Receipts. Although the investment manager will search for investments across a large number of sectors, from time to time, based on economic conditions, the Fund may have significant positions in particular countries or sectors.
When choosing equity investments for the Fund, the investment manager applies a “bottom-up,” value-oriented, long-term approach, focusing on the market price of a company’s securities relative to the investment manager’s evaluation of the company’s long-term earnings, asset value and cash flow potential. The investment manager also considers a company’s price/earnings ratio, profit margins and liquidation value.
The Fund may, from time to time, seek to hedge (protect) against currency risks, using certain derivative instruments, including currency and cross currency forwards and currency futures contracts.
Principal RisksYou could lose money by investing in the Fund. Mutual fund shares are not deposits or obligations of, or guaranteed or endorsed by, any bank, and are not insured by the Federal Deposit Insurance Corporation, the Federal Reserve Board, or any other agency of the U.S. government.
Market The market values of securities or other investments owned by the Fund will go up or down, sometimes rapidly or unpredictably. The market value of a security or other investment may be reduced by market activity or other results of supply and demand unrelated to the issuer. This is a basic risk associated
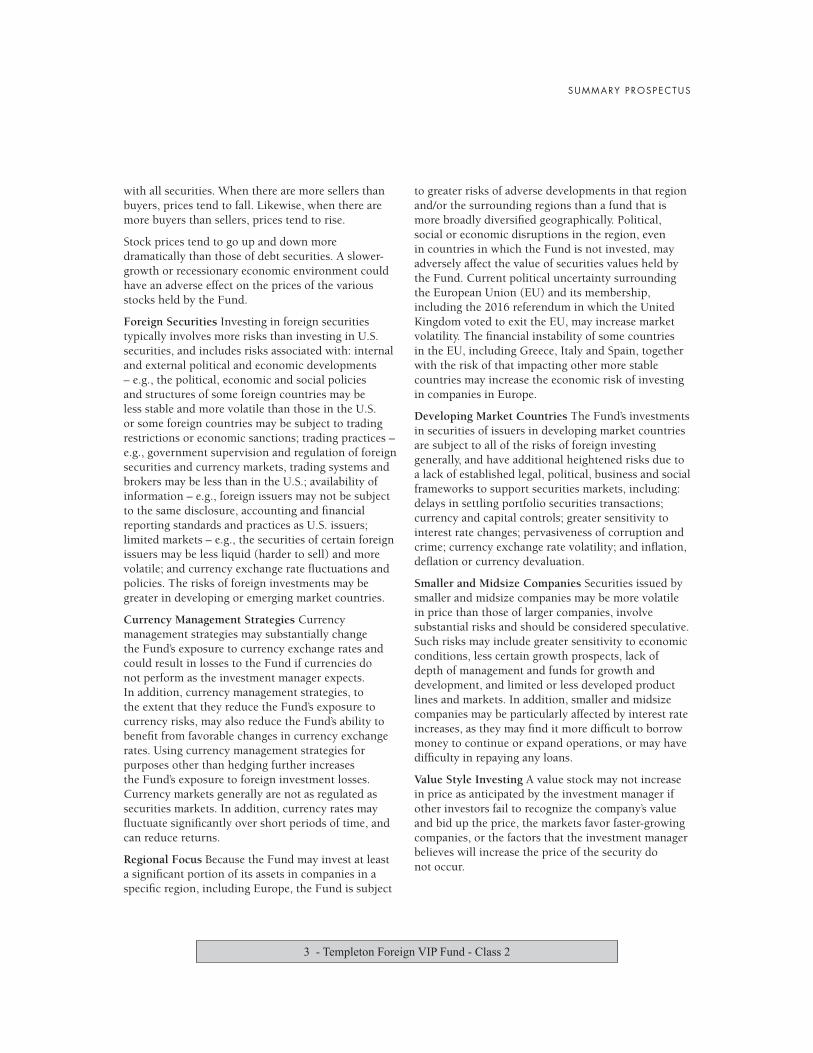
SUMMARY PROSPECTUS
3 - Templeton Foreign VIP Fund - Class 2
with all securities. When there are more sellers than buyers, prices tend to fall. Likewise, when there are more buyers than sellers, prices tend to rise.
Stock prices tend to go up and down more dramatically than those of debt securities. A slower-growth or recessionary economic environment could have an adverse effect on the prices of the various stocks held by the Fund.
Foreign Securities Investing in foreign securities typically involves more risks than investing in U.S. securities, and includes risks associated with: internal and external political and economic developments – e.g., the political, economic and social policies and structures of some foreign countries may be less stable and more volatile than those in the U.S. or some foreign countries may be subject to trading restrictions or economic sanctions; trading practices – e.g., government supervision and regulation of foreign securities and currency markets, trading systems and brokers may be less than in the U.S.; availability of information – e.g., foreign issuers may not be subject to the same disclosure, accounting and financial reporting standards and practices as U.S. issuers; limited markets – e.g., the securities of certain foreign issuers may be less liquid (harder to sell) and more volatile; and currency exchange rate fluctuations and policies. The risks of foreign investments may be greater in developing or emerging market countries.
Currency Management Strategies Currency management strategies may substantially change the Fund’s exposure to currency exchange rates and could result in losses to the Fund if currencies do not perform as the investment manager expects. In addition, currency management strategies, to the extent that they reduce the Fund’s exposure to currency risks, may also reduce the Fund’s ability to benefit from favorable changes in currency exchange rates. Using currency management strategies for purposes other than hedging further increases the Fund’s exposure to foreign investment losses. Currency markets generally are not as regulated as securities markets. In addition, currency rates may fluctuate significantly over short periods of time, and can reduce returns.
Regional Focus Because the Fund may invest at least a significant portion of its assets in companies in a specific region, including Europe, the Fund is subject
to greater risks of adverse developments in that region and/or the surrounding regions than a fund that is more broadly diversified geographically. Political, social or economic disruptions in the region, even in countries in which the Fund is not invested, may adversely affect the value of securities values held by the Fund. Current political uncertainty surrounding the European Union (EU) and its membership, including the 2016 referendum in which the United Kingdom voted to exit the EU, may increase market volatility. The financial instability of some countries in the EU, including Greece, Italy and Spain, together with the risk of that impacting other more stable countries may increase the economic risk of investing in companies in Europe.
Developing Market Countries The Fund’s investments in securities of issuers in developing market countries are subject to all of the risks of foreign investing generally, and have additional heightened risks due to a lack of established legal, political, business and social frameworks to support securities markets, including: delays in settling portfolio securities transactions; currency and capital controls; greater sensitivity to interest rate changes; pervasiveness of corruption and crime; currency exchange rate volatility; and inflation, deflation or currency devaluation.
Smaller and Midsize Companies Securities issued by smaller and midsize companies may be more volatile in price than those of larger companies, involve substantial risks and should be considered speculative. Such risks may include greater sensitivity to economic conditions, less certain growth prospects, lack of depth of management and funds for growth and development, and limited or less developed product lines and markets. In addition, smaller and midsize companies may be particularly affected by interest rate increases, as they may find it more difficult to borrow money to continue or expand operations, or may have difficulty in repaying any loans.
Value Style Investing A value stock may not increase in price as anticipated by the investment manager if other investors fail to recognize the company’s value and bid up the price, the markets favor faster-growing companies, or the factors that the investment manager believes will increase the price of the security do not occur.

SUMMARY PROSPECTUS
4 - Templeton Foreign VIP Fund - Class 2
Liquidity From time to time, the trading market for a particular security or type of security in which the Fund invests may become less liquid or even illiquid. Reduced liquidity will have an adverse impact on the Fund’s ability to sell such securities when necessary to meet the Fund’s liquidity needs or in response to a specific economic event and will also generally lower the value of a security. Market prices for such securities may be volatile.
Management The Fund is subject to management risk because it is an actively managed investment portfolio. The Fund’s investment manager applies investment techniques and risk analyses in making investment decisions for the Fund, but there can be no guarantee that these decisions will produce the desired results.
Focus To the extent that the Fund focuses on particular countries, regions, industries, sectors or types of investment from time to time, the Fund may be subject to greater risks of adverse developments in such areas of focus than a fund that invests in a wider variety of countries, regions, industries, sectors or investments.
Derivative Instruments The performance of derivative instruments depends largely on the performance of an underlying instrument, such as a currency, security, interest rate or index, and such instruments often have risks similar to the underlying instrument, in addition to other risks. Derivatives involve costs and can create economic leverage in the Fund’s portfolio which may result in significant volatility and cause the Fund to participate in losses (as well as gains) in an amount that exceeds the Fund’s initial investment. Other risks include illiquidity, mispricing or improper valuation of the derivative instrument, and imperfect correlation between the value of the derivative and the underlying instrument so that the Fund may not realize the intended benefits. When a derivative is used for hedging, the change in value of the derivative may also not correlate specifically with the currency, security, interest rate, index or other risk being hedged. Derivatives also may present the risk that the other party to the transaction will fail to perform.
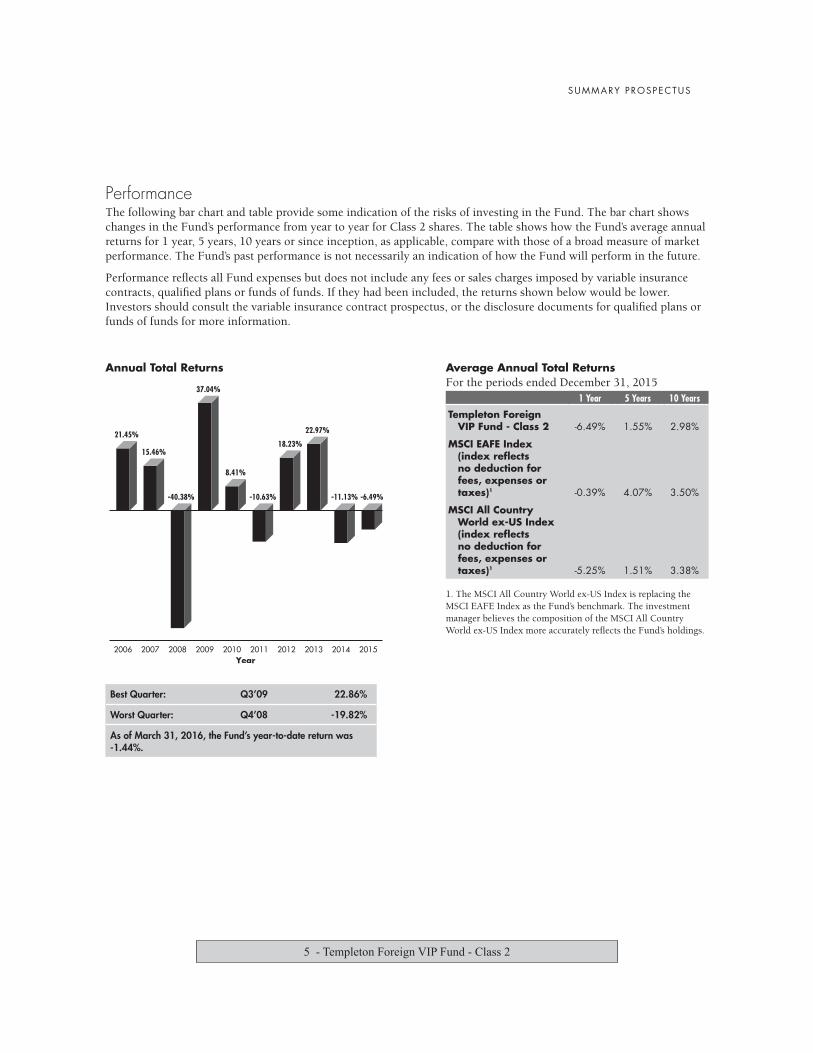
SUMMARY PROSPECTUS
5 - Templeton Foreign VIP Fund - Class 2
PerformanceThe following bar chart and table provide some indication of the risks of investing in the Fund. The bar chart shows changes in the Fund’s performance from year to year for Class 2 shares. The table shows how the Fund’s average annual returns for 1 year, 5 years, 10 years or since inception, as applicable, compare with those of a broad measure of market performance. The Fund’s past performance is not necessarily an indication of how the Fund will perform in the future.
Performance reflects all Fund expenses but does not include any fees or sales charges imposed by variable insurance contracts, qualified plans or funds of funds. If they had been included, the returns shown below would be lower. Investors should consult the variable insurance contract prospectus, or the disclosure documents for qualified plans or funds of funds for more information.
Annual Total Returns
Best Quarter: Q3’09 22.86%
Worst Quarter: Q4’08 -19.82%
As of March 31, 2016, the Fund’s year-to-date return was -1.44%.
-6.49%-11.13%
22.97%
18.23%
-10.63%
8.41%
37.04%
-40.38%
15.46%
21.45%
2015201420132012201120102009200820072006Year
Average Annual Total ReturnsFor the periods ended December 31, 2015
1 Year 5 Years 10 Years
Templeton Foreign VIP Fund - Class 2 -6.49% 1.55% 2.98%
MSCI EAFE Index (index reflects no deduction for fees, expenses or taxes)1 -0.39% 4.07% 3.50%
MSCI All Country World ex-US Index (index reflects no deduction for fees, expenses or taxes)1 -5.25% 1.51% 3.38%
1. The MSCI All Country World ex-US Index is replacing the MSCI EAFE Index as the Fund’s benchmark. The investment manager believes the composition of the MSCI All Country World ex-US Index more accurately reflects the Fund’s holdings.
SUMMARY PROSPECTUS
6 - Templeton Foreign VIP Fund - Class 2
Investment ManagerTempleton Investment Counsel, LLC (Investment Counsel)
Portfolio ManagersPeter A. Nori, CFAExecutive Vice President/Portfolio Manager - Research Analyst of Investment Counsel and portfolio manager of the Fund since 1999.Cindy L. Sweeting, CFAPresident of Investment Counsel and portfolio manager of the Fund since 2012.
Purchase and Sale of Fund SharesShares of the Fund are sold to insurance companies’ separate accounts (Insurers) to fund variable annuity or variable life insurance contracts and to qualified plans. Insurance companies offer variable annuity and variable life insurance products through separate accounts. Shares of the Fund may also be sold to other mutual funds, either as underlying funds in a fund of funds or in other structures. In addition, Fund shares are held by a limited number of Insurers, qualified retirement plans and, when applicable, funds of funds. Substantial withdrawals by one or more Insurers, qualified retirement plans or funds of funds could reduce Fund assets, causing total Fund expenses to become higher than the numbers shown in the fees and expenses table above.
The terms of the offering of interests in separate accounts are included in the variable annuity or variable life insurance product prospectus. The terms of offerings of funds of funds are included in those funds’ prospectuses. The terms of offering of qualified retirement plans are described in their disclosure
documents. Investors should consult the variable contract prospectus, fund of fund prospectus, or plan disclosure documents for more information on fees and expenses imposed by variable insurance contracts, funds of funds or qualified retirement plans, respectively.
TaxesBecause shares of the Fund are generally purchased through variable annuity contracts or variable life insurance contracts, the Fund’s distributions (which the Fund expects, based on its investment goals and strategies to consist of ordinary income, capital gains or some combination of both) will be exempt from current taxation if left to accumulate within the variable contract. You should refer to your contract prospectus for more information on these tax consequences.
Payments to Sponsoring Insurance Companies and Other Financial IntermediariesThe Fund or its distributor (and related companies) may pay broker/dealers or other financial intermediaries (such as banks and insurance companies, or their related companies) for the sale and retention of variable contracts which offer Fund shares and/or for other services. These payments may create a conflict of interest for an intermediary or be a factor in the insurance company’s decision to include the Fund as an investment option in its variable contract. For more information, ask your financial advisor, visit your intermediary’s website, or consult the Contract prospectus or this Fund prospectus.

[THIS PAGE INTENTIONALLY LEFT BLANK]

Investment Company Act file #811-05583
© 2016 Franklin Templeton Investments. All rights reserved. 720 PSUM 09/16
LV607FTS-12 Accompanies the EVUL, BVUL, EVUL II and BVUL II Prospectuses

Summary Prospectus May 1, 2016 (as revised August 1, 2016) American Century Investments®
VP Value Fund Class I: AVPIXClass II: AVPVX
Before you invest, you may want to review the fund’s prospectus, which contains more information about the fund and itsrisks. You can find the fund’s prospectus and other information about the fund online at the web addresses listed below.You can also get this information at no cost by calling or sending an email request. The fund’s prospectus and otherinformation are also available from insurance companies through which shares of the fund may be purchased or sold.
Retail Investorsamericancentury.com/funds/vp_fund_reports.jsp1-800-378-9878 or [email protected]
Financial Professionalsamericancentury.com/ipro/funds/fund_reports_vp.jsp1-800-345-6488advisor_prospectus@americancentury.com
This summary prospectus incorporates by reference the fund’s prospectus and statement of additional information (SAI),each dated May 1, 2016 (as supplemented at the time you receive this summary prospectus), as well as the Report ofIndependent Registered Public Accounting Firm and the financial statements included in the fund’s annual report toshareholders, dated December 31, 2015. The fund's SAI and annual report may be obtained, free of charge, in the samemanner as the prospectus.
Investment ObjectiveThe fund seeks long-term capital growth. Income is a secondary objective.
Fees and ExpensesThe following table describes the fees and expenses you may pay if you buy and hold shares of the fund. The table does not include the fees and expenses associated with your variable annuity or variable life insurance contract. Had they been included, fees and expenses presented below would have been higher. For information regarding the fees and expenses associated with your variable annuity or variable life insurance contract, please refer to your insurance product prospectus.
Annual Fund Operating Expenses (expenses that you pay each year as a percentage of the value of your investment) Class I Class IIManagement Fee 0.97% 0.87%Distribution and Service (12b-1) Fees None 0.25%Other Expenses 0.00% 0.00%Total Annual Fund Operating Expenses 0.97% 1.12%Fee Waiver1 0.15% 0.15%Total Annual Fund Operating Expenses After Waiver 0.82% 0.97%
1 Effective August 1, 2016, the advisor has agreed to waive 0.15 percentage points of the fund’s management fee. The advisor expects this waiver to continue until July 31, 2017 and cannot terminate it prior to such date without the approval of the Board of Directors.
Example The example below is intended to help you compare the costs of investing in the fund with the costs of investing in other mutual funds. The example does not include fees and expenses associated with your variable annuity or variable life insurance contract. Had they been included, fees and expenses would have been higher. The example assumes that you invest $10,000 in the fund for the time periods indicated and then redeem all of your shares at the end of those periods, and that you earn a 5% return each year. The example also assumes that the fund’s operating expenses remain the same, except that it reflects the rate and duration of any fee waivers noted in the table above. Although your actual costs may be higher or lower, based on these assumptions your costs would be:
1 year 3 years 5 years 10 yearsClass I $84 $295 $522 $1,176Class II $99 $342 $603 $1,350

Portfolio Turnover The fund pays transaction costs, such as commissions, when it buys and sells securities (or “turns over” its portfolio). A higher portfolio turnover rate may indicate higher transaction costs. These costs, which are not reflected in annual fund operating expenses or in the example, affect the fund’s performance. During the most recent fiscal year, the fund’s portfolio turnover rate was 47% of the average value of its portfolio.
Principal Investment StrategiesIn selecting stocks for the fund, the portfolio managers look for companies of all sizes whose stock price may not reflect the company’s value. The managers attempt to purchase the stocks of these undervalued companies and hold each stock until the price has increased to, or is higher than, a level the managers believe more accurately reflects the fair value of the company.The fund may invest a portion of its assets in foreign securities when these securities meet the portfolio managers’ standards of selection.The portfolio managers may sell stocks from the fund’s portfolio if they believe a stock no longer meets their valuation criteria, a stock’s risk parameters outweigh its return opportunity, more attractive alternatives are identified or specific events alter a stock’s prospects.
Principal Risks• Multi-Cap Investing – The fund is a multi-capitalization fund that invests in companies of all sizes. The small and medium-sized
companies in which the fund invests may be more volatile and subject to greater risk than larger companies.• Style Risk – If the market does not consider the individual stocks purchased by the fund to be undervalued, the value of the fund’s
shares may decline, even if stock prices generally are rising.• Foreign Securities – The fund may invest in foreign securities, which can be riskier than investing in U.S. securities.• Market Risk – The value of the fund’s shares will go up and down based on the performance of the companies whose securities it
owns and other factors generally affecting the securities market.• Price Volatility – The value of the fund’s shares may fluctuate significantly in the short term.• Redemption Risk –The fund may need to sell securities at times it would not otherwise do so in order to meet shareholder
redemption requests. Selling securities to meet such redemptions may cause the fund to experience a loss or increase the fund’s transaction costs. To the extent that an insurance company has a large position in the fund, the fund may experience relatively large redemptions if such insurance company reallocates its assets.
• Principal Loss – At any given time your shares may be worth less than the price you paid for them. In other words, it is possible to lose money by investing in the fund.
An investment in the fund is not a bank deposit, and it is not insured or guaranteed by the Federal Deposit Insurance Corporation (FDIC) or any other government agency.
Fund PerformanceThe following bar chart and table provide some indication of the risks of investing in the fund. The bar chart shows changes in the fund’s performance from year to year for Class I shares. The table shows how the fund’s average annual returns for the periods shown compared with those of a broad measure of market performance. Fees associated with your variable annuity or variable life insurance contract are not reflected in the chart or table below. Had they been included, returns presented below would have been lower. The fund’s past performance is not necessarily an indication of how the fund will perform in the future.
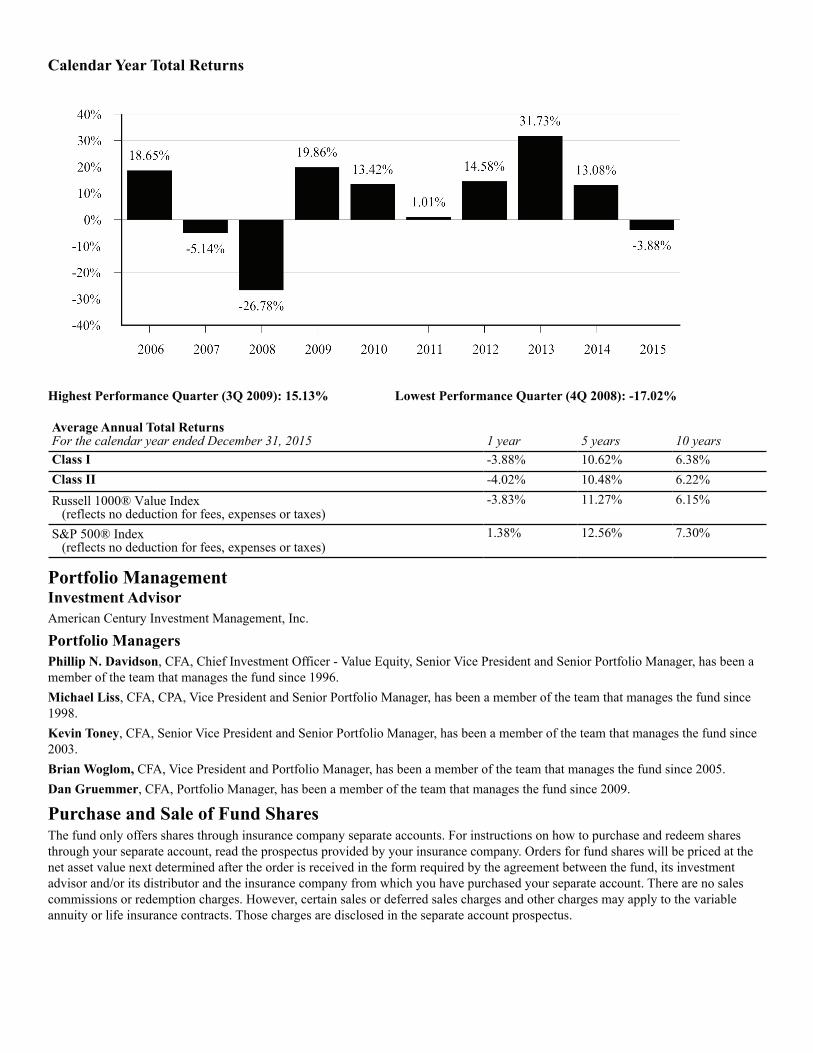
Calendar Year Total Returns
Highest Performance Quarter (3Q 2009): 15.13% Lowest Performance Quarter (4Q 2008): -17.02%
Average Annual Total ReturnsFor the calendar year ended December 31, 2015 1 year 5 years 10 yearsClass I -3.88% 10.62% 6.38%Class II -4.02% 10.48% 6.22%Russell 1000® Value Index (reflects no deduction for fees, expenses or taxes)
-3.83% 11.27% 6.15%
S&P 500® Index (reflects no deduction for fees, expenses or taxes)
1.38% 12.56% 7.30%
Portfolio ManagementInvestment Advisor American Century Investment Management, Inc.
Portfolio Managers Phillip N. Davidson, CFA, Chief Investment Officer - Value Equity, Senior Vice President and Senior Portfolio Manager, has been a member of the team that manages the fund since 1996.Michael Liss, CFA, CPA, Vice President and Senior Portfolio Manager, has been a member of the team that manages the fund since 1998.Kevin Toney, CFA, Senior Vice President and Senior Portfolio Manager, has been a member of the team that manages the fund since 2003.Brian Woglom, CFA, Vice President and Portfolio Manager, has been a member of the team that manages the fund since 2005.Dan Gruemmer, CFA, Portfolio Manager, has been a member of the team that manages the fund since 2009.
Purchase and Sale of Fund SharesThe fund only offers shares through insurance company separate accounts. For instructions on how to purchase and redeem shares through your separate account, read the prospectus provided by your insurance company. Orders for fund shares will be priced at the net asset value next determined after the order is received in the form required by the agreement between the fund, its investment advisor and/or its distributor and the insurance company from which you have purchased your separate account. There are no sales commissions or redemption charges. However, certain sales or deferred sales charges and other charges may apply to the variable annuity or life insurance contracts. Those charges are disclosed in the separate account prospectus.

Tax InformationConsult the prospectus of your insurance company separate account for a discussion of the tax status of your variable contract.
Payments to Broker-Dealers and Other Financial IntermediariesThe fund is offered as an underlying investment option for variable annuity or life insurance contracts. The fund and its related companies pay the sponsoring insurance company and its related companies for distribution and other services. These payments may influence the insurance company to include the fund over another investment as an option in its products. Ask your salesperson or visit your insurance company’s website for more information.
©2016 American Century Proprietary Holdings, Inc. All rights reserved.CL-SUM-90074 1608
LV600ACS-08 Accompanies the FVA, Pivot and all VL Prospectuses

Summary Prospectus May 1, 2016 (as revised August 1, 2016) American Century Investments®
VP Mid Cap Value Fund Class I: AVIPXClass II: AVMTX
Before you invest, you may want to review the fund’s prospectus, which contains more information about the fund and itsrisks. You can find the fund’s prospectus and other information about the fund online at the web addresses listed below.You can also get this information at no cost by calling or sending an email request. The fund’s prospectus and otherinformation are also available from insurance companies through which shares of the fund may be purchased or sold.
Retail Investorsamericancentury.com/funds/vp_fund_reports.jsp1-800-378-9878 or [email protected]
Financial Professionalsamericancentury.com/ipro/funds/fund_reports_vp.jsp1-800-345-6488advisor_prospectus@americancentury.com
This summary prospectus incorporates by reference the fund’s prospectus and statement of additional information (SAI),each dated May 1, 2016 (as supplemented at the time you receive this summary prospectus), as well as the Report ofIndependent Registered Public Accounting Firm and the financial statements included in the fund’s annual report toshareholders, dated December 31, 2015. The fund's SAI and annual report may be obtained, free of charge, in the samemanner as the prospectus.
Investment ObjectiveThe fund seeks long-term capital growth. Income is a secondary objective.
Fees and ExpensesThe following table describes the fees and expenses you may pay if you buy and hold shares of the fund. The table does not include the fees and expenses associated with your variable annuity or variable life insurance contract. Had they been included, fees and expenses presented below would have been higher. For information regarding the fees and expenses associated with your variable annuity or variable life insurance contract, please refer to your insurance product prospectus.
Annual Fund Operating Expenses (expenses that you pay each year as a percentage of the value of your investment) Class I Class IIManagement Fee 1.00% 0.90%Distribution and Service (12b-1) Fees None 0.25%Other Expenses 0.01% 0.01%Total Annual Fund Operating Expenses 1.01% 1.16%Fee Waiver1 0.14% 0.14%Total Annual Fund Operating Expenses After Waiver 0.87% 1.02%
1 Effective August 1, 2016, the advisor has agreed to waive 0.14 percentage points of the fund’s management fee. The advisor expects this waiver to continue until July 31, 2017 and cannot terminate it prior to such date without the approval of the Board of Directors.
Example The example below is intended to help you compare the costs of investing in the fund with the costs of investing in other mutual funds. The example does not include fees and expenses associated with your variable annuity or variable life insurance contract. Had they been included, fees and expenses would have been higher. The example assumes that you invest $10,000 in the fund for the time periods indicated and then redeem all of your shares at the end of those periods, and that you earn a 5% return each year. The example also assumes that the fund’s operating expenses remain the same, except that it reflects the rate and duration of any fee waivers noted in the table above. Although your actual costs may be higher or lower, based on these assumptions your costs would be:
1 year 3 years 5 years 10 yearsClass I $89 $308 $545 $1,224Class II $104 $355 $626 $1,396
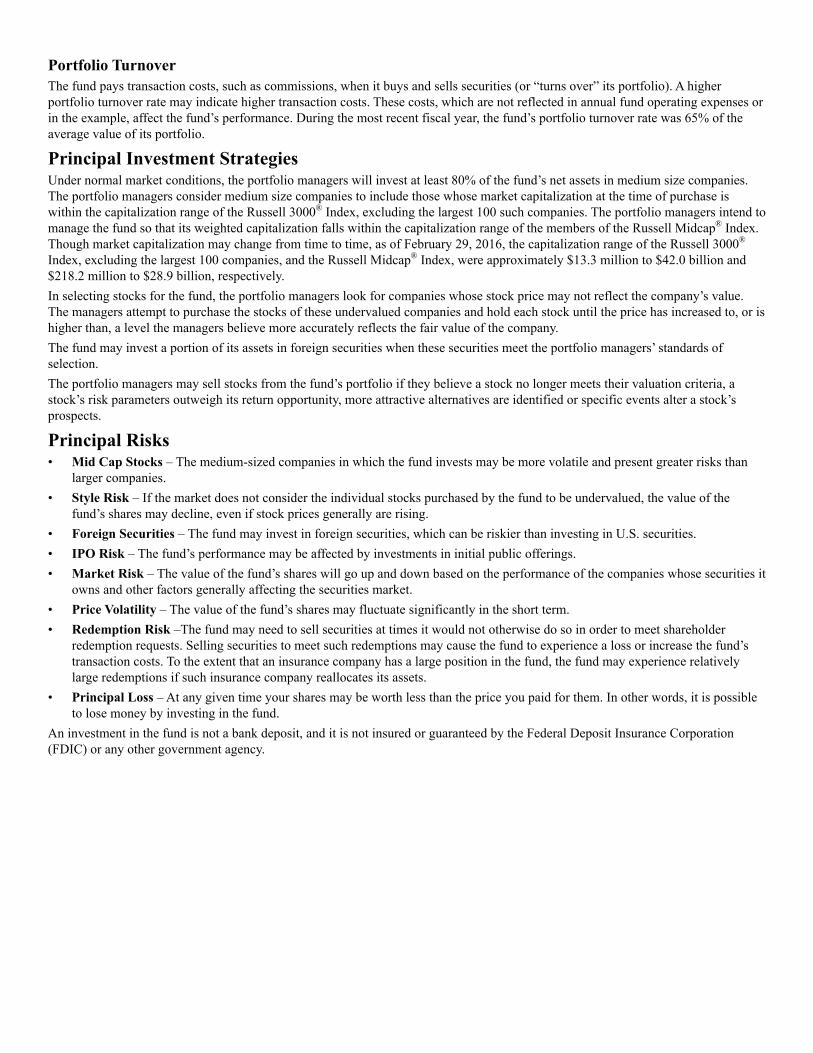
Portfolio Turnover The fund pays transaction costs, such as commissions, when it buys and sells securities (or “turns over” its portfolio). A higher portfolio turnover rate may indicate higher transaction costs. These costs, which are not reflected in annual fund operating expenses or in the example, affect the fund’s performance. During the most recent fiscal year, the fund’s portfolio turnover rate was 65% of the average value of its portfolio.
Principal Investment StrategiesUnder normal market conditions, the portfolio managers will invest at least 80% of the fund’s net assets in medium size companies. The portfolio managers consider medium size companies to include those whose market capitalization at the time of purchase is within the capitalization range of the Russell 3000® Index, excluding the largest 100 such companies. The portfolio managers intend to manage the fund so that its weighted capitalization falls within the capitalization range of the members of the Russell Midcap® Index. Though market capitalization may change from time to time, as of February 29, 2016, the capitalization range of the Russell 3000® Index, excluding the largest 100 companies, and the Russell Midcap® Index, were approximately $13.3 million to $42.0 billion and $218.2 million to $28.9 billion, respectively.In selecting stocks for the fund, the portfolio managers look for companies whose stock price may not reflect the company’s value. The managers attempt to purchase the stocks of these undervalued companies and hold each stock until the price has increased to, or is higher than, a level the managers believe more accurately reflects the fair value of the company.The fund may invest a portion of its assets in foreign securities when these securities meet the portfolio managers’ standards of selection.The portfolio managers may sell stocks from the fund’s portfolio if they believe a stock no longer meets their valuation criteria, a stock’s risk parameters outweigh its return opportunity, more attractive alternatives are identified or specific events alter a stock’s prospects.
Principal Risks• Mid Cap Stocks – The medium-sized companies in which the fund invests may be more volatile and present greater risks than
larger companies.• Style Risk – If the market does not consider the individual stocks purchased by the fund to be undervalued, the value of the
fund’s shares may decline, even if stock prices generally are rising.• Foreign Securities – The fund may invest in foreign securities, which can be riskier than investing in U.S. securities.• IPO Risk – The fund’s performance may be affected by investments in initial public offerings.• Market Risk – The value of the fund’s shares will go up and down based on the performance of the companies whose securities it
owns and other factors generally affecting the securities market.• Price Volatility – The value of the fund’s shares may fluctuate significantly in the short term.• Redemption Risk –The fund may need to sell securities at times it would not otherwise do so in order to meet shareholder
redemption requests. Selling securities to meet such redemptions may cause the fund to experience a loss or increase the fund’s transaction costs. To the extent that an insurance company has a large position in the fund, the fund may experience relatively large redemptions if such insurance company reallocates its assets.
• Principal Loss – At any given time your shares may be worth less than the price you paid for them. In other words, it is possible to lose money by investing in the fund.
An investment in the fund is not a bank deposit, and it is not insured or guaranteed by the Federal Deposit Insurance Corporation (FDIC) or any other government agency.
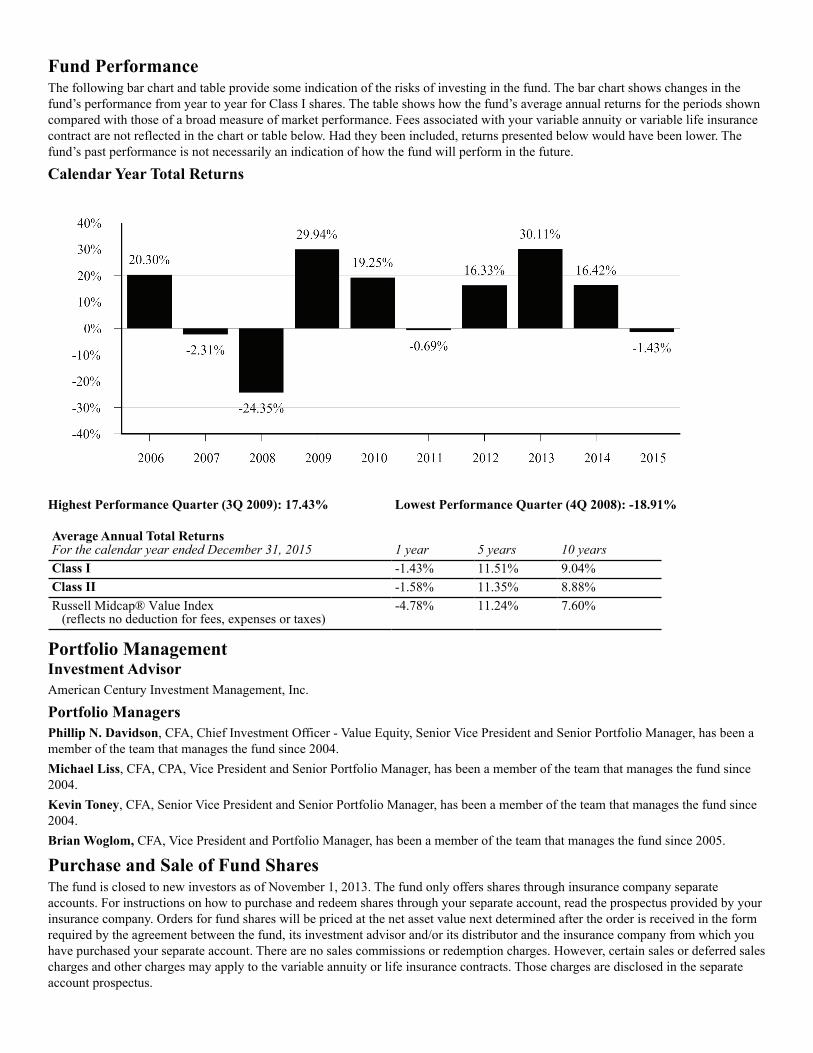
Fund PerformanceThe following bar chart and table provide some indication of the risks of investing in the fund. The bar chart shows changes in the fund’s performance from year to year for Class I shares. The table shows how the fund’s average annual returns for the periods shown compared with those of a broad measure of market performance. Fees associated with your variable annuity or variable life insurance contract are not reflected in the chart or table below. Had they been included, returns presented below would have been lower. The fund’s past performance is not necessarily an indication of how the fund will perform in the future.
Calendar Year Total Returns
Highest Performance Quarter (3Q 2009): 17.43% Lowest Performance Quarter (4Q 2008): -18.91%
Average Annual Total Returns For the calendar year ended December 31, 2015 1 year 5 years 10 yearsClass I -1.43% 11.51% 9.04%Class II -1.58% 11.35% 8.88%Russell Midcap® Value Index (reflects no deduction for fees, expenses or taxes)
-4.78% 11.24% 7.60%
Portfolio ManagementInvestment Advisor American Century Investment Management, Inc.
Portfolio Managers Phillip N. Davidson, CFA, Chief Investment Officer - Value Equity, Senior Vice President and Senior Portfolio Manager, has been a member of the team that manages the fund since 2004.Michael Liss, CFA, CPA, Vice President and Senior Portfolio Manager, has been a member of the team that manages the fund since 2004.Kevin Toney, CFA, Senior Vice President and Senior Portfolio Manager, has been a member of the team that manages the fund since 2004.Brian Woglom, CFA, Vice President and Portfolio Manager, has been a member of the team that manages the fund since 2005.
Purchase and Sale of Fund SharesThe fund is closed to new investors as of November 1, 2013. The fund only offers shares through insurance company separate accounts. For instructions on how to purchase and redeem shares through your separate account, read the prospectus provided by your insurance company. Orders for fund shares will be priced at the net asset value next determined after the order is received in the form required by the agreement between the fund, its investment advisor and/or its distributor and the insurance company from which you have purchased your separate account. There are no sales commissions or redemption charges. However, certain sales or deferred sales charges and other charges may apply to the variable annuity or life insurance contracts. Those charges are disclosed in the separate account prospectus.

Tax InformationConsult the prospectus of your insurance company separate account for a discussion of the tax status of your variable contract.
Payments to Broker-Dealers and Other Financial IntermediariesThe fund is offered as an underlying investment option for variable annuity or life insurance contracts. The fund and its related companies pay the sponsoring insurance company and its related companies for distribution and other services. These payments may influence the insurance company to include the fund over another investment as an option in its products. Ask your salesperson or visit your insurance company’s website for more information.
©2016 American Century Proprietary Holdings, Inc. All rights reserved.CL-SUM-90072 1608
LV600ACS-06 Accompanies the FVA, IPVA old, IPVA new and all VL Prospectuses

Summary Prospectus May 1, 2016 (as revised August 1, 2016) American Century Investments®
VP International Fund Class I: AVIIX Class II: ANVPX
Before you invest, you may want to review the fund’s prospectus, which contains more information about the fund and itsrisks. You can find the fund’s prospectus and other information about the fund online at the web addresses listed below.You can also get this information at no cost by calling or sending an email request. The fund’s prospectus and otherinformation are also available from insurance companies through which shares of the fund may be purchased or sold.
Retail Investorsamericancentury.com/funds/vp_fund_reports.jsp1-800-378-9878 or [email protected]
Financial Professionalsamericancentury.com/ipro/funds/fund_reports_vp.jsp1-800-345-6488advisor_prospectus@americancentury.com
This summary prospectus incorporates by reference the fund’s prospectus and statement of additional information (SAI),each dated May 1, 2016 (as supplemented at the time you receive this summary prospectus), as well as the Report ofIndependent Registered Public Accounting Firm and the financial statements included in the fund’s annual report toshareholders, dated December 31, 2015. The fund’s SAI and annual report may be obtained, free of charge, in the samemanner as the prospectus.
Investment ObjectiveThe fund seeks capital growth.
Fees and ExpensesThe following table describes the fees and expenses you may pay if you buy and hold shares of the fund. The table does not include the fees and expenses associated with your variable annuity or variable life insurance contract. Had they been included, fees and expenses presented below would have been higher. For information regarding the fees and expenses associated with your variable annuity or variable life insurance contract, please refer to your insurance product prospectus.
Annual Fund Operating Expenses (expenses that you pay each year as a percentage of the value of your investment) Class I Class IIManagement Fee 1.31% 1.21%Distribution and Service (12b-1) Fees None 0.25%Other Expenses 0.02% 0.02%Total Annual Fund Operating Expenses 1.33% 1.48%Fee Waiver1 0.21% 0.21%Total Annual Fund Operating Expenses After Waiver 1.12% 1.27%
1 Effective August 1, 2016, the advisor has agreed to waive 0.21 percentage points of the fund’s management fee. The advisor expects this waiver to continue until July 31, 2017 and cannot terminate it prior to such date without the approval of the Board of Directors.
ExampleThe example below is intended to help you compare the costs of investing in the fund with the costs of investing in other mutual funds. The example does not include fees and expenses associated with your variable annuity or variable life insurance contract. Had they been included, fees and expenses would have been higher. The example assumes that you invest $10,000 in the fund for the time periods indicated and then redeem all of your shares at the end of those periods and that you earn a 5% return each year. The example also assumes that the fund’s operating expenses remain the same, except that it reflects the rate and duration of any fee waivers noted in the table above. Although your actual costs may be higher or lower, based on these assumptions your costs would be:
1 year 3 years 5 years 10 yearsClass I $114 $401 $709 $1,582Class II $130 $448 $789 $1,749
Portfolio TurnoverThe fund pays transaction costs, such as commissions, when it buys and sells securities (or “turns over” its portfolio). A higher portfolio turnover rate may indicate higher transaction costs. These costs, which are not reflected in annual fund operating expenses or in the example, affect the fund’s performance. During the most recent fiscal year, the fund’s portfolio turnover rate was 59% of the average value of its portfolio.
Principal Investment StrategiesThe fund invests primarily in securities of companies located in at least three developed countries world-wide (excluding the United States). The portfolio managers look for stocks of companies they believe will increase in value over time, using an investment strategy developed by the fund’s investment advisor. In implementing this strategy, the portfolio managers make their investment decisions based primarily on their analysis of individual companies, rather than on broad economic forecasts. Management of the fund is based on the belief that, over the long term, stock price movements follow growth in earnings, revenues and/or cash flow. The portfolio managers use a variety of analytical research tools and techniques to help them buy and hold the stocks of companies that meet their investment criteria and sell the stocks of companies that do not. Under normal market conditions, the fund’s portfolio managers seek securities of companies whose earnings, revenues or key business fundamentals are not only growing, but growing at an accelerating pace.
Principal Risks• Foreign Risk – Foreign securities are generally riskier than U.S. securities. Political events (such as civil unrest, national elections
and imposition of exchange controls), social and economic events (such as labor strikes and rising inflation), and natural disasters occurring in a country where the fund invests could cause the fund’s investments in that country to experience gains or losses. Securities of foreign issuers may be less liquid, more volatile and harder to value than U.S. securities.
• Currency Risk – The fund could experience gains or losses based solely on changes in the exchange rate between foreign currencies and the U.S. dollar.
• Emerging Market Risk – Investing in emerging market countries generally is riskier than investing in foreign developed countries. Emerging market countries may have unstable governments, economies that are subject to sudden change, and significant volatility in their financial markets. These countries also may lack the legal, business and social framework to support securities markets.
• Growth Stocks – Investments in growth stocks may be more volatile than other stocks and the overall stock market. These stocks are typically priced higher than other stocks because of their growth potential, which may or may not be realized.
• Style Risk – If at any time the market is not favoring the fund’s growth investment style, the fund’s gains may not be as big as, or its losses may be bigger than, those of other equity funds using different investment styles.
• Market Risk – The value of the fund’s shares will go up and down based on the performance of the companies whose securities it owns and other factors generally affecting the securities market.
• Price Volatility – The value of the fund’s shares may fluctuate significantly in the short term.• Redemption Risk – The fund may need to sell securities at times it would not otherwise do so in order to meet shareholder
redemption requests. Selling securities to meet such redemptions may cause the fund to experience a loss or increase the fund’s transaction costs. To the extent that an insurance company has a large position in the fund, the fund may experience relatively large redemptions if such insurance company reallocates its assets.
• Principal Loss – At any given time your shares may be worth less than the price you paid for them. In other words, it is possible to lose money by investing in the fund.
An investment in the fund is not a bank deposit, and it is not insured or guaranteed by the Federal Deposit Insurance Corporation (FDIC) or any other government agency.

Fund PerformanceThe following bar chart and table provide some indication of the risks of investing in the fund. The bar chart shows changes in the fund’s performance from year to year for Class I shares. The table shows how the fund’s average annual returns for the periods shown compared with those of a broad measure of market performance. Fees associated with your variable annuity or variable life insurance contract are not reflected in the chart or table below. Had they been included, returns presented below would have been lower. The fund’s past performance is not necessarily an indication of how the fund will perform in the future.
Calendar Year Total Returns
Highest Performance Quarter (2Q 2009): 22.50% Lowest Performance Quarter (3Q 2008): -23.41%
Average Annual Total ReturnsFor the calendar year ended December 31, 2015 1 year 5 years 10 yearsClass I 0.76% 4.43% 4.36%Class II 0.51% 4.26% 4.20%MSCI EAFE Index (reflects no deduction for fees, expenses or taxes)
-0.81% 3.60% 3.03%
MSCI EAFE Growth Index (reflects no deduction for fees, expenses or taxes)
4.09% 4.60% 4.03%
Portfolio ManagementInvestment AdvisorAmerican Century Investment Management, Inc.
Portfolio ManagersRajesh Gandhi, CFA, Vice President and Senior Portfolio Manager, has been a member of the team that manages the fund since 2002.James G. Gendelman, Vice President and Portfolio Manager, has been a member of the team that manages the fund since 2015.
Purchase and Sale of Fund SharesThe fund only offers shares through insurance company separate accounts. For instructions on how to purchase and redeem shares through your separate account, read the prospectus provided by your insurance company. Orders for fund shares will be priced at the net asset value next determined after the order is received in the form required by the agreement between the fund, its investment advisor and/or its distributor and the insurance company from which you have purchased your separate account. There are no sales commissions or redemption charges. However, certain sales or deferred sales charges and other charges may apply to the variable annuity or life insurance contracts. Those charges are disclosed in the separate account prospectus.

Tax InformationConsult the prospectus of your insurance company separate account for a discussion of the tax status of your variable contract.
Payments to Broker-Dealers and Other Financial IntermediariesThe fund is offered as an underlying investment option for variable annuity or life insurance contracts. The fund and its related companies pay the sponsoring insurance company and its related companies for distribution and other services. These payments may influence the insurance company to include the fund over another investment as an option in its products. Ask your salesperson or visit your insurance company’s website for more information.
©2016 American Century Proprietary Holdings, Inc. All rights reserved.CL-SUM-90071 1608
LV600ACS-05 Accompanies the EVUL. BVUL, EVUL II and BVUL II Prospectuses

PIMCO High Yield Portfolio
PVIT | SUMMARY PROSPECTUS
SUMMARY PROSPECTUSApril 29, 2016 (as supplemented July 29, 2016)§
Share Class: Administrative Summary Prospectus
Before you invest, you may want to review the Portfolio’s prospectus, which, assupplemented, contains more information about the Portfolio and its risks. You can find thePortfolio’s prospectus and other information about the Portfolio online at http://pvit.pimco-funds.com/FundReports.aspx. You can also get this information at no cost by calling1.800.927.4648 or by sending an email request to [email protected]. ThePortfolio’s prospectus and Statement of Additional Information, both dated April 29, 2016,as supplemented, along with the financial statements included in the Portfolio’s most recentannual report to shareholders dated December 31, 2015, are incorporated by reference intothis Summary Prospectus.
Investment ObjectiveThe Portfolio seeks maximum total return, consistent with preservation ofcapital and prudent investment management.
Fees and Expenses of the PortfolioThis table describes the fees and expenses that you may pay if you buy andhold Administrative Class shares of the Portfolio. Overall fees and expensesof investing in the Portfolio are higher than shown because the table doesnot reflect variable contract fees and expenses.
Shareholder Fees (fees paid directly from your investment): None
Annual Portfolio Operating Expenses (expenses that you payeach year as a percentage of the value of your investment):
AdministrativeClass
Management Fees 0.60%
Distribution and/or Service (12b-1) Fees 0.15%
Other Expenses(1) 0.01%
Total Annual Portfolio Operating Expenses(2) 0.76%
1 “Other Expenses” reflect interest expense and is based on the amount incurred duringthe Portfolio’s most recent fiscal year as a result of entering into certain investments,such as reverse repurchase agreements. Interest expense is required to be treated as aPortfolio expense for accounting purposes and is not payable to PIMCO. The amount ofinterest expense (if any) will vary based on the Portfolio’s use of such investments as aninvestment strategy.
2 Total Annual Portfolio Operating Expenses excluding interest expense is 0.75% forAdministrative Class shares.
Example. The Example is intended to help you compare the cost ofinvesting in Administrative Class shares of the Portfolio with the costs ofinvesting in other mutual funds. The Example assumes that you invest$10,000 for the time periods indicated, and then redeem all your shares atthe end of those periods. The Example also assumes that your investmenthas a 5% return each year and that the Portfolio’s operating expensesremain the same. Although your actual costs may be higher or lower, theExample shows what your costs would be based on these assumptions. TheExample does not reflect fees and expenses of any variable annuity contractor variable life insurance policy, and would be higher if it did.
1 Year 3 Years 5 Years 10 Years
Administrative Class $78 $243 $422 $942
Portfolio TurnoverThe Portfolio pays transaction costs when it buys and sells securities (or“turns over” its portfolio). A higher portfolio turnover rate may indicatehigher transaction costs. These costs, which are not reflected in the AnnualPortfolio Operating Expenses or in the Example table, affect the Portfolio’sperformance. During the most recent fiscal year, the Portfolio’s portfolioturnover rate was 23% of the average value of its portfolio.
Principal Investment StrategiesThe Portfolio seeks to achieve its investment objective by investing undernormal circumstances at least 80% of its assets in a diversified portfolio ofhigh yield securities (“junk bonds”), which may be represented by forwardsor derivatives such as options, futures contracts or swap agreements, ratedbelow investment grade by Moody’s Investors Service, Inc. (“Moody’s”), orequivalently rated by Standard & Poor’s Ratings Services (“S&P”) or Fitch,Inc. (“Fitch”), or, if unrated, determined by Pacific Investment ManagementCompany LLC (“PIMCO”) to be of comparable quality. The Portfolio mayinvest up to 20% of its total assets in securities rated Caa or below byMoody’s, or equivalently rated by S&P or Fitch, or, if unrated, determined byPIMCO to be of comparable quality. The remainder of the Portfolio’s assetsmay be invested in investment grade Fixed Income Instruments. “FixedIncome Instruments” include bonds, debt securities and other similarinstruments issued by various U.S. and non-U.S. public- or private-sectorentities. The average portfolio duration of this Portfolio normally varieswithin two years (plus or minus) of the portfolio duration of the securitiescomprising the BofA Merrill Lynch U.S. High Yield, BB-B Rated, ConstrainedIndex, as calculated by PIMCO, which as of March 31, 2016 was 3.83years. Duration is a measure used to determine the sensitivity of a security’sprice to changes in interest rates. The longer a security’s duration, the moresensitive it will be to changes in interest rates. The Portfolio may invest up to20% of its total assets in securities denominated in foreign currencies andmay invest without limit in U.S. dollar-denominated securities of foreignissuers. The Portfolio will normally limit its foreign currency exposure (fromnon-U.S. dollar-denominated securities or currencies) to 20% of its totalassets. The Portfolio may invest up to 15% of its total assets in securitiesand instruments that are economically tied to emerging market countries(this limitation does not apply to investment grade sovereign debtdenominated in the local currency with less than 1 year remaining tomaturity, which means the Portfolio may invest, together with any otherinvestments denominated in foreign currencies, up to 20% of its totalassets in such instruments).
The Portfolio may invest, without limitation, in derivative instruments, suchas options, futures contracts or swap agreements, or in mortgage- or asset-backed securities, subject to applicable law and any other restrictionsdescribed in the Portfolio’s prospectus or Statement of AdditionalInformation. The Portfolio may purchase or sell securities on a when-issued,delayed delivery or forward commitment basis and may engage in shortsales. The Portfolio may, without limitation, seek to obtain market exposureto the securities in which it primarily invests by entering into a series of

PIMCO High Yield Portfolio
. SUMMARY PROSPECTUS | PVIT2
purchase and sale contracts or by using other investment techniques (suchas buy backs or dollar rolls). The “total return” sought by the Portfolioconsists of income earned on the Portfolio’s investments, plus capitalappreciation, if any, which generally arises from decreases in interest rates,foreign currency appreciation, or improving credit fundamentals for aparticular sector or security. The Portfolio may invest up to 10% of its totalassets in preferred stocks.
Principal RisksIt is possible to lose money on an investment in the Portfolio. The principalrisks of investing in the Portfolio, which could adversely affect its net assetvalue, yield and total return, are:
Interest Rate Risk: the risk that fixed income securities will decline invalue because of an increase in interest rates; a portfolio with a longeraverage portfolio duration will be more sensitive to changes in interest ratesthan a portfolio with a shorter average portfolio duration
Call Risk: the risk that an issuer may exercise its right to redeem a fixedincome security earlier than expected (a call). Issuers may call outstandingsecurities prior to their maturity for a number of reasons (e.g., declininginterest rates, changes in credit spreads and improvements in the issuer’scredit quality). If an issuer calls a security that the Portfolio has invested in,the Portfolio may not recoup the full amount of its initial investment andmay be forced to reinvest in lower-yielding securities, securities with greatercredit risks or securities with other, less favorable features
Credit Risk: the risk that the Portfolio could lose money if the issuer orguarantor of a fixed income security, or the counterparty to a derivativecontract, is unable or unwilling to meet its financial obligations
High Yield Risk: the risk that high yield securities and unrated securities ofsimilar credit quality (commonly known as “junk bonds”) are subject togreater levels of credit, call and liquidity risks. High yield securities areconsidered primarily speculative with respect to the issuer’s continuingability to make principal and interest payments, and may be more volatilethan higher-rated securities of similar maturity
Market Risk: the risk that the value of securities owned by the Portfoliomay go up or down, sometimes rapidly or unpredictably, due to factorsaffecting securities markets generally or particular industries
Issuer Risk: the risk that the value of a security may decline for a reasondirectly related to the issuer, such as management performance, financialleverage and reduced demand for the issuer’s goods or services
Liquidity Risk: the risk that a particular investment may be difficult topurchase or sell and that the Portfolio may be unable to sell illiquidsecurities at an advantageous time or price or achieve its desired level ofexposure to a certain sector. Liquidity risk may result from the lack of anactive market, reduced number and capacity of traditional marketparticipants to make a market in fixed income securities, and may bemagnified in a rising interest rate environment or other circumstanceswhere investor redemptions from fixed income mutual funds may be higherthan normal, causing increased supply in the market due to selling activity
Derivatives Risk: the risk of investing in derivative instruments (such asfutures, swaps and structured securities), including liquidity, interest rate,
market, credit and management risks, mispricing or valuation complexity.Changes in the value of the derivative may not correlate perfectly with, andmay be more sensitive to market events than, the underlying asset, rate orindex, and the Portfolio could lose more than the initial amount invested.The Portfolio’s use of derivatives may result in losses to the Portfolio, areduction in the Portfolio’s returns and/or increased volatility. Over-the-counter (“OTC”) derivatives are also subject to the risk that a counterpartyto the transaction will not fulfill its contractual obligations to the otherparty, as many of the protections afforded to centrally-cleared derivativetransactions might not be available for OTC derivatives. For derivativestraded on an exchange or through a central counterparty, credit risk resideswith the creditworthiness of the Portfolio’s clearing broker, or theclearinghouse itself, rather than to a counterparty in an OTC derivativetransaction. Changes in regulation relating to a mutual fund’s use ofderivatives and related instruments could potentially limit or impact thePortfolio’s ability to invest in derivatives, limit the Portfolio’s ability to employcertain strategies that use derivatives and/or adversely affect the value orperformance of derivatives and the Portfolio
Equity Risk: the risk that the value of equity securities, such as commonstocks and preferred stocks, may decline due to general market conditionswhich are not specifically related to a particular company or to factorsaffecting a particular industry or industries. Equity securities generally havegreater price volatility than fixed income securities
Mortgage-Related and Other Asset-Backed Securities Risk: therisks of investing in mortgage-related and other asset-backed securities,including interest rate risk, extension risk, prepayment risk, and credit risk
Foreign (Non-U.S.) Investment Risk: the risk that investing in foreign(non-U.S.) securities may result in the Portfolio experiencing more rapid andextreme changes in value than a portfolio that invests exclusively insecurities of U.S. companies, due to smaller markets, differing reporting,accounting and auditing standards, increased risk of delayed settlement ofportfolio transactions or loss of certificates of portfolio securities, and therisk of unfavorable foreign government actions, including nationalization,expropriation or confiscatory taxation, currency blockage, or politicalchanges or diplomatic developments. Foreign securities may also be lessliquid and more difficult to value than securities of U.S. issuers
Emerging Markets Risk: the risk of investing in emerging marketsecurities, primarily increased foreign (non-U.S.) investment risk
Sovereign Debt Risk: the risk that investments in fixed incomeinstruments issued by sovereign entities may decline in value as a result ofdefault or other adverse credit event resulting from an issuer’s inability orunwillingness to make principal or interest payments in a timely fashion
Currency Risk: the risk that foreign (non-U.S.) currencies will decline invalue relative to the U.S. dollar and affect the Portfolio’s investments inforeign (non-U.S.) currencies or in securities that trade in, and receiverevenues in, or in derivatives that provide exposure to, foreign (non-U.S.)currencies
Leveraging Risk: the risk that certain transactions of the Portfolio, such asreverse repurchase agreements, loans of portfolio securities, and the use ofwhen-issued, delayed delivery or forward commitment transactions, orderivative instruments, may give rise to leverage, magnifying gains and

Summary Prospectus
April 29, 2016 (as supplemented July 29, 2016) | SUMMARY PROSPECTUS .3
losses and causing the Portfolio to be more volatile than if it had not beenleveraged. This means that leverage entails a heightened risk of loss
Management Risk: the risk that the investment techniques and riskanalyses applied by PIMCO will not produce the desired results and thatlegislative, regulatory, or tax restrictions, policies or developments mayaffect the investment techniques available to PIMCO and the individualportfolio manager in connection with managing the Portfolio. There is noguarantee that the investment objective of the Portfolio will be achieved
Short Sale Risk: the risk of entering into short sales, including thepotential loss of more money than the actual cost of the investment, andthe risk that the third party to the short sale may fail to honor its contractterms, causing a loss to the Portfolio
Please see “Description of Principal Risks” in the Portfolio’s prospectus for amore detailed description of the risks of investing in the Portfolio. Aninvestment in the Portfolio is not a deposit of a bank and is not insured orguaranteed by the Federal Deposit Insurance Corporation or any othergovernment agency.
Performance InformationThe performance information below shows summary performanceinformation for the Portfolio in a bar chart and an Average Annual TotalReturns table. The information provides some indication of the risks ofinvesting in the Portfolio by showing changes in its performance from yearto year and by showing how the Portfolio’s average annual returns comparewith the returns of a broad-based securities market index. The Portfolio’sperformance information reflects applicable fee waivers and/or expenselimitations in effect during the periods presented. Absent such fee waiversand/or expense limitations, if any, performance would have been lower.Performance shown does not reflect any charges or expenses imposed byan insurance company and if it did, performance shown would be lower.The bar chart and the table show performance of the Portfolio’sAdministrative Class shares. The Portfolio’s past performance is notnecessarily an indication of how the Portfolio will perform in the future.
The BofA Merrill Lynch U.S. High Yield, BB-B Rated, Constrained Index tracksthe performance of BB-B rated U.S. Dollar-denominated corporate bondspublicly issued in the U.S. domestic market. Qualifying bonds arecapitalization-weighted provided the total allocation to an individual issuer(defined by Bloomberg tickers) does not exceed 2%. Issuers that exceed thelimit are reduced to 2% and the face value of each of their bonds isadjusted on a pro-rata basis. Similarly, the face value of bonds of all otherissuers that fall below the 2% cap are increased on a pro-rata basis.
Performance for the Portfolio is updated daily and monthly and may beobtained as follows: daily updates on the net asset value may be obtainedby calling 1-888-87-PIMCO and monthly performance may be obtained athttp://pvit.pimco-funds.com.
Calendar Year Total Returns — Administrative Class*
'06 '07 '08 '09 '10 '11 '12 '13 '14 '15-40
-20
0
20
40
60
9.08%3.50%
-23.51%
40.26%
14.46%
3.34%
14.30%
5.73% 3.34%
-1.64%
(%)
Years
*For the periods shown in the bar chart, the highest quarterly return was 17.35% in the Q22009, and the lowest quarterly return was -12.52% in the Q4 2008.
Average Annual Total Returns (for periods ended 12/31/15)1 Year 5 Years 10 Years
Administrative Class Return -1.64% 4.89% 5.82%
BofA Merrill Lynch U.S. High Yield, BB-B Rated,Constrained Index (reflects no deductions for fees,expenses or taxes)
-2.79% 5.25% 6.43%
Investment Adviser/Portfolio ManagerPIMCO serves as the investment adviserfor the Portfolio. The Portfolio’s portfolio isjointly managed by Andrew Jessop andHozef Arif. Mr. Jessop is a ManagingDirector of PIMCO and has managedthe Portfolio since January 2010. Mr. Arif
is an Executive Vice President of PIMCO and has managedthe Portfolio since July 2016.
Purchase and Sale of Portfolio SharesShares of the Portfolio currently are sold to segregated asset accounts(“Separate Accounts”) of insurance companies that fund variable annuitycontracts and variable life insurance policies (“Variable Contracts”).Investors do not deal directly with the Portfolio to purchase and redeemshares. Please refer to the prospectus for the Separate Account forinformation on the allocation of premiums and on transfers of accumulatedvalue among sub-accounts of the Separate Account.
Tax InformationThe shareholders of the Portfolio are the insurance companies offering thevariable products. Please refer to the prospectus for the Separate Accountand the Variable Contract for information regarding the federal income taxtreatment of distributions to the Separate Account.
Payments to Insurance Companies and OtherFinancial IntermediariesThe Portfolio and/or its related companies (including PIMCO) may pay theinsurance company and other intermediaries for the sale of the Portfolioand/or other services. These payments may create a conflict of interest by

PIMCO High Yield Portfolio
. SUMMARY PROSPECTUS | PVIT4
influencing the insurance company or intermediary and your salesperson torecommend a Variable Contract and the Portfolio over another investment.Ask your insurance company or salesperson or visit your financialintermediary’s Web site for more information.
PVIT0337S_072916
LV612PCS-12 Accompanies the IPVA old, IPVA new, Pivot, EVUL, BVUL, EVUL II and BVUL II Prospectuses

1 of 4
LargeCap S&P 500 Index Account - Class 1 and Class 2 SharesPrincipal Variable Contracts Funds, Inc. Summary Prospectus May 1, 2016 as amended July 29, 2016
Before you invest, you may want to review the Account's prospectus, which contains more information about the Account and its risks. You can find the Account's prospectus and other information about the Account online at www.principalfunds.com/pvcprospectus. You can also get this information at no cost by calling 1 800-222-5852 or by sending an email request to [email protected].
This Summary Prospectus incorporates by reference the Statutory Prospectus dated May 1, 2016 as supplemented on June 17, 2016, June 30, 2016, and July 29, 2016, and the Statement of Additional Information dated May 1, 2016 as supplemented on June 17, 2016 and July 29, 2016 (which may be obtained in the same manner as the Prospectus).
Objective: The Account seeks long-term growth of capital.
Fees and Expenses of the AccountThis table describes the fees and expenses that you may pay if you buy and hold shares of the Account. These fees and expenses do not reflect the fees and expenses of any variable insurance contract that may invest in the Account and would be higher if they did.
Annual Account Operating Expenses(expenses that you pay each year as a percentage of the value of your investment)
Class 1 Class 2Management Fees 0.25% 0.25%Distribution and/or Service (12b-1) Fees N/A 0.25%Other Expenses —% —%Total Annual Account Operating Expenses 0.25% 0.50%
ExampleThis Example is intended to help you compare the cost of investing in the Account with the cost of investing in other mutual funds.
The Example assumes that you invest $10,000 in the Account for the time periods indicated and then redeem all of your shares at the end of those periods. The Example also assumes that your investment has a 5% return each year and that the Account’s operating expenses remain the same. If separate account expenses and contract level expenses were included, expenses would be higher. Although your actual costs may be higher or lower, based on these assumptions your costs would be:
Number of years you own your shares1 3 5 10
LargeCap S&P 500 Index Account - Class 1 $26 $80 $141 $318LargeCap S&P 500 Index Account - Class 2 51 160 280 628
Portfolio TurnoverThe Account pays transaction costs, such as commissions, when it buys and sells securities (or “turns over” its portfolio). A higher portfolio turnover rate may indicate higher transaction costs. These costs, which are not reflected in annual Account operating expenses or in the example, affect the Account’s performance. During the most recent fiscal year, the Account’s portfolio turnover rate was 6.3% of the average value of its portfolio.

2 of 4
Principal Investment StrategiesUnder normal circumstances, the Account invests at least 80% of its net assets, plus any borrowings for investment purposes, in equity securities of companies that compose the S&P 500 Index at the time of each purchase. The Index is designed to represent U.S equities with risk/return characteristics of the large cap universe. As of December 31, 2015, the market capitalization range of the companies comprising the Index was between approximately $1.8 billion and $586.9 billion. The Account employs a passive investment approach designed to attempt to track the performance of the Index. The Account utilizes derivative strategies and exchange-traded funds ("ETFs"). A derivative is a financial arrangement, the value of which is derived from, or based on, a traditional security, asset, or market index. Specifically, the Account invests in index futures and equity ETFs on a daily basis to gain exposure to the Index in an effort to minimize tracking error relative to the benchmark.
Note: “Standard & Poor's 500" and "S&P 500®" are trademarks of The McGraw-Hill Companies, Inc. and have been licensed by Principal. The Account is not sponsored, endorsed, sold, or promoted by Standard & Poor's and Standard & Poor's makes no representation regarding the advisability of investing in the Account.
Principal RisksThe value of your investment in the Account changes with the value of the Account's investments. Many factors affect that value, and it is possible to lose money by investing in the Account. An investment in the Account is not a deposit of a bank and is not insured or guaranteed by the Federal Deposit Insurance Corporation or any other government agency. The principal risks of investing in the Account, in alphabetical order, are:
Derivatives Risk. Derivatives may not move in the direction anticipated by the portfolio manager. Transactions in derivatives may increase volatility, cause the liquidation of portfolio positions when not advantageous to do so and result in disproportionate losses that may be substantially greater than a fund's initial investment.
• Futures. Futures contracts involve specific risks, including: the imperfect correlation between the change in market value of the instruments held by the fund and the price of the futures contract; possible lack of a liquid secondary market for a futures contract and the resulting inability to close a futures contract when desired; counterparty risk; and if the fund has insufficient cash, it may have to sell securities from its portfolio to meet daily variation margin requirements.
Equity Securities Risk. The value of equity securities could decline if the issuer's financial condition declines or in response to overall market and economic conditions. A fund's principal market segment (such as market capitalization or style), may underperform other market segments or the equity markets as a whole.
Exchange-Traded Funds ("ETFs") Risk. An ETF is subject to the risks associated with direct ownership of the securities in which the ETF invests or that comprise the index on which the ETF is based. Fund shareholders indirectly bear their proportionate share of the expenses of the ETFs in which the fund invests.
Index Fund Risk. More likely than not, an index fund will underperform the index due to cashflows and the fees and expenses of the fund. The correlation between fund performance and index performance may also be affected by changes in securities markets, changes in the composition of the index and the timing of purchases and sales of fund shares.
Redemption Risk. A fund that serves as an underlying fund for a fund of funds is subject to certain risks. When a fund of funds reallocates or rebalances its investments, an underlying fund may experience relatively large redemptions or investments. These transactions may cause the underlying fund to sell portfolio securities to meet such redemptions, or to invest cash from such investments, at times it would not otherwise do so, and may as a result increase transaction costs and adversely affect underlying fund performance.
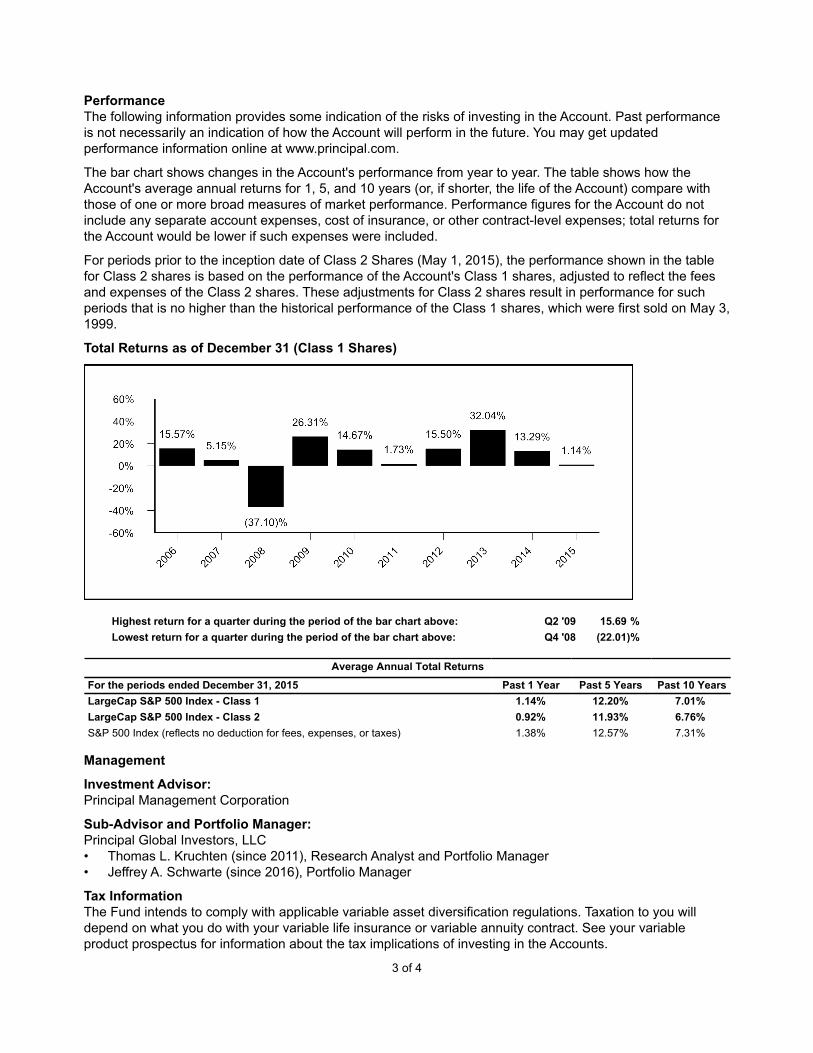
3 of 4
PerformanceThe following information provides some indication of the risks of investing in the Account. Past performance is not necessarily an indication of how the Account will perform in the future. You may get updated performance information online at www.principal.com.
The bar chart shows changes in the Account's performance from year to year. The table shows how the Account's average annual returns for 1, 5, and 10 years (or, if shorter, the life of the Account) compare with those of one or more broad measures of market performance. Performance figures for the Account do not include any separate account expenses, cost of insurance, or other contract-level expenses; total returns for the Account would be lower if such expenses were included.
For periods prior to the inception date of Class 2 Shares (May 1, 2015), the performance shown in the table for Class 2 shares is based on the performance of the Account's Class 1 shares, adjusted to reflect the fees and expenses of the Class 2 shares. These adjustments for Class 2 shares result in performance for such periods that is no higher than the historical performance of the Class 1 shares, which were first sold on May 3, 1999.
Total Returns as of December 31 (Class 1 Shares)
Highest return for a quarter during the period of the bar chart above: Q2 '09 15.69 %Lowest return for a quarter during the period of the bar chart above: Q4 '08 (22.01)%
Average Annual Total Returns
For the periods ended December 31, 2015 Past 1 Year Past 5 Years Past 10 YearsLargeCap S&P 500 Index - Class 1 1.14% 12.20% 7.01%LargeCap S&P 500 Index - Class 2 0.92% 11.93% 6.76%S&P 500 Index (reflects no deduction for fees, expenses, or taxes) 1.38% 12.57% 7.31%
Management
Investment Advisor: Principal Management Corporation
Sub-Advisor and Portfolio Manager: Principal Global Investors, LLC• Thomas L. Kruchten (since 2011), Research Analyst and Portfolio Manager• Jeffrey A. Schwarte (since 2016), Portfolio Manager
Tax InformationThe Fund intends to comply with applicable variable asset diversification regulations. Taxation to you will depend on what you do with your variable life insurance or variable annuity contract. See your variable product prospectus for information about the tax implications of investing in the Accounts.

4 of 4
Payments to Broker-Dealers and Other Financial IntermediariesIf you purchase the Fund through a broker-dealer or other financial intermediary (such as a bank, insurance company, investment adviser, etc.), the Fund and its related companies may pay the intermediary for the sale of Fund shares and related services. These payments may create a conflict of interest by influencing the broker-dealer or other intermediary and your salesperson to recommend the Fund over another investment, to recommend one share class of the Fund over another share class, or to recommend one variable annuity, variable life insurance policy or mutual fund over another. Ask your salesperson or visit your financial intermediary's website for more information.
PVC16A6-01 Accompanies Free, Free 2, FVA, IPVA old, IPVA new, Pivot, Premier,FVLI, PFLX, SVUL, Accum, Accum II, VULI, VULI II, VULI III, EVUL II and BVUL II Prospectuses

Principal Life Insurance Company Variable Life Separate Account
Supplement dated July 22, 2016 to the Statutory Prospectus dated May 1, 2016 for:
Principal Variable Universal Life AccumulatorPrincipal Variable Universal Life Accumulator II
Principal Benefit Variable Universal Life Principal Benefit Variable Universal Life IIPrincipal Executive Variable Universal Life
Principal Executive Variable Universal Life IIPrincipal Flexible Variable Life
Principal Survivorship Flexible Premium Variable Universal LifePrincipal Variable Universal Life Income
Principal Variable Universal Life Income IIPrinFlex Life
This supplement updates information contained in the Statutory Prospectus for the variable life insurance policies referenced above. Please retain this supplement for future reference.
Putnam Investments previously informed Principal Life Insurance Company (“PLIC”) that the Putnam VT Voyager Fund, which is the underlying fund for the Putnam VT Voyager Division (the “Merging Division”) was scheduled to merge into the Putnam VT Growth Opportunities Fund effective July 15, 2016. However, Putnam Investments has notified PLIC that the merger is deferred until further notice. Putnam has not provided any additional details about the new expected date of the merger. However, it is our understanding that the Putnam VT Voyager Fund is still expected to merge into the Putnam VT Growth Opportunities Fund. As previously disclosed, when the merger occurs, we will transfer any remaining values in the Merging Division to the division that invests in the Putnam VT Growth Opportunities Fund.
TABLE OF SEPARATE ACCOUNT DIVISIONS
Until further notice, the row for the Putnam VT Voyager Division will remain in the Table of Separate Account Divisions.
On or about the merger date, the row for the Putnam VT Voyager Division will be deleted and replaced with the following:
Putnam VT Growth Opportunities Division
Invests in: Putnam VT Growth Opportunities Fund - Class IBInvestment Advisor: Putnam Investment Management, LLCInvestment Objective: seeks capital appreciation.
LV859S-01

MAY 1, 2016, AS AMENDED JULY 18, 2016
Before you invest, you may want to review the Fund’s prospectus, which contains more information about the
Fund and its risks. You can find the Fund’s prospectus, statement of additional information and other information
about the Fund online at franklintempleton.com/ftviptfunds. You can also get this information at no cost by calling
1-888-FRANKLIN or by sending an e-mail request to [email protected]. The Fund’s
prospectus and statement of additional information, both dated May 1, 2016, as may be amended from time to
time, are incorporated by reference into this Summary prospectus, which means that they are legally a part of this
Summary prospectus. Shares of the insurance funds of Franklin Templeton Variable Insurance Products Trust are
not offered to the public; they are offered and sold only to: (1) insurance company separate accounts to serve as the
underlying investment vehicles for variable contracts; (2) certain qualified plans; and (3) other mutual funds (fund
of funds). This Summary prospectus is not intended for use by other investors. Please check with your insurance
company for availability. Please read this Summary prospectus together with your variable annuity or variable life
insurance product prospectus.
SUMMARY PROSPECTUSFRANKLIN TEMPLETON VARIABLE INSURANCE PRODUCTS TRUST | CLASS 2
Franklin Small Cap
Value VIP Fund

SUMMARY PROSPECTUS
2 - Franklin Small Cap Value VIP Fund - Class 2
Investment GoalLong-term total return.
Fees and Expenses of the FundThis table describes the fees and expenses that you may pay if you buy and hold shares of the Fund. The table and the example do not include any fees or sales charges imposed by variable insurance contracts, qualified retirement plans or funds of funds. If they were included, your costs would be higher.
Annual Fund Operating Expenses(expenses that you pay each year as a percentage of the value of your investment)
Class 2
Management fees 0.62%
Distribution and service (12b-1) fees 0.25%
Other expenses 0.03%
Acquired fund fees and expenses1 0.01%
Total annual Fund operating expenses 0.91%
Fee waiver and/or expense reimbursement2 -0.01%
Total annual Fund operating expenses after fee waiver and/or expense reimbursement1,2 0.90%
1. Total annual Fund operating expenses differ from the ratio of expenses to average net assets shown in the Financial Highlights, which reflect operating expenses of the Fund and do not include acquired fund fees and expenses.
2. The investment manager has contractually agreed in advance to reduce its fee as a result of the Fund’s investment in a Franklin Templeton money fund (acquired fund) for at least the next 12-month period. Contractual fee waiver and/or expense reimbursement agreements may not be changed or terminated during the time periods set forth above.
ExampleThis Example is intended to help you compare the cost of investing in the Fund with the cost of investing in other mutual funds. The Example assumes that you invest $10,000 in the Fund for the time periods indicated and then redeem all of your shares at the end of the period. The Example also assumes that your investment has a 5% return each year and that the Fund’s operating expenses remain the same. The Example reflects adjustments made to the Fund’s operating expenses due to the fee waivers and/or expense reimbursements by management as described
above for the 1 Year numbers only. Although your actual costs may be higher or lower, based on these assumptions your costs would be:
1 Year 3 Years 5 Years 10 Years
Class 2 $92 $289 $503 $1,119
Portfolio TurnoverThe Fund pays transaction costs, such as commissions, when it buys and sells securities (or “turns over” its portfolio). A higher portfolio turnover rate may indicate higher transaction costs. These costs, which are not reflected in annual Fund operating expenses or in the example, affect the Fund’s performance. During the most recent fiscal year, the Fund’s portfolio turnover rate was 27.05% of the average value of its portfolio.
Principal Investment StrategiesUnder normal market conditions, the Fund invests at least 80% of its net assets in investments of small-capitalization (small-cap) companies. Small-cap companies are companies with market capitalizations (the total market value of a company’s outstanding stock) under $3.5 billion at the time of purchase. Effective September 30, 2016, the definition of small-cap companies will be revised to read as follows: Small-cap companies are companies with market capitalizations (the total market value of a company’s outstanding stock) not exceeding either 1) the highest market capitalization in the Russell 2000 Index or 2) the 12-month average of the highest market capitalization in the Russell 2000 Index, whichever is greater, at the time of purchase. As of May 31, 2016, the highest market capitalization in the Russell 2000 Index was $5.96 billion.
The Fund generally invests in equity securities that the Fund’s investment manager believes are undervalued at the time of purchase and have the potential for capital appreciation. The Fund invests predominantly in common stocks. A stock price is undervalued, or is a “value,” when it trades at less than the price at which the investment manager believes it would trade if the market reflected all factors relating to the company’s worth. Following this strategy, the Fund invests in companies that the investment manager believes have, for example: stock prices that are low relative to current, or historical or future earnings, book value,
SUMMARY PROSPECTUS
3 - Franklin Small Cap Value VIP Fund - Class 2
cash flow or sales; recent sharp price declines but the potential for good long-term earnings prospects; and valuable intangibles not reflected in the stock price. The Fund also may invest in equity real estate investment trusts (REITs).
The types of companies the Fund may invest in include those that may be considered out of favor, such as companies attempting to recover from bankruptcy, business setbacks or adverse events (turnarounds) or cyclical downturns, or that may be considered potential takeover targets.
The Fund may invest up to 25% of its total assets in foreign securities.
Principal RisksYou could lose money by investing in the Fund. Mutual fund shares are not deposits or obligations of, or guaranteed or endorsed by, any bank, and are not insured by the Federal Deposit Insurance Corporation, the Federal Reserve Board, or any other agency of the U.S. government.
Market The market values of securities or other investments owned by the Fund will go up or down, sometimes rapidly or unpredictably. The market value of a security or other investment may be reduced by market activity or other results of supply and demand unrelated to the issuer. This is a basic risk associated with all securities. When there are more sellers than buyers, prices tend to fall. Likewise, when there are more buyers than sellers, prices tend to rise.
Stock prices tend to go up and down more dramatically than those of debt securities. A slower-growth or recessionary economic environment could have an adverse effect on the prices of the various stocks held by the Fund.
Value Style Investing A value stock may not increase in price as anticipated by the investment manager if other investors fail to recognize the company’s value and bid up the price, the markets favor faster-growing companies, or the factors that the investment manager believes will increase the price of the security do not occur.
Cyclical stocks in which the Fund may invest tend to lose value more quickly in periods of anticipated
economic downturns than non-cyclical stocks. Companies that may be considered out of favor, particularly companies emerging from bankruptcy, may tend to lose value more quickly in periods of anticipated economic downturns, may have difficulty retaining customers and suppliers and, during economic downturns, may have difficulty paying their debt obligations or finding additional financing.
Smaller Companies Securities issued by smaller companies may be more volatile in price than those of larger companies, involve substantial risks and should be considered speculative. Such risks may include greater sensitivity to economic conditions, less certain growth prospects, lack of depth of management and funds for growth and development and limited or less developed product lines and markets. In addition, smaller companies may be particularly affected by interest rate increases, as they may find it more difficult to borrow money to continue or expand operations, or may have difficulty in repaying any loans.
Real Estate Investment Trusts (REITs) A REIT’s performance depends on the types, values and locations of the properties it owns and how well those properties are managed. A decline in rental income may occur because of extended vacancies, increased competition from other properties, tenants’ failure to pay rent or poor management. Because a REIT may be invested in a limited number of projects or in a particular market segment, it may be more susceptible to adverse developments affecting a single project or market segment than more broadly diversified investments. Loss of status as a qualified REIT under the U.S. federal tax laws could adversely affect the value of a particular REIT or the market for REITs as a whole.
Focus To the extent that the Fund focuses on particular countries, regions, industries, sectors or types of investment from time to time, the Fund may be subject to greater risks of adverse developments in such areas of focus than a fund that invests in a wider variety of countries, regions, industries, sectors or investments.
Foreign Securities Investing in foreign securities typically involves more risks than investing in U.S. securities, including risks related to currency exchange

SUMMARY PROSPECTUS
4 - Franklin Small Cap Value VIP Fund - Class 2
rates and policies, country or government specific issues, less favorable trading practices or regulation and greater price volatility. Certain of these risks also may apply to securities of U.S. companies with significant foreign operations.
Management The Fund is subject to management risk because it is an actively managed investment portfolio. The Fund’s investment manager applies investment techniques and risk analyses in making investment decisions for the Fund, but there can be no guarantee that these decisions will produce the desired results.

SUMMARY PROSPECTUS
5 - Franklin Small Cap Value VIP Fund - Class 2
PerformanceThe following bar chart and table provide some indication of the risks of investing in the Fund. The bar chart shows changes in the Fund’s performance from year to year for Class 2 shares. The table shows how the Fund’s average annual returns for 1 year, 5 years, 10 years or since inception, as applicable, compare with those of a broad measure of market performance. The Fund’s past performance is not necessarily an indication of how the Fund will perform in the future.
Performance reflects all Fund expenses but does not include any fees or sales charges imposed by variable insurance contracts, qualified plans or funds of funds. If they had been included, the returns shown below would be lower. Investors should consult the variable insurance contract prospectus, or the disclosure documents for qualified plans or funds of funds for more information.
Annual Total Returns
Best Quarter: Q2’09 24.33%
Worst Quarter: Q4’08 -27.34%
As of March 31, 2016, the Fund’s year-to-date return was 5.15%.
-7.39%0.57%
36.24%
18.39%
-3.76%
28.22%29.16%
-33.02%-2.38%
16.98%
2015201420132012201120102009200820072006Year
Average Annual Total ReturnsFor the periods ended December 31, 2015
1 Year 5 Years 10 Years
Franklin Small Cap Value VIP Fund - Class 2 -7.39% 7.65% 6.24%
Russell 2000 Value Index (index reflects no deduction for fees, expenses or taxes)1 -7.47% 7.67% 5.58%
Russell 2500 Value Index (index reflects no deduction for fees, expenses or taxes)1 -5.49% 9.23% 6.51%
1. Performance figures as of December 31, 2015. Effective September 30, 2016 the Russell 2000 Value Index is replacing the Russell 2500 Value Index as the Fund’s benchmark. The investment manager believes the composition of the Russell 2000 Value Index more accurately reflects the Fund’s holdings.
No one index is representative of the Fund’s portfolio.

SUMMARY PROSPECTUS
6 - Franklin Small Cap Value VIP Fund - Class 2
Investment ManagerFranklin Advisory Services, LLC (Advisory Services)
Portfolio ManagersSteven B. RaineriVice President of Advisory Services and portfolio manager of the Fund since 2012.Christopher Meeker, CFAPortfolio Manager of Advisory Services and portfolio manager of the Fund since 2015.Donald G. Taylor, CPAPresident and Chief Investment Officer of Advisory Services and portfolio manager of the Fund since inception (1998).
Purchase and Sale of Fund SharesShares of the Fund are sold to insurance companies’ separate accounts (Insurers) to fund variable annuity or variable life insurance contracts and to qualified plans. Insurance companies offer variable annuity and variable life insurance products through separate accounts. Shares of the Fund may also be sold to other mutual funds, either as underlying funds in a fund of funds or in other structures. In addition, Fund shares are held by a limited number of Insurers, qualified retirement plans and, when applicable, funds of funds. Substantial withdrawals by one or more Insurers, qualified retirement plans or funds of funds could reduce Fund assets, causing total Fund expenses to become higher than the numbers shown in the fees and expenses table above.
The terms of the offering of interests in separate accounts are included in the variable annuity or variable life insurance product prospectus. The terms of offerings of funds of funds are included in those funds’ prospectuses. The terms of offering of qualified
retirement plans are described in their disclosure documents. Investors should consult the variable contract prospectus, fund of fund prospectus, or plan disclosure documents for more information on fees and expenses imposed by variable insurance contracts, funds of funds or qualified retirement plans, respectively.
TaxesBecause shares of the Fund are generally purchased through variable annuity contracts or variable life insurance contracts, the Fund’s distributions (which the Fund expects, based on its investment goals and strategies to consist of ordinary income, capital gains or some combination of both) will be exempt from current taxation if left to accumulate within the variable contract. You should refer to your contract prospectus for more information on these tax consequences.
Payments to Sponsoring Insurance Companies and Other Financial IntermediariesThe Fund or its distributor (and related companies) may pay broker/dealers or other financial intermediaries (such as banks and insurance companies, or their related companies) for the sale and retention of variable contracts which offer Fund shares and/or for other services. These payments may create a conflict of interest for an intermediary or be a factor in the insurance company’s decision to include the Fund as an investment option in its variable contract. For more information, ask your financial advisor, visit your intermediary’s website, or consult the Contract prospectus or this Fund prospectus.

[THIS PAGE INTENTIONALLY LEFT BLANK]

Investment Company Act file #811-05583
© 2016 Franklin Templeton Investments. All rights reserved. 776 PSUM 07/16
LV607FTS-10 Accompanies the FVA, IPVA old, IPVA new and all VL Prospectuses

VISCE STAT & SUM SUP-1
VISCE STAT & SUM SUP-1
Summary Prospectus and Statutory Prospectus Supplement dated July 18, 2016
Important Notice Regarding Future Changes to the Portfolio Management Team of Invesco V. I. Small Cap Equity Fund
Effective June 30, 2017, Juan Hartsfield will become Lead Portfolio Manager for Invesco V. I. Small Cap Equity Fund (the “Fund”). Davis Paddock will continue to assist in the portfolio management of the Fund. Juliet Ellis, the current Lead PortfolioManager of the Fund, will transition out of her role as portfolio manager but will remain Chief Investment Officer (CIO) overseeingInvesco’s U.S. Growth Equity Group, including the Fund’s portfolio management team.
Current Team New Team Effective June 30, 2017 Juliet Ellis (lead) Juan Hartsfield (lead) Juan Hartsfield Davis Paddock Davis Paddock
Ms. Ellis will remain fully engaged in the investment decision making process of the Fund’s portfolio management team until thetransition in June 2017. Transitioning into a CIO-only role will allow Ms. Ellis to spend all of her time maintaining the U.S. Growth Equity Group’s strong investment culture, talent management and risk oversight, as well as expand her one-on-one mentoring role with each portfolio manager and analyst in the group.
Mr. Hartsfield and Ms. Ellis have worked together for more than 16 years using the small cap investment process that Ms. Ellis developed in 1993. The Fund’s portfolio management team has been thoughtfully built over the years and well trained in the small cap investment process. Mr. Hartsfield has served as a Portfolio Manager of the Fund since 2006. Mr. Paddock has served as a Portfolio Manager of the Fund since 2016 and as an Analyst on the small cap team since 2005.
The investment objective, philosophy and processes for the Fund will not change.
LV601INS-07 Accompanies the FVA, IPVA old, IPVA new, FVLI, PFLX, SVUL, Accum, EVUL, BVUL, EVUL II and BVUL II Prospectuses
PIMCO Long-Term U.S. GovernmentPortfolio
PVIT | SUMMARY PROSPECTUS
SUMMARY PROSPECTUSApril 29, 2016 (as supplemented July 12, 2016)§
Share Class: Administrative Summary Prospectus
Before you invest, you may want to review the Portfolio’s prospectus, which, assupplemented, contains more information about the Portfolio and its risks. You can find thePortfolio’s prospectus and other information about the Portfolio online at http://pvit.pimco-funds.com/FundReports.aspx. You can also get this information at no cost by calling1.800.927.4648 or by sending an email request to [email protected]. ThePortfolio’s prospectus and Statement of Additional Information, both dated April 29, 2016,as supplemented, along with the financial statements included in the Portfolio’s most recentannual report to shareholders dated December 31, 2015, are incorporated by reference intothis Summary Prospectus.
Investment ObjectiveThe Portfolio seeks maximum total return, consistent with preservation ofcapital and prudent investment management.
Fees and Expenses of the PortfolioThis table describes the fees and expenses that you may pay if you buy andhold Administrative Class shares of the Portfolio. Overall fees and expensesof investing in the Portfolio are higher than shown because the table doesnot reflect variable contract fees and expenses.
Shareholder Fees (fees paid directly from your investment): None
Annual Portfolio Operating Expenses (expenses that you payeach year as a percentage of the value of your investment):
AdministrativeClass
Management Fees 0.475%
Distribution and/or Service (12b-1) Fees 0.15%
Other Expenses(1) 0.04%
Total Annual Portfolio Operating Expenses(2) 0.665%
1 “Other Expenses” reflect interest expense and is based on the amount incurred duringthe Portfolio’s most recent fiscal year as a result of entering into certain investments,such as reverse repurchase agreements. Interest expense is required to be treated as aPortfolio expense for accounting purposes and is not payable to PIMCO. The amount ofinterest expense (if any) will vary based on the Portfolio’s use of such investments as aninvestment strategy.
2 Total Annual Portfolio Operating Expenses excluding interest expense is 0.625% forAdministrative Class shares.
Example. The Example is intended to help you compare the cost ofinvesting in Administrative Class shares of the Portfolio with the costs ofinvesting in other mutual funds. The Example assumes that you invest$10,000 for the time periods indicated, and then redeem all your shares atthe end of those periods. The Example also assumes that your investmenthas a 5% return each year and that the Portfolio’s operating expensesremain the same. Although your actual costs may be higher or lower, theExample shows what your costs would be based on these assumptions. TheExample does not reflect fees and expenses of any variable annuity contractor variable life insurance policy, and would be higher if it did.
1 Year 3 Years 5 Years 10 Years
Administrative Class $68 $213 $370 $828
Portfolio TurnoverThe Portfolio pays transaction costs when it buys and sells securities (or“turns over” its portfolio). A higher portfolio turnover rate may indicatehigher transaction costs. These costs, which are not reflected in the AnnualPortfolio Operating Expenses or in the Example table, affect the Portfolio’sperformance. During the most recent fiscal year, the Portfolio’s portfolioturnover rate was 34% of the average value of its portfolio.
Principal Investment StrategiesThe Portfolio seeks to achieve its investment objective by investing undernormal circumstances at least 80% of its assets in a diversified portfolio offixed income securities that are issued or guaranteed by the U.S.Government, its agencies or government-sponsored enterprises (“U.S.Government Securities”), which may be represented by forwards orderivatives such as options, futures contracts or swap agreements. Assetsnot invested in U.S. Government Securities may be invested in other typesof Fixed Income Instruments. “Fixed Income Instruments” include bonds,debt securities and other similar instruments issued by various U.S. andnon-U.S. public- or private-sector entities. While Pacific InvestmentManagement Company LLC (“PIMCO”) may invest in derivatives at anytime it deems appropriate, it will generally do so when it believes that U.S.Government Securities are overvalued relative to derivative instruments. ThisPortfolio will normally have a minimum average portfolio duration of eightyears. Duration is a measure used to determine the sensitivity of a security’sprice to changes in interest rates. The longer a security’s duration, the moresensitive it will be to changes in interest rates. In addition, the dollar-weighted average portfolio maturity of the Portfolio, under normalcircumstances, is expected to be more than ten years.
The Portfolio’s investments in Fixed Income Instruments are limited to thoseof investment grade U.S. dollar-denominated securities of U.S. issuers thatare rated at least A by Moody’s Investors Service, Inc. (“Moody’s”), orequivalently rated by Standard & Poor’s Ratings Services (“S&P”), or Fitch,Inc. (“Fitch”), or, if unrated, determined by PIMCO to be of comparablequality. In addition, the Portfolio may only invest up to 10% of its totalassets in securities rated A by Moody’s, or equivalently rated by S&P orFitch, or, if unrated, determined by PIMCO to be of comparable quality andmay only invest up to 25% of its total assets in securities rated Aa byMoody’s, or equivalently rated by S&P or Fitch or, if unrated, determined byPIMCO to be of comparable quality.
The Portfolio may invest, without limitation, in derivative instruments, suchas options, futures contracts or swap agreements, or in mortgage- or asset-backed securities, subject to applicable law and any other restrictionsdescribed in the Portfolio’s prospectus or Statement of AdditionalInformation. The Portfolio may purchase or sell securities on a when-issued,delayed delivery or forward commitment basis and may engage in shortsales. The Portfolio may, without limitation, seek to obtain market exposureto the securities in which it primarily invests by entering into a series ofpurchase and sale contracts or by using other investment techniques (suchas buy backs or dollar rolls). The “total return” sought by the Portfolio
PIMCO Long-Term U.S. Government Portfolio
. SUMMARY PROSPECTUS | PVIT2
consists of income earned on the Portfolio’s investments, plus capitalappreciation, if any, which generally arises from decreases in interest ratesor improving credit fundamentals for a particular sector or security. ThePortfolio may also invest up to 10% of its total assets in preferred stocks.
Principal RisksIt is possible to lose money on an investment in the Portfolio. The principalrisks of investing in the Portfolio, which could adversely affect its net assetvalue, yield and total return, are:
Interest Rate Risk: the risk that fixed income securities will decline invalue because of an increase in interest rates; a portfolio with a longeraverage portfolio duration will be more sensitive to changes in interest ratesthan a portfolio with a shorter average portfolio duration
Call Risk: the risk that an issuer may exercise its right to redeem a fixedincome security earlier than expected (a call). Issuers may call outstandingsecurities prior to their maturity for a number of reasons (e.g., declininginterest rates, changes in credit spreads and improvements in the issuer’scredit quality). If an issuer calls a security that the Portfolio has invested in,the Portfolio may not recoup the full amount of its initial investment andmay be forced to reinvest in lower-yielding securities, securities with greatercredit risks or securities with other, less favorable features
Credit Risk: the risk that the Portfolio could lose money if the issuer orguarantor of a fixed income security, or the counterparty to a derivativecontract, is unable or unwilling to meet its financial obligations
Market Risk: the risk that the value of securities owned by the Portfoliomay go up or down, sometimes rapidly or unpredictably, due to factorsaffecting securities markets generally or particular industries
Issuer Risk: the risk that the value of a security may decline for a reasondirectly related to the issuer, such as management performance, financialleverage and reduced demand for the issuer’s goods or services
Derivatives Risk: the risk of investing in derivative instruments (such asfutures, swaps and structured securities), including liquidity, interest rate,market, credit and management risks, mispricing or valuation complexity.Changes in the value of the derivative may not correlate perfectly with, andmay be more sensitive to market events than, the underlying asset, rate orindex, and the Portfolio could lose more than the initial amount invested.The Portfolio’s use of derivatives may result in losses to the Portfolio, areduction in the Portfolio’s returns and/or increased volatility. Over-the-counter (“OTC”) derivatives are also subject to the risk that a counterpartyto the transaction will not fulfill its contractual obligations to the otherparty, as many of the protections afforded to centrally-cleared derivativetransactions might not be available for OTC derivatives. For derivativestraded on an exchange or through a central counterparty, credit risk resideswith the creditworthiness of the Portfolio’s clearing broker, or theclearinghouse itself, rather than to a counterparty in an OTC derivativetransaction. Changes in regulation relating to a mutual fund’s use ofderivatives and related instruments could potentially limit or impact thePortfolio’s ability to invest in derivatives, limit the Portfolio’s ability to employcertain strategies that use derivatives and/or adversely affect the value orperformance of derivatives and the Portfolio
Equity Risk: the risk that the value of equity securities, such as commonstocks and preferred stocks, may decline due to general market conditionswhich are not specifically related to a particular company or to factorsaffecting a particular industry or industries. Equity securities generally havegreater price volatility than fixed income securities
Mortgage-Related and Other Asset-Backed Securities Risk: therisks of investing in mortgage-related and other asset-backed securities,including interest rate risk, extension risk, prepayment risk, and credit risk
Leveraging Risk: the risk that certain transactions of the Portfolio, such asreverse repurchase agreements, loans of portfolio securities, and the use ofwhen-issued, delayed delivery or forward commitment transactions, orderivative instruments, may give rise to leverage, magnifying gains andlosses and causing the Portfolio to be more volatile than if it had not beenleveraged. This means that leverage entails a heightened risk of loss
Management Risk: the risk that the investment techniques and riskanalyses applied by PIMCO will not produce the desired results and thatlegislative, regulatory, or tax restrictions, policies or developments mayaffect the investment techniques available to PIMCO and the individualportfolio manager in connection with managing the Portfolio. There is noguarantee that the investment objective of the Portfolio will be achieved
Short Sale Risk: the risk of entering into short sales, including thepotential loss of more money than the actual cost of the investment, andthe risk that the third party to the short sale may fail to honor its contractterms, causing a loss to the Portfolio
Please see “Description of Principal Risks” in the Portfolio’s prospectus for amore detailed description of the risks of investing in the Portfolio. Aninvestment in the Portfolio is not a deposit of a bank and is not insured orguaranteed by the Federal Deposit Insurance Corporation or any othergovernment agency.
Performance InformationThe performance information below shows summary performanceinformation for the Portfolio in a bar chart and an Average Annual TotalReturns table. The information provides some indication of the risks ofinvesting in the Portfolio by showing changes in its performance from yearto year and by showing how the Portfolio’s average annual returns comparewith the returns of a broad-based securities market index. The Portfolio’sperformance information reflects applicable fee waivers and/or expenselimitations in effect during the periods presented. Absent such fee waiversand/or expense limitations, if any, performance would have been lower.Performance shown does not reflect any charges or expenses imposed byan insurance company and if it did, performance shown would be lower.The bar chart and the table show performance of the Portfolio’sAdministrative Class shares. The Portfolio’s past performance is notnecessarily an indication of how the Portfolio will perform in the future.
The Barclays Long-Term Treasury Index consists of U.S. Treasury issues withmaturities of 10 or more years.
Performance for the Portfolio is updated daily and monthly and may beobtained as follows: daily updates on the net asset value may be obtainedby calling 1-888-87-PIMCO and monthly performance may be obtained athttp://pvit.pimco-funds.com.

Summary Prospectus
April 29, 2016 (as supplemented July 12, 2016) | SUMMARY PROSPECTUS .3
Calendar Year Total Returns — Administrative Class*
'06 '07 '08 '09 '10 '11 '12 '13 '14 '15-20
-10
0
10
20
30
40
1.15%
9.75%
17.29%
-4.39%
11.61%
27.83%
4.43%
-12.95%
24.01%
-1.39%
(%)
Years
*For the periods shown in the bar chart, the highest quarterly return was 22.46% in the Q32011, and the lowest quarterly return was -8.36% in the Q2 2015.
Average Annual Total Returns (for periods ended 12/31/15)1 Year 5 Years 10 Years
Administrative Class Return -1.39% 7.28% 7.04%
Barclays Long-Term Treasury Index (reflects nodeductions for fees, expenses or taxes)
-1.21% 7.74% 6.73%
Investment Adviser/Portfolio ManagerPIMCO serves as theinvestment adviser forthe Portfolio. ThePortfolio’s portfolio isjointly managed byStephen Rodosky,
Michael Cudzil and Josh Thimons. Messrs. Rodosky and Thimons areManaging Directors of PIMCO and Mr. Cudzil is an Executive Vice Presidentof PIMCO. Mr. Rodosky has managed the Portfolio since July 2007. Messrs.Cudzil and Thimons have managed the Portfolio since February 2016.
Purchase and Sale of Portfolio SharesShares of the Portfolio currently are sold to segregated asset accounts(“Separate Accounts”) of insurance companies that fund variable annuitycontracts and variable life insurance policies (“Variable Contracts”).Investors do not deal directly with the Portfolio to purchase and redeemshares. Please refer to the prospectus for the Separate Account forinformation on the allocation of premiums and on transfers of accumulatedvalue among sub-accounts of the Separate Account.
Payments to Insurance Companies and OtherFinancial IntermediariesThe Portfolio and/or its related companies (including PIMCO) may pay theinsurance company and other intermediaries for the sale of the Portfolioand/or other services. These payments may create a conflict of interest byinfluencing the insurance company or intermediary and your salesperson torecommend a Variable Contract and the Portfolio over another investment.Ask your insurance company or salesperson or visit your financialintermediary’s Web site for more information.
Tax InformationThe shareholders of the Portfolio are the insurance companies offering thevariable products. Please refer to the prospectus for the Separate Accountand the Variable Contract for information regarding the federal income taxtreatment of distributions to the Separate Account.

PVIT0341S_071216
LV612PCS-11 Accompanies EVUL, BVUL, EVUL II and BVUL II Prospectuses

Neuberger Berman Alternative and Multi-Asset Class Funds® (“Alternative Funds”) Neuberger Berman Advisers Management Trust® (“AMT Funds”) Neuberger Berman Equity Funds® (“Equity Funds”) Neuberger Berman Income Funds® (“Income Funds”) Supplement to the Summary Prospectus(es), Prospectus(es) and Statement of Additional Information of each fund listed in Schedule A
The following change applies to the Summary Prospectus(es), Prospectus(es) and Statement of Additional Information for each series of the Alternative Funds, AMT Funds, Equity Funds, and Income Funds (each a “Fund”) listed in Schedule A:
On or about July 1, 2016, it is anticipated that Neuberger Berman Management LLC (“NBM”) will be reorganized into Neuberger Berman LLC (“NB LLC”) (the “Reorganization”). Upon the completion of the Reorganization, NB LLC will assume all rights and obligations pertaining to all services NBM provides to any Fund under any distribution agreement or distribution and services agreement (the “Agreements”) or plan adopted pursuant to Rule 12b-1 under the Investment Company Act of 1940, as amended, (the “Plans”). Accordingly, after the Reorganization, NB LLC will become each Fund’s distributor and the services previously provided by NBM under the Agreements and Plans will be provided by NB LLC. Consequently, upon completion of the Reorganization, each reference to NBM in each Fund’s Summary Prospectus(es), Prospectus(es), and Statement of Additional Information is replaced with NB LLC. Following the Reorganization, the employees of NBM who currently provide services to each Fund under the Agreements and Plans will continue to provide the same services, except that they will provide those services in their capacities as employees of NB LLC. Further, the Reorganization will not result in any change in the nature or level of services provided to each Fund, or the fees, if any, each Fund pays under the Agreements or the Plans. The following is added to the “Portfolio Holdings Policy” section in each Fund’s Prospectus: No earlier than five business days after month-end, a Fund may publicly disclose via various shareholder and public communications, such as portfolio manager commentaries, fact sheets or other marketing materials, which will be publicly available at www.nb.com, certain portfolio characteristics for the month or as of month-end, including but not limited to: up to the top 10 holdings of the Fund (if the Fund engages in short selling, it may also disclose up to the top 10 short positions); up to the top 10 holdings that contributed to and/or detracted from performance or were the best and/or worst performers; or changes to portfolio composition (e.g., buys and sells). This information will remain available at this website until information for the subsequent month has been posted.
R01
21 0
6/16

The “Portfolio Holdings Disclosure - Portfolio Holdings Disclosure Policy” section and the “Portfolio Holdings Disclosure - Portfolio Holdings Disclosure Procedures” section in each Fund’s Statement of Additional Information is deleted and replaced with the following: Portfolio Holdings Disclosure Policy
The Funds prohibit the disclosure of information about their portfolio holdings, before such information is publicly disclosed, to any outside parties, including individual investors, institutional investors, intermediaries, third party service providers to NBIA or the Funds, rating and ranking organizations, and affiliated persons of the Funds or NBIA (the “Potential Recipients”) unless such disclosure is consistent with the Funds’ legitimate business purposes and is in the best interests of their shareholders (the “Best Interests Standard”).
NBIA and the Funds have determined that the only categories of Potential Recipients that meet the Best Interests Standard are certain mutual fund rating and ranking organizations and third party service providers to NBIA or the Funds with a specific business reason to know the portfolio holdings of the Funds (e.g., custodians, prime brokers, etc.) (the “Allowable Recipients”). As such, certain procedures must be adhered to before the Allowable Recipients may receive the portfolio holdings prior to their being made public. Allowable Recipients that get approved for receipt of the portfolio holdings are known as “Approved Recipients.” NBIA may expand the categories of Allowable Recipients only if it is determined that the Best Interests Standard has been met and only with the written concurrence of NBIA’s legal and compliance department. These procedures are designed to address conflicts of interest between the shareholders, on the one hand, and NBIA or any affiliated person of either NBIA or the Funds on the other, by creating a review and approval process of Potential Recipients of portfolio holdings consistent with the Best Interests Standard.
Selective Disclosure Procedures
Disclosure of portfolio holdings may be requested by completing and submitting a holdings disclosure form to NBIA’s legal and compliance department or to the Funds’ Chief Compliance Officer for review, approval and processing.
Neither the Funds, NBIA, nor any affiliate of either may receive any compensation or consideration for the disclosure of portfolio holdings. Each Allowable Recipient must be subject to a duty of confidentiality or sign a non-disclosure agreement, including an undertaking not to trade on the information, before they may become an Approved Recipient. Allowable Recipients are (1) required to keep all portfolio holdings information confidential and (2) prohibited from trading based on such information. The Funds’ Chief Compliance Officer shall report any material issues that may arise under these policies to the Board of Trustees.
Pursuant to a Code of Ethics adopted by the Funds and NBIA (“NB Code”), employees are prohibited from revealing information relating to current or anticipated investment intentions, portfolio holdings, portfolio transactions or activities of the Funds except to persons whose responsibilities require knowledge of the information. The NB Code also prohibits any individual associated with the Funds or NBIA, from engaging directly or indirectly, in any transaction in securities held or to be acquired by the Fund while in possession of material nonpublic information regarding such securities or their issuer.

The following amends and supplements the “Additional Information about Principal Investment Risks - Recent Market Conditions” section in each Fund’s Prospectus and supersedes any information to the contrary: The precise details and the resulting impact of the United Kingdom’s vote to leave the European Union (the “EU”), commonly referred to as “Brexit,” are impossible to know for sure at this point. The effect on the United Kingdom’s economy will likely depend on the nature of trade relations with the EU following its exit, a matter to be negotiated. The decision may cause increased volatility and have a significant adverse impact on world financial markets, other international trade agreements, and the United Kingdom and European economies, as well as the broader global economy for some time. The date of this supplement is June 30, 2016.
Please retain this supplement for future reference.
Neuberger Berman Investment Advisers LLC 605 Third Avenue 2nd Floor New York, NY 10158-0180
Shareholder Services 800.877.9700 Institutional Services 800.366.6264
www.nb.com

LV627NBS-01 Accompanies the IPVA old, IPVA new, Pivot, EVUL, BVUL, EVUL II, BVUL II, VULI II and VULI III Prospectuses

Janus Aspen SeriesEnterprise Portfolio
Supplement dated June 30, 2016to Currently Effective Prospectuses
Effective July 1, 2016, the following replaces the corresponding information for Enterprise Portfolio (the“Portfolio”) as noted below.
1. The following replaces in its entirety the corresponding information found under “Management” in thePortfolio Summary section of Enterprise Portfolio’s Prospectuses:
Portfolio Managers: Brian Demain, CFA, is Executive Vice President and Co-Portfolio Manager ofthe Portfolio, which he has managed or co-managed since November 2007. Cody Wheaton, CFA, isExecutive Vice President and Co-Portfolio Manager of the Portfolio, which he has co-managed sinceJuly 2016.
2. The following replaces in its entirety the corresponding information in the “Investment Personnel” sectionof the Prospectuses related to the portfolio management of the Portfolio:
Enterprise PortfolioCo-Portfolio Managers Brian Demain and Cody Wheaton are responsible for the day-to-daymanagement of the Portfolio. Mr. Demain, as lead Portfolio Manager, has the authority to exercisefinal decision-making on the overall portfolio.
Brian Demain, CFA, is Executive Vice President and Co-Portfolio Manager of Enterprise Portfolio,which he has managed or co-managed since November 2007. Mr. Demain is also Portfolio Manager ofother Janus accounts. He joined Janus Capital in 1999 as a securities analyst. Mr. Demain holds aBachelor’s degree (summa cum laude) in Economics from Princeton University, where he was arecipient of the Daniel L. Rubinfeld ’67 Prize in Empirical Economics for his senior thesis.Mr. Demain holds the Chartered Financial Analyst designation.
Cody Wheaton, CFA, is Executive Vice President and Co-Portfolio Manager of Enterprise Portfolio,which he has co-managed since July 2016. Mr. Wheaton is also Portfolio Manager of other Janusaccounts and performs duties as a research analyst. He joined Janus Capital in 2001 as a researchanalyst. Mr. Wheaton holds Bachelor of Arts degrees in Economics and Government from DartmouthCollege. Mr. Wheaton holds the Chartered Financial Analyst designation.
Please retain this Supplement with your records.
109-31-69596 06-16109-31-69597 06-16
LV599JAS-09 Accompanies FVA, FVLI, PFLX, SVUL, Accum, EVUL, BVUL, EVUL II and BVUL II Prospectuses

1 of 5
Strategic Asset Management ("SAM") Balanced Portfolio - Class 1 and Class 2 SharesPrincipal Variable Contracts Funds, Inc. Summary Prospectus May 1, 2016 as amended June 30, 2016
Before you invest, you may want to review the Account's prospectus, which contains more information about the Account and its risks. You can find the Account's prospectus and other information about the Account online at www.principalfunds.com/pvcprospectus. You can also get this information at no cost by calling 1 800-222-5852 or by sending an email request to [email protected].
This Summary Prospectus incorporates by reference the Statutory Prospectus dated May 1, 2016 as supplemented on June 17, 2016 and June 30, 2016, and the Statement of Additional Information dated May 1, 2016 as supplemented on June 17, 2016 (which may be obtained in the same manner as the Prospectus).
Objective: The Portfolio seeks to provide as high a level of total return (consisting of reinvested income and capital appreciation) as is consistent with reasonable risk.
Fees and Expenses of the AccountThis table describes the fees and expenses that you may pay if you buy and hold shares of the Account. These fees and expenses do not reflect the fees and expenses of any variable insurance contract that may invest in the Account and would be higher if they did.
Annual Account Operating Expenses(expenses that you pay each year as a percentage of the value of your investment)
Class 1 Class 2Management Fees 0.23% 0.23%Distribution and/or Service (12b-1) Fees N/A 0.25%Other Expenses —% —%Acquired Fund Fees and Expenses 0.70% 0.70%Total Annual Account Operating Expenses 0.93% 1.18%
ExampleThis Example is intended to help you compare the cost of investing in the Account with the cost of investing in other mutual funds.
The Example assumes that you invest $10,000 in the Account for the time periods indicated and then redeem all of your shares at the end of those periods. The Example also assumes that your investment has a 5% return each year and that the Account’s operating expenses remain the same. If separate account expenses and contract level expenses were included, expenses would be higher. Although your actual costs may be higher or lower, based on these assumptions your costs would be:
Number of years you own your shares1 3 5 10
SAM Balanced Portfolio - Class 1 $95 $296 $515 $1,143SAM Balanced Portfolio - Class 2 120 375 649 1,432

2 of 5
Portfolio TurnoverAs a fund of funds, the Account does not pay transaction costs, such as commissions, when it buys and sells shares of underlying funds (or “turns over” its portfolio); however, the Account does pay such transaction costs when it buys and sells other investments. Also, an underlying fund pays transaction costs when it buys and sells portfolio securities, and a higher portfolio turnover for the underlying fund may indicate higher transaction costs. These costs, which are not reflected in annual account operating expenses or in the examples, affect the performance of the underlying fund and the Account. During its most recent fiscal year, the Account's portfolio turnover rate was 26.1% of the average value of its portfolio.
Principal Investment StrategiesThe SAM Portfolios operate as funds of funds and invest principally in Principal Funds, Inc. and Class 1 shares of Principal Variable Contracts Funds, Inc. equity funds, fixed-income funds and specialty funds (“Underlying Funds”); the Sub-Advisor generally categorizes the Underlying Fund based on the investment profile of the Underlying Fund. If an Underlying Fund offers multiple classes of shares, the SAM Portfolios will purchase shares of the class with the lowest expense ratio at the time of purchase. Each SAM Portfolio typically allocates its assets among Underlying Funds, and within predetermined percentage ranges, as determined by the Sub-Advisor in accordance with its outlook for the economy, the financial markets and the relative market valuations of the Underlying Funds.
The Portfolio:• Generally invests between 20% and 60% of its assets in fixed-income funds, and less than 40% in any
one fixed-income fund (fixed-income funds that generally invest in fixed income instruments such as real estate securities, mortgage-backed securities (securitized products), government and government-sponsored securities, and corporate bonds)
• Generally invests between 40% and 80% of its assets in equity funds that invest in small, medium, and large market capitalization companies, and less than 30% in any one equity fund (equity funds that generally invest in domestic and foreign equity securities) and
• Generally invests less than 20% of its assets in specialty funds, and less than 20% in any one specialty fund (specialty funds that generally offer unique combinations of traditional equity securities and fixed-income securities or that use alternative investment strategies that aim to offer diversification beyond traditional equity and fixed-income securities and include investments in such assets as infrastructure, commodities, currencies, and public timber companies)
The Portfolio may temporarily exceed the applicable percentage ranges for short periods, and the Sub-Advisor may alter the percentage ranges when it deems appropriate.
Principal RisksThe broad diversification of the Portfolio is designed to cushion severe losses in any one investment sector and moderate overall price volatility. However, the Portfolio is subject to the particular risks of the Underlying Funds in which it invests, and its share prices and performance will fluctuate with the shares prices and performance of the Underlying Funds. The Portfolio operates as a fund of funds and thus bears both its own expenses and, indirectly, its proportionate share of the expenses of the Underlying Funds in which it invests. An investment in the Portfolio is not a deposit of a bank and is not insured or guaranteed by the Federal Deposit Insurance Corporation or any other government agency. If you sell your shares when their value is less than the price you paid, you will lose money.
The principal risks of investing in the Portfolio that are inherent in the fund of funds, in alphabetical order, are:
Asset Allocation Risk. A fund's selection and weighting of asset classes may cause it to underperform other funds with a similar investment objective.
Conflict of Interest Risk. The Advisor and its affiliates earn different fees from different underlying funds and may have an incentive to allocate more fund-of-fund assets to underlying funds from which they receive higher fees.
Fund of Funds Risk. The performance and risks of a fund of funds directly correspond to the performance and risks of the underlying funds in which the fund invests. Fund shareholders bear indirectly their proportionate share of the expenses of other investment companies in which the fund invests.

3 of 5
The principal risks of investing in the Portfolio that are inherent in the Underlying Funds, in alphabetical order, are:
Equity Securities Risk. The value of equity securities could decline if the issuer's financial condition declines or in response to overall market and economic conditions. A fund's principal market segment (such as market capitalization or style), may underperform other market segments or the equity markets as a whole.
• Growth Stock Risk. If growth companies do not increase their earnings at a rate expected by investors, the market price of the stock may decline significantly, even if earnings show an absolute increase. Growth company stocks also typically lack the dividend yield that can lessen price declines in market downturns.
• Small and Medium Market Capitalization Companies. Investments in small and medium sized companies may involve greater risk and price volatility than investments in larger, more mature companies.
• Value Stock Risk. Value stocks may continue to be undervalued by the market for extended periods, including the entire period during which the stock is held by a fund, or the events that the portfolio manager believed would cause the stock price to increase may not occur as anticipated or at all. Moreover, a stock judged to be undervalued actually may be appropriately priced at a low level.
Fixed-Income Securities Risk. Fixed-income securities are subject to interest rate risk and credit quality risk. The market value of fixed-income securities generally declines when interest rates rise, and an issuer of fixed-income securities could default on its payment obligations.
Foreign Currency Risk. Risks of investing in securities denominated in, or that trade in, foreign (non-U.S.) currencies include changes in foreign exchange rates and foreign exchange restrictions.
Foreign Securities Risk. The risks of foreign securities include loss of value as a result of: political or economic instability; nationalization, expropriation or confiscatory taxation; settlement delays; and limited government regulation (including less stringent reporting, accounting, and disclosure standards than are required of U.S. companies).
Investment Company Securities Risk. Fund shareholders bear indirectly their proportionate share of the expenses of other investment companies in which the fund invests.
Portfolio Duration Risk. Portfolio duration is a measure of the expected life of a fixed-income security and its sensitivity to changes in interest rates. The longer a fund's average portfolio duration, the more sensitive the fund will be to changes in interest rates.
Real Estate Securities Risk. Investing in real estate securities subjects the fund to the risks associated with the real estate market (which are similar to the risks associated with direct ownership in real estate), including declines in real estate values, loss due to casualty or condemnation, property taxes, interest rate changes, increased expenses, cash flow of underlying real estate assets, regulatory changes (including zoning, land use and rents), and environmental problems, as well as to the risks related to the management skill and creditworthiness of the issuer.
Redemption Risk. A fund that serves as an underlying fund for a fund of funds is subject to certain risks. When a fund of funds reallocates or rebalances its investments, an underlying fund may experience relatively large redemptions or investments. These transactions may cause the underlying fund to sell portfolio securities to meet such redemptions, or to invest cash from such investments, at times it would not otherwise do so, and may as a result increase transaction costs and adversely affect underlying fund performance.
Securitized Products Risk. Investments in securitized products are subject to risks similar to traditional fixed income securities, such as credit, interest rate, liquidity, prepayment, extension, and default risk, as well as additional risks associated with the nature of the assets and the servicing of those assets. Unscheduled prepayments on securitized products may have to be reinvested at lower rates. A reduction in prepayments may increase the effective maturities of these securities, exposing them to the risk of decline in market value over time (extension risk).
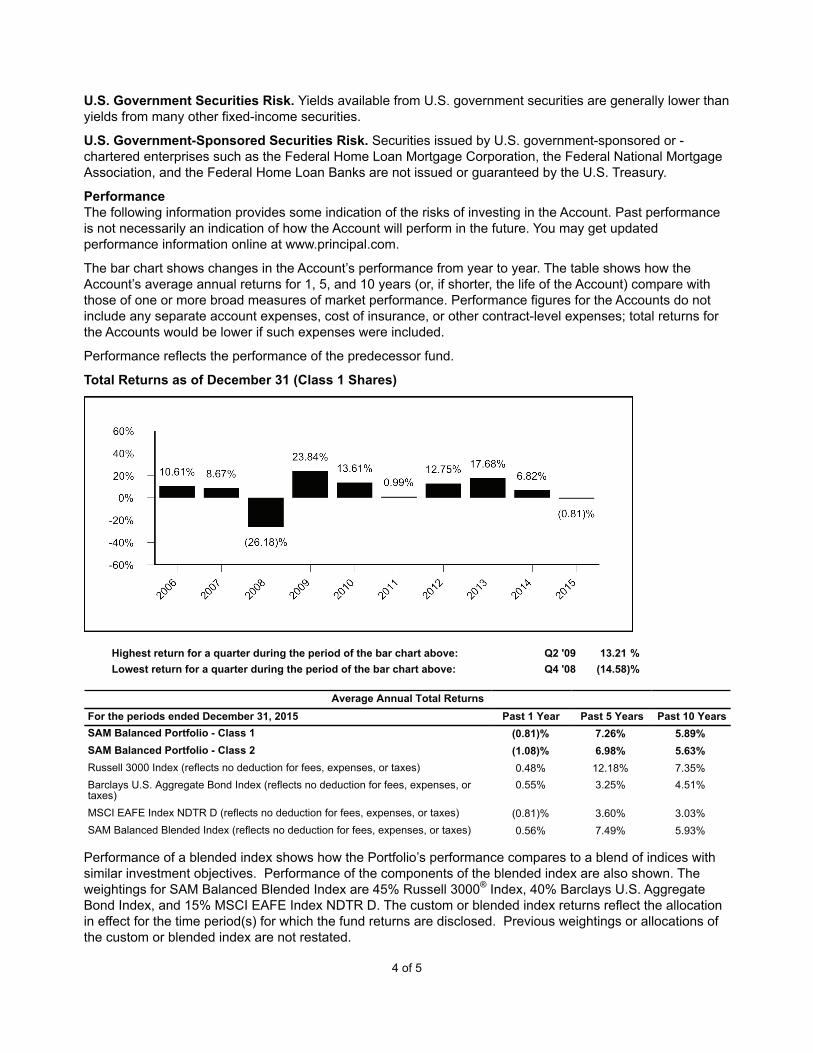
4 of 5
U.S. Government Securities Risk. Yields available from U.S. government securities are generally lower than yields from many other fixed-income securities.
U.S. Government-Sponsored Securities Risk. Securities issued by U.S. government-sponsored or -chartered enterprises such as the Federal Home Loan Mortgage Corporation, the Federal National Mortgage Association, and the Federal Home Loan Banks are not issued or guaranteed by the U.S. Treasury.
PerformanceThe following information provides some indication of the risks of investing in the Account. Past performance is not necessarily an indication of how the Account will perform in the future. You may get updated performance information online at www.principal.com.
The bar chart shows changes in the Account’s performance from year to year. The table shows how the Account’s average annual returns for 1, 5, and 10 years (or, if shorter, the life of the Account) compare with those of one or more broad measures of market performance. Performance figures for the Accounts do not include any separate account expenses, cost of insurance, or other contract-level expenses; total returns for the Accounts would be lower if such expenses were included.
Performance reflects the performance of the predecessor fund.
Total Returns as of December 31 (Class 1 Shares)
Highest return for a quarter during the period of the bar chart above: Q2 '09 13.21 %Lowest return for a quarter during the period of the bar chart above: Q4 '08 (14.58)%
Average Annual Total ReturnsFor the periods ended December 31, 2015 Past 1 Year Past 5 Years Past 10 YearsSAM Balanced Portfolio - Class 1 (0.81)% 7.26% 5.89%SAM Balanced Portfolio - Class 2 (1.08)% 6.98% 5.63%Russell 3000 Index (reflects no deduction for fees, expenses, or taxes) 0.48% 12.18% 7.35%Barclays U.S. Aggregate Bond Index (reflects no deduction for fees, expenses, ortaxes)
0.55% 3.25% 4.51%
MSCI EAFE Index NDTR D (reflects no deduction for fees, expenses, or taxes) (0.81)% 3.60% 3.03%SAM Balanced Blended Index (reflects no deduction for fees, expenses, or taxes) 0.56% 7.49% 5.93%
Performance of a blended index shows how the Portfolio’s performance compares to a blend of indices with similar investment objectives. Performance of the components of the blended index are also shown. The weightings for SAM Balanced Blended Index are 45% Russell 3000® Index, 40% Barclays U.S. Aggregate Bond Index, and 15% MSCI EAFE Index NDTR D. The custom or blended index returns reflect the allocation in effect for the time period(s) for which the fund returns are disclosed. Previous weightings or allocations of the custom or blended index are not restated.

5 of 5
Management
Investment Advisor: Principal Management Corporation
Sub-Advisor and Portfolio Managers:Edge Asset Management, Inc. • Charles D. Averill (since 2010), Portfolio Manager• Jill R. Cuniff (since 2010), President and Portfolio Manager• Todd A. Jablonski (since 2010), Portfolio Manager
Tax InformationThe Fund intends to comply with applicable variable asset diversification regulations. Taxation to you will depend on what you do with your variable life insurance or variable annuity contract. See your variable product prospectus for information about the tax implications of investing in the Accounts.
Payments to Broker-Dealers and Other Financial IntermediariesIf you purchase the Fund through a broker-dealer or other financial intermediary (such as a bank, insurance company, investment adviser, etc.), the Fund and its related companies may pay the intermediary for the sale of Fund shares and related services. These payments may create a conflict of interest by influencing the broker-dealer or other intermediary and your salesperson to recommend the Fund over another investment, to recommend one share class of the Fund over another share class, or to recommend one variable annuity, variable life insurance policy or mutual fund over another. Ask your salesperson or visit your financial intermediary's website for more information.

(This page left intentionally blank)

(This page left intentionally blank)

PVC29A6-01 Accompanies Premier, FVA, IPVA old, IPVA new, Freedom 2, Pivot, and all VL Product Prospectuses

1 of 5
Strategic Asset Management ("SAM") Conservative Balanced Portfolio - Class 1 and Class 2 SharesPrincipal Variable Contracts Funds, Inc. Summary Prospectus May 1, 2016 as amended June 30, 2016
Before you invest, you may want to review the Account's prospectus, which contains more information about the Account and its risks. You can find the Account's prospectus and other information about the Account online at www.principalfunds.com/pvcprospectus. You can also get this information at no cost by calling 1 800-222-5852 or by sending an email request to [email protected].
This Summary Prospectus incorporates by reference the Statutory Prospectus dated May 1, 2016 as supplemented on June 17, 2016 and June 30, 2016, and the Statement of Additional Information dated May 1, 2016 as supplemented on June 17, 2016 (which may be obtained in the same manner as the Prospectus).
Objective: The Portfolio seeks to provide a high level of total return (consisting of reinvestment of income and capital appreciation), consistent with a moderate degree of principal risk.
Fees and Expenses of the AccountThis table describes the fees and expenses that you may pay if you buy and hold shares of the Account. These fees and expenses do not reflect the fees and expenses of any variable insurance contract that may invest in the Account and would be higher if they did.
Annual Account Operating Expenses(expenses that you pay each year as a percentage of the value of your investment)
Class 1 Class 2Management Fees 0.23% 0.23%Distribution and/or Service (12b-1) Fees N/A 0.25%Other Expenses —% —%Acquired Fund Fees and Expenses 0.65% 0.65%Total Annual Account Operating Expenses 0.88% 1.13%
ExampleThis Example is intended to help you compare the cost of investing in the Account with the cost of investing in other mutual funds.
The Example assumes that you invest $10,000 in the Account for the time periods indicated and then redeem all of your shares at the end of those periods. The Example also assumes that your investment has a 5% return each year and that the Account’s operating expenses remain the same. If separate account expenses and contract level expenses were included, expenses would be higher. Although your actual costs may be higher or lower, based on these assumptions your costs would be:
Number of years you own your shares1 3 5 10
SAM Conservative Balanced Portfolio - Class 1 $90 $281 $488 $1,084SAM Conservative Balanced Portfolio - Class 2 115 359 622 1,375

2 of 5
Portfolio TurnoverAs a fund of funds, the Account does not pay transaction costs, such as commissions, when it buys and sells shares of underlying funds (or “turns over” its portfolio); however, the Account does pay such transaction costs when it buys and sells other investments. Also, an underlying fund pays transaction costs when it buys and sells portfolio securities, and a higher portfolio turnover for the underlying fund may indicate higher transaction costs. These costs, which are not reflected in annual account operating expenses or in the examples, affect the performance of the underlying fund and the Account. During its most recent fiscal year, the Account's portfolio turnover rate was 28.2% of the average value of its portfolio.
Principal Investment StrategiesThe SAM Portfolios operate as funds of funds and invest principally in Principal Funds, Inc. and Class 1 shares of Principal Variable Contracts Funds, Inc. equity funds, fixed-income funds and specialty funds (“Underlying Funds”); the Sub-Advisor generally categorizes the Underlying Fund based on the investment profile of the Underlying Fund. If an Underlying Fund offers multiple classes of shares, the SAM Portfolios will purchase shares of the class with the lowest expense ratio at the time of purchase. Each SAM Portfolio typically allocates its assets among Underlying Funds, and within predetermined percentage ranges, as determined by the Sub-Advisor in accordance with its outlook for the economy, the financial markets and the relative market valuations of the Underlying Funds.
The Portfolio:• Generally invests between 40% and 80% of its assets in fixed-income funds, and less than 40% in any
one fixed-income fund (fixed-income funds that generally invest in fixed income instruments such as high yield securities (or “junk” bonds), real estate securities, mortgage-backed securities (securitized products), government and government-sponsored securities, and corporate bonds)
• Generally invests between 20% and 60% of its assets in equity funds, and less than 30% in any one equity fund (equity funds that generally invest in domestic and foreign equity securities) and
• Generally invests less than 20% of its assets in specialty funds, and less than 20% in any one specialty fund (specialty funds that generally offer unique combinations of traditional equity securities and fixed-income securities or that use alternative investment strategies that aim to offer diversification beyond traditional equity and fixed-income securities and include investments in such assets as infrastructure, commodities, currencies, and public timber companies)
The Portfolio may temporarily exceed these percentage ranges for short periods, and the Sub-Advisor may alter the percentage ranges when it deems appropriate.
Principal RisksThe broad diversification of the Portfolio is designed to cushion severe losses in any one investment sector and moderate overall price volatility. However, the Portfolio is subject to the particular risks of the Underlying Funds in which it invests, and its share prices and performance will fluctuate with the shares prices and performance of the Underlying Funds. The Portfolio operates as a fund of funds and thus bears both its own expenses and, indirectly, its proportionate share of the expenses of the Underlying Funds in which it invests. An investment in the Portfolio is not a deposit of a bank and is not insured or guaranteed by the Federal Deposit Insurance Corporation or any other government agency. If you sell your shares when their value is less than the price you paid, you will lose money.
The principal risks of investing in the Portfolio that are inherent in the fund of funds, in alphabetical order, are:
Asset Allocation Risk. A fund's selection and weighting of asset classes may cause it to underperform other funds with a similar investment objective.
Conflict of Interest Risk. The Advisor and its affiliates earn different fees from different underlying funds and may have an incentive to allocate more fund-of-fund assets to underlying funds from which they receive higher fees.
Fund of Funds Risk. The performance and risks of a fund of funds directly correspond to the performance and risks of the underlying funds in which the fund invests. Fund shareholders bear indirectly their proportionate share of the expenses of other investment companies in which the fund invests.

3 of 5
The principal risks of investing in the Portfolio that are inherent in the Underlying Funds, in alphabetical order, are:
Equity Securities Risk. The value of equity securities could decline if the issuer's financial condition declines or in response to overall market and economic conditions. A fund's principal market segment (such as market capitalization or style), may underperform other market segments or the equity markets as a whole.
• Growth Stock Risk. If growth companies do not increase their earnings at a rate expected by investors, the market price of the stock may decline significantly, even if earnings show an absolute increase. Growth company stocks also typically lack the dividend yield that can lessen price declines in market downturns.
• Value Stock Risk. Value stocks may continue to be undervalued by the market for extended periods, including the entire period during which the stock is held by a fund, or the events that the portfolio manager believed would cause the stock price to increase may not occur as anticipated or at all. Moreover, a stock judged to be undervalued actually may be appropriately priced at a low level.
Fixed-Income Securities Risk. Fixed-income securities are subject to interest rate risk and credit quality risk. The market value of fixed-income securities generally declines when interest rates rise, and an issuer of fixed-income securities could default on its payment obligations.
Foreign Currency Risk. Risks of investing in securities denominated in, or that trade in, foreign (non-U.S.) currencies include changes in foreign exchange rates and foreign exchange restrictions.
Foreign Securities Risk. The risks of foreign securities include loss of value as a result of: political or economic instability; nationalization, expropriation or confiscatory taxation; settlement delays; and limited government regulation (including less stringent reporting, accounting, and disclosure standards than are required of U.S. companies).
High Yield Securities Risk. High yield fixed-income securities (commonly referred to as "junk bonds") are subject to greater credit quality risk than higher rated fixed-income securities and should be considered speculative.
Investment Company Securities Risk. Fund shareholders bear indirectly their proportionate share of the expenses of other investment companies in which the fund invests.
Portfolio Duration Risk. Portfolio duration is a measure of the expected life of a fixed-income security and its sensitivity to changes in interest rates. The longer a fund's average portfolio duration, the more sensitive the fund will be to changes in interest rates. .
Real Estate Securities Risk. Investing in real estate securities subjects the fund to the risks associated with the real estate market (which are similar to the risks associated with direct ownership in real estate), including declines in real estate values, loss due to casualty or condemnation, property taxes, interest rate changes, increased expenses, cash flow of underlying real estate assets, regulatory changes (including zoning, land use and rents), and environmental problems, as well as to the risks related to the management skill and creditworthiness of the issuer.
Redemption Risk. A fund that serves as an underlying fund for a fund of funds is subject to certain risks. When a fund of funds reallocates or rebalances its investments, an underlying fund may experience relatively large redemptions or investments. These transactions may cause the underlying fund to sell portfolio securities to meet such redemptions, or to invest cash from such investments, at times it would not otherwise do so, and may as a result increase transaction costs and adversely affect underlying fund performance.
Securitized Products Risk. Investments in securitized products are subject to risks similar to traditional fixed income securities, such as credit, interest rate, liquidity, prepayment, extension, and default risk, as well as additional risks associated with the nature of the assets and the servicing of those assets. Unscheduled prepayments on securitized products may have to be reinvested at lower rates. A reduction in prepayments may increase the effective maturities of these securities, exposing them to the risk of decline in market value over time (extension risk).

4 of 5
U.S. Government Securities Risk. Yields available from U.S. government securities are generally lower than yields from many other fixed-income securities.
U.S. Government-Sponsored Securities Risk. Securities issued by U.S. government-sponsored or -chartered enterprises such as the Federal Home Loan Mortgage Corporation, the Federal National Mortgage Association, and the Federal Home Loan Banks are not issued or guaranteed by the U.S. Treasury.
PerformanceThe following information provides some indication of the risks of investing in the Account. Past performance is not necessarily an indication of how the Account will perform in the future. You may get updated performance information online at www.principal.com.
The bar chart shows changes in the Account's performance from year to year. The table shows how the Account's average annual returns for 1, 5, and 10 years (or, if shorter, the life of the Account) compare with those of one or more broad measures of market performance. Performance figures for the Accounts do not include any separate account expenses, cost of insurance, or other contract-level expenses; total returns for the Accounts would be lower if such expenses were included.
Performance reflects the performance of the predecessor fund.
Total Returns as of December 31 (Class 1 Shares)
Highest return for a quarter during the period of the bar chart above: Q2 '09 11.00 %Lowest return for a quarter during the period of the bar chart above: Q4 '08 (10.39)%
Average Annual Total Returns
For the periods ended December 31, 2015 Past 1 Year Past 5 Years Past 10 YearsSAM Conservative Balanced Portfolio - Class 1 (0.78)% 5.98% 5.53%SAM Conservative Balanced Portfolio - Class 2 (0.93)% 5.71% 5.27%Barclays U.S. Aggregate Bond Index (reflects no deduction for fees, expenses, or taxes) 0.55% 3.25% 4.51%Russell 3000 Index (reflects no deduction for fees, expenses, or taxes) 0.48% 12.18% 7.35%MSCI EAFE Index NDTR D (reflects no deduction for fees, expenses, or taxes) (0.81)% 3.60% 3.03%SAM Conservative Balanced Blended Index (reflects no deduction for fees, expenses, ortaxes)
0.63% 6.13% 5.57%
Performance of a blended index shows how the Portfolio’s performance compares to a blend of indices with similar investment objectives. Performance of the components of the blended index are also shown. The weightings for SAM Conservative Balanced Blended Index are 60% Barclays U.S. Aggregate Bond Index, 30% Russell 3000® Index, and 10% MSCI EAFE Index NDTR D. The custom or blended index returns reflect the allocation in effect for the time period(s) for which the fund returns are disclosed. Previous weightings or allocations of the custom or blended index are not restated.

5 of 5
ManagementInvestment Advisor: Principal Management Corporation
Sub-Advisor and Portfolio Managers:Edge Asset Management, Inc. • Charles D. Averill (since 2010), Portfolio Manager• Jill R. Cuniff (since 2010), President and Portfolio Manager• Todd A. Jablonski (since 2010), Portfolio Manager
Tax InformationThe Fund intends to comply with applicable variable asset diversification regulations. Taxation to you will depend on what you do with your variable life insurance or variable annuity contract. See your variable product prospectus for information about the tax implications of investing in the Accounts.
Payments to Broker-Dealers and Other Financial IntermediariesIf you purchase the Fund through a broker-dealer or other financial intermediary (such as a bank, insurance company, investment adviser, etc.), the Fund and its related companies may pay the intermediary for the sale of Fund shares and related services. These payments may create a conflict of interest by influencing the broker-dealer or other intermediary and your salesperson to recommend the Fund over another investment, to recommend one share class of the Fund over another share class, or to recommend one variable annuity, variable life insurance policy or mutual fund over another. Ask your salesperson or visit your financial intermediary's website for more information.

(This page left intentionally blank)

(This page left intentionally blank)

PVC30A6-01 Accompanies FVA, IPVA old, IPVA new, Freedom 2, Pivot, and all VL Product Prospectuses

1 of 5
Strategic Asset Management ("SAM") Conservative Growth Portfolio - Class 1 and Class 2 SharesPrincipal Variable Contracts Funds, Inc. Summary Prospectus May 1, 2016 as amended June 30, 2016
Before you invest, you may want to review the Account's prospectus, which contains more information about the Account and its risks. You can find the Account's prospectus and other information about the Account online at www.principalfunds.com/pvcprospectus. You can also get this information at no cost by calling 1 800-222-5852 or by sending an email request to [email protected].
This Summary Prospectus incorporates by reference the Statutory Prospectus dated May 1, 2016 as supplemented on June 17, 2016 and June 30, 2016, and the Statement of Additional Information dated May 1, 2016 as supplemented on June 17, 2016 (which may be obtained in the same manner as the Prospectus).
Objective: The Portfolio seeks to provide long-term capital appreciation.
Fees and Expenses of the AccountThis table describes the fees and expenses that you may pay if you buy and hold shares of the Account. These fees and expenses do not reflect the fees and expenses of any variable insurance contract that may invest in the Account and would be higher if they did.
Annual Account Operating Expenses(expenses that you pay each year as a percentage of the value of your investment)
Class 1 Class 2Management Fees 0.23% 0.23%Distribution and/or Service (12b-1) Fees N/A 0.25%Other Expenses —% —%Acquired Fund Fees and Expenses 0.76% 0.76%Total Annual Account Operating Expenses 0.99% 1.24%
ExampleThis Example is intended to help you compare the cost of investing in the Account with the cost of investing in other mutual funds.
The Example assumes that you invest $10,000 in the Account for the time periods indicated and then redeem all of your shares at the end of those periods. The Example also assumes that your investment has a 5% return each year and that the Account’s operating expenses remain the same. If separate account expenses and contract level expenses were included, expenses would be higher. Although your actual costs may be higher or lower, based on these assumptions your costs would be:
Number of years you own your shares1 3 5 10
SAM Conservative Growth Portfolio - Class 1 $101 $315 $547 $1,213SAM Conservative Growth Portfolio - Class 2 126 393 681 1,500

2 of 5
Portfolio TurnoverAs a fund of funds, the Account does not pay transaction costs, such as commissions, when it buys and sells shares of underlying funds (or “turns over” its portfolio); however, the Account does pay such transaction costs when it buys and sells other investments. Also, an underlying fund pays transaction costs when it buys and sells portfolio securities, and a higher portfolio turnover for the underlying fund may indicate higher transaction costs. These costs, which are not reflected in annual account operating expenses or in the examples, affect the performance of the underlying fund and the Account. During its most recent fiscal year, the Account's portfolio turnover rate was 29.1% of the average value of its portfolio.
Principal Investment StrategiesThe SAM Portfolios operate as funds of funds and invest principally in Principal Funds, Inc. and Class 1 shares of Principal Variable Contracts Funds, Inc. equity funds, fixed-income funds and specialty funds (“Underlying Funds”); the Sub-Advisor generally categorizes the Underlying Fund based on the investment profile of the Underlying Fund. If an Underlying Fund offers multiple classes of shares, the SAM Portfolios will purchase shares of the class with the lowest expense ratio at the time of purchase. Each SAM Portfolio typically allocates its assets among Underlying Funds, and within predetermined percentage ranges, as determined by the Sub-Advisor in accordance with its outlook for the economy, the financial markets and the relative market valuations of the Underlying Funds.
The Portfolio:• Generally invests between 0% and 40% of its assets in fixed-income funds, and less than 30% in any one
fixed-income fund (fixed-income funds that generally invest in fixed-income instruments such asgovernment and government-sponsored securities and corporate bonds)
• Generally invests between 60% and 100% of its assets in equity funds that invest in small, medium, andlarge market capitalization companies, and less than 40% in any one equity fund (equity funds thatgenerally invest in domestic and foreign equity securities) and
• Generally invests less than 20% of its assets in specialty funds, and less than 20% in any one specialtyfund (specialty funds that generally offer unique combinations of traditional equity securities and fixed-income securities or that use alternative investment strategies that aim to offer diversification beyondtraditional equity and fixed-income securities and include investments in such assets as infrastructure,commodities, currencies, and public timber companies)
The Portfolio may temporarily exceed the applicable percentage ranges for short periods, and the Sub-Advisor may alter the percentage ranges when it deems appropriate.
Principal RisksThe broad diversification of the Portfolio is designed to cushion severe losses in any one investment sector and moderate overall price volatility. However, the Portfolio is subject to the particular risks of the Underlying Funds in which it invests, and its share prices and performance will fluctuate with the shares prices and performance of the Underlying Funds. The Portfolio operates as a fund of funds and thus bears both its own expenses and, indirectly, its proportionate share of the expenses of the Underlying Funds in which it invests. An investment in the Portfolio is not a deposit of a bank and is not insured or guaranteed by the Federal Deposit Insurance Agency or any other government agency. If you sell your shares when their value is less than the price you paid, you will lose money.
The principal risks of investing in the Portfolio that are inherent in the fund of funds, in alphabetical order, are:
Asset Allocation Risk. A fund's selection and weighting of asset classes may cause it to underperform other funds with a similar investment objective.
Conflict of Interest Risk. The Advisor and its affiliates earn different fees from different underlying funds and may have an incentive to allocate more fund-of-fund assets to underlying funds from which they receive higher fees.
Fund of Funds Risk. The performance and risks of a fund of funds directly correspond to the performance and risks of the underlying funds in which the fund invests. Fund shareholders bear indirectly their proportionate share of the expenses of other investment companies in which the fund invests.

3 of 5
The principal risks of investing in the Portfolio that are inherent in the Underlying Funds, in alphabetical order, are:
Equity Securities Risk. The value of equity securities could decline if the issuer's financial condition declines or in response to overall market and economic conditions. A fund's principal market segment (such as market capitalization or style), may underperform other market segments or the equity markets as a whole.
• Growth Stock Risk. If growth companies do not increase their earnings at a rate expected by investors,the market price of the stock may decline significantly, even if earnings show an absolute increase.Growth company stocks also typically lack the dividend yield that can lessen price declines in marketdownturns.
• Small and Medium Market Capitalization Companies. Investments in small and medium-sizecompanies may involve greater risk and price volatility than investments in larger, more maturecompanies.
• Value Stock Risk. Value stocks may continue to be undervalued by the market for extended periods,including the entire period during which the stock is held by a fund, or the events that the portfoliomanager believed would cause the stock price to increase may not occur as anticipated or at all.Moreover, a stock judged to be undervalued actually may be appropriately priced at a low level.
Fixed-Income Securities Risk. Fixed-income securities are subject to interest rate risk and credit quality risk. The market value of fixed-income securities generally declines when interest rates rise, and an issuer of fixed-income securities could default on its payment obligations.
Foreign Currency Risk. Risks of investing in securities denominated in, or that trade in, foreign (non-U.S.) currencies include changes in foreign exchange rates and foreign exchange restrictions.
Foreign Securities Risk. The risks of foreign securities include loss of value as a result of: political or economic instability; nationalization, expropriation or confiscatory taxation; settlement delays; and limited government regulation (including less stringent reporting, accounting, and disclosure standards than are required of U.S. companies).
Investment Company Securities Risk. Fund shareholders bear indirectly their proportionate share of the expenses of other investment companies in which the fund invests.
Portfolio Duration Risk. Portfolio duration is a measure of the expected life of a fixed-income security and its sensitivity to changes in interest rates. The longer a fund's average portfolio duration, the more sensitive the fund will be to changes in interest rates.
Redemption Risk. A fund that serves as an underlying fund for a fund of funds is subject to certain risks. When a fund of funds reallocates or rebalances its investments, an underlying fund may experience relatively large redemptions or investments. These transactions may cause the underlying fund to sell portfolio securities to meet such redemptions, or to invest cash from such investments, at times it would not otherwise do so, and may as a result increase transaction costs and adversely affect underlying fund performance.
U.S. Government Securities Risk. Yields available from U.S. government securities are generally lower than yields from many other fixed-income securities.
U.S. Government-Sponsored Securities Risk. Securities issued by U.S. government-sponsored or -chartered enterprises such as the Federal Home Loan Mortgage Corporation, the Federal National Mortgage Association, and the Federal Home Loan Banks are not issued or guaranteed by the U.S. Treasury.
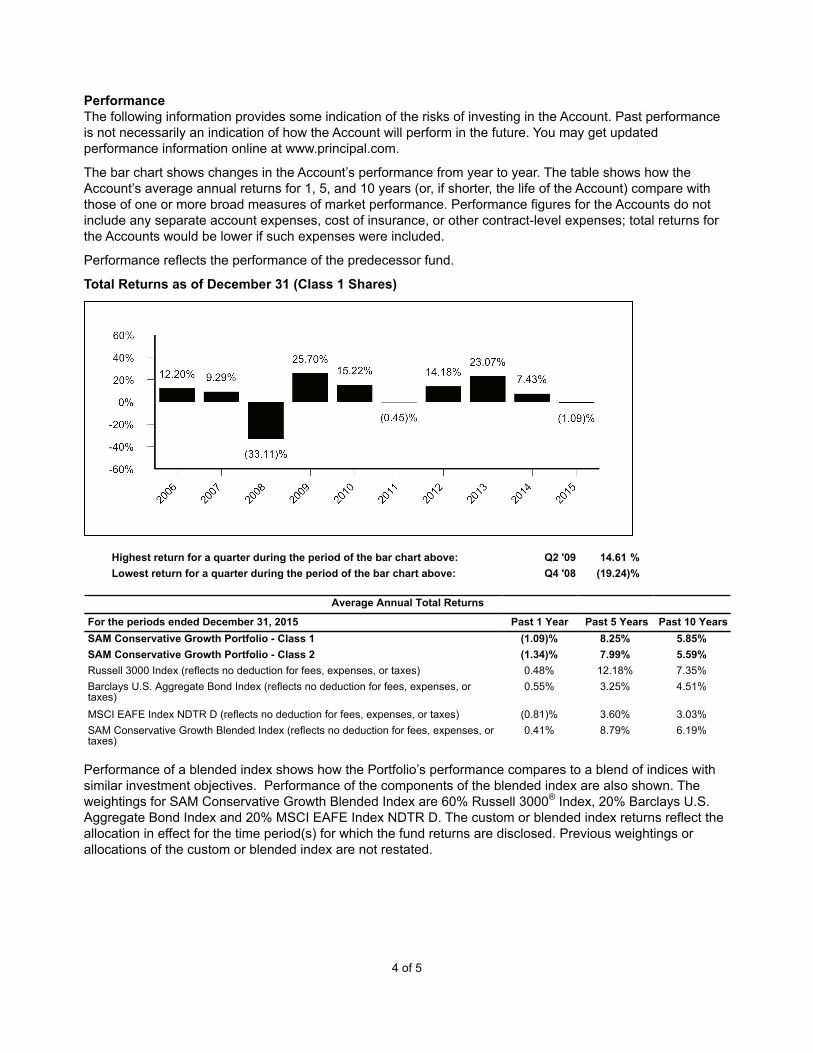
4 of 5
PerformanceThe following information provides some indication of the risks of investing in the Account. Past performance is not necessarily an indication of how the Account will perform in the future. You may get updated performance information online at www.principal.com.
The bar chart shows changes in the Account’s performance from year to year. The table shows how the Account’s average annual returns for 1, 5, and 10 years (or, if shorter, the life of the Account) compare with those of one or more broad measures of market performance. Performance figures for the Accounts do not include any separate account expenses, cost of insurance, or other contract-level expenses; total returns for the Accounts would be lower if such expenses were included.
Performance reflects the performance of the predecessor fund.
Total Returns as of December 31 (Class 1 Shares)
Highest return for a quarter during the period of the bar chart above: Q2 '09 14.61 %Lowest return for a quarter during the period of the bar chart above: Q4 '08 (19.24)%
Average Annual Total Returns
For the periods ended December 31, 2015 Past 1 Year Past 5 Years Past 10 YearsSAM Conservative Growth Portfolio - Class 1 (1.09)% 8.25% 5.85%SAM Conservative Growth Portfolio - Class 2 (1.34)% 7.99% 5.59%Russell 3000 Index (reflects no deduction for fees, expenses, or taxes) 0.48% 12.18% 7.35%Barclays U.S. Aggregate Bond Index (reflects no deduction for fees, expenses, ortaxes)
0.55% 3.25% 4.51%
MSCI EAFE Index NDTR D (reflects no deduction for fees, expenses, or taxes) (0.81)% 3.60% 3.03%SAM Conservative Growth Blended Index (reflects no deduction for fees, expenses, ortaxes)
0.41% 8.79% 6.19%
Performance of a blended index shows how the Portfolio’s performance compares to a blend of indices with similar investment objectives. Performance of the components of the blended index are also shown. The weightings for SAM Conservative Growth Blended Index are 60% Russell 3000® Index, 20% Barclays U.S. Aggregate Bond Index and 20% MSCI EAFE Index NDTR D. The custom or blended index returns reflect the allocation in effect for the time period(s) for which the fund returns are disclosed. Previous weightings or allocations of the custom or blended index are not restated.

5 of 5
Management
Investment Advisor: Principal Management Corporation
Sub-Advisor and Portfolio Managers:Edge Asset Management, Inc. • Charles D. Averill (since 2010), Portfolio Manager• Jill R. Cuniff (since 2010), President and Portfolio Manager• Todd A. Jablonski (since 2010), Portfolio Manager
Tax InformationThe Fund intends to comply with applicable variable asset diversification regulations. Taxation to you will depend on what you do with your variable life insurance or variable annuity contract. See your variable product prospectus for information about the tax implications of investing in the Accounts.
Payments to Broker-Dealers and Other Financial IntermediariesIf you purchase the Fund through a broker-dealer or other financial intermediary (such as a bank, insurance company, investment adviser, etc.), the Fund and its related companies may pay the intermediary for the sale of Fund shares and related services. These payments may create a conflict of interest by influencing the broker-dealer or other intermediary and your salesperson to recommend the Fund over another investment, to recommend one share class of the Fund over another share class, or to recommend one variable annuity, variable life insurance policy or mutual fund over another. Ask your salesperson or visit your financial intermediary's website for more information.

(This page left intentionally blank)

(This page left intentionally blank)

PVC31A6-01 Accompanies FVA, IPVA old, IPVA new, Freedom 2, Pivot, and all VL Product Prospectuses

1 of 5
Strategic Asset Management ("SAM") Flexible Income Portfolio - Class 1 and Class 2 SharesPrincipal Variable Contracts Funds, Inc. Summary Prospectus May 1, 2016 as amended June 30, 2016
Before you invest, you may want to review the Account's prospectus, which contains more information about the Account and its risks. You can find the Account's prospectus and other information about the Account online at www.principalfunds.com/pvcprospectus. You can also get this information at no cost by calling 1 800-222-5852 or by sending an email request to [email protected].
This Summary Prospectus incorporates by reference the Statutory Prospectus dated May 1, 2016 as supplemented on June 17, 2016 and June 30, 2016, and the Statement of Additional Information dated May 1, 2016 as supplemented on June 17, 2016 (which may be obtained in the same manner as the Prospectus).
Objective: The Portfolio seeks to provide a high level of total return (consisting of reinvestment of income with some capital appreciation).
Fees and Expenses of the AccountThis table describes the fees and expenses that you may pay if you buy and hold shares of the Account. These fees and expenses do not reflect the fees and expenses of any variable insurance contract that may invest in the Account and would be higher if they did.
Annual Account Operating Expenses(expenses that you pay each year as a percentage of the value of your investment)
Class 1 Class 2Management Fees 0.23% 0.23%Distribution and/or Service (12b-1) Fees N/A 0.25%Other Expenses —% —%Acquired Fund Fees and Expenses 0.55% 0.55%Total Annual Account Operating Expenses 0.78% 1.03%
ExampleThis Example is intended to help you compare the cost of investing in the Account with the cost of investing in other mutual funds.
The Example assumes that you invest $10,000 in the Account for the time periods indicated and then redeem all of your shares at the end of those periods. The Example also assumes that your investment has a 5% return each year and that the Account’s operating expenses remain the same. If separate account expenses and contract level expenses were included, expenses would be higher. Although your actual costs may be higher or lower, based on these assumptions your costs would be:
Number of years you own your shares1 3 5 10
SAM Flexible Income Portfolio - Class 1 $80 $249 $433 $966SAM Flexible Income Portfolio - Class 2 105 328 569 1,259

2 of 5
Portfolio TurnoverAs a fund of funds, the Account does not pay transaction costs, such as commissions, when it buys and sells shares of underlying funds (or “turns over” its portfolio); however, the Account does pay such transaction costs when it buys and sells other investments. Also, an underlying fund pays transaction costs when it buys and sells portfolio securities, and a higher portfolio turnover for the underlying fund may indicate higher transaction costs. These costs, which are not reflected in annual account operating expenses or in the examples, affect the performance of the underlying fund and the Account. During its most recent fiscal year, the Account's portfolio turnover rate was 25.2% of the average value of its portfolio.
Principal Investment StrategiesThe SAM Portfolios operate as funds of funds and invest principally in Principal Funds, Inc. and Class 1 shares of Principal Variable Contracts Funds, Inc. equity funds, fixed-income funds and specialty funds (“Underlying Funds”); the Sub-Advisor generally categorizes the Underlying Fund based on the investment profile of the Underlying Fund. If an Underlying Fund offers multiple classes of shares, the SAM Portfolios will purchase shares of the class with the lowest expense ratio at the time of purchase. Each SAM Portfolio typically allocates its assets among Underlying Funds, and within predetermined percentage ranges, as determined by the Sub-Advisor in accordance with its outlook for the economy, the financial markets and the relative market valuations of the Underlying Funds.
The Portfolio:• Generally invests between 55% and 95% of its assets in fixed-income funds, and less than 40% in any
one fixed-income fund (fixed-income funds that generally invest in fixed income instruments such as high yield securities (or “junk” bonds), real estate securities, mortgage-backed securities (securitized products), government and government-sponsored securities, and corporate bonds)
• Generally invests between 5% and 45% of its assets in equity funds, and less than 30% in any one equity fund (equity funds that generally invest in domestic and foreign equity securities) and
• Generally invests less than 20% of its assets in specialty funds, and less than 20% in any one specialty fund (specialty funds that generally offer unique combinations of traditional equity securities and fixed-income securities or that use alternative investment strategies that aim to offer diversification beyond traditional equity and fixed-income securities and include investments in such assets as infrastructure, commodities, currencies, and public timber companies)
The Portfolio may temporarily exceed these percentage ranges for short periods, and the Sub-Advisor may alter the percentage ranges when it deems appropriate.
Principal RisksThe broad diversification of the Portfolio is designed to cushion severe losses in any one investment sector and moderate overall price volatility. However, the Portfolio is subject to the particular risks of the Underlying Funds in which it invests, and its share prices and performance will fluctuate with the shares prices and performance of the Underlying Funds. The Portfolio operates as a fund of funds and thus bears both its own expenses and, indirectly, its proportionate share of the expenses of the Underlying Funds in which it invests. An investment in the Portfolio is not a deposit of a bank and is not insured or guaranteed by the Federal Deposit Insurance Corporation or any other government agency. If you sell your shares when their value is less than the price you paid, you will lose money.
The principal risks of investing in the Portfolio that are inherent in the fund of funds, in alphabetical order, are:
Asset Allocation Risk. A fund's selection and weighting of asset classes may cause it to underperform other funds with a similar investment objective.
Conflict of Interest Risk. The Advisor and its affiliates earn different fees from different underlying funds and may have an incentive to allocate more fund-of-fund assets to underlying funds from which they receive higher fees.
Fund of Funds Risk. The performance and risks of a fund of funds directly correspond to the performance and risks of the underlying funds in which the fund invests. Fund shareholders bear indirectly their proportionate share of the expenses of other investment companies in which the fund invests.
3 of 5
The principal risks of investing in the Portfolio that are inherent in the Underlying Funds, in alphabetical order, are:
Equity Securities Risk. The value of equity securities could decline if the issuer's financial condition declines or in response to overall market and economic conditions. A fund's principal market segment (such as market capitalization or style), may underperform other market segments or the equity markets as a whole.
• Growth Stock Risk. If growth companies do not increase their earnings at a rate expected by investors, the market price of the stock may decline significantly, even if earnings show an absolute increase. Growth company stocks also typically lack the dividend yield that can lessen price declines in market downturns.
• Value Stock Risk. Value stocks may continue to be undervalued by the market for extended periods, including the entire period during which the stock is held by a fund, or the events that the portfolio manager believed would cause the stock price to increase may not occur as anticipated or at all. Moreover, a stock judged to be undervalued actually may be appropriately priced at a low level.
Fixed-Income Securities Risk. Fixed-income securities are subject to interest rate risk and credit quality risk. The market value of fixed-income securities generally declines when interest rates rise, and an issuer of fixed-income securities could default on its payment obligations.
Foreign Currency Risk. Risks of investing in securities denominated in, or that trade in, foreign (non-U.S.) currencies include changes in foreign exchange rates and foreign exchange restrictions.
Foreign Securities Risk. The risks of foreign securities include loss of value as a result of: political or economic instability; nationalization, expropriation or confiscatory taxation; settlement delays; and limited government regulation (including less stringent reporting, accounting, and disclosure standards than are required of U.S. companies).
High Yield Securities Risk. High yield fixed-income securities (commonly referred to as "junk bonds") are subject to greater credit quality risk than higher rated fixed-income securities and should be considered speculative.
Investment Company Securities Risk. Fund shareholders bear indirectly their proportionate share of the expenses of other investment companies in which the fund invests.
Portfolio Duration Risk. Portfolio duration is a measure of the expected life of a fixed-income security and its sensitivity to changes in interest rates. The longer a fund's average portfolio duration, the more sensitive the fund will be to changes in interest rates.
Real Estate Securities Risk. Investing in real estate securities subjects the fund to the risks associated with the real estate market (which are similar to the risks associated with direct ownership in real estate), including declines in real estate values, loss due to casualty or condemnation, property taxes, interest rate changes, increased expenses, cash flow of underlying real estate assets, regulatory changes (including zoning, land use and rents), and environmental problems, as well as to the risks related to the management skill and creditworthiness of the issuer.
Redemption Risk. A fund that serves as an underlying fund for a fund of funds is subject to certain risks. When a fund of funds reallocates or rebalances its investments, an underlying fund may experience relatively large redemptions or investments. These transactions may cause the underlying fund to sell portfolio securities to meet such redemptions, or to invest cash from such investments, at times it would not otherwise do so, and may as a result increase transaction costs and adversely affect underlying fund performance.
Securitized Products Risk. Investments in securitized products are subject to risks similar to traditional fixed income securities, such as credit, interest rate, liquidity, prepayment, extension, and default risk, as well as additional risks associated with the nature of the assets and the servicing of those assets. Unscheduled prepayments on securitized products may have to be reinvested at lower rates. A reduction in prepayments may increase the effective maturities of these securities, exposing them to the risk of decline in market value over time (extension risk).

4 of 5
U.S. Government Securities Risk. Yields available from U.S. government securities are generally lower than yields from many other fixed-income securities.
U.S. Government-Sponsored Securities Risk. Securities issued by U.S. government-sponsored or -chartered enterprises such as the Federal Home Loan Mortgage Corporation, the Federal National Mortgage Association, and the Federal Home Loan Banks are not issued or guaranteed by the U.S. Treasury.
PerformanceThe following information provides some indication of the risks of investing in the Account. Past performance is not necessarily an indication of how the Account will perform in the future. You may get updated performance information online at www.principal.com.
The bar chart shows changes in the Account's performance from year to year. The table shows how the Account's average annual returns for 1, 5, and 10 years (or, if shorter, the life of the Account) compare with those of one or more broad measures of market performance. Performance figures for the Accounts do not include any separate account expenses, cost of insurance, or other contract-level expenses; total returns for the Accounts would be lower if such expenses were included.
Performance reflects the performance of the predecessor fund.
Total Returns as of December 31 (Class 1 Shares)
Highest return for a quarter during the period of the bar chart above: Q2 '09 10.44 %Lowest return for a quarter during the period of the bar chart above: Q4 '08 (6.95)%
Average Annual Total ReturnsFor the periods ended December 31, 2015 Past 1 Year Past 5 Years Past 10 YearsSAM Flexible Income Portfolio - Class 1 (1.31)% 5.22% 5.27%SAM Flexible Income Portfolio - Class 2 (1.55)% 4.96% 5.01%Barclays U.S. Aggregate Bond Index (reflects no deduction for fees, expenses, ortaxes)
0.55% 3.25% 4.51%
Russell 3000 Index (reflects no deduction for fees, expenses, or taxes) 0.48% 12.18% 7.35%MSCI EAFE Index NDTR D (reflects no deduction for fees, expenses, or taxes) (0.81)% 3.60% 3.03%SAM Flexible Income Blended Index (reflects no deduction for fees, expenses, ortaxes)
0.65% 5.17% 5.27%
Performance of a blended index shows how the Portfolio’s performance compares to a blend of indices with similar investment objectives. Performance of the components of the blended index are also shown. The weightings for SAM Flexible Income Blended Index are 75% Barclays U.S. Aggregate Bond Index, 20% Russell 3000® Index, and 5% MSCI EAFE Index NDTR D. The custom or blended index returns reflect the allocation in effect for the time period(s) for which the fund returns are disclosed. Previous weightings or allocations of the custom or blended index are not restated.
5 of 5
Management
Investment Advisor: Principal Management Corporation
Sub-Advisor and Portfolio Managers:Edge Asset Management, Inc. • Charles D. Averill (since 2010), Portfolio Manager• Jill R. Cuniff (since 2010), President and Portfolio Manager• Todd A. Jablonski (since 2010), Portfolio Manager
Tax InformationThe Fund intends to comply with applicable variable asset diversification regulations. Taxation to you will depend on what you do with your variable life insurance or variable annuity contract. See your variable product prospectus for information about the tax implications of investing in the Accounts.
Payments to Broker-Dealers and Other Financial IntermediariesIf you purchase the Fund through a broker-dealer or other financial intermediary (such as a bank, insurance company, investment adviser, etc.), the Fund and its related companies may pay the intermediary for the sale of Fund shares and related services. These payments may create a conflict of interest by influencing the broker-dealer or other intermediary and your salesperson to recommend the Fund over another investment, to recommend one share class of the Fund over another share class, or to recommend one variable annuity, variable life insurance policy or mutual fund over another. Ask your salesperson or visit your financial intermediary's website for more information.

(This page left intentionally blank)

(This page left intentionally blank)

PVC32A6-01 Accompanies FVA, IPVA old, IPVA new, Freedom 2, Pivot, and all VL Product Prospectuses
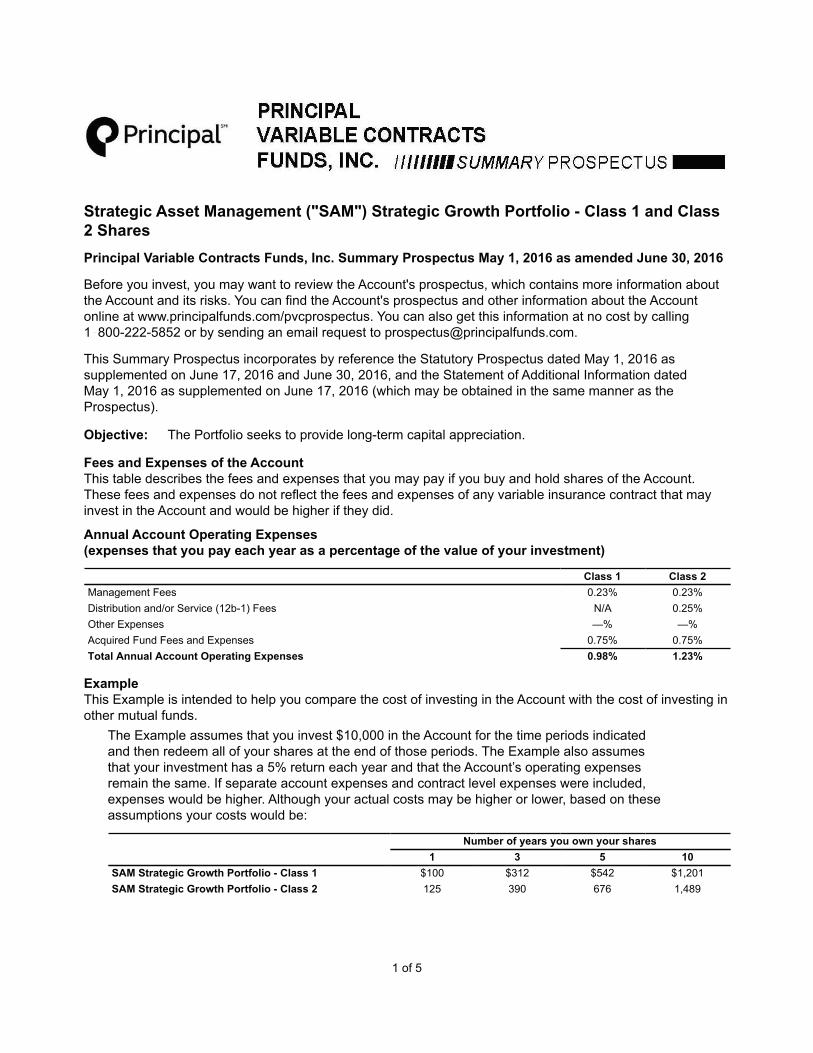
1 of 5
Strategic Asset Management ("SAM") Strategic Growth Portfolio - Class 1 and Class 2 SharesPrincipal Variable Contracts Funds, Inc. Summary Prospectus May 1, 2016 as amended June 30, 2016
Before you invest, you may want to review the Account's prospectus, which contains more information about the Account and its risks. You can find the Account's prospectus and other information about the Account online at www.principalfunds.com/pvcprospectus. You can also get this information at no cost by calling 1 800-222-5852 or by sending an email request to [email protected].
This Summary Prospectus incorporates by reference the Statutory Prospectus dated May 1, 2016 as supplemented on June 17, 2016 and June 30, 2016, and the Statement of Additional Information dated May 1, 2016 as supplemented on June 17, 2016 (which may be obtained in the same manner as the Prospectus).
Objective: The Portfolio seeks to provide long-term capital appreciation.
Fees and Expenses of the AccountThis table describes the fees and expenses that you may pay if you buy and hold shares of the Account. These fees and expenses do not reflect the fees and expenses of any variable insurance contract that may invest in the Account and would be higher if they did.
Annual Account Operating Expenses(expenses that you pay each year as a percentage of the value of your investment)
Class 1 Class 2Management Fees 0.23% 0.23%Distribution and/or Service (12b-1) Fees N/A 0.25%Other Expenses —% —%Acquired Fund Fees and Expenses 0.75% 0.75%Total Annual Account Operating Expenses 0.98% 1.23%
ExampleThis Example is intended to help you compare the cost of investing in the Account with the cost of investing in other mutual funds.
The Example assumes that you invest $10,000 in the Account for the time periods indicated and then redeem all of your shares at the end of those periods. The Example also assumes that your investment has a 5% return each year and that the Account’s operating expenses remain the same. If separate account expenses and contract level expenses were included, expenses would be higher. Although your actual costs may be higher or lower, based on these assumptions your costs would be:
Number of years you own your shares1 3 5 10
SAM Strategic Growth Portfolio - Class 1 $100 $312 $542 $1,201SAM Strategic Growth Portfolio - Class 2 125 390 676 1,489

2 of 5
Portfolio TurnoverAs a fund of funds, the Account does not pay transaction costs, such as commissions, when it buys and sells shares of underlying funds (or “turns over” its portfolio); however, the Account does pay such transaction costs when it buys and sells other investments. Also, an underlying fund pays transaction costs when it buys and sells portfolio securities, and a higher portfolio turnover for the underlying fund may indicate higher transaction costs. These costs, which are not reflected in annual account operating expenses or in the examples, affect the performance of the underlying fund and the Account. During its most recent fiscal year, the Account's portfolio turnover rate was 37.9% of the average value of its portfolio.
Principal Investment StrategiesThe SAM Portfolios operate as funds of funds and invest principally in Principal Funds, Inc. and Class 1 shares of Principal Variable Contracts Funds, Inc. equity funds, fixed-income funds and specialty funds (“Underlying Funds”); the Sub-Advisor generally categorizes the Underlying Fund based on the investment profile of the Underlying Fund. If an Underlying Fund offers multiple classes of shares, the SAM Portfolios will purchase shares of the class with the lowest expense ratio at the time of purchase. Each SAM Portfolio typically allocates its assets among Underlying Funds, and within predetermined percentage ranges, as determined by the Sub-Advisor in accordance with its outlook for the economy, the financial markets and the relative market valuations of the Underlying Funds.
The Portfolio:• Generally invests between 75% and 100% of its assets in equity funds that invest in small, medium, and
large market capitalization companies, and less than 50% in any one equity fund (equity funds that generally invest in domestic and foreign equity securities) and
• Generally invests less than 20% of its assets in specialty funds, and less than 20% in any one specialty fund (specialty funds that generally offer unique combinations of traditional equity securities and fixed-income securities or that use alternative investment strategies that aim to offer diversification beyond traditional equity and fixed-income securities and include investments in such assets as infrastructure, commodities, currencies, and public timber companies)
The Portfolio may temporarily exceed the applicable percentage ranges for short periods, and the Sub-Advisor may alter the percentage ranges when it deems appropriate.
Principal RisksThe broad diversification of the Portfolio is designed to cushion severe losses in any one investment sector and moderate overall price volatility. However, the Portfolio is subject to the particular risks of the Underlying Funds in which it invests, and its share prices and performance will fluctuate with the shares prices and performance of the Underlying Funds. The Portfolio operates as a fund of funds and thus bears both its own expenses and, indirectly, its proportionate share of the expenses of the Underlying Funds in which it invests. An investment in the Portfolio is not a deposit of a bank and is not insured or guaranteed by the Federal Deposit Insurance Corporation or any other government agency. If you sell your shares when their value is less than the price you paid, you will lose money.
The principal risks of investing in the Portfolio that are inherent in the fund of funds, in alphabetical order, are:
Asset Allocation Risk. A fund's selection and weighting of asset classes may cause it to underperform other funds with a similar investment objective.
Conflict of Interest Risk. The Advisor and its affiliates earn different fees from different underlying funds and may have an incentive to allocate more fund-of-fund assets to underlying funds from which they receive higher fees.
Fund of Funds Risk. The performance and risks of a fund of funds directly correspond to the performance and risks of the underlying funds in which the fund invests. Fund shareholders bear indirectly their proportionate share of the expenses of other investment companies in which the fund invests.

3 of 5
The principal risks of investing in the Portfolio that are inherent in the Underlying Funds, in alphabetical order, are:
Equity Securities Risk. The value of equity securities could decline if the issuer's financial condition declines or in response to overall market and economic conditions. A fund's principal market segment (such as market capitalization or style), may underperform other market segments or the equity markets as a whole.
• Growth Stock Risk. If growth companies do not increase their earnings at a rate expected by investors, the market price of the stock may decline significantly, even if earnings show an absolute increase. Growth company stocks also typically lack the dividend yield that can lessen price declines in market downturns.
• Small and Medium Market Capitalization Companies. Investments in small and medium sized companies may involve greater risk and price volatility than investments in larger, more mature companies.
• Value Stock Risk. Value stocks may continue to be undervalued by the market for extended periods, including the entire period during which the stock is held by a fund, or the events that the portfolio manager believed would cause the stock price to increase may not occur as anticipated or at all. Moreover, a stock judged to be undervalued actually may be appropriately priced at a low level.
Foreign Currency Risk. Risks of investing in securities denominated in, or that trade in, foreign (non-U.S.) currencies include changes in foreign exchange rates and foreign exchange restrictions.
Foreign Securities Risk. The risks of foreign securities include loss of value as a result of: political or economic instability; nationalization, expropriation or confiscatory taxation; settlement delays; and limited government regulation (including less stringent reporting, accounting, and disclosure standards than are required of U.S. companies).
Investment Company Securities Risk. Fund shareholders bear indirectly their proportionate share of the expenses of other investment companies in which the fund invests.
Redemption Risk. A fund that serves as an underlying fund for a fund of funds is subject to certain risks. When a fund of funds reallocates or rebalances its investments, an underlying fund may experience relatively large redemptions or investments. These transactions may cause the underlying fund to sell portfolio securities to meet such redemptions, or to invest cash from such investments, at times it would not otherwise do so, and may as a result increase transaction costs and adversely affect underlying fund performance.
PerformanceThe following information provides some indication of the risks of investing in the Account. Past performance is not necessarily an indication of how the Account will perform in the future. You may get updated performance information online at www.principal.com.
The bar chart shows changes in the Account’s performance from year to year. The table shows how the Account’s average annual returns for 1, 5, and 10 years (or, if shorter, the life of the Account) compare with those of one or more broad measures of market performance. Performance figures for the Accounts do not include any separate account expenses, cost of insurance, or other contract-level expenses; total returns for the Accounts would be lower if such expenses were included.
Performance reflects the performance of the predecessor fund.

4 of 5
Total Returns as of December 31 (Class 1 Shares)
Highest return for a quarter during the period of the bar chart above: Q3 ‘09 15.95 %Lowest return for a quarter during the period of the bar chart above: Q4 '08 (22.38)%
Average Annual Total ReturnsFor the periods ended December 31, 2015 Past 1 Year Past 5 Years Past 10 YearsSAM Strategic Growth Portfolio - Class 1 (1.62)% 9.07% 5.91%SAM Strategic Growth Portfolio - Class 2 (1.87)% 8.79% 5.65%Russell 3000 Index (reflects no deduction for fees, expenses, or taxes) 0.48% 12.18% 7.35%MSCI EAFE Index NDTR D (reflects no deduction for fees, expenses, or taxes) (0.81)% 3.60% 3.03%Barclays U.S. Aggregate Bond Index (reflects no deduction for fees, expenses, ortaxes)
0.55% 3.25% 4.51%
SAM Strategic Growth Blended Index (reflects no deduction for fees, expenses, ortaxes)
0.24% 9.62% 6.25%
Performance of a blended index shows how the Portfolio’s performance compares to a blend of indices with similar investment objectives. Performance of the components of the blended index are also shown. The weightings for SAM Strategic Growth Blended Index are 70% Russell 3000® Index, 25% MSCI EAFE Index NDTR D and 5% Barclays U.S. Aggregate Bond Index. The custom or blended index returns reflect the allocation in effect for the time period(s) for which the fund returns are disclosed. Previous weightings or allocations of the custom or blended index are not restated.
ManagementInvestment Advisor: Principal Management Corporation
Sub-Advisor and Portfolio Managers:Edge Asset Management, Inc. • Charles D. Averill (since 2010), Portfolio Manager• Jill R. Cuniff (since 2010), President and Portfolio Manager• Todd A. Jablonski (since 2010), Portfolio Manager
Tax InformationThe Fund intends to comply with applicable variable asset diversification regulations. Taxation to you will depend on what you do with your variable life insurance or variable annuity contract. See your variable product prospectus for information about the tax implications of investing in the Accounts.

5 of 5
Payments to Broker-Dealers and Other Financial IntermediariesIf you purchase the Fund through a broker-dealer or other financial intermediary (such as a bank, insurance company, investment adviser, etc.), the Fund and its related companies may pay the intermediary for the sale of Fund shares and related services. These payments may create a conflict of interest by influencing the broker-dealer or other intermediary and your salesperson to recommend the Fund over another investment, to recommend one share class of the Fund over another share class, or to recommend one variable annuity, variable life insurance policy or mutual fund over another. Ask your salesperson or visit your financial intermediary's website for more information.

(This page left intentionally blank)

(This page left intentionally blank)

PVC33A6-01 Accompanies FVA, IPVA old, IPVA new, Freedom 2, Pivot, and all VL Product Prospectuses

Page 1 of 2
Principal Life Insurance Company Variable Life Separate Account
Notice and Supplement dated May 19, 2016to the Statutory Prospectuses dated May 1, 2016 for:
Principal Variable Universal Life AccumulatorPrincipal Variable Universal Life Accumulator II
Principal Benefit Variable Universal Life Principal Benefit Variable Universal Life IIPrincipal Executive Variable Universal Life
Principal Executive Variable Universal Life IIPrincipal Flexible Variable Life
Principal Survivorship Flexible Premium Variable Universal LifePrincipal Variable Universal Life Income
Principal Variable Universal Life Income IIPrinFlex Life
This supplement updates information contained in the Statutory Prospectus for the variable life insurance policies referenced above. Please retain this supplement for future reference.
PUTNAM VT VOYAGER FUND MERGING
One of the mutual funds available as an investment option under the insurance policies referenced above is merging into another fund effective July 15, 2016. The purpose of this notice and supplement is to advise you of the merger and, if you have values allocated to the merging fund, inform you of your options.
Principal Life Insurance Company has been informed by Putnam Investments that the Putnam VT Voyager Fund, which is the underlying fund for the Putnam VT Voyager Division (the “Merging Fund Division”) will merge into the Putnam VT Growth Opportunities Fund effective July 15, 2016 (the “Merger Date”). No transfers into the Merging Fund Division will be allowed on or after July 14, 2016.
On the Merger Date, we will transfer any remaining values in the Merging Fund Division to the division that invests in the Putnam VT Growth Opportunities Fund.
REVISIONS TO THE PROSPECTUS TABLE OF SEPARATE ACCOUNT DIVISIONS
On or about July 15, 2016, replace the row for the Putnam VT Voyager Division with the following:
Putnam VT Growth Opportunities Division
Invests in: Putnam VT Growth Opportunities Fund - Class IBInvestment Advisor: Putnam Investment Management, LLCInvestment Objective: seeks capital appreciation.
OPTIONS FOR OWNERS WHO HAVE VALUES ALLOCATED TO THE MERGING FUND DIVISION
If you have policy values allocated to the Merging Fund Division:
You can do nothing, and any funds remaining in the Merging Fund Division will be automatically transferred to the Putnam VT Growth Opportunities Division on the Merger Date. There will be no transfer fee charged to you when this automatic transfer occurs, and you will have the right to subsequently transfer such value as described below.
You can transfer value out of the Merging Fund Division (before the Merger Date) or the Putnam VT Growth Opportunities Division (after the Closing Date) to another available investment option under your Policy without charge for a period beginning 30 days before the Closing Date through 60 days following the Closing Date. Transfers made related to this merger during the prescribed time periods will not count in determining the number of transfers made in any period or the number made in any period without charge.

Page 2 of 2
To request a transfer of division values you have in the Merging Fund Division to another division, you must provide us notice using one of the following methods:1. Visit www.principal.com and complete the transfer online using your logon and password;2. Call us at 1-800-247-9988. We can process your transfer request by phone or provide you with the forms to
submit your request in writing via mail or via FAX (1-866-885-0390); or3. Contact your financial professional or servicing representative.
NOTE: 1. For variable life insurance as part of a Corporate-Owned Life Insurance (COLI) plan, please request your
transfer by calling 1-800-999-4031.2. For variable life insurance using Automatic Portfolio Rebalancing or Dollar Cost Averaging, you must
provide your instruction to us by July 15, 2016. Otherwise, we will direct any Merging Fund Division allocations to the Putnam VT Growth Opportunities Division.
3. There are no tax consequences resulting from the transfer of funds as required by this Notice.4. In summary, your instructions related to transferring funds out of the Merging Fund Division must be received
by us by 5 p.m. CST on July 15, 2016 to avoid the automatic transfer of funds from the Merging Fund Division to the Putnam VT Growth Opportunities Division.
We previously sent you prospectuses for available underlying funds which may aid you in choosing new investments, and a copy of the summary prospectus for the Putnam VT Growth Opportunities Fund is included with this notice and supplement mailing. You can also view the underlying funds at www.principal.com or call us to request copies.
LV877S-0

SUPPLEMENT TO PROSPECTUS The date of this supplement is June 28, 2016.
MFS® Blended Research® Small Cap Equity Portfolio Initial Class & Service Class Shares
1023418 1 VSC-SUP-I-062816
Effective immediately, the fifth paragraph in the sub-section entitled "Principal Investment Strategies" under the main heading "Summary of Key Information" is restated in its entirety as follows:
MFS uses a bottom-up approach to buying and selling investments for the fund. Investments are selected primarily based on blending fundamental and quantitative research. MFS uses fundamental analysis of individual issuers to determine a fundamental rating for an issuer. MFS uses quantitative analysis to determine a quantitative rating for an issuer. MFS then constructs the portfolio considering the blended rating from combining the fundamental rating and the quantitative rating, as well as issuer, industry, and sector weightings, market capitalization, volatility, and other factors with a goal of constructing a portfolio with a target predicted tracking error of approximately 3% compared to the Index. There is no assurance that the fund will meet this target predicted tracking error over the long term or for any year or period of years, or that the fund's predicted tracking error and actual tracking error will be similar. Tracking error generally measures how the differences between the fund's monthly returns and the Index's monthly returns have varied over a specified time period.
Effective immediately, the fourth paragraph in the sub-section entitled "Principal Risks" under the main heading "Summary of Key Information" is restated in its entirety as follows:
Investment Strategy Risk: The fund's strategy to target a predicted tracking error of approximately 3% compared to the Index and to blend fundamental and quantitative research may not produce the intended results. In addition, MFS fundamental research is not available for all issuers.
Effective immediately, the fourth paragraph in the sub-section entitled "Principal Investment Strategies" under the main heading "Investment Objective, Strategies, and Risks" is restated in its entirety as follows: MFS uses a bottom-up approach to buying and selling investments for the fund. Investments are selected primarily based on blending fundamental and quantitative research. MFS uses fundamental analysis of individual issuers and their potential in light of their financial condition and market, economic, political, and regulatory conditions to determine a fundamental rating for an issuer. Factors considered may include
position, and management ability. MFS uses quantitative
analysis, including quantitative models that systematically
earnings quality, and other factors to determine a quantitative rating for an issuer. When MFS quantitative research is available but MFS fundamental research is not available, MFS considers the issuer to have a neutral fundamental rating. MFS then constructs the portfolio considering the blended rating from combining the fundamental rating and the quantitative rating, as well as issuer, industry, and sector weightings, market capitalization, volatility, and other factors with a goal of constructing a portfolio with a target predicted tracking error of approximately 3% compared to the Index. There is no assurance that the fund will meet this target predicted tracking error over the long term or for any year or period of years, or that the fund's predicted tracking error and actual tracking error will be similar. Tracking error generally measures how the differences between the fund's monthly returns and the Index's monthly returns have varied over a specified time period. A higher tracking error means that the differences between the fund's returns and the Index's returns have varied more over time while a lower tracking error means the differences between the fund's returns and the Index's returns have varied less over time.
Effective immediately, the fifth paragraph in the sub-section entitled "Principal Risks" under the main heading "Investment Objective, Strategies, and Risks" is restated in its entirety as follows:
Investment Strategy Risk: The fund's strategy to target a predicted tracking error of approximately 3% compared to the Index and to blend fundamental and quantitative research may not produce the intended results. In addition, MFS fundamental research is not available for all issuers.
LV609MFS-03 Accompanies All VL Prospectuses
MAY 1, 2016, AS AMENDED JUNE 27, 2016
Before you invest, you may want to review the Fund’s prospectus, which contains more information about the
Fund and its risks. You can find the Fund’s prospectus, statement of additional information and other information
about the Fund online at franklintempleton.com/ftviptfunds. You can also get this information at no cost by calling
1-888-FRANKLIN or by sending an e-mail request to [email protected]. The Fund’s
prospectus and statement of additional information, both dated May 1, 2016, as may be amended from time to
time, are incorporated by reference into this Summary prospectus, which means that they are legally a part of this
Summary prospectus. Shares of the insurance funds of Franklin Templeton Variable Insurance Products Trust are
not offered to the public; they are offered and sold only to: (1) insurance company separate accounts to serve as the
underlying investment vehicles for variable contracts; (2) certain qualified plans; and (3) other mutual funds (fund
of funds). This Summary prospectus is not intended for use by other investors. Please check with your insurance
company for availability. Please read this Summary prospectus together with your variable annuity or variable life
insurance product prospectus.
SUMMARY PROSPECTUSFRANKLIN TEMPLETON VARIABLE INSURANCE PRODUCTS TRUST | CLASS 2
Templeton Foreign
VIP Fund

S U M M A RY P RO S P E C T U S
2 - Templeton Foreign VIP Fund - Class 2
Investment GoalLong-term capital growth.
Fees and Expenses of the FundThis table describes the fees and expenses that you may pay if you buy and hold shares of the Fund. The table and the example do not include any fees or sales charges imposed by variable insurance contracts, qualified retirement plans or funds of funds. If they were included, your costs would be higher.
Annual Fund Operating Expenses(expenses that you pay each year as a percentage of the value of your investment)
Class 2
Management fees 0.75%
Distribution and service (12b-1) fees 0.25%
Other expenses 0.03%
Total annual Fund operating expenses 1.03%
ExampleThis Example is intended to help you compare the cost of investing in the Fund with the cost of investing in other mutual funds. The Example assumes that you invest $10,000 in the Fund for the time periods indicated and then redeem all of your shares at the end of the period. The Example also assumes that your investment has a 5% return each year and that the Fund’s operating expenses remain the same. The Example reflects adjustments made to the Fund’s operating expenses due to the fee waivers and/or expense reimbursements by management for the 1 Year numbers only. Although your actual costs may be higher or lower, based on these assumptions your costs would be:
1 Year 3 Years 5 Years 10 Years
Class 2 $105 $328 $569 $1,259
Portfolio TurnoverThe Fund pays transaction costs, such as commissions, when it buys and sells securities (or “turns over” its portfolio). A higher portfolio turnover rate may indicate higher transaction costs. These costs, which are not reflected in annual Fund operating expenses or in the example, affect the Fund’s
performance. During the most recent fiscal year, the Fund’s portfolio turnover rate was 15.15% of the average value of its portfolio.
Principal Investment StrategiesUnder normal market conditions, the Fund invests at least 80% of its net assets in investments of issuers located outside the U.S., including those in emerging markets. Under normal market conditions, the Fund invests predominantly in equity securities, primarily to predominantly in common stock. While there are no set percentage targets, the Fund invests predominantly in large to medium capitalization companies and may invest a portion in smaller companies. The Fund also invests in American, European and Global Depositary Receipts. Although the investment manager will search for investments across a large number of sectors, from time to time, based on economic conditions, the Fund may have significant positions in particular countries or sectors.
When choosing equity investments for the Fund, the investment manager applies a “bottom-up,” value-oriented, long-term approach, focusing on the market price of a company’s securities relative to the investment manager’s evaluation of the company’s long-term earnings, asset value and cash flow potential. The investment manager also considers a company’s price/earnings ratio, profit margins and liquidation value.
The Fund may, from time to time, seek to hedge (protect) against currency risks, using certain derivative instruments, including currency and cross currency forwards and currency futures contracts.
Principal RisksYou could lose money by investing in the Fund. Mutual fund shares are not deposits or obligations of, or guaranteed or endorsed by, any bank, and are not insured by the Federal Deposit Insurance Corporation, the Federal Reserve Board, or any other agency of the U.S. government.
Market The market values of securities or other investments owned by the Fund will go up or down, sometimes rapidly or unpredictably. The market value of a security or other investment may be reduced by market activity or other results of supply and demand unrelated to the issuer. This is a basic risk associated
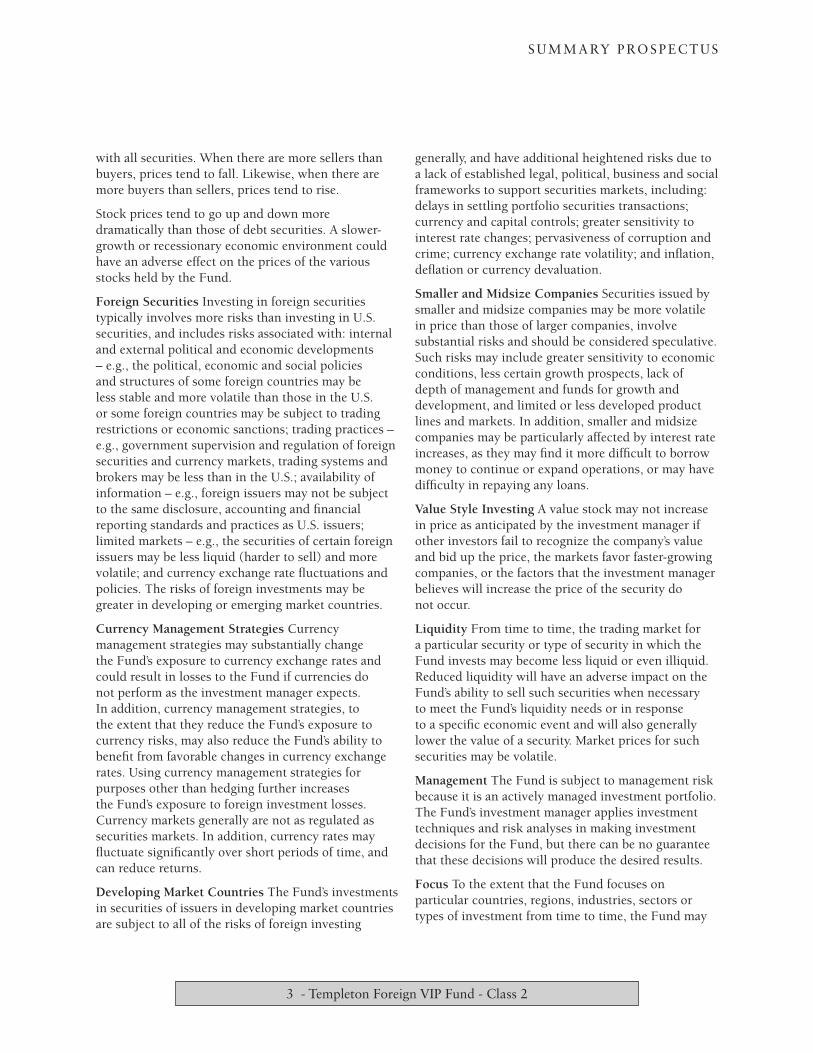
S U M M A RY P RO S P E C T U S
3 - Templeton Foreign VIP Fund - Class 2
with all securities. When there are more sellers than buyers, prices tend to fall. Likewise, when there are more buyers than sellers, prices tend to rise.
Stock prices tend to go up and down more dramatically than those of debt securities. A slower-growth or recessionary economic environment could have an adverse effect on the prices of the various stocks held by the Fund.
Foreign Securities Investing in foreign securities typically involves more risks than investing in U.S. securities, and includes risks associated with: internal and external political and economic developments – e.g., the political, economic and social policies and structures of some foreign countries may be less stable and more volatile than those in the U.S. or some foreign countries may be subject to trading restrictions or economic sanctions; trading practices – e.g., government supervision and regulation of foreign securities and currency markets, trading systems and brokers may be less than in the U.S.; availability of information – e.g., foreign issuers may not be subject to the same disclosure, accounting and financial reporting standards and practices as U.S. issuers; limited markets – e.g., the securities of certain foreign issuers may be less liquid (harder to sell) and more volatile; and currency exchange rate fluctuations and policies. The risks of foreign investments may be greater in developing or emerging market countries.
Currency Management Strategies Currency management strategies may substantially change the Fund’s exposure to currency exchange rates and could result in losses to the Fund if currencies do not perform as the investment manager expects. In addition, currency management strategies, to the extent that they reduce the Fund’s exposure to currency risks, may also reduce the Fund’s ability to benefit from favorable changes in currency exchange rates. Using currency management strategies for purposes other than hedging further increases the Fund’s exposure to foreign investment losses. Currency markets generally are not as regulated as securities markets. In addition, currency rates may fluctuate significantly over short periods of time, and can reduce returns.
Developing Market Countries The Fund’s investments in securities of issuers in developing market countries are subject to all of the risks of foreign investing
generally, and have additional heightened risks due to a lack of established legal, political, business and social frameworks to support securities markets, including: delays in settling portfolio securities transactions; currency and capital controls; greater sensitivity to interest rate changes; pervasiveness of corruption and crime; currency exchange rate volatility; and inflation, deflation or currency devaluation.
Smaller and Midsize Companies Securities issued by smaller and midsize companies may be more volatile in price than those of larger companies, involve substantial risks and should be considered speculative. Such risks may include greater sensitivity to economic conditions, less certain growth prospects, lack of depth of management and funds for growth and development, and limited or less developed product lines and markets. In addition, smaller and midsize companies may be particularly affected by interest rate increases, as they may find it more difficult to borrow money to continue or expand operations, or may have difficulty in repaying any loans.
Value Style Investing A value stock may not increase in price as anticipated by the investment manager if other investors fail to recognize the company’s value and bid up the price, the markets favor faster-growing companies, or the factors that the investment manager believes will increase the price of the security do not occur.
Liquidity From time to time, the trading market for a particular security or type of security in which the Fund invests may become less liquid or even illiquid. Reduced liquidity will have an adverse impact on the Fund’s ability to sell such securities when necessary to meet the Fund’s liquidity needs or in response to a specific economic event and will also generally lower the value of a security. Market prices for such securities may be volatile.
Management The Fund is subject to management risk because it is an actively managed investment portfolio. The Fund’s investment manager applies investment techniques and risk analyses in making investment decisions for the Fund, but there can be no guarantee that these decisions will produce the desired results.
Focus To the extent that the Fund focuses on particular countries, regions, industries, sectors or types of investment from time to time, the Fund may

S U M M A RY P RO S P E C T U S
4 - Templeton Foreign VIP Fund - Class 2
be subject to greater risks of adverse developments in such areas of focus than a fund that invests in a wider variety of countries, regions, industries, sectors or investments.
Derivative Instruments The performance of derivative instruments depends largely on the performance of an underlying instrument, such as a currency, security, interest rate or index, and such instruments often have risks similar to the underlying instrument, in addition to other risks. Derivatives involve costs and can create economic leverage in the Fund’s portfolio which may result in significant volatility and cause
the Fund to participate in losses (as well as gains) in an amount that exceeds the Fund’s initial investment. Other risks include illiquidity, mispricing or improper valuation of the derivative instrument, and imperfect correlation between the value of the derivative and the underlying instrument so that the Fund may not realize the intended benefits. When a derivative is used for hedging, the change in value of the derivative may also not correlate specifically with the currency, security, interest rate, index or other risk being hedged. Derivatives also may present the risk that the other party to the transaction will fail to perform.

S U M M A RY P RO S P E C T U S
5 - Templeton Foreign VIP Fund - Class 2
PerformanceThe following bar chart and table provide some indication of the risks of investing in the Fund. The bar chart shows changes in the Fund’s performance from year to year for Class 2 shares. The table shows how the Fund’s average annual returns for 1 year, 5 years, 10 years or since inception, as applicable, compare with those of a broad measure of market performance. The Fund’s past performance is not necessarily an indication of how the Fund will perform in the future.
Performance reflects all Fund expenses but does not include any fees or sales charges imposed by variable insurance contracts, qualified plans or funds of funds. If they had been included, the returns shown below would be lower. Investors should consult the variable insurance contract prospectus, or the disclosure documents for qualified plans or funds of funds for more information.
Annual Total Returns
Best Quarter: Q3’09 22.86%
Worst Quarter: Q4’08 -19.82%
As of March 31, 2016, the Fund’s year-to-date return was -1.44%.
-6.49%-11.13%
22.97%
18.23%
-10.63%
8.41%
37.04%
-40.38%
15.46%
21.45%
2015201420132012201120102009200820072006Year
Average Annual Total ReturnsFor the periods ended December 31, 2015
1 Year 5 Years 10 Years
Templeton Foreign VIP Fund - Class 2 -6.49% 1.55% 2.98%
MSCI EAFE Index (index reflects no deduction for fees, expenses or taxes)1 -0.39% 4.07% 3.50%
MSCI All Country World ex-US Index (index reflects no deduction for fees, expenses or taxes)1 -5.25% 1.51% 3.38%
1. The MSCI All Country World ex-US Index is replacing the MSCI EAFE Index as the Fund’s benchmark. The investment manager believes the composition of the MSCI All Country World ex-US Index more accurately reflects the Fund’s holdings.

S U M M A RY P RO S P E C T U S
6 - Templeton Foreign VIP Fund - Class 2
Investment ManagerTempleton Investment Counsel, LLC (Investment Counsel)
Portfolio ManagersPeter A. Nori, CFAExecutive Vice President/Portfolio Manager - Research Analyst of Investment Counsel and portfolio manager of the Fund since 1999.Cindy L. Sweeting, CFAPresident of Investment Counsel and portfolio manager of the Fund since 2012.
Purchase and Sale of Fund SharesShares of the Fund are sold to insurance companies’ separate accounts (Insurers) to fund variable annuity or variable life insurance contracts and to qualified plans. Insurance companies offer variable annuity and variable life insurance products through separate accounts. Shares of the Fund may also be sold to other mutual funds, either as underlying funds in a fund of funds or in other structures. In addition, Fund shares are held by a limited number of Insurers, qualified retirement plans and, when applicable, funds of funds. Substantial withdrawals by one or more Insurers, qualified retirement plans or funds of funds could reduce Fund assets, causing total Fund expenses to become higher than the numbers shown in the fees and expenses table above.
The terms of the offering of interests in separate accounts are included in the variable annuity or variable life insurance product prospectus. The terms of offerings of funds of funds are included in those funds’ prospectuses. The terms of offering of qualified retirement plans are described in their disclosure
documents. Investors should consult the variable contract prospectus, fund of fund prospectus, or plan disclosure documents for more information on fees and expenses imposed by variable insurance contracts, funds of funds or qualified retirement plans, respectively.
TaxesBecause shares of the Fund are generally purchased through variable annuity contracts or variable life insurance contracts, the Fund’s distributions (which the Fund expects, based on its investment goals and strategies to consist of ordinary income, capital gains or some combination of both) will be exempt from current taxation if left to accumulate within the variable contract. You should refer to your contract prospectus for more information on these tax consequences.
Payments to Sponsoring Insurance Companies and Other Financial IntermediariesThe Fund or its distributor (and related companies) may pay broker/dealers or other financial intermediaries (such as banks and insurance companies, or their related companies) for the sale and retention of variable contracts which offer Fund shares and/or for other services. These payments may create a conflict of interest for an intermediary or be a factor in the insurance company’s decision to include the Fund as an investment option in its variable contract. For more information, ask your financial advisor, visit your intermediary’s website, or consult the Contract prospectus or this Fund prospectus.

[THIS PAGE INTENTIONALLY LEFT BLANK]

Investment Company Act file #811-05583
© 2016 Franklin Templeton Investments. All rights reserved. 720 PSUM 06/16LV607FTS-08 Accompanies EVUL, BVUL, EVUL II, and BVUL II Prospectuses

SUMMARY PROSPECTUS April 29, 2016 (As Amended June 23, 2016)
MFS® Global Equity Series Service Class
VGE-SSUM-062316 Page 1 of 3
Before you invest, you may want to review the fund’s prospectus, which contains more information about the fund and its risks. You can find the fund’s prospectus and other information about the fund, including the fund’s statement of additional information, online at insurancefunds.mfs.com. You can also get this information at no cost by calling 1-800-225-2606 or by sending an e-mail request to [email protected]. The fund’s prospectus and statement of additional information, both dated April 29, 2016, as may be supplemented from time to time, are incorporated by reference into this Summary Prospectus. CLASS TICKER
SYMBOL Service Class N/A
Summary of Key Information
Investment Objective The fund’s investment objective is to seek capital appreciation.
Fees and Expenses This table describes the fees and expenses that you may pay when you hold shares of the fund. Expenses have been adjusted to reflect the current management fee set forth in the fund's Investment Advisory Agreement. If the fees and expenses imposed by the insurance company that issued your variable contracts or other eligible investor through which the fund is offered were included, your expenses would be higher.
Annual Fund Operating Expenses (expenses that you pay each year as a percentage of the value of your investment): Management Fee 0.90%
Distribution and/or Service (12b-1) Fees 0.25%
Other Expenses 0.26% Total Annual Fund Operating Expenses 1.41%
Fee Reductions and/or Expense Reimbursements1 (0.16)%
Total Annual Fund Operating Expenses After Fee Reductions and/or Expense Reimbursements 1.25% 1 Massachusetts Financial Services Company has agreed in writing to bear the fund’s expenses, excluding interest, taxes, extraordinary
expenses, brokerage and transaction costs, and investment-related expenses (such as interest and borrowing expenses incurred in connection with the fund's investment activity), such that “Total Annual Fund Operating Expenses” do not exceed 1.25% of the fund’s average daily net assets annually for Service Class shares. This written agreement will continue until modified by the fund’s Board of Trustees, but such agreement will continue until at least April 30, 2017.

MFS Global Equity Series
Page 2 of 3
Example This example is intended to help you compare the cost of investing in the fund with the cost of investing in other mutual funds. If the fees and expenses imposed by the insurance company that issued your variable contracts or other eligible investor through which an investment in the fund is made were included, your expenses would be higher. The example assumes that: you invest $10,000 in the fund for the time periods indicated and you redeem your shares at the end of the time periods; your investment has a 5% return each year; and the fund’s operating expenses remain the same. Although your actual costs will likely be higher or lower, under these assumptions your costs would be: 1 YEAR 3 YEARS 5 YEARS 10 YEARS
Service Class Shares $127 $431 $756 $1,677
Portfolio Turnover The fund pays transaction costs, such as commissions, when it buys and sells securities (or “turns over” its portfolio). A higher portfolio turnover rate may indicate higher transaction costs. These transaction costs, which are not reflected in “Annual Fund Operating Expenses” or in the “Example,” affect the fund’s performance. During the most recent fiscal year, the fund’s portfolio turnover rate was 12% of the average value of its portfolio.
Principal Investment Strategies MFS (Massachusetts Financial Services Company, the fund’s investment adviser) normally invests at least 80% of the fund’s net assets in equity securities. Equity securities include common stocks and other securities that represent an ownership interest (or right to acquire an ownership interest) in a company or other issuer. In selecting investments for the fund, MFS is not constrained to any particular investment style. MFS may invest the fund’s assets in the stocks of companies it believes to have above average earnings growth potential compared to other companies (growth companies), in the stocks of companies it believes are undervalued compared to their perceived worth (value companies), or in a combination of growth and value companies. While MFS may invest the fund’s assets in companies of any size, MFS primarily invests in companies with large capitalizations. MFS invests the fund’s assets in U.S. and foreign securities, including emerging market securities. MFS normally allocates the fund's investments across different countries and regions, but MFS may invest a large percentage of the fund’s assets in issuers in a single country, a small number of countries, or a particular geographic region. MFS uses a bottom-up investment approach to buying and selling investments for the fund. Investments are selected primarily based on fundamental analysis of individual issuers. Quantitative models that systematically evaluate issuers may also be considered.
Principal Risks As with any mutual fund, the fund may not achieve its objective and/or you could lose money on your investment in the fund. An investment in the fund is not a bank deposit and is not insured or guaranteed by the Federal Deposit Insurance Corporation or any other governmental agency. The principal risks of investing in the fund are:
Stock Market/Company Risk: Stock markets are volatile and can decline significantly in response to issuer, market, economic, industry, political, regulatory, geopolitical, and other conditions, as well as to investor perceptions of these conditions. The price of an equity security can decrease significantly in response to these conditions, and these conditions can affect a single issuer or type of security, issuers within a broad market sector, industry or geographic region, or the market in general. Foreign Risk: Exposure to foreign markets through issuers or currencies can involve additional risks relating to market, economic, industry, political, regulatory, geopolitical, and other conditions. These factors can make foreign investments, especially those in emerging markets, more volatile and less liquid than U.S. investments. In addition, foreign markets can react differently to these conditions than the U.S. market. Emerging Markets Risk: Investments in emerging markets can involve additional and greater risks than the risks associated with investments in developed foreign markets. Emerging markets can have less developed markets, greater custody and operational risk, less developed legal, regulatory, and accounting systems, and greater political, social, and economic instability than developed markets. Currency Risk: The value of foreign currencies relative to the U.S. dollar fluctuates in response to market, economic, industry, political, regulatory, geopolitical, and other conditions, and a decline in the value of a foreign currency versus the U.S. dollar reduces the value in U.S. dollars of investments denominated in that foreign currency. Geographic Focus Risk: The fund’s performance will be closely tied to the market, currency, economic, political, regulatory, geopolitical, and other conditions in the countries or regions in which the fund's assets are invested. Liquidity Risk: It may be difficult to value, and it may not be possible to sell, certain investments, types of investments, and/or investments in certain segments of the market, and the fund may have to sell certain of these investments at a price or time that is not advantageous in order to meet redemptions or other cash needs. Investment Selection Risk: MFS' investment analysis and its selection of investments may not produce the intended results and/or can lead to an investment focus that results in the fund underperforming other funds with similar investment strategies and/or underperforming the markets in which the fund invests.
Performance Information The bar chart and performance table below are intended to provide some indication of the risks of investing in the fund by showing changes in the fund’s performance over time and how the fund's performance over time compares with that of a broad measure of market performance. The fund’s past performance does not necessarily indicate how the fund will perform in the future. Updated performance is available at mfs.com or by calling 1-877-411-3325. If the fees and expenses imposed by the insurance company that issued your variable contracts or other eligible investor through which an investment in the fund is made were included, they would reduce the returns shown.

MFS Global Equity Series
Page 3 of 3
Service Class Bar Chart.
(1.67)
3.63
27.5222.98
(4.53)
12.05
31.80
(33.97)
8.97
24.02
-50-40-30-20-10
01020304050
2006 2007 2008 2009 2010 2011 2012 2013 2014 2015CALENDAR YEAR
GAI
N o
r LO
SS(%
)
The total return for the three-month period ended March 31, 2016, was 1.97%. During the period(s) shown in the bar chart, the highest quarterly return was 18.93% (for the calendar quarter ended June 30, 2009) and the lowest quarterly return was (18.27)% (for the calendar quarter ended December 31, 2008).
Performance Table. Average Annual Total Returns (For the Periods Ended December 31, 2015)
Share Class 1 YEAR 5 YEARS 10 YEARS Service Class Shares (1.67)% 8.82% 7.23%
Index Comparison (Reflects no deduction for fees, expenses, or taxes)
MSCI World Index (0.32)% 8.19% 5.56%
Investment Adviser MFS serves as the investment adviser for the fund.
Portfolio Manager(s)
Portfolio Manager Since Title
David Mannheim 1999 Investment Officer of MFS
Roger Morley 2009 Investment Officer of MFS MFS anticipates that David Mannheim will retire as portfolio manager of the fund at a date between June 2017 and June 2018. As of September 30, 2016, the above chart will be restated as follows:
Portfolio Manager Since Title
David Mannheim 1999 Investment Officer of MFS
Ryan P. McAllister September 2016 Investment Officer of MFS
Roger Morley 2009 Investment Officer of MFS MFS anticipates that David Mannheim will retire as portfolio manager of the fund at a date between June 2017 and June 2018.
Purchase and Sale of Fund Shares You should consult with the insurance company that issued your variable contract, or other eligible investor through which your investment in the fund is made, for minimum investment requirements and redemption procedures.
Taxes You should consult with the insurance company that issued your variable contract, or other eligible investor through which your investment in the fund is made, to understand the tax treatment of your investment.
Payments to Financial Intermediaries The fund, MFS, and/or its affiliates may make payments to insurance companies, other financial intermediaries, and all of their affiliates, for distribution and/or other services. These payments may create a conflict of interest for the insurance company or other financial intermediary to include the fund as an investment option in its product or to recommend the fund over another investment option. Ask your financial intermediary or insurance company, or visit your financial intermediary's or insurance company's Web site, for more information.

LV609MFS-02 Accompanies EVUL, EVUL II, BVUL, BVUL II Prospectuses

VK-VIAMVA SUM SUP-1 061416
VK-VIAMVA SUM SUP-1 061416
Summary Prospectus Supplement dated June 14, 2016
The purpose of this mailing is to provide you with changes to the current Summary Prospectuses for Series I and Series II shares of the Fund listed below:
Invesco V.I. American Value Fund
The following information replaces the table in its entirety appearing under the heading “Management of the Fund” in the summary prospectuses:
“Portfolio Managers Title Length of Service on the Fund Thomas R. Copper Portfolio Manager (co-lead) 2010 (predecessor fund 2005) Jeffrey Vancavage Portfolio Manager (co-lead) 2016 Sergio Marcheli Portfolio Manager 2010 (predecessor fund 2003) John Mazanec Portfolio Manager 2010 (predecessor fund 2008)
Effective on or about September 30, 2016, John Mazanec will no longer serve as Portfolio Manager to the Fund.”
LV601INS-06 Accompanies all VL Prospectuses

PIMCO Total Return Portfolio
PVIT | SUMMARY PROSPECTUS
SUMMARY PROSPECTUSApril 29, 2016 (as supplemented June 13, 2016)
Share Class: Administrative Summary Prospectus
Before you invest, you may want to review the Portfolio’s prospectus, which, assupplemented, contains more information about the Portfolio and its risks. You can find thePortfolio’s prospectus and other information about the Portfolio online at http://pvit.pimco-funds.com/FundReports.aspx. You can also get this information at no cost by calling1.800.927.4648 or by sending an email request to [email protected]. ThePortfolio’s prospectus and Statement of Additional Information, both dated April 29, 2016,as supplemented, along with the financial statements included in the Portfolio’s most recentannual report to shareholders dated December 31, 2015, are incorporated by reference intothis Summary Prospectus.
Investment ObjectiveThe Portfolio seeks maximum total return, consistent with preservation ofcapital and prudent investment management.
Fees and Expenses of the PortfolioThis table describes the fees and expenses that you may pay if you buy andhold Administrative Class shares of the Portfolio. Overall fees and expensesof investing in the Portfolio are higher than shown because the table doesnot reflect variable contract fees and expenses.
Shareholder Fees (fees paid directly from your investment): None
Annual Portfolio Operating Expenses (expenses that you payeach year as a percentage of the value of your investment):
AdministrativeClass
Management Fees 0.50%
Distribution and/or Service (12b-1) Fees 0.15%
Other Expenses(1) 0.01%
Total Annual Portfolio Operating Expenses(2) 0.66%
1 “Other Expenses” reflect interest expense and is based on the amount incurred duringthe Portfolio’s most recent fiscal year as a result of entering into certain investments,such as reverse repurchase agreements. Interest expense is required to be treated as aPortfolio expense for accounting purposes and is not payable to PIMCO. The amount ofinterest expense (if any) will vary based on the Portfolio’s use of such investments as aninvestment strategy.
2 Total Annual Portfolio Operating Expenses excluding interest expense is 0.65% forAdministrative Class shares.
Example. The Example is intended to help you compare the cost ofinvesting in Administrative Class shares of the Portfolio with the costs ofinvesting in other mutual funds. The Example assumes that you invest$10,000 for the time periods indicated, and then redeem all your shares atthe end of those periods. The Example also assumes that your investmenthas a 5% return each year and that the Portfolio’s operating expensesremain the same. Although your actual costs may be higher or lower, theExample shows what your costs would be based on these assumptions. TheExample does not reflect fees and expenses of any variable annuity contractor variable life insurance policy, and would be higher if it did.
1 Year 3 Years 5 Years 10 Years
Administrative Class $67 $211 $368 $822
Portfolio TurnoverThe Portfolio pays transaction costs when it buys and sells securities (or“turns over” its portfolio). A higher portfolio turnover rate may indicatehigher transaction costs. These costs, which are not reflected in the AnnualPortfolio Operating Expenses or in the Example table, affect the Portfolio’sperformance. During the most recent fiscal year, the Portfolio’s portfolioturnover rate was 462% of the average value of its portfolio.
Principal Investment StrategiesThe Portfolio seeks to achieve its investment objective by investing undernormal circumstances at least 65% of its total assets in a diversifiedportfolio of Fixed Income Instruments of varying maturities, which may berepresented by forwards or derivatives such as options, futures contracts, orswap agreements. “Fixed Income Instruments” include bonds, debtsecurities and other similar instruments issued by various U.S. and non-U.S.public- or private-sector entities. The average portfolio duration of thisPortfolio normally varies within two years (plus or minus) of the portfolioduration of the securities comprising the Barclays U.S. Aggregate Index, ascalculated by PIMCO, which as of March 31, 2016 was 5.30 years. Durationis a measure used to determine the sensitivity of a security’s price tochanges in interest rates. The longer a security’s duration, the more sensitiveit will be to changes in interest rates.
The Portfolio invests primarily in investment grade debt securities, but mayinvest up to 20% of its total assets in high yield securities (“junk bonds”)rated B or higher by Moody’s Investors Service, Inc. (“Moody’s”), orequivalently rated by Standard & Poor’s Ratings Services (“S&P”) or Fitch,Inc. (“Fitch”), or, if unrated, determined by Pacific Investment ManagementCompany LLC (“PIMCO”) to be of comparable quality (except that withinsuch 20% limitation, the Portfolio may invest in mortgage-related securitiesrated below B). The Portfolio may invest up to 30% of its total assets insecurities denominated in foreign currencies, and may invest beyond thislimit in U.S. dollar-denominated securities of foreign issuers. The Portfoliomay invest up to 15% of its total assets in securities and instruments thatare economically tied to emerging market countries (this limitation does notapply to investment grade sovereign debt denominated in the local currencywith less than 1 year remaining to maturity, which means the Portfolio mayinvest, together with any other investments denominated in foreigncurrencies, up to 30% of its total assets in such instruments). The Portfoliowill normally limit its foreign currency exposure (from non-U.S. dollar-denominated securities or currencies) to 20% of its total assets.
The Portfolio may invest, without limitation, in derivative instruments, suchas options, futures contracts or swap agreements, or in mortgage- or asset-backed securities, subject to applicable law and any other restrictionsdescribed in the Portfolio’s prospectus or Statement of AdditionalInformation. The Portfolio may purchase or sell securities on a when-issued,delayed delivery or forward commitment basis and may engage in shortsales. The Portfolio may invest up to 10% of its total assets in preferredstock, convertible securities and other equity-related securities. The Portfoliomay, without limitation, seek to obtain market exposure to the securities in
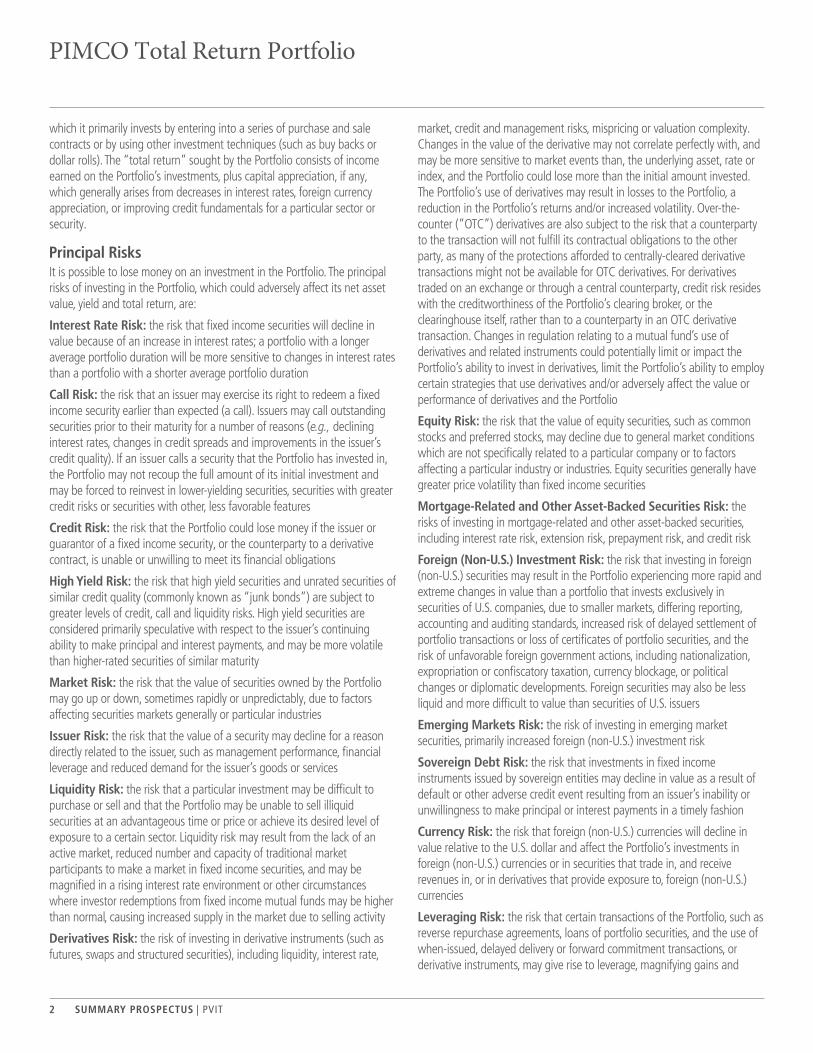
PIMCO Total Return Portfolio
SUMMARY PROSPECTUS | PVIT2
which it primarily invests by entering into a series of purchase and salecontracts or by using other investment techniques (such as buy backs ordollar rolls). The “total return” sought by the Portfolio consists of incomeearned on the Portfolio’s investments, plus capital appreciation, if any,which generally arises from decreases in interest rates, foreign currencyappreciation, or improving credit fundamentals for a particular sector orsecurity.
Principal RisksIt is possible to lose money on an investment in the Portfolio. The principalrisks of investing in the Portfolio, which could adversely affect its net assetvalue, yield and total return, are:
Interest Rate Risk: the risk that fixed income securities will decline invalue because of an increase in interest rates; a portfolio with a longeraverage portfolio duration will be more sensitive to changes in interest ratesthan a portfolio with a shorter average portfolio duration
Call Risk: the risk that an issuer may exercise its right to redeem a fixedincome security earlier than expected (a call). Issuers may call outstandingsecurities prior to their maturity for a number of reasons (e.g., declininginterest rates, changes in credit spreads and improvements in the issuer’scredit quality). If an issuer calls a security that the Portfolio has invested in,the Portfolio may not recoup the full amount of its initial investment andmay be forced to reinvest in lower-yielding securities, securities with greatercredit risks or securities with other, less favorable features
Credit Risk: the risk that the Portfolio could lose money if the issuer orguarantor of a fixed income security, or the counterparty to a derivativecontract, is unable or unwilling to meet its financial obligations
High Yield Risk: the risk that high yield securities and unrated securities ofsimilar credit quality (commonly known as “junk bonds”) are subject togreater levels of credit, call and liquidity risks. High yield securities areconsidered primarily speculative with respect to the issuer’s continuingability to make principal and interest payments, and may be more volatilethan higher-rated securities of similar maturity
Market Risk: the risk that the value of securities owned by the Portfoliomay go up or down, sometimes rapidly or unpredictably, due to factorsaffecting securities markets generally or particular industries
Issuer Risk: the risk that the value of a security may decline for a reasondirectly related to the issuer, such as management performance, financialleverage and reduced demand for the issuer’s goods or services
Liquidity Risk: the risk that a particular investment may be difficult topurchase or sell and that the Portfolio may be unable to sell illiquidsecurities at an advantageous time or price or achieve its desired level ofexposure to a certain sector. Liquidity risk may result from the lack of anactive market, reduced number and capacity of traditional marketparticipants to make a market in fixed income securities, and may bemagnified in a rising interest rate environment or other circumstanceswhere investor redemptions from fixed income mutual funds may be higherthan normal, causing increased supply in the market due to selling activity
Derivatives Risk: the risk of investing in derivative instruments (such asfutures, swaps and structured securities), including liquidity, interest rate,
market, credit and management risks, mispricing or valuation complexity.Changes in the value of the derivative may not correlate perfectly with, andmay be more sensitive to market events than, the underlying asset, rate orindex, and the Portfolio could lose more than the initial amount invested.The Portfolio’s use of derivatives may result in losses to the Portfolio, areduction in the Portfolio’s returns and/or increased volatility. Over-the-counter (“OTC”) derivatives are also subject to the risk that a counterpartyto the transaction will not fulfill its contractual obligations to the otherparty, as many of the protections afforded to centrally-cleared derivativetransactions might not be available for OTC derivatives. For derivativestraded on an exchange or through a central counterparty, credit risk resideswith the creditworthiness of the Portfolio’s clearing broker, or theclearinghouse itself, rather than to a counterparty in an OTC derivativetransaction. Changes in regulation relating to a mutual fund’s use ofderivatives and related instruments could potentially limit or impact thePortfolio’s ability to invest in derivatives, limit the Portfolio’s ability to employcertain strategies that use derivatives and/or adversely affect the value orperformance of derivatives and the Portfolio
Equity Risk: the risk that the value of equity securities, such as commonstocks and preferred stocks, may decline due to general market conditionswhich are not specifically related to a particular company or to factorsaffecting a particular industry or industries. Equity securities generally havegreater price volatility than fixed income securities
Mortgage-Related and Other Asset-Backed Securities Risk: therisks of investing in mortgage-related and other asset-backed securities,including interest rate risk, extension risk, prepayment risk, and credit risk
Foreign (Non-U.S.) Investment Risk: the risk that investing in foreign(non-U.S.) securities may result in the Portfolio experiencing more rapid andextreme changes in value than a portfolio that invests exclusively insecurities of U.S. companies, due to smaller markets, differing reporting,accounting and auditing standards, increased risk of delayed settlement ofportfolio transactions or loss of certificates of portfolio securities, and therisk of unfavorable foreign government actions, including nationalization,expropriation or confiscatory taxation, currency blockage, or politicalchanges or diplomatic developments. Foreign securities may also be lessliquid and more difficult to value than securities of U.S. issuers
Emerging Markets Risk: the risk of investing in emerging marketsecurities, primarily increased foreign (non-U.S.) investment risk
Sovereign Debt Risk: the risk that investments in fixed incomeinstruments issued by sovereign entities may decline in value as a result ofdefault or other adverse credit event resulting from an issuer’s inability orunwillingness to make principal or interest payments in a timely fashion
Currency Risk: the risk that foreign (non-U.S.) currencies will decline invalue relative to the U.S. dollar and affect the Portfolio’s investments inforeign (non-U.S.) currencies or in securities that trade in, and receiverevenues in, or in derivatives that provide exposure to, foreign (non-U.S.)currencies
Leveraging Risk: the risk that certain transactions of the Portfolio, such asreverse repurchase agreements, loans of portfolio securities, and the use ofwhen-issued, delayed delivery or forward commitment transactions, orderivative instruments, may give rise to leverage, magnifying gains and
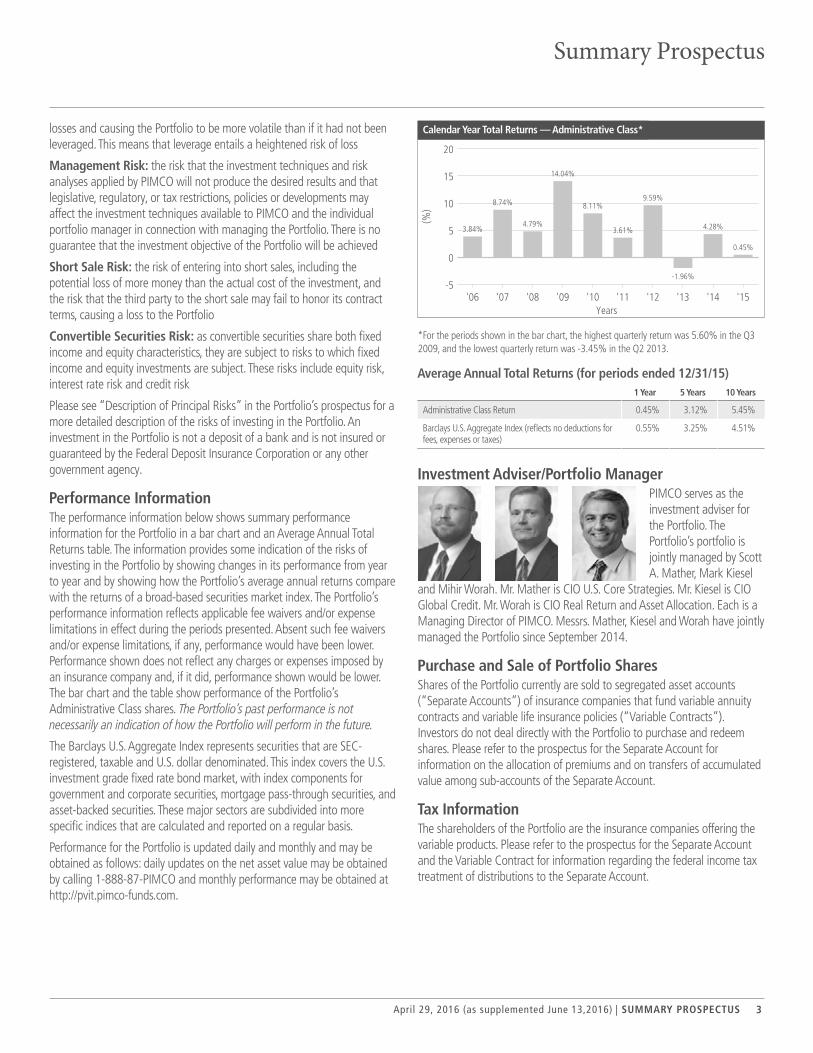
Summary Prospectus
April 29, 2016 (as supplemented June 13,2016)
losses and causing the Portfolio to be more volatile than if it had not beenleveraged. This means that leverage entails a heightened risk of loss
Management Risk: the risk that the investment techniques and riskanalyses applied by PIMCO will not produce the desired results and thatlegislative, regulatory, or tax restrictions, policies or developments mayaffect the investment techniques available to PIMCO and the individualportfolio manager in connection with managing the Portfolio. There is noguarantee that the investment objective of the Portfolio will be achieved
Short Sale Risk: the risk of entering into short sales, including thepotential loss of more money than the actual cost of the investment, andthe risk that the third party to the short sale may fail to honor its contractterms, causing a loss to the Portfolio
Convertible Securities Risk: as convertible securities share both fixedincome and equity characteristics, they are subject to risks to which fixedincome and equity investments are subject. These risks include equity risk,interest rate risk and credit risk
Please see “Description of Principal Risks” in the Portfolio’s prospectus for amore detailed description of the risks of investing in the Portfolio. Aninvestment in the Portfolio is not a deposit of a bank and is not insured orguaranteed by the Federal Deposit Insurance Corporation or any othergovernment agency.
Performance InformationThe performance information below shows summary performanceinformation for the Portfolio in a bar chart and an Average Annual TotalReturns table. The information provides some indication of the risks ofinvesting in the Portfolio by showing changes in its performance from yearto year and by showing how the Portfolio’s average annual returns comparewith the returns of a broad-based securities market index. The Portfolio’sperformance information reflects applicable fee waivers and/or expenselimitations in effect during the periods presented. Absent such fee waiversand/or expense limitations, if any, performance would have been lower.Performance shown does not reflect any charges or expenses imposed byan insurance company and, if it did, performance shown would be lower.The bar chart and the table show performance of the Portfolio’sAdministrative Class shares. The Portfolio’s past performance is notnecessarily an indication of how the Portfolio will perform in the future.
The Barclays U.S. Aggregate Index represents securities that are SEC-registered, taxable and U.S. dollar denominated. This index covers the U.S.investment grade fixed rate bond market, with index components forgovernment and corporate securities, mortgage pass-through securities, andasset-backed securities. These major sectors are subdivided into morespecific indices that are calculated and reported on a regular basis.
Performance for the Portfolio is updated daily and monthly and may beobtained as follows: daily updates on the net asset value may be obtainedby calling 1-888-87-PIMCO and monthly performance may be obtained athttp://pvit.pimco-funds.com.
Calendar Year Total Returns — Administrative Class*
'06 '07 '08 '09 '10 '11 '12 '13 '14 '15-5
0
5
10
15
20
3.84%
8.74%
4.79%
14.04%
8.11%
3.61%
9.59%
-1.96%
4.28%
0.45%
(%)
Years
*For the periods shown in the bar chart, the highest quarterly return was 5.60% in the Q32009, and the lowest quarterly return was -3.45% in the Q2 2013.
Average Annual Total Returns (for periods ended 12/31/15)1 Year 5 Years 10 Years
Administrative Class Return 0.45% 3.12% 5.45%
Barclays U.S. Aggregate Index (reflects no deductions forfees, expenses or taxes)
0.55% 3.25% 4.51%
Investment Adviser/Portfolio ManagerPIMCO serves as theinvestment adviser forthe Portfolio. ThePortfolio’s portfolio isjointly managed by ScottA. Mather, Mark Kiesel
and Mihir Worah. Mr. Mather is CIO U.S. Core Strategies. Mr. Kiesel is CIOGlobal Credit. Mr. Worah is CIO Real Return and Asset Allocation. Each is aManaging Director of PIMCO. Messrs. Mather, Kiesel and Worah have jointlymanaged the Portfolio since September 2014.
Purchase and Sale of Portfolio SharesShares of the Portfolio currently are sold to segregated asset accounts(“Separate Accounts”) of insurance companies that fund variable annuitycontracts and variable life insurance policies (“Variable Contracts”).Investors do not deal directly with the Portfolio to purchase and redeemshares. Please refer to the prospectus for the Separate Account forinformation on the allocation of premiums and on transfers of accumulatedvalue among sub-accounts of the Separate Account.
Tax InformationThe shareholders of the Portfolio are the insurance companies offering thevariable products. Please refer to the prospectus for the Separate Accountand the Variable Contract for information regarding the federal income taxtreatment of distributions to the Separate Account.
| SUMMARY PROSPECTUS 3

PIMCO Total Return Portfolio
SUMMARY PROSPECTUS | PVIT4
Payments to Insurance Companies and OtherFinancial IntermediariesThe Portfolio and/or its related companies (including PIMCO) may pay theinsurance company and other intermediaries for the sale of the Portfolioand/or other services. These payments may create a conflict of interest byinfluencing the insurance company or intermediary and your salesperson torecommend a Variable Contract and the Portfolio over another investment.Ask your insurance company or salesperson or visit your financialintermediary’s Web site for more information.
PVIT0331S_061316
LV612PCS-10 Accompanies IPVA old, IPVA new, Pivot, EVUL, BVUL, EVUL 2, BVUL 2

Summary prospectus of the Trust�1
Before you invest, you may wish to review the fund’s prospectus, which contains more information about the fund and its risks. You may obtain the prospectus and other information about the fund, including the statement of additional information (SAI) and most recent reports to shareholders, at no cost by visiting putnam.com/individual/annuities, calling 1-800-225-1581, or e-mailing Putnam at [email protected].
The fund’s prospectus and SAI, both dated 4/30/16, are incorporated by reference into this summary prospectus.
Fund summaryGoalPutnam VT Growth Opportunities Fund seeks capital appreciation.
Fees and expensesThe following table describes the fees and expenses you may pay if you buy and hold shares of the fund. The fees and expenses information does not reflect insurance-related charges or expenses borne by contract holders indirectly investing in the fund. If it did, expenses would be higher.
Annual fund operating expenses
(expenses you pay each year as a percentage of the value of your investment)
Share class
Manage-
ment
fees
Distribution
and service
(12b-1)
fees
Other
expenses
Total
annual
fund
operating
expenses
Expense
reimburse-
ment=
Total
annual
fund
operating
expenses
after
expense
reimburse-
ment
Class IA 0.55% N/A 0.36% 0.91% (0.09%) 0.82%
Class IB 0.55% 0.25% 0.36% 1.16% (0.09%) 1.07%
= Reflects Putnam Investment Management, LLC’s contractual obligation to limit certain fund expenses through 4/30/17. This obligation may be modified or discontinued only with approval of the fund’s Board of Trustees.
Example
The following hypothetical example is intended to help you compare the cost of investing in the fund with the cost of investing in other funds. The example does not reflect insur-ance-related charges or expenses. If it did, expenses would be higher. It assumes that you invest $10,000 in the fund for
the time periods indicated and then redeem or hold all your shares at the end of those periods. It assumes a 5% return on your investment each year and that the fund’s operating expenses remain the same. Only the first year of each period in the example takes into account the expense reimbursement described above. Your actual costs may be higher or lower.
Share class 1 year 3 years 5 years 10 years
Class IA $84 $281 $495 $1,111
Class IB $109 $360 $630 $1,401
Portfolio turnover
The fund pays transaction-related costs, such as commissions, when it buys and sells securities (or “turns over” its portfolio). A higher turnover rate may indicate higher transaction costs. These costs, which are not reflected in annual fund operating expenses or the above example, affect fund performance. The fund’s turnover rate in the most recent fiscal year was 79%.
Investments, risks, and performance
Investments
We invest mainly in common stocks of large U.S. companies, with a focus on growth stocks. Growth stocks are issued by companies whose earnings are expected to grow faster than those of similar firms, and whose business growth and other characteristics may lead to an increase in stock price. We may consider, among other factors, a company’s valuation, finan-cial strength, growth potential, competitive position in its industry, projected future earnings, cash flows and dividends when deciding whether to buy or sell investments.
Risks
It is important to understand that you can lose money by investing in the fund.
The value of stocks in the fund’s portfolio may fall or fail to rise over extended periods of time for a variety of reasons, including both general financial market conditions and factors related to a specific company or industry. Growth stocks may be more susceptible to earnings disappointments, and the market may not favor growth-style investing.
The fund may not achieve its goal, and it is not intended to be a complete investment program. An investment in the fund is not insured or guaranteed by the Federal Deposit Insurance Corporation or any other government agency.
Putnam VT Growth Opportunities Fund
CLASS IA —
CLASS IB —
FUND SYMBOLS Summary prospectus 4 | 30 | 16

2�
Summary prospectus of the Trust
Performance
The performance information below gives some indication of the risks associated with an investment in the fund by showing the fund’s performance year to year and over time. The performance information does not reflect insurance-related charges or expenses. If it did, performance would be lower. Please remember that past performance is not necessarily an indication of future results.
Annual total returns for class IA shares
36.55%
8.75%5.82%
–37.63%
41.26%
2013 20142006 2007 2008 2009 2010
17.57%
2011 2012
–3.86%
17.85%14.16%
1.28%
2015
Year-to- date per-formance through 3/31/16
–1.99%
Best calendar quarter Q1 12
18.22%
Worst calendar quarter Q4 08
–21.27%
Average annual total returns
(for periods ending 12/31/15)
Share class 1 year 5 years 10 years
Class IA 1.28% 12.34% 7.87%
Class IB 1.03% 12.05% 7.60%
Russell 1000 Growth Index (no deduction for fees or expenses) 5.67% 13.53% 8.53%
Your fund’s management
Investment advisor
Putnam Investment Management, LLC
Portfolio manager
Robert Brookby, Portfolio Manager, portfolio manager of the fund since 2009
Purchase and sale of fund shares
Fund shares are offered to separate accounts of various insurers. The fund requires no minimum investment, but insurers may require minimum investments from those purchasing variable insurance products for which the fund is an underlying investment option. Insurers may purchase or sell shares on behalf of separate accounts by submitting an order to Putnam Retail Management any day the New York Stock Exchange (NYSE) is open. Some restrictions may apply.
Tax information
Generally, owners of variable insurance contracts are not taxed currently on income or gains realized with respect to such contracts. However, some distributions from such contracts may be taxable at ordinary income tax rates and distributions to contract owners younger than 59½ may be subject to a 10% penalty tax. For more information, please see the prospectus (or other offering document) for your variable insurance contract.
Payments to insurance companies
The fund is offered as an underlying investment option for vari-able insurance contracts. The fund and its related companies may make payments to the sponsoring insurance company (or its affiliates) and dealers for distribution and/or other services. These payments may create an incentive for the insurance company to include the fund, rather than another invest-ment, as an option in its products and may create a conflict of interest for dealers in recommending the fund over another investment. The prospectus (or other offering document) for your variable insurance contract may contain additional information about these payments.
Additional information is available at putnam.com/individual/annuities, by calling 1-800-225-1581, or by e-mailing Putnam at [email protected].
File No. 811-05346 VTBP061 300457 4/16
LV858PTS-02 Accompanies all VL Prospectuses

PRINCIPAL BENEFIT VARIABLE UNIVERSAL LIFE II
VARIABLE UNIVERSAL LIFE INSURANCE POLICY
Issued by Principal Life Insurance Company (the “Company”) through its
Principal Life Insurance Company Variable Life Separate Account
This prospectus is dated May 1, 2016.
This prospectus describes an individual flexible variable universal life insurance policy offered by the Company.
As in the case of other life insurance policies, it may not be in your best interest to buy this Policy as a replacement for, or in addition to, existing insurance coverage. The Policy involves investment risk, including possible loss of principal.
This prospectus provides information that you should know before buying a Policy. It is accompanied by current prospectuses for the underlying mutual funds that are available as investment options under the Policy. Please read these prospectuses carefully and keep them for future reference.
The Securities and Exchange Commission (“SEC”) has not approved or disapproved this security or determined if this prospectus is truthful or complete. Any representation to the contrary is a criminal offense.
Not all the benefits, programs, features and investment options described in this prospectus are available or approved for use in every state. This prospectus offers a Policy which may not be available in all states and is not an offer to sell or solicitation of an offer to buy the Policy in states in which the offer or solicitation may not be lawfully made. No person is authorized to give any information or to make any representation in connection with this Policy other than those contained in this prospectus.

2
TABLE OF CONTENTS
PageSUMMARY: BENEFITS AND RISKS . . . . . . . . . . . . . . . . . . . . . . . . . . . . . . . . . . . . . . . . . . . . . . . . . 4POLICY BENEFITS . . . . . . . . . . . . . . . . . . . . . . . . . . . . . . . . . . . . . . . . . . . . . . . . . . . . . . . . . . . . . . 4
Death Benefits and Proceeds . . . . . . . . . . . . . . . . . . . . . . . . . . . . . . . . . . . . . . . . . . . . . . . . . . . . . 4Premium Payment Flexibility . . . . . . . . . . . . . . . . . . . . . . . . . . . . . . . . . . . . . . . . . . . . . . . . . . . . . . 4Policy Values . . . . . . . . . . . . . . . . . . . . . . . . . . . . . . . . . . . . . . . . . . . . . . . . . . . . . . . . . . . . . . . . . 4Adjustment Options . . . . . . . . . . . . . . . . . . . . . . . . . . . . . . . . . . . . . . . . . . . . . . . . . . . . . . . . . . . . 4Maturity Proceeds . . . . . . . . . . . . . . . . . . . . . . . . . . . . . . . . . . . . . . . . . . . . . . . . . . . . . . . . . . . . . . 5
POLICY RISKS . . . . . . . . . . . . . . . . . . . . . . . . . . . . . . . . . . . . . . . . . . . . . . . . . . . . . . . . . . . . . . . . . . 5Risks of Poor Investment Performance . . . . . . . . . . . . . . . . . . . . . . . . . . . . . . . . . . . . . . . . . . . . . . 5Policy Termination (Lapse) . . . . . . . . . . . . . . . . . . . . . . . . . . . . . . . . . . . . . . . . . . . . . . . . . . . . . . . 5Limitations on Access to Surrender Value. . . . . . . . . . . . . . . . . . . . . . . . . . . . . . . . . . . . . . . . . . . . 5Adverse Tax Consequences . . . . . . . . . . . . . . . . . . . . . . . . . . . . . . . . . . . . . . . . . . . . . . . . . . . . . . 5Risks of Underlying Mutual Funds . . . . . . . . . . . . . . . . . . . . . . . . . . . . . . . . . . . . . . . . . . . . . . . . . 6
SUMMARY: FEE TABLES. . . . . . . . . . . . . . . . . . . . . . . . . . . . . . . . . . . . . . . . . . . . . . . . . . . . . . . . . . 7GLOSSARY . . . . . . . . . . . . . . . . . . . . . . . . . . . . . . . . . . . . . . . . . . . . . . . . . . . . . . . . . . . . . . . . . . . . 10CORPORATE ORGANIZATION AND OPERATION . . . . . . . . . . . . . . . . . . . . . . . . . . . . . . . . . . . . . . 12CHARGES AND DEDUCTIONS . . . . . . . . . . . . . . . . . . . . . . . . . . . . . . . . . . . . . . . . . . . . . . . . . . . . . 14
Premium Expense Charge (Sales Charge and Taxes) . . . . . . . . . . . . . . . . . . . . . . . . . . . . . . . . . . 14Surrender Charge . . . . . . . . . . . . . . . . . . . . . . . . . . . . . . . . . . . . . . . . . . . . . . . . . . . . . . . . . . . . . . 14Transaction Fee for Unscheduled Partial Surrender . . . . . . . . . . . . . . . . . . . . . . . . . . . . . . . . . . . . 15Transfer Fee for Unscheduled Division Transfer . . . . . . . . . . . . . . . . . . . . . . . . . . . . . . . . . . . . . . . 15Monthly Policy Charge . . . . . . . . . . . . . . . . . . . . . . . . . . . . . . . . . . . . . . . . . . . . . . . . . . . . . . . . . . 15Net Policy Loan Charge . . . . . . . . . . . . . . . . . . . . . . . . . . . . . . . . . . . . . . . . . . . . . . . . . . . . . . . . . 17Underlying Mutual Fund Charges . . . . . . . . . . . . . . . . . . . . . . . . . . . . . . . . . . . . . . . . . . . . . . . . . . 17
GENERAL DESCRIPTION OF THE POLICY . . . . . . . . . . . . . . . . . . . . . . . . . . . . . . . . . . . . . . . . . . . 17The Contract . . . . . . . . . . . . . . . . . . . . . . . . . . . . . . . . . . . . . . . . . . . . . . . . . . . . . . . . . . . . . . . . . . 17Rights under the Policy . . . . . . . . . . . . . . . . . . . . . . . . . . . . . . . . . . . . . . . . . . . . . . . . . . . . . . . . . . 17Policy Limitations . . . . . . . . . . . . . . . . . . . . . . . . . . . . . . . . . . . . . . . . . . . . . . . . . . . . . . . . . . . . . . 18Optional Insurance Benefits . . . . . . . . . . . . . . . . . . . . . . . . . . . . . . . . . . . . . . . . . . . . . . . . . . . . . . 20Right to Exchange . . . . . . . . . . . . . . . . . . . . . . . . . . . . . . . . . . . . . . . . . . . . . . . . . . . . . . . . . . . . . 22Suicide . . . . . . . . . . . . . . . . . . . . . . . . . . . . . . . . . . . . . . . . . . . . . . . . . . . . . . . . . . . . . . . . . . . . . . 23Delay of Payments or Transfers . . . . . . . . . . . . . . . . . . . . . . . . . . . . . . . . . . . . . . . . . . . . . . . . . . . 23
PREMIUMS . . . . . . . . . . . . . . . . . . . . . . . . . . . . . . . . . . . . . . . . . . . . . . . . . . . . . . . . . . . . . . . . . . . . . 23Payment of Premiums . . . . . . . . . . . . . . . . . . . . . . . . . . . . . . . . . . . . . . . . . . . . . . . . . . . . . . . . . . . 23Premiums Affecting Guarantee Provisions . . . . . . . . . . . . . . . . . . . . . . . . . . . . . . . . . . . . . . . . . . . 24Premium Limitations . . . . . . . . . . . . . . . . . . . . . . . . . . . . . . . . . . . . . . . . . . . . . . . . . . . . . . . . . . . . 25Allocation of Premiums . . . . . . . . . . . . . . . . . . . . . . . . . . . . . . . . . . . . . . . . . . . . . . . . . . . . . . . . . . 25
DEATH BENEFITS AND POLICY VALUES . . . . . . . . . . . . . . . . . . . . . . . . . . . . . . . . . . . . . . . . . . . . 27Death Proceeds . . . . . . . . . . . . . . . . . . . . . . . . . . . . . . . . . . . . . . . . . . . . . . . . . . . . . . . . . . . . . . . 27Death Benefit Options . . . . . . . . . . . . . . . . . . . . . . . . . . . . . . . . . . . . . . . . . . . . . . . . . . . . . . . . . . . 28Change in Death Benefit Option . . . . . . . . . . . . . . . . . . . . . . . . . . . . . . . . . . . . . . . . . . . . . . . . . . . 28IRS Definition of Life Insurance . . . . . . . . . . . . . . . . . . . . . . . . . . . . . . . . . . . . . . . . . . . . . . . . . . . 30Maturity Proceeds . . . . . . . . . . . . . . . . . . . . . . . . . . . . . . . . . . . . . . . . . . . . . . . . . . . . . . . . . . . . . . 31Adjustment Options . . . . . . . . . . . . . . . . . . . . . . . . . . . . . . . . . . . . . . . . . . . . . . . . . . . . . . . . . . . . 31Policy Values . . . . . . . . . . . . . . . . . . . . . . . . . . . . . . . . . . . . . . . . . . . . . . . . . . . . . . . . . . . . . . . . . 32

3
PageSURRENDERS AND PARTIAL SURRENDERS . . . . . . . . . . . . . . . . . . . . . . . . . . . . . . . . . . . . . . . . . 32
Surrenders . . . . . . . . . . . . . . . . . . . . . . . . . . . . . . . . . . . . . . . . . . . . . . . . . . . . . . . . . . . . . . . . . . . 32Examination Offer (Free-Look Provision) . . . . . . . . . . . . . . . . . . . . . . . . . . . . . . . . . . . . . . . . . . . . 34
LOANS . . . . . . . . . . . . . . . . . . . . . . . . . . . . . . . . . . . . . . . . . . . . . . . . . . . . . . . . . . . . . . . . . . . . . . . . 34Policy Loans . . . . . . . . . . . . . . . . . . . . . . . . . . . . . . . . . . . . . . . . . . . . . . . . . . . . . . . . . . . . . . . . . . 34Loan Account . . . . . . . . . . . . . . . . . . . . . . . . . . . . . . . . . . . . . . . . . . . . . . . . . . . . . . . . . . . . . . . . . 35Loan Payments . . . . . . . . . . . . . . . . . . . . . . . . . . . . . . . . . . . . . . . . . . . . . . . . . . . . . . . . . . . . . . . . 35
POLICY TERMINATION AND REINSTATEMENT. . . . . . . . . . . . . . . . . . . . . . . . . . . . . . . . . . . . . . . . 36Policy Termination (Lapse) . . . . . . . . . . . . . . . . . . . . . . . . . . . . . . . . . . . . . . . . . . . . . . . . . . . . . . . 36Reinstatement . . . . . . . . . . . . . . . . . . . . . . . . . . . . . . . . . . . . . . . . . . . . . . . . . . . . . . . . . . . . . . . . . 37
TAX ISSUES RELATED TO THE POLICY . . . . . . . . . . . . . . . . . . . . . . . . . . . . . . . . . . . . . . . . . . . . . 38GENERAL PROVISIONS . . . . . . . . . . . . . . . . . . . . . . . . . . . . . . . . . . . . . . . . . . . . . . . . . . . . . . . . . . 40
Frequent Trading and Market-Timing (Abusive Trading Practices) . . . . . . . . . . . . . . . . . . . . . . . . . 40Purchase Procedures . . . . . . . . . . . . . . . . . . . . . . . . . . . . . . . . . . . . . . . . . . . . . . . . . . . . . . . . . . . 41Special Purchase Plans . . . . . . . . . . . . . . . . . . . . . . . . . . . . . . . . . . . . . . . . . . . . . . . . . . . . . . . . . 42Distribution of the Policy . . . . . . . . . . . . . . . . . . . . . . . . . . . . . . . . . . . . . . . . . . . . . . . . . . . . . . . . . 42Payments to Financial Intermediaries . . . . . . . . . . . . . . . . . . . . . . . . . . . . . . . . . . . . . . . . . . . . . . . 43Service Arrangements and Compensation . . . . . . . . . . . . . . . . . . . . . . . . . . . . . . . . . . . . . . . . . . . 43Statement of Values . . . . . . . . . . . . . . . . . . . . . . . . . . . . . . . . . . . . . . . . . . . . . . . . . . . . . . . . . . . . 43Services Available via the Telephone . . . . . . . . . . . . . . . . . . . . . . . . . . . . . . . . . . . . . . . . . . . . . . . 43Misstatement of Age or Gender . . . . . . . . . . . . . . . . . . . . . . . . . . . . . . . . . . . . . . . . . . . . . . . . . . . 44Non-Participating Policy . . . . . . . . . . . . . . . . . . . . . . . . . . . . . . . . . . . . . . . . . . . . . . . . . . . . . . . . . 44Incontestability . . . . . . . . . . . . . . . . . . . . . . . . . . . . . . . . . . . . . . . . . . . . . . . . . . . . . . . . . . . . . . . . 44Independent Registered Public Accounting Firm . . . . . . . . . . . . . . . . . . . . . . . . . . . . . . . . . . . . . . 44
LEGAL PROCEEDINGS . . . . . . . . . . . . . . . . . . . . . . . . . . . . . . . . . . . . . . . . . . . . . . . . . . . . . . . . . . . 44TABLE OF SEPARATE ACCOUNT DIVISIONS . . . . . . . . . . . . . . . . . . . . . . . . . . . . . . . . . . . . . . . . . 45APPENDIX A - SURRENDER CHARGE RATE TABLE. . . . . . . . . . . . . . . . . . . . . . . . . . . . . . . . . . . . 62APPENDIX B - SURRENDER CHARGE PERCENTAGE TABLE. . . . . . . . . . . . . . . . . . . . . . . . . . . . 65APPENDIX C - TARGET PREMIUM RATES. . . . . . . . . . . . . . . . . . . . . . . . . . . . . . . . . . . . . . . . . . . . 69APPENDIX D - APPLICABLE PERCENTAGES (FOR LIFE INSURANCE DEFINITION TEST). . . . . 75ADDITIONAL INFORMATION . . . . . . . . . . . . . . . . . . . . . . . . . . . . . . . . . . . . . . . . . . . . . . . . . . . . . . . 85
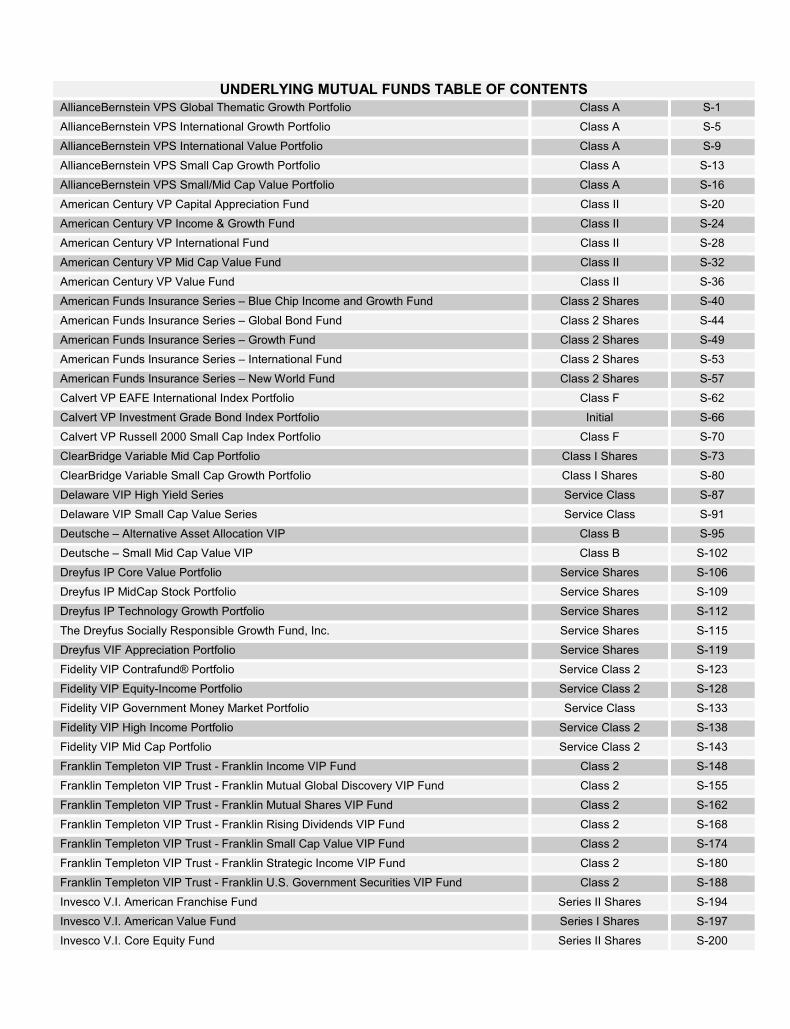
UNDERLYING MUTUAL FUNDS TABLE OF CONTENTSAllianceBernstein VPS Global Thematic Growth Portfolio Class A S-1
AllianceBernstein VPS International Growth Portfolio Class A S-5
AllianceBernstein VPS International Value Portfolio Class A S-9
AllianceBernstein VPS Small Cap Growth Portfolio Class A S-13
AllianceBernstein VPS Small/Mid Cap Value Portfolio Class A S-16
American Century VP Capital Appreciation Fund Class II S-20
American Century VP Income & Growth Fund Class II S-24
American Century VP International Fund Class II S-28
American Century VP Mid Cap Value Fund Class II S-32
American Century VP Value Fund Class II S-36
American Funds Insurance Series – Blue Chip Income and Growth Fund Class 2 Shares S-40
American Funds Insurance Series – Global Bond Fund Class 2 Shares S-44
American Funds Insurance Series – Growth Fund Class 2 Shares S-49
American Funds Insurance Series – International Fund Class 2 Shares S-53
American Funds Insurance Series – New World Fund Class 2 Shares S-57
Calvert VP EAFE International Index Portfolio Class F S-62
Calvert VP Investment Grade Bond Index Portfolio Initial S-66
Calvert VP Russell 2000 Small Cap Index Portfolio Class F S-70
ClearBridge Variable Mid Cap Portfolio Class I Shares S-73
ClearBridge Variable Small Cap Growth Portfolio Class I Shares S-80
Delaware VIP High Yield Series Service Class S-87
Delaware VIP Small Cap Value Series Service Class S-91
Deutsche – Alternative Asset Allocation VIP Class B S-95
Deutsche – Small Mid Cap Value VIP Class B S-102
Dreyfus IP Core Value Portfolio Service Shares S-106
Dreyfus IP MidCap Stock Portfolio Service Shares S-109
Dreyfus IP Technology Growth Portfolio Service Shares S-112
The Dreyfus Socially Responsible Growth Fund, Inc. Service Shares S-115
Dreyfus VIF Appreciation Portfolio Service Shares S-119
Fidelity VIP Contrafund® Portfolio Service Class 2 S-123
Fidelity VIP Equity-Income Portfolio Service Class 2 S-128
Fidelity VIP Government Money Market Portfolio Service Class S-133
Fidelity VIP High Income Portfolio Service Class 2 S-138
Fidelity VIP Mid Cap Portfolio Service Class 2 S-143
Franklin Templeton VIP Trust - Franklin Income VIP Fund Class 2 S-148
Franklin Templeton VIP Trust - Franklin Mutual Global Discovery VIP Fund Class 2 S-155
Franklin Templeton VIP Trust - Franklin Mutual Shares VIP Fund Class 2 S-162
Franklin Templeton VIP Trust - Franklin Rising Dividends VIP Fund Class 2 S-168
Franklin Templeton VIP Trust - Franklin Small Cap Value VIP Fund Class 2 S-174
Franklin Templeton VIP Trust - Franklin Strategic Income VIP Fund Class 2 S-180
Franklin Templeton VIP Trust - Franklin U.S. Government Securities VIP Fund Class 2 S-188
Invesco V.I. American Franchise Fund Series II Shares S-194
Invesco V.I. American Value Fund Series I Shares S-197
Invesco V.I. Core Equity Fund Series II Shares S-200

Invesco V.I. Global Health Care Fund Series I Shares S-203
Invesco V.I. Global Real Estate Fund Series I Shares S-206
Invesco V.I. International Growth Fund Series I Shares S-210
Invesco V.I. Mid Cap Core Equity Fund Series II Shares S-213
Invesco V.I. Mid Cap Growth Fund Series I Shares S-216
Invesco V.I. Small Cap Equity Fund Series I Shares S-219
Janus Aspen Series Balanced Portfolio Service Shares S-221
Janus Aspen Series Enterprise Portfolio Service Shares S-226
Janus Aspen Series Flexible Bond Portfolio Service Shares S-230
Janus Aspen Series Forty Portfolio Service Shares S-235
Janus Aspen Series Global Research Portfolio Service Shares S-239
Lord Abbett Series Fund Developing Growth Portfolio Class VC S-244
Lord Abbett Series Fund International Opportunities Portfolio Class VC S-253
MFS® Blended Research® Small Cap Equity Portfolio Service Class S-263
MFS® Global Equity Series Service Class S-266
MFS® Growth Series Service Class S-269
MFS® Inflation-Adjusted Bond Portfolio Service Class S-272
MFS® International Value Portfolio Service Class S-275
MFS® Mid Cap Value Portfolio Service Class S-278
MFS® New Discovery Series Service Class S-281
MFS® New Discovery Value Portfolio Service Class S-284
MFS® Research International Portfolio Service Class S-287
MFS® Total Return Series Service Class S-290
MFS® Utilities Series Service Class S-293
MFS® Value Series Service Class S-297
Neuberger Berman AMT Guardian Portfolio Class I Shares S-300
Neuberger Berman AMT Large Cap Value Portfolio Class I Shares S-306
Neuberger Berman AMT Mid Cap Growth Portfolio S Class Shares S-312
Oppenheimer Main Street Small Cap Fund®/VA Service Shares S-318
PIMCO VIT All Asset Portfolio Administrative Class S-323
PIMCO VIT CommodityRealReturn® Strategy Portfolio Administrative Class S-329
PIMCO VIT Emerging Markets Bond Portfolio Administrative Class S-333
PIMCO VIT High Yield Portfolio Administrative Class S-337
PIMCO VIT Long-Term U.S. Government Portfolio Administrative Class S-341
PIMCO VIT Low Duration Portfolio Administrative Class S-345
PIMCO VIT Real Return Portfolio Administrative Class S-349
PIMCO VIT Short-Term Portfolio Administrative Class S-353
PIMCO VIT Total Return Portfolio Administrative Class S-357
Principal Variable Contracts Funds - Bond Market Index Account Class 1 Shares S-361
Principal Variable Contracts Funds - Capital Appreciation Account Class 1 Shares S-365
Principal Variable Contracts Funds - Core Plus Bond Account Class 1 Shares S-368
Principal Variable Contracts Funds - Diversified International Account Class 1 Shares S-373
Principal Variable Contracts Funds - Equity Income Account Class 1 Shares S-376
Principal Variable Contracts Funds - Government & High Quality Bond Account Class 1 Shares S-380
Principal Variable Contracts Funds - International Emerging Markets Account Class 1 Shares S-384
Principal Variable Contracts Funds - LargeCap Growth Account Class 1 Shares S-388

Principal Variable Contracts Funds - LargeCap Growth Account I Class 1 Shares S-391
Principal Variable Contracts Funds - LargeCap S&P 500 Index Account Class 1 Shares S-394
Principal Variable Contracts Funds - LargeCap Value Account Class 1 Shares S-398
Principal Variable Contracts Funds - MidCap Account Class 1 Shares S-401
Principal Variable Contracts Funds - Multi-Asset Income Account Class 1 Shares S-405
Principal Variable Contracts Funds - Principal LifeTime 2010 Account Class 1 Shares S-410
Principal Variable Contracts Funds - Principal LifeTime 2020 Account Class 1 Shares S-416
Principal Variable Contracts Funds - Principal LifeTime 2030 Account Class 1 Shares S-422
Principal Variable Contracts Funds - Principal LifeTime 2040 Account Class 1 Shares S-428
Principal Variable Contracts Funds - Principal LifeTime 2050 Account Class 1 Shares S-434
Principal Variable Contracts Funds - Principal LifeTime 2060 Account Class 1 Shares S-440
Principal Variable Contracts Funds - Principal LifeTime Strategic Income Account Class 1 Shares S-446
Principal Variable Contracts Funds - Real Estate Securities Account Class 1 Shares S-452
Principal Variable Contracts Funds - SAM Balanced Portfolio Class 1 Shares S-456
Principal Variable Contracts Funds - SAM Conservative Balanced Portfolio Class 1 Shares S-461
Principal Variable Contracts Funds - SAM Conservative Growth Portfolio Class 1 Shares S-466
Principal Variable Contracts Funds - SAM Flexible Income Portfolio Class 1 Shares S-471
Principal Variable Contracts Funds - SAM Strategic Growth Portfolio Class 1 Shares S-476
Principal Variable Contracts Funds - Short-Term Income Account Class 1 Shares S-481
Principal Variable Contracts Funds - SmallCap Account Class 1 Shares S-485
Putnam VT Voyager Fund Class IB S-488
Franklin Templeton VIP Trust - Templeton Developing Markets VIP Fund Class 2 S-491
Franklin Templeton VIP Trust - Templeton Foreign VIP Fund Class 2 S-497
Franklin Templeton VIP Trust - Templeton Global Bond VIP Fund Class 2 S-504
TOPS® Managed Risk Balanced ETF Portfolio Class 2 S-512
TOPS® Managed Risk Growth ETF Portfolio Class 2 S-516
TOPS® Managed Risk Moderate Growth ETF Portfolio Class 2 S-520
VanEck VIP Trust - Van Eck VIP Global Hard Assets Fund Initial Class Shares S-524
Vanguard VIF - Mid-Cap Index Portfolio S-544
Wanger International S-550

4
SUMMARY: BENEFITS AND RISKS
This prospectus describes an individual flexible variable universal life insurance policy offered by the Company. This is a brief summary of the Policy’s features. More detailed information follows later in this prospectus.
Examination Offer (Free – Look Provision)Under state law, you have the right to return the Policy for any reason during the examination offer period (a “free look”). Please see page 36 of this prospectus for more information.
POLICY BENEFITS
Death Benefits and ProceedsThe Company guarantees to pay a death benefit for as long as the Policy is in force. The death proceeds are paid to the beneficiary(ies) when the insured dies. Death proceeds are calculated as of the date of death of the insured. The amount of the death proceeds is:• the death benefit plus interest (as explained in DEATH BENEFITS AND POLICY VALUES — Death Proceeds);• minus loan indebtedness; • minus any overdue monthly policy charges (Overdue monthly policy charges arise when a Policy is in a grace
period and the net policy value is insufficient to cover the sum of the cost of insurance and of additional benefits provided by any rider plus other policy charges).
Death proceeds are paid in cash or applied under a benefit payment option. The Policy provides for three death benefit options. A death benefit option is elected on the application. Subject to certain conditions, the death benefit option may be changed after the Policy has been issued.
Premium Payment FlexibilityYou may choose the amount and frequency of premium payments (subject to certain limitations).
Policy ValuesThe policy value reflects your premium payments, partial surrenders, policy loans, policy expenses, interest credited to the fixed account and the investment experience of the divisions. There is no guaranteed minimum division value.
Policy LoansA loan may be taken using the Policy as collateral. The maximum loan amount is 90% of the net surrender value.
Full SurrenderThe Policy may be surrendered and any net surrender value paid to the owner. If the full surrender is within ten years of the policy date or a policy face amount increase, a surrender charge is imposed.
Partial SurrenderOn or after the first policy anniversary, a Policy may be partially surrendered and the proceeds paid to the owner. No surrender charge is imposed on a partial surrender; however, a transaction fee of the lesser of $25 or 2% of the amount surrendered is imposed on each unscheduled partial surrender after the second unscheduled partial surrender in a policy year.
Adjustment OptionsThe total face amount may be increased (unless the Policy is in a grace period or if monthly policy charges are being waived under a rider) or decreased.
Total Face Amount IncreaseThe minimum amount of an increase is $10,000 and is subject to our underwriting guidelines in effect at the time the increase is requested.
Total Face Amount DecreaseOn or after the first policy anniversary, a decrease in total face amount may be requested if the request does not decrease the total face amount below $100,000.
5
Maturity ProceedsIf the insured is living on the policy maturity date, we will pay the owner an amount equal to the net surrender value unless the Extended Coverage rider is in effect. Maturity proceeds are paid in cash lump sum or applied under a benefit payment option. The Policy terminates on the policy maturity date unless extended by the Extended Coverage Rider.
POLICY RISKSRisks of Poor Investment PerformanceTransaction costs and policy charges are among the reasons why the Policy is not intended to be a short-term savings vehicle. It is possible that investment performance could cause a loss of the entire amount allocated to the divisions. Without additional premium payments, investment in the fixed account, or a death benefit guarantee rider, it is possible that no death benefit would be paid upon the insured’s death.
Policy Termination (Lapse)A Policy will enter a grace period and is at risk of terminating (meaning you will no longer have any life insurance coverage) if the net policy value on any monthly date is less than the monthly policy charge, unless the Policy has the death benefit guarantee rider and its terms are met. A Policy may be at risk of terminating due to insufficient premium payments, poor investment results, partial surrenders, or loan indebtedness. If a Policy is at risk of terminating, we will notify you that the Policy will terminate without value unless you make a required premium payment by the end of the grace period. A Policy may be reinstated within three years after it has lapsed, subject to certain conditions.
Limitations on Access to Surrender ValueUnscheduled Partial Surrenders• Each unscheduled partial surrender may not be less than $500. Each unscheduled partial surrender may not be
greater than 90% of the net surrender value (as of the effective date of the unscheduled partial surrender).• The policy value will be reduced by the amount of the unscheduled partial surrender plus any transaction fee.• A transaction fee of the lesser of $25 or 2% of the amount surrendered is imposed on each unscheduled partial
surrender after the second unscheduled partial surrender in a policy year.• The total face amount may be reduced by the amount of each unscheduled partial surrender.
Scheduled Partial Surrenders• Partial surrenders may be scheduled on a monthly, quarterly, semiannual, or annual basis.• Each scheduled partial surrender may not be greater than 90% of the net surrender value (as of the effective
date of the scheduled partial surrender).• The policy value will be reduced by the amount of any scheduled partial surrender.• The total face amount may be reduced by the amount of each scheduled partial surrender.
Full SurrendersIf the full surrender is within ten years of the policy date or a policy face amount increase, a surrender charge is imposed.
Adverse Tax ConsequencesTermination of the Policy for any reason other than death of the insured may have adverse tax consequences. If the amount received by the policy owner plus any loan indebtedness exceeds the premiums paid into the Policy, then the excess generally will be treated as taxable income.
Distributions from a Modified Endowment Contract during the life of the insured are taxed as if the Policy is a deferred annuity, therefore partial surrenders and loans may be taxable as ordinary income to the extent there are earnings in the Policy.
In certain employer-sponsored life insurance arrangements, participants may be required to report for income tax purposes one or more of the following:• the value each year of the life insurance protection provided;• an amount equal to any employer-paid premiums; or • some or all of the amount by which the current value exceeds the employer’s interest in the Policy.

6
Participants should consult with the sponsor or the administrator of the plan, and/or with their personal tax or legal adviser, to determine the tax consequences, if any, of their employer-sponsored life insurance arrangements.
There are other tax issues to consider when you own a life insurance policy. These are described in more detail in TAX ISSUES RELATED TO THE POLICY.
Risks of Underlying Mutual FundsA comprehensive discussion of the risks of each underlying mutual fund may be found in the underlying mutual fund’s prospectus. As with all mutual funds, as the value of an underlying mutual fund’s assets rise or fall, the fund’s share price changes. If you sell your units in a division (each of which invests in an underlying mutual fund) when their value is less than the price you paid, you will lose money.
Equity FundsThe biggest risk is that the fund’s returns may vary, and you could lose money. The equity funds are each designed for long-term investors who can accept the risks of investing in a portfolio with significant common stock holdings. Common stocks tend to be more volatile than other investment choices. The value of an underlying mutual fund’s portfolio may decrease if the value of an individual company in the portfolio decreases. The value of an underlying mutual fund’s portfolio could also decrease if the stock market goes down.
Income FundsA fundamental risk of fixed-income securities is that their value will fall if interest rates rise. Since the value of a fixed – income portfolio will generally decrease when interest rates rise, the underlying mutual fund’s share price may likewise decrease. Another fundamental risk associated with fixed-income securities is credit risk, which is the risk that an issuer will be unable to make principal and interest payments when due.
International FundsThe international underlying mutual funds have significant exposure to foreign markets. As a result, their returns and price per share may be affected to a large degree by fluctuations in currency exchange rates or political or economic conditions in a particular country.
General AccountThe Company's general obligations and any guaranteed benefits under the Policy are supported by our general account (and not by the separate account) and are subject to the Company's claims-paying ability. A Policy owner should look to the financial strength of the Company for its claims-paying ability. Assets in the general account are not segregated for the exclusive benefit of any particular Policy or obligation. General account assets are also available to the Company's general creditors and the conduct of its routine business activities, such as the payment of salaries, rent and other ordinary business expenses. For more information about the Company's financial strength, you may review its financial statements and/or check its current rating with one or more of the independent sources that rate insurance companies for their financial strength and stability. Such ratings are subject to change and have no bearing on the performance of the underlying mutual funds.

7
SUMMARY: FEE TABLESThe following tables describe the fees and expenses that you will pay when buying, owning, and surrendering the Policy. The first table describes the fees and expenses that you will pay at the time that you buy, surrender the Policy, or transfer cash value between investment options.
Transaction FeesCharge When Charge is Deducted Amount Deducted
Sales Charge upon receipt of premiumMaximum 6.70% of premium paid(1)
Current 6.70% of premium paid(1)
Taxes (federal, state and local) upon receipt of premiumMaximum 3.25% of premium paidCurrent 3.25% of premium paid
Surrender Charge(full surrender of Policy) from surrender proceeds
Maximum $55.83 per $1,000 of policy face amountMinimum $6.30 per $1,000 of policy face amountCurrent Charge for Representative Insured(The representative insured is a 45-year oldmale in policy year one) $15.81 per $1,000 of policy face amount
Transfer Fee for Unscheduled Division Transfer(2) upon each unscheduled division transfer afterthe first unscheduled division transfer in apolicy month
Maximum $25 per unscheduled division transferCurrent None
Optional Insurance Benefits(3)
Life Paid-Up Rider on the date rider benefit beginsMaximum 13.50% of policy valueCurrent 3.50% of policy value(if Policy is issued with the guideline premium/cash value corridor test)(4)
Current 7.50% of policy value(if the Policy is issued with the cash value accumulation test)(4)

8
The following table describes the fees and expenses that you will pay periodically during the time that you own the Policy, not including underlying mutual fund fees and expenses.
Periodic Charges Other Than Underlying Mutual Fund Operating ExpensesWhen Charge
Charge is Deducted Amount DeductedCost of Insurance(5) monthly
Maximum $83.33 per $1,000 of net amount at risk(6)
Minimum $0.01 per $1,000 of net amount at risk(6)
Current Charge for Representative Insured (Therepresentative insured is a 45 year-old male with a riskclassification of preferred non-tobacco in policy year one)
$0.10 per $1,000 of net amount at risk(6)
Asset Based Charge: monthly equivalent to:
Maximum 0.70% of net policy value per year(7)
Current 0.70% of net policy value per year(7)
Monthly Policy Issue Charge monthlyMaximum $1.09 per $1,000 of total face amountMinimum $0.07 per $1,000 of total face amountCurrent Charge for Representative Insured (Therepresentative insured is a 45 year-old male with a riskclassification of preferred non-tobacco in policy year one)
$0.13 per $1,000 of total face amount
Net Policy Loan Charge(8) annually(accrued daily)
Maximum 1.00% of loan indebtedness per year(7)
Current 1.00% of loan indebtedness per year(7)
Optional Insurance Benefits(3)
Accounting Benefit Rider monthly
Maximum $0.0208 per thousand of base policy face amount(9)
Current $0.0208 per thousand of base policy face amount(9)
Supplemental Benefit Rider monthly(Cost of Supplemental Insurance)(5)
Maximum $83.33 per $1,000 of net amount at risk(6)
Minimum $0.01 per $1,000 of net amount at risk(6)
Current Charge for Representative Insured (Therepresentative insured is a 45 year-old male with a riskclassification of preferred non-tobacco for policy year one)
$0.01 per $1,000 of net amount at risk(6)
Waiver of Monthly Policy Charges Rider
Maximum $0.51 per $1,000 of net amount at risk(6)
Minimum $0.01 per $1,000 of net amount at risk(6)
Current Charge for Representative Insured (Therepresentative insured is a 45-year-old male with a riskclassification of preferred non-tobacco for policy year one)
$0.02 per $1,000 of net amount at risk(6)
Periodic Charges Other Than Underlying Mutual Fund Operating Expenses
ChargeWhen Chargeis Deducted Amount Deducted
Waiver of Specified Premium Rider monthlyMaximum $0.94 per $100 of planned periodic premiumMinimum $0.15 per $100 of planned periodic premiumCurrent Charge for Representative Insured (Therepresentative insured is a 45-year-old male with a riskclassification of preferred non-tobacco for policy year one)
$0.40 per $100 of planned periodic premium
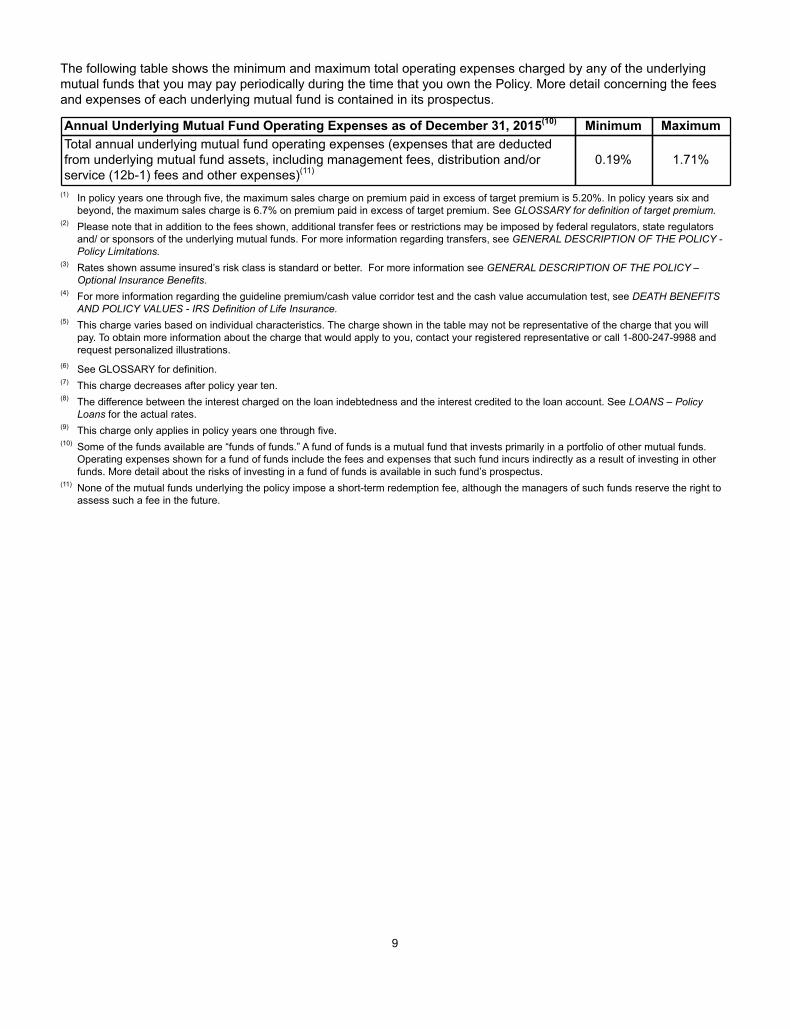
9
The following table shows the minimum and maximum total operating expenses charged by any of the underlying mutual funds that you may pay periodically during the time that you own the Policy. More detail concerning the fees and expenses of each underlying mutual fund is contained in its prospectus.
Annual Underlying Mutual Fund Operating Expenses as of December 31, 2015(10) Minimum MaximumTotal annual underlying mutual fund operating expenses (expenses that are deducted from underlying mutual fund assets, including management fees, distribution and/or service (12b-1) fees and other expenses)(11)
0.19% 1.71%
(1) In policy years one through five, the maximum sales charge on premium paid in excess of target premium is 5.20%. In policy years six and beyond, the maximum sales charge is 6.7% on premium paid in excess of target premium. See GLOSSARY for definition of target premium.
(2) Please note that in addition to the fees shown, additional transfer fees or restrictions may be imposed by federal regulators, state regulators and/ or sponsors of the underlying mutual funds. For more information regarding transfers, see GENERAL DESCRIPTION OF THE POLICY - Policy Limitations.
(3) Rates shown assume insured’s risk class is standard or better. For more information see GENERAL DESCRIPTION OF THE POLICY – Optional Insurance Benefits.
(4) For more information regarding the guideline premium/cash value corridor test and the cash value accumulation test, see DEATH BENEFITS AND POLICY VALUES - IRS Definition of Life Insurance.
(5) This charge varies based on individual characteristics. The charge shown in the table may not be representative of the charge that you will pay. To obtain more information about the charge that would apply to you, contact your registered representative or call 1-800-247-9988 and request personalized illustrations.
(6) See GLOSSARY for definition. (7) This charge decreases after policy year ten.(8) The difference between the interest charged on the loan indebtedness and the interest credited to the loan account. See LOANS – Policy
Loans for the actual rates.(9) This charge only applies in policy years one through five.(10) Some of the funds available are “funds of funds.” A fund of funds is a mutual fund that invests primarily in a portfolio of other mutual funds.
Operating expenses shown for a fund of funds include the fees and expenses that such fund incurs indirectly as a result of investing in other funds. More detail about the risks of investing in a fund of funds is available in such fund’s prospectus.
(11) None of the mutual funds underlying the policy impose a short-term redemption fee, although the managers of such funds reserve the right to assess such a fee in the future.
10
GLOSSARY
adjustment – change to the Policy resulting from an increase or decrease in total face amount or a change in: tobacco status; death benefit option; rating or riders.
adjustment date – the monthly date on or next following the Company’s approval of a requested adjustment.
attained age – the insured’s issue age on the birthday nearest to the policy date, plus the number of full policy years since the policy date.
base policy face amount – the insurance benefit provided by the Policy without any riders.
business day – any date that the New York Stock Exchange (“NYSE”) is open for trading and trading is not restricted.
death benefit guarantee premium requirement – the amount of premium required to be paid in order to maintain the protections of the death benefit guarantee rider.
division – a part of the Separate Account which invests in shares of a corresponding underlying mutual fund. The value of an investment in a division is variable and is not guaranteed. The "money market division" refers to the Fidelity VIP Government Money Market Division.
effective date – the date on which all requirements, including initial premium, for issuance of a policy have been satisfied.
fixed account – the portion of the policy value that is held in our general account.
general account – assets of the Company other than those allocated to any of our Separate Accounts.
initial total face amount – the original total face amount in effect on the policy date.
insured – the person named as the “insured” on the most recent application for the Policy. The insured may or may not be the owner.
loan account – that portion of the policy value held in our general account that reflects loan indebtedness.
loan indebtedness – the amount of any outstanding policy loan(s) and unpaid loan interest.
monthly date – the day of the month which is the same day as the policy date. Example: If the policy date is September 5, 2009, the first monthly date is October 5, 2009.
monthly policy charge – the amount subtracted from the policy value on each monthly date equal to the sum of the cost of insurance and the cost of additional benefits provided by any rider plus the monthly policy issue charge and asset based charge in effect on the monthly date.
net amount at risk – the amount upon which cost of insurance charges are based. It is the result of:• the death benefit (as described in the Policy) at the beginning of the policy month, divided by 1.0024663; minus• the policy value at the beginning of the policy month calculated as if the monthly policy charge was zero.
net policy value – the policy value minus any loan indebtedness.
net premium – the gross premium less the deductions for the premium expense charge. It is the amount of premium allocated to the divisions and/or the fixed account.
net surrender value – surrender value minus any loan indebtedness.
notice – any form of communication received in our home office which provides the information we need which may be in writing sent to us by mail or another manner we approve in advance. In states where permitted, we will require You to use the form(s) We provide for certain Notices along with required supporting documentation, including, for example, for a policy surrender, a change of beneficiary, or a request to adjust Your policy.

11
owner – the party which owns all the rights and privileges of this Policy.
planned periodic premium – the premium in the amount and frequency you plan to pay.
policy date – the date from which monthly dates, policy years and policy anniversaries are determined; the policy date may not be in the future and will never be the 29th, 30th, or 31st of any month.
policy maturity date – the policy anniversary nearest the insured’s 121st birthday.
policy month – any one – month period beginning on the monthly date. Example: The monthly date is May 5, 2009; the first policy month ends on June 4, 2009.
policy value – the sum of the values in the divisions, the fixed account and the loan account.
policy year – the one – year period beginning on the policy date and ending one day before the policy anniversary and each subsequent one year period beginning on a policy anniversary.
Example: If the policy date is September 5, 2009, the first policy year ends on September 4, 2010. The first policy anniversary falls on September 5, 2010.
premium expense charge – the charge deducted from premium payments to cover a sales charge and state, local and federal taxes.
prorated basis – is the proportion that the value of a particular division or the fixed account bears to the total value of all divisions and the fixed account.
separate account – the Principal Life Insurance Company Variable Life Separate Account, an account established by us which has divisions to which net premiums may be allocated under the Policy.
surrender value – policy value minus any surrender charge.
target premium – a premium amount which is used to determine the premium expense charge under a Policy. The target premium is not required to be paid and may be calculated using the rates provided in Appendix C.
total face amount – base policy face amount plus face amount of the supplemental benefit rider, if any.
underlying mutual fund – a registered open-end investment company, or a separate investment account or portfolio thereof, in which a division invests.
unit – the accounting measure used to calculate the value of each division.
valuation period – the period begins at the close of normal trading on the NYSE, generally 4:00 p.m. E.T. on each business day, and ends at the close of normal trading of the NYSE on the next business day.
written request – actual delivery to the Company at our home office of a written notice or request, signed and dated, on a form we supply or approve.
Your notices may be mailed to us at: Principal Life Insurance CompanyP.O. Box 10431Des Moines, Iowa 50306-0431Phone: 1-800-247-9988Fax: 1-866-885-0390
we, us, our – Principal Life Insurance Company. We are also referred to throughout this prospectus as the Company.
you, your – the owner of the Policy.
12
CORPORATE ORGANIZATION AND OPERATIONThe CompanyThe Company is a stock life insurance company with its home office at: Principal Financial Group, 711 High Street, Des Moines, Iowa 50392. It is authorized to transact life and annuity business in all of the United States and the District of Columbia. The Company is a wholly owned subsidiary of Principal Financial Services, Inc., which in turn, is a directly wholly owned subsidiary of Principal Financial Group, Inc.
On June 24, 1879, the Company was incorporated under Iowa law as a mutual life insurance company named Bankers Life Association. It changed its name to Bankers Life Company in 1911 and then to Principal Mutual Life Insurance Company in 1986. The name change to Principal Life Insurance Company and reorganization into a mutual holding company structure took place July 1, 1998. Effective October 26, 2001, Principal Mutual Holding Company converted to a stock company and Principal Financial Group, Inc. completed its initial public offering.
The Company believes that, consistent with well established industry and SEC practice, the periodic reporting requirements of the Securities and Exchange Act of 1934 do not apply to it as the depositor of one or more variable insurance product separate accounts. If such requirements are deemed to apply to it as such a depositor, the Company intends to rely on the exemption from such requirements provided by Rule 12h-7 under that Act.
Principal Life Insurance Company Variable Life Separate AccountThe Separate Account was established under Iowa law on November 2, 1987. It was then registered as a unit investment trust with the SEC. This registration does not involve SEC supervision of the investments or investment policies of the Separate Account.
The income, gains, and losses, whether or not realized, credited to or charged against the Separate Account reflect the Separate Account’s own investment experience and not the investment experience of the Company’s other assets. Assets of the Separate Account may not be used to pay any liabilities of the Company other than those arising from the policies funded by the Separate Account. The Company is obligated to pay all amounts promised to Policy owners under the Policy.
The Company does not guarantee the investment results of the Separate Account. There is no assurance that the value of your policy will equal the total of your premium payments.
In a low interest rate environment, yields for the money market division, after deduction of all applicable Policy and rider charges, may be negative even though the yield for the underlying money market fund, before deducting for such charges, is positive. If you allocate a portion of your policy value to a money market division or participate in a scheduled automatic transfer program where policy value is allocated to a money market division, that portion of your policy value allocated to the money market division may decrease in value.
The FundsThe assets of each division of the Separate Account invest in a corresponding underlying mutual fund. The Company purchases and sells fund shares for the Separate Account at their net asset value. The assets of each division are separate from the others. A division’s performance has no effect on the investment performance of any other division.
The funds are mutual funds registered under the Investment Company Act of 1940 as open-end management investment companies. A full description of the funds, their investment objectives, policies and restrictions, charges and expenses and other operational information is contained in the attached prospectuses (which should be read carefully before investing). Additional copies of these documents are available without charge from a registered representative or our home office (1-800-247-9988). A fund's summary prospectus also includes information on how to obtain such fund's full statutory prospectus.
The funds are NOT available to the general public directly. The funds are available only as investment options in variable life insurance policies or variable annuity contracts issued by life insurance companies and qualified plans. Some of the funds have been established by investment advisers that manage publicly traded mutual funds having similar names and investment objectives. While some of the funds may be similar to, and may in fact be modeled after publicly traded mutual funds, you should understand that the funds are not otherwise directly related to any publicly traded mutual fund. Consequently, the investment performance of any underlying mutual fund may differ substantially from the investment performance of a publicly traded mutual fund.
The TABLE OF SEPARATE ACCOUNT DIVISIONS later in this prospectus contains a brief summary of the investment objectives of, and advisor and sub-advisor(s), if applicable, for each underlying mutual fund.

13
New divisions may be added and made available. Divisions may also be eliminated from the Separate Account following approval from appropriate regulatory authority.
Deletion or Substitution of DivisionsWe reserve the right to make certain changes if, in our judgment, they best serve your interests or are appropriate in carrying out the purpose of the Policy. Any changes are made only to the extent and in the manner permitted by applicable laws. Also, when required by law, we will obtain your approval of the changes and approval from any appropriate regulatory authority. Approvals may not be required in all cases. Examples of the changes we may make include:• transfer assets in any division to another division; • add, combine or eliminate divisions; or • substitute the shares of a division for shares in another division:
• if shares of a division are no longer available for investment; or• if in our judgment, investment in a division becomes inappropriate considering the purposes of the division.
If we eliminate or combine existing divisions or transfer assets from one division to another, you may change allocation percentages and transfer any value in an affected division to another division(s) without charge. You may exercise this transfer privilege until the later of 60 days after a) the effective date of the change, or b) the date you receive notice of the options available. You may only exercise this right if you have an interest in the affected division(s).
Voting RightsWe vote shares of the underlying mutual funds owned by the Separate Account according to the instructions of Policy owners.
We will notify you of shareholder meetings of the mutual funds underlying the divisions in which you hold units. We will send you proxy materials and instructions for you to provide voting instructions to us. We will arrange for the handling and tallying of proxies received from you and other Policy owners. If you give no voting instructions, we will vote those shares in the same proportion as shares for which we received instructions.
We determine the number of fund shares that you may instruct us to vote by allocating one vote for each $100 of policy value in the division. Fractional votes are allocated for amounts less than $100. We determine the number of underlying fund shares you may instruct us to vote as of the record date established by the mutual fund for its shareholder meeting. In the event that applicable law changes or we are required by regulators to disregard voting instructions, we may decide to vote the shares of the underlying mutual funds in our own right.
NOTE: Because there is no required minimum number of votes a small number of votes can have a disproportionate effect.
The Fixed AccountThe fixed account is a part of our general account. Because of exemptions and exclusions contained in the Securities Act of 1933 and the Investment Company Act of 1940, the fixed account, and any interest in it, is not subject to the provisions of these acts. As a result the SEC has not reviewed the disclosures in this prospectus relating to the fixed account. However, disclosures relating to it are subject to generally applicable provisions of the federal securities laws relating to the accuracy and completeness of statements made in prospectuses. You may obtain more information regarding the fixed account from our home office or from a registered representative.
Our obligations with respect to the fixed account are supported by our general account. Subject to applicable law, we have sole discretion over the investment of assets in the general account.
We guarantee that the fixed account value accrues interest daily at an effective annual rate of 3% compounded annually. We may, in our sole discretion, credit interest at a higher rate.
We may defer payments of proceeds payable out of the fixed account for a period of up to six months.
14
Our underwriting guidelines prohibit fixed account values in related policies* to exceed $20 million without our prior approval. In addition, without our prior approval, in each calendar year no more than $5 million of net premium payment allocations and/or transfers to the fixed accounts may be made by related policies. In the absence of your instructions, we will refund the premium payment to the owner and/or reject the transfer instructions which would otherwise cause these limits to be exceeded.
* Related policies are those owned and/or sponsored by a single entity (for example, the employer of the insureds). We determine what policies are related.
We reserve the right to limit premium payments and/or transfers allocated to the fixed account.
CHARGES AND DEDUCTIONSWe make certain charges and deductions to support operation of the Policy and the Separate Account. Some charges are deducted from premium payments when they are received. Other charges are deducted on a monthly basis while others are deducted at the time a Policy is surrendered or terminated. These charges are intended to cover distribution expenses (commissions paid to registered representatives, advertising, and printing of prospectuses), administrative expenses (processing applications; conducting medical examinations; determining insurability; establishing and maintaining records; processing death benefit claims and policy changes, reporting and overhead), and mortality expenses.
The amount of the charges in any policy year may not specifically correspond to the expenses for that year. We expect to recover our total expenses over the life of the Policies. To the extent that the charges do not cover total expenses for a policy year, we bear the loss. Conversely, if the aggregate amount of the charges deducted is more than our costs for a policy year, the excess is profit to the Company.
Premium Expense Charge (Sales Charge and Taxes)When we receive your premium payment, we deduct a premium expense charge. The sales charge is intended to pay us for distribution and other expenses related to sales of the policy, including commissions paid to registered representatives, advertising, and printing of prospectuses and sales literature.
Deductions from premiums equal: • In policy years one through five, a sales charge of 6.70% of premiums paid up to target premium and 5.20% of
premiums paid in excess of target premium*. In policy years six and beyond, a sales charge of 6.70% of premiums paid.* The target premium is based on the gender, if applicable, age and risk classification of the insured (see
APPENDIX C-TARGET PREMIUM RATES). The target premium is a calculated premium amount used to determine the sales charge. The target premium is not required to be paid.
• plus 1.25% of premiums paid for federal taxes. • plus 2.00% of premiums paid for state and local taxes**.
** The actual taxes we pay vary from state to state. The expense charge is based upon the average tax rate we expect to pay nationwide, the premiums we receive from all states and other expense assumptions. The rate for a particular Policy does not necessarily reflect the actual tax costs applicable to that Policy.
Surrender ChargeA surrender charge is imposed upon full surrender of the Policy within ten years of the policy date or of a base policy face amount increase. In addition, if you reinstate your Policy and then it is fully surrendered, a surrender charge may be imposed. The surrender charge compensates us for expenses related to the sale of the Policy.
Surrender charges vary based on gender, age at issue or adjustment, state of issue and number of policy years since issue or adjustment. The charge applies only during the first ten policy years unless there is a base policy face amount increase. A base policy face amount increase has its own surrender charge period that begins on the adjustment date. The total surrender charge on the Policy is the sum of the surrender charges for the base policy face amount at issue and each base policy face amount increase. Therefore, if the Policy is surrendered after a base policy face amount increase, surrender charges applied will be higher than if no base policy face amount increase had occurred. The surrender charge is not affected by any decrease in base policy face amount or any change in base policy face amount resulting from a change of death benefit options.

15
The surrender charge is (a) multiplied by (b) multiplied by (c) where:(a) is the applicable rate from Appendix A, based upon gender unless your Policy was issued under unisex rates
pursuant to state or federal regulations;(b) is the policy face amount divided by 1,000; and (c) is the applicable percentage from Appendix B.
Example: The surrender charge in policy year 2 for a 45-year old male with a risk classification of preferred non-tobacco and a policy face amount of $2,000,000 is $21,460 (10.73*2,000*100%).
If the same policy has a policy face amount increase of $100,000 at the beginning of policy year 2 (the insured would be age 46 at time of the policy face amount increase), the total surrender charge applicable is $22,591 which is the sum of $21,460 as calculated above and $1,131 (11.31*100*100%) for the policy face amount increase.
The surrender charge on an early surrender or Policy lapse is significant. As a result, you should purchase a Policy only if you have the financial capacity to keep it in force for a substantial period of time.
Transaction Fee for Unscheduled Partial SurrenderA transaction fee of the lesser of $25 or 2% of the amount surrendered is charged on each unscheduled partial surrender after the second unscheduled partial surrender in a policy year.
Transfer Fee for Unscheduled Division TransferCurrently there is no charge for making an unscheduled division transfer. However, we reserve the right to impose a transfer fee in the future of up to $25 on each unscheduled division transfer after the first unscheduled division transfer in a policy month. A transfer fee is intended to reimburse us for our additional separate account operation expenses related to multiple unscheduled division transfers. Policyowners will not be provided prior notice if we begin imposing the transfer fee; however, if imposed, the transfer fee will apply to all policyowners in a non-discriminatory fashion.
For purposes of applying the transfer fee for unscheduled division transfers, we will count all unscheduled division transfers that occur in any one valuation period as one transfer. However, allocations of premium payments will not be counted as unscheduled division transfers.
Monthly Policy ChargeThe monthly policy charge is made up of: • a charge for the cost of insurance; • an asset based charge; • a monthly policy issue charge; and • any charge for an optional insurance benefit added by rider(s).
On the policy date and each monthly date thereafter, we deduct the monthly policy charge from your policy value in the divisions and/or fixed account (but not your loan account). The deduction is made using your current monthly policy charge allocation percentages. Your allocation percentages may be:• the same as allocation percentages for premium payments; • determined on a prorated basis; or • determined by any other allocation method upon which we agreeIf you do not designate monthly policy charge allocation percentages, the allocation percentages will be the same as the allocation percentages for premium payments. The total of the allocation percentages must equal 100. Allocation percentages may be changed without charge. A request for an allocation change is effective once approved by us, as of the next monthly date. If we cannot follow your instructions because of insufficient value in any division and/or the fixed account, the monthly policy charge is deducted on a prorated basis.
Cost of Insurance ChargeThis charge compensates us for providing insurance protection under the Policy. We base this charge on several factors including, but not limited to, (i) the insured’s gender*, issue age, tobacco status, and risk classification, and (ii) our expectations of future investment earnings, expenses, mortality, and persistency. The monthly cost of insurance rate ranges from a minimum of $0.01 per $1,000 net amount at risk to a maximum of $83.33 per $1,000 net amount at risk.
* The cost of insurance rate for Policies issued in states which require unisex pricing or in connection with employment related insurance and benefit plans is not based on the gender of the insured.

16
Entities and other persons buying Policies under a sponsored arrangement may apply for special underwriting. If special underwriting is granted, the cost of insurance charge may increase because of higher anticipated mortality experience. Special underwriting programs currently available include simplified issue underwriting and guaranteed issue underwriting. The cost of insurance rates for healthy individuals may be greater under special underwriting programs than for Policies subjected to full underwriting. Healthy individuals in a group will likely pay higher cost of insurance charges because they bear a portion of the cost of insuring the less healthy individuals in the group.
The net amount at risk is the difference between the death benefit and the policy value (see GLOSSARY for formula). The lower the policy value, the higher the net amount at risk thus higher cost of insurance charges. The net amount at risk is affected by investment performance, policy loans, payment of premiums and charges under the Policy, death benefit option chosen, partial surrenders and adjustments to the total face amount.
Asset Based Charge The asset based charge compensates us for expenses associated with the maintenance, accounting and recordkeeping of the divisions of the Separate Account. In addition, this charge reimburses us for service fees (a trail commission) paid to the registered representative.
During the first ten policy years, we deduct an asset based charge of 0.0581% of the net policy value each month (equivalent to 0.70% annually). After the tenth policy year, we deduct an asset based charge of 0.025% of the net policy value each month (equivalent to 0.30% annually)
Monthly Policy Issue ChargeThis charge reimburses us for the expenses associated with policy issue, including underwriting and setting up policy records. The monthly policy issue charge applies per $1,000 of total face amount and varies by gender (if applicable), age, tobacco status and risk classification; the charge ranges from a minimum of $0.07 to a maximum of $1.09 per $1,000 total face amount. Currently, this charge is applied for ten years from policy issue or total face amount increase; however, we reserve the right to apply this charge in all years. Any total face amount increase will have its own monthly policy issue charge.
Optional Insurance Benefits Charges Accounting Benefit RiderThere is a monthly charge of $0.03 per $1,000 of total face amount in the first five policy years.
Change of Insured RiderThere is no charge for this rider.
Cost of Living RiderThere is no charge for this rider; however, when there is a cost of living increase to the total face amount, the monthly policy charge and surrender charge will be increased proportionally.
Death Benefit Guarantee RiderThere is no charge for this rider; however, the guarantee provided by the rider requires payment of certain minimum premium amounts that vary based on the individual characteristics of the insured (age, gender, tobacco status, and risk classification).
Extended Coverage RiderThere is no charge for this rider.
Life Paid-Up Rider (Overloan Protection)There is no charge for this rider unless the rider benefits commence. If the rider benefits commence, there is a one-time charge guaranteed not to exceed 7.5% of the policy value (for policies using the guideline premium test) and 13.5% of the policy value (for policies using the cash value accumulation test) that is taken from the policy value.
Supplemental Benefit RiderThere is a supplemental cost of insurance charge for the net amount at risk provided by this rider. The supplemental cost of insurance rate is based on the insured’s gender, issue age, tobacco status, and risk classification. The supplemental cost of insurance rate ranges from a maximum of $83.33 per $1,000 net amount at risk to $0.01 per $1,000 net amount at risk.
17
Waiver of Monthly Policy Charges RiderThere is a monthly charge for this rider and it varies based on the attained age, risk classification and gender of the insured. For insureds with a risk classification of standard or better, the monthly charge is guaranteed not to be less than nor to exceed $0.01 and $0.51 per $1,000 net amount at risk.
Waiver of Specified Premium RiderThere is a monthly charge for this rider. It varies based on the attained age, risk classification and gender of the insured. For insureds with a risk classification of standard or better, the monthly charge is guaranteed not be less than nor to exceed $0.15 and $0.94 per $100 of planned periodic premium.
Net Policy Loan ChargeSee LOANS for more detail.
Underlying Mutual Fund ChargesThe assets of each division are used to purchase shares in a corresponding mutual fund at net asset value. The net asset value of the mutual fund reflects management fees and operating expenses already deducted from the assets of the mutual fund. Current management fees, operating expenses and potential redemption fees (if any) for a mutual fund are shown in the prospectus for the underlying mutual fund. None of the underlying mutual funds currently impose a redemption fee.
GENERAL DESCRIPTION OF THE POLICYThe ContractThe entire contract is made up of applications, amendments, riders and endorsements attached to the Policy, current data pages, copies of any supplemental applications, amendments, endorsements and revised data pages which are mailed to you. No statement, unless made in an application, is used to void a Policy (or void an adjustment in the case of an adjustment application). Only our corporate officers can agree to change or waive any provisions of a Policy. Any change or waiver must be in writing and signed by an officer of the Company.
The Policy is an individual flexible premium variable universal life insurance policy. This prospectus describes all material features of the Policy. Your Policy’s provisions may differ from the description in this prospectus, and certain riders and options may not be available, because of legal requirements or restrictions in your state. Any variations from the information appearing in this prospectus which are required due to individual state requirements are contained in your Policy, or in riders or endorsements attached to your Policy. You should refer to your Policy for these state specific features.
Rights under the PolicyOwnershipUnless changed, the owner is as named in the application. The owner may exercise every right and privilege of the Policy, subject to the rights of any irrevocable beneficiary(ies) and any assignee(s).
All rights and privileges of ownership of a Policy end if: • the death proceeds are paid; • the maturity proceeds are paid; • the Policy is surrendered; or • the grace period ends without our receiving the payment required to keep the Policy in force.
If an owner dies before the Policy terminates, the surviving owner(s), if any, succeeds to that person’s ownership interest, unless otherwise specified. If all owners die before the Policy terminates, the Policy’s ownership interest passes to the insured. If the owner is not a natural person and is no longer in existence, the insured becomes the owner unless otherwise required by law. With our consent, you may specify a different arrangement for contingent ownership.
You may change your ownership designation at any time. Your request must be in writing and approved by us. After approval, the change is effective as of the date you signed the request for change. We reserve the right to require that you send us the Policy so that we can record the change.
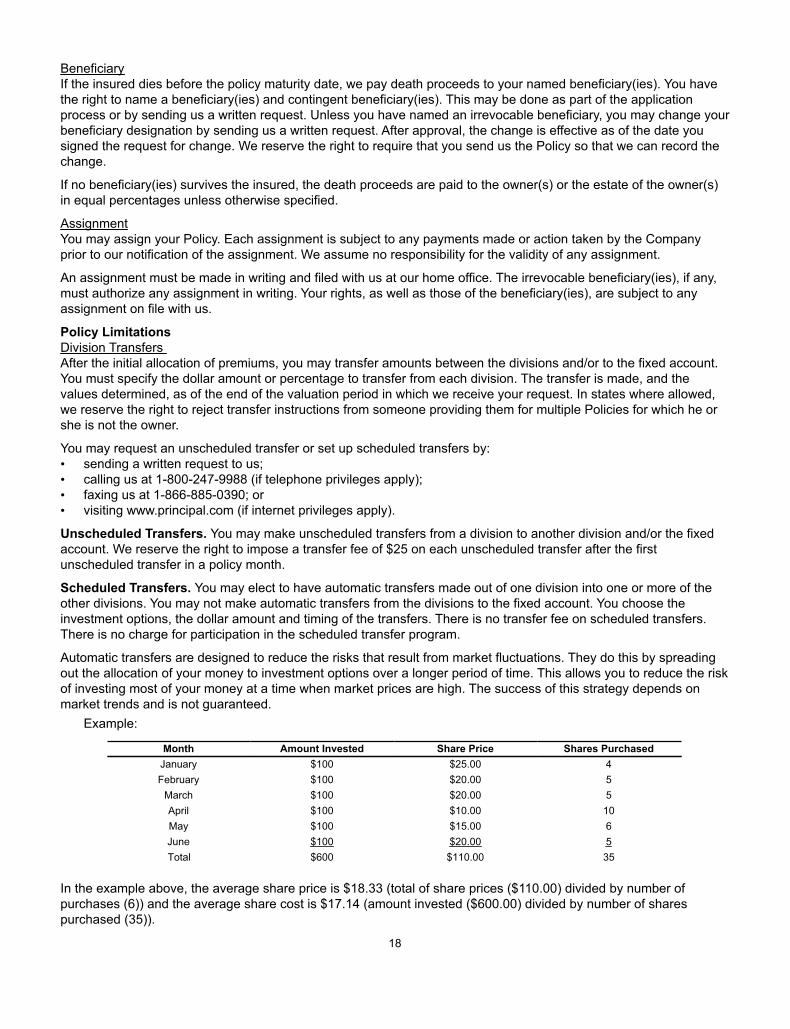
18
BeneficiaryIf the insured dies before the policy maturity date, we pay death proceeds to your named beneficiary(ies). You have the right to name a beneficiary(ies) and contingent beneficiary(ies). This may be done as part of the application process or by sending us a written request. Unless you have named an irrevocable beneficiary, you may change your beneficiary designation by sending us a written request. After approval, the change is effective as of the date you signed the request for change. We reserve the right to require that you send us the Policy so that we can record the change.
If no beneficiary(ies) survives the insured, the death proceeds are paid to the owner(s) or the estate of the owner(s) in equal percentages unless otherwise specified.
AssignmentYou may assign your Policy. Each assignment is subject to any payments made or action taken by the Company prior to our notification of the assignment. We assume no responsibility for the validity of any assignment.
An assignment must be made in writing and filed with us at our home office. The irrevocable beneficiary(ies), if any, must authorize any assignment in writing. Your rights, as well as those of the beneficiary(ies), are subject to any assignment on file with us.
Policy LimitationsDivision Transfers After the initial allocation of premiums, you may transfer amounts between the divisions and/or to the fixed account. You must specify the dollar amount or percentage to transfer from each division. The transfer is made, and the values determined, as of the end of the valuation period in which we receive your request. In states where allowed, we reserve the right to reject transfer instructions from someone providing them for multiple Policies for which he or she is not the owner.
You may request an unscheduled transfer or set up scheduled transfers by: • sending a written request to us; • calling us at 1-800-247-9988 (if telephone privileges apply);• faxing us at 1-866-885-0390; or • visiting www.principal.com (if internet privileges apply).
Unscheduled Transfers. You may make unscheduled transfers from a division to another division and/or the fixed account. We reserve the right to impose a transfer fee of $25 on each unscheduled transfer after the first unscheduled transfer in a policy month.
Scheduled Transfers. You may elect to have automatic transfers made out of one division into one or more of the other divisions. You may not make automatic transfers from the divisions to the fixed account. You choose the investment options, the dollar amount and timing of the transfers. There is no transfer fee on scheduled transfers. There is no charge for participation in the scheduled transfer program.
Automatic transfers are designed to reduce the risks that result from market fluctuations. They do this by spreading out the allocation of your money to investment options over a longer period of time. This allows you to reduce the risk of investing most of your money at a time when market prices are high. The success of this strategy depends on market trends and is not guaranteed.
Example:
Month Amount Invested Share Price Shares PurchasedJanuary $100 $25.00 4February $100 $20.00 5
March $100 $20.00 5April $100 $10.00 10May $100 $15.00 6June $100 $20.00 5Total $600 $110.00 35
In the example above, the average share price is $18.33 (total of share prices ($110.00) divided by number of purchases (6)) and the average share cost is $17.14 (amount invested ($600.00) divided by number of shares purchased (35)).

19
Automatic transfers are made on a periodic basis. • The amount of the transfer is:
• the dollar amount you select; or • a percentage of the division value as of the date specified (other than the 29th, 30th or 31st).
• You select the transfer date (other than the 29th, 30th or 31st) and the transfer frequency (annually, semi – annually, quarterly or monthly). If the selected date is not a business day, the transfer is completed on the next business day.
• Transfers continue until your interest in the division has a zero balance or we receive notice to stop them.• We reserve the right to limit the number of divisions from which simultaneous transfers are made. In no event will
it ever be less than two.• Automatic transfers are not available from the divisions to the fixed account.
Fixed Account TransfersTransfers from the fixed account to your division(s) are subject to certain limitations. You may transfer amounts by making either a scheduled or unscheduled fixed account transfer. You may not make both a scheduled and an unscheduled transfer from the fixed account in the same calendar year. It may take several years before a policy owner can move all the policy value in the fixed account to the divisions.
Unscheduled Transfers. You may make one unscheduled transfer from the fixed account to division(s) during the first 30-day period of each calendar quarter.• In each calendar year, the transfers may not exceed:
• your fixed account value as of December 31 of the prior year (if $5,000 or less);• $5,000 (if your fixed account value as of December 31 of the prior year is greater than $5,000 but less than
$20,000); or• 25% of your fixed account value as of December 31 of the prior year (if the fixed account value is greater
than $20,000).• We must receive your notice during the 30-day period. • You must specify the dollar amount or percentage to be transferred.
Scheduled Transfer Program. You may elect scheduled transfers from the fixed account to your division(s) without an additional charge as follows:• The value of your fixed account must be $20,000 or more when your scheduled transfers begin.• You must elect participation in the program by furnishing us with notice. The election may be made at any time
following the end of the examination offer period. Once made, this election is irrevocable.• Transfers to the divisions will be made in the proportions used for allocation of premium payments.• If your premium payments included an allocation to the fixed account, your notice must include new premium
payment allocations to the division(s) only.• During the transfer period, you may not:
• make unscheduled transfers out of the fixed account; or• make transfers and premium payments to the fixed account.
Your election will be effective as of the valuation period during which we receive your notice and transfers will be made according to the following schedule:• The first transfer will be 25% of the fixed account value;• 12 months from the first transfer (or next business day if the transfer day is not a business day), 33% of the fixed
account value;• 24 months from the first transfer (or next business day if the transfer day is not a business day), 50% of the fixed
account value; and• 36 months from the first transfer (or next business day if the transfer day is not a business day), the balance of
the fixed account value.
If on any transfer date, the fixed account value prior to the transfer is $5,000 or less, the entire fixed account value will be transferred.
Example: The example does not reflect payment of interest on the value in the fixed account. It also assumes that monthly policy charges are not taken from the fixed account and that you make no partial surrenders or policy loans from the fixed account.

20
The policy is dated July 1, 2009. On February 7, 2010, the balance in the fixed account is $100,000 and scheduled transfers are elected. The transfers will occur as follows:
Date Balance Percent to beTransferred
Amount to beTransferred
February 7, 2009 $100,000 25% $25,000February 7, 2010 $75,000 33% $24,750February 7, 2011 $50,250 50% $25,125February 7, 2012 $25,125 100% $25,125
The first day that you may make transfers or premium payments to the fixed account is February 8, 2012. After January 1, 2013, you may make an unscheduled transfer from the fixed account as set forth above.
Automatic Portfolio Rebalancing (APR)APR allows you to maintain a specific percentage of your net policy value in the divisions over time.
Example: You may choose to rebalance so that 50% of your policy values are in the money market division and 50% in the SmallCap Value I division. At the end of the specified period, market changes may have caused 60% of your value to be in the money market division and 40% in the SmallCap Value I division. By rebalancing, units from the money market division are sold and the proceeds are used to purchase units in the SmallCap Value I division so that 50% of the policy values are once again invested in each division.
You may elect APR at the time of application or after the Policy has been issued. There is no charge for participation in the APR program. The APR transfers: • do not begin until the expiration of the examination offer period;• are done without charge; • may be done on the specified frequency (monthly, quarterly, semiannual or annual) on a policy year or calendar
year basis;• may be done by:
• calling us at 1-800-247-9988 (if telephone privileges apply);• mailing your written request to us; • faxing us at 1-866-885-0390; or • visiting www.principal.com (if internet privileges apply).
• are made at the end of the next valuation period after we receive your instruction;• are not available if you have scheduled transfers from the same divisions; and• are not available for any values in the fixed account.
Automatic portfolio rebalancing is also the term used in connection with certain non – qualified deferred compensation plans. In these instances, the plan has a service agreement directing the service provider to give effect to the plan’s allocation instructions.
Optional Insurance BenefitsSubject to certain conditions, you may add one or more optional insurance benefits to your Policy. Detailed information concerning optional insurance benefits may be obtained from an authorized agent or our home office. Not all optional insurance benefits are available in all states. Some provisions may vary from state to state. The cost, if any, of an optional insurance benefit is deducted from your policy value. See SUMMARY: FEE TABLES for maximum rider charges.
Accounting Benefit RiderThis rider is available on business owned Policies only and provides if the Policy is surrendered, any surrender charge which would otherwise apply, will be waived. This waiver of surrender charge does not apply to a Policy which is surrendered for the purpose of replacing it with a policy from another company, including Internal Revenue Code Section 1035 exchanges. This rider may be elected at any time prior to issue, subject to our approval under our then current underwriting guidelines. There is a charge for this rider.

21
Change of Insured RiderThis rider is available on business owned Policies only and allows the business to change the insured when an employee leaves employment or ownership of the business changes. This rider may be added at any time prior to the proposed insured’s attained age 69. Until the effective date of the change of insured, coverage remains in effect on the life of the prior insured. We must receive satisfactory evidence of insurability (according to our underwriting guidelines then in effect) for the newly named insured. Future cost of insurance rates are based on the gender, issue age, tobacco status and risk classification of the newly named insured. The death proceeds are paid when the newly named insured dies. There is no charge for this rider.
Cost of Living Increase RiderThis rider provides increases in the face amount every three years, to the insured’s age 55, without requiring evidence of insurability. This rider is only available in New York and added automatically to all personally-owned Policies with a risk classification of standard or better and where the insured’s issue age is 52 or younger. There is no charge for adding this rider; however, when there is a cost of living face amount increase, the monthly policy charge and surrender charge will be higher. The surrender charge period will also extend.
Death Benefit Guarantee RiderThis rider guarantees the Policy, including any attached riders, will not lapse before the insured attains a specified age provided that the dollar amount that is the result of all premiums paid, minus the sum of loan indebtedness and partial surrenders, equals or exceeds the death benefit guarantee premium requirement. The specified age is either the insured’s attained age 65 or 85, depending on the level of premium (planned or paid) at issue. The death benefit guarantee premium requirement is described in PREMIUMS - Premiums Affecting Guarantee Provisions. The death benefit guarantee premium requirement for your Policy will be provided to you simply by requesting an illustration (available at no charge from your registered representative or our home office).
If on any monthly date, the death benefit guarantee premium requirement is not met, the protections of the rider will not apply and the Policy is at risk of terminating if on any monthly date the net policy value is insufficient to pay the monthly policy charge. The protections of the rider will resume on the first monthly date following our receipt of the premium required to meet the death benefit guarantee premium requirement.
This rider is automatically made a part of the Policy at issue unless you elect the Supplemental Benefit Rider. There is no charge for this rider; however, sufficient premiums are required in order for the rider benefits to apply.
Extended Coverage RiderThis rider extends the Policy beyond the policy maturity date as long as the Policy is still in – force and the insured is living on the policy maturity date. The Policy will then terminate upon the insured’s death. No monthly policy charges are deducted after the policy maturity date. No additional premium payments are allowed, adjustment options are not available and the death benefit option is changed to Death Benefit Option 1. All division and fixed account values will be transferred to the money market division and no further transfers are allowed. This rider is added automatically to all Policies when issued. You may choose not to extend the policy maturity date by requesting the rider not be attached to your Policy. There is no charge for this rider.
Life Paid-Up Rider (Overloan Protection)Under certain circumstances, this rider can guarantee the Policy will not lapse when there is large loan indebtedness by converting the Policy to paid-up life insurance. In order for the rider benefit to begin, the following conditions must be satisfied:• the loan indebtedness must be at least 92% of the surrender value;• there is sufficient net surrender value to cover the one-time rider charge;• the insured’s attained age must be 75 years or older;• the Policy must have been in force for at least 15 policy years; and• Total partial surrenders must equal or exceed total premiums paid.
For Policies issued with the cash value accumulation test, we reserve the right to begin the rider benefit when the loan indebtedness is at least 86% of the surrender value and all other conditions are satisfied.
22
Once the rider benefit begins: • The total face amount is reduced to equal the policy value after the rider charge multiplied by 105%.• All values in the divisions are immediately transferred to the fixed account where they will earn interest.• No further monthly policy charges are deducted for the remaining paid-up death benefit.• No new premium payments, face amount adjustments, partial surrenders or loans are allowed.• If death benefit option 2 or 3 is in effect, your death benefit option will change to death benefit option 1 and you
may no longer change the death benefit option.• Your loan indebtedness remains and interest will continue to accrue on the loan indebtedness. However, loan
payments can be submitted.• All optional riders, except the extended coverage rider, will automatically be terminated.
There is a one time charge taken from the policy value on the date the rider benefit begins. The rider may be elected at any time prior to the policy maturity date.
The Internal Revenue Service has not taken a position on the Life Paid-Up rider. You should consult your tax advisor regarding this rider.
Supplemental Benefit RiderThis rider provides additional insurance (total face amount) at a reduced cost. Cost of insurance rates are based on the insured’s gender, issue age, duration since issue, tobacco status, and risk classification. This rider may be added to your Policy subject to our approval under our then current underwriting guidelines. There is a charge for this rider.
If you elect the Supplemental Benefit Rider, the Death Benefit Guarantee Rider is not available.
Waiver of Monthly Policy Charges RiderThis rider pays the monthly policy charges of the Policy if the insured becomes disabled (as described in the rider) and loses his/her ability to earn an income. This rider is only available in New York and may be added at anytime that the insured’s attained age is not greater than 59, subject to our approval under our then current underwriting guidelines. There is a charge for this rider.
Waiver of Specified Premium RiderThis rider pays the planned periodic premium on the Policy if the insured becomes disabled (as described in the rider) and loses his/her ability to earn an income. This rider is only available in New York and may be added at anytime that the insured’s attained age is not greater than 59, subject to our approval under our then current underwriting guidelines. There is a charge for this rider.
Reservation of RightsWe reserve the right to change the Policy to assure it continues to qualify as life insurance for tax purposes. However, we cannot make any guarantee regarding the future tax treatment of any Policy.
We reserve the right to modify or endorse the Policy in order to maintain compliance with applicable laws and regulations. We also reserve the right to amend or terminate the special plans described in this prospectus, for example preauthorized premium payments.
You would be notified of any above action to the extent required by law. Any change, modification, endorsement, amendment or termination we make to the Policy or special plans described in this prospectus will be in writing and signed by an officer of the Company.
Right to ExchangeDuring the first 24 months after the effective date (except during a grace period), you have the right to make an irrevocable, one-time election to transfer all of your division values to the fixed account. No charge is imposed on this transfer. The policy value immediately after the transfer will be the same as immediately before the transfer. From the exchange date forward, the policy value will no longer be affected by the investment performance of the divisions.
Your request must be in writing and be signed by the owner(s). The request must be postmarked or delivered to our home office before the end of the 24-month period. The transfer is effective when we receive your written request

23
SuicideDeath proceeds are not paid if the insured dies by suicide, while sane or insane, within two years of the policy date (or two years from the date of total face amount increase with respect to such increase). In the event of the suicide of the insured within two years of the policy date, our only liability is a refund of premiums paid, without interest, minus any loan indebtedness and partial surrenders. In the event of suicide within two years of a total face amount increase, our only liability with respect to that increase is a refund of the cost of insurance for the increase. This amount will be paid to the beneficiary(ies).
Delay of Payments or TransfersPayment due to exercise of your rights under the examination offer provision, surrenders, policy loans, death or maturity proceeds, and transfers to or from a division are generally made within five days after we receive your instructions in a form acceptable to us. This period may be shorter where required by law. However, payment of any amount upon return of the Policy, full or partial surrender, policy loan, death, maturity or the transfer to or from a division may be deferred during any period when the right to sell mutual fund shares is suspended as permitted under provisions of the Investment Company Act of 1940.
The right to sell shares may be suspended during any period when: • trading on the NYSE is restricted as determined by the SEC or when the NYSE is closed for other than
weekends and holidays, or• an emergency exists, as determined by the SEC, as a result of which:
• disposal by a fund of securities owned by it is not reasonably practicable;• it is not reasonably practicable for a fund to fairly determine the value of its net assets; or• the SEC permits suspension for the protection of security holders.
If a payment or transfer is delayed and you do not cancel your instructions in writing, the transaction will occur on the first business day following the expiration of the permitted delay. The transaction is made within five days thereafter.
In addition, we reserve the right to defer payment of that portion of your policy value that is attributable to a premium payment made by check for a reasonable period of time (not to exceed 15 business days) to allow the check to clear the banking system.
We may defer payment from the fixed account for a period of up to six months.
PREMIUMSPayment of PremiumsYou may make unscheduled premium payments and/or planned periodic premiums. Planned periodic premiums are premiums in the amount and on the frequency you plan to pay. We will send premium reminder notices if you establish an annual, semiannual, or quarterly planned payment schedule. You may set up monthly preauthorized withdrawals to allow us to automatically deduct premium payments from your checking or other financial institution account.
The amount and frequency of your premium payments affects the policy value, the net policy value, and how long the Policy remains in force.
Premium payments may be delivered to us as follows:• If you have established an annual, semiannual, or quarterly planned payment schedule, by sending payment in
the reply envelope enclosed in the premium reminder notice;• By mailing your payment according to the instructions below; or• By wire transfer according to the instructions below.
Premium Payment Mailing InstructionsPremium payments sent to our home office must be addressed as follows:
Principal Life Insurance CompanyP.O. Box 10431Des Moines, Iowa 50306-0431

24
Premium Payment Wiring InstructionsPremium payments sent to us by wire transfer must be directed as follows:
Direct to: Wire Routing Transit Number 121000248 Bank name: Wells Fargo Bank, N.A. City, State: San Francisco, CA Beneficiary Account Number (BNF): 8785453690 Beneficiary Account Name: Principal Life Insurance Company Individual BMA EFT OBI Information: (instructions - see below)
OBI Information is extremely important in identifying how to apply these funds. Please include the following:• As much description as possible in the 68 characters allowed.• Contract number(s), business group or Insured’s name, special instructions - such as “init prem”, “loan repay”,
etc.• Direct it to: ATTN: Individual Billing and Collection
Payments are to be made via personal or financial institution check (for example, a bank or cashier’s check). We reserve the right to refuse any payment that we feel presents a fraud or money laundering risk. Examples of the types of payments we will not accept are cash, money orders, travelers checks, credit card checks, and foreign checks.
Premiums Affecting Guarantee ProvisionsIf the Death Benefit Guarantee rider is made a part of your Policy and you pay at least the death benefit guarantee premium requirement, the rider guarantees the Policy will not lapse before the attained age you choose (attained age 65, or attained age 85). Generally, a longer death benefit guarantee period will have a higher premium requirement.
The death benefit guarantee monthly premium is ((a) times (b)) divided by (c) where:(a) is the total face amount divided by 1,000; (b) is the death benefit guarantee premium rate; and (c) is 12.
ExampleIf the face amount is $1,000,000 with Death Benefit Option 2 and
the insured is a 45-year old mail with a risk classification of preferred non-tobacco:
Premium RateDeath Benefit
Guarantee Monthly PremiumDeath Benefit Guarantee to attained age 65 $20.15 $1,680Death Benefit Guarantee to attained age 85 $23.71 $1,976
You choose the death benefit guarantee period based on your scheduled premium payments. The death benefit guarantee premium requirement is met if [(a) minus (b)] is greater than or equal to (c) where:
(a) is the sum of premiums paid; (b) is the sum of all loan indebtedness and partial surrenders; and (c) is the sum of the death benefit guarantee monthly premiums since the policy date to the most recent monthly
date.
Using the DBG 85 example above, if the Policy is in its 25th month and there have been no loans or partial surrenders, the death benefit guarantee premium requirement on the 25th monthly date is $49,400 (25 times $1,976). If on any monthly date, the death benefit guarantee premium requirement is not met, the protections of the rider will not apply and the Policy is at risk of terminating on any monthly date if the net policy value is insufficient to pay the monthly policy charge.
The death benefit guarantee premium rates are per $1,000 of face amount and may vary by issue age, risk classification, gender* and tobacco status. The death benefit guarantee monthly premium is shown on your Policy.
* For Policies issued in states which require unisex pricing or in connection with employment related insurance and benefit plans, the premiums are not based on the gender of the insured

25
Premium LimitationsIn no event may the total of all premiums paid, both scheduled and unscheduled, be more than the maximum premium payments allowed for life insurance under the Internal Revenue Code. If you make a premium payment that would result in total premiums exceeding the maximum limitation, we only accept that portion of the payment that makes total premiums equal the maximum. Unless otherwise directed, any excess will be promptly returned and no further premiums are accepted until allowed by the current maximum premium limitations.
If any premium payment increases the Policy’s death benefit by more than it increases the policy value, we reserve the right to refund all or part of the premium payment. If all or part of the premium payment is not refunded, we may require satisfactory evidence of insurability.
The minimum initial premium required is three monthly policy charges divided by (1-premium expense charge). The amount is based on the initial total face amount of the Policy, the death benefit option and the charges and expenses of the Policy. There is no minimum amount requirement for subsequent premiums; however, insufficient premium payments may cause the policy to lapse (see POLICY TERMINATION AND REINSTATEMENT - Policy Termination (Lapse)).
Allocation of PremiumsWe allocate your initial net premiums as described below. Thereafter, allocations of net premiums are made to the divisions and the fixed account according to your instructions. The total of all allocation percentages must equal 100. Net premiums are allocated as of the valuation period in which they are received in good order.
The percentage allocation for future premium payments may be changed, without charge, at any time by:• sending a written request to us; • calling us at 1-800-247-9988 (if telephone privileges apply);• faxing us at 1-866-885-0390; or • visiting www.principal.com (if internet privileges apply).
The allocation changes are effective at the end of the valuation period in which the new instructions are received.
Premium Refund StatesIf the Policy is issued in a state that requires a full refund of premium when the policy is returned during the examination offer period, the initial net premium, including any premium received during the examination offer period, is allocated to the money market division. The premium will be reallocated to the divisions and the fixed account according to your instructions on the later of the effective date or the end of the examination offer period (or on the first business day thereafter). See SURRENDERS AND PARTIAL SURRENDERS - Right to Examine Policy (“Free Look” Provision”) for more information about the examination offer period.
If the purchase of this policy falls within the definition of a replacement under state law, we reserve the right to retain the initial net premiums in the money market division to correspond to the examination offer period of a particular state’s replacement requirements.
Market Value StatesIf the policy is issued in a state that allows refund of net policy value when the policy is returned during the examination offer period, the initial net premium is allocated to the divisions according to your instructions on the later of the policy date or the effective date. In these states, we will refund the net policy value, which may be more or less than your premium, if the policy is returned during the examination offer period. See SURRENDERS AND PARTIAL SURRENDERS - Right to Examine Policy ("Free Look" Provision) for more information about the examination offer period.
Division Valuation There is no guaranteed minimum division value. Its value reflects the investment experience of the division. It is possible that the investment performance could cause a loss of the entire amount allocated to the division. Without additional premium payments or a Death Benefit Guarantee rider, it is possible that no death benefit would be paid upon the insured’s death.

26
At the end of any valuation period, your value in a division is: • the number of units you have in the division • multiplied by the value of a unit in the division.
The number of units is the total of units purchased by allocations to the division from:• your initial premium payment (less premium expense charges);• plus subsequent premium payments (less premium expense charges);• plus transfers from another division or the fixed accountminus units sold: • for partial surrenders from the division; • as part of a transfer to another division, the fixed account or the loan account; and• to pay monthly policy charges and any transaction fees.
We calculate unit values on days that the NYSE is open for trading and trading is not restricted. We do not calculate unit values on these recognized holidays: New Year’s Day; Labor Day; Martin Luther King, Jr. Day; Thanksgiving; President’s Day; Christmas; Good Friday; Memorial Day and Independence Day. In addition, we do not calculate unit values if an emergency exists making disposal or valuation of securities held in the underlying mutual funds impracticable or if the SEC, by order, permits a suspension or postponement for the protection of security holders. To calculate the unit value of a division, the unit value from the previous business day is multiplied by the division’s net investment factor for the current valuation period. The number of units does not change due to a change in unit value.
The net investment factor measures the performance of each division. The net investment factor for a valuation period is calculated as follows:
[{the share price (net asset value) of the underlying mutual fund at the endof the valuation period before that day’s transactions
plusthe per share amount of the dividend (or other distribution) made by the mutual fund during the valuation period}
divided bythe share price of the underlying mutual fund at the end of the previous valuation period after that day’s transactions].
When an investment owned by an underlying mutual fund pays a dividend, the dividend increases the net asset value of a share of the underlying mutual fund as of the date the dividend is recorded. As the net asset value of a share of an underlying mutual fund increases, the unit value of the corresponding division also reflects an increase. Payment of a dividend under these circumstances does not increase the number of units you own in the division.
Fixed Account ValuationThe value of your fixed account on any business day is: • net premiums allocated to the fixed account • plus transfers from the division(s) and the loan account (as a result of a loan repayment)• plus interest credited to the fixed account • minus surrenders, transaction fees and monthly policy charges• minus transfers to the loan account • minus transfers to the division(s)
27
DEATH BENEFITS AND POLICY VALUES
Death ProceedsIf coverage is in effect and the insured dies before the policy maturity date, we pay death proceeds upon our receipt of:• proof of the death of the insured (typically, a death certificate);• Beneficiary’s Statement (Claim Form)*; and
• If the beneficiary is a trust, the Claim Form must be signed by the trustee(s) and we must also receive a copy of the trust agreement and/or our Trustee Certification Form.
• If the beneficiary is a corporation or other entity, the Claim Form must be signed by a corporate officer and we must receive proof of that person’s signing authority (e.g., submitted with a copy of the Articles of Incorporation or By-Laws indicating the authority of the office and a current Board resolution providing the name of the officer(s) authorized to sign on behalf of the entity) and a Certificate of Good Standing or Certificate of Existence provided by the state of where the entity was incorporated or otherwise created.
Payment of the death proceeds will be made within seven business days of receipt of the required documentation. We pay death proceeds first to the assignee, if any, in a lump sum. We pay the remainder to your named beneficiary(ies) as described below. If no beneficiary(ies) survives the insured, we will pay the death proceeds to the owner or the owner’s estate unless you have given us written notice otherwise.
We will pay death proceeds according to the benefit payment option (shown below) that you have chosen. If you do not select a benefit payment option, your named beneficiary(ies) may each choose to receive payment in a lump sum or according to a benefit payment option. If your beneficiary(ies) does not choose a benefit payment option, we will pay the death proceeds in a lump sum.
Death proceeds are calculated as of the date of the insured’s death and include: • the death benefit described below in DEATH BENEFITS AND POLICY VALUES — Death Benefit Options;• minus loan indebtedness; • minus any overdue monthly policy charges if the insured died during a grace period;• plus interest on the death proceeds as required by state law.
Benefit InstructionsWhile the insured is alive, you may give us instructions for payment of death proceeds under one of the fixed benefit payment options shown below. If we have not received written benefit payment instructions from you prior to the insured’s death, each of your beneficiaries may select either a lump sum distribution or one of the benefit payment options shown below. You may change your benefit payment instructions by sending us written notice. If you change your beneficiary(ies) designation, your prior benefit payment instructions are automatically revoked.
Benefit Payment OptionsThe benefit payment options include: • Custom Benefit Arrangement
We will make benefit payments based on arrangements you have requested and we have agreed to in writing (e.g., equal payments made over a specified period of time; joint and survivor life income with a reduced survivor benefit, etc.).
• Life Income We will make benefit payments for a person’s lifetime; payments stop after the death of that person. It is possible that we would make no payments if the person were to die before the first payment was due.
• Life Income with Period Certain We will make benefit payments for the longer of a person’s lifetime or a guaranteed period that you specify (must be between 5 to 30 years). If the person dies before all of the guaranteed payments have been made, we will continue to make the guaranteed payments to the person(s) you or your beneficiary designate until the end of the guaranteed period.
• Joint and Survivor Life Income We will make benefit payments for the longer of the lifetimes of two named people. Payments stop upon the death of the survivor of the two persons. It is possible that we would make no payments if both persons were to die before the first payment was due.

28
• Joint and Survivor Life Income with Period Certain We will make benefit payments for the longer of the lifetimes of two named people or a guaranteed payment period that you specify (must be between 5 to 30 years). If both people die before all of the guaranteed payments have been made, we will continue to make the guaranteed payments to the person(s) you or your beneficiary designates until the end of the guaranteed period.
These benefit payment options are also available if the Policy matures or is surrendered.
Death Benefit OptionsThe death benefit option is selected at the time of application. If a death benefit option is not chosen, the Policy will be issued with Death Benefit Option 1.
The three death benefit options available are: • Death Benefit Option 1 – the death benefit equals the greater of:
• the total face amount; or • the amount found by multiplying the policy value by the applicable percentage*.
• Death Benefit Option 2 – the death benefit equals the greater of:• the total face amount plus the policy value; or • the amount found by multiplying the policy value by the applicable percentage*.
• Death Benefit Option 3 – the death benefit equals the greater of:• the total face amount plus the greater of a) premiums paid less partial surrenders or b) zero; or• the amount found by multiplying the policy value by the applicable percentage*.
* The applicable percentage tables are in Appendix D and are based on our interpretation of Section 7702 of the Internal Revenue Code as set forth below. The table which applies to your Policy is determined by your choice of either the guideline premium/cash value corridor test or the cash value accumulation test.
Example: The following assumptions are made to demonstrate the use of the tables found in Appendix D. Death Benefit Option: 1 Total Face Amount: $1,000,000 Policy Value: $900,000 Definition of Life Insurance Test: Guideline Premium/Cash Value Corridor Test Attained Age: 45 Risk Class: Preferred Non-Tobacco
Applicable Percentage: 215% Death Benefit: $900,000 x 215% = $1,935,000
If the Definition of Life Insurance Test was the Cash Value Accumulation Test, the applicable percentage would be 336.69% (assuming the insured is a male) and the death benefit would be $3,030,210.
Change in Death Benefit OptionYou may change the death benefit option on or after the first policy anniversary. Up to two changes are allowed per policy year. Your request must be made in writing and approved by us. The effective date of the change will be the monthly date that coincides with, or next follows, our approval. If the death benefit option change involves a face decrease, you may elect to keep the current total face amount, subject to underwriting review and approval.
The option may not be changed from Death Benefit Option 1 to Death Benefit Option 3 or from Death Benefit Option 2 to Death Benefit Option 3. We will increase or decrease the total face amount so that the death benefit immediately after the change equals the death benefit before the change.
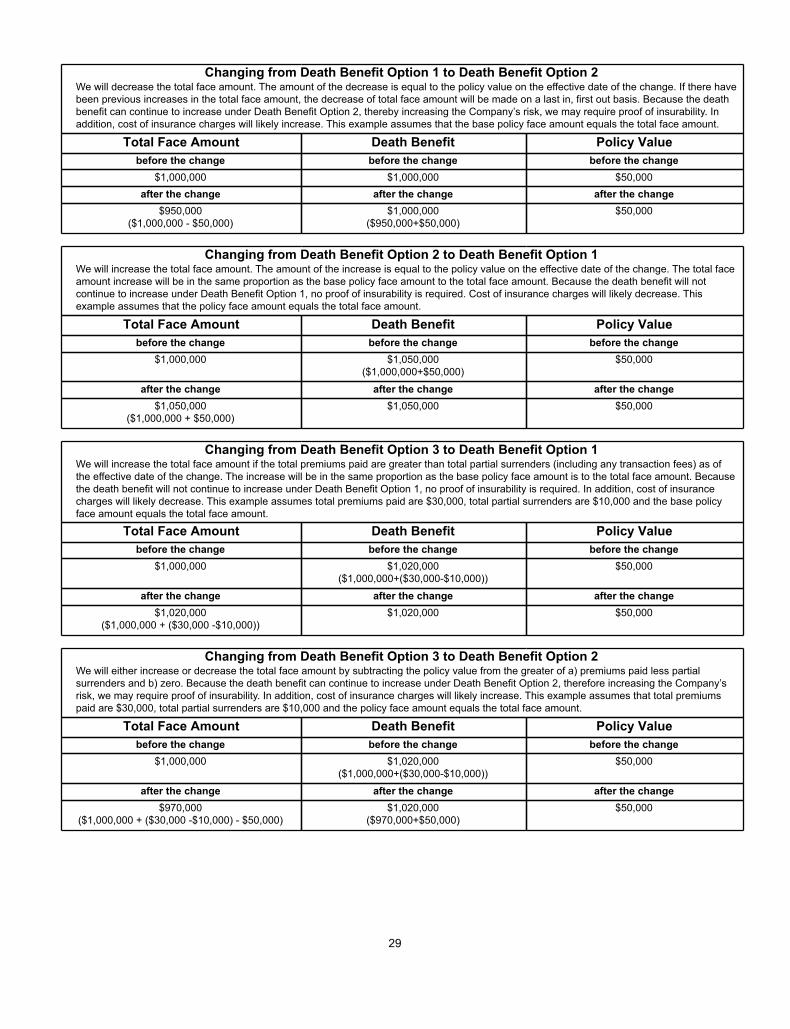
29
Changing from Death Benefit Option 1 to Death Benefit Option 2We will decrease the total face amount. The amount of the decrease is equal to the policy value on the effective date of the change. If there have been previous increases in the total face amount, the decrease of total face amount will be made on a last in, first out basis. Because the death benefit can continue to increase under Death Benefit Option 2, thereby increasing the Company’s risk, we may require proof of insurability. In addition, cost of insurance charges will likely increase. This example assumes that the base policy face amount equals the total face amount.
Total Face Amount Death Benefit Policy Valuebefore the change before the change before the change
$1,000,000 $1,000,000 $50,000after the change after the change after the change
$950,000($1,000,000 - $50,000)
$1,000,000($950,000+$50,000)
$50,000
Changing from Death Benefit Option 2 to Death Benefit Option 1We will increase the total face amount. The amount of the increase is equal to the policy value on the effective date of the change. The total face amount increase will be in the same proportion as the base policy face amount to the total face amount. Because the death benefit will not continue to increase under Death Benefit Option 1, no proof of insurability is required. Cost of insurance charges will likely decrease. This example assumes that the policy face amount equals the total face amount.
Total Face Amount Death Benefit Policy Valuebefore the change before the change before the change
$1,000,000 $1,050,000($1,000,000+$50,000)
$50,000
after the change after the change after the change$1,050,000
($1,000,000 + $50,000)$1,050,000 $50,000
Changing from Death Benefit Option 3 to Death Benefit Option 1We will increase the total face amount if the total premiums paid are greater than total partial surrenders (including any transaction fees) as of the effective date of the change. The increase will be in the same proportion as the base policy face amount is to the total face amount. Because the death benefit will not continue to increase under Death Benefit Option 1, no proof of insurability is required. In addition, cost of insurance charges will likely decrease. This example assumes total premiums paid are $30,000, total partial surrenders are $10,000 and the base policy face amount equals the total face amount.
Total Face Amount Death Benefit Policy Valuebefore the change before the change before the change
$1,000,000 $1,020,000($1,000,000+($30,000-$10,000))
$50,000
after the change after the change after the change$1,020,000
($1,000,000 + ($30,000 -$10,000))$1,020,000 $50,000
Changing from Death Benefit Option 3 to Death Benefit Option 2We will either increase or decrease the total face amount by subtracting the policy value from the greater of a) premiums paid less partial surrenders and b) zero. Because the death benefit can continue to increase under Death Benefit Option 2, therefore increasing the Company’s risk, we may require proof of insurability. In addition, cost of insurance charges will likely increase. This example assumes that total premiums paid are $30,000, total partial surrenders are $10,000 and the policy face amount equals the total face amount.
Total Face Amount Death Benefit Policy Valuebefore the change before the change before the change
$1,000,000 $1,020,000($1,000,000+($30,000-$10,000))
$50,000
after the change after the change after the change$970,000
($1,000,000 + ($30,000 -$10,000) - $50,000)$1,020,000
($970,000+$50,000)$50,000

30
IRS Definition of Life InsuranceThe Policy should qualify as a life insurance contract as long as it satisfies either the guideline premium/cash value corridor test or the cash value accumulation test as defined under Section 7702 of the Internal Revenue Code. One of these tests is chosen on the application. If a test is not chosen, the Policy will comply with the guideline premium/cash value corridor test. Once a test is chosen, it cannot be changed on the Policy.
The guideline premium/cash value corridor test places limitations on the amount of premium payments that may be made and on policy values that can accumulate relative to the death benefit. Guideline premium limits are determined when the Policy is issued and can vary by the death benefit option chosen. Guideline premium limits will likely change due to any adjustment to the Policy.
If at any time a premium is paid which would result in total premiums exceeding the current guideline premium limits, we accept only that portion of the premium which would make the total premiums equal the guideline premium limits.
The cash value accumulation test does not place limitations on the amount of premium payments but limits the amount of policy values that can accumulate relative to the death benefit.
To satisfy either test, the ratio of the death benefit to the policy value must be at least as great as the applicable percentage shown in Appendix D. As the policy value increases, the minimum death benefit may be required to increase. Because the cost of insurance you pay is based in part on the amount of the death benefit, an increase in the death benefit increases the cost of insurance.
As compared to the cash value accumulation test, the guideline premium/cash value corridor test generally has:• smaller applicable percentages • lower minimum death benefit • lower cost of insurance charges • better policy value growth.
The smaller applicable percentages lead to a lower minimum death benefit and thus lower cost of insurance charges. Lower charges result in better policy value growth.
This may not be the result in all cases. The specifics of each Policy determine which test is more suitable. Illustrations using each of the tests will help you determine which test meets your objectives. An illustration may be obtained from your registered representative or by calling 1-800-247-9988. The table below demonstrates the minimum death benefit based on the test chosen.
The example below is based on the following: • The insured is a male with an attained age of 45 at the time the Policy was issued. He dies at the beginning of
the sixth policy year (attained age 50)• Total Face amount is $100,000 • Death Benefit Option 1 • Policy value at the date of death is $25,000 • The minimum death benefit under the guideline premium/cash value corridor test is $46,250 (assuming an
applicable percentage of 185% x policy value)• The minimum death benefit under the cash value accumulation test is $71,477 (assuming an applicable
percentage of 285.909%)
The death benefit payable is the larger of these two amounts
FaceAmount
Minimum Deathbenefit
Net amount at risk used incalculating the cost of
insurance chargeGuideline Premium/Cash Value Corridor Test $100,000 $46,250 $74,753.98Cash Value Accumulation Test $100,000 $71,477 $74,753.98
Here’s the same example, but with a policy value of $75,000. Because the policy value has increased, the minimum death benefit is now:• $138,750 for the guideline premium/cash value corridor test• $214,432 for the cash value accumulation test.

31
The death benefit payable is the larger of these two amounts
FaceAmount
Minimum Deathbenefit
Net amount at risk used incalculating the cost of
insurance chargeGuideline Premium/Cash Value Corridor Test $100,000 $138,750 $63,408.65Cash Value Accumulation Test $100,000 $214,432 $138,904.20
Keep in mind that cost of insurance charges, which affect your Policy’s value, increase with the amount of the death benefit, as well as over time. The cost of insurance is charged at a rate per $1,000 of net amount at risk. As the net amount at risk increases, the cost of insurance increases. Policy value also varies depending on the performance of the investment options in your Policy.
All transactions will be subject to the limits as defined under Section 7702 of the Internal Revenue Code. A transaction may not be allowed, or an increase in total face amount may be required, if the transaction would cause a refund of premium and/or distribution of the policy value in order to maintain compliance with the Section 7702 limits.
Maturity ProceedsThe policy maturity date is the policy anniversary where the insured’s attained age is 121 and is shown on your current data pages. If the insured is living on the policy maturity date, the Policy is in force and you do not want the policy maturity date extended by the Extended Coverage Rider, maturity proceeds equal to the net surrender value are paid. If the Extended Coverage Rider is attached but you wish to receive the maturity proceeds at the Policy’s maturity and avoid conversion to Death Benefit Option 1, you must send instructions to our home office.
The maturity proceeds are paid either as a cash lump sum on the policy maturity date or under the benefit payment option you have selected. Only if the Extended Coverage Rider is present on the Policy will the policy maturity date automatically be extended to the date of the insured’s death (as explained in GENERAL DESCRIPTION OF THE POLICY — Optional Insurance Benefits).
Adjustment OptionsIncrease in Total Face AmountYou may request an increase in the total face amount at any time provided that the Policy is not in a grace period and monthly policy charges are not being waived under a rider. The minimum increase in total face amount is $10,000.
The request must be made on an adjustment application. The application must be signed by the owner(s) and the insured. If your request is not approved, no changes are made to your Policy.
We will approve your request if: • the insured is alive at the time of your request; and• the attained age of the insured is 75 or less at the time of the request; and• we receive evidence satisfactory to us that the insured is insurable under our underwriting guidelines in place at
the time of your request.
The increase in total face amount is in a risk classification determined by us. The adjustment is effective on the monthly date on or next following our approval of your request.
If you want insurance coverage to start at the time the adjustment application is submitted, an “adjustment premium” payment must be sent with the completed application. The amount of the adjustment premium is based on the face amount of the Policy, the death benefit option and the charges and expenses of the Policy. This amount is shown on the policy illustration provided to you by your registered representative. If this amount is submitted with the application, an adjustment premium conditional receipt will be given to you. The receipt acknowledges the adjustment premium payment and details any interim conditional insurance coverage.
Any adjustment premium payment made in connection with the adjustment application is held in our general account without interest (for a period of up to a 60 days) while we complete underwriting for the adjustment. If we approve the adjustment, on the effective date of the adjustment, the amount of the adjustment premium payment being held minus the premium expense charge is moved to the divisions and/or fixed account according to your then current premium allocation percentages.

32
The cost of insurance charge will increase in the event of an increase in a Policy’s total face amount. If there is insufficient value to pay the higher charges after an increase in total face amount, the Policy will lapse, unless the protections of the death benefit guarantee rider are in effect. The entire Policy would be at risk of lapsing, not just the incremental increase in total face amount.
Decrease in Total Face AmountOn or after the first policy anniversary, you may request a decrease in the total face amount. No transaction fee is imposed on decreases in the total face amount. A decrease in face amount lowers the cost of insurance charges but does not reduce surrender charges. A decrease is requested as follows:• the request must be made on an adjustment application; • the application must be signed by the owner(s); • the decrease is at least the minimum amount as determined by our underwriting guidelines in place at the time of
your request;• the decrease may not reduce the total face amount below $100,000; and• if there have been previous increases in the total face amount, the decrease of total face amount will be made on
a last in, first out basis.
A decrease may not be allowed if the decrease would cause a refund of premium and/or the distribution of the policy value in order to maintain compliance with the limits required by the Internal Revenue Code relating to the definition of life insurance.
Policy ValuesYour policy value is equal to the sum of the values in the divisions, the fixed account and loan account. The policy value:• increases as premiums are applied and interest is credited;• decreases as policy loans, partial surrenders and policy expenses are deducted; and• can increase or decrease as the investment experience of your chosen divisions fluctuates.
SURRENDERS AND PARTIAL SURRENDERSSurrendersYou must send us a written request for any surrender. The request must be signed by all owners, irrevocable beneficiary(ies), if any, and any assignees. The surrender is effective and the surrender value calculated as of the end of the valuation period during which we receive the written request for surrender. Partial surrenders may negatively affect your Death Benefit Guarantee rider, if applicable. Partial surrenders will reduce your face amount if under death benefit option 1 or 3.
Total and partial surrenders from the Policy are generally paid within five business days of our receipt of the written request for surrender. Certain delays in payment are permitted (see GENERAL DESCRIPTION — Delay of Payments).
Full SurrenderThe Policy may be surrendered while the Policy is in effect. If the full surrender is within ten years of the policy date or a policy face amount increase, a surrender charge is imposed. There is no refund of any monthly policy charges deducted before the full surrender effective date.
We reserve the right to require you to return the Policy to us prior to making any payment though this does not affect the amount of the net surrender value.
Unscheduled Partial SurrenderOn or after the first policy anniversary and prior to the policy maturity date, you may surrender a part of the net surrender value. You may take two unscheduled partial surrenders during a policy year before any transaction fees apply. After the second unscheduled partial surrender in a policy year, a transaction fee of the lesser of $25 or 2% of the amount surrendered is charged on each unscheduled partial surrender. An unscheduled partial surrender may not be less than $500 and may not be greater than 90% of the net surrender value as of the effective date of the unscheduled partial surrender. The unscheduled partial surrender may not decrease the total face amount to less than $100,000. Unscheduled partial surrenders will negatively affect your death benefit and your Death Benefit Guarantee rider, if applicable.

33
Your policy value is reduced by the amount of the unscheduled partial surrender plus any transaction fee. We surrender units from the divisions and/or values from the fixed account to equal the dollar amount of the surrender request. The amount of the surrender and the transaction fee are deducted from your divisions and/or fixed account according to the surrender allocation percentages you specify. If surrender allocation percentages are not specified, we use your monthly policy charge allocation percentages. No surrender charge is imposed on a partial surrender.
An unscheduled partial surrender may cause a reduction in total face amount. If the total face amount had been previously increased, any reduction of the total face amount at the time of partial surrender, is made on a last in, first out basis.• If Death Benefit Option 1 is in effect and the death benefit equals the total face amount, the total face amount is
reduced by the amount of the unscheduled partial surrender plus transaction fee that is not deemed to be a preferred partial surrender. In situations where the death benefit is greater than the total face amount, the total face amount is reduced by the amount the unscheduled partial surrender plus transaction fee exceeds the difference between the death benefit and total face amount.
Preferred Partial Surrender (pertains only if Death Benefit Option 1 is in effect).During policy years two through 15, 10% of the net surrender value as of the end of the prior policy year may be surrendered without a subsequent decrease in the total face amount. As discussed above, any amount surrendered in excess of 10% would not constitute a preferred partial surrender and would cause a reduction in the total face amount. The 10% preferred partial surrender privilege is not cumulative from year-to-year and cannot exceed $100,000 in any policy year or $250,000 over the life of the Policy.The maximum preferred partial surrender is equal to ((a) plus (b)) not to exceed (c) where:(a) is the amount of the unscheduled partial surrender plus transaction fee; (b) is the amount of any preferred partial surrenders in the same policy year; and(c) is 10% of the net surrender value at the end of the prior policy year.
• If the Death Benefit Option 2 is in effect, there is no reduction in the total face amount upon a unscheduled partial surrender.
• If the Death Benefit Option 3 is in effect, the total face amount is reduced by the lesser of (a) or (b) where:(a) is the amount of the unscheduled partial surrender; and (b) is the greater of (i) the amount that total partial surrenders exceed total premiums paid; or (ii) zero.
Scheduled Partial SurrenderOn or after the first policy anniversary and prior to the policy maturity date, you may elect to receive part of your net surrender value automatically on any monthly date.• You select the amount of the surrender and the surrender frequency (annually, semi-annually, quarterly or
monthly (based on policy year)).• Your policy value is reduced by the amount of any scheduled partial surrender.• The surrender is deducted from your division(s) and/or fixed account according to your monthly policy charge
allocation percentages.• Each scheduled partial surrender may not be greater than 90% of the net surrender value (as of the date of the
scheduled partial surrender).• Scheduled partial surrenders will continue until we receive your instructions to stop them or until surrenders
equal premiums paid. Once surrenders equal premiums paid, if there is any remaining net surrender value, scheduled policy loans will automatically begin, unless you direct us otherwise, so as to provide you the same dollar amount at the same frequency as you had received under the scheduled partial surrenders.
• A scheduled partial surrender may cause a reduction in total face amount:• If Death Benefit Option 1 is in effect and the death benefit equals the total face amount, the total face amount
is reduced on the first monthly date a scheduled partial surrender is effective (and each subsequent policy anniversary). The amount of the reduction is the sum of the scheduled partial surrenders planned for that policy year that are not deemed to be a preferred partial surrender. If the amount of the scheduled partial surrender is increased, the total face amount is reduced on the monthly date the change is effective. If the amount of the scheduled partial surrender is decreased, the total face amount is not increased.

34
If the death benefit is greater than the total face amount, the total face amount is reduced by the amount determined above which exceeds the difference between the death benefit and total face amount.
Preferred Partial Surrender (pertains only if Death Benefit Option 1 is in effect).During policy years two through 15, 10% of the net surrender value as of the end of the prior policy year may be surrendered without a subsequent decrease in the total face amount. As discussed above, any amount surrendered in excess of 10% would not constitute a preferred partial surrender and would cause a reduction in the total face amount. The 10% preferred partial surrender privilege is not cumulative from year-to-year and cannot exceed $100,000 in any policy year or $250,000 over the life of the Policy.The maximum preferred partial surrender is equal to ((a) plus (b)) not to exceed (c) where:(a) is the amount of the scheduled partial surrenders planned for that policy year;(b) is the amount of any preferred partial surrenders in the same policy year; and(c) is 10% of the net surrender value at the end of the prior policy year.
• If the Death Benefit Option 2 is in effect, there is no reduction in the total face amount upon a scheduled partial surrender.
• If the Death Benefit Option 3 is in effect, the total face amount is reduced on the first monthly date a scheduled partial surrender is effective and on each subsequent policy anniversary. The total face amount may also be reduced on the monthly date any increase to a scheduled partial surrender is effective. The total face amount is reduced by the lesser of (a) or (b) where:(a) is the amount of the scheduled partial surrenders planned for that policy year; and(b) is the greater of (i) the amount that total partial surrenders exceed total premiums paid; or (ii) zero.
Examination Offer (Free-Look Provision)It is important to us that you are satisfied with the purchase of your Policy. Under state law, you have the right to return the Policy for any reason during the examination offer period (a “free look”). If you properly exercise your free look, we will rescind the policy and we will pay you a refund. The state in which the Policy is issued determines the examination offer period and the type of refund that applies.
If you return this Policy before expiration of the examination offer period, we will refund your full premium in states where required. In states where permitted, we will refund the net policy value, which may be more or less than your premium.
Your request to return the Policy must be in writing. The request and the Policy must be mailed to us or returned to the agent no later (as determined by the postmark) than the last day of the examination offer period as shown below.
The examination offer period is the later of: • 10 days after you receive the Policy, or • such later date as specified by applicable state law.
NOTE: See GENERAL DESCRIPTION OF THE POLICY – Delay of Payments
LOANSPolicy LoansWhile your Policy is in effect (but after the examination offer period) and has a net surrender value, you may borrow money from us with the Policy as the security for the policy loan.• The maximum amount you may borrow is 90% of the net surrender value as of the date we process the policy
loan.• If telephone privileges apply, you may request a policy loan of $100,000 or less by calling us at 1-800-247-9988.
If you do not have telephone privileges or are requesting a policy loan of more than $100,000, the request must be made in writing.
• Generally, policy loan proceeds are sent within five business days from the date we receive your request (see GENERAL DESCRIPTION OF THE POLICY — Delay of Payments).
• Requests for policy loans from any joint owner are binding on all joint owners.• Policy loans may negatively affect your Death Benefit Guarantee rider, if applicable (see POLICY TERMINATION
AND REINSTATEMENT — Policy Termination (Lapse)).

35
You are charged interest on any loan indebtedness. During the first ten policy years, the interest rate is 5.00% per year. After policy year ten, the interest rate is 4.00% per year. Interest accrues daily and is due and payable at the end of the policy year. If interest is not paid when due, it is added to the loan indebtedness. Adding unpaid interest to the loan indebtedness causes additional amounts to be redeemed from the division(s) and/or fixed account and redemption proceeds transferred to the loan account. Redemptions are made in the same proportion as the allocation used for the most recent monthly policy charge.
A policy loan generally has a permanent effect on policy values. If a policy loan had not been made, the policy value would reflect the investment experience of the division(s) and the interest credited to the fixed account. In addition, loan indebtedness is subtracted from:• death proceeds at the death of the insured; • surrender value upon full surrender or termination of a Policy; and• maturity proceeds paid.
Loan indebtedness reduces your net policy value. If the net policy value is less than the monthly policy charges on a monthly date, the 61-day grace period provision applies (see POLICY TERMINATION AND REINSTATEMENT — Policy Termination (Lapse)).
If the Policy lapses with any loan indebtedness, there may be negative tax consequences.
Loan AccountWhen a policy loan is taken, a loan account is established. The loan account is part of our general account.
An amount equal to the loan is transferred from your divisions and/or fixed account to your loan account. You may instruct us on the proportions to be taken from your divisions or the fixed account. There are no restrictions on which divisions or accounts that the loan amount can be transferred from.
Your loan account earns interest from the date of transfer. The loan account interest rate is 4.00% per year. Interest accrues daily and is paid at the end of the policy year.
Unscheduled LoansUnscheduled loans are available in all policy years. You may instruct us on the proportions to be taken from your accounts. If you do not provide such instruction, the loan amount is withdrawn in the same proportion as the allocation used for the most recent monthly policy charge.
Scheduled LoansAfter the first policy year, scheduled policy loans are available on any monthly date if you have withdrawn, through partial surrenders, an amount equal to or exceeding total premiums paid. A scheduled loan is the equivalent of a scheduled withdrawal of earnings following the withdrawal of all premiums paid. Scheduled loans may occur on a monthly, quarterly, semiannual or annual basis (based on the policy year). The loan amount is withdrawn in the same proportion as the allocation used for the most recent monthly policy charge.
Loan PaymentsWhile the Policy is in force and before the insured dies, you may pay the loan indebtedness as follows:• policy loans may be repaid totally or in part; • repayments are allocated to the division(s) and/or the fixed account in the proportions used for allocation of
premium payments;• payments that we receive that are not designated as premium payments are applied as loan repayments if there
is any loan indebtedness;• the repayments are allocated as of the valuation period in which we receive the repayment; and• repayments are to be sent to our home office.
36
POLICY TERMINATION AND REINSTATEMENTPolicy Termination (Lapse)A Policy will go into default and is at risk of terminating if the net policy value on any monthly date is less than the monthly policy charge.
Before any Policy lapses, the Policy will enter a grace period, described below, during which you may pay the minimum required premium to keep your Policy in force. A Policy will terminate if you have not made the minimum required premium payment before the grace period expires.
The Policy also terminates: • when you make a full Policy surrender; • when death proceeds are paid; and • when the maturity proceeds are paid.
When the Policy terminates, all privileges and rights of the owner(s) and all optional insurance benefits will end. Subject to certain conditions, you may reinstate a policy that has terminated (see POLICY TERMINATION AND REINSTATEMENT — Reinstatement).
Grace Period If a Policy goes into default and is at risk of terminating, we will send you notice of a 61-day grace period during which you can pay the minimum required premium to keep your Policy in force. This grace period begins on the date we mail the notice of impending policy termination to you. The notice will be sent to your last post office address known to us and will tell you the amount of the minimum required premium to keep the Policy in force, payment instructions; and the grace period end date.
Your Policy will remain in force during the grace period. If we do not receive the minimum required premium payment by the end of the grace period, your Policy will terminate without value.
No partial surrenders or policy loans may be made during a grace period.
Minimum Required PremiumThe minimum required premium is intended to a) reimburse us for the monthly policy charges during the grace period and b) provide enough policy value to pay the monthly policy charge on the first monthly date after the grace period.
The minimum required premium payment is ((a) plus (b)) divided by (c) where: (a) is any amount by which your net policy value is less than zero at the start of the grace period after the
monthly policy charge is deducted;(b) is three monthly policy charges; and (c) is 1 minus the maximum premium expense charge. See CHARGES AND DEDUCTIONS — Premium
Expense Charge (Sales Charge and Taxes)
If the grace period ends before we receive the minimum required premium, we keep any remaining value in the Policy to cover past due policy charges. Adverse market fluctuations may cause the Policy to enter into subsequent grace periods.
Death during Grace PeriodIf the insured dies during a grace period, the death benefit is paid and the amount is reduced by:• all monthly policy charges due and unpaid at the death of the insured; and• any loan indebtedness.
NOTE: The state of Florida requires that the net policy value of the Policy equal zero prior to entering a grace period. The grace period will end 31 days after the day the notice is mailed.

37
ReinstatementSubject to certain conditions, you may reinstate a Policy that terminated as described in POLICY TERMINATION AND REINSTATEMENT - Policy Termination (Lapse). The Policy may be reinstated provided all of the following conditions are satisfied:
(a) such reinstatement is prior to the policy maturity date; (b) You have not surrendered your Policy; (c) not more than three years have elapsed since the policy terminated; (d) You supply evidence which satisfies us that the insured is alive and is insurable under our underwriting
guidelines then in effect; and(e) You make the minimum required premium payment.
The minimum required premium is intended to a) reimburse us for the monthly policy charges during the grace period and b) provide enough policy value to pay monthly policy charges for three policy months after reinstatement. The minimum required premium payment is [(1) plus (2)] divided by (3) where:
(1) is any amount by which your net policy value is less than zero at the end of the grace period after the monthly policy charge is deducted;
(2) is three monthly policy charges; and (3) is 1 minus the maximum premium expense charge. See CHARGES AND DEDUCTIONS — Premium
Expense Charge (Sales Charge and Taxes)
NOTE: The minimum required premium during a grace period and the minimum required premium to reinstate a policy are calculated differently. The minimum required premium for reinstatement is calculated in order to collect policy charges due and unpaid during the grace period in addition to providing enough policy value to pay three monthly policy charges after reinstatement of the Policy. As a result, the minimum required premium for reinstatement is higher than the minimum required premium for grace period.
Reinstatement will be effective on the next monthly date following the date we approve the reinstatement application. Your rights and privileges as owner(s) are restored upon reinstatement. The reinstated Policy will have the same policy date as the original Policy. The Death Benefit Guarantee rider will be as if the Policy had never ended. You will receive new data pages upon reinstatement.
If a policy loan or loan interest was unpaid when the Policy terminated, the policy loan must be reinstated or repaid (loan interest does not accrue over the period the Policy was terminated).We do not require payment of monthly policy charges during the period the Policy was terminated.
Premiums received with your reinstatement application are held in our general account without interest while we complete underwriting for the reinstatement. If the reinstatement is approved, premiums are allocated to your selected division(s) and/or fixed account on the reinstatement date. We will use the premium allocation percentages in effect at the time of termination of the Policy unless you provide new allocation instructions.
If you reinstate your Policy, the surrender charge, if any, the premium expense charge, and the monthly policy issue charge are calculated based on the number of years since the Policy was issued.
38
TAX ISSUES RELATED TO THE POLICYThe following description is a general summary of the tax rules pertaining to life insurance policies. This section relates primarily to federal income taxes rules, regulations and interpretations, which in our opinion are currently in effect but which are subject to change at any time. This summary is not comprehensive and is not intended as tax advice. While we reserve the right to change the Policy to assure it continues to qualify as life insurance for tax purposes, we cannot make any guarantee regarding the future tax treatment of any Policy.
NOTE: Due to the complexity of these rules and because they are affected by the facts and circumstances of each Policy, you should consult with legal and tax counsel and other competent advisors regarding these matters.
Taxation of Death ProceedsUnder Section 101(a)(1) of the Internal Revenue Code, gross income does not include amounts received under a Policy if such amounts are paid by reason of the death of the insured. However, if the Policy is transferred for valuable consideration, then a portion of the death proceeds may be includable in the beneficiary’s gross income under Section 101(a)(2) of the Internal Revenue Code.
Under Section 101(g) of the Internal Revenue Code, certain amounts received under a Policy on the life of an insured who qualifies as a terminally or chronically ill individual can be excluded from gross income as an amount paid by reason of the death of the insured.
For employer-owned life insurance on the life of an insured who is an employee, the death benefit amount excluded from gross income is limited to the premiums and other consideration paid for the life insurance if the employer is directly or indirectly a beneficiary under the Policy unless certain requirements are met. These requirements are provided in Section 101(j) of the Internal Revenue Code and would include notice and consent by the insured of the life insurance coverage prior to the issuance of the coverage. These rules generally apply to employer-owned life insurance issued or materially changed on or after August 17, 2006.
Taxation of Maturity ProceedsA taxable event may occur if the net surrender value at maturity plus any loan indebtedness is greater than premiums paid less partial surrenders and premium refunds. The taxable amount is the difference between the surrender value and the remaining premiums in the policy.
Taxation of Growth in Policy ValueAny increase in policy value is not included in gross income while the Policy is in-force and continues to meet the definition of life insurance as defined under Section 7702 of the Internal Revenue Code. If a contract does not meet the definition of life insurance, the policy owner will be subject to income tax on annual increases in cash value.
Taxation of Policy Surrenders and Partial Surrenders (including Preferred Partial Surrenders)A surrender or lapse of the Policy may have income tax consequences. Upon surrender, the owner(s) is not taxed on the surrender value except for the amount, if any, that exceeds the gross premiums paid less the untaxed portion of any prior surrenders. The amount of any loan indebtedness, upon surrender or lapse, is added to the net surrender value and treated, for this purpose, as if it had been received. A loss incurred upon surrender is generally not deductible. The tax consequences of a surrender may differ if the proceeds are received under any benefit payment option.
A full surrender of the Policy will, and a partial surrender may, be included in your gross income to the extent that the distribution exceeds your premiums paid into the Policy. Partial surrenders generally are not taxable unless the total of such surrenders exceeds total premiums paid to the date of partial surrender less the untaxed portion of any prior partial surrenders. If within the first fifteen policy years, you make a partial surrender with a corresponding reduction in the total face amount, special rules apply. Under those circumstances, the Internal Revenue Code has defined a special formula under which you may be taxed on all or a portion of the surrender amount.
Transfers between the division(s) and/or fixed account are not considered as distributions from the Policy and would not be considered taxable income.
Taxation of Policy Loans and Loan InterestIf the Policy is not a modified endowment contract, loans received under the Policy are not generally considered to be distributions subject to tax. Interest paid to us as a result of a policy loan may or may not be deductible depending on a number of factors.

39
If the Policy is a modified endowment contract, loans received under the Policy are considered to be distributions subject to tax. The taxable amount is generally the difference between the policy value and the net premiums paid at the time the loan is made.
If the Policy lapses with an outstanding loan balance, there may be tax consequences.
Taxation of Change of OwnerTransfer of ownership may have tax consequences to the owner. The sale of a life insurance policy may have different income tax consequences than the cash surrender of such policy. Please consult with your tax advisor before changing ownership of your life insurance policy.
Taxation of Change of InsuredFor tax purposes, changing the insured is considered to be the same as a surrender of the policy. The taxable amount is generally the difference between the policy value and the net premiums paid.
Modified Endowment Contract StatusA Policy becomes a Modified Endowment Contract when premiums paid exceed certain premium limits as defined by Section 7702A of the Internal Revenue Code. There is no change regarding the tax-deferred internal build-up of policy value or the income tax-free death benefit to your beneficiary(ies), however, distributions from a Modified Endowment Contract are taxed as if the Policy is a deferred annuity. Thus, taxation on partial surrenders, policy loans and other defined distributions will occur if your policy value is greater than your premiums paid. In addition, taxable distributions are subject to a federal income tax penalty of 10% unless the distribution is• made after the owner attains age 59½; or • attributable to the taxpayer becoming disabled; or • part of a series of substantially equal periodic payments (made not less frequently than annually) made for the
life or life expectancy of the taxpayer or the joint lives or joint life expectancy of the taxpayer and beneficiary.
Once a Policy is classified as a Modified Endowment Contract, the classification cannot be changed. Modified endowment contract classification may be avoided by limiting the amount of premiums paid under the Policy. In the absence of your instructions, we will refund all or part of the premium payment that would make the Policy a modified endowment contract.
Taxation of Exchange or Assignment of PoliciesAn exchange or assignment of a Policy may have tax consequences. Please consult with your tax advisor before exchanging or assigning your life insurance policy.
Corporate Alternative Minimum TaxOwnership of a Policy by certain corporations may affect the owner’s exposure to the corporate alternative minimum tax. In determining whether it is subject to alternative minimum tax, the corporate owner must make two computations. First, the corporation must take into account a portion of the current year’s increase in the built-in gain in its corporate owned policies. Second, the corporation must take into account a portion of the amount by which the death benefits received under any Policy exceed the sum of a) the premiums paid on that Policy in the year of death, and b) the corporation’s basis in the Policy (as measured for alternative minimum tax purposes) as of the end of the corporation’s tax year immediately preceding the year of death. The corporate alternative minimum tax does not apply to S Corporations. Such tax also does not apply to “Small Corporations” as defined by Section 55(e) of the Internal Revenue Code.
Special Considerations for Life Insurance Owned by a Business EntitySection 264 of the Internal Revenue Code imposes numerous limitations on the interest and other business deductions that may otherwise be available to businesses that own life insurance policies. In addition, the premium paid by a business for a life insurance policy is not deductible as a business expense or otherwise if the business is directly or indirectly a beneficiary of the policy.
Other Tax IssuesFederal estate taxes and state and local estate, inheritance and other taxes may become due depending on applicable law and your circumstances or the circumstances of the Policy beneficiary(ies) if you or the insured dies.
40
WithholdingWithholding is generally required on certain taxable distributions under insurance contracts. In the case of periodic payments, the withholding is at graduated rates. With respect to non-periodic distributions, withholding is a flat rate of 10%. You may elect to have either non-periodic or periodic payments made without withholding except if your tax identification number has not been furnished to us or if the IRS has notified us that the number you furnished is incorrect. Non-resident aliens are subject to 30% withholding (or lower treaty rate) on taxable distributions.
Under the Foreign Account Tax Compliance Act (FATCA), We will be required to withhold a 30% tax on certain distributions to certain foreign entities that fail to comply with new reporting and withholding requirements designed to inform the U.S. Department of the Treasury. We may disclose the information we receive from policy owners to the IRS, non-U.S. taxing authorities or other parties as necessary to comply with FATCA. Withholding also may be required if a policy owner that is a foreign entity fails to provide Us with appropriate certifications or other documentation concerning its status under FATCA.
Mutual Fund DiversificationThe United States Treasury Department has adopted regulations under Section 817(h) of the Internal Revenue Code which establishes standards of diversification for the investments underlying the contracts. Under this Internal Revenue Code Section, Separate Account investments must be adequately diversified in order for the increase in the value of contracts to receive tax-deferred treatment. In order to be adequately diversified, the portfolio of each underlying mutual fund must, as of the end of each calendar quarter or within 30 days thereafter, have no more than 55% of its assets invested in any one investment, 70% in any two investments, 80% in any three investments and 90% in any four investments. Variable life insurance Separate Accounts are provided a special diversification exemption when investing in U.S. Treasury securities.
Failure of an underlying mutual fund to meet the diversification requirements could result in tax liability to contract holders. The investment opportunities of the underlying mutual funds could conceivably be limited by adhering to the above diversification requirements.
GENERAL PROVISIONSFrequent Trading and Market-Timing (Abusive Trading Practices)This Policy is not designed for frequent trading or market timing activity of the investment options. If you intend to trade frequently and/or use market timing investment strategies, you should not purchase this Policy. The Company does not accommodate market timing.
We consider frequent trading and market timing activities to be abusive trading practices because they:• Disrupt the management of the underlying mutual funds by;
• forcing the fund to hold short-term (liquid) assets rather than investing for long term growth, which results in lost investment opportunities for the fund; and
• causing unplanned portfolio turnover; • Hurt the portfolio performance of the underlying mutual funds; and• Increase expenses of the underlying mutual fund and separate account due to;
• increased broker-dealer commissions; and • increased recordkeeping and related costs.
If we are not able to identify such abusive trading practices, the abuses described above will negatively impact the Policy and cause investors to suffer the harms described.
We have adopted policies and procedures to help us identify and prevent abusive trading practices. In addition, the underlying mutual funds monitor trading activity to identify and take action against abuses. While our policies and procedures are designed to identify and protect against abusive trading practices, there can be no certainty that we will identify and prevent abusive trading in all instances. When we do identify abusive trading, we will apply our policies and procedures in a fair and uniform manner.
41
If we, or an underlying mutual fund that is an investment option with the Policy, deem abusive trading practices to be occurring, we will take action that may include, but is not limited to:• Rejecting transfer instructions from a Policy owner or other person authorized by the owner to direct transfers;• Restricting submission of transfer requests by, for example, allowing transfer requests to be submitted by
1st class U.S. mail only and disallowing requests made via the internet, by facsimile, by overnight courier or by telephone;
• Limiting the number of unscheduled transfers during a Policy year to no more than 12;• Prohibiting you from requesting a transfer among the divisions for a minimum of thirty days where there is
evidence of at least one round-trip transaction (exchange or redemption of shares that were purchased within 30 days of the exchange/redemption) by you; and
• Taking such other action as directed by the underlying mutual fund.
We will support the underlying mutual funds’ right to accept, reject or restrict, without prior written notice, any transfer requests into a fund.
In some instances, a transfer may be completed inadvertently after we have notified a Policy owner that we believe that the Policy owner may have been engaging in abusive trading practices. In those instances, we will reverse the transfer (within two business days after the transfer) and return the Policy to the investment options it had prior to the transfer. The reversal will be effected at the unit values determined on the date of the reversal. As a result, the Policy owner assumes the risk of any gains or losses associated with an investment in the transferee division instead of in the transferor division between the time of the transfer and the time of the reversal of the transfer. We will give the Policy owner notice in writing of the reversal.
Purchase ProceduresA completed application and required supplements must be submitted to us through an agent or broker selling the Policy.
The minimum total face amount when the Policy is originally issued is $100,000. We reserve the right to increase or decrease the minimum total face amount. The increased minimum total face amount would apply only to Policies issued after the effective date of the increase.
To issue a Policy, we require that the age of the insured be 75 or younger as of the policy date. Other underwriting restrictions may apply. An applicant for the Policy must:• furnish satisfactory evidence of insurability of the insured; and• meet our insurance underwriting guidelines and suitability rules.
If you want insurance coverage to start at the time the application is submitted, a payment must be sent with the completed application. The amount is based on the face amount of the Policy, the death benefit option and the charges and expenses of the Policy. This amount is shown on the policy illustration provided to you by your registered representative. If this amount is submitted with the application, a conditional receipt will be given to you. The receipt acknowledges the initial payment and details any interim conditional insurance coverage.
We reserve the right to reject any application or related premium if we determine that we have not received complete information and/or instructions or that our underwriting guidelines, suitability rules or procedures have not been met. Any premium submitted will be returned to the designated owner on the application no later than five business days from the date the application was rejected.
Important Information about Customer Identification Procedures To help the government fight the funding of terrorism and money laundering activities, federal law requires financial institutions to obtain, verify, and record information that identifies each person who opens an account. When you open an account, we will ask for your name, address, date of birth, and other information that will allow us to verify your identity. We may also ask to see your driver’s license or other identifying documents.
If concerns arise with verification of your identification, no transactions, other than redemptions, will be permitted while we attempt to reconcile the concerns. If we are unable to verify your identity within 30 days of our receipt of your original purchase, the account(s) will be closed and redeemed in accordance with normal redemption procedures.
We do not knowingly sell policies that are for the benefit of a business/organization that is illegal under Federal and/or State law (such as a marijuana clinic), or a person who owns or receives income from such an entity or whose source of funds is illegal.

42
Policy DateIf we issue a Policy, a policy date is determined. Policies will not be dated on the 29th, 30th or 31st of any month. Policies that would otherwise be dated on these dates will be dated on the first day of the following month. The policy date is shown on the current data pages. Current data pages are the most recent policy specification pages issued to a Policy owner and are located in the Policy.
Upon specific request and our approval, the Policy may be backdated. The policy date may not be more than six months prior to the date of application (or shorter period if required by state law). Payment of at least the monthly policy charges is required for the backdated period. Monthly policy charges are deducted from the policy value for the backdated period.
Effective DateThe Policy date and the effective date are the same unless a backdated policy date is requested. Insurance coverage is effective, provided all purchase requirements for the Policy have been satisfied.
If the proposed insured dies before the effective date, there is no coverage under the Policy (coverage is determined solely under the terms of the conditional receipt, if any).
Special Purchase PlansWhere permitted by state law, Policies may be purchased under group or sponsored arrangements as well as on an individual basis. A group arrangement is a program under which a trustee, employer, or similar entity purchases Policies covering a group of individuals on a group or individual basis. A sponsored arrangement is a program under which an employer permits group solicitation of its employees or an association permits group solicitation of its members for the purchase of Policies on an individual basis.
Charges and deductions may be reduced for Policies purchased under a group or sponsored arrangement including waiver of premium sales load and waiver of surrender charge. Reductions may be available to:• employees, officers, directors, agents, and immediate family members of the group or sponsored
arrangement; and• employees or agents of the Company and its subsidiaries.
Reductions are made under our rules in effect on the date a Policy application is approved and are based on certain criteria (size of group, expected number of participants, anticipated premium payments, total assets under management for the group or sponsored arrangement).
Generally, the sales contacts and effort, administrative costs and mortality cost per Policy vary based on the size of the arrangement, the purpose for which the Policies are purchased, and certain characteristics of the members. The amount of the reduction and the criteria for reducing the charges and deductions reflect: a) our reduced sales effort and administrative costs; and b) the different mortality experience expected from sales to group or sponsored arrangements.
We may modify, on a uniform basis, both the amounts of reductions and the criteria for qualification. Reductions in these charges will not discriminate unfairly against any person, including the affected owners and all other Policy owners with policies funded with the Separate Account.
Distribution of the PolicyThe Company has appointed Principal Securities, Inc. ("PSI") (formerly, Princor Financial Services Corporation), Des Moines, Iowa 50392-0200, a broker-dealer registered under the Securities Exchange Act of 1934, a member of the Financial Industry Regulatory Authority and an affiliate of the Company, as the distributor and principal underwriter of the Policy. The Company pays commissions on sales of the Policy of no more than 50% of premiums received by the Company in the first policy year (or first policy year following an adjustment) up to the target premium. In addition, a commission of up to 2.5% of premium above the target premium received in the first policy year (or first year following an adjustment) may be paid. In the second through fifth years following the policy date (or adjustment date), commissions range from 0% to 2.5% of premiums received. A service fee of up to 0.25% of net policy value is paid in the sixth through tenth policy years and up to 0.10% of net policy value in policy years eleven and beyond. Expense allowances may be paid to agents and brokers based on premiums received. PSI also may receive 12b-1 fees in connection with purchases and sales of mutual funds underlying the Policies. The 12b-1 fees for the underlying mutual funds are shown in the prospectuses of each underlying mutual fund.

43
Applications for the Policies are solicited by registered representatives of PSI or such other broker-dealers as have entered into selling agreements with PSI. Such registered representatives act as appointed agents of the Company under applicable state insurance law and must be licensed to sell variable insurance products. The Company intends to offer the Policy in all jurisdictions where it is licensed to do business and where the Policy is approved.
Payments to Financial IntermediariesThe Company pays compensation to broker-dealers, financial institutions and other parties (“Financial Intermediaries”) for the sale of the Policy according to schedules in the sales agreements and other agreements reached between the Company and the Financial Intermediaries. Such compensation generally consists of commissions on premiums paid on the Policy. The Company and/or its affiliates may also pay other amounts (“Additional Payments”) that include, but are not limited to, marketing allowances, expense reimbursements and education payments. These Additional Payments are designed to provide incentives for the sale and retention of the Policies as well as other products sold by the Company and may influence the Financial Intermediary or sales representative to recommend the purchase of this Policy over competing policies or over other investment options. You may ask your sales representative about these differing and divergent interests, how she/he is personally compensated and how his/her broker-dealer is compensated for soliciting applications for the Policy.
Service Arrangements and CompensationThe Company and/or PSI have entered into agreements with the distributors, advisers and/or the affiliates of some of the mutual funds underlying the Policy and receive compensation for providing certain services including, but not limited to, distribution and operational support services, to the underlying mutual fund. Fees for these services are paid periodically (typically, quarterly or monthly) based on the average daily net asset value of shares of each fund held by the Separate Account and purchased at the Policy owners’ instructions. Because the Company and PSI receive such fees, they may be subject to competing interests in making these funds available as investment options under the Policy. The Company takes into consideration the anticipated payments from underlying mutual funds when it determines the charges assessed under the Policy. Without these payments, charges under the Policy are expected to be higher.
Statement of ValuesYou will receive an annual policy statement once each year. The statement will show:• current death benefit; • current policy value and net surrender value; • all premiums paid since the last statement; • all charges since the last statement; • any loan indebtedness; • any partial surrenders since the last statement; • the number of units and unit value; • total value of each of the divisions and of the fixed account;• designated beneficiary(ies); and • all riders included in the Policy.
At any time, you may request a free current statement by telephoning 1-800-247-9988.
We also send you the reports required by the Investment Company Act of 1940 (as amended).
Services Available via the TelephoneIf you elect to use telephone privileges, instructions for the following transactions may be given to us via the telephone:• change in allocations of future premium payments; • change in allocation of the monthly policy charge; • change to your APR instructions; • change to your scheduled transfer instructions; • unscheduled transfers; and • request for a policy loan (of $100,000 or less).
44
Instructions: • may be given by calling us at 1-800-247-9988 between 8 a.m. and 5 p.m. Eastern Time on any day that the
NYSE is open;• must be received by us before the close of the NYSE (generally 4:00 p.m. Eastern Time) to be effective the day
they are given;• are effective the next business day if not received until after the close of the NYSE.
Although neither the Separate Account nor the Company is responsible for the authenticity of telephone transaction instructions, the Separate Account and the Company reserve the right to refuse telephone instructions. You are liable for a loss resulting from a fraudulent telephone or internet order that we reasonably believe is genuine. We use reasonable procedures to assure instructions are genuine. If the procedures are not followed, we may be liable for loss due to unauthorized or fraudulent transactions. The procedures for telephone instructions include: recording all telephone instructions, requesting personal identification information (name, phone number, social security number, birth date, etc.) and sending written confirmation to the owner’s address of record.
Misstatement of Age or GenderIf the age or, where applicable, gender of the insured has been misstated, we adjust the death benefit payable under your Policy to reflect the amount that would have been payable at the correct age and gender.
Non-Participating PolicyThe Policies do not share in any divisible surplus of the Company.
IncontestabilityWe will not contest the insurance coverage provided by the Policy, except for any increases in total face amount, after the Policy has been in force during the lifetime of the insured for a period of two years from the policy date. Any total face amount increase has its own two-year contestability period that begins on the effective date of the adjustment. In many states, the time limit in the incontestability period does not apply to fraudulent misrepresentations.
Independent Registered Public Accounting FirmThe financial statements of the Principal Life Insurance Company Variable Life Separate Account and the consolidated financial statements of the Principal Life Insurance Company are included in the Statement of Additional Information. Those statements have been audited by Ernst & Young LLP, independent registered public accounting firm, 801 Grand Avenue, Des Moines, Iowa 50309, for the periods indicated in their reports.
LEGAL PROCEEDINGS
There are no legal proceedings pending to which the Separate Account is a party or which would materially affect the Separate Account.
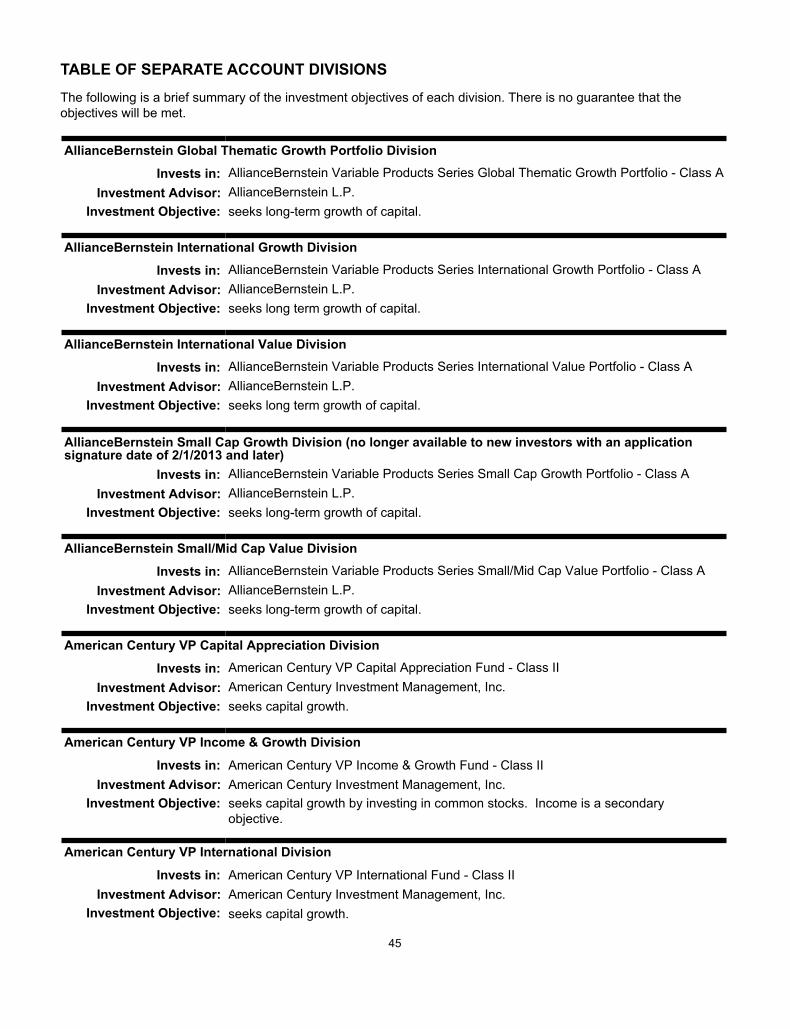
45
TABLE OF SEPARATE ACCOUNT DIVISIONS
The following is a brief summary of the investment objectives of each division. There is no guarantee that the objectives will be met.
AllianceBernstein Global Thematic Growth Portfolio Division
Invests in: AllianceBernstein Variable Products Series Global Thematic Growth Portfolio - Class AInvestment Advisor: AllianceBernstein L.P.
Investment Objective: seeks long-term growth of capital.
AllianceBernstein International Growth Division
Invests in: AllianceBernstein Variable Products Series International Growth Portfolio - Class AInvestment Advisor: AllianceBernstein L.P.
Investment Objective: seeks long term growth of capital.
AllianceBernstein International Value Division
Invests in: AllianceBernstein Variable Products Series International Value Portfolio - Class AInvestment Advisor: AllianceBernstein L.P.
Investment Objective: seeks long term growth of capital.
AllianceBernstein Small Cap Growth Division (no longer available to new investors with an applicationsignature date of 2/1/2013 and later)
Invests in: AllianceBernstein Variable Products Series Small Cap Growth Portfolio - Class AInvestment Advisor: AllianceBernstein L.P.
Investment Objective: seeks long-term growth of capital.
AllianceBernstein Small/Mid Cap Value Division
Invests in: AllianceBernstein Variable Products Series Small/Mid Cap Value Portfolio - Class AInvestment Advisor: AllianceBernstein L.P.
Investment Objective: seeks long-term growth of capital.
American Century VP Capital Appreciation Division
Invests in: American Century VP Capital Appreciation Fund - Class IIInvestment Advisor: American Century Investment Management, Inc.
Investment Objective: seeks capital growth.
American Century VP Income & Growth Division
Invests in: American Century VP Income & Growth Fund - Class IIInvestment Advisor: American Century Investment Management, Inc.
Investment Objective: seeks capital growth by investing in common stocks. Income is a secondaryobjective.
American Century VP International Division
Invests in: American Century VP International Fund - Class IIInvestment Advisor: American Century Investment Management, Inc.
Investment Objective: seeks capital growth.

46
American Century VP Mid Cap Value Division
Invests in: American Century VP Mid Cap Value Fund - Class IIInvestment Advisor: American Century Investment Management, Inc.
Investment Objective: seeks long-term capital growth. Income is a secondary objective.
American Century VP Value Division
Invests in: American Century VP Value Fund - Class IIInvestment Advisor: American Century Investment Management, Inc.
Investment Objective: seeks long-term capital growth. Income is a secondary objective.
American Funds Insurance Series Blue Chip Income and Growth DivisionInvests in: American Funds Insurance Series - Blue Chip Income and Growth Fund - Class 2
SharesInvestment Advisor: Capital Research and Management Company
Investment Objective: seeks to produce income exceeding the average yield on U.S stocks generally and toprovide an opportunity for growth of principal consistent with sound common stockinvesting.
American Funds Insurance Series Global Bond DivisionInvests in: American Funds Insurance Series - Global Bond Fund - Class 2 Shares
Investment Advisor: Capital Research and Management CompanyInvestment Objective: seeks to provide, over the long term, a high level of total return consistent with prudent
investment management.
American Funds Insurance Series Growth Fund DivisionInvests in: American Funds Insurance Series - Growth Fund - Class 2 Shares
Investment Advisor: Capital Research and Management CompanyInvestment Objective: seeks growth of capital.
American Funds Insurance Series International Fund DivisionInvests in: American Funds Insurance Series - International Fund - Class 2 Shares
Investment Advisor: Capital Research and Management CompanyInvestment Objective: seeks long-term growth of capital.
American Funds Insurance Series New World Fund DivisionInvests in: American Funds Insurance Series - New World Fund - Class 2 Shares
Investment Advisor: Capital Research and Management CompanyInvestment Objective: seeks long-term capital appreciation.

47
Calvert EAFE International Index Division
Invests in: Calvert VP EAFE International Index Portfolio - Class FInvestment Advisor: World asset Management, Inc. through a sub-advisory agreement with Calvert
Investment Management, Inc.Investment Objective: seeks investment results that correspond to the total return performance of common
stocks as represented by the MSCI EAFE (Standard) Index ("MSCI EAFE Index").The MSCI EAFE Index emphasizes the stocks of companies in major markets inEurope, Australasia, and the Far East. This objective may be changed by thePortfolio’s Board of Directors without shareholder approval.
Calvert Investment Grade Bond Index DivisionInvests in: Calvert VP Investment Grade Bond Index Portfolio
Investment Advisor: Calvert Investment Management, Inc. through a sub-advisory agreement withAmeritas Investment Partners, Inc.
Investment Objective: seeks investment results that correspond to the total return performance of the bondmarket, as represented by the Barclays U.S. Aggregate Bond Index (the “BarclaysIndex”). This objective may be changed by the Portfolio’s Board of Directors withoutshareholder approval.
Calvert Russell 2000 Small Cap Index DivisionInvests in: Calvert VP Russell 2000 Small Cap Index Portfolio - Class F
Investment Advisor: Ameritas Investment Partners, Inc. through a sub-advisory agreement with CalvertInvestment Management, Inc.
Investment Objective: seeks investment results that correspond to the investment performance of U.S.common stocks, as represented by the Russell 2000 Index. This objective may bechanged by the Portfolio’s Board of Directors without shareholder approval.
ClearBridge Mid Cap Division (fka ClearBridge Mid Cap Core Division)Invests in: ClearBridge Variable Mid Cap Portfolio - Class I Shares (fka ClearBridge Variable
Mid Cap Core Portfolio - Class I Shares)Investment Advisor: ClearBridge Investments, LLC through a sub-advisory agreement with Legg Mason
Partners Fund Advisor, LLCInvestment Objective: seeks long-term growth of capital.
ClearBridge Small Cap Growth DivisionInvests in: ClearBridge Variable Small Cap Growth Portfolio - Class I Shares
Investment Advisor: ClearBridge Investments, LLC through a sub-advisory agreement with Legg MasonPartners Fund Advisor, LLC
Investment Objective: seeks long-term growth of capital.
Delaware High Yield DivisionInvests in: Delaware VIP High Yield Series - Service Class
Investment Advisor: Delaware Management CompanyInvestment Objective: seeks total return and, as a secondary objective, high current income.
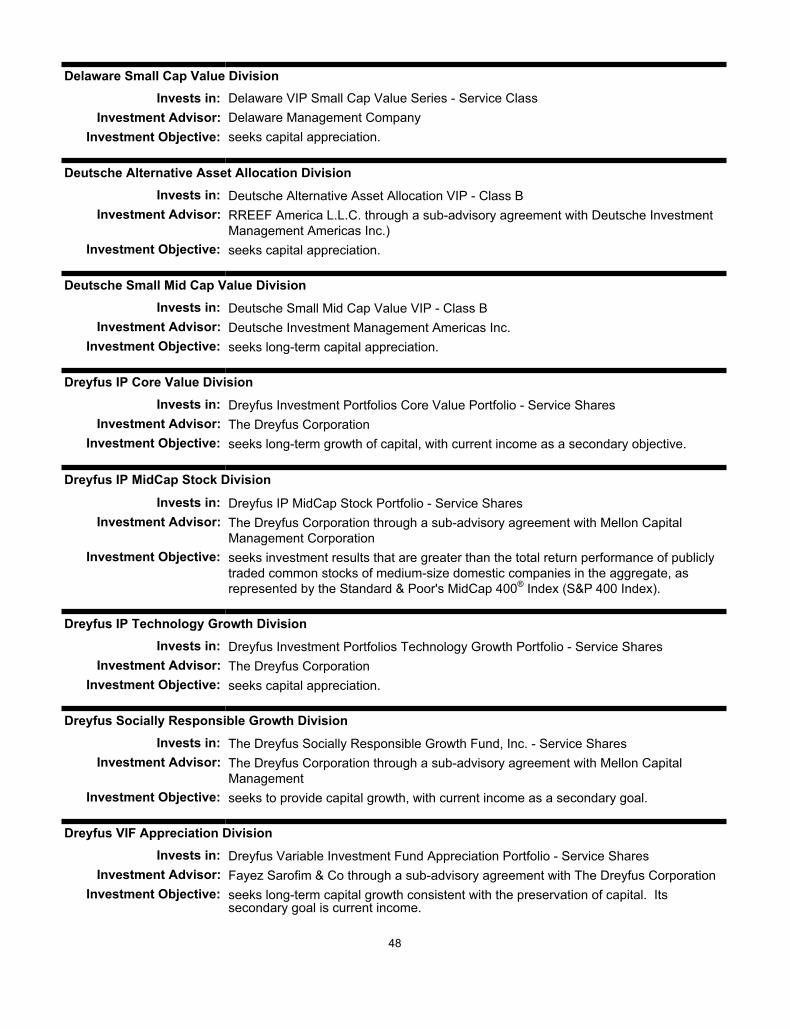
48
Delaware Small Cap Value DivisionInvests in: Delaware VIP Small Cap Value Series - Service Class
Investment Advisor: Delaware Management CompanyInvestment Objective: seeks capital appreciation.
Deutsche Alternative Asset Allocation DivisionInvests in: Deutsche Alternative Asset Allocation VIP - Class B
Investment Advisor: RREEF America L.L.C. through a sub-advisory agreement with Deutsche InvestmentManagement Americas Inc.)
Investment Objective: seeks capital appreciation.
Deutsche Small Mid Cap Value DivisionInvests in: Deutsche Small Mid Cap Value VIP - Class B
Investment Advisor: Deutsche Investment Management Americas Inc.Investment Objective: seeks long-term capital appreciation.
Dreyfus IP Core Value DivisionInvests in: Dreyfus Investment Portfolios Core Value Portfolio - Service Shares
Investment Advisor: The Dreyfus CorporationInvestment Objective: seeks long-term growth of capital, with current income as a secondary objective.
Dreyfus IP MidCap Stock Division
Invests in: Dreyfus IP MidCap Stock Portfolio - Service SharesInvestment Advisor: The Dreyfus Corporation through a sub-advisory agreement with Mellon Capital
Management CorporationInvestment Objective: seeks investment results that are greater than the total return performance of publicly
traded common stocks of medium-size domestic companies in the aggregate, as represented by the Standard & Poor's MidCap 400® Index (S&P 400 Index).
Dreyfus IP Technology Growth DivisionInvests in: Dreyfus Investment Portfolios Technology Growth Portfolio - Service Shares
Investment Advisor: The Dreyfus CorporationInvestment Objective: seeks capital appreciation.
Dreyfus Socially Responsible Growth DivisionInvests in: The Dreyfus Socially Responsible Growth Fund, Inc. - Service Shares
Investment Advisor: The Dreyfus Corporation through a sub-advisory agreement with Mellon CapitalManagement
Investment Objective: seeks to provide capital growth, with current income as a secondary goal.
Dreyfus VIF Appreciation DivisionInvests in: Dreyfus Variable Investment Fund Appreciation Portfolio - Service Shares
Investment Advisor: Fayez Sarofim & Co through a sub-advisory agreement with The Dreyfus CorporationInvestment Objective: seeks long-term capital growth consistent with the preservation of capital. Its
secondary goal is current income.
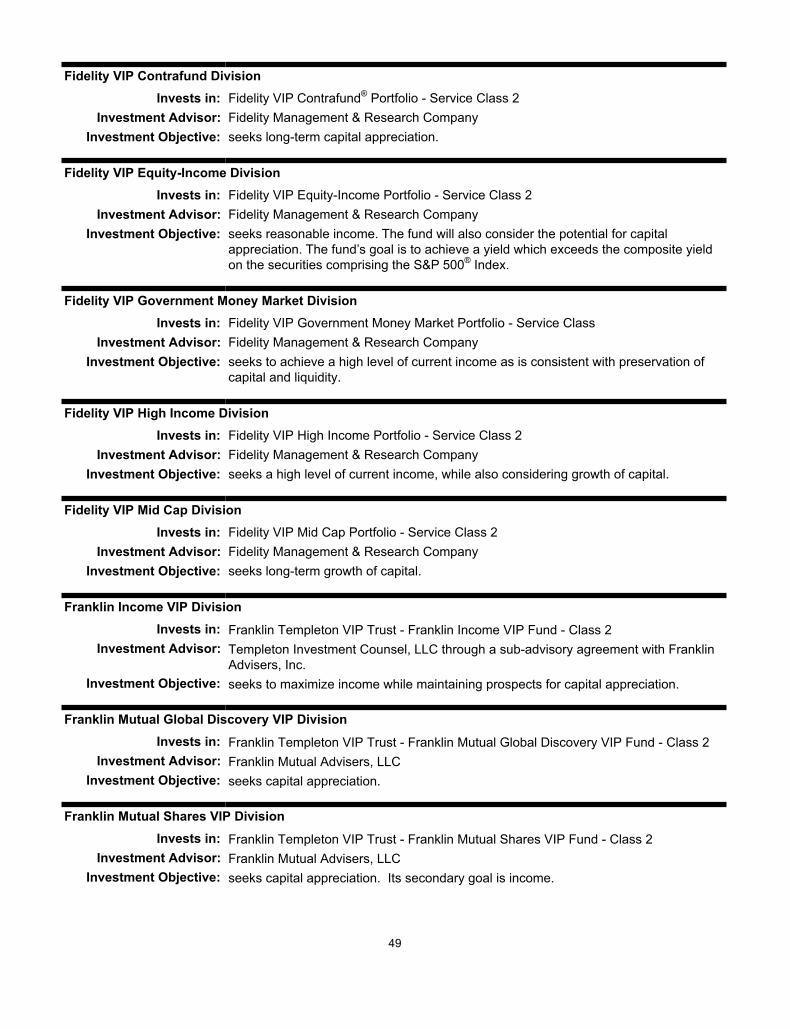
49
Fidelity VIP Contrafund DivisionInvests in: Fidelity VIP Contrafund® Portfolio - Service Class 2
Investment Advisor: Fidelity Management & Research CompanyInvestment Objective: seeks long-term capital appreciation.
Fidelity VIP Equity-Income DivisionInvests in: Fidelity VIP Equity-Income Portfolio - Service Class 2
Investment Advisor: Fidelity Management & Research CompanyInvestment Objective: seeks reasonable income. The fund will also consider the potential for capital
appreciation. The fund’s goal is to achieve a yield which exceeds the composite yield on the securities comprising the S&P 500® Index.
Fidelity VIP Government Money Market DivisionInvests in: Fidelity VIP Government Money Market Portfolio - Service Class
Investment Advisor: Fidelity Management & Research CompanyInvestment Objective: seeks to achieve a high level of current income as is consistent with preservation of
capital and liquidity.
Fidelity VIP High Income DivisionInvests in: Fidelity VIP High Income Portfolio - Service Class 2
Investment Advisor: Fidelity Management & Research CompanyInvestment Objective: seeks a high level of current income, while also considering growth of capital.
Fidelity VIP Mid Cap DivisionInvests in: Fidelity VIP Mid Cap Portfolio - Service Class 2
Investment Advisor: Fidelity Management & Research CompanyInvestment Objective: seeks long-term growth of capital.
Franklin Income VIP DivisionInvests in: Franklin Templeton VIP Trust - Franklin Income VIP Fund - Class 2
Investment Advisor: Templeton Investment Counsel, LLC through a sub-advisory agreement with FranklinAdvisers, Inc.
Investment Objective: seeks to maximize income while maintaining prospects for capital appreciation.
Franklin Mutual Global Discovery VIP DivisionInvests in: Franklin Templeton VIP Trust - Franklin Mutual Global Discovery VIP Fund - Class 2
Investment Advisor: Franklin Mutual Advisers, LLCInvestment Objective: seeks capital appreciation.
Franklin Mutual Shares VIP DivisionInvests in: Franklin Templeton VIP Trust - Franklin Mutual Shares VIP Fund - Class 2
Investment Advisor: Franklin Mutual Advisers, LLCInvestment Objective: seeks capital appreciation. Its secondary goal is income.

50
Franklin Rising Dividends VIP DivisionInvests in: Franklin Templeton VIP Trust - Franklin Rising Dividends VIP Fund - Class 2
Investment Advisor: Franklin Advisory Services, LLCInvestment Objective: seeks long-term capital appreciation. Preservation of capital, while not a goal, is also
an important consideration.
Franklin Small Cap Value VIP DivisionInvests in: Franklin Templeton VIP Trust - Franklin Small Cap Value VIP Fund - Class 2
Investment Advisor: Franklin Advisory Services, LLCInvestment Objective: seeks long-term total return.
Franklin Strategic Income VIP DivisionInvests in: Franklin Templeton VIP Trust - Franklin Strategic Income VIP Fund - Class 2
Investment Advisor: Franklin Advisers, Inc.Investment Objective: Seeks a high level of current income. A secondary goal is long-term capital
appreciation.
Franklin U.S. Government Securities VIP DivisionInvests in: Franklin Templeton VIP Trust - Franklin U.S. Government Securities VIP Fund -
Class 2Investment Advisor: Franklin Advisers, Inc.
Investment Objective: seeks income.
Invesco American Franchise DivisionInvests in: Invesco V.I. American Franchise Fund - Series II Shares
Investment Advisor: Invesco Advisers, Inc.Investment Objective: seeks capital growth.
Invesco American Value DivisionInvests in: Invesco V.I. American Value Fund - Series I Shares
Investment Advisor: Invesco Advisers, Inc.Investment Objective: seeks to provide above-average total return over a market cycle of three to five years
by investing in common stocks and other equity securities.
Invesco Core Equity DivisionInvests in: Invesco V.I. Core Equity Fund - Series II Shares
Investment Advisor: Invesco Advisers, Inc.Investment Objective: seeks long-term growth of capital.
Invesco Global Health Care DivisionInvests in: Invesco V.I. Global Health Care Fund - Series I Shares
Investment Advisor: Invesco Advisers, Inc.Investment Objective: seeks long-term growth of capital.

51
Invesco Global Real Estate DivisionInvests in: Invesco V.I. Global Real Estate Fund - Series I Shares
Investment Advisor: Invesco Asset Management Limited through a sub-advisory agreement with InvescoAdvisers, Inc.
Investment Objective: seeks total return through growth of capital and current income.
Invesco International Growth DivisionInvests in: Invesco V.I. International Growth Fund - Series I Shares
Investment Advisor: Invesco Advisers, Inc.Investment Objective: seeks long-term growth of capital.
Invesco Mid Cap Core Equity DivisionInvests in: Invesco V.I. Mid Cap Core Equity Fund - Series II Shares
Investment Advisor: Invesco Advisers, Inc.Investment Objective: seeks long-term growth of capital.
Invesco Mid Cap Growth DivisionInvests in: Invesco V.I. Mid Cap Growth Fund - Series I Shares
Investment Advisor: Invesco Advisers, Inc.Investment Objective: seeks capital growth.
Invesco Small Cap Equity DivisionInvests in: Invesco V.I. Small Cap Equity Fund - Series I Shares
Investment Advisor: Invesco Advisers, Inc.Investment Objective: seeks long-term growth of capital.
Janus Aspen Balanced DivisionInvests in: Janus Aspen Series Balanced Portfolio - Service Shares
Investment Advisor: Janus Capital Management LLCInvestment Objective: seeks long-term capital growth, consistent with preservation of capital and balanced
by current income.
Janus Aspen Enterprise DivisionInvests in: Janus Aspen Series Enterprise Portfolio - Service Shares
Investment Advisor: Janus Capital Management LLCInvestment Objective: seeks long-term growth of capital.
Janus Aspen Flexible Bond DivisionInvests in: Janus Aspen Series Flexible Bond Portfolio - Service Shares
Investment Advisor: Janus Capital Management LLCInvestment Objective: seeks to obtain maximum total return, consistent with preservation of capital.

52
Janus Aspen Forty DivisionInvests in: Janus Aspen Series Forty Portfolio - Service Shares
Investment Advisor: Janus Capital Management LLCInvestment Objective: seeks long-term growth of capital.
Janus Aspen Global Research DivisionInvests in: Janus Aspen Series Global Research Portfolio - Service Shares
Investment Advisor: Janus Capital Management LLCInvestment Objective: seeks long-term growth of capital.
Lord Abbett Series Fund Developing Growth Division*Invests in: Lord Abbett Series Fund Developing Growth Portfolio - Class VC
Investment Advisor: Lord, Abbett & Co. LLCInvestment Objective: seeks long-term growth of capital.
Lord Abbett Series Fund International Opportunities Division*Invests in: Lord Abbett Series Fund International Opportunities Portfolio - Class VC
Investment Advisor: Lord, Abbett & Co. LLCInvestment Objective: seeks long-term capital appreciation.
MFS Blended Research Small Cap Equity Division*Invests in: MFS® Blended Research® Small Cap Equity Portfolio - Service Class
Investment Advisor: Massachusetts Financial Services Company (MFS)Investment Objective: seeks capital appreciation.
MFS Global Equity DivisionInvests in: MFS® Global Equity Series - Service Class
Investment Advisor: Massachusetts Financial Services Company (MFS)Investment Objective: seeks capital appreciation.
MFS Growth DivisionInvests in: MFS® Growth Series - Service Class
Investment Advisor: Massachusetts Financial Services Company (MFS)Investment Objective: seeks capital appreciation.
MFS Inflation-Adjusted Bond DivisionInvests in: MFS® Inflation-Adjusted Bond Portfolio - Service Class
Investment Advisor: Massachusetts Financial Services Company (MFS)Investment Objective: seeks total return that exceeds the rate of inflation over the long-term, with an
emphasis on current income, but also considering capital appreciation.
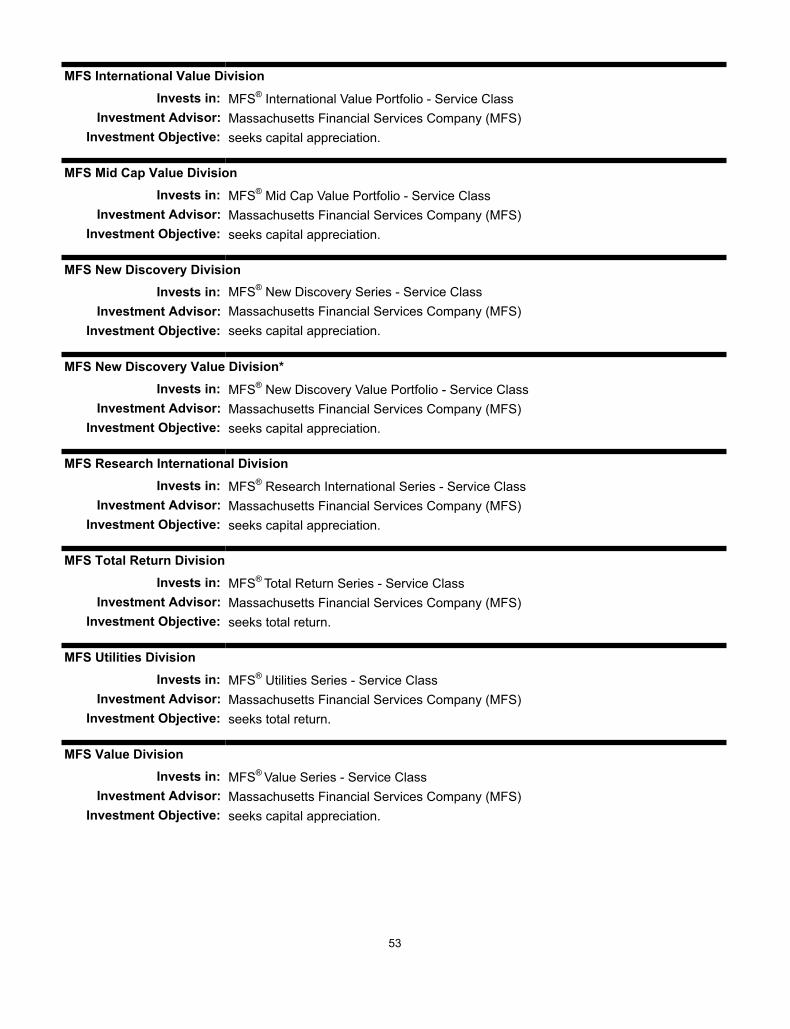
53
MFS International Value DivisionInvests in: MFS® International Value Portfolio - Service Class
Investment Advisor: Massachusetts Financial Services Company (MFS)Investment Objective: seeks capital appreciation.
MFS Mid Cap Value DivisionInvests in: MFS® Mid Cap Value Portfolio - Service Class
Investment Advisor: Massachusetts Financial Services Company (MFS)Investment Objective: seeks capital appreciation.
MFS New Discovery DivisionInvests in: MFS® New Discovery Series - Service Class
Investment Advisor: Massachusetts Financial Services Company (MFS)Investment Objective: seeks capital appreciation.
MFS New Discovery Value Division*Invests in: MFS® New Discovery Value Portfolio - Service Class
Investment Advisor: Massachusetts Financial Services Company (MFS)Investment Objective: seeks capital appreciation.
MFS Research International DivisionInvests in: MFS® Research International Series - Service Class
Investment Advisor: Massachusetts Financial Services Company (MFS)Investment Objective: seeks capital appreciation.
MFS Total Return DivisionInvests in: MFS® Total Return Series - Service Class
Investment Advisor: Massachusetts Financial Services Company (MFS)Investment Objective: seeks total return.
MFS Utilities DivisionInvests in: MFS® Utilities Series - Service Class
Investment Advisor: Massachusetts Financial Services Company (MFS)Investment Objective: seeks total return.
MFS Value DivisionInvests in: MFS® Value Series - Service Class
Investment Advisor: Massachusetts Financial Services Company (MFS)Investment Objective: seeks capital appreciation.

54
Neuberger Berman AMT Guardian DivisionInvests in: Neuberger Berman AMT Guardian Portfolio - Class I
Investment Advisor: Neuberger Berman LLC through a sub-advisory agreement with Neuberger BermanManagement LLC
Investment Objective: seeks long-term growth of capital; current income is a secondary goal.
Neuberger Berman AMT Large Cap Value DivisionInvests in: Neuberger Berman AMT Large Cap Value Portfolio - Class I
Investment Advisor: Neuberger Berman LLC through a sub-advisory agreement with Neuberger BermanManagement LLC
Investment Objective: seeks long-term growth of capital.
Neuberger Berman AMT Mid Cap Growth DivisionInvests in: Neuberger Berman AMT Mid Cap Growth Portfolio - Class S
Investment Advisor: Neuberger Berman through a sub-advisory agreement with Neuberger BermanManagement LLC
Investment Objective: seeks growth of capital.
Oppenheimer Main Street Small Cap DivisionInvests in: Oppenheimer Main Street Small Cap Fund®/VA - Service Shares
Investment Advisor: Oppenheimer Funds, Inc. through a sub-advisory agreement with OFI Global AssetManagement, Inc.
Investment Objective: seeks capital appreciation.
PIMCO All Asset DivisionInvests in: PIMCO VIT All Asset Portfolio - Administrative Class
Investment Advisor: Research Affiliates, LLC through a sub-advisory agreement with Pacific InvestmentManagement Company LLC (PIMCO)
Investment Objective: seeks maximum real return consistent with preservation of real capital and prudentinvestment management.
PIMCO Commodity Real Return Strategy DivisionInvests in: PIMCO VIT CommodityRealReturn® Strategy Portfolio - Administrative Class
Investment Advisor: Pacific Investment Management Company LLC (PIMCO)Investment Objective: seeks maximum real return consistent with prudent investment management.
PIMCO Emerging Markets Bond DivisionInvests in: PIMCO VIT Emerging Markets Bond Portfolio - Administrative Class
Investment Advisor: Pacific Investment Management Company LLC (PIMCO)Investment Objective: seeks maximum total return, consistent with preservation of capital and prudent
investment management.

55
PIMCO High Yield DivisionInvests in: PIMCO VIT High Yield Portfolio - Administrative Class
Investment Advisor: Pacific Investment Management Company LLC (PIMCO)Investment Objective: seeks maximum total return, consistent with preservation of capital and prudent
investment management.
PIMCO Long-Term U.S. Government DivisionInvests in: PIMCO VIT Long-Term U.S. Government Portfolio - Administrative Class
Investment Advisor: Pacific Investment Management Company LLC (PIMCO)Investment Objective: seeks maximum total return, consistent with preservation of capital and prudent
investment management.
PIMCO Low Duration Division*Invests in: PIMCO VIT Low Duration Portfolio - Administrative Class
Investment Advisor: Pacific Investment Management Company LLC ("PIMCO")Investment Objective: seeks maximum total return, consistent with preservation of capital and prudent
investment management.
PIMCO Real Return DivisionInvests in: PIMCO VIT Real Return Portfolio - Administrative Class
Investment Advisor: Pacific Investment Management Company LLC (PIMCO)Investment Objective: seeks maximum real return, consistent with preservation of real capital and prudent
investment management.
PIMCO Short-Term DivisionInvests in: PIMCO VIT Short-Term Portfolio - Administrative Class
Investment Advisor: Pacific Investment Management Company LLC (PIMCO)Investment Objective: seeks maximum current income, consistent with preservation of capital and daily
liquidity.
PIMCO Total Return DivisionInvests in: PIMCO VIT Total Return Portfolio - Administrative Class
Investment Advisor: Pacific Investment Management Company LLC (PIMCO)Investment Objective: seeks maximum total return, consistent with preservation of capital and prudent
investment management.
Bond Market Index DivisionInvests in: Principal Variable Contracts Funds Bond Market Index Account - Class 1
Investment Advisor: Mellon Capital Management Corporation through a sub-advisory agreement withPrincipal Management Corporation
Investment Objective: seeks to provide current income.
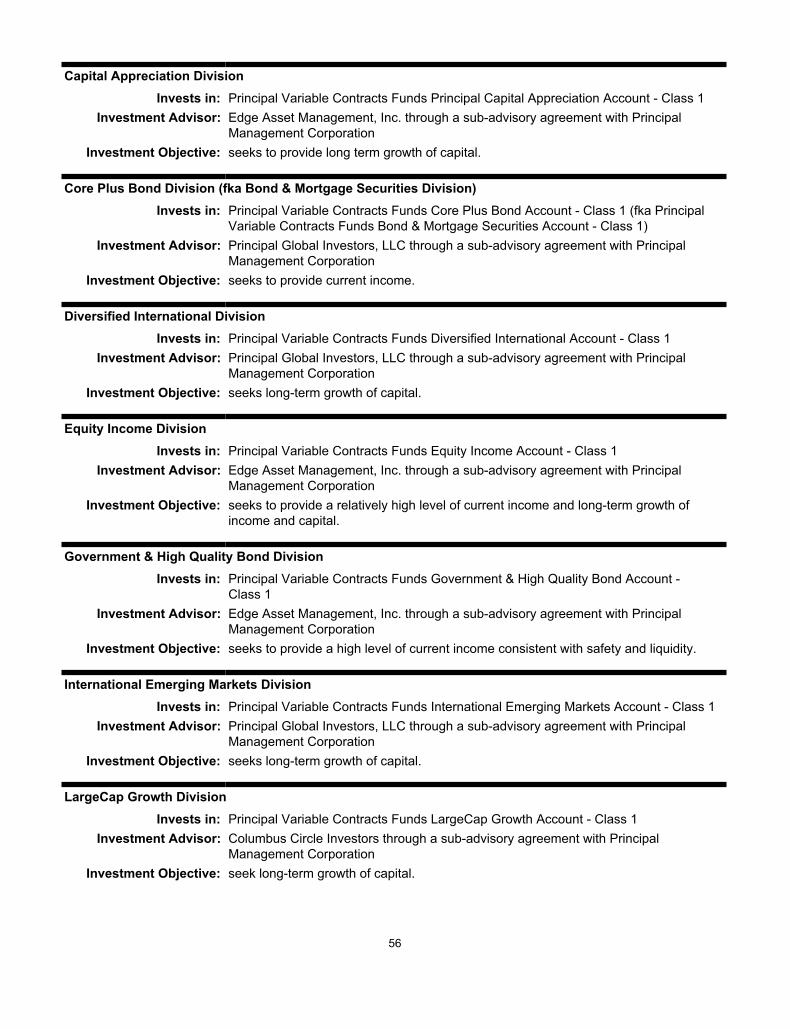
56
Capital Appreciation DivisionInvests in: Principal Variable Contracts Funds Principal Capital Appreciation Account - Class 1
Investment Advisor: Edge Asset Management, Inc. through a sub-advisory agreement with PrincipalManagement Corporation
Investment Objective: seeks to provide long term growth of capital.
Core Plus Bond Division (fka Bond & Mortgage Securities Division)Invests in: Principal Variable Contracts Funds Core Plus Bond Account - Class 1 (fka Principal
Variable Contracts Funds Bond & Mortgage Securities Account - Class 1)Investment Advisor: Principal Global Investors, LLC through a sub-advisory agreement with Principal
Management CorporationInvestment Objective: seeks to provide current income.
Diversified International DivisionInvests in: Principal Variable Contracts Funds Diversified International Account - Class 1
Investment Advisor: Principal Global Investors, LLC through a sub-advisory agreement with PrincipalManagement Corporation
Investment Objective: seeks long-term growth of capital.
Equity Income DivisionInvests in: Principal Variable Contracts Funds Equity Income Account - Class 1
Investment Advisor: Edge Asset Management, Inc. through a sub-advisory agreement with PrincipalManagement Corporation
Investment Objective: seeks to provide a relatively high level of current income and long-term growth ofincome and capital.
Government & High Quality Bond DivisionInvests in: Principal Variable Contracts Funds Government & High Quality Bond Account -
Class 1Investment Advisor: Edge Asset Management, Inc. through a sub-advisory agreement with Principal
Management CorporationInvestment Objective: seeks to provide a high level of current income consistent with safety and liquidity.
International Emerging Markets DivisionInvests in: Principal Variable Contracts Funds International Emerging Markets Account - Class 1
Investment Advisor: Principal Global Investors, LLC through a sub-advisory agreement with PrincipalManagement Corporation
Investment Objective: seeks long-term growth of capital.
LargeCap Growth DivisionInvests in: Principal Variable Contracts Funds LargeCap Growth Account - Class 1
Investment Advisor: Columbus Circle Investors through a sub-advisory agreement with PrincipalManagement Corporation
Investment Objective: seek long-term growth of capital.

57
LargeCap Growth I DivisionInvests in: Principal Variable Contracts Funds LargeCap Growth Account I - Class 1
Investment Advisor: T. Rowe Price Associates, Inc. and Brown Advisory, LLC through sub-advisoryagreements with Principal Management Corporation
Investment Objective: seeks long-term growth of capital.
LargeCap S&P 500 Index DivisionInvests in: Principal Variable Contracts Funds LargeCap S&P 500 Index Account - Class 1
Investment Advisor: Principal Global Investors, LLC through a sub-advisory agreement with PrincipalManagement Corporation
Investment Objective: seeks long-term growth of capital.
LargeCap Value DivisionInvests in: Principal Variable Contracts Funds LargeCap Value Account - Class 1
Investment Advisor: Principal Global Investors, LLC through a sub-advisory agreement with PrincipalManagement Corporation
Investment Objective: seeks long-term growth of capital.
MidCap Division (no longer available to new investors with an application signature date of 8/16/2013 andlater)
Invests in: Principal Variable Contracts Funds MidCap Account - Class 1Investment Advisor: Principal Global Investors, LLC through a sub-advisory agreement with Principal
Management CorporationInvestment Objective: seeks long-term growth of capital.
Multi-Asset Income Division*Invests in: Principal Variable Contracts Funds Multi-Asset Income Account - Class 1
Investment Advisor: Principal Global Investors, LLC through a sub-advisory agreement with PrincipalManagement Corporation
Investment Objective: seeks current income.
Principal LifeTime 2010 DivisionInvests in: Principal Variable Contracts Funds Principal LifeTime 2010 Account - Class 1
Investment Advisor: Principal Global Investors, LLC through a sub-advisory agreement with PrincipalManagement Corporation
Investment Objective: seeks a total return consisting of long-term growth of capital and current income.
Principal LifeTime 2020 DivisionInvests in: Principal Variable Contracts Funds Principal LifeTime 2020 Account - Class 1
Investment Advisor: Principal Global Investors, LLC through a sub-advisory agreement with PrincipalManagement Corporation
Investment Objective: seeks a total return consisting of long-term growth of capital and current income.
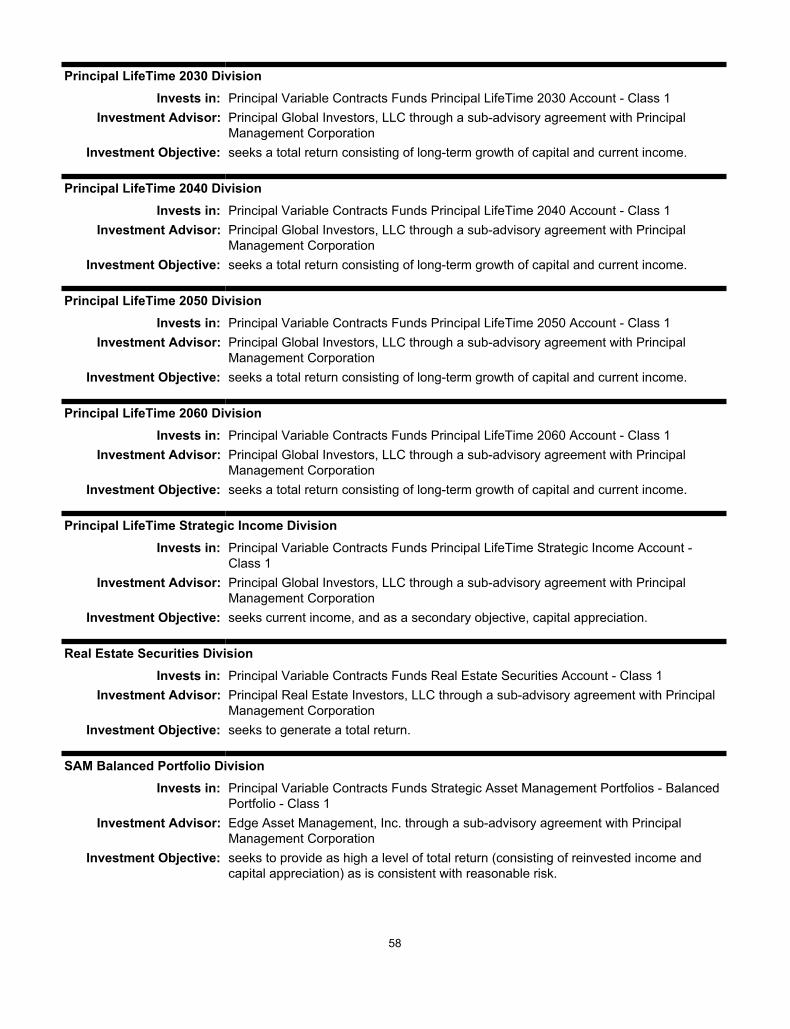
58
Principal LifeTime 2030 DivisionInvests in: Principal Variable Contracts Funds Principal LifeTime 2030 Account - Class 1
Investment Advisor: Principal Global Investors, LLC through a sub-advisory agreement with PrincipalManagement Corporation
Investment Objective: seeks a total return consisting of long-term growth of capital and current income.
Principal LifeTime 2040 DivisionInvests in: Principal Variable Contracts Funds Principal LifeTime 2040 Account - Class 1
Investment Advisor: Principal Global Investors, LLC through a sub-advisory agreement with PrincipalManagement Corporation
Investment Objective: seeks a total return consisting of long-term growth of capital and current income.
Principal LifeTime 2050 DivisionInvests in: Principal Variable Contracts Funds Principal LifeTime 2050 Account - Class 1
Investment Advisor: Principal Global Investors, LLC through a sub-advisory agreement with PrincipalManagement Corporation
Investment Objective: seeks a total return consisting of long-term growth of capital and current income.
Principal LifeTime 2060 DivisionInvests in: Principal Variable Contracts Funds Principal LifeTime 2060 Account - Class 1
Investment Advisor: Principal Global Investors, LLC through a sub-advisory agreement with PrincipalManagement Corporation
Investment Objective: seeks a total return consisting of long-term growth of capital and current income.
Principal LifeTime Strategic Income DivisionInvests in: Principal Variable Contracts Funds Principal LifeTime Strategic Income Account -
Class 1Investment Advisor: Principal Global Investors, LLC through a sub-advisory agreement with Principal
Management CorporationInvestment Objective: seeks current income, and as a secondary objective, capital appreciation.
Real Estate Securities DivisionInvests in: Principal Variable Contracts Funds Real Estate Securities Account - Class 1
Investment Advisor: Principal Real Estate Investors, LLC through a sub-advisory agreement with PrincipalManagement Corporation
Investment Objective: seeks to generate a total return.
SAM Balanced Portfolio DivisionInvests in: Principal Variable Contracts Funds Strategic Asset Management Portfolios - Balanced
Portfolio - Class 1Investment Advisor: Edge Asset Management, Inc. through a sub-advisory agreement with Principal
Management CorporationInvestment Objective: seeks to provide as high a level of total return (consisting of reinvested income and
capital appreciation) as is consistent with reasonable risk.

59
SAM Conservative Balanced Portfolio DivisionInvests in: Principal Variable Contracts Funds Strategic Asset Management Portfolios -
Conservative Balanced Portfolio - Class 1Investment Advisor: Edge Asset Management, Inc. through a sub-advisory agreement with Principal
Management CorporationInvestment Objective: seeks to provide a high level of total return (consisting of reinvestment of income and
capital appreciation), consistent with a moderate degree of principal risk.
SAM Conservative Growth Portfolio DivisionInvests in: Principal Variable Contracts Funds Strategic Asset Management Portfolios -
Conservative Growth Portfolio - Class 1Investment Advisor: Edge Asset Management, Inc. through a sub-advisory agreement with Principal
Management CorporationInvestment Objective: seeks to provide long-term capital appreciation.
SAM Flexible Income Portfolio DivisionInvests in: Principal Variable Contracts Funds Strategic Asset Management Portfolios - Flexible
Income Portfolio - Class 1Investment Advisor: Edge Asset Management, Inc. through a sub-advisory agreement with Principal
Management CorporationInvestment Objective: seeks to provide a high level of total return (consisting of reinvestment of income with
some capital appreciation).
SAM Strategic Growth Portfolio DivisionInvests in: Principal Variable Contracts Funds Strategic Asset Management Portfolios - Strategic
Growth Portfolio - Class 1Investment Advisor: Edge Asset Management, Inc. through a sub-advisory agreement with Principal
Management CorporationInvestment Objective: seeks to provide long-term capital appreciation.
Short-Term Income DivisionInvests in: Principal Variable Contracts Funds Short-Term Income Account - Class 1
Investment Advisor: Edge Asset Management, Inc. through a sub-advisory agreement with PrincipalManagement Corporation
Investment Objective: seeks to provide as high a level of current income as is consistent with prudentinvestment management and stability of principal.
SmallCap Division (fka SmallCap Blend Division)Invests in: Principal Variable Contracts Funds SmallCap Account - Class 1 (fka Principal Variable
Contracts Funds SmallCap Blend Account - Class 1)Investment Advisor: Principal Global Investors, LLC through a sub-advisory agreement with Principal
Management CorporationInvestment Objective: seeks long-term growth of capital.

60
Putnam VT Voyager DivisionInvests in: Putnam VT Voyager Fund - Class IB
Investment Advisor: Putnam Investment Management, LLCInvestment Objective: seeks capital appreciation.
Templeton Developing Markets VIP DivisionInvests in: Franklin Templeton VIP Trust - Templeton Developing Markets VIP Fund - Class 2
Investment Advisor: Templeton Asset Management Ltd.Investment Objective: seeks long-term capital appreciation.
Templeton Foreign VIP DivisionInvests in: Franklin Templeton VIP Trust - Templeton Foreign VIP Fund - Class 2
Investment Advisor: Templeton Investment Counsel, LLCInvestment Objective: seeks long-term capital growth.
Templeton Global Bond VIP DivisionInvests in: Franklin Templeton VIP Trust - Templeton Global Bond VIP Fund - Class 2
Investment Advisor: Franklin Advisers, Inc.Investment Objective: seeks high current income, consistent with preservation of capital. Capital
appreciation is a secondary consideration.
TOPS Managed Risk Balanced ETF DivisionInvests in: TOPS®™ Managed Risk Balanced ETF Portfolio - Class 2
Investment Advisor: Milliman Financial Risk Management, LLC through a sub-advisory agreement withValMark Advisers, Inc.
Investment Objective: seeks to provide income and capital appreciation with less volatility than the fixedincome and equity markets as a whole.
TOPS Managed Risk Growth ETF DivisionInvests in: TOPS®™ Managed Risk Growth ETF Portfolio - Class 2
Investment Advisor: Milliman Financial Risk Management, LLC through a sub-advisory agreement withValMark Advisers, Inc.
Investment Objective: seeks capital appreciation with less volatility than the equity markets as a whole.
TOPS Managed Risk Moderate Growth ETF DivisionInvests in: TOPS®™ Managed Risk Moderate Growth ETF Portfolio - Class 2
Investment Advisor: Milliman Financial Risk Management, LLC through a sub-advisory agreement withValMark Advisers, Inc.
Investment Objective: seeks capital appreciation with less volatility than the equity markets as a whole.
VanEck Global Hard Assets DivisionInvests in: VanEck VIP Trust - VanEck VIP Global Hard Assets Fund - Initial Class Shares
Investment Advisor: Van Eck Associates CorporationInvestment Objective: seeks long-term capital appreciation by investing primarily in hard asset securities.
Income is a secondary consideration.
61
Vanguard VIF Mid-Cap Index DivisionInvests in: Vanguard VIF - Mid-Cap Index Portfolio
Investment Advisor: The Vanguard Group, Inc.Investment Objective: seeks to track the performance of a benchmark index that measures the investment
return of mid-capitalization stocks.
Wanger International DivisionInvests in: Wanger International
Investment Advisor: Columbia Wanger Asset Management LLCInvestment Objective: seeks long-term capital appreciation.
*Available beginning May 23, 2016.

62
APPENDIX A - SURRENDER CHARGE RATE TABLE
SURRENDER CHARGE RATE TABLE - ALL STATES EXCEPT NEW YORK
Issue Age Male Female Unisex0 2.63 2.12 2.561 2.63 2.12 2.562 2.63 2.12 2.563 2.63 2.12 2.564 2.63 2.12 2.565 2.63 2.12 2.566 2.63 2.12 2.567 2.63 2.12 2.568 2.63 2.12 2.569 2.63 2.12 2.5610 2.63 2.12 2.5611 2.74 2.18 2.6612 2.85 2.25 2.7813 2.96 2.31 2.8814 3.08 2.38 2.9915 3.19 2.44 3.0916 3.47 2.72 3.3717 3.74 3.00 3.6518 4.02 3.29 3.9219 4.30 3.56 4.2020 4.58 3.85 4.4821 4.58 3.87 4.4922 4.59 3.90 4.5023 4.60 3.92 4.5124 4.61 3.95 4.5225 4.61 3.98 4.5326 4.72 4.07 4.6427 4.82 4.16 4.7328 4.93 4.24 4.8429 5.03 4.33 4.9430 5.14 4.42 5.0531 5.38 4.62 5.2832 5.63 4.83 5.5333 5.90 5.06 5.7934 6.20 5.30 6.0835 6.50 5.55 6.3836 6.83 5.82 6.7037 7.16 6.10 7.0338 7.52 6.40 7.3839 7.91 6.71 7.7540 8.32 7.04 8.1541 8.75 7.37 8.5742 9.20 7.74 9.0143 9.68 8.12 9.4844 10.19 8.52 9.9845 10.73 8.95 10.5046 11.31 9.40 11.0647 11.93 9.87 11.6648 12.58 10.37 12.2949 13.28 10.91 12.9750 14.01 11.48 13.68
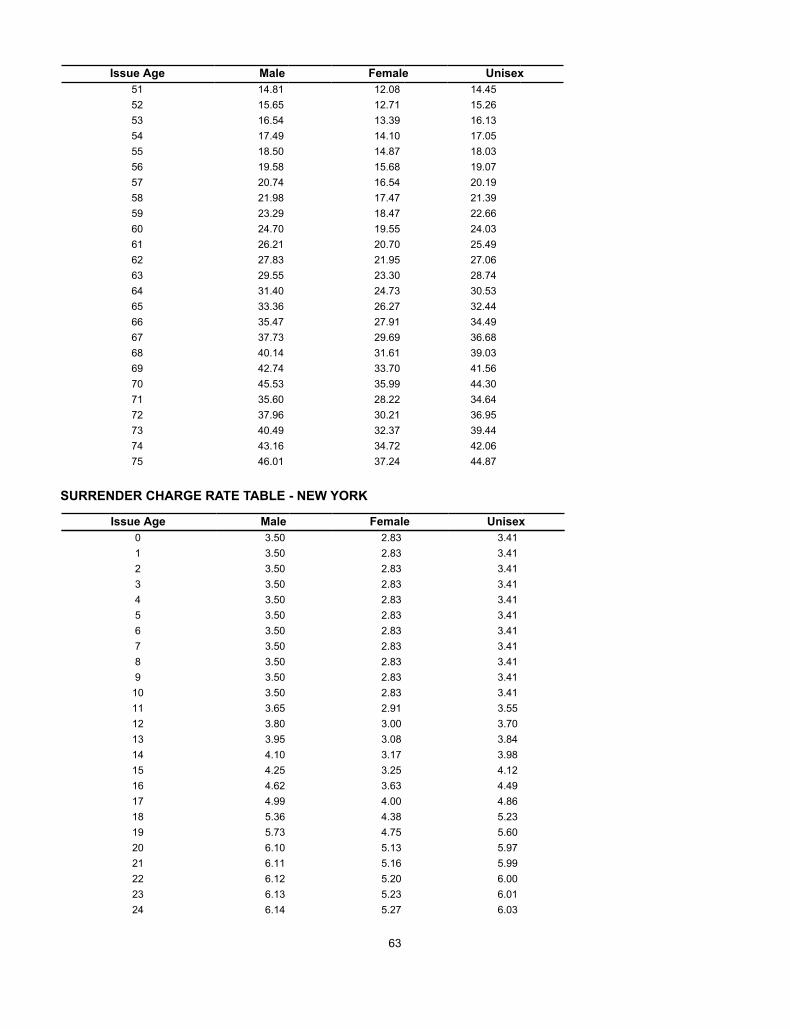
63
Issue Age Male Female Unisex51 14.81 12.08 14.4552 15.65 12.71 15.2653 16.54 13.39 16.1354 17.49 14.10 17.0555 18.50 14.87 18.0356 19.58 15.68 19.0757 20.74 16.54 20.1958 21.98 17.47 21.3959 23.29 18.47 22.6660 24.70 19.55 24.0361 26.21 20.70 25.4962 27.83 21.95 27.0663 29.55 23.30 28.7464 31.40 24.73 30.5365 33.36 26.27 32.4466 35.47 27.91 34.4967 37.73 29.69 36.6868 40.14 31.61 39.0369 42.74 33.70 41.5670 45.53 35.99 44.3071 35.60 28.22 34.6472 37.96 30.21 36.9573 40.49 32.37 39.4474 43.16 34.72 42.0675 46.01 37.24 44.87
SURRENDER CHARGE RATE TABLE - NEW YORK
Issue Age Male Female Unisex0 3.50 2.83 3.411 3.50 2.83 3.412 3.50 2.83 3.413 3.50 2.83 3.414 3.50 2.83 3.415 3.50 2.83 3.416 3.50 2.83 3.417 3.50 2.83 3.418 3.50 2.83 3.419 3.50 2.83 3.4110 3.50 2.83 3.4111 3.65 2.91 3.5512 3.80 3.00 3.7013 3.95 3.08 3.8414 4.10 3.17 3.9815 4.25 3.25 4.1216 4.62 3.63 4.4917 4.99 4.00 4.8618 5.36 4.38 5.2319 5.73 4.75 5.6020 6.10 5.13 5.9721 6.11 5.16 5.9922 6.12 5.20 6.0023 6.13 5.23 6.0124 6.14 5.27 6.03

64
Issue Age Male Female Unisex25 6.15 5.30 6.0426 6.29 5.42 6.1827 6.43 5.54 6.3128 6.57 5.65 6.4529 6.71 5.77 6.5930 6.85 5.89 6.7331 7.17 6.16 7.0432 7.51 6.44 7.3733 7.87 6.74 7.7234 8.26 7.06 8.1035 8.66 7.40 8.5036 9.10 7.76 8.9337 9.55 8.13 9.3738 10.03 8.53 9.8439 10.54 8.94 10.3340 11.09 9.38 10.8741 11.66 9.83 11.4242 12.26 10.32 12.0143 12.91 10.82 12.6444 13.59 11.36 13.3045 14.31 11.93 14.0046 15.08 12.53 14.7547 15.90 13.16 15.5448 16.77 13.83 16.3949 17.70 14.54 17.2950 18.68 15.30 18.2451 19.74 16.10 19.2752 20.86 16.94 20.3553 22.05 17.85 21.5054 23.32 18.80 22.7355 24.67 19.82 24.0456 26.11 20.90 25.4357 27.65 22.05 26.9258 29.30 23.29 28.5259 31.05 24.62 30.2160 32.93 26.06 32.0461 34.94 27.60 33.9962 37.10 29.26 36.0863 39.40 31.06 38.3264 41.86 32.97 40.7065 44.48 35.02 43.2566 46.24 37.21 45.9867 46.23 39.58 46.3668 46.23 42.14 46.3669 46.21 44.93 46.3470 46.19 46.85 46.3371 46.17 35.91 46.1872 46.17 38.45 46.3273 46.16 41.20 46.3174 46.14 44.18 46.3075 46.12 46.83 46.28

65
APPENDIX B – SURRENDER CHARGE PERCENTAGE TABLESURRENDER CHARGE PERCENTAGE TABLE – ALL STATES EXCEPT NEW YORK
Policy YearIssueAge 0 1 2 3 4 5 6 7 8 9 10
0 100.0% 100.0% 100.0% 93.3% 80.0% 66.7% 53.3% 40.0% 26.7% 13.3% 0.0%1 100.0% 100.0% 100.0% 93.3% 80.0% 66.7% 53.3% 40.0% 26.7% 13.3% 0.0%2 100.0% 100.0% 100.0% 93.3% 80.0% 66.7% 53.3% 40.0% 26.7% 13.3% 0.0%3 100.0% 100.0% 100.0% 93.3% 80.0% 66.7% 53.3% 40.0% 26.7% 13.3% 0.0%4 100.0% 100.0% 100.0% 93.3% 80.0% 66.7% 53.3% 40.0% 26.7% 13.3% 0.0%5 100.0% 100.0% 100.0% 93.3% 80.0% 66.7% 53.3% 40.0% 26.7% 13.3% 0.0%6 100.0% 100.0% 100.0% 93.3% 80.0% 66.7% 53.3% 40.0% 26.7% 13.3% 0.0%7 100.0% 100.0% 100.0% 93.3% 80.0% 66.7% 53.3% 40.0% 26.7% 13.3% 0.0%8 100.0% 100.0% 100.0% 93.3% 80.0% 66.7% 53.3% 40.0% 26.7% 13.3% 0.0%9 100.0% 100.0% 100.0% 93.3% 80.0% 66.7% 53.3% 40.0% 26.7% 13.3% 0.0%10 100.0% 100.0% 100.0% 93.3% 80.0% 66.7% 53.3% 40.0% 26.7% 13.3% 0.0%11 100.0% 100.0% 100.0% 93.3% 80.0% 66.7% 53.3% 40.0% 26.7% 13.3% 0.0%12 100.0% 100.0% 100.0% 93.3% 80.0% 66.7% 53.3% 40.0% 26.7% 13.3% 0.0%13 100.0% 100.0% 100.0% 93.3% 80.0% 66.7% 53.3% 40.0% 26.7% 13.3% 0.0%14 100.0% 100.0% 100.0% 93.3% 80.0% 66.7% 53.3% 40.0% 26.7% 13.3% 0.0%15 100.0% 100.0% 100.0% 93.3% 80.0% 66.7% 53.3% 40.0% 26.7% 13.3% 0.0%16 100.0% 100.0% 100.0% 93.3% 80.0% 66.7% 53.3% 40.0% 26.7% 13.3% 0.0%17 100.0% 100.0% 100.0% 93.3% 80.0% 66.7% 53.3% 40.0% 26.7% 13.3% 0.0%18 100.0% 100.0% 100.0% 93.3% 80.0% 66.7% 53.3% 40.0% 26.7% 13.3% 0.0%19 100.0% 100.0% 100.0% 93.3% 80.0% 66.7% 53.3% 40.0% 26.7% 13.3% 0.0%20 100.0% 100.0% 100.0% 93.3% 80.0% 66.7% 53.3% 40.0% 26.7% 13.3% 0.0%21 100.0% 100.0% 100.0% 93.3% 80.0% 66.7% 53.3% 40.0% 26.7% 13.3% 0.0%22 100.0% 100.0% 100.0% 93.3% 80.0% 66.7% 53.3% 40.0% 26.7% 13.3% 0.0%23 100.0% 100.0% 100.0% 93.3% 80.0% 66.7% 53.3% 40.0% 26.7% 13.3% 0.0%24 100.0% 100.0% 100.0% 93.3% 80.0% 66.7% 53.3% 40.0% 26.7% 13.3% 0.0%25 100.0% 100.0% 100.0% 93.3% 80.0% 66.7% 53.3% 40.0% 26.7% 13.3% 0.0%26 100.0% 100.0% 100.0% 93.3% 80.0% 66.7% 53.3% 40.0% 26.7% 13.3% 0.0%27 100.0% 100.0% 100.0% 93.3% 80.0% 66.7% 53.3% 40.0% 26.7% 13.3% 0.0%28 100.0% 100.0% 100.0% 93.3% 80.0% 66.7% 53.3% 40.0% 26.7% 13.3% 0.0%29 100.0% 100.0% 100.0% 93.3% 80.0% 66.7% 53.3% 40.0% 26.7% 13.3% 0.0%30 100.0% 100.0% 100.0% 93.3% 80.0% 66.7% 53.3% 40.0% 26.7% 13.3% 0.0%31 100.0% 100.0% 100.0% 93.3% 80.0% 66.7% 53.3% 40.0% 26.7% 13.3% 0.0%32 100.0% 100.0% 100.0% 93.3% 80.0% 66.7% 53.3% 40.0% 26.7% 13.3% 0.0%33 100.0% 100.0% 100.0% 93.3% 80.0% 66.7% 53.3% 40.0% 26.7% 13.3% 0.0%34 100.0% 100.0% 100.0% 93.3% 80.0% 66.7% 53.3% 40.0% 26.7% 13.3% 0.0%35 100.0% 100.0% 100.0% 93.3% 80.0% 66.7% 53.3% 40.0% 26.7% 13.3% 0.0%36 100.0% 100.0% 100.0% 93.3% 80.0% 66.7% 53.3% 40.0% 26.7% 13.3% 0.0%37 100.0% 100.0% 100.0% 93.3% 80.0% 66.7% 53.3% 40.0% 26.7% 13.3% 0.0%38 100.0% 100.0% 100.0% 93.3% 80.0% 66.7% 53.3% 40.0% 26.7% 13.3% 0.0%39 100.0% 100.0% 100.0% 93.3% 80.0% 66.7% 53.3% 40.0% 26.7% 13.3% 0.0%40 100.0% 100.0% 100.0% 93.3% 80.0% 66.7% 53.3% 40.0% 26.7% 13.3% 0.0%41 100.0% 100.0% 100.0% 93.3% 80.0% 66.7% 53.3% 40.0% 26.7% 13.3% 0.0%42 100.0% 100.0% 100.0% 93.3% 80.0% 66.7% 53.3% 40.0% 26.7% 13.3% 0.0%43 100.0% 100.0% 100.0% 93.3% 80.0% 66.7% 53.3% 40.0% 26.7% 13.3% 0.0%44 100.0% 100.0% 100.0% 93.3% 80.0% 66.7% 53.3% 40.0% 26.7% 13.3% 0.0%45 100.0% 100.0% 100.0% 93.3% 80.0% 66.7% 53.3% 40.0% 26.7% 13.3% 0.0%46 100.0% 100.0% 100.0% 93.3% 80.0% 66.7% 53.3% 40.0% 26.7% 13.3% 0.0%47 100.0% 100.0% 100.0% 93.3% 80.0% 66.7% 53.3% 40.0% 26.7% 13.3% 0.0%48 100.0% 100.0% 100.0% 93.3% 80.0% 66.7% 53.3% 40.0% 26.7% 13.3% 0.0%49 100.0% 100.0% 100.0% 93.3% 80.0% 66.7% 53.3% 40.0% 26.7% 13.3% 0.0%
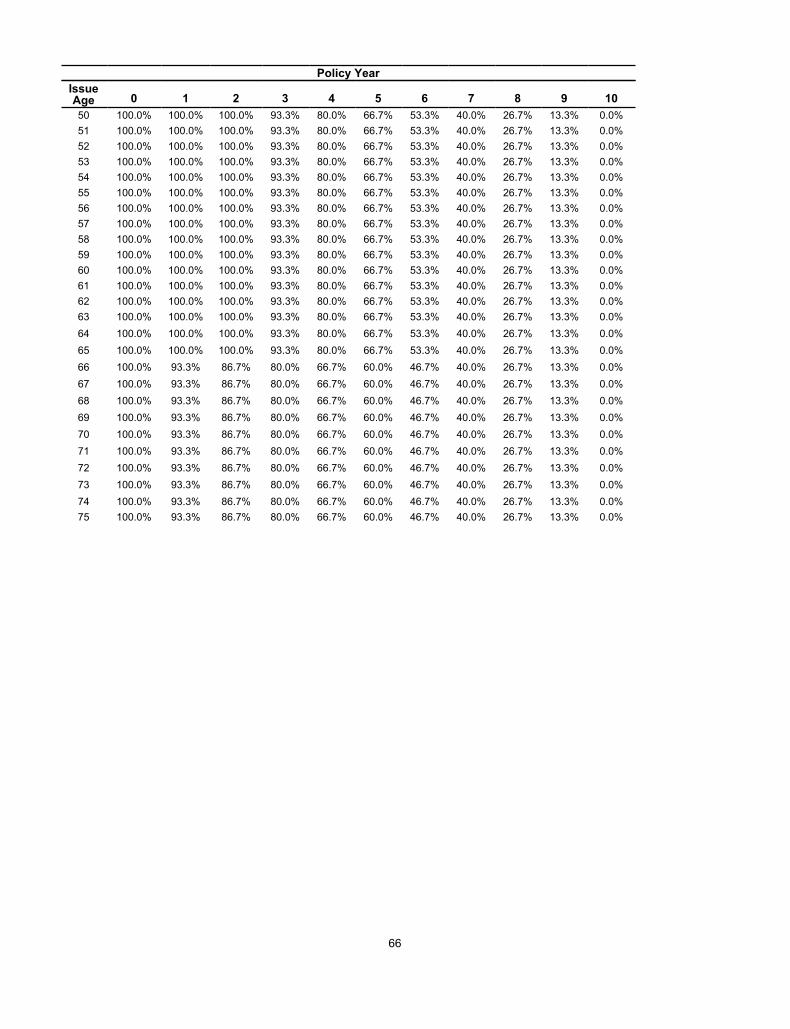
66
Policy YearIssueAge 0 1 2 3 4 5 6 7 8 9 1050 100.0% 100.0% 100.0% 93.3% 80.0% 66.7% 53.3% 40.0% 26.7% 13.3% 0.0%51 100.0% 100.0% 100.0% 93.3% 80.0% 66.7% 53.3% 40.0% 26.7% 13.3% 0.0%52 100.0% 100.0% 100.0% 93.3% 80.0% 66.7% 53.3% 40.0% 26.7% 13.3% 0.0%53 100.0% 100.0% 100.0% 93.3% 80.0% 66.7% 53.3% 40.0% 26.7% 13.3% 0.0%54 100.0% 100.0% 100.0% 93.3% 80.0% 66.7% 53.3% 40.0% 26.7% 13.3% 0.0%55 100.0% 100.0% 100.0% 93.3% 80.0% 66.7% 53.3% 40.0% 26.7% 13.3% 0.0%56 100.0% 100.0% 100.0% 93.3% 80.0% 66.7% 53.3% 40.0% 26.7% 13.3% 0.0%57 100.0% 100.0% 100.0% 93.3% 80.0% 66.7% 53.3% 40.0% 26.7% 13.3% 0.0%58 100.0% 100.0% 100.0% 93.3% 80.0% 66.7% 53.3% 40.0% 26.7% 13.3% 0.0%59 100.0% 100.0% 100.0% 93.3% 80.0% 66.7% 53.3% 40.0% 26.7% 13.3% 0.0%60 100.0% 100.0% 100.0% 93.3% 80.0% 66.7% 53.3% 40.0% 26.7% 13.3% 0.0%61 100.0% 100.0% 100.0% 93.3% 80.0% 66.7% 53.3% 40.0% 26.7% 13.3% 0.0%62 100.0% 100.0% 100.0% 93.3% 80.0% 66.7% 53.3% 40.0% 26.7% 13.3% 0.0%63 100.0% 100.0% 100.0% 93.3% 80.0% 66.7% 53.3% 40.0% 26.7% 13.3% 0.0%64 100.0% 100.0% 100.0% 93.3% 80.0% 66.7% 53.3% 40.0% 26.7% 13.3% 0.0%65 100.0% 100.0% 100.0% 93.3% 80.0% 66.7% 53.3% 40.0% 26.7% 13.3% 0.0%66 100.0% 93.3% 86.7% 80.0% 66.7% 60.0% 46.7% 40.0% 26.7% 13.3% 0.0%67 100.0% 93.3% 86.7% 80.0% 66.7% 60.0% 46.7% 40.0% 26.7% 13.3% 0.0%68 100.0% 93.3% 86.7% 80.0% 66.7% 60.0% 46.7% 40.0% 26.7% 13.3% 0.0%69 100.0% 93.3% 86.7% 80.0% 66.7% 60.0% 46.7% 40.0% 26.7% 13.3% 0.0%70 100.0% 93.3% 86.7% 80.0% 66.7% 60.0% 46.7% 40.0% 26.7% 13.3% 0.0%71 100.0% 93.3% 86.7% 80.0% 66.7% 60.0% 46.7% 40.0% 26.7% 13.3% 0.0%72 100.0% 93.3% 86.7% 80.0% 66.7% 60.0% 46.7% 40.0% 26.7% 13.3% 0.0%73 100.0% 93.3% 86.7% 80.0% 66.7% 60.0% 46.7% 40.0% 26.7% 13.3% 0.0%74 100.0% 93.3% 86.7% 80.0% 66.7% 60.0% 46.7% 40.0% 26.7% 13.3% 0.0%75 100.0% 93.3% 86.7% 80.0% 66.7% 60.0% 46.7% 40.0% 26.7% 13.3% 0.0%

67
SURRENDER CHARGE PERCENTAGE TABLE – NEW YORK
Policy YearIssueAge 0 1 2 3 4 5 6 7 8 9 10
0 100.0% 100.0% 100.0% 93.3% 80.0% 66.7% 53.3% 40.0% 26.7% 13.3% 0.0%1 100.0% 100.0% 100.0% 93.3% 80.0% 66.7% 53.3% 40.0% 26.7% 13.3% 0.0%2 100.0% 100.0% 100.0% 93.3% 80.0% 66.7% 53.3% 40.0% 26.7% 13.3% 0.0%3 100.0% 100.0% 100.0% 93.3% 80.0% 66.7% 53.3% 40.0% 26.7% 13.3% 0.0%4 100.0% 100.0% 100.0% 93.3% 80.0% 66.7% 53.3% 40.0% 26.7% 13.3% 0.0%5 100.0% 100.0% 100.0% 93.3% 80.0% 66.7% 53.3% 40.0% 26.7% 13.3% 0.0%6 100.0% 100.0% 100.0% 93.3% 80.0% 66.7% 53.3% 40.0% 26.7% 13.3% 0.0%7 100.0% 100.0% 100.0% 93.3% 80.0% 66.7% 53.3% 40.0% 26.7% 13.3% 0.0%8 100.0% 100.0% 100.0% 93.3% 80.0% 66.7% 53.3% 40.0% 26.7% 13.3% 0.0%9 100.0% 100.0% 100.0% 93.3% 80.0% 66.7% 53.3% 40.0% 26.7% 13.3% 0.0%10 100.0% 100.0% 100.0% 93.3% 80.0% 66.7% 53.3% 40.0% 26.7% 13.3% 0.0%11 100.0% 100.0% 100.0% 93.3% 80.0% 66.7% 53.3% 40.0% 26.7% 13.3% 0.0%12 100.0% 100.0% 100.0% 93.3% 80.0% 66.7% 53.3% 40.0% 26.7% 13.3% 0.0%13 100.0% 100.0% 100.0% 93.3% 80.0% 66.7% 53.3% 40.0% 26.7% 13.3% 0.0%14 100.0% 100.0% 100.0% 93.3% 80.0% 66.7% 53.3% 40.0% 26.7% 13.3% 0.0%15 100.0% 100.0% 100.0% 93.3% 80.0% 66.7% 53.3% 40.0% 26.7% 13.3% 0.0%16 100.0% 100.0% 100.0% 93.3% 80.0% 66.7% 53.3% 40.0% 26.7% 13.3% 0.0%17 100.0% 100.0% 100.0% 93.3% 80.0% 66.7% 53.3% 40.0% 26.7% 13.3% 0.0%18 100.0% 100.0% 100.0% 93.3% 80.0% 66.7% 53.3% 40.0% 26.7% 13.3% 0.0%19 100.0% 100.0% 100.0% 93.3% 80.0% 66.7% 53.3% 40.0% 26.7% 13.3% 0.0%20 100.0% 100.0% 100.0% 93.3% 80.0% 66.7% 53.3% 40.0% 26.7% 13.3% 0.0%21 100.0% 100.0% 100.0% 93.3% 80.0% 66.7% 53.3% 40.0% 26.7% 13.3% 0.0%22 100.0% 100.0% 100.0% 93.3% 80.0% 66.7% 53.3% 40.0% 26.7% 13.3% 0.0%23 100.0% 100.0% 100.0% 93.3% 80.0% 66.7% 53.3% 40.0% 26.7% 13.3% 0.0%24 100.0% 100.0% 100.0% 93.3% 80.0% 66.7% 53.3% 40.0% 26.7% 13.3% 0.0%25 100.0% 100.0% 100.0% 93.3% 80.0% 66.7% 53.3% 40.0% 26.7% 13.3% 0.0%26 100.0% 100.0% 100.0% 93.3% 80.0% 66.7% 53.3% 40.0% 26.7% 13.3% 0.0%27 100.0% 100.0% 100.0% 93.3% 80.0% 66.7% 53.3% 40.0% 26.7% 13.3% 0.0%28 100.0% 100.0% 100.0% 93.3% 80.0% 66.7% 53.3% 40.0% 26.7% 13.3% 0.0%29 100.0% 100.0% 100.0% 93.3% 80.0% 66.7% 53.3% 40.0% 26.7% 13.3% 0.0%30 100.0% 100.0% 100.0% 93.3% 80.0% 66.7% 53.3% 40.0% 26.7% 13.3% 0.0%31 100.0% 100.0% 100.0% 93.3% 80.0% 66.7% 53.3% 40.0% 26.7% 13.3% 0.0%32 100.0% 100.0% 100.0% 93.3% 80.0% 66.7% 53.3% 40.0% 26.7% 13.3% 0.0%33 100.0% 100.0% 100.0% 93.3% 80.0% 66.7% 53.3% 40.0% 26.7% 13.3% 0.0%34 100.0% 100.0% 100.0% 93.3% 80.0% 66.7% 53.3% 40.0% 26.7% 13.3% 0.0%35 100.0% 100.0% 100.0% 93.3% 80.0% 66.7% 53.3% 40.0% 26.7% 13.3% 0.0%36 100.0% 100.0% 100.0% 93.3% 80.0% 66.7% 53.3% 40.0% 26.7% 13.3% 0.0%37 100.0% 100.0% 100.0% 93.3% 80.0% 66.7% 53.3% 40.0% 26.7% 13.3% 0.0%38 100.0% 100.0% 100.0% 93.3% 80.0% 66.7% 53.3% 40.0% 26.7% 13.3% 0.0%39 100.0% 100.0% 100.0% 93.3% 80.0% 66.7% 53.3% 40.0% 26.7% 13.3% 0.0%40 100.0% 100.0% 100.0% 93.3% 80.0% 66.7% 53.3% 40.0% 26.7% 13.3% 0.0%41 100.0% 100.0% 100.0% 93.3% 80.0% 66.7% 53.3% 40.0% 26.7% 13.3% 0.0%42 100.0% 100.0% 100.0% 93.3% 80.0% 66.7% 53.3% 40.0% 26.7% 13.3% 0.0%43 100.0% 100.0% 100.0% 93.3% 80.0% 66.7% 53.3% 40.0% 26.7% 13.3% 0.0%44 100.0% 100.0% 100.0% 93.3% 80.0% 66.7% 53.3% 40.0% 26.7% 13.3% 0.0%45 100.0% 100.0% 100.0% 93.3% 80.0% 66.7% 53.3% 40.0% 26.7% 13.3% 0.0%46 100.0% 100.0% 100.0% 93.3% 80.0% 66.7% 53.3% 40.0% 26.7% 13.3% 0.0%47 100.0% 100.0% 100.0% 93.3% 80.0% 66.7% 53.3% 40.0% 26.7% 13.3% 0.0%48 100.0% 100.0% 100.0% 93.3% 80.0% 66.7% 53.3% 40.0% 26.7% 13.3% 0.0%49 100.0% 100.0% 100.0% 93.3% 80.0% 66.7% 53.3% 40.0% 26.7% 13.3% 0.0%

68
Policy YearIssueAge 0 1 2 3 4 5 6 7 8 9 1050 100.0% 100.0% 100.0% 93.3% 80.0% 66.7% 53.3% 40.0% 26.7% 13.3% 0.0%51 100.0% 100.0% 100.0% 93.3% 80.0% 66.7% 53.3% 40.0% 26.7% 13.3% 0.0%52 100.0% 100.0% 100.0% 93.3% 80.0% 66.7% 53.3% 40.0% 26.7% 13.3% 0.0%53 100.0% 100.0% 100.0% 93.3% 80.0% 66.7% 53.3% 40.0% 26.7% 13.3% 0.0%54 100.0% 100.0% 100.0% 93.3% 80.0% 66.7% 53.3% 40.0% 26.7% 13.3% 0.0%55 100.0% 100.0% 100.0% 93.3% 80.0% 66.7% 53.3% 40.0% 26.7% 13.3% 0.0%56 100.0% 100.0% 100.0% 93.3% 80.0% 66.7% 53.3% 40.0% 26.7% 13.3% 0.0%57 100.0% 100.0% 100.0% 93.3% 80.0% 66.7% 53.3% 40.0% 26.7% 13.3% 0.0%58 100.0% 100.0% 100.0% 93.3% 80.0% 66.7% 53.3% 40.0% 26.7% 13.3% 0.0%59 100.0% 100.0% 100.0% 93.3% 80.0% 66.7% 53.3% 40.0% 26.7% 13.3% 0.0%60 100.0% 100.0% 100.0% 93.3% 80.0% 66.7% 53.3% 40.0% 26.7% 13.3% 0.0%61 100.0% 93.3% 86.7% 80.0% 66.7% 60.0% 46.7% 40.0% 26.7% 13.3% 0.0%62 100.0% 93.3% 86.7% 80.0% 66.7% 60.0% 46.7% 40.0% 26.7% 13.3% 0.0%63 100.0% 93.3% 86.7% 80.0% 66.7% 60.0% 46.7% 40.0% 26.7% 13.3% 0.0%64 100.0% 93.3% 86.7% 80.0% 66.7% 60.0% 46.7% 40.0% 26.7% 13.3% 0.0%65 100.0% 93.3% 86.7% 80.0% 66.7% 60.0% 46.7% 40.0% 26.7% 13.3% 0.0%66 100.0% 93.3% 86.7% 80.0% 66.7% 60.0% 46.7% 40.0% 26.7% 13.3% 0.0%67 100.0% 93.3% 86.7% 80.0% 66.7% 60.0% 46.7% 40.0% 26.7% 13.3% 0.0%68 100.0% 93.3% 86.7% 80.0% 66.7% 60.0% 46.7% 40.0% 26.7% 13.3% 0.0%69 100.0% 93.3% 86.7% 80.0% 66.7% 60.0% 46.7% 40.0% 26.7% 13.3% 0.0%70 100.0% 93.3% 86.7% 80.0% 66.7% 60.0% 46.7% 40.0% 26.7% 13.3% 0.0%71 100.0% 93.3% 86.7% 80.0% 66.7% 60.0% 46.7% 40.0% 26.7% 13.3% 0.0%72 100.0% 93.3% 86.7% 80.0% 66.7% 60.0% 46.7% 40.0% 26.7% 13.3% 0.0%73 100.0% 93.3% 86.7% 80.0% 66.7% 60.0% 46.7% 40.0% 26.7% 13.3% 0.0%74 100.0% 93.3% 86.7% 80.0% 66.7% 60.0% 46.7% 40.0% 26.7% 13.3% 0.0%75 100.0% 93.3% 86.7% 80.0% 66.7% 60.0% 46.7% 40.0% 26.7% 13.3% 0.0%

69
APPENDIX C – TARGET PREMIUM RATESTarget Premium Rates (per $1,000 of Policy Face Amount) – Male
IssueAge
Standard100%
Table2
120%
Table3
130%
Table4
140%
Table5
150%
Table6
150%
Table7
165%
Table8
165%
Table9
180%
Table 10
180%
Table 11
195%
Table 12
195%
Table 13
210%
Table 14
210%
Table 15
210%
Table 16
210%
0 3.36 4.03 4.37 4.70 5.04 5.04 5.54 5.54 6.05 6.05 6.55 6.55 7.06 7.06 7.06 7.061 3.36 4.03 4.37 4.70 5.04 5.04 5.54 5.54 6.05 6.05 6.55 6.55 7.06 7.06 7.06 7.062 3.36 4.03 4.37 4.70 5.04 5.04 5.54 5.54 6.05 6.05 6.55 6.55 7.06 7.06 7.06 7.063 3.36 4.03 4.37 4.70 5.04 5.04 5.54 5.54 6.05 6.05 6.55 6.55 7.06 7.06 7.06 7.064 3.36 4.03 4.37 4.70 5.04 5.04 5.54 5.54 6.05 6.05 6.55 6.55 7.06 7.06 7.06 7.065 3.36 4.03 4.37 4.70 5.04 5.04 5.54 5.54 6.05 6.05 6.55 6.55 7.06 7.06 7.06 7.066 3.36 4.03 4.37 4.70 5.04 5.04 5.54 5.54 6.05 6.05 6.55 6.55 7.06 7.06 7.06 7.067 3.36 4.03 4.37 4.70 5.04 5.04 5.54 5.54 6.05 6.05 6.55 6.55 7.06 7.06 7.06 7.068 3.36 4.03 4.37 4.70 5.04 5.04 5.54 5.54 6.05 6.05 6.55 6.55 7.06 7.06 7.06 7.069 3.36 4.03 4.37 4.70 5.04 5.04 5.54 5.54 6.05 6.05 6.55 6.55 7.06 7.06 7.06 7.0610 3.36 4.03 4.37 4.70 5.04 5.04 5.54 5.54 6.05 6.05 6.55 6.55 7.06 7.06 7.06 7.0611 3.53 4.24 4.59 4.94 5.30 5.30 5.82 5.82 6.35 6.35 6.88 6.88 7.41 7.41 7.41 7.4112 3.70 4.44 4.81 5.18 5.55 5.55 6.11 6.11 6.66 6.66 7.22 7.22 7.77 7.77 7.77 7.7713 3.87 4.64 5.03 5.42 5.81 5.81 6.39 6.39 6.97 6.97 7.55 7.55 8.13 8.13 8.13 8.1314 4.03 4.84 5.24 5.64 6.05 6.05 6.65 6.65 7.25 7.25 7.86 7.86 8.46 8.46 8.46 8.4615 4.21 5.05 5.47 5.89 6.32 6.32 6.95 6.95 7.58 7.58 8.21 8.21 8.84 8.84 8.84 8.8416 4.56 5.47 5.93 6.38 6.84 6.84 7.52 7.52 8.21 8.21 8.89 8.89 9.58 9.58 9.58 9.5817 4.93 5.92 6.41 6.90 7.40 7.40 8.13 8.13 8.87 8.87 9.61 9.61 10.35 10.35 10.35 10.3518 5.29 6.35 6.88 7.41 7.94 7.94 8.73 8.73 9.52 9.52 10.32 10.32 11.11 11.11 11.11 11.1119 5.66 6.79 7.36 7.92 8.49 8.49 9.34 9.34 10.19 10.19 11.04 11.04 11.89 11.89 11.89 11.8920 6.02 7.22 7.83 8.43 9.03 9.03 9.93 9.93 10.84 10.84 11.74 11.74 12.64 12.64 12.64 12.6421 6.05 7.26 7.87 8.47 9.08 9.08 9.98 9.98 10.89 10.89 11.80 11.80 12.71 12.71 12.71 12.7122 6.08 7.30 7.90 8.51 9.12 9.12 10.03 10.03 10.94 10.94 11.86 11.86 12.77 12.77 12.77 12.7723 6.09 7.31 7.92 8.53 9.14 9.14 10.05 10.05 10.96 10.96 11.88 11.88 12.79 12.79 12.79 12.7924 6.12 7.34 7.96 8.57 9.18 9.18 10.10 10.10 11.02 11.02 11.93 11.93 12.85 12.85 12.85 12.8525 6.15 7.38 8.00 8.61 9.23 9.23 10.15 10.15 11.07 11.07 11.99 11.99 12.92 12.92 12.92 12.9226 6.44 7.73 8.37 9.02 9.66 9.66 10.63 10.63 11.59 11.59 12.56 12.56 13.52 13.52 13.52 13.5227 6.73 8.08 8.75 9.42 10.10 10.10 11.10 11.10 12.11 12.11 13.12 13.12 14.13 14.13 14.13 14.1328 7.02 8.42 9.13 9.83 10.53 10.53 11.58 11.58 12.64 12.64 13.69 13.69 14.74 14.74 14.74 14.7429 7.31 8.77 9.50 10.23 10.97 10.97 12.06 12.06 13.16 13.16 14.25 14.25 15.35 15.35 15.35 15.3530 7.60 9.12 9.88 10.64 11.40 11.40 12.54 12.54 13.68 13.68 14.82 14.82 15.96 15.96 15.96 15.9631 7.89 9.47 10.26 11.05 11.84 11.84 13.02 13.02 14.20 14.20 15.39 15.39 16.57 16.57 16.57 16.5732 8.18 9.82 10.63 11.45 12.27 12.27 13.50 13.50 14.72 14.72 15.95 15.95 17.18 17.18 17.18 17.1833 8.47 10.16 11.01 11.86 12.71 12.71 13.98 13.98 15.25 15.25 16.52 16.52 17.79 17.79 17.79 17.7934 8.76 10.51 11.39 12.26 13.14 13.14 14.45 14.45 15.77 15.77 17.08 17.08 18.40 18.40 18.40 18.4035 9.09 10.91 11.82 12.73 13.64 13.64 15.00 15.00 16.36 16.36 17.73 17.73 19.09 19.09 19.09 19.0936 9.68 11.62 12.58 13.55 14.52 14.52 15.97 15.97 17.42 17.42 18.88 18.88 20.33 20.33 20.33 20.3337 10.27 12.32 13.35 14.38 15.41 15.41 16.95 16.95 18.49 18.49 20.03 20.03 21.57 21.57 21.57 21.5738 10.86 13.03 14.12 15.20 16.29 16.29 17.92 17.92 19.55 19.55 21.18 21.18 22.81 22.81 22.81 22.8139 11.45 13.74 14.89 16.03 17.18 17.18 18.89 18.89 20.61 20.61 22.33 22.33 24.05 24.05 24.05 24.0540 12.04 14.45 15.65 16.86 18.06 18.06 19.87 19.87 21.67 21.67 23.48 23.48 25.28 25.28 25.28 25.2841 12.63 15.16 16.42 17.68 18.95 18.95 20.84 20.84 22.73 22.73 24.63 24.63 26.52 26.52 26.52 26.5242 13.22 15.86 17.19 18.51 19.83 19.83 21.81 21.81 23.80 23.80 25.78 25.78 27.76 27.76 27.76 27.7643 13.81 16.57 17.95 19.33 20.72 20.72 22.79 22.79 24.86 24.86 26.93 26.93 29.00 29.00 29.00 29.0044 14.40 17.28 18.72 20.16 21.60 21.60 23.76 23.76 25.92 25.92 28.08 28.08 30.24 30.24 30.24 30.2445 15.03 18.04 19.54 21.04 22.55 22.55 24.80 24.80 27.05 27.05 29.31 29.31 31.56 31.56 31.56 31.5646 16.12 19.34 20.96 22.57 24.18 24.18 26.60 26.60 29.02 29.02 31.43 31.43 33.85 33.85 33.85 33.8547 17.21 20.65 22.37 24.09 25.82 25.82 28.40 28.40 30.98 30.98 33.56 33.56 36.14 36.14 36.14 36.1448 18.30 21.96 23.79 25.62 27.45 27.45 30.20 30.20 32.94 32.94 35.69 35.69 38.43 38.43 38.43 38.4349 19.39 23.27 25.21 27.15 29.09 29.09 31.99 31.99 34.90 34.90 37.81 37.81 40.72 40.72 40.72 40.72
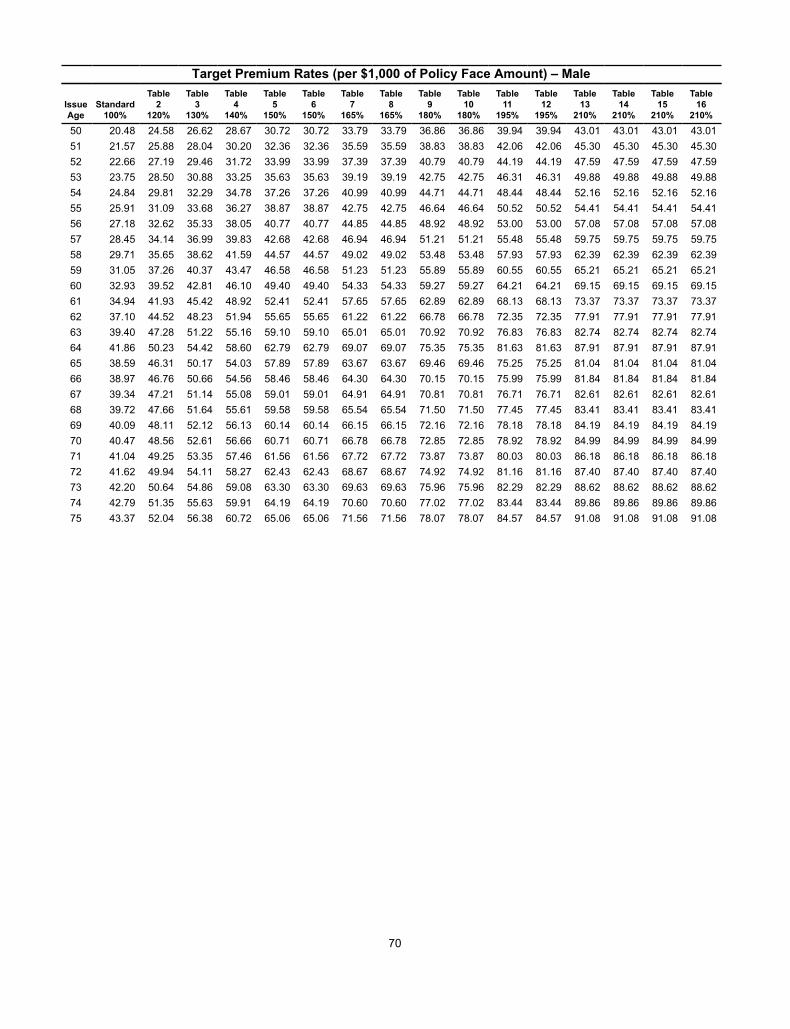
70
Target Premium Rates (per $1,000 of Policy Face Amount) – Male
IssueAge
Standard100%
Table2
120%
Table3
130%
Table4
140%
Table5
150%
Table6
150%
Table7
165%
Table8
165%
Table9
180%
Table 10
180%
Table 11
195%
Table 12
195%
Table 13
210%
Table 14
210%
Table 15
210%
Table 16
210%
50 20.48 24.58 26.62 28.67 30.72 30.72 33.79 33.79 36.86 36.86 39.94 39.94 43.01 43.01 43.01 43.0151 21.57 25.88 28.04 30.20 32.36 32.36 35.59 35.59 38.83 38.83 42.06 42.06 45.30 45.30 45.30 45.3052 22.66 27.19 29.46 31.72 33.99 33.99 37.39 37.39 40.79 40.79 44.19 44.19 47.59 47.59 47.59 47.5953 23.75 28.50 30.88 33.25 35.63 35.63 39.19 39.19 42.75 42.75 46.31 46.31 49.88 49.88 49.88 49.8854 24.84 29.81 32.29 34.78 37.26 37.26 40.99 40.99 44.71 44.71 48.44 48.44 52.16 52.16 52.16 52.1655 25.91 31.09 33.68 36.27 38.87 38.87 42.75 42.75 46.64 46.64 50.52 50.52 54.41 54.41 54.41 54.4156 27.18 32.62 35.33 38.05 40.77 40.77 44.85 44.85 48.92 48.92 53.00 53.00 57.08 57.08 57.08 57.0857 28.45 34.14 36.99 39.83 42.68 42.68 46.94 46.94 51.21 51.21 55.48 55.48 59.75 59.75 59.75 59.7558 29.71 35.65 38.62 41.59 44.57 44.57 49.02 49.02 53.48 53.48 57.93 57.93 62.39 62.39 62.39 62.3959 31.05 37.26 40.37 43.47 46.58 46.58 51.23 51.23 55.89 55.89 60.55 60.55 65.21 65.21 65.21 65.2160 32.93 39.52 42.81 46.10 49.40 49.40 54.33 54.33 59.27 59.27 64.21 64.21 69.15 69.15 69.15 69.1561 34.94 41.93 45.42 48.92 52.41 52.41 57.65 57.65 62.89 62.89 68.13 68.13 73.37 73.37 73.37 73.3762 37.10 44.52 48.23 51.94 55.65 55.65 61.22 61.22 66.78 66.78 72.35 72.35 77.91 77.91 77.91 77.9163 39.40 47.28 51.22 55.16 59.10 59.10 65.01 65.01 70.92 70.92 76.83 76.83 82.74 82.74 82.74 82.7464 41.86 50.23 54.42 58.60 62.79 62.79 69.07 69.07 75.35 75.35 81.63 81.63 87.91 87.91 87.91 87.9165 38.59 46.31 50.17 54.03 57.89 57.89 63.67 63.67 69.46 69.46 75.25 75.25 81.04 81.04 81.04 81.0466 38.97 46.76 50.66 54.56 58.46 58.46 64.30 64.30 70.15 70.15 75.99 75.99 81.84 81.84 81.84 81.8467 39.34 47.21 51.14 55.08 59.01 59.01 64.91 64.91 70.81 70.81 76.71 76.71 82.61 82.61 82.61 82.6168 39.72 47.66 51.64 55.61 59.58 59.58 65.54 65.54 71.50 71.50 77.45 77.45 83.41 83.41 83.41 83.4169 40.09 48.11 52.12 56.13 60.14 60.14 66.15 66.15 72.16 72.16 78.18 78.18 84.19 84.19 84.19 84.1970 40.47 48.56 52.61 56.66 60.71 60.71 66.78 66.78 72.85 72.85 78.92 78.92 84.99 84.99 84.99 84.9971 41.04 49.25 53.35 57.46 61.56 61.56 67.72 67.72 73.87 73.87 80.03 80.03 86.18 86.18 86.18 86.1872 41.62 49.94 54.11 58.27 62.43 62.43 68.67 68.67 74.92 74.92 81.16 81.16 87.40 87.40 87.40 87.4073 42.20 50.64 54.86 59.08 63.30 63.30 69.63 69.63 75.96 75.96 82.29 82.29 88.62 88.62 88.62 88.6274 42.79 51.35 55.63 59.91 64.19 64.19 70.60 70.60 77.02 77.02 83.44 83.44 89.86 89.86 89.86 89.8675 43.37 52.04 56.38 60.72 65.06 65.06 71.56 71.56 78.07 78.07 84.57 84.57 91.08 91.08 91.08 91.08

71
Target Premium Rates (per $1,000 of Policy Face Amount) – Female
IssueAge
Standard100%
Table2
120%
Table3
130%
Table4
140%
Table5
150%
Table6
150%
Table7
165%
Table8
165%
Table9
180%
Table 10
180%
Table 11
195%
Table 12
195%
Table 13
210%
Table 14
210%
Table 15
210%
Table 16
210%
0 2.91 3.49 3.78 4.07 4.37 4.37 4.80 4.80 5.24 5.24 5.67 5.67 6.11 6.11 6.11 6.111 2.91 3.49 3.78 4.07 4.37 4.37 4.80 4.80 5.24 5.24 5.67 5.67 6.11 6.11 6.11 6.112 2.91 3.49 3.78 4.07 4.37 4.37 4.80 4.80 5.24 5.24 5.67 5.67 6.11 6.11 6.11 6.113 2.91 3.49 3.78 4.07 4.37 4.37 4.80 4.80 5.24 5.24 5.67 5.67 6.11 6.11 6.11 6.114 2.91 3.49 3.78 4.07 4.37 4.37 4.80 4.80 5.24 5.24 5.67 5.67 6.11 6.11 6.11 6.115 2.91 3.49 3.78 4.07 4.37 4.37 4.80 4.80 5.24 5.24 5.67 5.67 6.11 6.11 6.11 6.116 2.91 3.49 3.78 4.07 4.37 4.37 4.80 4.80 5.24 5.24 5.67 5.67 6.11 6.11 6.11 6.117 2.91 3.49 3.78 4.07 4.37 4.37 4.80 4.80 5.24 5.24 5.67 5.67 6.11 6.11 6.11 6.118 2.91 3.49 3.78 4.07 4.37 4.37 4.80 4.80 5.24 5.24 5.67 5.67 6.11 6.11 6.11 6.119 2.91 3.49 3.78 4.07 4.37 4.37 4.80 4.80 5.24 5.24 5.67 5.67 6.11 6.11 6.11 6.1110 2.91 3.49 3.78 4.07 4.37 4.37 4.80 4.80 5.24 5.24 5.67 5.67 6.11 6.11 6.11 6.1111 3.05 3.66 3.97 4.27 4.58 4.58 5.03 5.03 5.49 5.49 5.95 5.95 6.41 6.41 6.41 6.4112 3.20 3.84 4.16 4.48 4.80 4.80 5.28 5.28 5.76 5.76 6.24 6.24 6.72 6.72 6.72 6.7213 3.34 4.01 4.34 4.68 5.01 5.01 5.51 5.51 6.01 6.01 6.51 6.51 7.01 7.01 7.01 7.0114 3.47 4.16 4.51 4.86 5.21 5.21 5.73 5.73 6.25 6.25 6.77 6.77 7.29 7.29 7.29 7.2915 3.63 4.36 4.72 5.08 5.45 5.45 5.99 5.99 6.53 6.53 7.08 7.08 7.62 7.62 7.62 7.6216 3.93 4.72 5.11 5.50 5.90 5.90 6.48 6.48 7.07 7.07 7.66 7.66 8.25 8.25 8.25 8.2517 4.24 5.09 5.51 5.94 6.36 6.36 7.00 7.00 7.63 7.63 8.27 8.27 8.90 8.90 8.90 8.9018 4.56 5.47 5.93 6.38 6.84 6.84 7.52 7.52 8.21 8.21 8.89 8.89 9.58 9.58 9.58 9.5819 4.87 5.84 6.33 6.82 7.31 7.31 8.04 8.04 8.77 8.77 9.50 9.50 10.23 10.23 10.23 10.2320 5.17 6.20 6.72 7.24 7.76 7.76 8.53 8.53 9.31 9.31 10.08 10.08 10.86 10.86 10.86 10.8621 5.19 6.23 6.75 7.27 7.79 7.79 8.56 8.56 9.34 9.34 10.12 10.12 10.90 10.90 10.90 10.9022 5.24 6.29 6.81 7.34 7.86 7.86 8.65 8.65 9.43 9.43 10.22 10.22 11.00 11.00 11.00 11.0023 5.25 6.30 6.83 7.35 7.88 7.88 8.66 8.66 9.45 9.45 10.24 10.24 11.03 11.03 11.03 11.0324 5.28 6.34 6.86 7.39 7.92 7.92 8.71 8.71 9.50 9.50 10.30 10.30 11.09 11.09 11.09 11.0925 5.30 6.36 6.89 7.42 7.95 7.95 8.75 8.75 9.54 9.54 10.34 10.34 11.13 11.13 11.13 11.1326 5.51 6.61 7.16 7.71 8.27 8.27 9.09 9.09 9.92 9.92 10.74 10.74 11.57 11.57 11.57 11.5727 5.72 6.86 7.44 8.01 8.58 8.58 9.44 9.44 10.30 10.30 11.15 11.15 12.01 12.01 12.01 12.0128 5.93 7.12 7.71 8.30 8.90 8.90 9.78 9.78 10.67 10.67 11.56 11.56 12.45 12.45 12.45 12.4529 6.14 7.37 7.98 8.60 9.21 9.21 10.13 10.13 11.05 11.05 11.97 11.97 12.89 12.89 12.89 12.8930 6.35 7.62 8.26 8.89 9.53 9.53 10.48 10.48 11.43 11.43 12.38 12.38 13.34 13.34 13.34 13.3431 6.56 7.87 8.53 9.18 9.84 9.84 10.82 10.82 11.81 11.81 12.79 12.79 13.78 13.78 13.78 13.7832 6.77 8.12 8.80 9.48 10.16 10.16 11.17 11.17 12.19 12.19 13.20 13.20 14.22 14.22 14.22 14.2233 6.98 8.38 9.07 9.77 10.47 10.47 11.52 11.52 12.56 12.56 13.61 13.61 14.66 14.66 14.66 14.6634 7.19 8.63 9.35 10.07 10.79 10.79 11.86 11.86 12.94 12.94 14.02 14.02 15.10 15.10 15.10 15.1035 7.40 8.88 9.62 10.36 11.10 11.10 12.21 12.21 13.32 13.32 14.43 14.43 15.54 15.54 15.54 15.5436 7.85 9.42 10.21 10.99 11.78 11.78 12.95 12.95 14.13 14.13 15.31 15.31 16.49 16.49 16.49 16.4937 8.30 9.96 10.79 11.62 12.45 12.45 13.70 13.70 14.94 14.94 16.19 16.19 17.43 17.43 17.43 17.4338 8.75 10.50 11.38 12.25 13.13 13.13 14.44 14.44 15.75 15.75 17.06 17.06 18.38 18.38 18.38 18.3839 9.20 11.04 11.96 12.88 13.80 13.80 15.18 15.18 16.56 16.56 17.94 17.94 19.32 19.32 19.32 19.3240 9.65 11.58 12.55 13.51 14.48 14.48 15.92 15.92 17.37 17.37 18.82 18.82 20.27 20.27 20.27 20.2741 10.10 12.12 13.13 14.14 15.15 15.15 16.67 16.67 18.18 18.18 19.70 19.70 21.21 21.21 21.21 21.2142 10.55 12.66 13.72 14.77 15.83 15.83 17.41 17.41 18.99 18.99 20.57 20.57 22.16 22.16 22.16 22.1643 11.00 13.20 14.30 15.40 16.50 16.50 18.15 18.15 19.80 19.80 21.45 21.45 23.10 23.10 23.10 23.1044 11.45 13.74 14.89 16.03 17.18 17.18 18.89 18.89 20.61 20.61 22.33 22.33 24.05 24.05 24.05 24.0545 11.93 14.32 15.51 16.70 17.90 17.90 19.68 19.68 21.47 21.47 23.26 23.26 25.05 25.05 25.05 25.0546 12.72 15.26 16.54 17.81 19.08 19.08 20.99 20.99 22.90 22.90 24.80 24.80 26.71 26.71 26.71 26.7147 13.51 16.21 17.56 18.91 20.27 20.27 22.29 22.29 24.32 24.32 26.34 26.34 28.37 28.37 28.37 28.3748 14.30 17.16 18.59 20.02 21.45 21.45 23.60 23.60 25.74 25.74 27.89 27.89 30.03 30.03 30.03 30.0349 15.09 18.11 19.62 21.13 22.64 22.64 24.90 24.90 27.16 27.16 29.43 29.43 31.69 31.69 31.69 31.69

72
Target Premium Rates (per $1,000 of Policy Face Amount) – Female
IssueAge
Standard100%
Table2
120%
Table3
130%
Table4
140%
Table5
150%
Table6
150%
Table7
165%
Table8
165%
Table9
180%
Table 10
180%
Table 11
195%
Table 12
195%
Table 13
210%
Table 14
210%
Table 15
210%
Table 16
210%
50 15.88 19.06 20.64 22.23 23.82 23.82 26.20 26.20 28.58 28.58 30.97 30.97 33.35 33.35 33.35 33.3551 16.67 20.00 21.67 23.34 25.01 25.01 27.51 27.51 30.01 30.01 32.51 32.51 35.01 35.01 35.01 35.0152 17.46 20.95 22.70 24.44 26.19 26.19 28.81 28.81 31.43 31.43 34.05 34.05 36.67 36.67 36.67 36.6753 18.25 21.90 23.73 25.55 27.38 27.38 30.11 30.11 32.85 32.85 35.59 35.59 38.33 38.33 38.33 38.3354 19.04 22.85 24.75 26.66 28.56 28.56 31.42 31.42 34.27 34.27 37.13 37.13 39.98 39.98 39.98 39.9855 19.82 23.78 25.77 27.75 29.73 29.73 32.70 32.70 35.68 35.68 38.65 38.65 41.62 41.62 41.62 41.6256 20.90 25.08 27.17 29.26 31.35 31.35 34.49 34.49 37.62 37.62 40.76 40.76 43.89 43.89 43.89 43.8957 22.05 26.46 28.67 30.87 33.08 33.08 36.38 36.38 39.69 39.69 43.00 43.00 46.31 46.31 46.31 46.3158 23.29 27.95 30.28 32.61 34.94 34.94 38.43 38.43 41.92 41.92 45.42 45.42 48.91 48.91 48.91 48.9159 24.62 29.54 32.01 34.47 36.93 36.93 40.62 40.62 44.32 44.32 48.01 48.01 51.70 51.70 51.70 51.7060 26.06 31.27 33.88 36.48 39.09 39.09 43.00 43.00 46.91 46.91 50.82 50.82 54.73 54.73 54.73 54.7361 27.60 33.12 35.88 38.64 41.40 41.40 45.54 45.54 49.68 49.68 53.82 53.82 57.96 57.96 57.96 57.9662 29.26 35.11 38.04 40.96 43.89 43.89 48.28 48.28 52.67 52.67 57.06 57.06 61.45 61.45 61.45 61.4563 31.06 37.27 40.38 43.48 46.59 46.59 51.25 51.25 55.91 55.91 60.57 60.57 65.23 65.23 65.23 65.2364 32.97 39.56 42.86 46.16 49.46 49.46 54.40 54.40 59.35 59.35 64.29 64.29 69.24 69.24 69.24 69.2465 30.28 36.34 39.36 42.39 45.42 45.42 49.96 49.96 54.50 54.50 59.05 59.05 63.59 63.59 63.59 63.5966 30.87 37.04 40.13 43.22 46.31 46.31 50.94 50.94 55.57 55.57 60.20 60.20 64.83 64.83 64.83 64.8367 31.46 37.75 40.90 44.04 47.19 47.19 51.91 51.91 56.63 56.63 61.35 61.35 66.07 66.07 66.07 66.0768 32.04 38.45 41.65 44.86 48.06 48.06 52.87 52.87 57.67 57.67 62.48 62.48 67.28 67.28 67.28 67.2869 32.62 39.14 42.41 45.67 48.93 48.93 53.82 53.82 58.72 58.72 63.61 63.61 68.50 68.50 68.50 68.5070 33.22 39.86 43.19 46.51 49.83 49.83 54.81 54.81 59.80 59.80 64.78 64.78 69.76 69.76 69.76 69.7671 33.80 40.56 43.94 47.32 50.70 50.70 55.77 55.77 60.84 60.84 65.91 65.91 70.98 70.98 70.98 70.9872 34.38 41.26 44.69 48.13 51.57 51.57 56.73 56.73 61.88 61.88 67.04 67.04 72.20 72.20 72.20 72.2073 34.96 41.95 45.45 48.94 52.44 52.44 57.68 57.68 62.93 62.93 68.17 68.17 73.42 73.42 73.42 73.4274 35.56 42.67 46.23 49.78 53.34 53.34 58.67 58.67 64.01 64.01 69.34 69.34 74.68 74.68 74.68 74.6875 36.14 43.37 46.98 50.60 54.21 54.21 59.63 59.63 65.05 65.05 70.47 70.47 75.89 75.89 75.89 75.89

73
Target Premium Rates (per $1,000 of Policy Face Amount) – Unisex
IssueAge
Standard100%
Table2
120%
Table3
130%
Table4
140%
Table5
150%
Table6
150%
Table7
165%
Table8
165%
Table9
180%
Table 10
180%
Table 11
195%
Table 12
195%
Table 13
210%
Table 14
210%
Table 15
210%
Table 16
210%
0 3.27 3.92 4.25 4.58 4.91 4.91 5.40 5.40 5.89 5.89 6.38 6.38 6.87 6.87 6.87 6.871 3.27 3.92 4.25 4.58 4.91 4.91 5.40 5.40 5.89 5.89 6.38 6.38 6.87 6.87 6.87 6.872 3.27 3.92 4.25 4.58 4.91 4.91 5.40 5.40 5.89 5.89 6.38 6.38 6.87 6.87 6.87 6.873 3.27 3.92 4.25 4.58 4.91 4.91 5.40 5.40 5.89 5.89 6.38 6.38 6.87 6.87 6.87 6.874 3.27 3.92 4.25 4.58 4.91 4.91 5.40 5.40 5.89 5.89 6.38 6.38 6.87 6.87 6.87 6.875 3.27 3.92 4.25 4.58 4.91 4.91 5.40 5.40 5.89 5.89 6.38 6.38 6.87 6.87 6.87 6.876 3.27 3.92 4.25 4.58 4.91 4.91 5.40 5.40 5.89 5.89 6.38 6.38 6.87 6.87 6.87 6.877 3.27 3.92 4.25 4.58 4.91 4.91 5.40 5.40 5.89 5.89 6.38 6.38 6.87 6.87 6.87 6.878 3.27 3.92 4.25 4.58 4.91 4.91 5.40 5.40 5.89 5.89 6.38 6.38 6.87 6.87 6.87 6.879 3.27 3.92 4.25 4.58 4.91 4.91 5.40 5.40 5.89 5.89 6.38 6.38 6.87 6.87 6.87 6.8710 3.27 3.92 4.25 4.58 4.91 4.91 5.40 5.40 5.89 5.89 6.38 6.38 6.87 6.87 6.87 6.8711 3.43 4.12 4.46 4.80 5.15 5.15 5.66 5.66 6.17 6.17 6.69 6.69 7.20 7.20 7.20 7.2012 3.60 4.32 4.68 5.04 5.40 5.40 5.94 5.94 6.48 6.48 7.02 7.02 7.56 7.56 7.56 7.5613 3.76 4.51 4.89 5.26 5.64 5.64 6.20 6.20 6.77 6.77 7.33 7.33 7.90 7.90 7.90 7.9014 3.92 4.70 5.10 5.49 5.88 5.88 6.47 6.47 7.06 7.06 7.64 7.64 8.23 8.23 8.23 8.2315 4.09 4.91 5.32 5.73 6.14 6.14 6.75 6.75 7.36 7.36 7.98 7.98 8.59 8.59 8.59 8.5916 4.44 5.33 5.77 6.22 6.66 6.66 7.33 7.33 7.99 7.99 8.66 8.66 9.32 9.32 9.32 9.3217 4.80 5.76 6.24 6.72 7.20 7.20 7.92 7.92 8.64 8.64 9.36 9.36 10.08 10.08 10.08 10.0818 5.14 6.17 6.68 7.20 7.71 7.71 8.48 8.48 9.25 9.25 10.02 10.02 10.79 10.79 10.79 10.7919 5.50 6.60 7.15 7.70 8.25 8.25 9.08 9.08 9.90 9.90 10.73 10.73 11.55 11.55 11.55 11.5520 5.85 7.02 7.61 8.19 8.78 8.78 9.65 9.65 10.53 10.53 11.41 11.41 12.29 12.29 12.29 12.2921 5.87 7.04 7.63 8.22 8.81 8.81 9.69 9.69 10.57 10.57 11.45 11.45 12.33 12.33 12.33 12.3322 5.91 7.09 7.68 8.27 8.87 8.87 9.75 9.75 10.64 10.64 11.52 11.52 12.41 12.41 12.41 12.4123 5.92 7.10 7.70 8.29 8.88 8.88 9.77 9.77 10.66 10.66 11.54 11.54 12.43 12.43 12.43 12.4324 5.95 7.14 7.74 8.33 8.93 8.93 9.82 9.82 10.71 10.71 11.60 11.60 12.50 12.50 12.50 12.5025 5.98 7.18 7.77 8.37 8.97 8.97 9.87 9.87 10.76 10.76 11.66 11.66 12.56 12.56 12.56 12.5626 6.25 7.50 8.13 8.75 9.38 9.38 10.31 10.31 11.25 11.25 12.19 12.19 13.13 13.13 13.13 13.1327 6.53 7.84 8.49 9.14 9.80 9.80 10.77 10.77 11.75 11.75 12.73 12.73 13.71 13.71 13.71 13.7128 6.80 8.16 8.84 9.52 10.20 10.20 11.22 11.22 12.24 12.24 13.26 13.26 14.28 14.28 14.28 14.2829 7.08 8.50 9.20 9.91 10.62 10.62 11.68 11.68 12.74 12.74 13.81 13.81 14.87 14.87 14.87 14.8730 7.35 8.82 9.56 10.29 11.03 11.03 12.13 12.13 13.23 13.23 14.33 14.33 15.44 15.44 15.44 15.4431 7.62 9.14 9.91 10.67 11.43 11.43 12.57 12.57 13.72 13.72 14.86 14.86 16.00 16.00 16.00 16.0032 7.90 9.48 10.27 11.06 11.85 11.85 13.04 13.04 14.22 14.22 15.41 15.41 16.59 16.59 16.59 16.5933 8.17 9.80 10.62 11.44 12.26 12.26 13.48 13.48 14.71 14.71 15.93 15.93 17.16 17.16 17.16 17.1634 8.45 10.14 10.99 11.83 12.68 12.68 13.94 13.94 15.21 15.21 16.48 16.48 17.75 17.75 17.75 17.7535 8.75 10.50 11.38 12.25 13.13 13.13 14.44 14.44 15.75 15.75 17.06 17.06 18.38 18.38 18.38 18.3836 9.31 11.17 12.10 13.03 13.97 13.97 15.36 15.36 16.76 16.76 18.15 18.15 19.55 19.55 19.55 19.5537 9.88 11.86 12.84 13.83 14.82 14.82 16.30 16.30 17.78 17.78 19.27 19.27 20.75 20.75 20.75 20.7538 10.44 12.53 13.57 14.62 15.66 15.66 17.23 17.23 18.79 18.79 20.36 20.36 21.92 21.92 21.92 21.9239 11.00 13.20 14.30 15.40 16.50 16.50 18.15 18.15 19.80 19.80 21.45 21.45 23.10 23.10 23.10 23.1040 11.56 13.87 15.03 16.18 17.34 17.34 19.07 19.07 20.81 20.81 22.54 22.54 24.28 24.28 24.28 24.2841 12.12 14.54 15.76 16.97 18.18 18.18 20.00 20.00 21.82 21.82 23.63 23.63 25.45 25.45 25.45 25.4542 12.69 15.23 16.50 17.77 19.04 19.04 20.94 20.94 22.84 22.84 24.75 24.75 26.65 26.65 26.65 26.6543 13.25 15.90 17.23 18.55 19.88 19.88 21.86 21.86 23.85 23.85 25.84 25.84 27.83 27.83 27.83 27.8344 13.81 16.57 17.95 19.33 20.72 20.72 22.79 22.79 24.86 24.86 26.93 26.93 29.00 29.00 29.00 29.0045 14.41 17.29 18.73 20.17 21.62 21.62 23.78 23.78 25.94 25.94 28.10 28.10 30.26 30.26 30.26 30.2646 15.44 18.53 20.07 21.62 23.16 23.16 25.48 25.48 27.79 27.79 30.11 30.11 32.42 32.42 32.42 32.4247 16.47 19.76 21.41 23.06 24.71 24.71 27.18 27.18 29.65 29.65 32.12 32.12 34.59 34.59 34.59 34.5948 17.50 21.00 22.75 24.50 26.25 26.25 28.88 28.88 31.50 31.50 34.13 34.13 36.75 36.75 36.75 36.7549 18.53 22.24 24.09 25.94 27.80 27.80 30.57 30.57 33.35 33.35 36.13 36.13 38.91 38.91 38.91 38.91

74
Target Premium Rates (per $1,000 of Policy Face Amount) – Unisex
IssueAge
Standard100%
Table2
120%
Table3
130%
Table4
140%
Table5
150%
Table6
150%
Table7
165%
Table8
165%
Table9
180%
Table 10
180%
Table 11
195%
Table 12
195%
Table 13
210%
Table 14
210%
Table 15
210%
Table 16
210%
50 19.56 23.47 25.43 27.38 29.34 29.34 32.27 32.27 35.21 35.21 38.14 38.14 41.08 41.08 41.08 41.0851 20.59 24.71 26.77 28.83 30.89 30.89 33.97 33.97 37.06 37.06 40.15 40.15 43.24 43.24 43.24 43.2452 21.62 25.94 28.11 30.27 32.43 32.43 35.67 35.67 38.92 38.92 42.16 42.16 45.40 45.40 45.40 45.4053 22.65 27.18 29.45 31.71 33.98 33.98 37.37 37.37 40.77 40.77 44.17 44.17 47.57 47.57 47.57 47.5754 23.68 28.42 30.78 33.15 35.52 35.52 39.07 39.07 42.62 42.62 46.18 46.18 49.73 49.73 49.73 49.7355 24.69 29.63 32.10 34.57 37.04 37.04 40.74 40.74 44.44 44.44 48.15 48.15 51.85 51.85 51.85 51.8556 25.92 31.10 33.70 36.29 38.88 38.88 42.77 42.77 46.66 46.66 50.54 50.54 54.43 54.43 54.43 54.4357 27.17 32.60 35.32 38.04 40.76 40.76 44.83 44.83 48.91 48.91 52.98 52.98 57.06 57.06 57.06 57.0658 28.52 34.22 37.08 39.93 42.78 42.78 47.06 47.06 51.34 51.34 55.61 55.61 59.89 59.89 59.89 59.8959 30.21 36.25 39.27 42.29 45.32 45.32 49.85 49.85 54.38 54.38 58.91 58.91 63.44 63.44 63.44 63.4460 32.04 38.45 41.65 44.86 48.06 48.06 52.87 52.87 57.67 57.67 62.48 62.48 67.28 67.28 67.28 67.2861 33.99 40.79 44.19 47.59 50.99 50.99 56.08 56.08 61.18 61.18 66.28 66.28 71.38 71.38 71.38 71.3862 36.08 43.30 46.90 50.51 54.12 54.12 59.53 59.53 64.94 64.94 70.36 70.36 75.77 75.77 75.77 75.7763 38.32 45.98 49.82 53.65 57.48 57.48 63.23 63.23 68.98 68.98 74.72 74.72 80.47 80.47 80.47 80.4764 40.70 48.84 52.91 56.98 61.05 61.05 67.16 67.16 73.26 73.26 79.37 79.37 85.47 85.47 85.47 85.4765 36.93 44.32 48.01 51.70 55.40 55.40 60.93 60.93 66.47 66.47 72.01 72.01 77.55 77.55 77.55 77.5566 37.35 44.82 48.56 52.29 56.03 56.03 61.63 61.63 67.23 67.23 72.83 72.83 78.44 78.44 78.44 78.4467 37.76 45.31 49.09 52.86 56.64 56.64 62.30 62.30 67.97 67.97 73.63 73.63 79.30 79.30 79.30 79.3068 38.18 45.82 49.63 53.45 57.27 57.27 63.00 63.00 68.72 68.72 74.45 74.45 80.18 80.18 80.18 80.1869 38.60 46.32 50.18 54.04 57.90 57.90 63.69 63.69 69.48 69.48 75.27 75.27 81.06 81.06 81.06 81.0670 39.02 46.82 50.73 54.63 58.53 58.53 64.38 64.38 70.24 70.24 76.09 76.09 81.94 81.94 81.94 81.9471 39.59 47.51 51.47 55.43 59.39 59.39 65.32 65.32 71.26 71.26 77.20 77.20 83.14 83.14 83.14 83.1472 40.17 48.20 52.22 56.24 60.26 60.26 66.28 66.28 72.31 72.31 78.33 78.33 84.36 84.36 84.36 84.3673 40.75 48.90 52.98 57.05 61.13 61.13 67.24 67.24 73.35 73.35 79.46 79.46 85.58 85.58 85.58 85.5874 41.34 49.61 53.74 57.88 62.01 62.01 68.21 68.21 74.41 74.41 80.61 80.61 86.81 86.81 86.81 86.8175 41.92 50.30 54.50 58.69 62.88 62.88 69.17 69.17 75.46 75.46 81.74 81.74 88.03 88.03 88.03 88.03

75
APPENDIX D
APPLICABLE PERCENTAGES (FOR LIFE INSURANCE DEFINITION TEST)
Guideline Premium/Cash Value Corridor Test
Insured’sAttained Age
Percentage ofSurrender Value
Insured’sAttained Age
Percentage ofSurrender Value
Insured’sAttained Age
Percentage ofSurrender Value
0-40 250.00 53 164.00 66 119.0041 243.00 54 157.00 67 118.0042 236.00 55 150.00 68 117.0043 229.00 56 146.00 69 116.0044 222.00 57 142.00 70 115.0045 215.00 58 138.00 71 113.0046 209.00 59 134.00 72 111.0047 203.00 60 130.00 73 109.0048 197.00 61 128.00 74 107.0049 191.00 62 126.00 75-90 105.0050 185.00 63 124.00 91 104.0051 178.00 64 122.00 92 103.0052 171.00 65 120.00 93 102.00
94+ 101.00
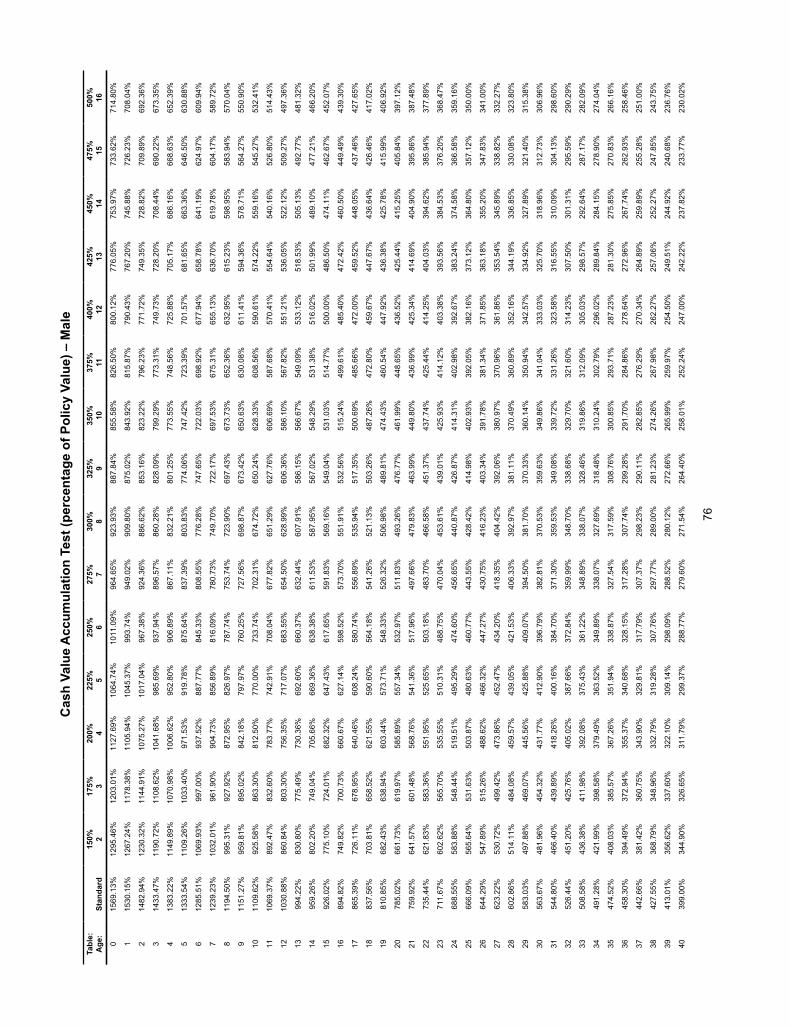
76
Cas
h Va
lue
Acc
umul
atio
n Te
st (p
erce
ntag
e of
Pol
icy
Valu
e) –
Mal
e
Tabl
e:A
ge:
Stan
dard
150% 2
175% 3
200% 4
225% 5
250% 6
275% 7
300% 8
325% 9
350% 10
375% 11
400% 12
425% 13
450% 14
475% 15
500% 16
015
69.1
3%12
95.4
6%12
03.0
1%11
27.6
9%10
64.7
4%10
11.0
9%96
4.65
%92
3.93
%88
7.84
%85
5.58
%82
6.50
%80
0.12
%77
6.05
%75
3.97
%73
3.62
%71
4.80
%
115
30.1
5%12
67.2
4%11
78.3
8%11
05.9
4%10
45.3
7%99
3.74
%94
9.02
%90
9.80
%87
5.02
%84
3.92
%81
5.87
%79
0.43
%76
7.20
%74
5.88
%72
6.23
%70
8.04
%
214
82.9
4%12
30.3
2%11
44.9
1%10
75.2
7%10
17.0
4%96
7.38
%92
4.36
%88
6.62
%85
3.16
%82
3.22
%79
6.23
%77
1.72
%74
9.35
%72
8.82
%70
9.89
%69
2.36
%
314
33.4
7%11
90.7
2%11
08.6
2%10
41.6
8%98
5.69
%93
7.94
%89
6.57
%86
0.28
%82
8.09
%79
9.29
%77
3.31
%74
9.73
%72
8.20
%70
8.44
%69
0.22
%67
3.35
%
413
83.2
2%11
49.8
9%10
70.9
8%10
06.6
2%95
2.80
%90
6.89
%86
7.11
%83
2.21
%80
1.25
%77
3.55
%74
8.56
%72
5.88
%70
5.17
%68
6.16
%66
8.63
%65
2.39
%
513
33.5
4%11
09.2
6%10
33.4
0%97
1.53
%91
9.78
%87
5.64
%83
7.39
%80
3.83
%77
4.06
%74
7.42
%72
3.39
%70
1.57
%68
1.65
%66
3.36
%64
6.50
%63
0.88
%
612
85.5
1%10
69.9
3%99
7.00
%93
7.52
%88
7.77
%84
5.33
%80
8.55
%77
6.28
%74
7.65
%72
2.03
%69
8.92
%67
7.94
%65
8.78
%64
1.19
%62
4.97
%60
9.94
%
712
39.2
3%10
32.0
1%96
1.90
%90
4.73
%85
6.89
%81
6.09
%78
0.73
%74
9.70
%72
2.17
%69
7.53
%67
5.31
%65
5.13
%63
6.70
%61
9.78
%60
4.17
%58
9.72
%
811
94.5
0%99
5.31
%92
7.92
%87
2.95
%82
6.97
%78
7.74
%75
3.74
%72
3.90
%69
7.43
%67
3.73
%65
2.36
%63
2.95
%61
5.23
%59
8.95
%58
3.94
%57
0.04
%
911
51.2
7%95
9.81
%89
5.02
%84
2.18
%79
7.97
%76
0.25
%72
7.56
%69
8.87
%67
3.42
%65
0.63
%63
0.08
%61
1.41
%59
4.36
%57
8.71
%56
4.27
%55
0.90
%
1011
09.6
2%92
5.58
%86
3.30
%81
2.50
%77
0.00
%73
3.74
%70
2.31
%67
4.72
%65
0.24
%62
8.33
%60
8.56
%59
0.61
%57
4.22
%55
9.16
%54
5.27
%53
2.41
%
1110
69.3
7%89
2.47
%83
2.60
%78
3.77
%74
2.91
%70
8.04
%67
7.82
%65
1.29
%62
7.76
%60
6.69
%58
7.68
%57
0.41
%55
4.64
%54
0.16
%52
6.80
%51
4.43
%
1210
30.8
8%86
0.84
%80
3.30
%75
6.35
%71
7.07
%68
3.55
%65
4.50
%62
8.99
%60
6.36
%58
6.10
%56
7.82
%55
1.21
%53
6.05
%52
2.12
%50
9.27
%49
7.36
%
1399
4.22
%83
0.80
%77
5.49
%73
0.36
%69
2.60
%66
0.37
%63
2.44
%60
7.91
%58
6.15
%56
6.67
%54
9.09
%53
3.12
%51
8.53
%50
5.13
%49
2.77
%48
1.32
%
1495
9.26
%80
2.20
%74
9.04
%70
5.66
%66
9.36
%63
8.38
%61
1.53
%58
7.95
%56
7.02
%54
8.29
%53
1.38
%51
6.02
%50
1.99
%48
9.10
%47
7.21
%46
6.20
%
1592
6.02
%77
5.10
%72
4.01
%68
2.32
%64
7.43
%61
7.65
%59
1.83
%56
9.16
%54
9.04
%53
1.03
%51
4.77
%50
0.00
%48
6.50
%47
4.11
%46
2.67
%45
2.07
%
1689
4.82
%74
9.82
%70
0.73
%66
0.67
%62
7.14
%59
8.52
%57
3.70
%55
1.91
%53
2.56
%51
5.24
%49
9.61
%48
5.40
%47
2.42
%46
0.50
%44
9.49
%43
9.30
%
1786
5.39
%72
6.11
%67
8.95
%64
0.46
%60
8.24
%58
0.74
%55
6.89
%53
5.94
%51
7.35
%50
0.69
%48
5.66
%47
2.00
%45
9.52
%44
8.05
%43
7.46
%42
7.65
%
1883
7.56
%70
3.81
%65
8.52
%62
1.55
%59
0.60
%56
4.18
%54
1.26
%52
1.13
%50
3.26
%48
7.26
%47
2.80
%45
9.67
%44
7.67
%43
6.64
%42
6.46
%41
7.02
%
1981
0.85
%68
2.43
%63
8.94
%60
3.44
%57
3.71
%54
8.33
%52
6.32
%50
6.98
%48
9.81
%47
4.43
%46
0.54
%44
7.92
%43
6.38
%42
5.78
%41
5.99
%40
6.92
%
2078
5.02
%66
1.73
%61
9.97
%58
5.89
%55
7.34
%53
2.97
%51
1.83
%49
3.26
%47
6.77
%46
1.99
%44
8.65
%43
6.52
%42
5.44
%41
5.25
%40
5.84
%39
7.12
%
2175
9.92
%64
1.57
%60
1.48
%56
8.76
%54
1.36
%51
7.96
%49
7.66
%47
9.83
%46
3.99
%44
9.80
%43
6.99
%42
5.34
%41
4.69
%40
4.90
%39
5.86
%38
7.48
%
2273
5.44
%62
1.83
%58
3.36
%55
1.95
%52
5.65
%50
3.18
%48
3.70
%46
6.58
%45
1.37
%43
7.74
%42
5.44
%41
4.25
%40
4.03
%39
4.62
%38
5.94
%37
7.89
%
2371
1.67
%60
2.62
%56
5.70
%53
5.55
%51
0.31
%48
8.75
%47
0.04
%45
3.61
%43
9.01
%42
5.93
%41
4.12
%40
3.38
%39
3.56
%38
4.53
%37
6.20
%36
8.47
%
2468
8.55
%58
3.88
%54
8.44
%51
9.51
%49
5.29
%47
4.60
%45
6.65
%44
0.87
%42
6.87
%41
4.31
%40
2.98
%39
2.67
%38
3.24
%37
4.58
%36
6.58
%35
9.16
%
2566
6.09
%56
5.64
%53
1.63
%50
3.87
%48
0.63
%46
0.77
%44
3.55
%42
8.42
%41
4.98
%40
2.93
%39
2.05
%38
2.16
%37
3.12
%36
4.80
%35
7.12
%35
0.00
%
2664
4.29
%54
7.89
%51
5.26
%48
8.62
%46
6.32
%44
7.27
%43
0.75
%41
6.23
%40
3.34
%39
1.78
%38
1.34
%37
1.85
%36
3.18
%35
5.20
%34
7.83
%34
1.00
%
2762
3.22
%53
0.72
%49
9.42
%47
3.86
%45
2.47
%43
4.20
%41
8.35
%40
4.42
%39
2.06
%38
0.97
%37
0.96
%36
1.86
%35
3.54
%34
5.89
%33
8.82
%33
2.27
%
2860
2.86
%51
4.11
%48
4.08
%45
9.57
%43
9.05
%42
1.53
%40
6.33
%39
2.97
%38
1.11
%37
0.49
%36
0.89
%35
2.16
%34
4.19
%33
6.85
%33
0.08
%32
3.80
%
2958
3.03
%49
7.88
%46
9.07
%44
5.56
%42
5.88
%40
9.07
%39
4.50
%38
1.70
%37
0.33
%36
0.14
%35
0.94
%34
2.57
%33
4.92
%32
7.89
%32
1.40
%31
5.38
%
3056
3.67
%48
1.96
%45
4.32
%43
1.77
%41
2.90
%39
6.79
%38
2.81
%37
0.53
%35
9.63
%34
9.86
%34
1.04
%33
3.03
%32
5.70
%31
8.96
%31
2.73
%30
6.96
%
3154
4.80
%46
6.40
%43
9.89
%41
8.26
%40
0.16
%38
4.70
%37
1.30
%35
9.53
%34
9.08
%33
9.72
%33
1.26
%32
3.58
%31
6.55
%31
0.09
%30
4.13
%29
8.60
%
3252
6.44
%45
1.20
%42
5.76
%40
5.02
%38
7.66
%37
2.84
%35
9.99
%34
8.70
%33
8.68
%32
9.70
%32
1.60
%31
4.23
%30
7.50
%30
1.31
%29
5.59
%29
0.29
%
3350
8.58
%43
6.38
%41
1.98
%39
2.08
%37
5.43
%36
1.22
%34
8.89
%33
8.07
%32
8.46
%31
9.86
%31
2.09
%30
5.03
%29
8.57
%29
2.64
%28
7.17
%28
2.09
%
3449
1.28
%42
1.99
%39
8.58
%37
9.49
%36
3.52
%34
9.89
%33
8.07
%32
7.69
%31
8.48
%31
0.24
%30
2.79
%29
6.02
%28
9.84
%28
4.15
%27
8.90
%27
4.04
%
3547
4.52
%40
8.03
%38
5.57
%36
7.26
%35
1.94
%33
8.87
%32
7.54
%31
7.59
%30
8.76
%30
0.85
%29
3.71
%28
7.23
%28
1.30
%27
5.85
%27
0.83
%26
6.16
%
3645
8.30
%39
4.49
%37
2.94
%35
5.37
%34
0.68
%32
8.15
%31
7.28
%30
7.74
%29
9.28
%29
1.70
%28
4.86
%27
8.64
%27
2.96
%26
7.74
%26
2.93
%25
8.46
%
3744
2.66
%38
1.42
%36
0.75
%34
3.90
%32
9.81
%31
7.79
%30
7.37
%29
8.23
%29
0.11
%28
2.85
%27
6.29
%27
0.34
%26
4.89
%25
9.89
%25
5.28
%25
1.00
%
3842
7.55
%36
8.79
%34
8.96
%33
2.79
%31
9.28
%30
7.76
%29
7.77
%28
9.00
%28
1.23
%27
4.26
%26
7.98
%26
2.27
%25
7.06
%25
2.27
%24
7.85
%24
3.75
%
3941
3.01
%35
6.62
%33
7.60
%32
2.10
%30
9.14
%29
8.09
%28
8.52
%28
0.12
%27
2.66
%26
5.99
%25
9.97
%25
4.50
%24
9.51
%24
4.92
%24
0.68
%23
6.76
%
4039
9.00
%34
4.90
%32
6.65
%31
1.79
%29
9.37
%28
8.77
%27
9.60
%27
1.54
%26
4.40
%25
8.01
%25
2.24
%24
7.00
%24
2.22
%23
7.82
%23
3.77
%23
0.02
%

77
Tabl
e:A
ge:
Stan
dard
150% 2
175% 3
200% 4
225% 5
250% 6
275% 7
300% 8
325% 9
350% 10
375% 11
400% 12
425% 13
450% 14
475% 15
500% 16
4138
5.51
%33
3.61
%31
6.11
%30
1.86
%28
9.94
%27
9.79
%27
0.99
%26
3.28
%25
6.43
%25
0.31
%24
4.79
%23
9.77
%23
5.19
%23
0.98
%22
7.10
%22
3.50
%
4237
2.54
%32
2.75
%30
5.97
%29
2.30
%28
0.89
%27
1.15
%26
2.73
%25
5.33
%24
8.78
%24
2.91
%23
7.62
%23
2.82
%22
8.43
%22
4.40
%22
0.69
%21
7.24
%
4336
0.09
%31
2.33
%29
6.24
%28
3.14
%27
2.20
%26
2.87
%25
4.80
%24
7.72
%24
1.44
%23
5.82
%23
0.75
%22
6.15
%22
1.96
%21
8.10
%21
4.55
%21
1.25
%
4434
8.13
%30
2.34
%28
6.91
%27
4.36
%26
3.87
%25
4.94
%24
7.20
%24
0.42
%23
4.41
%22
9.03
%22
4.18
%21
9.78
%21
5.76
%21
2.07
%20
8.67
%20
5.52
%
4533
6.69
%29
2.78
%27
7.99
%26
5.96
%25
5.92
%24
7.36
%23
9.95
%23
3.46
%22
7.71
%22
2.56
%21
7.92
%21
3.71
%20
9.86
%20
6.34
%20
3.08
%20
0.07
%
4632
5.73
%28
3.63
%26
9.47
%25
7.94
%24
8.32
%24
0.13
%23
3.04
%22
6.83
%22
1.32
%21
6.39
%21
1.96
%20
7.93
%20
4.25
%20
0.88
%19
7.77
%19
4.90
%
4731
5.22
%27
4.86
%26
1.29
%25
0.26
%24
1.04
%23
3.20
%22
6.42
%22
0.47
%21
5.20
%21
0.49
%20
6.25
%20
2.40
%19
8.89
%19
5.67
%19
2.70
%18
9.95
%
4830
5.12
%26
6.45
%25
3.45
%24
2.88
%23
4.07
%22
6.56
%22
0.07
%21
4.38
%20
9.35
%20
4.84
%20
0.79
%19
7.11
%19
3.75
%19
0.67
%18
7.84
%18
5.21
%
4929
5.35
%25
8.29
%24
5.85
%23
5.73
%22
7.29
%22
0.11
%21
3.90
%20
8.46
%20
3.64
%19
9.34
%19
5.46
%19
1.94
%18
8.74
%18
5.80
%18
3.09
%18
0.59
%
5028
5.91
%25
0.40
%23
8.48
%22
8.79
%22
0.71
%21
3.84
%20
7.90
%20
2.70
%19
8.09
%19
3.98
%19
0.28
%18
6.92
%18
3.86
%18
1.05
%17
8.46
%17
6.07
%
5127
6.80
%24
2.77
%23
1.35
%22
2.08
%21
4.35
%20
7.78
%20
2.10
%19
7.12
%19
2.72
%18
8.79
%18
5.25
%18
2.04
%17
9.12
%17
6.44
%17
3.97
%17
1.69
%
5425
1.56
%22
1.65
%21
1.64
%20
3.51
%19
6.75
%19
1.00
%18
6.03
%18
1.69
%17
7.85
%17
4.43
%17
1.35
%16
8.55
%16
6.01
%16
3.68
%16
1.54
%15
9.56
%
5524
3.86
%21
5.23
%20
5.65
%19
7.88
%19
1.41
%18
5.91
%18
1.17
%17
7.03
%17
3.36
%17
0.09
%16
7.15
%16
4.49
%16
2.06
%15
9.84
%15
7.80
%15
5.92
%
5623
6.52
%20
9.12
%19
9.96
%19
2.53
%18
6.35
%18
1.10
%17
6.57
%17
2.61
%16
9.11
%16
6.00
%16
3.19
%16
0.65
%15
8.34
%15
6.23
%15
4.28
%15
2.49
%
5722
9.52
%20
3.30
%19
4.54
%18
7.44
%18
1.54
%17
6.53
%17
2.21
%16
8.43
%16
5.10
%16
2.12
%15
9.45
%15
7.03
%15
4.83
%15
2.82
%15
0.96
%14
9.26
%
5822
2.84
%19
7.76
%18
9.39
%18
2.61
%17
6.97
%17
2.19
%16
8.07
%16
4.47
%16
1.29
%15
8.45
%15
5.91
%15
3.61
%15
1.51
%14
9.59
%14
7.83
%14
6.21
%
5921
6.41
%19
2.43
%18
4.43
%17
7.95
%17
2.57
%16
8.01
%16
4.08
%16
0.65
%15
7.62
%15
4.92
%15
2.49
%15
0.30
%14
8.31
%14
6.48
%14
4.81
%14
3.26
%
6021
0.23
%18
7.30
%17
9.66
%17
3.48
%16
8.34
%16
3.99
%16
0.24
%15
6.97
%15
4.09
%15
1.52
%14
9.21
%14
7.12
%14
5.23
%14
3.49
%14
1.90
%14
0.43
%
6120
4.30
%18
2.38
%17
5.09
%16
9.19
%16
4.29
%16
0.15
%15
6.57
%15
3.46
%15
0.71
%14
8.26
%14
6.07
%14
4.08
%14
2.28
%14
0.63
%13
9.12
%13
7.72
%
6219
8.65
%17
7.71
%17
0.74
%16
5.12
%16
0.45
%15
6.50
%15
3.09
%15
0.13
%14
7.51
%14
5.18
%14
3.10
%14
1.21
%13
9.50
%13
7.93
%13
6.49
%13
5.17
%
6319
3.28
%17
3.28
%16
6.64
%16
1.27
%15
6.83
%15
3.06
%14
9.82
%14
7.00
%14
4.51
%14
2.30
%14
0.32
%13
8.52
%13
6.90
%13
5.41
%13
4.05
%13
2.79
%
6418
8.19
%16
9.10
%16
2.77
%15
7.66
%15
3.42
%14
9.84
%14
6.76
%14
4.08
%14
1.71
%13
9.61
%13
7.73
%13
6.03
%13
4.48
%13
3.07
%13
1.78
%13
0.59
%
6518
3.35
%16
5.14
%15
9.11
%15
4.24
%15
0.21
%14
6.81
%14
3.88
%14
1.33
%13
9.09
%13
7.09
%13
5.30
%13
3.69
%13
2.23
%13
0.89
%12
9.67
%12
8.54
%
6617
8.74
%16
1.38
%15
5.64
%15
1.01
%14
7.18
%14
3.94
%14
1.16
%13
8.75
%13
6.62
%13
4.73
%13
3.03
%13
1.51
%13
0.12
%12
8.86
%12
7.70
%12
6.63
%
6717
4.34
%15
7.79
%15
2.33
%14
7.93
%14
4.29
%14
1.22
%13
8.58
%13
6.29
%13
4.28
%13
2.49
%13
0.88
%12
9.44
%12
8.13
%12
6.93
%12
5.84
%12
4.83
%
6817
0.11
%15
4.35
%14
9.15
%14
4.97
%14
1.52
%13
8.61
%13
6.11
%13
3.94
%13
2.03
%13
0.34
%12
8.82
%12
7.46
%12
6.22
%12
5.09
%12
4.06
%12
3.11
%
6916
6.04
%15
1.04
%14
6.10
%14
2.14
%13
8.86
%13
6.10
%13
3.74
%13
1.69
%12
9.88
%12
8.28
%12
6.85
%12
5.56
%12
4.39
%12
3.33
%12
2.36
%12
1.46
%
7016
2.12
%14
7.85
%14
3.16
%13
9.39
%13
6.29
%13
3.68
%13
1.44
%12
9.50
%12
7.80
%12
6.29
%12
4.94
%12
3.72
%12
2.62
%12
1.62
%12
0.70
%11
9.86
%
7115
8.36
%14
4.78
%14
0.33
%13
6.76
%13
3.82
%13
1.35
%12
9.24
%12
7.40
%12
5.79
%12
4.37
%12
3.10
%12
1.95
%12
0.92
%11
9.97
%11
9.11
%11
8.32
%
7215
4.74
%14
1.83
%13
7.61
%13
4.23
%13
1.45
%12
9.11
%12
7.12
%12
5.39
%12
3.87
%12
2.53
%12
1.33
%12
0.25
%11
9.28
%11
8.39
%11
7.58
%11
6.84
%
7315
1.32
%13
9.06
%13
5.06
%13
1.86
%12
9.23
%12
7.02
%12
5.14
%12
3.50
%12
2.07
%12
0.81
%11
9.68
%11
8.67
%11
7.76
%11
6.93
%11
6.17
%11
5.47
%
7414
8.07
%13
6.43
%13
2.64
%12
9.61
%12
7.13
%12
5.04
%12
3.27
%12
1.73
%12
0.39
%11
9.20
%11
8.14
%11
7.19
%11
6.33
%11
5.56
%11
4.84
%11
4.19
%
7514
4.97
%13
3.92
%13
0.33
%12
7.47
%12
5.13
%12
3.17
%12
1.49
%12
0.05
%11
8.79
%11
7.67
%11
6.68
%11
5.79
%11
4.99
%11
4.26
%11
3.59
%11
2.98
%
7614
2.02
%13
1.53
%12
8.14
%12
5.44
%12
3.23
%12
1.38
%11
9.81
%11
8.45
%11
7.27
%11
6.22
%11
5.29
%11
4.46
%11
3.71
%11
3.03
%11
2.41
%11
1.84
%
7713
9.20
%12
9.26
%12
6.05
%12
3.50
%12
1.42
%11
9.68
%11
8.20
%11
6.93
%11
5.82
%11
4.84
%11
3.97
%11
3.19
%11
2.49
%11
1.85
%11
1.27
%11
0.74
%
7813
6.52
%12
7.10
%12
4.07
%12
1.66
%11
9.70
%11
8.07
%11
6.68
%11
5.48
%11
4.44
%11
3.53
%11
2.71
%11
1.99
%11
1.33
%11
0.74
%11
0.20
%10
9.71
%
7913
3.99
%12
5.07
%12
2.20
%11
9.94
%11
8.09
%11
6.55
%11
5.25
%11
4.13
%11
3.16
%11
2.30
%11
1.54
%11
0.86
%11
0.25
%10
9.70
%10
9.20
%10
8.74
%
8013
1.61
%12
3.17
%12
0.47
%11
8.33
%11
6.60
%11
5.15
%11
3.93
%11
2.88
%11
1.97
%11
1.17
%11
0.46
%10
9.83
%10
9.26
%10
8.74
%10
8.28
%10
7.85
%

78
Tabl
e:A
ge:
Stan
dard
150% 2
175% 3
200% 4
225% 5
250% 6
275% 7
300% 8
325% 9
350% 10
375% 11
400% 12
425% 13
450% 14
475% 15
500% 16
8112
9.39
%12
1.40
%11
8.85
%11
6.84
%11
5.21
%11
3.85
%11
2.71
%11
1.72
%11
0.87
%11
0.12
%10
9.46
%10
8.87
%10
8.34
%10
7.86
%10
7.43
%10
7.03
%
8212
7.31
%11
9.76
%11
7.36
%11
5.47
%11
3.93
%11
2.66
%11
1.59
%11
0.67
%10
9.87
%10
9.18
%10
8.56
%10
8.01
%10
7.52
%10
7.07
%10
6.67
%10
6.30
%
8312
5.37
%11
8.23
%11
5.97
%11
4.19
%11
2.75
%11
1.56
%11
0.55
%10
9.69
%10
8.95
%10
8.30
%10
7.73
%10
7.22
%10
6.76
%10
6.34
%10
5.97
%10
5.63
%
8412
3.54
%11
6.80
%11
4.66
%11
2.99
%11
1.64
%11
0.52
%10
9.58
%10
8.78
%10
8.09
%10
7.48
%10
6.95
%10
6.47
%10
6.05
%10
5.67
%10
5.32
%10
5.00
%
8512
1.83
%11
5.46
%11
3.45
%11
1.87
%11
0.60
%10
9.56
%10
8.68
%10
7.93
%10
7.29
%10
6.72
%10
6.23
%10
5.78
%10
5.39
%10
5.03
%10
4.71
%10
4.42
%
8612
0.23
%11
4.22
%11
2.32
%11
0.84
%10
9.65
%10
8.67
%10
7.85
%10
7.15
%10
6.55
%10
6.02
%10
5.56
%10
5.15
%10
4.78
%10
4.45
%10
4.15
%10
3.88
%
8711
8.75
%11
3.08
%11
1.29
%10
9.90
%10
8.78
%10
7.86
%10
7.09
%10
6.43
%10
5.87
%10
5.38
%10
4.95
%10
4.57
%10
4.23
%10
3.92
%10
3.64
%10
3.39
%
8811
7.39
%11
2.05
%11
0.36
%10
9.04
%10
7.99
%10
7.12
%10
6.40
%10
5.79
%10
5.26
%10
4.80
%10
4.40
%10
4.05
%10
3.73
%10
3.44
%10
3.19
%10
2.95
%
8911
6.14
%11
1.11
%10
9.52
%10
8.27
%10
7.28
%10
6.46
%10
5.79
%10
5.21
%10
4.72
%10
4.29
%10
3.91
%10
3.58
%10
3.28
%10
3.02
%10
2.78
%10
2.56
%
9011
4.98
%11
0.27
%10
8.76
%10
7.59
%10
6.65
%10
5.88
%10
5.24
%10
4.70
%10
4.24
%10
3.83
%10
3.48
%10
3.17
%10
2.89
%10
2.64
%10
2.42
%10
2.22
%
9111
3.92
%10
9.52
%10
8.10
%10
6.99
%10
6.11
%10
5.38
%10
4.78
%10
4.27
%10
3.83
%10
3.45
%10
3.12
%10
2.83
%10
2.56
%10
2.33
%10
2.13
%10
1.97
%
9211
2.89
%10
8.82
%10
7.49
%10
6.44
%10
5.60
%10
4.92
%10
4.35
%10
3.87
%10
3.46
%10
3.10
%10
2.79
%10
2.51
%10
2.27
%10
2.05
%10
1.97
%10
1.00
%
9311
1.89
%10
8.16
%10
6.91
%10
5.93
%10
5.14
%10
4.49
%10
3.95
%10
3.50
%10
3.11
%10
2.78
%10
2.48
%10
2.23
%10
2.00
%10
1.97
%10
1.00
%10
1.00
%
9411
0.88
%10
7.53
%10
6.38
%10
5.45
%10
4.71
%10
4.10
%10
3.59
%10
3.16
%10
2.79
%10
2.48
%10
2.20
%10
1.97
%10
1.97
%10
1.00
%10
1.00
%10
1.00
%
9510
9.83
%10
6.91
%10
5.87
%10
5.01
%10
4.32
%10
3.74
%10
3.26
%10
2.85
%10
2.50
%10
2.20
%10
1.97
%10
1.00
%10
1.00
%10
1.00
%10
1.00
%10
1.00
%
9610
8.68
%10
6.29
%10
5.38
%10
4.61
%10
3.97
%10
3.43
%10
2.98
%10
2.59
%10
2.26
%10
1.98
%10
1.00
%10
1.00
%10
1.00
%10
1.00
%10
1.00
%10
1.00
%
9710
7.33
%10
5.55
%10
4.82
%10
4.18
%10
3.61
%10
3.13
%10
2.71
%10
2.34
%10
2.03
%10
1.97
%10
1.00
%10
1.00
%10
1.00
%10
1.00
%10
1.00
%10
1.00
%
9810
5.61
%10
4.55
%10
4.06
%10
3.61
%10
3.19
%10
2.80
%10
2.44
%10
2.11
%10
1.97
%10
1.00
%10
1.00
%10
1.00
%10
1.00
%10
1.00
%10
1.00
%10
1.00
%
9910
3.30
%10
2.95
%10
2.78
%10
2.61
%10
2.44
%10
2.26
%10
2.09
%10
1.97
%10
1.00
%10
1.00
%10
1.00
%10
1.00
%10
1.00
%10
1.00
%10
1.00
%10
1.00
%
100
101.
00%
101.
00%
101.
00%
101.
00%
101.
00%
101.
00%
101.
00%
101.
00%
101.
00%
101.
00%
101.
00%
101.
00%
101.
00%
101.
00%
101.
00%
101.
00%
101
101.
00%
101.
00%
101.
00%
101.
00%
101.
00%
101.
00%
101.
00%
101.
00%
101.
00%
101.
00%
101.
00%
101.
00%
101.
00%
101.
00%
101.
00%
101.
00%
102
101.
00%
101.
00%
101.
00%
101.
00%
101.
00%
101.
00%
101.
00%
101.
00%
101.
00%
101.
00%
101.
00%
101.
00%
101.
00%
101.
00%
101.
00%
101.
00%
103
101.
00%
101.
00%
101.
00%
101.
00%
101.
00%
101.
00%
101.
00%
101.
00%
101.
00%
101.
00%
101.
00%
101.
00%
101.
00%
101.
00%
101.
00%
101.
00%
104
101.
00%
101.
00%
101.
00%
101.
00%
101.
00%
101.
00%
101.
00%
101.
00%
101.
00%
101.
00%
101.
00%
101.
00%
101.
00%
101.
00%
101.
00%
101.
00%
105
101.
00%
101.
00%
101.
00%
101.
00%
101.
00%
101.
00%
101.
00%
101.
00%
101.
00%
101.
00%
101.
00%
101.
00%
101.
00%
101.
00%
101.
00%
101.
00%
106
101.
00%
101.
00%
101.
00%
101.
00%
101.
00%
101.
00%
101.
00%
101.
00%
101.
00%
101.
00%
101.
00%
101.
00%
101.
00%
101.
00%
101.
00%
101.
00%
107
101.
00%
101.
00%
101.
00%
101.
00%
101.
00%
101.
00%
101.
00%
101.
00%
101.
00%
101.
00%
101.
00%
101.
00%
101.
00%
101.
00%
101.
00%
101.
00%
108
101.
00%
101.
00%
101.
00%
101.
00%
101.
00%
101.
00%
101.
00%
101.
00%
101.
00%
101.
00%
101.
00%
101.
00%
101.
00%
101.
00%
101.
00%
101.
00%
109
101.
00%
101.
00%
101.
00%
101.
00%
101.
00%
101.
00%
101.
00%
101.
00%
101.
00%
101.
00%
101.
00%
101.
00%
101.
00%
101.
00%
101.
00%
101.
00%
110
101.
00%
101.
00%
101.
00%
101.
00%
101.
00%
101.
00%
101.
00%
101.
00%
101.
00%
101.
00%
101.
00%
101.
00%
101.
00%
101.
00%
101.
00%
101.
00%
111
101.
00%
101.
00%
101.
00%
101.
00%
101.
00%
101.
00%
101.
00%
101.
00%
101.
00%
101.
00%
101.
00%
101.
00%
101.
00%
101.
00%
101.
00%
101.
00%
112
101.
00%
101.
00%
101.
00%
101.
00%
101.
00%
101.
00%
101.
00%
101.
00%
101.
00%
101.
00%
101.
00%
101.
00%
101.
00%
101.
00%
101.
00%
101.
00%
113
101.
00%
101.
00%
101.
00%
101.
00%
101.
00%
101.
00%
101.
00%
101.
00%
101.
00%
101.
00%
101.
00%
101.
00%
101.
00%
101.
00%
101.
00%
101.
00%
114
101.
00%
101.
00%
101.
00%
101.
00%
101.
00%
101.
00%
101.
00%
101.
00%
101.
00%
101.
00%
101.
00%
101.
00%
101.
00%
101.
00%
101.
00%
101.
00%
115
101.
00%
101.
00%
101.
00%
101.
00%
101.
00%
101.
00%
101.
00%
101.
00%
101.
00%
101.
00%
101.
00%
101.
00%
101.
00%
101.
00%
101.
00%
101.
00%
116
101.
00%
101.
00%
101.
00%
101.
00%
101.
00%
101.
00%
101.
00%
101.
00%
101.
00%
101.
00%
101.
00%
101.
00%
101.
00%
101.
00%
101.
00%
101.
00%
117
101.
00%
101.
00%
101.
00%
101.
00%
101.
00%
101.
00%
101.
00%
101.
00%
101.
00%
101.
00%
101.
00%
101.
00%
101.
00%
101.
00%
101.
00%
101.
00%
118
101.
00%
101.
00%
101.
00%
101.
00%
101.
00%
101.
00%
101.
00%
101.
00%
101.
00%
101.
00%
101.
00%
101.
00%
101.
00%
101.
00%
101.
00%
101.
00%
119
101.
00%
101.
00%
101.
00%
101.
00%
101.
00%
101.
00%
101.
00%
101.
00%
101.
00%
101.
00%
101.
00%
101.
00%
101.
00%
101.
00%
101.
00%
101.
00%
120
101.
00%
101.
00%
101.
00%
101.
00%
101.
00%
101.
00%
101.
00%
101.
00%
101.
00%
101.
00%
101.
00%
101.
00%
101.
00%
101.
00%
101.
00%
101.
00%

79
Cas
h Va
lue
Acc
umul
atio
n Te
st (p
erce
ntag
e of
Pol
icy
Valu
e) –
Fem
ale
Tabl
e:A
geSt
anda
rd15
0% 217
5% 320
0% 422
5% 525
0% 627
5% 730
0% 832
5% 935
0% 1037
5% 1140
0% 1242
5% 1345
0% 1447
5% 1550
0% 16
018
71.1
8%15
50.5
8%14
42.0
6%13
53.7
1%12
79.9
3%12
17.1
0%11
62.7
4%11
15.1
0%10
72.8
9%10
35.1
4%10
01.1
3%97
0.28
%94
2.11
%91
6.27
%89
2.44
%87
0.39
%
118
14.3
3%15
06.3
6%14
02.0
9%13
17.1
8%12
46.2
6%11
85.8
7%11
33.6
1%10
87.7
9%10
47.2
0%10
10.9
0%97
8.18
%94
8.49
%92
1.39
%89
6.52
%87
3.59
%85
2.36
%
217
54.8
6%14
58.9
8%13
58.7
8%12
77.1
8%12
09.0
2%11
50.9
7%11
00.7
3%10
56.6
9%10
17.6
6%98
2.76
%95
1.30
%92
2.75
%89
6.69
%87
2.77
%85
0.71
%83
0.29
%
316
94.5
1%14
10.1
8%13
13.8
9%12
35.4
6%11
69.9
6%11
14.1
6%10
65.8
7%10
23.5
3%98
6.01
%95
2.46
%92
2.21
%89
4.76
%86
9.70
%84
6.70
%82
5.49
%80
5.85
%
416
34.4
4%13
61.1
9%12
68.6
4%11
93.2
5%11
30.2
9%10
76.6
5%10
30.2
3%98
9.53
%95
3.46
%92
1.21
%89
2.13
%86
5.73
%84
1.64
%81
9.52
%79
9.13
%78
0.25
%
515
76.0
8%13
13.4
6%12
24.5
0%11
52.0
5%10
91.5
2%10
39.9
7%99
5.34
%95
6.22
%92
1.55
%89
0.54
%86
2.58
%83
7.21
%81
4.04
%79
2.78
%77
3.17
%75
5.01
%
615
19.4
2%12
67.0
0%11
81.5
0%11
11.8
6%10
53.6
8%10
04.1
2%96
1.23
%92
3.62
%89
0.29
%86
0.48
%83
3.60
%80
9.21
%78
6.94
%76
6.49
%74
7.64
%73
0.19
%
714
64.6
4%12
22.0
4%11
39.8
6%10
72.9
2%10
17.0
0%96
9.37
%92
8.13
%89
1.98
%85
9.94
%83
1.28
%80
5.44
%78
1.99
%76
0.58
%74
0.93
%72
2.80
%70
6.02
%
814
12.2
8%11
79.1
2%11
00.1
4%10
35.8
0%98
2.05
%93
6.27
%89
6.63
%86
1.89
%83
1.09
%80
3.54
%77
8.70
%75
6.16
%73
5.57
%71
6.68
%69
9.25
%68
3.12
%
913
61.6
3%11
37.5
6%10
61.6
5%99
9.81
%94
8.15
%90
4.14
%86
6.05
%83
2.65
%80
3.04
%77
6.56
%75
2.69
%73
1.02
%71
1.23
%69
3.07
%67
6.32
%66
0.80
%
1013
12.6
7%10
97.3
2%10
24.3
6%96
4.92
%91
5.27
%87
2.97
%83
6.36
%80
4.26
%77
5.80
%75
0.34
%72
7.40
%70
6.56
%68
7.54
%67
0.08
%65
3.98
%63
9.07
%
1112
65.4
9%10
58.5
2%98
8.40
%93
1.28
%88
3.56
%84
2.90
%80
7.71
%77
6.86
%74
9.50
%72
5.04
%70
2.98
%68
2.96
%66
4.67
%64
7.89
%63
2.41
%61
8.07
%
1212
20.0
2%10
21.1
2%95
3.73
%89
8.83
%85
2.96
%81
3.89
%78
0.06
%75
0.41
%72
4.12
%70
0.60
%67
9.40
%66
0.15
%64
2.58
%62
6.44
%61
1.56
%59
7.78
%
1311
76.5
8%98
5.44
%92
0.68
%86
7.92
%82
3.84
%78
6.29
%75
3.79
%72
5.28
%70
0.02
%67
7.41
%65
7.04
%63
8.54
%62
1.65
%60
6.14
%59
1.84
%57
8.60
%
1411
34.9
1%95
1.25
%88
9.02
%83
8.32
%79
5.96
%75
9.88
%72
8.64
%70
1.25
%67
6.97
%65
5.25
%63
5.66
%61
7.89
%60
1.65
%58
6.75
%57
3.01
%56
0.28
%
1510
94.9
2%91
8.45
%85
8.65
%80
9.94
%76
9.24
%73
4.56
%70
4.55
%67
8.23
%65
4.90
%63
4.02
%61
5.20
%59
8.12
%58
2.52
%56
8.20
%55
4.99
%54
2.76
%
1610
56.4
1%88
6.86
%82
9.40
%78
2.59
%74
3.49
%71
0.17
%68
1.33
%65
6.04
%63
3.62
%61
3.56
%59
5.48
%57
9.07
%56
4.08
%55
0.32
%53
7.62
%52
5.87
%
1710
19.5
0%85
6.61
%80
1.41
%75
6.43
%71
8.86
%68
6.85
%65
9.14
%63
4.85
%61
3.31
%59
4.04
%57
6.67
%56
0.90
%54
6.49
%53
3.27
%52
1.08
%50
9.78
%
1898
3.92
%82
7.43
%77
4.40
%73
1.19
%69
5.10
%66
4.35
%63
7.73
%61
4.38
%59
3.69
%57
5.18
%55
8.49
%54
3.34
%52
9.50
%51
6.80
%50
5.09
%49
4.24
%
1994
9.61
%79
9.27
%74
8.33
%70
6.82
%67
2.15
%64
2.61
%61
7.04
%59
4.61
%57
4.73
%55
6.95
%54
0.92
%52
6.37
%51
3.08
%50
0.87
%48
9.62
%47
9.20
%
2091
6.60
%77
2.18
%72
3.24
%68
3.37
%65
0.06
%62
1.69
%59
7.12
%57
5.59
%55
6.49
%53
9.41
%52
4.01
%51
0.03
%49
7.27
%48
5.55
%47
4.74
%46
4.73
%
2188
4.67
%74
5.94
%69
8.93
%66
0.63
%62
8.64
%60
1.38
%57
7.79
%55
7.10
%53
8.76
%52
2.36
%50
7.57
%49
4.14
%48
1.88
%47
0.63
%46
0.25
%45
0.63
%
2285
3.79
%72
0.53
%67
5.37
%63
8.58
%60
7.85
%58
1.67
%55
9.01
%53
9.14
%52
1.53
%50
5.78
%49
1.57
%47
8.68
%46
6.90
%45
6.10
%44
6.13
%43
6.89
%
2382
3.99
%69
5.98
%65
2.61
%61
7.27
%58
7.76
%56
2.61
%54
0.85
%52
1.77
%50
4.85
%48
9.72
%47
6.08
%46
3.70
%45
2.39
%44
2.01
%43
2.44
%42
3.58
%
2479
5.11
%67
2.15
%63
0.49
%59
6.55
%56
8.20
%54
4.05
%52
3.15
%50
4.82
%48
8.58
%47
4.05
%46
0.95
%44
9.06
%43
8.20
%42
8.23
%41
9.04
%41
0.53
%
2576
7.25
%64
9.13
%60
9.11
%57
6.52
%54
9.29
%52
6.10
%50
6.02
%48
8.42
%47
2.82
%45
8.87
%44
6.29
%43
4.87
%42
4.45
%41
4.88
%40
6.05
%39
7.88
%
2674
0.35
%62
6.89
%58
8.46
%55
7.15
%53
1.00
%50
8.72
%48
9.44
%47
2.54
%45
7.56
%44
4.16
%43
2.08
%42
1.12
%41
1.11
%40
1.92
%39
3.45
%38
5.61
%
2771
4.38
%60
5.40
%56
8.48
%53
8.41
%51
3.30
%49
1.91
%47
3.39
%45
7.16
%44
2.78
%42
9.91
%41
8.32
%40
7.79
%39
8.18
%38
9.36
%38
1.23
%37
3.69
%
2868
9.39
%58
4.72
%54
9.26
%52
0.38
%49
6.26
%47
5.72
%45
7.94
%44
2.36
%42
8.55
%41
6.19
%40
5.06
%39
4.96
%38
5.73
%37
7.26
%36
9.45
%36
2.23
%
2966
5.29
%56
4.76
%53
0.70
%50
2.97
%47
9.81
%46
0.08
%44
3.01
%42
8.05
%41
4.79
%40
2.93
%39
2.24
%38
2.54
%37
3.69
%36
5.56
%35
8.06
%35
1.13
%
3064
2.04
%54
5.49
%51
2.78
%48
6.15
%46
3.91
%44
4.97
%42
8.58
%41
4.21
%40
1.48
%39
0.10
%37
9.84
%37
0.53
%36
2.03
%35
4.23
%34
7.03
%34
0.37
%
3161
9.58
%52
6.85
%49
5.44
%46
9.86
%44
8.51
%43
0.32
%41
4.58
%40
0.79
%38
8.57
%37
7.64
%36
7.79
%35
8.85
%35
0.69
%34
3.21
%33
6.30
%32
9.91
%
3259
7.97
%50
8.91
%47
8.75
%45
4.19
%43
3.68
%41
6.22
%40
1.11
%38
7.87
%37
6.14
%36
5.65
%35
6.19
%34
7.62
%33
9.79
%33
2.60
%32
5.98
%31
9.84
%
3357
7.13
%49
1.61
%46
2.64
%43
9.06
%41
9.37
%40
2.60
%38
8.10
%37
5.39
%36
4.13
%35
4.06
%34
4.98
%33
6.75
%32
9.24
%32
2.34
%31
5.99
%31
0.10
%
3455
7.07
%47
4.93
%44
7.12
%42
4.48
%40
5.57
%38
9.48
%37
5.55
%36
3.35
%35
2.54
%34
2.88
%33
4.17
%32
6.27
%31
9.06
%31
2.45
%30
6.35
%30
0.70
%
3553
7.75
%45
8.88
%43
2.18
%41
0.44
%39
2.29
%37
6.84
%36
3.48
%35
1.76
%34
1.39
%33
2.12
%32
3.76
%31
6.18
%30
9.26
%30
2.91
%29
7.06
%29
1.65
%
3651
9.22
%44
3.50
%41
7.86
%39
6.99
%37
9.57
%36
4.74
%35
1.91
%34
0.67
%33
0.72
%32
1.82
%31
3.80
%30
6.53
%29
9.89
%29
3.80
%28
8.19
%28
3.00
%
3750
1.37
%42
8.66
%40
4.05
%38
4.01
%36
7.29
%35
3.06
%34
0.75
%32
9.96
%32
0.41
%31
1.87
%30
4.18
%29
7.20
%29
0.84
%28
5.00
%27
9.62
%27
4.64
%
3848
4.19
%41
4.39
%39
0.76
%37
1.53
%35
5.48
%34
1.82
%33
0.01
%31
9.66
%31
0.49
%30
2.30
%29
4.93
%28
8.23
%28
2.13
%27
6.53
%27
1.37
%26
6.59
%
3946
7.62
%40
0.61
%37
7.93
%35
9.47
%34
4.06
%33
0.96
%31
9.62
%30
9.69
%30
0.90
%29
3.04
%28
5.97
%27
9.55
%27
3.69
%26
8.32
%26
3.38
%25
8.80
%
4045
1.63
%38
7.30
%36
5.52
%34
7.81
%33
3.03
%32
0.45
%30
9.57
%30
0.05
%29
1.61
%28
4.07
%27
7.29
%27
1.13
%26
5.52
%26
0.37
%25
5.62
%25
1.23
%

80
Tabl
e:A
geSt
anda
rd15
0% 217
5% 320
0% 422
5% 525
0% 627
5% 730
0% 832
5% 935
0% 1037
5% 1140
0% 1242
5% 1345
0% 1447
5% 1550
0% 16
4143
6.21
%37
4.45
%35
3.55
%33
6.55
%32
2.36
%31
0.29
%29
9.85
%29
0.72
%28
2.63
%27
5.40
%26
8.89
%26
2.98
%25
7.60
%25
2.66
%24
8.12
%24
3.91
%
4242
1.34
%36
2.05
%34
1.99
%32
5.67
%31
2.06
%30
0.48
%29
0.47
%28
1.70
%27
3.94
%26
7.01
%26
0.77
%25
5.10
%24
9.94
%24
5.21
%24
0.85
%23
6.82
%
4340
7.02
%35
0.11
%33
0.86
%31
5.20
%30
2.14
%29
1.03
%28
1.42
%27
3.01
%26
5.57
%25
8.92
%25
2.93
%24
7.51
%24
2.56
%23
8.02
%23
3.84
%22
9.98
%
4439
3.24
%33
8.62
%32
0.14
%30
5.11
%29
2.58
%28
1.92
%27
2.71
%26
4.64
%25
7.50
%25
1.13
%24
5.38
%24
0.18
%23
5.44
%23
1.09
%22
7.08
%22
3.38
%
4537
9.99
%32
7.56
%30
9.83
%29
5.41
%28
3.39
%27
3.16
%26
4.32
%25
6.59
%24
9.74
%24
3.62
%23
8.12
%23
3.13
%22
8.58
%22
4.42
%22
0.58
%21
7.03
%
4636
7.25
%31
6.93
%29
9.92
%28
6.09
%27
4.55
%26
4.74
%25
6.26
%24
8.85
%24
2.28
%23
6.42
%23
1.14
%22
6.36
%22
2.00
%21
8.01
%21
4.33
%21
0.93
%
4735
5.02
%30
6.74
%29
0.41
%27
7.14
%26
6.08
%25
6.67
%24
8.54
%24
1.43
%23
5.13
%22
9.51
%22
4.45
%21
9.87
%21
5.69
%21
1.87
%20
8.34
%20
5.08
%
4834
3.31
%29
6.98
%28
1.32
%26
8.59
%25
7.97
%24
8.95
%24
1.16
%23
4.34
%22
8.30
%22
2.92
%21
8.07
%21
3.68
%20
9.68
%20
6.01
%20
2.63
%19
9.51
%
4933
2.07
%28
7.63
%27
2.60
%26
0.39
%25
0.22
%24
1.57
%23
4.09
%22
7.56
%22
1.77
%21
6.61
%21
1.97
%20
7.76
%20
3.92
%20
0.41
%19
7.18
%19
4.19
%
5032
1.32
%27
8.69
%26
4.28
%25
2.57
%24
2.82
%23
4.52
%22
7.36
%22
1.09
%21
5.55
%21
0.61
%20
6.16
%20
2.13
%19
8.45
%19
5.09
%19
1.99
%18
9.13
%
5131
1.03
%27
0.14
%25
6.33
%24
5.10
%23
5.75
%22
7.80
%22
0.94
%21
4.93
%20
9.62
%20
4.88
%20
0.62
%19
6.76
%19
3.25
%19
0.02
%18
7.06
%18
4.32
%
5230
1.18
%26
1.97
%24
8.73
%23
7.97
%22
9.00
%22
1.39
%21
4.81
%20
9.06
%20
3.97
%19
9.44
%19
5.35
%19
1.66
%18
8.29
%18
5.21
%18
2.37
%17
9.75
%
5329
1.76
%25
4.18
%24
1.48
%23
1.17
%22
2.58
%21
5.28
%20
8.98
%20
3.48
%19
8.61
%19
4.26
%19
0.35
%18
6.82
%18
3.59
%18
0.64
%17
7.93
%17
5.42
%
5428
2.76
%24
6.74
%23
4.57
%22
4.69
%21
6.46
%20
9.47
%20
3.44
%19
8.17
%19
3.50
%18
9.35
%18
5.61
%18
2.22
%17
9.14
%17
6.31
%17
3.72
%17
1.32
%
5527
4.15
%23
9.63
%22
7.97
%21
8.51
%21
0.63
%20
3.93
%19
8.16
%19
3.11
%18
8.65
%18
4.67
%18
1.09
%17
7.85
%17
4.90
%17
2.20
%16
9.72
%16
7.43
%
5626
5.90
%23
2.83
%22
1.67
%21
2.61
%20
5.06
%19
8.66
%19
3.13
%18
8.30
%18
4.03
%18
0.22
%17
6.80
%17
3.70
%17
0.89
%16
8.30
%16
5.93
%16
3.74
%
5725
8.03
%22
6.35
%21
5.66
%20
6.99
%19
9.77
%19
3.64
%18
8.35
%18
3.73
%17
9.65
%17
6.01
%17
2.74
%16
9.78
%16
7.08
%16
4.61
%16
2.35
%16
0.25
%
5825
0.49
%22
0.16
%20
9.93
%20
1.63
%19
4.72
%18
8.86
%18
3.80
%17
9.38
%17
5.48
%17
2.00
%16
8.88
%16
6.05
%16
3.47
%16
1.12
%15
8.95
%15
6.95
%
5924
3.28
%21
4.25
%20
4.46
%19
6.52
%18
9.91
%18
4.31
%17
9.48
%17
5.25
%17
1.53
%16
8.20
%16
5.22
%16
2.52
%16
0.06
%15
7.81
%15
5.74
%15
3.84
%
6023
6.36
%20
8.59
%19
9.22
%19
1.63
%18
5.31
%17
9.96
%17
5.34
%17
1.30
%16
7.74
%16
4.57
%16
1.72
%15
9.14
%15
6.80
%15
4.65
%15
2.68
%15
0.86
%
6122
9.72
%20
3.15
%19
4.19
%18
6.93
%18
0.90
%17
5.78
%17
1.37
%16
7.52
%16
4.12
%16
1.09
%15
8.38
%15
5.92
%15
3.68
%15
1.64
%14
9.76
%14
8.02
%
6222
3.33
%19
7.92
%18
9.37
%18
2.43
%17
6.66
%17
1.78
%16
7.57
%16
3.89
%16
0.65
%15
7.76
%15
5.17
%15
2.83
%15
0.70
%14
8.75
%14
6.96
%14
5.31
%
6321
7.19
%19
2.91
%18
4.73
%17
8.10
%17
2.60
%16
7.93
%16
3.92
%16
0.41
%15
7.32
%15
4.57
%15
2.10
%14
9.87
%14
7.84
%14
5.98
%14
4.28
%14
2.70
%
6421
1.28
%18
8.08
%18
0.27
%17
3.94
%16
8.69
%16
4.24
%16
0.41
%15
7.07
%15
4.12
%15
1.50
%14
9.15
%14
7.02
%14
5.09
%14
3.32
%14
1.70
%14
0.21
%
6520
5.60
%18
3.43
%17
5.97
%16
9.94
%16
4.93
%16
0.69
%15
7.04
%15
3.85
%15
1.05
%14
8.55
%14
6.31
%14
4.29
%14
2.45
%14
0.77
%13
9.23
%13
7.81
%
6620
0.13
%17
8.96
%17
1.85
%16
6.09
%16
1.31
%15
7.27
%15
3.79
%15
0.76
%14
8.09
%14
5.72
%14
3.59
%14
1.66
%13
9.92
%13
8.32
%13
6.86
%13
5.51
%
6719
4.87
%17
4.67
%16
7.88
%16
2.39
%15
7.84
%15
3.99
%15
0.68
%14
7.79
%14
5.25
%14
2.99
%14
0.97
%13
9.14
%13
7.48
%13
5.97
%13
4.58
%13
3.30
%
6818
9.81
%17
0.53
%16
4.06
%15
8.83
%15
4.50
%15
0.83
%14
7.68
%14
4.94
%14
2.53
%14
0.38
%13
8.46
%13
6.72
%13
5.15
%13
3.71
%13
2.39
%13
1.18
%
6918
4.95
%16
6.57
%16
0.40
%15
5.41
%15
1.29
%14
7.80
%14
4.81
%14
2.20
%13
9.91
%13
7.87
%13
6.05
%13
4.40
%13
2.91
%13
1.55
%13
0.30
%12
9.15
%
7018
0.27
%16
2.75
%15
6.88
%15
2.13
%14
8.21
%14
4.89
%14
2.05
%13
9.57
%13
7.40
%13
5.47
%13
3.74
%13
2.18
%13
0.76
%12
9.47
%12
8.29
%12
7.20
%
7117
5.79
%15
9.10
%15
3.50
%14
8.99
%14
5.26
%14
2.11
%13
9.41
%13
7.06
%13
5.00
%13
3.16
%13
1.52
%13
0.05
%12
8.71
%12
7.49
%12
6.37
%12
5.34
%
7217
1.49
%15
5.60
%15
0.28
%14
5.99
%14
2.44
%13
9.45
%13
6.89
%13
4.66
%13
2.71
%13
0.97
%12
9.42
%12
8.02
%12
6.76
%12
5.60
%12
4.55
%12
3.57
%
7316
7.38
%15
2.26
%14
7.20
%14
3.12
%13
9.75
%13
6.92
%13
4.49
%13
2.38
%13
0.53
%12
8.89
%12
7.42
%12
6.10
%12
4.90
%12
3.81
%12
2.82
%12
1.90
%
7416
3.44
%14
9.06
%14
4.25
%14
0.38
%13
7.19
%13
4.50
%13
2.20
%13
0.21
%12
8.45
%12
6.90
%12
5.52
%12
4.27
%12
3.14
%12
2.11
%12
1.17
%12
0.31
%
7515
9.67
%14
6.01
%14
1.45
%13
7.77
%13
4.75
%13
2.20
%13
0.02
%12
8.14
%12
6.48
%12
5.02
%12
3.71
%12
2.53
%12
1.47
%12
0.50
%11
9.62
%11
8.80
%
7615
6.07
%14
3.09
%13
8.76
%13
5.28
%13
2.41
%13
0.00
%12
7.95
%12
6.16
%12
4.60
%12
3.22
%12
1.99
%12
0.88
%11
9.88
%11
8.97
%11
8.14
%11
7.37
%
7715
2.61
%14
0.31
%13
6.20
%13
2.90
%13
0.19
%12
7.91
%12
5.97
%12
4.28
%12
2.81
%12
1.51
%12
0.35
%11
9.31
%11
8.37
%11
7.51
%11
6.73
%11
6.02
%
7814
9.31
%13
7.64
%13
3.75
%13
0.63
%12
8.06
%12
5.91
%12
4.07
%12
2.49
%12
1.10
%11
9.88
%11
8.79
%11
7.81
%11
6.93
%11
6.13
%11
5.39
%11
4.72
%
7914
6.14
%13
5.09
%13
1.40
%12
8.45
%12
6.03
%12
4.00
%12
2.27
%12
0.77
%11
9.47
%11
8.32
%11
7.30
%11
6.38
%11
5.55
%11
4.80
%11
4.11
%11
3.49
%
8014
3.10
%13
2.65
%12
9.16
%12
6.37
%12
4.08
%12
2.16
%12
0.53
%11
9.13
%11
7.90
%11
6.82
%11
5.86
%11
5.00
%11
4.23
%11
3.52
%11
2.88
%11
2.30
%

81
Tabl
e:A
geSt
anda
rd15
0% 217
5% 320
0% 422
5% 525
0% 627
5% 730
0% 832
5% 935
0% 1037
5% 1140
0% 1242
5% 1345
0% 1447
5% 1550
0% 16
8114
0.19
%13
0.30
%12
7.01
%12
4.37
%12
2.21
%12
0.40
%11
8.86
%11
7.54
%11
6.39
%11
5.37
%11
4.47
%11
3.67
%11
2.94
%11
2.28
%11
1.68
%11
1.14
%
8213
7.46
%12
8.12
%12
5.01
%12
2.52
%12
0.47
%11
8.77
%11
7.33
%11
6.08
%11
5.00
%11
4.05
%11
3.20
%11
2.45
%11
1.77
%11
1.15
%11
0.59
%11
0.08
%
8313
4.91
%12
6.10
%12
3.16
%12
0.81
%11
8.88
%11
7.28
%11
5.92
%11
4.75
%11
3.73
%11
2.84
%11
2.05
%11
1.34
%11
0.71
%11
0.13
%10
9.61
%10
9.13
%
8413
2.49
%12
4.20
%12
1.43
%11
9.21
%11
7.40
%11
5.89
%11
4.61
%11
3.51
%11
2.56
%11
1.72
%11
0.98
%11
0.32
%10
9.72
%10
9.19
%10
8.70
%10
8.26
%
8513
0.20
%12
2.42
%11
9.80
%11
7.72
%11
6.01
%11
4.59
%11
3.39
%11
2.36
%11
1.46
%11
0.68
%10
9.99
%10
9.37
%10
8.82
%10
8.32
%10
7.86
%10
7.45
%
8612
8.04
%12
0.75
%11
8.30
%11
6.33
%11
4.73
%11
3.39
%11
2.26
%11
1.30
%11
0.46
%10
9.73
%10
9.08
%10
8.50
%10
7.98
%10
7.52
%10
7.10
%10
6.71
%
8712
5.96
%11
9.14
%11
6.83
%11
4.99
%11
3.48
%11
2.22
%11
1.16
%11
0.25
%10
9.46
%10
8.78
%10
8.17
%10
7.63
%10
7.14
%10
6.71
%10
6.31
%10
5.96
%
8812
4.03
%11
7.68
%11
5.52
%11
3.79
%11
2.37
%11
1.19
%11
0.19
%10
9.33
%10
8.59
%10
7.95
%10
7.37
%10
6.87
%10
6.41
%10
6.00
%10
5.63
%10
5.30
%
8912
2.23
%11
6.36
%11
4.34
%11
2.72
%11
1.39
%11
0.28
%10
9.34
%10
8.54
%10
7.84
%10
7.23
%10
6.69
%10
6.21
%10
5.79
%10
5.40
%10
5.05
%10
4.74
%
9012
0.55
%11
5.16
%11
3.29
%11
1.78
%11
0.54
%10
9.50
%10
8.63
%10
7.87
%10
7.22
%10
6.65
%10
6.15
%10
5.70
%10
5.29
%10
4.93
%10
4.60
%10
4.30
%
9111
8.92
%11
4.03
%11
2.32
%11
0.92
%10
9.77
%10
8.82
%10
8.00
%10
7.31
%10
6.70
%10
6.17
%10
5.71
%10
5.29
%10
4.92
%10
4.58
%10
4.28
%10
4.00
%
9211
7.17
%11
2.78
%11
1.22
%10
9.94
%10
8.88
%10
7.99
%10
7.25
%10
6.60
%10
6.05
%10
5.56
%10
5.13
%10
4.75
%10
4.41
%10
4.10
%10
3.82
%10
3.57
%
9311
5.39
%11
1.50
%11
0.08
%10
8.91
%10
7.94
%10
7.13
%10
6.44
%10
5.85
%10
5.34
%10
4.89
%10
4.50
%10
4.15
%10
3.84
%10
3.56
%10
3.31
%10
3.07
%
9411
3.63
%11
0.24
%10
8.97
%10
7.92
%10
7.04
%10
6.29
%10
5.66
%10
5.11
%10
4.64
%10
4.24
%10
3.88
%10
3.56
%10
3.27
%10
3.02
%10
2.79
%10
2.58
%
9511
1.88
%10
9.03
%10
7.93
%10
6.99
%10
6.20
%10
5.52
%10
4.93
%10
4.43
%10
4.00
%10
3.62
%10
3.28
%10
2.99
%10
2.73
%10
2.50
%10
2.29
%10
2.10
%
9611
0.15
%10
7.90
%10
6.98
%10
6.18
%10
5.49
%10
4.88
%10
4.35
%10
3.88
%10
3.48
%10
3.13
%10
2.81
%10
2.54
%10
2.30
%10
2.09
%10
1.97
%10
1.97
%
9710
8.30
%10
6.71
%10
6.02
%10
5.40
%10
4.83
%10
4.32
%10
3.85
%10
3.44
%10
3.06
%10
2.73
%10
2.43
%10
2.16
%10
1.97
%10
1.97
%10
1.00
%10
1.00
%
9810
6.19
%10
5.33
%10
4.93
%10
4.54
%10
4.18
%10
3.83
%10
3.50
%10
3.18
%10
2.89
%10
2.61
%10
2.34
%10
2.10
%10
1.00
%10
1.00
%10
1.00
%10
1.00
%
9910
3.48
%10
3.22
%10
3.09
%10
2.96
%10
2.83
%10
2.70
%10
2.57
%10
2.44
%10
2.31
%10
2.19
%10
2.06
%10
1.97
%10
1.00
%10
1.00
%10
1.00
%10
1.00
%
100
101.
00%
101.
00%
101.
00%
101.
00%
101.
00%
101.
00%
101.
00%
101.
00%
101.
00%
101.
00%
101.
00%
101.
00%
101.
00%
101.
00%
101.
00%
101.
00%
101
101.
00%
101.
00%
101.
00%
101.
00%
101.
00%
101.
00%
101.
00%
101.
00%
101.
00%
101.
00%
101.
00%
101.
00%
101.
00%
101.
00%
101.
00%
101.
00%
102
101.
00%
101.
00%
101.
00%
101.
00%
101.
00%
101.
00%
101.
00%
101.
00%
101.
00%
101.
00%
101.
00%
101.
00%
101.
00%
101.
00%
101.
00%
101.
00%
103
101.
00%
101.
00%
101.
00%
101.
00%
101.
00%
101.
00%
101.
00%
101.
00%
101.
00%
101.
00%
101.
00%
101.
00%
101.
00%
101.
00%
101.
00%
101.
00%
104
101.
00%
101.
00%
101.
00%
101.
00%
101.
00%
101.
00%
101.
00%
101.
00%
101.
00%
101.
00%
101.
00%
101.
00%
101.
00%
101.
00%
101.
00%
101.
00%
105
101.
00%
101.
00%
101.
00%
101.
00%
101.
00%
101.
00%
101.
00%
101.
00%
101.
00%
101.
00%
101.
00%
101.
00%
101.
00%
101.
00%
101.
00%
101.
00%
106
101.
00%
101.
00%
101.
00%
101.
00%
101.
00%
101.
00%
101.
00%
101.
00%
101.
00%
101.
00%
101.
00%
101.
00%
101.
00%
101.
00%
101.
00%
101.
00%
107
101.
00%
101.
00%
101.
00%
101.
00%
101.
00%
101.
00%
101.
00%
101.
00%
101.
00%
101.
00%
101.
00%
101.
00%
101.
00%
101.
00%
101.
00%
101.
00%
108
101.
00%
101.
00%
101.
00%
101.
00%
101.
00%
101.
00%
101.
00%
101.
00%
101.
00%
101.
00%
101.
00%
101.
00%
101.
00%
101.
00%
101.
00%
101.
00%
109
101.
00%
101.
00%
101.
00%
101.
00%
101.
00%
101.
00%
101.
00%
101.
00%
101.
00%
101.
00%
101.
00%
101.
00%
101.
00%
101.
00%
101.
00%
101.
00%
110
101.
00%
101.
00%
101.
00%
101.
00%
101.
00%
101.
00%
101.
00%
101.
00%
101.
00%
101.
00%
101.
00%
101.
00%
101.
00%
101.
00%
101.
00%
101.
00%
111
101.
00%
101.
00%
101.
00%
101.
00%
101.
00%
101.
00%
101.
00%
101.
00%
101.
00%
101.
00%
101.
00%
101.
00%
101.
00%
101.
00%
101.
00%
101.
00%
112
101.
00%
101.
00%
101.
00%
101.
00%
101.
00%
101.
00%
101.
00%
101.
00%
101.
00%
101.
00%
101.
00%
101.
00%
101.
00%
101.
00%
101.
00%
101.
00%
113
101.
00%
101.
00%
101.
00%
101.
00%
101.
00%
101.
00%
101.
00%
101.
00%
101.
00%
101.
00%
101.
00%
101.
00%
101.
00%
101.
00%
101.
00%
101.
00%
114
101.
00%
101.
00%
101.
00%
101.
00%
101.
00%
101.
00%
101.
00%
101.
00%
101.
00%
101.
00%
101.
00%
101.
00%
101.
00%
101.
00%
101.
00%
101.
00%
115
101.
00%
101.
00%
101.
00%
101.
00%
101.
00%
101.
00%
101.
00%
101.
00%
101.
00%
101.
00%
101.
00%
101.
00%
101.
00%
101.
00%
101.
00%
101.
00%
116
101.
00%
101.
00%
101.
00%
101.
00%
101.
00%
101.
00%
101.
00%
101.
00%
101.
00%
101.
00%
101.
00%
101.
00%
101.
00%
101.
00%
101.
00%
101.
00%
117
101.
00%
101.
00%
101.
00%
101.
00%
101.
00%
101.
00%
101.
00%
101.
00%
101.
00%
101.
00%
101.
00%
101.
00%
101.
00%
101.
00%
101.
00%
101.
00%
118
101.
00%
101.
00%
101.
00%
101.
00%
101.
00%
101.
00%
101.
00%
101.
00%
101.
00%
101.
00%
101.
00%
101.
00%
101.
00%
101.
00%
101.
00%
101.
00%
119
101.
00%
101.
00%
101.
00%
101.
00%
101.
00%
101.
00%
101.
00%
101.
00%
101.
00%
101.
00%
101.
00%
101.
00%
101.
00%
101.
00%
101.
00%
101.
00%
120
101.
00%
101.
00%
101.
00%
101.
00%
101.
00%
101.
00%
101.
00%
101.
00%
101.
00%
101.
00%
101.
00%
101.
00%
101.
00%
101.
00%
101.
00%
101.
00%

82
Cas
h Va
lue
Acc
umul
atio
n Te
st (p
erce
ntag
e of
Pol
icy
Valu
e) –
Uni
sex
Tabl
e:A
ge:
Stan
dard
150% 2
175% 3
200% 4
225% 5
250% 6
275% 7
300% 8
325% 9
350% 10
375% 11
400% 12
425% 13
450% 14
475% 15
500% 16
016
20.9
2%13
37.9
1%12
42.5
0%11
64.8
4%10
99.9
8%10
44.7
4%99
6.93
%95
5.03
%91
7.90
%88
4.70
%85
4.78
%82
7.64
%80
2.88
%78
0.16
%75
9.22
%73
9.85
%
115
79.0
5%13
07.1
6%12
15.4
4%11
40.7
6%10
78.3
8%10
25.2
2%97
9.20
%93
8.85
%90
3.08
%87
1.09
%84
2.26
%81
6.09
%79
2.21
%77
0.29
%75
0.08
%73
1.38
%
215
29.8
5%12
68.5
8%11
80.4
4%11
08.6
5%10
48.6
6%99
7.54
%95
3.28
%91
4.46
%88
0.05
%84
9.27
%82
1.52
%79
6.33
%77
3.33
%75
2.22
%73
2.76
%71
4.75
%
314
78.4
7%12
27.3
8%11
42.6
5%10
73.6
4%10
15.9
8%96
6.82
%92
4.26
%88
6.93
%85
3.84
%82
4.22
%79
7.53
%77
3.29
%75
1.16
%73
0.85
%71
2.13
%69
4.79
%
414
26.6
1%11
85.2
8%11
03.8
3%10
37.4
9%98
2.05
%93
4.80
%89
3.87
%85
7.98
%82
6.15
%79
7.67
%77
1.99
%74
8.68
%72
7.40
%70
7.86
%68
9.84
%67
3.16
%
513
75.4
9%11
43.5
2%10
65.2
3%10
01.4
5%94
8.15
%90
2.71
%86
3.37
%82
8.85
%79
8.24
%77
0.86
%74
6.16
%72
3.75
%70
3.27
%68
4.48
%66
7.15
%65
1.10
%
613
25.9
0%11
02.9
1%10
27.6
5%96
6.34
%91
5.10
%87
1.42
%83
3.59
%80
0.40
%77
0.97
%74
4.63
%72
0.88
%69
9.32
%67
9.63
%66
1.56
%64
4.89
%62
9.45
%
712
78.1
3%10
63.7
9%99
1.44
%93
2.50
%88
3.23
%84
1.24
%80
4.86
%77
2.95
%74
4.65
%71
9.33
%69
6.49
%67
5.75
%65
6.82
%63
9.43
%62
3.40
%60
8.55
%
812
32.1
0%10
26.0
7%95
6.52
%89
9.86
%85
2.50
%81
2.12
%77
7.15
%74
6.46
%71
9.25
%69
4.90
%67
2.94
%65
3.00
%63
4.79
%61
8.07
%60
2.65
%58
8.36
%
911
87.6
0%98
9.56
%92
2.71
%86
8.24
%82
2.71
%78
3.89
%75
0.27
%72
0.76
%69
4.60
%67
1.18
%65
0.06
%63
0.89
%61
3.37
%59
7.29
%58
2.46
%56
8.72
%
1011
44.7
3%95
4.37
%89
0.10
%83
7.74
%79
3.97
%75
6.65
%72
4.32
%69
5.96
%67
0.80
%64
8.28
%62
7.97
%60
9.53
%59
2.69
%57
7.22
%56
2.96
%54
9.74
%
1111
03.3
0%92
0.32
%85
8.54
%80
8.20
%76
6.13
%73
0.25
%69
9.17
%67
1.89
%64
7.70
%62
6.05
%60
6.52
%58
8.79
%57
2.59
%55
7.72
%54
4.00
%53
1.29
%
1210
63.5
8%88
7.70
%82
8.32
%77
9.93
%73
9.48
%70
4.99
%67
5.10
%64
8.88
%62
5.62
%60
4.80
%58
6.02
%56
8.97
%55
3.39
%53
9.09
%52
5.89
%51
3.67
%
1310
25.7
7%85
6.73
%79
9.65
%75
3.14
%71
4.25
%68
1.10
%65
2.37
%62
7.16
%60
4.79
%58
4.77
%56
6.72
%55
0.32
%53
5.33
%52
1.58
%50
8.88
%49
7.13
%
1498
9.64
%82
7.18
%77
2.32
%72
7.61
%69
0.24
%65
8.36
%63
0.74
%60
6.51
%58
5.00
%56
5.76
%54
8.39
%53
2.62
%51
8.21
%50
4.98
%49
2.77
%48
1.46
%
1595
5.23
%79
9.11
%74
6.39
%70
3.43
%66
7.50
%63
6.87
%61
0.32
%58
7.02
%56
6.35
%54
7.84
%53
1.14
%51
5.98
%50
2.12
%48
9.40
%47
7.66
%46
6.78
%
1692
2.82
%77
2.82
%72
2.16
%68
0.88
%64
6.35
%61
6.91
%59
1.39
%56
8.99
%54
9.12
%53
1.33
%51
5.28
%50
0.70
%48
7.37
%47
5.13
%46
3.84
%45
3.38
%
1789
2.14
%74
8.05
%69
9.38
%65
9.71
%62
6.54
%59
8.25
%57
3.73
%55
2.20
%53
3.10
%51
6.00
%50
0.57
%48
6.55
%47
3.74
%46
1.97
%45
1.11
%44
1.05
%
1886
3.05
%72
4.66
%67
7.91
%63
9.81
%60
7.94
%58
0.76
%55
7.20
%53
6.52
%51
8.17
%50
1.73
%48
6.90
%47
3.43
%46
1.11
%44
9.80
%43
9.36
%42
9.68
%
1983
5.09
%70
2.19
%65
7.30
%62
0.71
%59
0.11
%56
4.00
%54
1.37
%52
1.50
%50
3.87
%48
8.08
%47
3.83
%46
0.88
%44
9.04
%43
8.17
%42
8.13
%41
8.83
%
2080
8.09
%68
0.48
%63
7.38
%60
2.24
%57
2.85
%54
7.78
%52
6.04
%50
6.96
%49
0.03
%47
4.86
%46
1.17
%44
8.73
%43
7.36
%42
6.91
%41
7.27
%40
8.33
%
2178
1.83
%65
9.31
%61
7.92
%58
4.19
%55
5.97
%53
1.89
%51
1.03
%49
2.70
%47
6.44
%46
1.87
%44
8.73
%43
6.78
%42
5.86
%41
5.82
%40
6.56
%39
7.97
%
2275
6.31
%63
8.67
%59
8.94
%56
6.55
%53
9.46
%51
6.35
%49
6.31
%47
8.72
%46
3.10
%44
9.12
%43
6.49
%42
5.02
%41
4.53
%40
4.89
%39
6.00
%38
7.75
%
2373
1.54
%61
8.60
%58
0.46
%54
9.37
%52
3.37
%50
1.18
%48
1.95
%46
5.06
%45
0.07
%43
6.65
%42
4.53
%41
3.51
%40
3.44
%39
4.19
%38
5.65
%37
7.73
%
2470
7.43
%59
9.00
%56
2.39
%53
2.55
%50
7.59
%48
6.29
%46
7.83
%45
1.63
%43
7.24
%42
4.35
%41
2.72
%40
2.14
%39
2.48
%38
3.60
%37
5.40
%36
7.80
%
2568
4.04
%57
9.96
%54
4.81
%51
6.17
%49
2.22
%47
1.78
%45
4.06
%43
8.51
%42
4.70
%41
2.33
%40
1.17
%39
1.02
%38
1.75
%37
3.22
%36
5.35
%35
8.06
%
2666
1.36
%56
1.45
%52
7.72
%50
0.23
%47
7.24
%45
7.63
%44
0.63
%42
5.70
%41
2.45
%40
0.58
%38
9.87
%38
0.14
%37
1.24
%36
3.06
%35
5.51
%34
8.51
%
2763
9.47
%54
3.57
%51
1.20
%48
4.82
%46
2.76
%44
3.94
%42
7.63
%41
3.31
%40
0.60
%38
9.22
%37
8.94
%36
9.61
%36
1.07
%35
3.22
%34
5.98
%33
9.27
%
2861
8.33
%52
6.29
%49
5.23
%46
9.92
%44
8.76
%43
0.71
%41
5.06
%40
1.33
%38
9.14
%37
8.22
%36
8.36
%35
9.41
%35
1.22
%34
3.70
%33
6.75
%33
0.31
%
2959
7.76
%50
9.43
%47
9.62
%45
5.34
%43
5.04
%41
7.72
%40
2.71
%38
9.54
%37
7.85
%36
7.38
%35
7.93
%34
9.34
%34
1.49
%33
4.28
%32
7.62
%32
1.44
%
3057
7.72
%49
2.94
%46
4.34
%44
1.04
%42
1.56
%40
4.95
%39
0.56
%37
7.92
%36
6.71
%35
6.67
%34
7.61
%33
9.37
%33
1.85
%32
4.93
%31
8.55
%31
2.63
%
3155
8.24
%47
6.86
%44
9.42
%42
7.07
%40
8.38
%39
2.45
%37
8.64
%36
6.52
%35
5.77
%34
6.14
%33
7.45
%32
9.56
%32
2.34
%31
5.71
%30
9.59
%30
3.92
%
3253
9.30
%46
1.20
%43
4.86
%41
3.41
%39
5.49
%38
0.20
%36
6.96
%35
5.34
%34
5.03
%33
5.79
%32
7.46
%31
9.89
%31
2.98
%30
6.62
%30
0.75
%29
5.32
%
3352
0.93
%44
5.96
%42
0.69
%40
0.11
%38
2.91
%36
8.25
%35
5.55
%34
4.40
%33
4.51
%32
5.66
%31
7.67
%31
0.41
%30
3.78
%29
7.69
%29
2.07
%28
6.86
%
3450
3.13
%43
1.17
%40
6.92
%38
7.17
%37
0.67
%35
6.61
%34
4.42
%33
3.73
%32
4.25
%31
5.76
%30
8.10
%30
1.15
%29
4.79
%28
8.95
%28
3.56
%27
8.57
%
3548
5.92
%41
6.85
%39
3.58
%37
4.63
%35
8.80
%34
5.31
%33
3.63
%32
3.38
%31
4.28
%30
6.14
%29
8.80
%29
2.13
%28
6.04
%28
0.44
%27
5.28
%27
0.49
%
3646
9.29
%40
2.99
%38
0.65
%36
2.48
%34
7.29
%33
4.35
%32
3.15
%31
3.31
%30
4.60
%29
6.79
%28
9.75
%28
3.36
%27
7.52
%27
2.15
%26
7.20
%26
2.62
%
3745
3.25
%38
9.61
%36
8.18
%35
0.75
%33
6.18
%32
3.77
%31
3.02
%30
3.59
%29
5.23
%28
7.75
%28
1.01
%27
4.88
%26
9.28
%26
4.14
%25
9.40
%25
5.00
%
3843
7.76
%37
6.69
%35
6.13
%33
9.40
%32
5.43
%31
3.52
%30
3.22
%29
4.18
%28
6.16
%27
8.99
%27
2.52
%26
6.65
%26
1.29
%25
6.36
%25
1.82
%24
7.61
%
3942
2.86
%36
4.25
%34
4.52
%32
8.48
%31
5.08
%30
3.66
%29
3.78
%28
5.11
%27
7.43
%27
0.56
%26
4.36
%25
8.73
%25
3.59
%24
8.87
%24
4.52
%24
0.49
%
4040
8.51
%35
2.26
%33
3.33
%31
7.94
%30
5.09
%29
4.14
%28
4.67
%27
6.36
%26
9.00
%26
2.41
%25
6.47
%25
1.08
%24
6.15
%24
1.63
%23
7.47
%23
3.61
%

83
Tabl
e:A
ge:
Stan
dard
150% 2
175% 3
200% 4
225% 5
250% 6
275% 7
300% 8
325% 9
350% 10
375% 11
400% 12
425% 13
450% 14
475% 15
500% 16
4139
4.67
%34
0.69
%32
2.54
%30
7.78
%29
5.45
%28
4.96
%27
5.88
%26
7.91
%26
0.86
%25
4.54
%24
8.85
%24
3.69
%23
8.97
%23
4.64
%23
0.65
%22
6.95
%
4238
1.37
%32
9.57
%31
2.16
%29
8.00
%28
6.19
%27
6.13
%26
7.42
%25
9.79
%25
3.03
%24
6.98
%24
1.53
%23
6.58
%23
2.06
%22
7.92
%22
4.09
%22
0.56
%
4336
8.58
%31
8.89
%30
2.19
%28
8.61
%27
7.28
%26
7.64
%25
9.30
%25
1.99
%24
5.51
%23
9.71
%23
4.49
%22
9.75
%22
5.43
%22
1.46
%21
7.80
%21
4.41
%
4435
6.31
%30
8.64
%29
2.62
%27
9.61
%26
8.75
%25
9.51
%25
1.51
%24
4.51
%23
8.30
%23
2.75
%22
7.75
%22
3.22
%21
9.08
%21
5.28
%21
1.78
%20
8.54
%
4534
4.55
%29
8.83
%28
3.47
%27
1.00
%26
0.59
%25
1.74
%24
4.08
%23
7.37
%23
1.43
%22
6.11
%22
1.33
%21
6.99
%21
3.02
%20
9.39
%20
6.04
%20
2.94
%
4633
3.28
%28
9.43
%27
4.71
%26
2.75
%25
2.78
%24
4.30
%23
6.97
%23
0.54
%22
4.85
%21
9.77
%21
5.19
%21
1.03
%20
7.24
%20
3.77
%20
0.56
%19
7.60
%
4732
2.46
%28
0.42
%26
6.31
%25
4.85
%24
5.30
%23
7.18
%23
0.16
%22
4.01
%21
8.56
%21
3.70
%20
9.32
%20
5.34
%20
1.72
%19
8.39
%19
5.33
%19
2.50
%
4831
2.08
%27
1.78
%25
8.26
%24
7.28
%23
8.14
%23
0.36
%22
3.64
%21
7.75
%21
2.54
%20
7.89
%20
3.70
%19
9.90
%19
6.43
%19
3.26
%19
0.33
%18
7.62
%
4930
2.05
%26
3.41
%25
0.46
%23
9.95
%23
1.19
%22
3.74
%21
7.31
%21
1.68
%20
6.69
%20
2.24
%19
8.23
%19
4.60
%19
1.29
%18
8.25
%18
5.46
%18
2.87
%
5029
2.37
%25
5.33
%24
2.92
%23
2.86
%22
4.47
%21
7.34
%21
1.18
%20
5.80
%20
1.03
%19
6.77
%19
2.94
%18
9.47
%18
6.30
%18
3.40
%18
0.73
%17
8.26
%
5128
3.05
%24
7.55
%23
5.66
%22
6.02
%21
7.99
%21
1.16
%20
5.27
%20
0.12
%19
5.56
%19
1.49
%18
7.83
%18
4.51
%18
1.48
%17
8.71
%17
6.16
%17
3.80
%
5227
4.08
%24
0.06
%22
8.67
%21
9.44
%21
1.75
%20
5.22
%19
9.59
%19
4.66
%19
0.30
%18
6.41
%18
2.91
%17
9.73
%17
6.85
%17
4.20
%17
1.76
%16
9.51
%
5326
5.49
%23
2.89
%22
1.98
%21
3.14
%20
5.79
%19
9.54
%19
4.15
%18
9.44
%18
5.27
%18
1.55
%17
8.20
%17
5.18
%17
2.42
%16
9.89
%16
7.56
%16
5.42
%
5425
7.26
%22
6.02
%21
5.58
%20
7.12
%20
0.09
%19
4.11
%18
8.96
%18
4.45
%18
0.47
%17
6.92
%17
3.72
%17
0.83
%16
8.19
%16
5.78
%16
3.56
%16
1.51
%
5524
9.40
%21
9.48
%20
9.49
%20
1.39
%19
4.66
%18
8.95
%18
4.02
%17
9.72
%17
5.91
%17
2.52
%16
9.47
%16
6.71
%16
4.20
%16
1.90
%15
9.78
%15
7.82
%
5624
1.90
%21
3.25
%20
3.69
%19
5.95
%18
9.51
%18
4.05
%17
9.35
%17
5.23
%17
1.60
%16
8.36
%16
5.45
%16
2.82
%16
0.42
%15
8.23
%15
6.21
%15
4.35
%
5723
4.75
%20
7.32
%19
8.18
%19
0.78
%18
4.63
%17
9.41
%17
4.91
%17
0.99
%16
7.52
%16
4.43
%16
1.65
%15
9.14
%15
6.86
%15
4.77
%15
2.84
%15
1.07
%
5822
7.92
%20
1.67
%19
2.93
%18
5.85
%17
9.98
%17
5.00
%17
0.71
%16
6.96
%16
3.65
%16
0.71
%15
8.06
%15
5.67
%15
3.49
%15
1.50
%14
9.67
%14
7.98
%
5922
1.35
%19
6.24
%18
7.88
%18
1.12
%17
5.51
%17
0.75
%16
6.66
%16
3.08
%15
9.93
%15
7.12
%15
4.60
%15
2.32
%15
0.25
%14
8.35
%14
6.61
%14
5.00
%
6021
5.04
%19
1.02
%18
3.03
%17
6.57
%17
1.21
%16
6.68
%16
2.77
%15
9.36
%15
6.36
%15
3.68
%15
1.28
%14
9.11
%14
7.13
%14
5.33
%14
3.67
%14
2.14
%
6120
8.98
%18
6.02
%17
8.38
%17
2.22
%16
7.10
%16
2.77
%15
9.05
%15
5.80
%15
2.94
%15
0.39
%14
8.10
%14
6.03
%14
4.16
%14
2.44
%14
0.86
%13
9.41
%
6220
3.21
%18
1.25
%17
3.96
%16
8.07
%16
3.19
%15
9.07
%15
5.52
%15
2.42
%14
9.69
%14
7.27
%14
5.09
%14
3.12
%14
1.34
%13
9.71
%13
8.21
%13
6.83
%
6319
7.71
%17
6.72
%16
9.76
%16
4.15
%15
9.50
%15
5.56
%15
2.18
%14
9.24
%14
6.64
%14
4.33
%14
2.26
%14
0.39
%13
8.69
%13
7.14
%13
5.72
%13
4.41
%
6419
2.48
%17
2.44
%16
5.80
%16
0.44
%15
6.01
%15
2.27
%14
9.05
%14
6.24
%14
3.77
%14
1.58
%13
9.61
%13
7.84
%13
6.22
%13
4.75
%13
3.40
%13
2.16
%
6518
7.50
%16
8.37
%16
2.04
%15
6.93
%15
2.71
%14
9.15
%14
6.09
%14
3.42
%14
1.08
%13
8.99
%13
7.13
%13
5.44
%13
3.91
%13
2.52
%13
1.24
%13
0.06
%
6618
2.76
%16
4.50
%15
8.46
%15
3.61
%14
9.59
%14
6.20
%14
3.29
%14
0.76
%13
8.53
%13
6.55
%13
4.78
%13
3.19
%13
1.74
%13
0.41
%12
9.20
%12
8.09
%
6717
8.21
%16
0.80
%15
5.05
%15
0.43
%14
6.61
%14
3.39
%14
0.63
%13
8.23
%13
6.11
%13
4.24
%13
2.56
%13
1.05
%12
9.67
%12
8.42
%12
7.28
%12
6.22
%
6817
3.85
%15
7.25
%15
1.78
%14
7.38
%14
3.75
%14
0.70
%13
8.07
%13
5.80
%13
3.79
%13
2.02
%13
0.43
%12
9.00
%12
7.70
%12
6.52
%12
5.44
%12
4.44
%
6916
9.66
%15
3.84
%14
8.63
%14
4.45
%14
1.01
%13
8.11
%13
5.62
%13
3.47
%13
1.57
%12
9.89
%12
8.39
%12
7.04
%12
5.81
%12
4.69
%12
3.67
%12
2.73
%
7016
5.62
%15
0.55
%14
5.60
%14
1.63
%13
8.36
%13
5.61
%13
3.25
%13
1.21
%12
9.42
%12
7.83
%12
6.41
%12
5.13
%12
3.98
%12
2.92
%12
1.96
%12
1.07
%
7116
1.74
%14
7.39
%14
2.69
%13
8.92
%13
5.82
%13
3.21
%13
0.98
%12
9.05
%12
7.35
%12
5.85
%12
4.51
%12
3.31
%12
2.22
%12
1.23
%12
0.32
%11
9.48
%
7116
1.74
%14
7.39
%14
2.69
%13
8.92
%13
5.82
%13
3.21
%13
0.98
%12
9.05
%12
7.35
%12
5.85
%12
4.51
%12
3.31
%12
2.22
%12
1.23
%12
0.32
%11
9.48
%
7215
8.03
%14
4.36
%13
9.89
%13
6.32
%13
3.38
%13
0.91
%12
8.80
%12
6.98
%12
5.38
%12
3.96
%12
2.70
%12
1.56
%12
0.53
%11
9.60
%11
8.74
%11
7.96
%
7315
4.50
%14
1.51
%13
7.26
%13
3.87
%13
1.09
%12
8.75
%12
6.76
%12
5.03
%12
3.52
%12
2.19
%12
1.00
%11
9.93
%11
8.96
%11
8.08
%11
7.28
%11
6.54
%
7415
1.15
%13
8.79
%13
4.77
%13
1.55
%12
8.92
%12
6.71
%12
4.83
%12
3.20
%12
1.78
%12
0.52
%11
9.40
%11
8.40
%11
7.49
%11
6.66
%11
5.91
%11
5.22
%
7514
7.95
%13
6.21
%13
2.39
%12
9.35
%12
6.86
%12
4.77
%12
3.00
%12
1.47
%12
0.13
%11
8.94
%11
7.89
%11
6.95
%11
6.09
%11
5.32
%11
4.61
%11
3.97
%
7614
4.90
%13
3.75
%13
0.13
%12
7.25
%12
4.90
%12
2.93
%12
1.26
%11
9.82
%11
8.55
%11
7.44
%11
6.46
%11
5.57
%11
4.77
%11
4.05
%11
3.39
%11
2.78
%
7714
1.99
%13
1.40
%12
7.97
%12
5.25
%12
3.03
%12
1.17
%11
9.60
%11
8.24
%11
7.06
%11
6.01
%11
5.09
%11
4.26
%11
3.51
%11
2.83
%11
2.21
%11
1.65
%
7813
9.23
%12
9.18
%12
5.93
%12
3.36
%12
1.26
%11
9.51
%11
8.03
%11
6.75
%11
5.64
%11
4.66
%11
3.79
%11
3.01
%11
2.31
%11
1.68
%11
1.10
%11
0.58
%
7913
6.61
%12
7.08
%12
4.00
%12
1.57
%11
9.59
%11
7.95
%11
6.55
%11
5.35
%11
4.31
%11
3.39
%11
2.58
%11
1.85
%11
1.20
%11
0.60
%11
0.07
%10
9.57
%
8013
4.15
%12
5.11
%12
2.20
%11
9.91
%11
8.04
%11
6.49
%11
5.18
%11
4.05
%11
3.07
%11
2.21
%11
1.45
%11
0.77
%11
0.16
%10
9.61
%10
9.10
%10
8.65
%

84
Tabl
e:A
ge:
Stan
dard
150% 2
175% 3
200% 4
225% 5
250% 6
275% 7
300% 8
325% 9
350% 10
375% 11
400% 12
425% 13
450% 14
475% 15
500% 16
8113
1.83
%12
3.27
%12
0.52
%11
8.35
%11
6.59
%11
5.13
%11
3.89
%11
2.84
%11
1.92
%11
1.11
%11
0.40
%10
9.76
%10
9.19
%10
8.68
%10
8.21
%10
7.78
%
8212
9.67
%12
1.56
%11
8.96
%11
6.91
%11
5.25
%11
3.88
%11
2.72
%11
1.73
%11
0.87
%11
0.11
%10
9.45
%10
8.85
%10
8.32
%10
7.84
%10
7.40
%10
7.01
%
8312
7.65
%11
9.97
%11
7.51
%11
5.58
%11
4.02
%11
2.73
%11
1.64
%11
0.71
%10
9.90
%10
9.20
%10
8.57
%10
8.02
%10
7.52
%10
7.08
%10
6.67
%10
6.30
%
8412
5.74
%11
8.49
%11
6.16
%11
4.34
%11
2.87
%11
1.65
%11
0.63
%10
9.76
%10
9.00
%10
8.34
%10
7.76
%10
7.24
%10
6.78
%10
6.36
%10
5.99
%10
5.64
%
8512
3.96
%11
7.10
%11
4.90
%11
3.18
%11
1.79
%11
0.65
%10
9.69
%10
8.87
%10
8.17
%10
7.55
%10
7.01
%10
6.52
%10
6.09
%10
5.70
%10
5.35
%10
5.03
%
8612
2.29
%11
5.82
%11
3.74
%11
2.12
%11
0.81
%10
9.73
%10
8.83
%10
8.06
%10
7.40
%10
6.82
%10
6.31
%10
5.86
%10
5.46
%10
5.10
%10
4.77
%10
4.48
%
8712
0.74
%11
4.63
%11
2.67
%11
1.13
%10
9.89
%10
8.88
%10
8.03
%10
7.30
%10
6.68
%10
6.14
%10
5.67
%10
5.25
%10
4.87
%10
4.53
%10
4.23
%10
3.95
%
8811
9.30
%11
3.55
%11
1.70
%11
0.24
%10
9.07
%10
8.11
%10
7.31
%10
6.63
%10
6.05
%10
5.54
%10
5.09
%10
4.70
%10
4.34
%10
4.03
%10
3.74
%10
3.49
%
8911
7.98
%11
2.59
%11
0.83
%10
9.46
%10
8.35
%10
7.44
%10
6.68
%10
6.04
%10
5.49
%10
5.01
%10
4.58
%10
4.21
%10
3.88
%10
3.58
%10
3.32
%10
3.07
%
9011
6.75
%11
1.72
%11
0.07
%10
8.77
%10
7.72
%10
6.86
%10
6.14
%10
5.53
%10
5.01
%10
4.56
%10
4.16
%10
3.80
%10
3.49
%10
3.21
%10
2.96
%10
2.73
%
9111
5.60
%11
0.94
%10
9.39
%10
8.17
%10
7.18
%10
6.37
%10
5.69
%10
5.12
%10
4.62
%10
4.19
%10
3.82
%10
3.49
%10
3.19
%10
2.92
%10
2.68
%10
2.47
%
9211
4.42
%11
0.16
%10
8.71
%10
7.57
%10
6.64
%10
5.87
%10
5.24
%10
4.69
%10
4.23
%10
3.83
%10
3.47
%10
3.16
%10
2.88
%10
2.63
%10
2.41
%10
2.21
%
9311
3.23
%10
9.37
%10
8.04
%10
6.97
%10
6.10
%10
5.38
%10
4.78
%10
4.27
%10
3.84
%10
3.46
%10
3.13
%10
2.83
%10
2.57
%10
2.34
%10
2.14
%10
1.97
%
9411
2.00
%10
8.59
%10
7.37
%10
6.38
%10
5.57
%10
4.90
%10
4.34
%10
3.86
%10
3.45
%10
3.10
%10
2.79
%10
2.51
%10
2.27
%10
2.06
%10
1.97
%10
1.00
%
9511
0.72
%10
7.80
%10
6.72
%10
5.82
%10
5.07
%10
4.44
%10
3.91
%10
3.46
%10
3.07
%10
2.74
%10
2.45
%10
2.19
%10
1.97
%10
1.97
%10
1.00
%10
1.00
%
9610
9.36
%10
7.01
%10
6.08
%10
5.29
%10
4.62
%10
4.04
%10
3.55
%10
3.12
%10
2.76
%10
2.44
%10
2.17
%10
1.97
%10
1.00
%10
1.00
%10
1.00
%10
1.00
%
9710
7.80
%10
6.10
%10
5.38
%10
4.74
%10
4.17
%10
3.67
%10
3.22
%10
2.82
%10
2.47
%10
2.17
%10
1.97
%10
1.00
%10
1.00
%10
1.00
%10
1.00
%10
1.00
%
9810
5.91
%10
4.94
%10
4.50
%10
4.07
%10
3.68
%10
3.30
%10
2.95
%10
2.63
%10
2.32
%10
2.04
%10
1.00
%10
1.00
%10
1.00
%10
1.00
%10
1.00
%10
1.00
%
9910
3.39
%10
3.09
%10
2.94
%10
2.79
%10
2.65
%10
2.50
%10
2.35
%10
2.20
%10
2.05
%10
1.97
%10
1.00
%10
1.00
%10
1.00
%10
1.00
%10
1.00
%10
1.00
%
100
101.
00%
101.
00%
101.
00%
101.
00%
101.
00%
101.
00%
101.
00%
101.
00%
101.
00%
101.
00%
101.
00%
101.
00%
101.
00%
101.
00%
101.
00%
101.
00%
101
101.
00%
101.
00%
101.
00%
101.
00%
101.
00%
101.
00%
101.
00%
101.
00%
101.
00%
101.
00%
101.
00%
101.
00%
101.
00%
101.
00%
101.
00%
101.
00%
102
101.
00%
101.
00%
101.
00%
101.
00%
101.
00%
101.
00%
101.
00%
101.
00%
101.
00%
101.
00%
101.
00%
101.
00%
101.
00%
101.
00%
101.
00%
101.
00%
103
101.
00%
101.
00%
101.
00%
101.
00%
101.
00%
101.
00%
101.
00%
101.
00%
101.
00%
101.
00%
101.
00%
101.
00%
101.
00%
101.
00%
101.
00%
101.
00%
104
101.
00%
101.
00%
101.
00%
101.
00%
101.
00%
101.
00%
101.
00%
101.
00%
101.
00%
101.
00%
101.
00%
101.
00%
101.
00%
101.
00%
101.
00%
101.
00%
105
101.
00%
101.
00%
101.
00%
101.
00%
101.
00%
101.
00%
101.
00%
101.
00%
101.
00%
101.
00%
101.
00%
101.
00%
101.
00%
101.
00%
101.
00%
101.
00%
106
101.
00%
101.
00%
101.
00%
101.
00%
101.
00%
101.
00%
101.
00%
101.
00%
101.
00%
101.
00%
101.
00%
101.
00%
101.
00%
101.
00%
101.
00%
101.
00%
107
101.
00%
101.
00%
101.
00%
101.
00%
101.
00%
101.
00%
101.
00%
101.
00%
101.
00%
101.
00%
101.
00%
101.
00%
101.
00%
101.
00%
101.
00%
101.
00%
108
101.
00%
101.
00%
101.
00%
101.
00%
101.
00%
101.
00%
101.
00%
101.
00%
101.
00%
101.
00%
101.
00%
101.
00%
101.
00%
101.
00%
101.
00%
101.
00%
109
101.
00%
101.
00%
101.
00%
101.
00%
101.
00%
101.
00%
101.
00%
101.
00%
101.
00%
101.
00%
101.
00%
101.
00%
101.
00%
101.
00%
101.
00%
101.
00%
110
101.
00%
101.
00%
101.
00%
101.
00%
101.
00%
101.
00%
101.
00%
101.
00%
101.
00%
101.
00%
101.
00%
101.
00%
101.
00%
101.
00%
101.
00%
101.
00%
111
101.
00%
101.
00%
101.
00%
101.
00%
101.
00%
101.
00%
101.
00%
101.
00%
101.
00%
101.
00%
101.
00%
101.
00%
101.
00%
101.
00%
101.
00%
101.
00%
112
101.
00%
101.
00%
101.
00%
101.
00%
101.
00%
101.
00%
101.
00%
101.
00%
101.
00%
101.
00%
101.
00%
101.
00%
101.
00%
101.
00%
101.
00%
101.
00%
113
101.
00%
101.
00%
101.
00%
101.
00%
101.
00%
101.
00%
101.
00%
101.
00%
101.
00%
101.
00%
101.
00%
101.
00%
101.
00%
101.
00%
101.
00%
101.
00%
114
101.
00%
101.
00%
101.
00%
101.
00%
101.
00%
101.
00%
101.
00%
101.
00%
101.
00%
101.
00%
101.
00%
101.
00%
101.
00%
101.
00%
101.
00%
101.
00%
115
101.
00%
101.
00%
101.
00%
101.
00%
101.
00%
101.
00%
101.
00%
101.
00%
101.
00%
101.
00%
101.
00%
101.
00%
101.
00%
101.
00%
101.
00%
101.
00%
116
101.
00%
101.
00%
101.
00%
101.
00%
101.
00%
101.
00%
101.
00%
101.
00%
101.
00%
101.
00%
101.
00%
101.
00%
101.
00%
101.
00%
101.
00%
101.
00%
117
101.
00%
101.
00%
101.
00%
101.
00%
101.
00%
101.
00%
101.
00%
101.
00%
101.
00%
101.
00%
101.
00%
101.
00%
101.
00%
101.
00%
101.
00%
101.
00%
118
101.
00%
101.
00%
101.
00%
101.
00%
101.
00%
101.
00%
101.
00%
101.
00%
101.
00%
101.
00%
101.
00%
101.
00%
101.
00%
101.
00%
101.
00%
101.
00%
119
101.
00%
101.
00%
101.
00%
101.
00%
101.
00%
101.
00%
101.
00%
101.
00%
101.
00%
101.
00%
101.
00%
101.
00%
101.
00%
101.
00%
101.
00%
101.
00%
120
101.
00%
101.
00%
101.
00%
101.
00%
101.
00%
101.
00%
101.
00%
101.
00%
101.
00%
101.
00%
101.
00%
101.
00%
101.
00%
101.
00%
101.
00%
101.
00%

85
ADDITIONAL INFORMATION
Additional information about the Policy is available in the Statement of Additional Information dated May 1, 2016, and which is part of this prospectus.
Your questions and/or requests for a free copy of the Statement of Additional Information or a free personalized illustration should be directed to: Principal Benefit Variable Universal Life II, Principal Financial Group, P.O. Box 10431, Des Moines, Iowa 50306-0431, 1-800-247-9988. You may also contact us through our internet site: www.principal.com
Information about the Policy (including the Statement of Additional Information) can be reviewed and copied at the Securities and Exchange Commission’s Public Reference Room in Washington, D.C. Information on the operation of the public reference room may be obtained by calling the Commission at 202-942-8090. Reports and other information about the Policy are available on the Commission’s internet site at http://www.sec.gov. Copies of this information may be obtained, upon payment of a duplicating fee, by writing the Public Reference Section of the Commission, 450 Fifth Street, NW, Washington, D.C. 20549-0102.
Principal Benefit Variable Universal Life IIInvestment Company Act File No. 333-149363

SUMMARY PROSPECTUS May 1, 2016
AB Variable Products Series Fund, Inc.Global Thematic Growth Portfolio—Class A
Before you invest, you may want to review the Portfolio’s Prospectus, which contains more information about the Portfolio and itsrisks. The Portfolio’s Prospectus and Statement of Additional Information, both dated May 1, 2016, are incorporated by reference intothis Summary Prospectus. For free paper or electronic copies of the Portfolio’s Prospectus and other information about the Portfolio, goto http://www.ABglobal.com/links/variable, email a request to [email protected], call (800) 227-4618, or ask any insurancecompany that offers shares of the Portfolio.
INVESTMENT OBJECTIVEThe Portfolio’s investment objective is long-term growth of capital.
FEES AND EXPENSES OF THE PORTFOLIOThis table describes the fees and expenses that you may pay if you buy and hold shares of the Portfolio. The operating expensesinformation below is designed to assist Contractholders of variable products that invest in the Portfolio in understanding the feesand expenses that they may pay as an investor. Because the information does not reflect deductions at the separate account level orcontract level for any charges that may be incurred under a contract, Contractholders that invest in the Portfolio should refer to thevariable contract prospectus for a description of fees and expenses that apply to Contractholders. Inclusion of these charges wouldincrease the fees and expenses provided below.
Shareholder Fees (fees paid directly from your investment)N/A
Annual Portfolio Operating Expenses (expenses that you pay each year as a percentage of the value of your investment)
Management Fees .75%Other Expenses:
Transfer Agent .01%Other Expenses .25%
Total Other Expenses .26%
Total Portfolio Operating Expenses 1.01%
ExamplesThe Examples are intended to help you compare the cost of investing in the Portfolio with the cost of investing in other mutual funds.The Examples assume that you invest $10,000 in the Portfolio for the time periods indicated and then redeem all of your shares at theend of those periods. The Examples also assume that your investment has a 5% return each year and that the Portfolio’s operating ex-penses stay the same. Although your actual costs may be higher or lower, based on these assumptions your costs would be:
After 1 Year $ 103After 3 Years $ 322After 5 Years $ 558After 10 Years $1,236
Portfolio TurnoverThe Portfolio pays transaction costs, such as commissions, when it buys or sells securities (or “turns over” its portfolio). A higherportfolio turnover rate may indicate higher transaction costs. These transaction costs, which are not reflected in the Annual Portfo-lio Operating Expenses or in the Examples, affect the Portfolio’s performance. During the most recent fiscal year, the Portfolio’sportfolio turnover rate was 47% of the average value of its portfolio.
S-1
1
S-1

PRINCIPAL STRATEGIESThe Portfolio pursues opportunistic growth by investing in a global universe of companies in multiple industries that may benefitfrom innovation.
The Adviser employs a combination of “top-down” and “bottom-up” investment processes with the goal of identifying the mostattractive securities worldwide, fitting into broader themes, which are developments that have broad effects across industries andcompanies. Drawing on its global fundamental research capabilities, the Adviser seeks to identify long-term secular growth trendsthat will affect multiple industries. The Adviser will assess the effects of these trends on entire industries and on individual compa-nies. Through this process, the Adviser intends to identify key investment themes, which will be the focus of the Portfolio’sinvestments and which are expected to change over time based on the Adviser’s research.
In addition to this “top-down” thematic approach, the Adviser will also use a “bottom-up” analysis of individual companies thatfocuses on prospective earnings growth, valuation and quality of company management. The Adviser normally considers a largeuniverse of mid- to large-capitalization companies worldwide for investment.
The Portfolio invests in securities issued by U.S. and non-U.S. companies from multiple industry sectors in an attempt to maximizeopportunity, which should also tend to reduce risk. The Portfolio invests in both developed and emerging market countries. Undernormal market conditions, the Portfolio invests significantly (at least 40%—unless market conditions are not deemed favorable bythe Adviser) in securities of non-U.S. companies. In addition, the Portfolio invests, under normal circumstances, in the equitysecurities of companies located in at least three countries. The percentage of the Portfolio’s assets invested in securities of compa-nies in a particular country or denominated in a particular currency varies in accordance with the Adviser’s assessment of theappreciation potential of such securities.
The Portfolio may invest in any company and industry and in any type of equity security, listed and unlisted, with potential forcapital appreciation. It invests in well-known, established companies as well as new, smaller or less-seasoned companies. Invest-ments in new, smaller or less-seasoned companies may offer more reward but may also entail more risk than is generally true oflarger, established companies. The Portfolio may also invest in synthetic foreign equity securities, which are various types of war-rants used internationally that entitle a holder to buy or sell underlying securities, real estate investment trusts and zero-couponbonds.
The Portfolio may, at times, invest in shares of exchange-traded funds, or ETFs, in lieu of making direct investments in equity secu-rities. ETFs may provide more efficient and economical exposure to the type of companies and geographic locations in which thePortfolio seeks to invest than direct investments.
Currencies can have a dramatic impact on equity returns, significantly adding to returns in some years and greatly diminishing themin others. Currency and equity positions are evaluated separately. The Adviser may seek to hedge the currency exposure resultingfrom securities positions when it finds the currency exposure unattractive. To hedge all or a portion of its currency risk, the Portfo-lio may, from time to time, invest in currency-related derivatives, including forward currency exchange contracts, futures contracts,options on futures contracts, swaps and options. The Adviser may also seek investment opportunities by taking long or short posi-tions in currencies through the use of currency-related derivatives.
The Portfolio may enter into other derivatives transactions, such as options, futures contracts, forwards and swaps. The Portfoliomay use options strategies involving the purchase and/or writing of various combinations of call and/or put options, including onindividual securities and stock indices, futures contracts (including futures contracts on individual securities and stock indices) orshares of ETFs. These transactions may be used, for example, to earn extra income, to adjust exposure to individual securities ormarkets, or to protect all or a portion of the Portfolio’s portfolio from a decline in value, sometimes within certain ranges.
PRINCIPAL RISKS• Market Risk: The value of the Portfolio’s assets will fluctuate as the stock or bond market fluctuates. The value of its invest-
ments may decline, sometimes rapidly and unpredictably, simply because of economic changes or other events that affect largeportions of the market. It includes the risk that a particular style of investing, such as growth, may underperform the marketgenerally.
• Foreign (Non-U.S.) Risk: Investments in securities of non-U.S. issuers may involve more risk than those of U.S. issuers.These securities may fluctuate more widely in price and may be less liquid due to adverse market, economic, political, regulatoryor other factors.
• Emerging Market Risk: Investments in emerging market countries may have more risk because the markets are less developedand less liquid, and because these investments may be subject to increased economic, political, regulatory or other uncertainties.
• Currency Risk: Fluctuations in currency exchange rates may negatively affect the value of the Portfolio’s investments or reduceits returns.
S-2
2
S-2

• Capitalization Risk: Investments in small- and mid-capitalization companies may be more volatile than investments in large-capitalization companies. Investments in small-capitalization companies may have additional risks because these companies havelimited product lines, markets or financial resources.
• Derivatives Risk: Derivatives may be illiquid, difficult to price, and leveraged so that small changes may produce dispropor-tionate losses for the Portfolio, and may be subject to counterparty risk to a greater degree than more traditional investments.
• Focused Portfolio Risk: Investments in a limited number of companies may have more risk because changes in the value of asingle security may have a more significant effect, either negative or positive, on the Portfolio’s net asset value, or NAV.
• Leverage Risk: To the extent the Portfolio uses leveraging techniques, its NAV may be more volatile because leverage tends toexaggerate the effect of changes in interest rates and any increase or decrease in the value of the Portfolio’s investments.
• Management Risk: The Portfolio is subject to management risk because it is an actively-managed investment fund. The Ad-viser will apply its investment techniques and risk analyses in making investment decisions for the Portfolio, but there is no guar-antee that its techniques will produce the intended results.
As with all investments, you may lose money by investing in the Portfolio.
BAR CHART AND PERFORMANCE INFORMATIONThe bar chart and performance information provide an indication of the historical risk of an investment in the Portfolio byshowing:
• how the Portfolio’s performance changed from year to year over ten years; and
• how the Portfolio’s average annual returns for one, five and ten years compare to those of a broad-based securities market index.
The performance information does not take into account separate account charges. If separate account charges were included, aninvestor’s return would be lower. The Portfolio’s past performance, of course, does not necessarily indicate how it will perform inthe future.
Bar Chart
Calendar Year End (%)08
09 10 12
11
06 07 13 14 15
2.898.64
20.20 23.26
5.06-47.37
53.49
18.93
-23.23
13.52
During the period shown in the bar chart, the Portfolio’s:
Best Quarter was up 21.43%, 2nd quarter, 2009; and Worst Quarter was down -25.85%, 4th quarter, 2008.
Performance TableAverage Annual Total Returns(For the periods ended December 31, 2015)
1 Year 5 Years 10 Years
Portfolio 2.89% 3.03% 3.83%
MSCI AC World Index (Net)(reflects no deduction for fees, expenses, or taxes, except the reinvestment of dividends net of non-U.S. withholding taxes) -2.36% 6.09% 4.76%
S-3
3
S-3

INVESTMENT ADVISERAllianceBernstein L.P. is the investment adviser for the Portfolio.
PORTFOLIO MANAGERThe following table lists the person responsible for day-to-day management of the Portfolio’s portfolio:
Employee Length of Service Title
Daniel C. Roarty Since 2013 Senior Vice President of the Adviser
PURCHASE AND SALE OF PORTFOLIO SHARESThe Portfolio offers its shares through the separate accounts of participating life insurance companies (“Insurers”). You may onlypurchase and sell shares through these separate accounts. See the prospectus of the separate account of the Insurer for informationon the purchase and sale of the Portfolio shares.
TAX INFORMATIONThe Portfolio may pay income dividends or make capital gains distributions. The income and capital gains distributions are ex-pected to be made in shares of the Portfolio. See the prospectus of the separate account of the Insurer for federal income taxinformation.
PAYMENTS TO INSURERS AND OTHER FINANCIAL INTERMEDIARIESIf you purchase shares of the Portfolio through an Insurer or other financial intermediary, the Portfolio and its related companiesmay pay the intermediary for the sale of Portfolio shares and related services. These payments may create a conflict of interest byinfluencing the Insurer or other financial intermediary and your salesperson to recommend the Portfolio over another investment.Ask your salesperson or visit your financial intermediary’s website for more information.
Printed on recycledpaper containing postconsumer waste.
S-4
4
S-4

SUMMARY PROSPECTUS May 1, 2016
AB Variable Products Series Fund, Inc.International Growth Portfolio—Class A
Before you invest, you may want to review the Portfolio’s Prospectus, which contains more information about the Portfolio andits risks. The Portfolio’s Prospectus and Statement of Additional Information, both dated May 1, 2016, are incorporated by refer-ence into this Summary Prospectus. For free paper or electronic copies of the Portfolio’s Prospectus and other information aboutthe Portfolio, go to http://www.ABglobal.com/links/variable, email a request to [email protected], call (800) 227-4618,or ask any insurance company that offers shares of the Portfolio.
INVESTMENT OBJECTIVEThe Portfolio’s investment objective is long-term growth of capital.
FEES AND EXPENSES OF THE PORTFOLIOThis table describes the fees and expenses that you may pay if you buy and hold shares of the Portfolio. The operating expenses in-formation below is designed to assist Contractholders of variable products that invest in the Portfolio in understanding the fees and ex-penses that they may pay as an investor. Because the information does not reflect deductions at the separate account level or contractlevel for any charges that may be incurred under a contract, Contractholders that invest in the Portfolio should refer to the variablecontract prospectus for a description of fees and expenses that apply to Contractholders. Inclusion of these charges would increase thefees and expenses provided below.
Shareholder Fees (fees paid directly from your investment)N/A
Annual Portfolio Operating Expenses (expenses that you pay each year as a percentage of the value of your investment)
Management Fees .75%Other Expenses:
Transfer Agent .00%(a)Other Expenses .36%
Total Other Expenses .36%
Total Portfolio Operating Expenses 1.11%
(a) Less than .01%.
ExamplesThe Examples are intended to help you compare the cost of investing in the Portfolio with the cost of investing in other mutual funds. TheExamples assume that you invest $10,000 in the Portfolio for the time periods indicated and then redeem all of your shares at the end ofthose periods. The Examples also assume that your investment has a 5% return each year and that the Portfolio’s operating expenses stay thesame. Although your actual costs may be higher or lower, based on these assumptions your costs would be:
After 1 Year $ 113After 3 Years $ 353After 5 Years $ 612After 10 Years $1,352
Portfolio TurnoverThe Portfolio pays transaction costs, such as commissions, when it buys or sells securities (or “turns over” its portfolio). A higher port-folio turnover rate may indicate higher transaction costs. These transaction costs, which are not reflected in the Annual PortfolioOperating Expenses or in the Examples, affect the Portfolio’s performance. During the most recent fiscal year, the Portfolio’s portfolioturnover rate was 17% of the average value of its portfolio.
S-1
5
S-5

PRINCIPAL STRATEGIESThe Portfolio invests primarily in an international portfolio of equity securities of companies selected by the Adviser for their growthpotential within various market sectors. Examples of the types of market sectors in which the Portfolio may invest include, but arenot limited to, information technology (which includes telecommunications), health care, financial services, infrastructure, energyand natural resources, and consumer groups. The Adviser’s growth analysts seek to identify companies or industries for which otherinvestors have underestimated earnings potential—for example, some hidden earnings driver (including, but not limited to, reducedcompetition, market share gain, better margin trend, increased customer base, or similar factors) that would cause a company togrow faster than market forecasts.
The Adviser allocates the Portfolio’s investments among broad sector groups utilizing the fundamental company research con-ducted by the Adviser’s internal research staff, assessing the current and forecasted investment opportunities and conditions, as wellas diversification and risk considerations. The Adviser may vary the percentage allocations among market sectors and may changethe market sectors in which the Portfolio invests as companies’ potential for growth within a sector matures and new trends forgrowth emerge.
The Portfolio invests, under normal circumstances, in the equity securities of companies located in at least three countries (andnormally substantially more) other than the United States. The Portfolio invests in securities of companies in both developed andemerging market countries. Geographic distribution of the Portfolio’s investments among countries or regions also will be a prod-uct of the stock selection process rather than a pre-determined allocation.
The Portfolio may also invest in synthetic foreign equity securities, which are various types of warrants used internationally that entitlea holder to buy or sell underlying securities. The Adviser expects that normally the Portfolio’s portfolio will tend to emphasizeinvestments in larger capitalization companies, although the Portfolio may invest in smaller or medium capitalization companies.
The Portfolio may, at times, invest in shares of exchange-traded funds, or ETFs, in lieu of making direct investments in equity secu-rities. ETFs may provide more efficient and economical exposure to the type of companies and geographic locations in which thePortfolio seeks to invest than direct investments.
Currencies can have a dramatic impact on equity returns, significantly adding to returns in some years and greatly diminishing themin others. Currency and equity positions are evaluated separately. The Adviser may seek to hedge the currency exposure resultingfrom securities positions when it finds the currency exposure unattractive. To hedge all or a portion of its currency risk, the Portfo-lio may, from time to time, invest in currency-related derivatives, including forward currency exchange contracts, futures contracts,options on futures contracts, swaps and options. The Adviser may also seek investment opportunities by taking long or short posi-tions in currencies through the use of currency-related derivatives.
The Portfolio may enter into other derivatives transactions, such as options, futures contracts, forwards and swaps. The Portfoliomay use options strategies involving the purchase and/or writing of various combinations of call and/or put options, including onindividual securities and stock indices, futures contracts (including futures contracts on individual securities and stock indices) orshares of ETFs. These transactions may be used, for example, in an effort to earn extra income, to adjust exposure to individualsecurities or markets, or to protect all or a portion of the Portfolio’s portfolio from a decline in value, sometimes within certainranges.
PRINCIPAL RISKS• Market Risk: The value of the Portfolio’s assets will fluctuate as the stock or bond market fluctuates. The value of its invest-
ments may decline, sometimes rapidly and unpredictably, simply because of economic changes or other events that affect largeportions of the market. It includes the risk that a particular style of investing, such as growth, may underperform the marketgenerally.
• Foreign (Non-U.S.) Risk: Investments in securities of non-U.S. issuers may involve more risk than those of U.S. issuers.These securities may fluctuate more widely in price and may be less liquid due to adverse market, economic, political, regulatoryor other factors.
• Emerging Market Risk: Investments in emerging market countries may have more risk because the markets are less developedand less liquid, and because these investments may be subject to increased economic, political, regulatory or other uncertainties.
• Currency Risk: Fluctuations in currency exchange rates may negatively affect the value of the Portfolio’s investments or reduceits returns.
• Capitalization Risk: Investments in small- and mid-capitalization companies may be more volatile than investments in large-capitalization companies. Investments in small-capitalization companies may have additional risks because these companies havelimited product lines, markets or financial resources.
• Derivatives Risk: Derivatives may be illiquid, difficult to price, and leveraged so that small changes may produce dispropor-tionate losses for the Portfolio, and may be subject to counterparty risk to a greater degree than more traditional investments.
S-2
6
S-6

• Leverage Risk: To the extent the Portfolio uses leveraging techniques, its net asset value may be more volatile because leveragetends to exaggerate the effect of changes in interest rates and any increase or decrease in the value of the Portfolio’s investments.
• Management Risk: The Portfolio is subject to management risk because it is an actively-managed investment fund. The Ad-viser will apply its investment techniques and risk analyses in making investment decisions for the Portfolio, but there is no guar-antee that its techniques will produce the intended results.
As with all investments, you may lose money by investing in the Portfolio.
BAR CHART AND PERFORMANCE INFORMATIONThe bar chart and performance information provide an indication of the historical risk of an investment in the Portfolio by showing:
• how the Portfolio’s performance changed from year to year over ten years; and
• how the Portfolio’s average annual returns for one, five and ten years compare to those of a broad-based securities market index.
The performance information does not take into account separate account charges. If separate account charges were included, aninvestor’s return would be lower. The Portfolio’s past performance, of course, does not necessarily indicate how it will perform inthe future.
Bar Chart
Calendar Year End (%)
15
-1.8706
27.04
07
18.13
13
13.60
14
-1.19
08
-48.8509
39.58
10
12.89
11
-15.8512
15.54
During the period shown in the bar chart, the Portfolio’s:
Best Quarter was up 24.51%, 2nd quarter, 2009; and Worst Quarter was down -27.30%, 3rd quarter, 2008.
Performance TableAverage Annual Total Returns(For the periods ended December 31, 2015)
1 Year 5 Years 10 Years
Portfolio -1.87% 1.38% 2.62%
MSCI AC World Index (ex. U.S.)(reflects no deduction for fees, expenses, or taxes except the reinvestment of dividends net of non-U.S. withholding taxes) -5.66% 1.06% 2.92%
MSCI World Index (ex. U.S.)*(reflects no deduction for fees, expenses, or taxes except the reinvestment of dividends net of non-U.S. withholding taxes) -3.04% 2.79% 2.92%
* The performance table includes an additional index that shows how the Portfolio’s performance compares with an index of the equity market performance of developed markets.
INVESTMENT ADVISERAllianceBernstein L.P. is the investment adviser for the Portfolio.
PORTFOLIO MANAGERThe following table lists the person responsible for day-to-day management of the Portfolio’s portfolio:
Employee Length of Service Title
Daniel C. Roarty Since 2012 Senior Vice President of the Adviser
S-3
7
S-7

PURCHASE AND SALE OF PORTFOLIO SHARESThe Portfolio offers its shares through the separate accounts of participating life insurance companies (“Insurers”). You may onlypurchase and sell shares through these separate accounts. See the prospectus of the separate account of the Insurer for informationon the purchase and sale of the Portfolio shares.
TAX INFORMATIONThe Portfolio may pay income dividends or make capital gains distributions. The income and capital gains distributions are ex-pected to be made in shares of the Portfolio. See the prospectus of the separate account of the Insurer for federal income taxinformation.
PAYMENTS TO INSURERS AND OTHER FINANCIAL INTERMEDIARIESIf you purchase shares of the Portfolio through an Insurer or other financial intermediary, the Portfolio and its related companiesmay pay the intermediary for the sale of Portfolio shares and related services. These payments may create a conflict of interest byinfluencing the Insurer or other financial intermediary and your salesperson to recommend the Portfolio over another investment.Ask your salesperson or visit your financial intermediary’s website for more information.
Printed on recycledpaper containing postconsumer waste.
S-4
8
S-8

SUMMARY PROSPECTUS May 1, 2016
AB Variable Products Series Fund, Inc.International Value Portfolio—Class A
Before you invest, you may want to review the Portfolio’s Prospectus, which contains more information about the Portfolio andits risks. The Portfolio’s Prospectus and Statement of Additional Information, both dated May 1, 2016, are incorporated by refer-ence into this Summary Prospectus. For free paper or electronic copies of the Portfolio’s Prospectus and other information aboutthe Portfolio, go to http://www.ABglobal.com/links/variable, email a request to [email protected], call (800) 227-4618,or ask any insurance company that offers shares of the Portfolio.
INVESTMENT OBJECTIVEThe Portfolio’s investment objective is long-term growth of capital.
FEES AND EXPENSES OF THE PORTFOLIOThis table describes the fees and expenses that you may pay if you buy and hold shares of the Portfolio. The operating expensesinformation below is designed to assist Contractholders of variable products that invest in the Portfolio in understanding the feesand expenses that they may pay as an investor. Because the information does not reflect deductions at the separate account level orcontract level for any charges that may be incurred under a contract, Contractholders that invest in the Portfolio should refer to thevariable contract prospectus for a description of fees and expenses that apply to Contractholders. Inclusion of these charges wouldincrease the fees and expenses provided below.
Shareholder Fees (fees paid directly from your investment)N/A
Annual Portfolio Operating Expenses (expenses that you pay each year as a percentage of the value of your investment)
Management Fees .75%Other Expenses:
Transfer Agent .00%(a)Other Expenses .10%
Total Other Expenses .10%
Total Portfolio Operating Expenses .85%
(a) Less than .01%.
ExamplesThe Examples are intended to help you compare the cost of investing in the Portfolio with the cost of investing in other mutual funds.The Examples assume that you invest $10,000 in the Portfolio for the time periods indicated and then redeem all of your shares at theend of those periods. The Examples also assume that your investment has a 5% return each year and that the Portfolio’s operating ex-penses stay the same. Although your actual costs may be higher or lower, based on these assumptions your costs would be:
After 1 Year $ 87After 3 Years $ 271After 5 Years $ 471After 10 Years $1,049
Portfolio TurnoverThe Portfolio pays transaction costs, such as commissions, when it buys or sells securities (or “turns over” its portfolio). A higherportfolio turnover rate may indicate higher transaction costs. These transaction costs, which are not reflected in the Annual Portfo-lio Operating Expenses or in the Examples, affect the Portfolio’s performance. During the most recent fiscal year, the Portfolio’sportfolio turnover rate was 74% of the average value of its portfolio.
S-1
9
S-9

PRINCIPAL STRATEGIESThe Portfolio invests primarily in a diversified portfolio of equity securities of established companies selected from more than 40industries and more than 40 developed and emerging market countries. These countries currently include the developed nations inEurope and the Far East, Canada, Australia and emerging market countries worldwide. Under normal market conditions, the Port-folio invests significantly (at least 40%—unless market conditions are not deemed favorable by the Adviser) in securities of non-U.S. companies. In addition, the Portfolio invests, under normal circumstances, in the equity securities of companies located in atleast three countries.
The Portfolio invests in companies that are determined by the Adviser to be undervalued, using a fundamental value approach. Inselecting securities for the Portfolio’s portfolio, the Adviser uses its fundamental and quantitative research to identify companieswhose stocks are priced low in relation to their perceived long-term earnings power.
The Adviser’s fundamental analysis depends heavily upon its internal research staff. The research staff begins with a global researchuniverse of approximately 2,000 international and emerging market companies. Teams within the research staff cover a given in-dustry worldwide to better understand each company’s competitive position in a global context. The Adviser typically projects acompany’s financial performance over a full economic cycle, including a trough and a peak, within the context of forecasts for realeconomic growth, inflation and interest rate changes. The Adviser focuses on the valuation implied by the current price, relative tothe earnings the company will be generating five years from now, or “normalized” earnings, assuming average mid-economic cyclegrowth for the fifth year.
The Portfolio’s management team and other senior investment professionals work in close collaboration to weigh each investmentopportunity identified by the research staff relative to the entire portfolio and determine the timing and position size for purchasesand sales. Analysts remain responsible for monitoring new developments that would affect the securities they cover. The team willgenerally sell a security when it no longer meets appropriate valuation criteria, although sales may be delayed when positive returntrends are favorable.
Currencies can have a dramatic impact on equity returns, significantly adding to returns in some years and greatly diminishing themin others. The Adviser evaluates currency and equity positions separately and may seek to hedge the currency exposure resultingfrom securities positions when it finds the currency exposure unattractive. To hedge all or a portion of its currency risk, the Portfo-lio may, from time to time, invest in currency-related derivatives, including forward currency exchange contracts, futures contracts,options on futures contracts, swaps and options. The Adviser may also seek investment opportunities by taking long or short posi-tions in currencies through the use of currency-related derivatives.
The Portfolio may enter into other derivatives transactions, such as options, futures contracts, forwards and swaps. The Portfoliomay use options strategies involving the purchase and/or writing of various combinations of call and/or put options, including onindividual securities and stock indices, futures contracts (including futures contracts on individual securities and stock indices) orshares of exchange-traded funds, or ETFs. These transactions may be used, for example, to earn extra income, to adjust exposure toindividual securities or markets, or to protect all or a portion of the Portfolio’s portfolio from a decline in value, sometimes withincertain ranges.
The Portfolio may, at times, invest in shares of ETFs in lieu of making direct investments in equity securities. ETFs may providemore efficient and economical exposure to the type of companies and geographic locations in which the Portfolio seeks to investthan direct investments. The Portfolio may invest in depositary receipts, instruments of supranational entities denominated in thecurrency of any country, securities of multinational companies and “semi-governmental securities”, and enter into forwardcommitments.
PRINCIPAL RISKS• Market Risk: The value of the Portfolio’s assets will fluctuate as the stock or bond market fluctuates. The value of its investments
may decline, sometimes rapidly and unpredictably, simply because of economic changes or other events that affect large portions ofthe market. It includes the risk that a particular style of investing, such as value, may underperform the market generally.
• Foreign (Non-U.S.) Risk: Investments in securities of non-U.S. issuers may involve more risk than those of U.S. issuers.These securities may fluctuate more widely in price and may be less liquid due to adverse market, economic, political, regulatoryor other factors.
• Emerging Market Risk: Investments in emerging market countries may have more risk because the markets are less developedand less liquid, and because these investments may be subject to increased economic, political, regulatory or other uncertainties.
• Currency Risk: Fluctuations in currency exchange rates may negatively affect the value of the Portfolio’s investments or reduceits returns.
• Derivatives Risk: Derivatives may be illiquid, difficult to price, and leveraged so that small changes may produce dispropor-tionate losses for the Portfolio, and may be subject to counterparty risk to a greater degree than more traditional investments.
S-2
10
S-10

• Leverage Risk: When the Portfolio borrows money or otherwise leverages its portfolio, its net asset value may be more volatilebecause leverage tends to exaggerate the effect of changes in interest rates and any increase or decrease in the value of the Portfo-lio’s investments. The Portfolio may create leverage through the use of reverse repurchase agreements, forward commitments, orby borrowing money.
• Management Risk: The Portfolio is subject to management risk because it is an actively-managed investment fund. The Ad-viser will apply its investment techniques and risk analyses in making investment decisions for the Portfolio, but there is no guar-antee that its techniques will produce the intended results.
As with all investments, you may lose money by investing in the Portfolio.
BAR CHART AND PERFORMANCE INFORMATIONThe bar chart and performance information provide an indication of the historical risk of an investment in the Portfolio by showing:
• how the Portfolio’s performance changed from year to year over ten years; and
• how the Portfolio’s average annual returns for one, five and ten years compare to those of a broad-based securities market index.
The performance information does not take into account separate account charges. If separate account charges were included, aninvestor’s return would be lower. The Portfolio’s past performance, of course, does not necessarily indicate how it will perform inthe future.
Bar Chart
Calendar Year End (%)
15
08
09 10 12
11
1314
06 07
35.36
5.84-53.18
34.68
4.59 -19.25
14.5323.00
-6.21 2.59
During the period shown in the bar chart, the Portfolio’s:
Best Quarter was up 26.30%, 2nd quarter, 2009; and Worst Quarter was down -28.76%, 4th quarter, 2008.
Performance TableAverage Annual Total Returns(For the periods ended December 31, 2015)
1 Year 5 Years 10 Years
Portfolio 2.59% 1.82% 0.34%
MSCI EAFE Index (Net)(reflects no deduction for fees, expenses, or taxes, except the reinvestment of dividends net ofnon-U.S. withholding taxes) -0.81% 3.60% 3.03%
INVESTMENT ADVISERAllianceBernstein L.P. is the investment adviser for the Portfolio.
PORTFOLIO MANAGERSThe following table lists the persons responsible for day-to-day management of the Portfolio’s portfolio:
Employee Length of Service Title
Takeo Aso Since 2012 Senior Vice President of the Adviser
Avi Lavi Since 2012 Senior Vice President of the Adviser
Kevin F. Simms* Since 2001 Senior Vice President of the Adviser
* Effective June 30, 2016, Mr. Simms will be replaced by Tawhid Ali, Senior Vice President of the Adviser.
S-3
11
S-11

PURCHASE AND SALE OF PORTFOLIO SHARESThe Portfolio offers its shares through the separate accounts of participating life insurance companies (“Insurers”). You may onlypurchase and sell shares through these separate accounts. See the prospectus of the separate account of the Insurer for informationon the purchase and sale of the Portfolio shares.
TAX INFORMATIONThe Portfolio may pay income dividends or make capital gains distributions. The income and capital gains distributions are ex-pected to be made in shares of the Portfolio. See the prospectus of the separate account of the Insurer for federal income taxinformation.
PAYMENTS TO INSURERS AND OTHER FINANCIAL INTERMEDIARIESIf you purchase shares of the Portfolio through an Insurer or other financial intermediary, the Portfolio and its related companiesmay pay the intermediary for the sale of Portfolio shares and related services. These payments may create a conflict of interest byinfluencing the Insurer or other financial intermediary and your salesperson to recommend the Portfolio over another investment.Ask your salesperson or visit your financial intermediary’s website for more information.
Printed on recycledpaper containing postconsumer waste.
S-4
12
S-12

SUMMARY PROSPECTUS May 1, 2016
AB Variable Products Series Fund, Inc.Small Cap Growth Portfolio—Class A
Before you invest, you may want to review the Portfolio’s Prospectus, which contains more information about the Portfolio andits risks. The Portfolio’s Prospectus and Statement of Additional Information, both dated May 1, 2016, are incorporated by refer-ence into this Summary Prospectus. For free paper or electronic copies of the Portfolio’s Prospectus and other information aboutthe Portfolio, go to http://www.ABglobal.com/links/variable, email a request to [email protected], call (800) 227-4618,or ask any insurance company that offers shares of the Portfolio.
INVESTMENT OBJECTIVEThe Portfolio’s investment objective is long-term growth of capital.
FEES AND EXPENSES OF THE PORTFOLIOThis table describes the fees and expenses that you may pay if you buy and hold shares of the Portfolio. The operating expensesinformation below is designed to assist Contractholders of variable products that invest in the Portfolio in understanding the feesand expenses that they may pay as an investor. Because the information does not reflect deductions at the separate account level orcontract level for any charges that may be incurred under a contract, Contractholders that invest in the Portfolio should refer to thevariable contract prospectus for a description of fees and expenses that apply to Contractholders. Inclusion of these charges wouldincrease the fees and expenses provided below.
Shareholder Fees (fees paid directly from your investment)N/A
Annual Portfolio Operating Expenses (expenses that you pay each year as a percentage of the value of your investment)
Management Fees .75%Other Expenses:
Transfer Agent .01%Other Expenses .55%
Total Other Expenses .56%
Total Portfolio Operating Expenses 1.31%
ExamplesThe Examples are intended to help you compare the cost of investing in the Portfolio with the cost of investing in other mutualfunds. The Examples assume that you invest $10,000 in the Portfolio for the time periods indicated and then redeem all of yourshares at the end of those periods. The Examples also assume that your investment has a 5% return each year and that the Portfo-lio’s operating expenses stay the same. Although your actual costs may be higher or lower, based on these assumptions your costswould be:
After 1 Year $ 133After 3 Years $ 415After 5 Years $ 718After 10 Years $1,579
Portfolio TurnoverThe Portfolio pays transaction costs, such as commissions, when it buys or sells securities (or “turns over” its portfolio). A higherportfolio turnover rate may indicate higher transaction costs. These transaction costs, which are not reflected in the Annual Portfo-lio Operating Expenses or in the Examples, affect the Portfolio’s performance. During the most recent fiscal year, the Portfolio’sportfolio turnover rate was 72% of the average value of its portfolio.
S-1
13
S-13
PRINCIPAL STRATEGIESThe Portfolio invests primarily in a diversified portfolio of equity securities with relatively smaller capitalizations as compared to theoverall U.S. market. Under normal circumstances, the Portfolio invests at least 80% of its net assets in equity securities of smallercompanies. For these purposes, “smaller companies” are those that, at the time of investment, fall within the lowest 20% of the to-tal U.S. equity market capitalization (excluding, for purposes of this calculation, companies with market capitalizations of less than$10 million). As of December 31, 2015, there were approximately 4,300 smaller companies, and those smaller companies had mar-ket capitalizations ranging up to approximately $11.1 billion. Because the Portfolio’s definition of smaller companies is dynamic,the limits on market capitalization will change with the markets.
The Portfolio may invest in any company and industry and in any type of equity security with potential for capital appreciation. Itinvests in well-known and established companies and in new and less-seasoned companies. The Portfolio’s investment policiesemphasize investments in companies that are demonstrating improving financial results and a favorable earnings outlook. The Port-folio may invest in foreign securities.
When selecting securities, the Adviser typically looks for companies that have strong, experienced management teams, strong mar-ket positions, and the potential to support greater than expected earnings growth rates. In making specific investment decisions forthe Portfolio, the Adviser combines fundamental and quantitative analysis in its stock selection process. The Portfolio may periodi-cally invest in the securities of companies that are expected to appreciate due to a development particularly or uniquely applicableto that company regardless of general business conditions or movements of the market as a whole.
The Portfolio invests primarily in equity securities but may also invest in other types of securities, such as preferred stocks. ThePortfolio may, at times, invest in shares of exchange-traded funds, or ETFs, in lieu of making direct investments in securities. ETFsmay provide more efficient and economical exposure to the types of companies and geographic locations in which the Portfolioseeks to invest than direct investments. The Portfolio may also invest up to 20% of its total assets in rights or warrants.
The Portfolio may enter into derivatives transactions, such as options, futures contracts, forwards and swaps. The Portfolio may useoptions strategies involving the purchase and/or writing of various combinations of call and/or put options, including on individualsecurities and stock indices, futures contracts (including futures contracts on individual securities and stock indices) or shares ofETFs. These transactions may be used, for example, in an effort to earn extra income, to adjust exposure to individual securities ormarkets, or to protect all or a portion of the Portfolio’s portfolio from a decline in value, sometimes within certain ranges.
PRINCIPAL RISKS• Market Risk: The value of the Portfolio’s assets will fluctuate as the stock or bond market fluctuates. The value of its invest-
ments may decline, sometimes rapidly and unpredictably, simply because of economic changes or other events that affect largeportions of the market. It includes the risk that a particular style of investing, such as growth, may underperform the marketgenerally.
• Capitalization Risk: Investments in small- and mid-capitalization companies may be more volatile than investments in large-capitalization companies. Investments in small-capitalization companies may have additional risks because these companies havelimited product lines, markets or financial resources.
• Foreign (Non-U.S.) Risk: Investments in securities of non-U.S. issuers may involve more risk than those of U.S. issuers.These securities may fluctuate more widely in price and may be less liquid due to adverse market, economic, political, regulatoryor other factors.
• Derivatives Risk: Derivatives may be illiquid, difficult to price, and leveraged so that small changes may produce dispropor-tionate losses for the Portfolio, and may be subject to counterparty risk to a greater degree than more traditional investments.
• Management Risk: The Portfolio is subject to management risk because it is an actively-managed investment fund. The Ad-viser will apply its investment techniques and risk analyses in making investment decisions for the Portfolio, but there is no guar-antee that its techniques will produce the intended results.
As with all investments, you may lose money by investing in the Portfolio.
BAR CHART AND PERFORMANCE INFORMATIONThe bar chart and performance information provide an indication of the historical risk of an investment in the Portfolio by showing:
• how the Portfolio’s performance changed from year to year over ten years; and
• how the Portfolio’s average annual returns for one, five and ten years compare to those of a broad-based securities market index.
The performance information does not take into account separate account charges. If separate account charges were included, an invest-or’s return would be lower. The Portfolio’s past performance, of course, does not necessarily indicate how it will perform in the future.
S-2
14
S-14

Bar Chart
Calendar Year End (%)
15
08
09 10 121106 07 13 14
10.69 14.08
-45.54
41.76 36.90
4.4615.02
45.66
-1.81 -1.25
During the period shown in the bar chart, the Portfolio’s:
Best Quarter was up 20.66%, 2nd quarter, 2009; and Worst Quarter was down -29.52%, 4th quarter, 2008.
Performance TableAverage Annual Total Returns(For the periods ended December 31, 2015)
1 Year 5 Years 10 Years
Portfolio -1.25% 11.16% 8.52%
Russell 2000® Growth Index(reflects no deduction for fees, expenses, or taxes) -1.38% 10.67% 7.95%
INVESTMENT ADVISERAllianceBernstein L.P. is the investment adviser for the Portfolio.
PORTFOLIO MANAGERSThe following table lists the persons responsible for day-to-day management of the Portfolio’s portfolio:
Employee Length of Service Title
Bruce K. Aronow Since 2000 Senior Vice President of the Adviser
N. Kumar Kirpalani Since 2005 Senior Vice President of the Adviser
Samantha S. Lau Since 2005 Senior Vice President of the Adviser
Wen-Tse Tseng Since 2006 Senior Vice President of the Adviser
PURCHASE AND SALE OF PORTFOLIO SHARESThe Portfolio offers its shares through the separate accounts of participating life insurance companies (“Insurers”). You may onlypurchase and sell shares through these separate accounts. See the prospectus of the separate account of the Insurer for informationon the purchase and sale of the Portfolio shares.
TAX INFORMATIONThe Portfolio may pay income dividends or make capital gains distributions. The income and capital gains distributions are ex-pected to be made in shares of the Portfolio. See the prospectus of the separate account of the Insurer for federal income tax in-formation.
PAYMENTS TO INSURERS AND OTHER FINANCIAL INTERMEDIARIESIf you purchase shares of the Portfolio through an Insurer or other financial intermediary, the Portfolio and its related companiesmay pay the intermediary for the sale of Portfolio shares and related services. These payments may create a conflict of interest byinfluencing the Insurer or other financial intermediary and your salesperson to recommend the Portfolio over another investment.Ask your salesperson or visit your financial intermediary’s website for more information.
S-3
15
S-15

SUMMARY PROSPECTUS May 1, 2016
AB Variable Products Series Fund, Inc.Small/Mid Cap Value Portfolio—Class A
Before you invest, you may want to review the Portfolio’s Prospectus, which contains more information about the Portfolio andits risks. The Portfolio’s Prospectus and Statement of Additional Information, both dated May 1, 2016, are incorporated by refer-ence into this Summary Prospectus. For free paper or electronic copies of the Portfolio’s Prospectus and other information aboutthe Portfolio, go to http://www.ABglobal.com/links/variable, email a request to [email protected], call (800) 227-4618,or ask any insurance company that offers shares of the Portfolio.
INVESTMENT OBJECTIVEThe Portfolio’s investment objective is long-term growth of capital.
FEES AND EXPENSES OF THE PORTFOLIOThis table describes the fees and expenses that you may pay if you buy and hold shares of the Portfolio. The operating expensesinformation below is designed to assist Contractholders of variable products that invest in the Portfolio in understanding the feesand expenses that they may pay as an investor. Because the information does not reflect deductions at the separate account level orcontract level for any charges that may be incurred under a contract, Contractholders that invest in the Portfolio should refer to thevariable contract prospectus for a description of fees and expenses that apply to Contractholders. Inclusion of these charges wouldincrease the fees and expenses provided below.
Shareholder Fees (fees paid directly from your investment)N/A
Annual Portfolio Operating Expenses (expenses that you pay each year as a percentage of the value of your investment)
Management Fees .75%Other Expenses:
Transfer Agent .00%(a)Other Expenses .07%
Total Other Expenses .07%
Total Portfolio Operating Expenses .82%
(a) Less than .01%.
ExamplesThe Examples are intended to help you compare the cost of investing in the Portfolio with the cost of investing in other mutual funds.The Examples assume that you invest $10,000 in the Portfolio for the time periods indicated and then redeem all of your shares at theend of those periods. The Examples also assume that your investment has a 5% return each year and that the Portfolio’s operating ex-penses stay the same. Although your actual costs may be higher or lower, based on these assumptions your costs would be:
After 1 Year $ 84After 3 Years $ 262After 5 Years $ 455After 10 Years $1,014
Portfolio TurnoverThe Portfolio pays transaction costs, such as commissions, when it buys or sells securities (or “turns over” its portfolio). A higherportfolio turnover rate may indicate higher transaction costs. These transaction costs, which are not reflected in the Annual Portfo-lio Operating Expenses or in the Examples, affect the Portfolio’s performance. During the most recent fiscal year, the Portfolio’sportfolio turnover rate was 42% of the average value of its portfolio.
S-1
16
S-16

PRINCIPAL STRATEGIESThe Portfolio invests primarily in a diversified portfolio of equity securities of small- to mid-capitalization U.S. companies. Undernormal circumstances, the Portfolio invests at least 80% of its net assets in securities of small- to mid-capitalization companies. Forpurposes of this policy, small- to mid-capitalization companies are those that, at the time of investment, fall within the capital-ization range between the smallest company in the Russell 2500® Value Index and the greater of $5 billion or the market capital-ization of the largest company in the Russell 2500® Value Index.
Because the Portfolio’s definition of small- to mid-capitalization companies is dynamic, the lower and upper limits on market capi-talization will change with the markets. As of December 31, 2015, there were approximately 1,706 small- to mid-capitalizationcompanies, representing a market capitalization range from approximately $14.8 million to approximately $12.0 billion.
The Portfolio invests in companies that are determined by the Adviser to be undervalued, using the Adviser’s fundamental valueapproach. In selecting securities for the Portfolio’s portfolio, the Adviser uses its fundamental and quantitative research to identifycompanies whose long-term earnings power is not reflected in the current market price of their securities.
In selecting securities for the Portfolio’s portfolio, the Adviser looks for companies with attractive valuation (for example, with lowprice to book ratios) and compelling success factors (for example, momentum and return on equity). The Adviser then uses thisinformation to calculate an expected return. Returns and rankings are updated on a daily basis. The rankings are used to determineprospective candidates for further fundamental research and, subsequently, possible addition to the portfolio. Typically, the Ad-viser’s fundamental research analysts focus their research on the most attractive 20% of the universe.
The Adviser typically projects a company’s financial performance over a full economic cycle, including a trough and a peak, withinthe context of forecasts for real economic growth, inflation and interest rate changes. The Adviser focuses on the valuation impliedby the current price, relative to the earnings the company will be generating five years from now, or “normalized” earnings,assuming average mid-economic cycle growth for the fifth year.
The Portfolio’s management team and other senior investment professionals work in close collaboration to weigh each investmentopportunity identified by the research staff relative to the entire portfolio and determine the timing and position size for purchasesand sales. Analysts remain responsible for monitoring new developments that would affect the securities they cover. The team willgenerally sell a security when it no longer meets appropriate valuation criteria, although sales may be delayed when positive returntrends are favorable. Typically, growth in the size of a company’s market capitalization relative to other domestically tradedcompanies will not cause the Portfolio to dispose of the security.
The Adviser seeks to manage overall portfolio volatility relative to the universe of companies that comprise the lowest 20% of thetotal U.S. market capitalization by favoring promising securities that offer the best balance between return and targeted risk. Attimes, the Portfolio may favor or disfavor a particular sector compared to that universe of companies. The Portfolio may invest sig-nificantly in companies involved in certain sectors that constitute a material portion of the universe of small- and mid-capitalizationcompanies, such as financial services and consumer services.
The Portfolio may enter into derivatives transactions, such as options, futures contracts, forwards and swaps. The Portfolio may useoptions strategies involving the purchase and/or writing of various combinations of call and/or put options, including on individualsecurities and stock indices, futures contracts (including futures contracts on individual securities and stock indices) or shares ofexchange-traded funds, or ETFs. These transactions may be used, for example, to earn extra income, to adjust exposure to in-dividual securities or markets, or to protect all or a portion of the Portfolio’s portfolio from a decline in value, sometimes withincertain ranges.
The Portfolio may invest in securities issued by non-U.S. companies.
The Portfolio may, at times, invest in shares of ETFs in lieu of making direct investments in equity securities. ETFs may providemore efficient and economical exposure to the types of companies and geographic locations in which the Portfolio seeks to investthan direct investments.
PRINCIPAL RISKS• Market Risk: The value of the Portfolio’s assets will fluctuate as the stock or bond market fluctuates. The value of its investments
may decline, sometimes rapidly and unpredictably, simply because of economic changes or other events that affect large portions ofthe market. It includes the risk that a particular style of investing, such as value, may underperform the market generally.
• Capitalization Risk: Investments in small- and mid-capitalization companies may be more volatile than investments in large-capitalization companies. Investments in small-capitalization companies may have additional risks because these companies havelimited product lines, markets or financial resources.
• Foreign (Non-U.S.) Risk: Investments in securities of non-U.S. issuers may involve more risk than those of U.S. issuers.These securities may fluctuate more widely in price and may be less liquid due to adverse market, economic, political, regulatoryor other factors.
S-2
17
S-17

• Currency Risk: Fluctuations in currency exchange rates may negatively affect the value of the Portfolio’s investments or reduceits returns.
• Derivatives Risk: Derivatives may be illiquid, difficult to price, and leveraged so that small changes may produce dispropor-tionate losses for the Portfolio, and may be subject to counterparty risk to a greater degree than more traditional investments.
• Management Risk: The Portfolio is subject to management risk because it is an actively-managed investment fund. TheAdviser will apply its investment techniques and risk analyses in making investment decisions for the Portfolio, but there is noguarantee that its techniques will produce the intended results.
As with all investments, you may lose money by investing in the Portfolio.
BAR CHART AND PERFORMANCE INFORMATIONThe bar chart and performance information provide an indication of the historical risk of an investment in the Portfolio by show-ing:
• how the Portfolio’s performance changed from year to year over ten years; and
• how the Portfolio’s average annual returns for one, five and ten years compare to those of a broad-based securities market index.
The performance information does not take into account separate account charges. If separate account charges were included, aninvestor’s return would be lower. The Portfolio’s past performance, of course, does not necessarily indicate how it will perform inthe future.
Bar Chart
Calendar Year End (%)08
09 10 1211
1306 07 1415
14.42
1.71 -35.58
42.86
26.91
-8.39
18.75
38.06
9.20-5.49
During the period shown in the bar chart, the Portfolio’s:
Best Quarter was up 24.75%, 3rd quarter, 2009; and Worst Quarter was down -26.95%, 4th quarter, 2008.
Performance TableAverage Annual Total Returns(For the periods ended December 31, 2015)
1 Year 5 Years 10 Years
Portfolio -5.49% 9.16% 7.74%
Russell 2500® Value Index(reflects no deduction for fees, expenses, or taxes) -5.49% 9.23% 6.51%
Russell 2500TM Index*(reflects no deduction for fees, expenses, or taxes) -2.90% 10.32% 7.56%
* The performance table includes an additional index that shows how the Portfolio’s performance compares with an index of securities similar to those in which the Portfolio invests.
INVESTMENT ADVISERAllianceBernstein L.P. is the investment adviser for the Portfolio.
PORTFOLIO MANAGERSThe following table lists the persons responsible for day-to-day management of the Portfolio’s portfolio:
Employee Length of Service Title
James W. MacGregor Since 2005 Senior Vice President of the Adviser
Joseph G. Paul Since 2002 Senior Vice President of the Adviser
Shri Singhvi Since 2014 Senior Vice President of the Adviser
S-3
18
S-18

PURCHASE AND SALE OF PORTFOLIO SHARESThe Portfolio offers its shares through the separate accounts of participating life insurance companies (“Insurers”). You may onlypurchase and sell shares through these separate accounts. See the prospectus of the separate account of the Insurer for informationon the purchase and sale of the Portfolio shares.
TAX INFORMATIONThe Portfolio may pay income dividends or make capital gains distributions. The income and capital gains distributions are ex-pected to be made in shares of the Portfolio. See the prospectus of the separate account of the Insurer for federal income taxinformation.
PAYMENTS TO INSURERS AND OTHER FINANCIAL INTERMEDIARIESIf you purchase shares of the Portfolio through an Insurer or other financial intermediary, the Portfolio and its related companiesmay pay the intermediary for the sale of Portfolio shares and related services. These payments may create a conflict of interest byinfluencing the Insurer or other financial intermediary and your salesperson to recommend the Portfolio over another investment.Ask your salesperson or visit your financial intermediary’s website for more information.
Printed on recycledpaper containing postconsumer waste.
S-4
19
S-19
Summary Prospectus May 1, 2016 American Century Investments®
VP Capital Appreciation Fund Class I: AVCIXClass II: AVCWX
Before you invest, you may want to review the fund’s prospectus, which contains more information about the fund and itsrisks. You can find the fund’s prospectus and other information about the fund online at the web addresses listed below.You can also get this information at no cost by calling or sending an email request. The fund’s prospectus and otherinformation are also available from insurance companies through which shares of the fund may be purchased or sold.
Retail Investorsamericancentury.com/funds/vp_fund_reports.jsp1-800-378-9878 or [email protected]
Financial Professionalsamericancentury.com/ipro/funds/fund_reports_vp.jsp1-800-345-6488advisor_prospectus@americancentury.com
This summary prospectus incorporates by reference the fund’s prospectus and statement of additional information (SAI),each dated May 1, 2016 (as supplemented at the time you receive this summary prospectus), as well as the Report ofIndependent Registered Public Accounting Firm and the financial statements included in the fund’s annual report toshareholders, dated December 31, 2015. The fund’s SAI and annual report may be obtained, free of charge, in the samemanner as the prospectus.
Investment ObjectiveThis fund seeks capital growth.
Fees and ExpensesThe following table describes the fees and expenses you may pay if you buy and hold shares of the fund. The table does not include the fees and expenses associated with your variable annuity or variable life insurance contract. Had they been included, fees and expenses presented below would have been higher. For information regarding the fees and expenses associated with your variable annuity or variable life insurance contract, please refer to your insurance product prospectus.
Annual Fund Operating Expenses (expenses that you pay each year as a percentage of the value of your investment) Class I Class IIManagement Fee 1.00% 0.90%Distribution and Service (12b-1) Fees None 0.25%Other Expenses 0.00% 0.00%Total Annual Fund Operating Expenses 1.00% 1.15%Fee Waiver1 0.01% 0.01%Total Annual Fund Operating Expenses After Waiver 0.99% 1.14%
1 The advisor has agreed to waive 0.01 percentage points of the fund’s management fee. The advisor expects this waiver to continue until April 30, 2017 and cannot terminate it prior to such date without the approval of the Board of Directors.
ExampleThe example below is intended to help you compare the costs of investing in the fund with the costs of investing in other mutual funds. The example does not include fees and expenses associated with your variable annuity or variable life insurance contract. Had they been included, fees and expenses would have been higher. The example assumes that you invest $10,000 in the fund for the time periods indicated and then redeem all of your shares at the end of those periods and that you earn a 5% return each year. The example also assumes that the fund’s operating expenses remain the same, except that it reflects the rate and duration of any fee waivers noted in the table above. Although your actual costs may be higher or lower, based on these assumptions your costs would be:
1 year 3 years 5 years 10 yearsClass I $101 $318 $552 $1,224Class II $116 $365 $633 $1,396
20
S-20
Portfolio Turnover The fund pays transaction costs, such as commissions, when it buys and sells securities (or “turns over” its portfolio). A higher portfolio turnover rate may indicate higher transaction costs. These costs, which are not reflected in annual fund operating expenses or in the example, affect the fund’s performance. During the most recent fiscal year, the fund’s portfolio turnover rate was 72% of the average value of its portfolio.
Principal Investment StrategiesThe portfolio managers look for stocks of medium-sized and smaller companies they believe will increase in value over time, using an investment strategy developed by the fund’s investment advisor. In implementing this strategy, the portfolio managers make their investment decisions based primarily on their analysis of individual companies, rather than on broad economic forecasts. Management of the fund is based on the belief that, over the long term, stock price movements follow growth in earnings and revenues. The portfolio managers’ principal analytical technique involves the identification of companies with earnings and revenues that are not only growing, but growing at an accelerating pace. This includes companies whose growth rates, although still negative, are less negative than prior periods, and companies whose growth rates are expected to accelerate. In addition to accelerating growth, the fund also considers companies demonstrating price strength relative to their peers. This means that the portfolio managers favor companies whose securities are the strongest performers compared to the overall market. These techniques help the portfolio managers buy or hold the stocks of companies they believe have favorable growth prospects and sell the stocks of companies whose characteristics no longer meet their criteria.The fund will usually purchase common stocks of companies that are medium-sized and smaller at the time of purchase, but it will purchase securities of larger-sized companies as well.Also, although the portfolio managers intend to invest the fund’s assets primarily in U.S. securities, the fund may invest in securities of foreign companies when these securities meet the portfolio managers’ standards’ of selection.
Principal Risks• Growth Stocks – Investments in growth stocks may be more volatile than other stocks and the overall stock market. These stocks
are typically priced higher than other stocks because of their growth potential, which may or may not be realized.• Mid Cap Stocks – The fund invests in mid-sized and smaller companies, which may be more volatile and subject to greater risk
than larger companies. Smaller companies may have limited financial resources, product lines and markets, and their securities may trade less frequently and in more limited volumes than the securities of larger companies, which could lead to higher transaction costs.
• Style Risk – If at any time the market is not favoring the fund’s growth investment style, the fund’s gains may not be as big as, or its losses may be bigger than, those of other equity funds using different investment styles.
• Foreign Securities – The fund may invest in foreign securities, which can be riskier than investing in U.S. securities. Securities of foreign issuers may be less liquid, more volatile and harder to value than U.S. securities.
• Price Volatility – The value of the fund’s shares may fluctuate significantly in the short term.• Market Risk – The value of the fund’s shares will go up and down based on the performance of the companies whose securities it
owns and other factors generally affecting the securities market.• Redemption Risk –The fund may need to sell securities at times it would not otherwise do so in order to meet shareholder
redemption requests. Selling securities to meet such redemptions may cause the fund to experience a loss or increase the fund’s transaction costs. To the extent that an insurance company has a large position in the fund, the fund may experience relatively large redemptions if such insurance company reallocates its assets.
• Principal Loss – At any given time your shares may be worth less than the price you paid for them. In other words, it is possible to lose money by investing in the fund.
An investment in the fund is not a bank deposit, and it is not insured or guaranteed by the Federal Deposit Insurance Corporation (FDIC) or any other government agency.
Fund PerformanceThe following bar chart and table provide some indication of the risks of investing in the fund. The bar chart shows changes in the fund’s performance from year to year for Class I shares. The table shows how the fund’s average annual returns for the periods shown compared with those of a broad measure of market performance. Fees associated with your variable annuity or variable life insurance contract are not reflected in the chart or table below. Had they been included, returns presented below would have been lower. The fund’s past performance is not necessarily an indication of how the fund will perform in the future.
21
S-21

Calendar Year Total Returns
Highest Performance Quarter (3Q 2010): 18.43% Lowest Performance Quarter (4Q 2008): -26.62%
Average Annual Total Returns For the calendar year ended December 31, 2015 1 year 5 years 10 years Inception DateClass I 1.93% 9.37% 9.98% 11/20/1987Class II 1.73% 9.20%¹ 9.81%¹ 04/25/2014Russell Midcap® Growth Index (reflects no deduction for fees, expenses or taxes) -0.20% 11.53% 8.16% —
1 Historical performance for Class II prior to its inception is based on the performance of Class I shares. Class II performance has been adjusted to reflect differences in expenses between classes.
Portfolio ManagementInvestment Advisor American Century Investment Management, Inc.
Portfolio Managers David M. Hollond, Chief Investment Officer, U.S. Growth Equity – Mid & Small Cap, Senior Vice President and Senior Portfolio Manager, has been a member of the team that manages the fund since 2007.Greg Walsh, Vice President and Portfolio Manager, has been a member of the team that manages the fund since 2003.Nalin Yogasundram, Portfolio Manager, has been a member of the team that manages the fund since 2013.
Purchase and Sale of Fund SharesThe fund only offers shares through insurance company separate accounts. For instructions on how to purchase and redeem shares through your separate account, read the prospectus provided by your insurance company. Orders for fund shares will be priced at the net asset value next determined after the order is received in the form required by the agreement between the fund, its investment advisor and/or its distributor and the insurance company from which you have purchased your separate account. There are no sales commissions or redemption charges. However, certain sales or deferred sales charges and other charges may apply to the variable annuity or life insurance contracts. Those charges are disclosed in the separate account prospectus.
Tax InformationConsult the prospectus of your insurance company separate account for a discussion of the tax status of your variable contract.
Payments to Broker-Dealers and Other Financial IntermediariesThe fund is offered as an underlying investment option for variable annuity or life insurance contracts. The fund and its related companies pay the sponsoring insurance company and its related companies for distribution and other services. These payments may influence the insurance company to include the fund over another investment as an option in its products. Ask your salesperson or visit your insurance company’s website for more information.
22
S-22

©2016 American Century Proprietary Holdings, Inc. All rights reserved.CL-SUM-88359 1605
23
S-23

Summary Prospectus May 1, 2016 American Century Investments®
VP Income & Growth Fund Class I: AVGIXClass II: AVPGX
Before you invest, you may want to review the fund’s prospectus, which contains more information about the fund and itsrisks. You can find the fund’s prospectus and other information about the fund online at the web addresses listed below.You can also get this information at no cost by calling or sending an email request. The fund’s prospectus and otherinformation are also available from insurance companies through which shares of the fund may be purchased or sold.
Retail Investorsamericancentury.com/funds/vp_fund_reports.jsp1-800-378-9878 or [email protected]
Financial Professionalsamericancentury.com/ipro/funds/fund_reports_vp.jsp1-800-345-6488advisor_prospectus@americancentury.com
This summary prospectus incorporates by reference the fund’s prospectus and statement of additional information (SAI),each dated May 1, 2016 (as supplemented at the time you receive this summary prospectus), as well as the Report ofIndependent Registered Public Accounting Firm and the financial statements included in the fund’s annual report toshareholders, dated December 31, 2015. The fund's SAI and annual report may be obtained, free of charge, in the samemanner as the prospectus.
Investment ObjectiveThe fund seeks capital growth by investing in common stocks. Income is a secondary objective.
Fees and ExpensesThe following table describes the fees and expenses you may pay if you buy and hold shares of the fund. The table does not include the fees and expenses associated with your variable annuity or variable life insurance contract. Had they been included, fees and expenses presented below would have been higher. For information regarding the fees and expenses associated with your variable annuity or variable life insurance contract, please refer to your insurance product prospectus.
Annual Fund Operating Expenses (expenses that you pay each year as a percentage of the value of your investment) Class I Class IIManagement Fee 0.70% 0.70%Distribution and Service (12b-1) Fees None 0.25%Other Expenses 0.00% 0.00%Total Annual Fund Operating Expenses 0.70% 0.95%
Example The example below is intended to help you compare the costs of investing in the fund with the costs of investing in other mutual funds. The example does not include fees and expenses associated with your variable annuity or variable life insurance contract. Had they been included, fees and expenses would have been higher. The example assumes that you invest $10,000 in the fund for the time periods indicated and then redeem all of your shares at the end of those periods, that you earn a 5% return each year, and that the fund’s operating expenses remain the same. Although your actual costs may be higher or lower, based on these assumptions your costs would be:
1 year 3 years 5 years 10 yearsClass I $72 $224 $390 $871Class II $97 $303 $526 $1,166
Portfolio Turnover The fund pays transaction costs, such as commissions, when it buys and sells securities (or “turns over” its portfolio). A higher portfolio turnover rate may indicate higher transaction costs. These costs, which are not reflected in annual fund operating expenses or in the example, affect the fund’s performance. During the most recent fiscal year, the fund’s portfolio turnover rate was 88% of the average value of its portfolio.
24
S-24

Principal Investment StrategiesIn selecting stocks for the fund, the portfolio managers use quantitative management techniques in a two-step process. First, the managers rank stocks, primarily large capitalization, publicly-traded U.S. companies with a market capitalization greater than $2 billion, from most attractive to least attractive based on an objective set of measures, including valuation, quality, growth and sentiment (with a tilt towards valuation). Second, the portfolio managers use a quantitative model to build a portfolio of stocks from the ranking described above that they believe will provide the optimal balance between risk and expected return. The portfolio managers also attempt to create a dividend yield that will be greater than that of the S&P 500® Index.The portfolio managers generally sell a stock when they believe it has become less attractive relative to other opportunities, its risk characteristics outweigh its return opportunity or specific events alter its prospects.
Principal Risks• Style Risk – If at any time the market is not favoring the fund’s quantitative investment style, the fund’s gains may not be as big as,
or its losses may be bigger than, those of other equity funds using different investment styles.• Investment Process Risk – Stocks selected by the portfolio managers using quantitative models may perform differently than
expected due to the portfolio managers’ judgments regarding the factors used in the models, the weight placed on each factor, changes from the factors’ historical trends, and technical issues with the construction and implementation of the models (including, for example, data problems and/or software or other implementation issues). There is no guarantee that the use of the quantitative model will result in effective investment decisions for the fund. Additionally, the commonality of portfolio holdings across quantitative investment managers may amplify losses.
• Benchmark Correlation – The fund’s performance will be tied to the performance of its benchmark, the S&P 500® Index. If the fund’s benchmark goes down, it is likely that the fund’s performance will go down.
• Low Dividend Yield – Although income is a secondary objective of the fund, if the stocks that make up the S&P 500® Index do not have a high dividend yield, then the fund’s dividend yield will not be high.
• Market Risk – The value of the fund’s shares will go up and down based on the performance of the companies whose securities it owns and other factors generally affecting the securities market.
• Price Volatility – The value of the fund’s shares may fluctuate significantly in the short term.• Redemption Risk –The fund may need to sell securities at times it would not otherwise do so in order to meet shareholder
redemption requests. Selling securities to meet such redemptions may cause the fund to experience a loss or increase the fund’s transaction costs. To the extent that an insurance company has a large position in the fund, the fund may experience relatively large redemptions if such insurance company reallocates its assets.
• Principal Loss – At any given time your shares may be worth less than the price you paid for them. In other words, it is possible to lose money by investing in the fund.
An investment in the fund is not a bank deposit, and it is not insured or guaranteed by the Federal Deposit Insurance Corporation (FDIC) or any other government agency.
Fund PerformanceThe following bar chart and table provide some indication of the risks of investing in the fund. The bar chart shows changes in the fund’s performance from year to year for Class I shares. The table shows how the fund’s average annual returns for the periods shown compared with those of a broad measure of market performance. Fees associated with your variable annuity or variable life insurance contract are not reflected in the chart or table below. Had they been included, returns presented below would have been lower. The fund’s past performance is not necessarily an indication of how the fund will perform in the future.
25
S-25

Calendar Year Total Returns
Highest Performance Quarter (2Q 2009): 15.39% Lowest Performance Quarter (4Q 2008): -19.80%
Average Annual Total Returns For the calendar year ended December 31, 2015 1 year 5 years 10 yearsClass I -5.62% 11.27% 5.82%Class II -5.95% 10.99% 5.54%S&P 500® Index (reflects no deduction for fees, expenses or taxes)
1.38% 12.56% 7.30%
Portfolio ManagementInvestment Advisor American Century Investment Management, Inc.
Portfolio Managers Brian L. Garbe, Vice President and Senior Portfolio Manager, has been a member of the team that manages the fund since 2010.Claudia Musat, Vice President, Portfolio Manager and Quantitative Analyst, has been a member of the team that manages the fund since 2010.
Purchase and Sale of Fund SharesThe fund only offers shares through insurance company separate accounts. For instructions on how to purchase and redeem shares through your separate account, read the prospectus provided by your insurance company. Orders for fund shares will be priced at the net asset value next determined after the order is received in the form required by the agreement between the fund, its investment advisor and/or its distributor and the insurance company from which you have purchased your separate account. There are no sales commissions or redemption charges. However, certain sales or deferred sales charges and other charges may apply to the variable annuity or life insurance contracts. Those charges are disclosed in the separate account prospectus.
Tax InformationConsult the prospectus of your insurance company separate account for a discussion of the tax status of your variable contract.
Payments to Broker-Dealers and Other Financial IntermediariesThe fund is offered as an underlying investment option for variable annuity or life insurance contracts. The fund and its related companies pay the sponsoring insurance company and its related companies for distribution and other services. These payments may influence the insurance company to include the fund over another investment as an option in its products. Ask your salesperson or visit your insurance company’s website for more information.
26
S-26

©2016 American Century Proprietary Holdings, Inc. All rights reserved.CL-SUM-88363 1605
27
S-27

Summary Prospectus May 1, 2016 American Century Investments®
VP International Fund Class I: AVIIX Class II: ANVPX
Before you invest, you may want to review the fund’s prospectus, which contains more information about the fund and itsrisks. You can find the fund’s prospectus and other information about the fund online at the web addresses listed below.You can also get this information at no cost by calling or sending an email request. The fund’s prospectus and otherinformation are also available from insurance companies through which shares of the fund may be purchased or sold.
Retail Investorsamericancentury.com/funds/vp_fund_reports.jsp1-800-378-9878 or [email protected]
Financial Professionalsamericancentury.com/ipro/funds/fund_reports_vp.jsp1-800-345-6488advisor_prospectus@americancentury.com
This summary prospectus incorporates by reference the fund’s prospectus and statement of additional information (SAI),each dated May 1, 2016 (as supplemented at the time you receive this summary prospectus), as well as the Report ofIndependent Registered Public Accounting Firm and the financial statements included in the fund’s annual report toshareholders, dated December 31, 2015. The fund’s SAI and annual report may be obtained, free of charge, in the samemanner as the prospectus.
Investment ObjectiveThe fund seeks capital growth.
Fees and ExpensesThe following table describes the fees and expenses you may pay if you buy and hold shares of the fund. The table does not include the fees and expenses associated with your variable annuity or variable life insurance contract. Had they been included, fees and expenses presented below would have been higher. For information regarding the fees and expenses associated with your variable annuity or variable life insurance contract, please refer to your insurance product prospectus.
Annual Fund Operating Expenses (expenses that you pay each year as a percentage of the value of your investment) Class I Class IIManagement Fee 1.31% 1.21%Distribution and Service (12b-1) Fees None 0.25%Other Expenses 0.02% 0.02%Total Annual Fund Operating Expenses 1.33% 1.48%Fee Waiver1 0.31% 0.31%Total Annual Fund Operating Expenses After Waiver 1.02% 1.17%
1 The advisor has agreed to waive 0.31 percentage points of the fund’s management fee. The advisor expects this waiver to continue until April 30, 2017 and cannot terminate it prior to such date without the approval of the Board of Directors.
ExampleThe example below is intended to help you compare the costs of investing in the fund with the costs of investing in other mutual funds. The example does not include fees and expenses associated with your variable annuity or variable life insurance contract. Had they been included, fees and expenses would have been higher. The example assumes that you invest $10,000 in the fund for the time periods indicated and then redeem all of your shares at the end of those periods and that you earn a 5% return each year. The example also assumes that the fund’s operating expenses remain the same, except that it reflects the rate and duration of any fee waivers noted in the table above. Although your actual costs may be higher or lower, based on these assumptions your costs would be:
1 year 3 years 5 years 10 yearsClass I $104 $392 $700 $1,574Class II $119 $438 $779 $1,741
28
S-28

Portfolio TurnoverThe fund pays transaction costs, such as commissions, when it buys and sells securities (or “turns over” its portfolio). A higher portfolio turnover rate may indicate higher transaction costs. These costs, which are not reflected in annual fund operating expenses or in the example, affect the fund’s performance. During the most recent fiscal year, the fund’s portfolio turnover rate was 59% of the average value of its portfolio.
Principal Investment StrategiesThe fund invests primarily in securities of companies located in at least three developed countries world-wide (excluding the United States). The portfolio managers look for stocks of companies they believe will increase in value over time, using an investment strategy developed by the fund’s investment advisor. In implementing this strategy, the portfolio managers make their investment decisions based primarily on their analysis of individual companies, rather than on broad economic forecasts. Management of the fund is based on the belief that, over the long term, stock price movements follow growth in earnings, revenues and/or cash flow. The portfolio managers use a variety of analytical research tools and techniques to help them buy and hold the stocks of companies that meet their investment criteria and sell the stocks of companies that do not. Under normal market conditions, the fund’s portfolio managers seek securities of companies whose earnings, revenues or key business fundamentals are not only growing, but growing at an accelerating pace.
Principal Risks• Foreign Risk – Foreign securities are generally riskier than U.S. securities. Political events (such as civil unrest, national elections
and imposition of exchange controls), social and economic events (such as labor strikes and rising inflation), and natural disasters occurring in a country where the fund invests could cause the fund’s investments in that country to experience gains or losses. Securities of foreign issuers may be less liquid, more volatile and harder to value than U.S. securities.
• Currency Risk – The fund could experience gains or losses based solely on changes in the exchange rate between foreign currencies and the U.S. dollar.
• Emerging Market Risk – Investing in emerging market countries generally is riskier than investing in foreign developed countries. Emerging market countries may have unstable governments, economies that are subject to sudden change, and significant volatility in their financial markets. These countries also may lack the legal, business and social framework to support securities markets.
• Growth Stocks – Investments in growth stocks may be more volatile than other stocks and the overall stock market. These stocks are typically priced higher than other stocks because of their growth potential, which may or may not be realized.
• Style Risk – If at any time the market is not favoring the fund’s growth investment style, the fund’s gains may not be as big as, or its losses may be bigger than, those of other equity funds using different investment styles.
• Market Risk – The value of the fund’s shares will go up and down based on the performance of the companies whose securities it owns and other factors generally affecting the securities market.
• Price Volatility – The value of the fund’s shares may fluctuate significantly in the short term.• Redemption Risk – The fund may need to sell securities at times it would not otherwise do so in order to meet shareholder
redemption requests. Selling securities to meet such redemptions may cause the fund to experience a loss or increase the fund’s transaction costs. To the extent that an insurance company has a large position in the fund, the fund may experience relatively large redemptions if such insurance company reallocates its assets.
• Principal Loss – At any given time your shares may be worth less than the price you paid for them. In other words, it is possible to lose money by investing in the fund.
An investment in the fund is not a bank deposit, and it is not insured or guaranteed by the Federal Deposit Insurance Corporation (FDIC) or any other government agency.
29
S-29
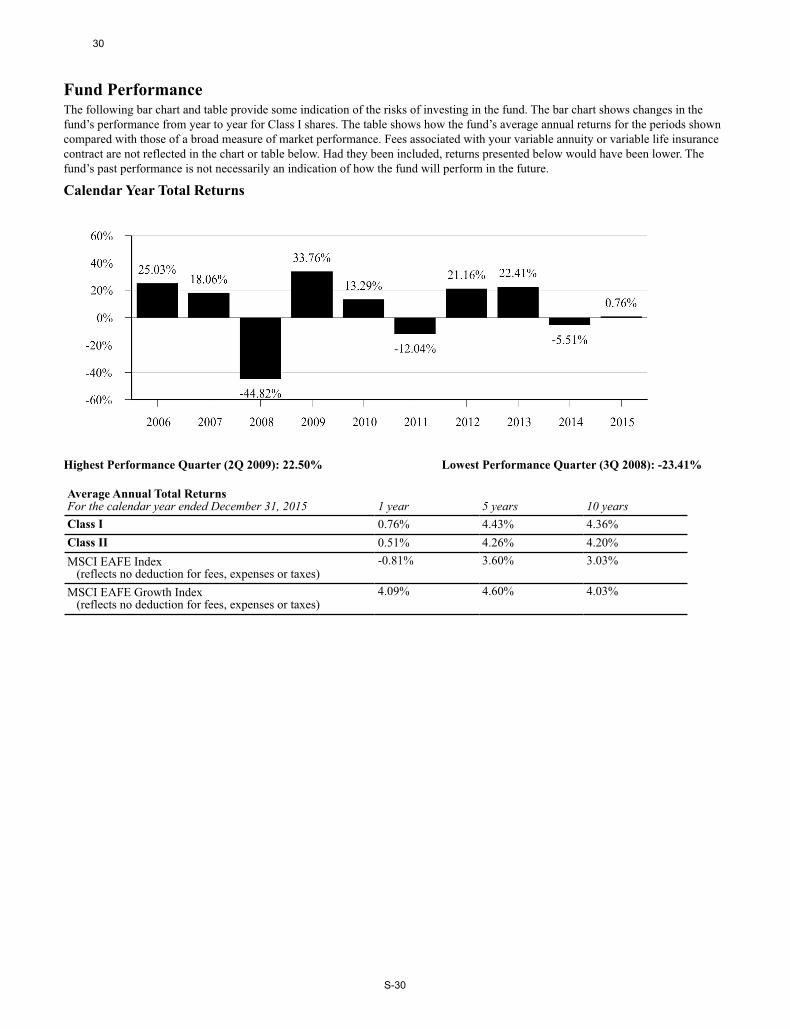
Fund PerformanceThe following bar chart and table provide some indication of the risks of investing in the fund. The bar chart shows changes in the fund’s performance from year to year for Class I shares. The table shows how the fund’s average annual returns for the periods shown compared with those of a broad measure of market performance. Fees associated with your variable annuity or variable life insurance contract are not reflected in the chart or table below. Had they been included, returns presented below would have been lower. The fund’s past performance is not necessarily an indication of how the fund will perform in the future.
Calendar Year Total Returns
Highest Performance Quarter (2Q 2009): 22.50% Lowest Performance Quarter (3Q 2008): -23.41%
Average Annual Total ReturnsFor the calendar year ended December 31, 2015 1 year 5 years 10 yearsClass I 0.76% 4.43% 4.36%Class II 0.51% 4.26% 4.20%MSCI EAFE Index (reflects no deduction for fees, expenses or taxes)
-0.81% 3.60% 3.03%
MSCI EAFE Growth Index (reflects no deduction for fees, expenses or taxes)
4.09% 4.60% 4.03%
30
S-30

Portfolio ManagementInvestment AdvisorAmerican Century Investment Management, Inc.
Portfolio ManagersRajesh Gandhi, CFA, Vice President and Senior Portfolio Manager, has been a member of the team that manages the fund since 2002.James G. Gendelman, Vice President and Portfolio Manager, has been a member of the team that manages the fund since 2015.
Purchase and Sale of Fund SharesThe fund only offers shares through insurance company separate accounts. For instructions on how to purchase and redeem shares through your separate account, read the prospectus provided by your insurance company. Orders for fund shares will be priced at the net asset value next determined after the order is received in the form required by the agreement between the fund, its investment advisor and/or its distributor and the insurance company from which you have purchased your separate account. There are no sales commissions or redemption charges. However, certain sales or deferred sales charges and other charges may apply to the variable annuity or life insurance contracts. Those charges are disclosed in the separate account prospectus.
Tax InformationConsult the prospectus of your insurance company separate account for a discussion of the tax status of your variable contract.
Payments to Broker-Dealers and Other Financial IntermediariesThe fund is offered as an underlying investment option for variable annuity or life insurance contracts. The fund and its related companies pay the sponsoring insurance company and its related companies for distribution and other services. These payments may influence the insurance company to include the fund over another investment as an option in its products. Ask your salesperson or visit your insurance company’s website for more information.
©2016 American Century Proprietary Holdings, Inc. All rights reserved.CL-SUM-88367 1605
31
S-31

Summary Prospectus May 1, 2016 American Century Investments®
VP Mid Cap Value Fund Class I: AVIPXClass II: AVMTX
Before you invest, you may want to review the fund’s prospectus, which contains more information about the fund and itsrisks. You can find the fund’s prospectus and other information about the fund online at the web addresses listed below.You can also get this information at no cost by calling or sending an email request. The fund’s prospectus and otherinformation are also available from insurance companies through which shares of the fund may be purchased or sold.
Retail Investorsamericancentury.com/funds/vp_fund_reports.jsp1-800-378-9878 or [email protected]
Financial Professionalsamericancentury.com/ipro/funds/fund_reports_vp.jsp1-800-345-6488advisor_prospectus@americancentury.com
This summary prospectus incorporates by reference the fund’s prospectus and statement of additional information (SAI),each dated May 1, 2016 (as supplemented at the time you receive this summary prospectus), as well as the Report ofIndependent Registered Public Accounting Firm and the financial statements included in the fund’s annual report toshareholders, dated December 31, 2015. The fund's SAI and annual report may be obtained, free of charge, in the samemanner as the prospectus.
Investment ObjectiveThe fund seeks long-term capital growth. Income is a secondary objective.
Fees and ExpensesThe following table describes the fees and expenses you may pay if you buy and hold shares of the fund. The table does not include the fees and expenses associated with your variable annuity or variable life insurance contract. Had they been included, fees and expenses presented below would have been higher. For information regarding the fees and expenses associated with your variable annuity or variable life insurance contract, please refer to your insurance product prospectus.
Annual Fund Operating Expenses (expenses that you pay each year as a percentage of the value of your investment) Class I Class IIManagement Fee 1.00% 0.90%Distribution and Service (12b-1) Fees None 0.25%Other Expenses 0.01% 0.01%Total Annual Fund Operating Expenses 1.01% 1.16%Fee Waiver1 0.12% 0.12%Total Annual Fund Operating Expenses After Waiver 0.89% 1.04%
1 The advisor has agreed to waive 0.12 percentage points of the fund’s management fee. The advisor expects this waiver to continue until April 30, 2017 and cannot terminate it prior to such date without the approval of the Board of Directors.
Example The example below is intended to help you compare the costs of investing in the fund with the costs of investing in other mutual funds. The example does not include fees and expenses associated with your variable annuity or variable life insurance contract. Had they been included, fees and expenses would have been higher. The example assumes that you invest $10,000 in the fund for the time periods indicated and then redeem all of your shares at the end of those periods, and that you earn a 5% return each year. The example also assumes that the fund’s operating expenses remain the same, except that it reflects the rate and duration of any fee waivers noted in the table above. Although your actual costs may be higher or lower, based on these assumptions your costs would be:
1 year 3 years 5 years 10 yearsClass I $91 $310 $547 $1,225Class II $106 $357 $627 $1,398
32
S-32

Portfolio Turnover The fund pays transaction costs, such as commissions, when it buys and sells securities (or “turns over” its portfolio). A higher portfolio turnover rate may indicate higher transaction costs. These costs, which are not reflected in annual fund operating expenses or in the example, affect the fund’s performance. During the most recent fiscal year, the fund’s portfolio turnover rate was 65% of the average value of its portfolio.
Principal Investment StrategiesUnder normal market conditions, the portfolio managers will invest at least 80% of the fund’s net assets in medium size companies. The portfolio managers consider medium size companies to include those whose market capitalization at the time of purchase is within the capitalization range of the Russell 3000® Index, excluding the largest 100 such companies. The portfolio managers intend to manage the fund so that its weighted capitalization falls within the capitalization range of the members of the Russell Midcap® Index. Though market capitalization may change from time to time, as of February 29, 2016, the capitalization range of the Russell 3000® Index, excluding the largest 100 companies, and the Russell Midcap® Index, were approximately $13.3 million to $42.0 billion and $218.2 million to $28.9 billion, respectively.In selecting stocks for the fund, the portfolio managers look for companies whose stock price may not reflect the company’s value. The managers attempt to purchase the stocks of these undervalued companies and hold each stock until the price has increased to, or is higher than, a level the managers believe more accurately reflects the fair value of the company.The fund may invest a portion of its assets in foreign securities when these securities meet the portfolio managers’ standards of selection.The portfolio managers may sell stocks from the fund’s portfolio if they believe a stock no longer meets their valuation criteria, a stock’s risk parameters outweigh its return opportunity, more attractive alternatives are identified or specific events alter a stock’s prospects.
Principal Risks• Mid Cap Stocks – The medium-sized companies in which the fund invests may be more volatile and present greater risks than
larger companies.• Style Risk – If the market does not consider the individual stocks purchased by the fund to be undervalued, the value of the
fund’s shares may decline, even if stock prices generally are rising.• Foreign Securities – The fund may invest in foreign securities, which can be riskier than investing in U.S. securities.• IPO Risk – The fund’s performance may be affected by investments in initial public offerings.• Market Risk – The value of the fund’s shares will go up and down based on the performance of the companies whose securities it
owns and other factors generally affecting the securities market.• Price Volatility – The value of the fund’s shares may fluctuate significantly in the short term.• Redemption Risk –The fund may need to sell securities at times it would not otherwise do so in order to meet shareholder
redemption requests. Selling securities to meet such redemptions may cause the fund to experience a loss or increase the fund’s transaction costs. To the extent that an insurance company has a large position in the fund, the fund may experience relatively large redemptions if such insurance company reallocates its assets.
• Principal Loss – At any given time your shares may be worth less than the price you paid for them. In other words, it is possible to lose money by investing in the fund.
An investment in the fund is not a bank deposit, and it is not insured or guaranteed by the Federal Deposit Insurance Corporation (FDIC) or any other government agency.
33
S-33

Fund PerformanceThe following bar chart and table provide some indication of the risks of investing in the fund. The bar chart shows changes in the fund’s performance from year to year for Class I shares. The table shows how the fund’s average annual returns for the periods shown compared with those of a broad measure of market performance. Fees associated with your variable annuity or variable life insurance contract are not reflected in the chart or table below. Had they been included, returns presented below would have been lower. The fund’s past performance is not necessarily an indication of how the fund will perform in the future.
Calendar Year Total Returns
Highest Performance Quarter (3Q 2009): 17.43% Lowest Performance Quarter (4Q 2008): -18.91%
Average Annual Total Returns For the calendar year ended December 31, 2015 1 year 5 years 10 yearsClass I -1.43% 11.51% 9.04%Class II -1.58% 11.35% 8.88%Russell Midcap® Value Index (reflects no deduction for fees, expenses or taxes)
-4.78% 11.24% 7.60%
Portfolio ManagementInvestment Advisor American Century Investment Management, Inc.
Portfolio Managers Phillip N. Davidson, CFA, Chief Investment Officer - Value Equity, Senior Vice President and Senior Portfolio Manager, has been a member of the team that manages the fund since 2004.Michael Liss, CFA, CPA, Vice President and Senior Portfolio Manager, has been a member of the team that manages the fund since 2004.Kevin Toney, CFA, Senior Vice President and Senior Portfolio Manager, has been a member of the team that manages the fund since 2004.Brian Woglom, CFA, Vice President and Portfolio Manager, has been a member of the team that manages the fund since 2005.
Purchase and Sale of Fund SharesThe fund is closed to new investors as of November 1, 2013. The fund only offers shares through insurance company separate accounts. For instructions on how to purchase and redeem shares through your separate account, read the prospectus provided by your insurance company. Orders for fund shares will be priced at the net asset value next determined after the order is received in the form required by the agreement between the fund, its investment advisor and/or its distributor and the insurance company from which you have purchased your separate account. There are no sales commissions or redemption charges. However, certain sales or deferred sales charges and other charges may apply to the variable annuity or life insurance contracts. Those charges are disclosed in the separate account prospectus.
34
S-34

Tax InformationConsult the prospectus of your insurance company separate account for a discussion of the tax status of your variable contract.
Payments to Broker-Dealers and Other Financial IntermediariesThe fund is offered as an underlying investment option for variable annuity or life insurance contracts. The fund and its related companies pay the sponsoring insurance company and its related companies for distribution and other services. These payments may influence the insurance company to include the fund over another investment as an option in its products. Ask your salesperson or visit your insurance company’s website for more information.
©2016 American Century Proprietary Holdings, Inc. All rights reserved.CL-SUM-88371 1605
35
S-35

Summary Prospectus May 1, 2016 American Century Investments®
VP Value Fund Class I: AVPIXClass II: AVPVX
Before you invest, you may want to review the fund’s prospectus, which contains more information about the fund and itsrisks. You can find the fund’s prospectus and other information about the fund online at the web addresses listed below.You can also get this information at no cost by calling or sending an email request. The fund’s prospectus and otherinformation are also available from insurance companies through which shares of the fund may be purchased or sold.
Retail Investorsamericancentury.com/funds/vp_fund_reports.jsp1-800-378-9878 or [email protected]
Financial Professionalsamericancentury.com/ipro/funds/fund_reports_vp.jsp1-800-345-6488advisor_prospectus@americancentury.com
This summary prospectus incorporates by reference the fund’s prospectus and statement of additional information (SAI),each dated May 1, 2016 (as supplemented at the time you receive this summary prospectus), as well as the Report ofIndependent Registered Public Accounting Firm and the financial statements included in the fund’s annual report toshareholders, dated December 31, 2015. The fund's SAI and annual report may be obtained, free of charge, in the samemanner as the prospectus.
Investment ObjectiveThe fund seeks long-term capital growth. Income is a secondary objective.
Fees and ExpensesThe following table describes the fees and expenses you may pay if you buy and hold shares of the fund. The table does not include the fees and expenses associated with your variable annuity or variable life insurance contract. Had they been included, fees and expenses presented below would have been higher. For information regarding the fees and expenses associated with your variable annuity or variable life insurance contract, please refer to your insurance product prospectus.
Annual Fund Operating Expenses (expenses that you pay each year as a percentage of the value of your investment) Class I Class IIManagement Fee 0.97% 0.87%Distribution and Service (12b-1) Fees None 0.25%Other Expenses 0.00% 0.00%Total Annual Fund Operating Expenses 0.97% 1.12%Fee Waiver1 0.18% 0.18%Total Annual Fund Operating Expenses After Waiver 0.79% 0.94%
1 The advisor has agreed to waive 0.18 percentage points of the fund’s management fee. The advisor expects this waiver to continue until April 30, 2017 and cannot terminate it prior to such date without the approval of the Board of Directors.
Example The example below is intended to help you compare the costs of investing in the fund with the costs of investing in other mutual funds. The example does not include fees and expenses associated with your variable annuity or variable life insurance contract. Had they been included, fees and expenses would have been higher. The example assumes that you invest $10,000 in the fund for the time periods indicated and then redeem all of your shares at the end of those periods, and that you earn a 5% return each year. The example also assumes that the fund’s operating expenses remain the same, except that it reflects the rate and duration of any fee waivers noted in the table above. Although your actual costs may be higher or lower, based on these assumptions your costs would be:
1 year 3 years 5 years 10 yearsClass I $81 $292 $519 $1,173Class II $96 $339 $600 $1,347
36
S-36

Portfolio Turnover The fund pays transaction costs, such as commissions, when it buys and sells securities (or “turns over” its portfolio). A higher portfolio turnover rate may indicate higher transaction costs. These costs, which are not reflected in annual fund operating expenses or in the example, affect the fund’s performance. During the most recent fiscal year, the fund’s portfolio turnover rate was 47% of the average value of its portfolio.
Principal Investment StrategiesIn selecting stocks for the fund, the portfolio managers look for companies of all sizes whose stock price may not reflect the company’s value. The managers attempt to purchase the stocks of these undervalued companies and hold each stock until the price has increased to, or is higher than, a level the managers believe more accurately reflects the fair value of the company.The fund may invest a portion of its assets in foreign securities when these securities meet the portfolio managers’ standards of selection.The portfolio managers may sell stocks from the fund’s portfolio if they believe a stock no longer meets their valuation criteria, a stock’s risk parameters outweigh its return opportunity, more attractive alternatives are identified or specific events alter a stock’s prospects.
Principal Risks• Multi-Cap Investing – The fund is a multi-capitalization fund that invests in companies of all sizes. The small and medium-sized
companies in which the fund invests may be more volatile and subject to greater risk than larger companies.• Style Risk – If the market does not consider the individual stocks purchased by the fund to be undervalued, the value of the fund’s
shares may decline, even if stock prices generally are rising.• Foreign Securities – The fund may invest in foreign securities, which can be riskier than investing in U.S. securities.• Market Risk – The value of the fund’s shares will go up and down based on the performance of the companies whose securities it
owns and other factors generally affecting the securities market.• Price Volatility – The value of the fund’s shares may fluctuate significantly in the short term.• Redemption Risk –The fund may need to sell securities at times it would not otherwise do so in order to meet shareholder
redemption requests. Selling securities to meet such redemptions may cause the fund to experience a loss or increase the fund’s transaction costs. To the extent that an insurance company has a large position in the fund, the fund may experience relatively large redemptions if such insurance company reallocates its assets.
• Principal Loss – At any given time your shares may be worth less than the price you paid for them. In other words, it is possible to lose money by investing in the fund.
An investment in the fund is not a bank deposit, and it is not insured or guaranteed by the Federal Deposit Insurance Corporation (FDIC) or any other government agency.
Fund PerformanceThe following bar chart and table provide some indication of the risks of investing in the fund. The bar chart shows changes in the fund’s performance from year to year for Class I shares. The table shows how the fund’s average annual returns for the periods shown compared with those of a broad measure of market performance. Fees associated with your variable annuity or variable life insurance contract are not reflected in the chart or table below. Had they been included, returns presented below would have been lower. The fund’s past performance is not necessarily an indication of how the fund will perform in the future.
37
S-37

Calendar Year Total Returns
Highest Performance Quarter (3Q 2009): 15.13% Lowest Performance Quarter (4Q 2008): -17.02%
Average Annual Total ReturnsFor the calendar year ended December 31, 2015 1 year 5 years 10 yearsClass I -3.88% 10.62% 6.38%Class II -4.02% 10.48% 6.22%Russell 1000® Value Index (reflects no deduction for fees, expenses or taxes)
-3.83% 11.27% 6.15%
S&P 500® Index (reflects no deduction for fees, expenses or taxes)
1.38% 12.56% 7.30%
Portfolio ManagementInvestment Advisor American Century Investment Management, Inc.
Portfolio Managers Phillip N. Davidson, CFA, Chief Investment Officer - Value Equity, Senior Vice President and Senior Portfolio Manager, has been a member of the team that manages the fund since 1996.Michael Liss, CFA, CPA, Vice President and Senior Portfolio Manager, has been a member of the team that manages the fund since 1998.Kevin Toney, CFA, Senior Vice President and Senior Portfolio Manager, has been a member of the team that manages the fund since 2003.Brian Woglom, CFA, Vice President and Portfolio Manager, has been a member of the team that manages the fund since 2005.Dan Gruemmer, CFA, Portfolio Manager, has been a member of the team that manages the fund since 2009.
Purchase and Sale of Fund SharesThe fund only offers shares through insurance company separate accounts. For instructions on how to purchase and redeem shares through your separate account, read the prospectus provided by your insurance company. Orders for fund shares will be priced at the net asset value next determined after the order is received in the form required by the agreement between the fund, its investment advisor and/or its distributor and the insurance company from which you have purchased your separate account. There are no sales commissions or redemption charges. However, certain sales or deferred sales charges and other charges may apply to the variable annuity or life insurance contracts. Those charges are disclosed in the separate account prospectus.
Tax InformationConsult the prospectus of your insurance company separate account for a discussion of the tax status of your variable contract.
38
S-38

Payments to Broker-Dealers and Other Financial IntermediariesThe fund is offered as an underlying investment option for variable annuity or life insurance contracts. The fund and its related companies pay the sponsoring insurance company and its related companies for distribution and other services. These payments may influence the insurance company to include the fund over another investment as an option in its products. Ask your salesperson or visit your insurance company’s website for more information.
©2016 American Century Proprietary Holdings, Inc. All rights reserved.CL-SUM-88375 1605
39
S-39
American Funds Insurance Series®
Blue Chip Income and Growth Fund
Summary prospectus Class 2 shares May 1, 2016
Before you invest, you may want to review the fund’s prospectus and statementof additional information, which contain more information about the fund and itsrisks. You can find the fund’s prospectus, statement of additional information andother information about the fund online at americanfunds.com/afis. You can also get this information at no cost by calling (800) 421-9900, ext. 65413 or by sending an email request to [email protected]. The current prospectus and statement of additional information, dated May 1, 2016, are incorporated by reference into this summary prospectus.
40
S-40
1 American Funds Insurance Series – Blue Chip Income and Growth Fund / Summary prospectus
Investment objectives The fund’s investment objectives are to produce income exceeding the average yield on U.S. stocks generally and to provide an opportunity for growth of principal consistent with sound common stock investing.
Fees and expenses of the fund This table describes the fees and expenses that you may pay if you buy and hold an interest in Class 2 shares of the fund. It does not reflect insurance contract fees and expenses. If insurance contract fees and expenses were reflected, expenses shown would be higher.
Annual fund operating expenses (expenses that you pay each year as a percentage of the value of your investment) Class 2
Management fee 0.40% Distribution and/or service (12b-1) fees 0.25 Other expenses 0.01 Total annual fund operating expenses 0.66
Example This example is intended to help you compare the cost of investing in Class 2 shares of the fund with the cost of investing in other mutual funds.
The example assumes that you invest $10,000 in the fund for the time periods indicated and then redeem all of your shares at the end of those periods. The example also assumes that your investment has a 5% return each year and that the fund’s operating expenses remain the same. The example does not reflect insurance contract expenses. If insurance contract expenses were reflected, expenses shown would be higher. Although your actual costs may be higher or lower, based on these assumptions your costs would be:
1 year 3 years 5 years 10 years
Class 2 $67 $211 $368 $822
Portfolio turnover The fund pays transaction costs, such as commissions, when it buys and sells securities (or “turns over” its portfolio). A higher portfolio turnover rate may indicate higher transaction costs. These costs, which are not reflected in annual fund operating expenses or in the example, affect the fund’s investment results. During the most recent fiscal year, the fund’s portfolio turnover rate was 26% of the average value of its portfolio.
Principal investment strategies The fund invests primarily in dividend-paying common stocks of larger, more established companies domiciled in the United States with market capitalizations greater than $4.0 billion. The fund’s investment adviser considers these types of investments to be “blue chip” stocks. In seeking to produce a level of current income that exceeds the average yield on U.S. stocks, the fund generally looks to the average yield on stocks of companies listed on the S&P 500 Index. The fund also ordinarily invests at least 90% of its equity assets in the stock of companies whose debt securities are rated at least investment grade by Nationally Recognized Statistical Rating Organizations designated by the fund’s investment adviser or unrated but determined to be of equivalent quality by the fund’s investment adviser. The fund may invest up to 10% of its assets in equity securities of larger companies domiciled outside the United States, so long as they are listed or traded in the United States. The fund invests, under normal market conditions, at least 90% of its assets in equity securities. The fund is designed for investors seeking both income and capital appreciation.
The investment adviser uses a system of multiple portfolio managers in managing the fund’s assets. Under this approach, the portfolio of the fund is divided into segments managed by individual managers who decide how their respective segments will be invested.
The fund relies on the professional judgment of its investment adviser to make decisions about the fund’s portfolio investments. The basic investment philosophy of the investment adviser is to seek to invest in attractively valued securities that, in its opinion, represent good, long-term investment opportunities. The investment adviser believes that an important way to accomplish this is through fundamental analysis, which may include meeting with company executives and employees, suppliers, customers and competitors. Securities may be sold when the investment adviser believes that they no longer represent relatively attractive investment opportunities.
41
S-41

American Funds Insurance Series – Blue Chip Income and Growth Fund / Summary prospectus 2
Principal risks This section describes the principal risks associated with the fund’s principal investment strategies. You may lose money by investing in the fund. The likelihood of loss may be greater if you invest for a shorter period of time. Investors in the fund should have a long-term perspective and be able to tolerate potentially sharp declines in value.
Market conditions — The prices of, and the income generated by, the common stocks and other securities held by the fund may decline – sometimes rapidly or unpredictably – due to various factors, including events or conditions affecting the general economy or particular industries; overall market changes; local, regional or global political, social or economic instability; governmental or governmental agency responses to economic conditions; and currency exchange rate, interest rate and commodity price fluctuations.
Issuer risks — The prices of, and the income generated by, securities held by the fund may decline in response to various factors directly related to the issuers of such securities, including reduced demand for an issuer’s goods or services, poor management performance and strategic initiatives such as mergers, acquisitions or dispositions and the market response to any such initiatives.
Investing in income-oriented stocks — Income provided by the fund may be reduced by changes in the dividend policies of, and the capital resources available for dividend payments at, the companies in which the fund invests.
Investing in growth-oriented stocks — Growth-oriented common stocks and other equity-type securities (such as preferred stocks, convertible preferred stocks and convertible bonds) may involve larger price swings and greater potential for loss than other types of investments.
Investing outside the United States — Securities of issuers domiciled outside the United States, or with significant operations or revenues outside the United States, may lose value because of adverse political, social, economic or market developments (including social instability, regional conflicts, terrorism and war) in the countries or regions in which the issuers operate or generate revenue. These securities may also lose value due to changes in foreign currency exchange rates against the U.S. dollar and/or currencies of other countries. Issuers of these securities may be more susceptible to actions of foreign governments, such as the imposition of price controls or punitive taxes, that could adversely impact revenues. Securities markets in certain countries may be more volatile and/or less liquid than those in the United States. Investments outside the United States may also be subject to different accounting practices and different regulatory, legal and reporting standards and practices, and may be more difficult to value, than those in the United States. In addition, the value of investments outside the United States may be reduced by foreign taxes, including foreign withholding taxes on interest and dividends. Further, there may be increased risks of delayed settlement of securities purchased or sold by the fund. The risks of investing outside the United States may be heightened in connection with investments in emerging markets.
Management — The investment adviser to the fund actively manages the fund’s investments. Consequently, the fund is subject to the risk that the methods and analyses employed by the investment adviser in this process may not produce the desired results. This could cause the fund to lose value or its investment results to lag relevant benchmarks or other funds with similar objectives.
Your investment in the fund is not a bank deposit and is not insured or guaranteed by the Federal Deposit Insurance Corporation or any other governmental agency, entity or person. You should consider how this fund fits into your overall investment program.
Investment results The following bar chart shows how the investment results of the Class 2 shares of the fund have varied from year to year, and the following table shows how the fund’s average annual total returns for various periods compare with different broad measures of market results. This information provides some indication of the risks of investing in the fund. The Lipper Growth and Income Funds Index includes mutual funds that disclose investment objectives and/or strategies reasonably comparable to those of the fund. Past investment results (before and after taxes) are not predictive of future investment results. Figures shown reflect fees and expenses associated with an investment in the fund, but do not reflect insurance contract fees and expenses. If insurance contract fees and expenses were included, results would have been lower. Updated information on the fund’s investment results can be obtained by visiting americanfunds.com/afis.
Calendar year total returns
Highest/Lowest quarterly results during this period were:
Highest 17.09% (quarter ended June 30, 2009)
Lowest –21.27% (quarter ended December 31, 2008)
(%)
01020
4030
–40
–10
–30–20
’12 ’14’06 ’07 ’08 ’09
27.97
’10
12.33
’11
13.88
’13
17.42
–50
–0.90
–36.50
2.03
33.00
15.36
’15
–2.93
42
S-42

INA2IPX-072-0516P Printed in USA CGD/AFD/8024 Investment Company File No. 811-03857
Average annual total returns For the periods ended December 31, 2015: 1 year 5 years 10 years Lifetime
Fund (inception date — 7/5/01) –2.93% 10.94% 6.27% 5.11%
S&P 500 Index (reflects no deduction for sales charges, account fees, expenses or U.S. federal income taxes)
1.38 12.57 7.31 5.72
Lipper Growth and Income Funds Index (reflects no deduction for sales charges, account fees or U.S. federal income taxes)
–1.61 9.00 5.50 5.03
Management Investment adviser Capital Research and Management CompanySM
Portfolio managers The individuals primarily responsible for the portfolio management of the fund are:
Portfolio manager/ Series title (if applicable)
Portfolio manager experience in this fund
Primary title with investment adviser
Christopher D. Buchbinder 9 years Partner – Capital Research Global Investors
James B. Lovelace 9 years Partner – Capital Research Global Investors
James Terrile 4 years Partner – Capital Research Global Investors
Tax information See your variable insurance contract prospectus for information regarding the federal income tax treatment of your variable insurance contract and related distributions.
Payments to broker-dealers and other financial intermediaries If you purchase shares of the fund through a broker-dealer or other financial intermediary (such as an insurance company), the fund and the fund’s distributor or its affiliates may pay the intermediary for the sale of fund shares and related services. These payments may create a conflict of interest by influencing the broker-dealer or other intermediary and your individual financial advisor to recommend the fund over another investment. Ask your individual financial advisor or visit your financial intermediary’s website for more information. The fund is not sold directly to the general public but instead is offered as an underlying investment option for variable insurance contracts. In addition to payments described above, the fund and its related companies may make payments to the sponsoring insurance company (or its affiliates) for distribution and/or other services. These payments may be a factor that the insurance company considers in including the fund as an underlying investment option in the variable insurance contract. The prospectus (or other offering document) for your variable insurance contract may contain additional information about these payments.
43
S-43

American Funds Insurance Series®
Global Bond Fund
Summary prospectus Class 2 shares May 1, 2016
Before you invest, you may want to review the fund’s prospectus and statementof additional information, which contain more information about the fund and itsrisks. You can find the fund’s prospectus, statement of additional information andother information about the fund online at americanfunds.com/afis. You can also get this information at no cost by calling (800) 421-9900, ext. 65413 or by sending an email request to [email protected]. The current prospectus and statement of additional information, dated May 1, 2016, are incorporated by reference into this summary prospectus.
44
S-44
1 American Funds Insurance Series – Global Bond Fund / Summary prospectus
Investment objective The fund’s investment objective is to provide you, over the long term, with a high level of total return consistent with prudent investment management.
Fees and expenses of the fund This table describes the fees and expenses that you may pay if you buy and hold an interest in Class 2 shares of the fund. It does not reflect insurance contract fees and expenses. If insurance contract fees and expenses were reflected, expenses shown would be higher.
Annual fund operating expenses (expenses that you pay each year as a percentage of the value of your investment) Class 2
Management fee 0.53% Distribution and/or service (12b-1) fees 0.25 Other expenses 0.04 Total annual fund operating expenses 0.82
Example This example is intended to help you compare the cost of investing in Class 2 shares of the fund with the cost of investing in other mutual funds.
The example assumes that you invest $10,000 in the fund for the time periods indicated and then redeem all of your shares at the end of those periods. The example also assumes that your investment has a 5% return each year and that the fund’s operating expenses remain the same. The example does not reflect insurance contract expenses. If insurance contract expenses were reflected, expenses shown would be higher. Although your actual costs may be higher or lower, based on these assumptions your costs would be:
1 year 3 years 5 years 10 years
Class 2 $84 $262 $455 $1,014
Portfolio turnover The fund pays transaction costs, such as commissions, when it buys and sells securities (or “turns over” its portfolio). A higher portfolio turnover rate may indicate higher transaction costs. These costs, which are not reflected in annual fund operating expenses or in the example, affect the fund’s investment results. During the most recent fiscal year, the fund’s portfolio turnover rate was 159% of the average value of its portfolio.
Principal investment strategies Under normal market circumstances, the fund invests at least 80% of its assets in bonds and other debt securities, which may be represented by other investment instruments, including derivatives. The fund invests primarily in debt securities, including asset-backed and mortgage-backed securities and securities of governmental, supranational and corporate issuers denominated in various currencies, including U.S. dollars. As a fund that seeks to invest globally, the fund will allocate its assets among securities of companies domiciled in various countries, including the United States and countries with emerging markets (but in no fewer than three countries). Under normal market conditions, the fund will invest significantly in issuers domiciled outside the United States (i.e., at least 40% of its net assets, unless market conditions are not deemed favorable by the fund’s investment adviser, in which case the fund would invest at least 30% of its net assets in issuers outside the United States). Normally, the fund’s debt obligations consist substantially of investment-grade bonds (rated Baa3 or better or BBB- or better by Nationally Recognized Statistical Rating Organizations, or NRSROs, designated by the fund’s investment adviser or unrated but determined to be of equivalent quality by the fund’s investment adviser). The fund may also invest up to 35% of its assets in lower quality, higher yielding debt securities (rated Ba1 or below and BB+ or below by NRSROs designated by the fund’s investment adviser or unrated but determined to be of equivalent quality by the fund’s investment adviser). Such securities are sometimes referred to as “junk bonds.” The total return of the fund will be the result of interest income, changes in the market value of the fund’s investments and changes in the values of other currencies relative to the U.S. dollar.
The fund may invest in certain derivative instruments, such as futures contracts and swaps. A derivative is a financial contract, the value of which is based on the value of an underlying financial asset (such as a stock, bond or currency), a reference rate or a market index. The fund may invest in a derivative only if, in the opinion of the investment adviser, the expected risks and rewards of the proposed investment are consistent with the investment objective and strategies of the fund as disclosed in this prospectus and in the fund’s statement of additional information.
The fund is nondiversified, which allows it to invest a greater percentage of its assets in any one issuer than would otherwise be the case. However, the fund intends to limit its investments in the securities of any single issuer.
45
S-45

American Funds Insurance Series – Global Bond Fund / Summary prospectus 2
The investment adviser uses a system of multiple portfolio managers in managing the fund’s assets. Under this approach, the portfolio of the fund is divided into segments managed by individual managers who decide how their respective segments will be invested.
The fund relies on the professional judgment of its investment adviser to make decisions about the fund’s portfolio investments. The basic investment philosophy of the investment adviser is to seek to invest in attractively valued securities that, in its opinion, represent good, long-term investment opportunities. The investment adviser believes that an important way to accomplish this is through fundamental analysis, which may include meeting with government officials, central banks and company executives. Securities may be sold when the investment adviser believes that they no longer represent relatively attractive investment opportunities.
Principal risks This section describes the principal risks associated with the fund’s principal investment strategies. You may lose money by investing in the fund. The likelihood of loss may be greater if you invest for a shorter period of time.
Market conditions — The prices of, and the income generated by, the bonds and other securities held by the fund may decline – sometimes rapidly or unpredictably – due to various factors, including events or conditions affecting the general economy or particular industries; overall market changes; local, regional or global political, social or economic instability; governmental or governmental agency responses to economic conditions; and currency exchange rate, interest rate and commodity price fluctuations.
Issuer risks — The prices of, and the income generated by, securities held by the fund may decline in response to various factors directly related to the issuers of such securities, including reduced demand for an issuer’s goods or services, poor management performance and strategic initiatives such as mergers, acquisitions or dispositions and the market response to any such initiatives.
Investing in debt instruments — The prices of, and the income generated by, bonds and other debt securities held by the fund may be affected by changing interest rates and by changes in the effective maturities and credit ratings of these securities.
Rising interest rates will generally cause the prices of bonds and other debt securities to fall. Falling interest rates may cause an issuer to redeem, call or refinance a debt security before its stated maturity, which may result in the fund having to reinvest the proceeds in lower yielding securities. Longer maturity debt securities generally have greater sensitivity to changes in interest rates and may be subject to greater price fluctuations than shorter maturity debt securities.
Bonds and other debt securities are also subject to credit risk, which is the possibility that the credit strength of an issuer will weaken and/or an issuer of a debt security will fail to make timely payments of principal or interest and the security will go into default. Lower quality debt securities generally have higher rates of interest and may be subject to greater price fluctuations than higher quality debt securities. Credit risk is gauged, in part, by the credit ratings of the debt securities in which the fund invests. However, ratings are only the opinions of the rating agencies issuing them and are not guarantees as to credit quality or an evaluation of market risk. The fund’s investment adviser relies on its own credit analysts to research issuers and issues in seeking to mitigate various credit and default risks.
Investing in lower rated debt instruments — Lower rated bonds and other lower rated debt securities generally have higher rates of interest and involve greater risk of default or price declines due to changes in the issuer’s creditworthiness than those of higher quality debt securities. The market prices of these securities may fluctuate more than the prices of higher quality debt securities and may decline significantly in periods of general economic difficulty. These risks may be increased with respect to investments in junk bonds.
Investing in securities backed by the U.S. government — Securities backed by the U.S. Treasury or the full faith and credit of the U.S. government are guaranteed only as to the timely payment of interest and principal when held to maturity. Accordingly, the current market values for these securities will fluctuate with changes in interest rates. Securities issued by government-sponsored entities and federal agencies and instrumentalities that are not backed by the full faith and credit of the U.S. government are neither issued nor guaranteed by the U.S. government.
Investing in derivatives — The use of derivatives involves a variety of risks, which may be different from, or greater than, the risks associated with investing in traditional cash securities, such as stocks and bonds. Changes in the value of a derivative may not correlate perfectly with, and may be more sensitive to market events than, the underlying asset, rate or index, and a derivative instrument may expose the fund to losses in excess of its initial investment. Derivatives may be difficult for the fund to buy or sell at an opportune time or price and may be difficult to terminate or otherwise offset. The fund’s use of derivatives may result in losses to the fund, and investing in derivatives may reduce the fund’s returns and increase the fund’s price volatility. The fund’s counterparty to a derivative transaction (including, if applicable, the fund’s clearing broker, the derivatives exchange or the clearinghouse) may be unable or unwilling to honor its financial obligations in respect of the transaction. A description of the derivative instruments in which the fund may invest and the various risks associated with those derivatives is included in the fund’s statement of additional information under “Description of certain securities, investment techniques and risks.”
Thinly traded securities — There may be little trading in the secondary market for particular bonds, other debt securities or derivatives, which may make them more difficult to value, acquire or sell.
Investing outside the United States — Securities of issuers domiciled outside the United States, or with significant operations or revenues outside the United States, may lose value because of adverse political, social, economic or market developments (including social instability, regional conflicts, terrorism and war) in the countries or regions in which the issuers operate or
46
S-46
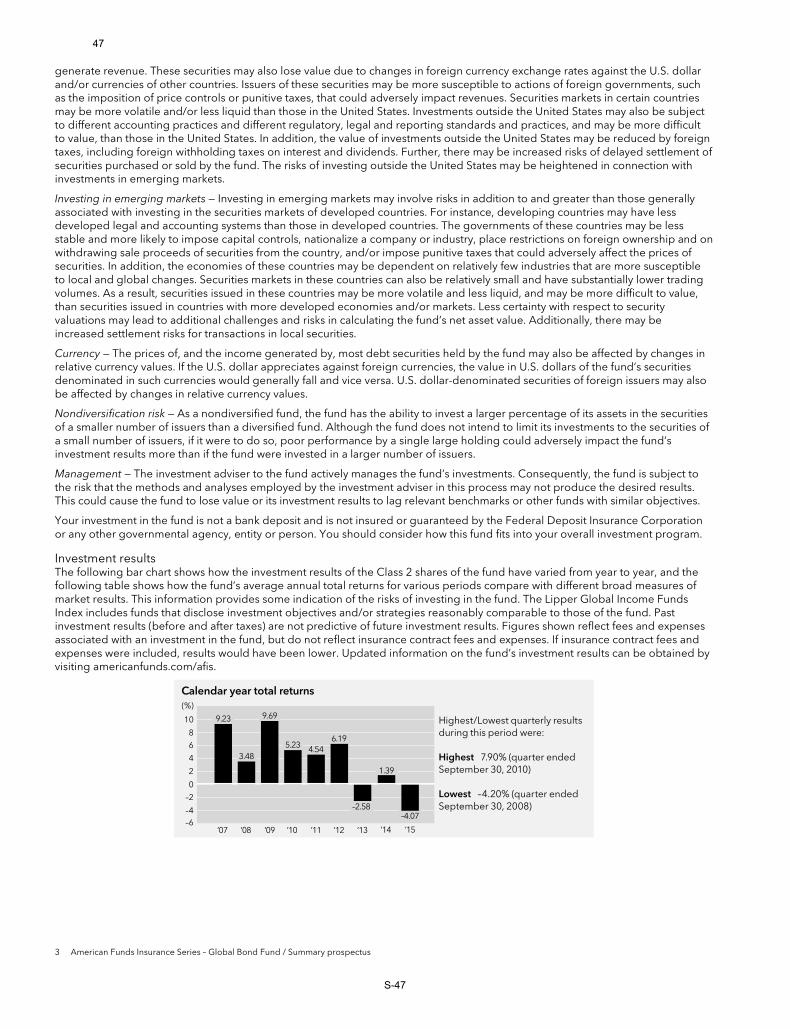
3 American Funds Insurance Series – Global Bond Fund / Summary prospectus
generate revenue. These securities may also lose value due to changes in foreign currency exchange rates against the U.S. dollar and/or currencies of other countries. Issuers of these securities may be more susceptible to actions of foreign governments, such as the imposition of price controls or punitive taxes, that could adversely impact revenues. Securities markets in certain countries may be more volatile and/or less liquid than those in the United States. Investments outside the United States may also be subject to different accounting practices and different regulatory, legal and reporting standards and practices, and may be more difficult to value, than those in the United States. In addition, the value of investments outside the United States may be reduced by foreign taxes, including foreign withholding taxes on interest and dividends. Further, there may be increased risks of delayed settlement of securities purchased or sold by the fund. The risks of investing outside the United States may be heightened in connection with investments in emerging markets.
Investing in emerging markets — Investing in emerging markets may involve risks in addition to and greater than those generally associated with investing in the securities markets of developed countries. For instance, developing countries may have less developed legal and accounting systems than those in developed countries. The governments of these countries may be less stable and more likely to impose capital controls, nationalize a company or industry, place restrictions on foreign ownership and on withdrawing sale proceeds of securities from the country, and/or impose punitive taxes that could adversely affect the prices of securities. In addition, the economies of these countries may be dependent on relatively few industries that are more susceptible to local and global changes. Securities markets in these countries can also be relatively small and have substantially lower trading volumes. As a result, securities issued in these countries may be more volatile and less liquid, and may be more difficult to value, than securities issued in countries with more developed economies and/or markets. Less certainty with respect to security valuations may lead to additional challenges and risks in calculating the fund’s net asset value. Additionally, there may be increased settlement risks for transactions in local securities.
Currency — The prices of, and the income generated by, most debt securities held by the fund may also be affected by changes in relative currency values. If the U.S. dollar appreciates against foreign currencies, the value in U.S. dollars of the fund’s securities denominated in such currencies would generally fall and vice versa. U.S. dollar-denominated securities of foreign issuers may also be affected by changes in relative currency values.
Nondiversification risk — As a nondiversified fund, the fund has the ability to invest a larger percentage of its assets in the securities of a smaller number of issuers than a diversified fund. Although the fund does not intend to limit its investments to the securities of a small number of issuers, if it were to do so, poor performance by a single large holding could adversely impact the fund’s investment results more than if the fund were invested in a larger number of issuers.
Management — The investment adviser to the fund actively manages the fund’s investments. Consequently, the fund is subject to the risk that the methods and analyses employed by the investment adviser in this process may not produce the desired results. This could cause the fund to lose value or its investment results to lag relevant benchmarks or other funds with similar objectives.
Your investment in the fund is not a bank deposit and is not insured or guaranteed by the Federal Deposit Insurance Corporation or any other governmental agency, entity or person. You should consider how this fund fits into your overall investment program.
Investment results The following bar chart shows how the investment results of the Class 2 shares of the fund have varied from year to year, and the following table shows how the fund’s average annual total returns for various periods compare with different broad measures of market results. This information provides some indication of the risks of investing in the fund. The Lipper Global Income Funds Index includes funds that disclose investment objectives and/or strategies reasonably comparable to those of the fund. Past investment results (before and after taxes) are not predictive of future investment results. Figures shown reflect fees and expenses associated with an investment in the fund, but do not reflect insurance contract fees and expenses. If insurance contract fees and expenses were included, results would have been lower. Updated information on the fund’s investment results can be obtained by visiting americanfunds.com/afis.
Calendar year total returns
Highest/Lowest quarterly results during this period were:
Highest 7.90% (quarter ended September 30, 2010)
Lowest –4.20% (quarter ended September 30, 2008)
(%)
’12’07 ’08 ’09 ’10
4.54
’11 ’13
5.23
9.23
6.19
0
6
8
10
–6
–2
–4
4
2
3.48
9.69
–2.58
’14
1.39
’15
–4.07
47
S-47
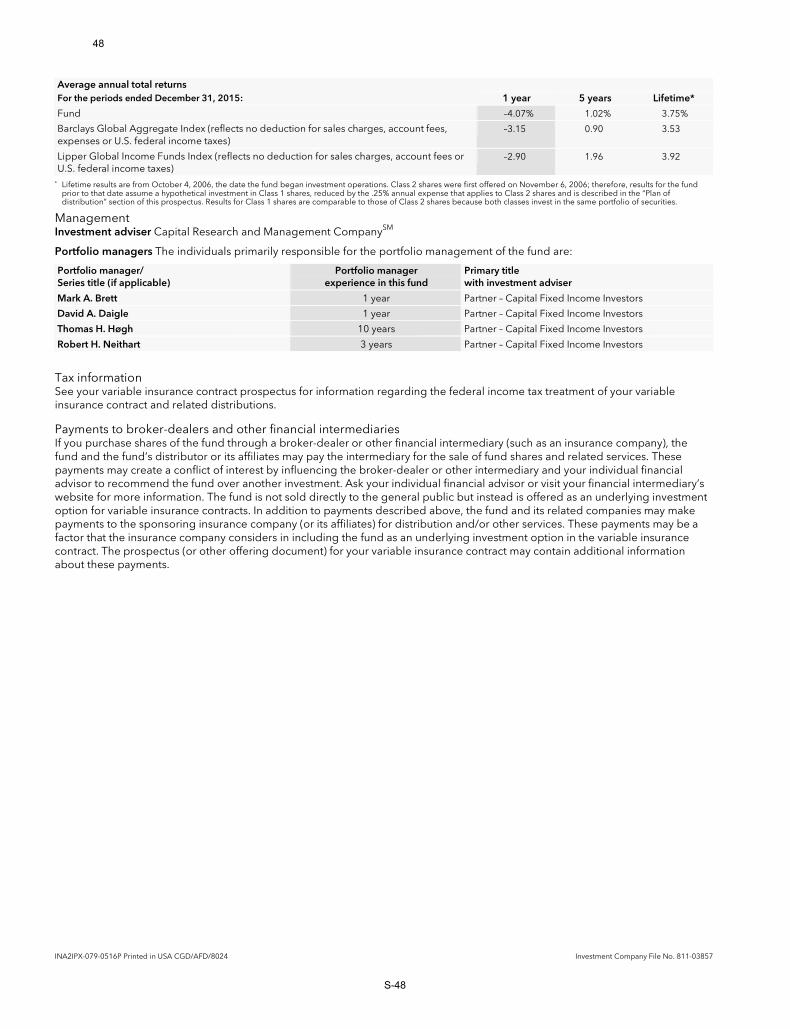
INA2IPX-079-0516P Printed in USA CGD/AFD/8024 Investment Company File No. 811-03857
Average annual total returns For the periods ended December 31, 2015: 1 year 5 years Lifetime*
Fund –4.07% 1.02% 3.75%
Barclays Global Aggregate Index (reflects no deduction for sales charges, account fees, expenses or U.S. federal income taxes)
–3.15 0.90 3.53
Lipper Global Income Funds Index (reflects no deduction for sales charges, account fees or U.S. federal income taxes)
–2.90 1.96 3.92
* Lifetime results are from October 4, 2006, the date the fund began investment operations. Class 2 shares were first offered on November 6, 2006; therefore, results for the fund prior to that date assume a hypothetical investment in Class 1 shares, reduced by the .25% annual expense that applies to Class 2 shares and is described in the “Plan of distribution” section of this prospectus. Results for Class 1 shares are comparable to those of Class 2 shares because both classes invest in the same portfolio of securities.
Management Investment adviser Capital Research and Management CompanySM
Portfolio managers The individuals primarily responsible for the portfolio management of the fund are:
Portfolio manager/ Series title (if applicable)
Portfolio manager experience in this fund
Primary title with investment adviser
Mark A. Brett 1 year Partner – Capital Fixed Income Investors
David A. Daigle 1 year Partner – Capital Fixed Income Investors
Thomas H. Høgh 10 years Partner – Capital Fixed Income Investors
Robert H. Neithart 3 years Partner – Capital Fixed Income Investors
Tax information See your variable insurance contract prospectus for information regarding the federal income tax treatment of your variable insurance contract and related distributions.
Payments to broker-dealers and other financial intermediaries If you purchase shares of the fund through a broker-dealer or other financial intermediary (such as an insurance company), the fund and the fund’s distributor or its affiliates may pay the intermediary for the sale of fund shares and related services. These payments may create a conflict of interest by influencing the broker-dealer or other intermediary and your individual financial advisor to recommend the fund over another investment. Ask your individual financial advisor or visit your financial intermediary’s website for more information. The fund is not sold directly to the general public but instead is offered as an underlying investment option for variable insurance contracts. In addition to payments described above, the fund and its related companies may make payments to the sponsoring insurance company (or its affiliates) for distribution and/or other services. These payments may be a factor that the insurance company considers in including the fund as an underlying investment option in the variable insurance contract. The prospectus (or other offering document) for your variable insurance contract may contain additional information about these payments.
48
S-48

American Funds Insurance Series®
Growth Fund
Summary prospectus Class 2 shares May 1, 2016
Before you invest, you may want to review the fund’s prospectus and statementof additional information, which contain more information about the fund and itsrisks. You can find the fund’s prospectus, statement of additional information andother information about the fund online at americanfunds.com/afis. You can also get this information at no cost by calling (800) 421-9900, ext. 65413 or by sending an email request to [email protected]. The current prospectus and statement of additional information, dated May 1, 2016, are incorporated by reference into this summary prospectus.
49
S-49

1 American Funds Insurance Series – Growth Fund / Summary prospectus
Investment objective The fund’s investment objective is to provide you with growth of capital.
Fees and expenses of the fund This table describes the fees and expenses that you may pay if you buy and hold an interest in Class 2 shares of the fund. It does not reflect insurance contract fees and expenses. If insurance contract fees and expenses were reflected, expenses shown would be higher.
Annual fund operating expenses (expenses that you pay each year as a percentage of the value of your investment) Class 2
Management fee 0.33% Distribution and/or service (12b-1) fees 0.25 Other expenses 0.02 Total annual fund operating expenses 0.60
Example This example is intended to help you compare the cost of investing in Class 2 shares of the fund with the cost of investing in other mutual funds.
The example assumes that you invest $10,000 in the fund for the time periods indicated and then redeem all of your shares at the end of those periods. The example also assumes that your investment has a 5% return each year and that the fund’s operating expenses remain the same. The example does not reflect insurance contract expenses. If insurance contract expenses were reflected, expenses shown would be higher. Although your actual costs may be higher or lower, based on these assumptions your costs would be:
1 year 3 years 5 years 10 years
Class 2 $61 $192 $335 $750
Portfolio turnover The fund pays transaction costs, such as commissions, when it buys and sells securities (or “turns over” its portfolio). A higher portfolio turnover rate may indicate higher transaction costs. These costs, which are not reflected in annual fund operating expenses or in the example, affect the fund’s investment results. During the most recent fiscal year, the fund’s portfolio turnover rate was 20% of the average value of its portfolio.
Principal investment strategies The fund invests primarily in common stocks and seeks to invest in companies that appear to offer superior opportunities for growth of capital. The fund may invest up to 25% of its assets in common stocks and other securities of issuers domiciled outside the United States.
The investment adviser uses a system of multiple portfolio managers in managing the fund’s assets. Under this approach, the portfolio of the fund is divided into segments managed by individual managers who decide how their respective segments will be invested.
The fund relies on the professional judgment of its investment adviser to make decisions about the fund’s portfolio investments. The basic investment philosophy of the investment adviser is to seek to invest in attractively valued companies that, in its opinion, represent good, long-term investment opportunities. The investment adviser believes that an important way to accomplish this is through fundamental analysis, which may include meeting with company executives and employees, suppliers, customers and competitors. Securities may be sold when the investment adviser believes that they no longer represent relatively attractive investment opportunities.
50
S-50

American Funds Insurance Series – Growth Fund / Summary prospectus 2
Principal risks This section describes the principal risks associated with the fund’s principal investment strategies. You may lose money by investing in the fund. The likelihood of loss may be greater if you invest for a shorter period of time. Investors in the fund should have a long-term perspective and be able to tolerate potentially sharp declines in value.
Market conditions — The prices of, and the income generated by, the common stocks and other securities held by the fund may decline – sometimes rapidly or unpredictably – due to various factors, including events or conditions affecting the general economy or particular industries; overall market changes; local, regional or global political, social or economic instability; governmental or governmental agency responses to economic conditions; and currency exchange rate, interest rate and commodity price fluctuations.
Issuer risks — The prices of, and the income generated by, securities held by the fund may decline in response to various factors directly related to the issuers of such securities, including reduced demand for an issuer’s goods or services, poor management performance and strategic initiatives such as mergers, acquisitions or dispositions and the market response to any such initiatives.
Investing in growth-oriented stocks — Growth-oriented common stocks and other equity-type securities (such as preferred stocks, convertible preferred stocks and convertible bonds) may involve larger price swings and greater potential for loss than other types of investments. These risks may be even greater in the case of smaller capitalization stocks.
Investing outside the United States — Securities of issuers domiciled outside the United States, or with significant operations or revenues outside the United States, may lose value because of adverse political, social, economic or market developments (including social instability, regional conflicts, terrorism and war) in the countries or regions in which the issuers operate or generate revenue. These securities may also lose value due to changes in foreign currency exchange rates against the U.S. dollar and/or currencies of other countries. Issuers of these securities may be more susceptible to actions of foreign governments, such as the imposition of price controls or punitive taxes, that could adversely impact revenues. Securities markets in certain countries may be more volatile and/or less liquid than those in the United States. Investments outside the United States may also be subject to different accounting practices and different regulatory, legal and reporting standards and practices, and may be more difficult to value, than those in the United States. In addition, the value of investments outside the United States may be reduced by foreign taxes, including foreign withholding taxes on interest and dividends. Further, there may be increased risks of delayed settlement of securities purchased or sold by the fund. The risks of investing outside the United States may be heightened in connection with investments in emerging markets.
Management — The investment adviser to the fund actively manages the fund’s investments. Consequently, the fund is subject to the risk that the methods and analyses employed by the investment adviser in this process may not produce the desired results. This could cause the fund to lose value or its investment results to lag relevant benchmarks or other funds with similar objectives.
Your investment in the fund is not a bank deposit and is not insured or guaranteed by the Federal Deposit Insurance Corporation or any other governmental agency, entity or person. You should consider how this fund fits into your overall investment program.
Investment results The following bar chart shows how the investment results of the Class 2 shares of the fund have varied from year to year, and the following table shows how the fund’s average annual total returns for various periods compare with different broad measures of market results. This information provides some indication of the risks of investing in the fund. The Lipper Growth Funds Index and the Lipper Capital Appreciation Funds Index include mutual funds that disclose investment objectives and/or strategies reasonably comparable to those of the fund. Past investment results (before and after taxes) are not predictive of future investment results. Figures shown reflect fees and expenses associated with an investment in the fund, but do not reflect insurance contract fees and expenses. If insurance contract fees and expenses were included, results would have been lower. Updated information on the fund’s investment results can be obtained by visiting americanfunds.com/afis.
Calendar year total returns
Highest/Lowest quarterly results during this period were:
Highest 18.50% (quarter ended June 30, 2009)
Lowest –26.05% (quarter ended December 31, 2008)
(%)
01020304050
–30–40
–10–20
–50
’12 ’14 ’15’06 ’07 ’08 ’09 ’10
18.68
’11 ’13
12.35 8.51
–60
30.11
6.86
39.41
–43.97
17.8910.22
–4.27
51
S-51

INA2IPX-027-0516P Printed in USA CGD/AFD/8024 Investment Company File No. 811-03857
Average annual total returns For the periods ended December 31, 2015: 1 year 5 years 10 years Lifetime*
Fund 6.86% 11.23% 6.93% 12.17%
S&P 500 Index (reflects no deduction for sales charges, account fees, expenses or U.S. federal income taxes)
1.38 12.57 7.31 11.08
Lipper Growth Funds Index (reflects no deduction for sales charges, account fees or U.S. federal income taxes)
2.15 11.55 6.48 9.36
Lipper Capital Appreciation Funds Index (reflects no deduction for sales charges, account fees or U.S. federal income taxes)
0.74 10.22 7.28 9.48
* Lifetime results are from February 8, 1984, the date the fund began investment operations. Class 2 shares were first offered on April 30, 1997; therefore, results for the fund prior to that date assume a hypothetical investment in Class 1 shares, reduced by the .25% annual expense that applies to Class 2 shares and is described in the “Plan of distribution” section of this prospectus. Results for Class 1 shares are comparable to those of Class 2 shares because both classes invest in the same portfolio of securities.
Management Investment adviser Capital Research and Management CompanySM
Portfolio managers The individuals primarily responsible for the portfolio management of the fund are:
Portfolio manager/ Series title (if applicable)
Portfolio manager experience in this fund
Primary title with investment adviser
Gregory D. Johnson 9 years Partner – Capital World Investors
Michael T. Kerr 11 years Partner – Capital World Investors
Ronald B. Morrow 13 years Partner – Capital World Investors
Andraz Razen 3 years Partner – Capital World Investors
Martin Romo Less than 1 year Partner – Capital World Investors
Alan J. Wilson 2 years Partner – Capital World Investors
Tax information See your variable insurance contract prospectus for information regarding the federal income tax treatment of your variable insurance contract and related distributions.
Payments to broker-dealers and other financial intermediaries If you purchase shares of the fund through a broker-dealer or other financial intermediary (such as an insurance company), the fund and the fund’s distributor or its affiliates may pay the intermediary for the sale of fund shares and related services. These payments may create a conflict of interest by influencing the broker-dealer or other intermediary and your individual financial advisor to recommend the fund over another investment. Ask your individual financial advisor or visit your financial intermediary’s website for more information. The fund is not sold directly to the general public but instead is offered as an underlying investment option for variable insurance contracts. In addition to payments described above, the fund and its related companies may make payments to the sponsoring insurance company (or its affiliates) for distribution and/or other services. These payments may be a factor that the insurance company considers in including the fund as an underlying investment option in the variable insurance contract. The prospectus (or other offering document) for your variable insurance contract may contain additional information about these payments.
52
S-52

American Funds Insurance Series®
International Fund
Summary prospectus Class 2 shares May 1, 2016
Before you invest, you may want to review the fund’s prospectus and statementof additional information, which contain more information about the fund and itsrisks. You can find the fund’s prospectus, statement of additional information andother information about the fund online at americanfunds.com/afis. You can also get this information at no cost by calling (800) 421-9900, ext. 65413 or by sending an email request to [email protected]. The current prospectus and statement of additional information, dated May 1, 2016, are incorporated by reference into this summary prospectus.
53
S-53
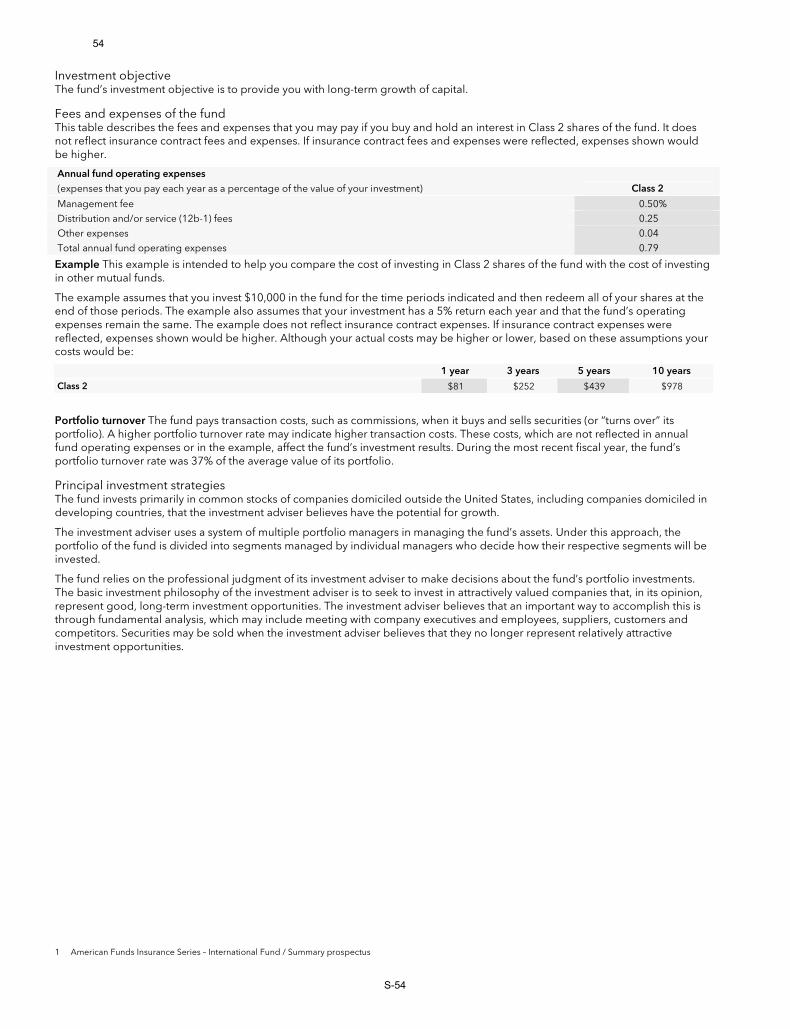
1 American Funds Insurance Series – International Fund / Summary prospectus
Investment objective The fund’s investment objective is to provide you with long-term growth of capital.
Fees and expenses of the fund This table describes the fees and expenses that you may pay if you buy and hold an interest in Class 2 shares of the fund. It does not reflect insurance contract fees and expenses. If insurance contract fees and expenses were reflected, expenses shown would be higher.
Annual fund operating expenses (expenses that you pay each year as a percentage of the value of your investment) Class 2
Management fee 0.50% Distribution and/or service (12b-1) fees 0.25 Other expenses 0.04 Total annual fund operating expenses 0.79
Example This example is intended to help you compare the cost of investing in Class 2 shares of the fund with the cost of investing in other mutual funds.
The example assumes that you invest $10,000 in the fund for the time periods indicated and then redeem all of your shares at the end of those periods. The example also assumes that your investment has a 5% return each year and that the fund’s operating expenses remain the same. The example does not reflect insurance contract expenses. If insurance contract expenses were reflected, expenses shown would be higher. Although your actual costs may be higher or lower, based on these assumptions your costs would be:
1 year 3 years 5 years 10 years
Class 2 $81 $252 $439 $978
Portfolio turnover The fund pays transaction costs, such as commissions, when it buys and sells securities (or “turns over” its portfolio). A higher portfolio turnover rate may indicate higher transaction costs. These costs, which are not reflected in annual fund operating expenses or in the example, affect the fund’s investment results. During the most recent fiscal year, the fund’s portfolio turnover rate was 37% of the average value of its portfolio.
Principal investment strategies The fund invests primarily in common stocks of companies domiciled outside the United States, including companies domiciled in developing countries, that the investment adviser believes have the potential for growth.
The investment adviser uses a system of multiple portfolio managers in managing the fund’s assets. Under this approach, the portfolio of the fund is divided into segments managed by individual managers who decide how their respective segments will be invested.
The fund relies on the professional judgment of its investment adviser to make decisions about the fund’s portfolio investments. The basic investment philosophy of the investment adviser is to seek to invest in attractively valued companies that, in its opinion, represent good, long-term investment opportunities. The investment adviser believes that an important way to accomplish this is through fundamental analysis, which may include meeting with company executives and employees, suppliers, customers and competitors. Securities may be sold when the investment adviser believes that they no longer represent relatively attractive investment opportunities.
54
S-54

American Funds Insurance Series – International Fund / Summary prospectus 2
Principal risks This section describes the principal risks associated with the fund’s principal investment strategies. You may lose money by investing in the fund. The likelihood of loss may be greater if you invest for a shorter period of time. Investors in the fund should have a long-term perspective and be able to tolerate potentially sharp declines in value.
Market conditions — The prices of, and the income generated by, the common stocks and other securities held by the fund may decline – sometimes rapidly or unpredictably – due to various factors, including events or conditions affecting the general economy or particular industries; overall market changes; local, regional or global political, social or economic instability; governmental or governmental agency responses to economic conditions; and currency exchange rate, interest rate and commodity price fluctuations.
Issuer risks — The prices of, and the income generated by, securities held by the fund may decline in response to various factors directly related to the issuers of such securities, including reduced demand for an issuer’s goods or services, poor management performance and strategic initiatives such as mergers, acquisitions or dispositions and the market response to any such initiatives.
Investing in growth-oriented stocks — Growth-oriented common stocks and other equity-type securities (such as preferred stocks, convertible preferred stocks and convertible bonds) may involve larger price swings and greater potential for loss than other types of investments.
Investing outside the United States — Securities of issuers domiciled outside the United States, or with significant operations or revenues outside the United States, may lose value because of adverse political, social, economic or market developments (including social instability, regional conflicts, terrorism and war) in the countries or regions in which the issuers operate or generate revenue. These securities may also lose value due to changes in foreign currency exchange rates against the U.S. dollar and/or currencies of other countries. Issuers of these securities may be more susceptible to actions of foreign governments, such as the imposition of price controls or punitive taxes, that could adversely impact revenues. Securities markets in certain countries may be more volatile and/or less liquid than those in the United States. Investments outside the United States may also be subject to different accounting practices and different regulatory, legal and reporting standards and practices, and may be more difficult to value, than those in the United States. In addition, the value of investments outside the United States may be reduced by foreign taxes, including foreign withholding taxes on interest and dividends. Further, there may be increased risks of delayed settlement of securities purchased or sold by the fund. The risks of investing outside the United States may be heightened in connection with investments in emerging markets.
Investing in emerging markets — Investing in emerging markets may involve risks in addition to and greater than those generally associated with investing in the securities markets of developed countries. For instance, developing countries may have less developed legal and accounting systems than those in developed countries. The governments of these countries may be less stable and more likely to impose capital controls, nationalize a company or industry, place restrictions on foreign ownership and on withdrawing sale proceeds of securities from the country, and/or impose punitive taxes that could adversely affect the prices of securities. In addition, the economies of these countries may be dependent on relatively few industries that are more susceptible to local and global changes. Securities markets in these countries can also be relatively small and have substantially lower trading volumes. As a result, securities issued in these countries may be more volatile and less liquid, and may be more difficult to value, than securities issued in countries with more developed economies and/or markets. Less certainty with respect to security valuations may lead to additional challenges and risks in calculating the fund’s net asset value. Additionally, there may be increased settlement risks for transactions in local securities.
Management — The investment adviser to the fund actively manages the fund’s investments. Consequently, the fund is subject to the risk that the methods and analyses employed by the investment adviser in this process may not produce the desired results. This could cause the fund to lose value or its investment results to lag relevant benchmarks or other funds with similar objectives.
Your investment in the fund is not a bank deposit and is not insured or guaranteed by the Federal Deposit Insurance Corporation or any other governmental agency, entity or person. You should consider how this fund fits into your overall investment program.
55
S-55
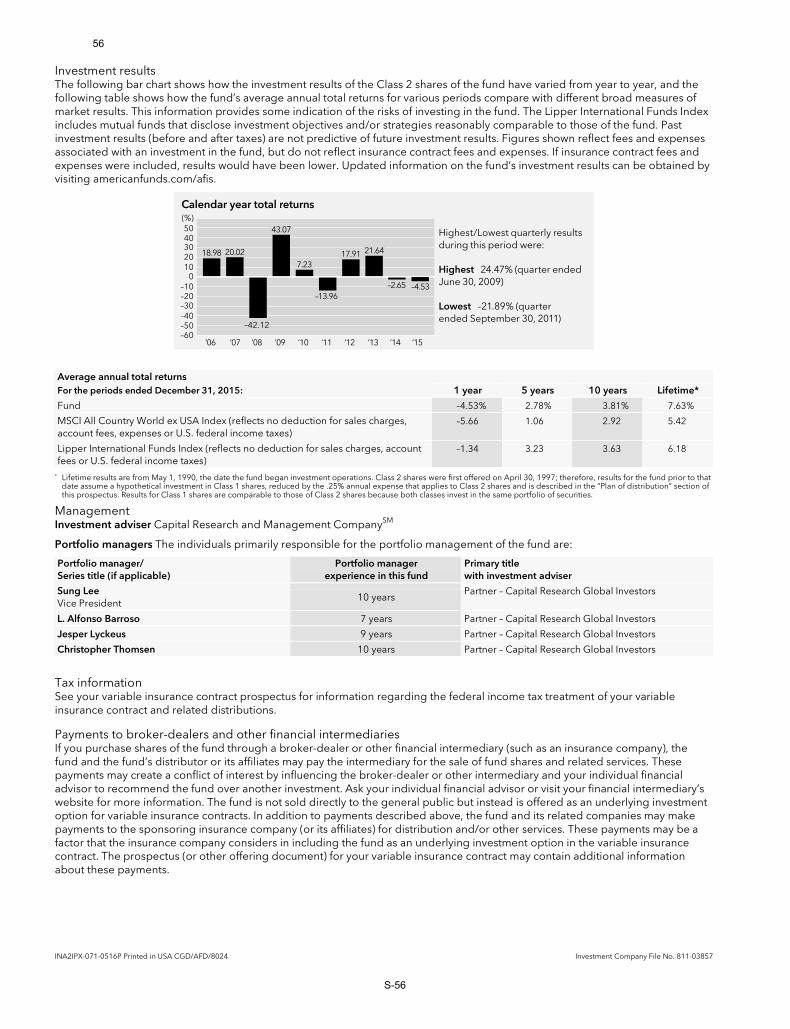
INA2IPX-071-0516P Printed in USA CGD/AFD/8024 Investment Company File No. 811-03857
Investment results The following bar chart shows how the investment results of the Class 2 shares of the fund have varied from year to year, and the following table shows how the fund’s average annual total returns for various periods compare with different broad measures of market results. This information provides some indication of the risks of investing in the fund. The Lipper International Funds Index includes mutual funds that disclose investment objectives and/or strategies reasonably comparable to those of the fund. Past investment results (before and after taxes) are not predictive of future investment results. Figures shown reflect fees and expenses associated with an investment in the fund, but do not reflect insurance contract fees and expenses. If insurance contract fees and expenses were included, results would have been lower. Updated information on the fund’s investment results can be obtained by visiting americanfunds.com/afis.
Calendar year total returns
Highest/Lowest quarterly results during this period were:
Highest 24.47% (quarter ended June 30, 2009)
Lowest –21.89% (quarter ended September 30, 2011)
(%)
01020304050
–30–40
–10–20
–50
’12 ’14’06 ’07 ’08 ’09 ’10
7.23
’11 ’13–60
21.64
43.07
17.91
–13.96
–42.12
–2.65
’15
20.0218.98
–4.53
Average annual total returns For the periods ended December 31, 2015: 1 year 5 years 10 years Lifetime*
Fund –4.53% 2.78% 3.81% 7.63%
MSCI All Country World ex USA Index (reflects no deduction for sales charges, account fees, expenses or U.S. federal income taxes)
–5.66 1.06 2.92 5.42
Lipper International Funds Index (reflects no deduction for sales charges, account fees or U.S. federal income taxes)
–1.34 3.23 3.63 6.18
* Lifetime results are from May 1, 1990, the date the fund began investment operations. Class 2 shares were first offered on April 30, 1997; therefore, results for the fund prior to that date assume a hypothetical investment in Class 1 shares, reduced by the .25% annual expense that applies to Class 2 shares and is described in the “Plan of distribution” section of this prospectus. Results for Class 1 shares are comparable to those of Class 2 shares because both classes invest in the same portfolio of securities.
Management Investment adviser Capital Research and Management CompanySM
Portfolio managers The individuals primarily responsible for the portfolio management of the fund are:
Portfolio manager/ Series title (if applicable)
Portfolio manager experience in this fund
Primary title with investment adviser
Sung Lee Vice President
10 years Partner – Capital Research Global Investors
L. Alfonso Barroso 7 years Partner – Capital Research Global Investors
Jesper Lyckeus 9 years Partner – Capital Research Global Investors
Christopher Thomsen 10 years Partner – Capital Research Global Investors
Tax information See your variable insurance contract prospectus for information regarding the federal income tax treatment of your variable insurance contract and related distributions.
Payments to broker-dealers and other financial intermediaries If you purchase shares of the fund through a broker-dealer or other financial intermediary (such as an insurance company), the fund and the fund’s distributor or its affiliates may pay the intermediary for the sale of fund shares and related services. These payments may create a conflict of interest by influencing the broker-dealer or other intermediary and your individual financial advisor to recommend the fund over another investment. Ask your individual financial advisor or visit your financial intermediary’s website for more information. The fund is not sold directly to the general public but instead is offered as an underlying investment option for variable insurance contracts. In addition to payments described above, the fund and its related companies may make payments to the sponsoring insurance company (or its affiliates) for distribution and/or other services. These payments may be a factor that the insurance company considers in including the fund as an underlying investment option in the variable insurance contract. The prospectus (or other offering document) for your variable insurance contract may contain additional information about these payments.
56
S-56
American Funds Insurance Series®
New World Fund®
Summary prospectus Class 2 shares May 1, 2016
Before you invest, you may want to review the fund’s prospectus and statementof additional information, which contain more information about the fund and itsrisks. You can find the fund’s prospectus, statement of additional information andother information about the fund online at americanfunds.com/afis. You can also get this information at no cost by calling (800) 421-9900, ext. 65413 or by sending an email request to [email protected]. The current prospectus and statement of additional information, dated May 1, 2016, are incorporated by reference into this summary prospectus.
57
S-57

1 American Funds Insurance Series – New World Fund / Summary prospectus
Investment objective The fund’s investment objective is long-term capital appreciation.
Fees and expenses of the fund This table describes the fees and expenses that you may pay if you buy and hold an interest in Class 2 shares of the fund. It does not reflect insurance contract fees and expenses. If insurance contract fees and expenses were reflected, expenses shown would be higher.
Annual fund operating expenses (expenses that you pay each year as a percentage of the value of your investment) Class 2
Management fee 0.72% Distribution and/or service (12b-1) fees 0.25 Other expenses 0.07 Total annual fund operating expenses 1.04
Example This example is intended to help you compare the cost of investing in Class 2 shares of the fund with the cost of investing in other mutual funds.
The example assumes that you invest $10,000 in the fund for the time periods indicated and then redeem all of your shares at the end of those periods. The example also assumes that your investment has a 5% return each year and that the fund’s operating expenses remain the same. The example does not reflect insurance contract expenses. If insurance contract expenses were reflected, expenses shown would be higher. Although your actual costs may be higher or lower, based on these assumptions your costs would be:
1 year 3 years 5 years 10 years
Class 2 $106 $331 $574 $1,271
Portfolio turnover The fund pays transaction costs, such as commissions, when it buys and sells securities (or “turns over” its portfolio). A higher portfolio turnover rate may indicate higher transaction costs. These costs, which are not reflected in annual fund operating expenses or in the example, affect the fund’s investment results. During the most recent fiscal year, the fund’s portfolio turnover rate was 39% of the average value of its portfolio.
Principal investment strategies The fund invests primarily in common stocks of companies with significant exposure to countries with developing economies and/or markets and that the investment adviser believes have potential of providing capital appreciation. The fund may also invest in debt securities of issuers, including issuers of lower rated bonds (rated Ba1 or below and BB+ or below by Nationally Recognized Statistical Rating Organizations designated by the fund’s investment adviser or unrated but determined to be of equivalent quality by the fund’s investment adviser), with exposure to these countries. Bonds rated Ba1 or BB+ or below are sometimes referred to as “junk bonds.”
Under normal market conditions, the fund invests at least 35% of its assets in equity and debt securities of issuers primarily based in qualified countries that have developing economies and/or markets. In determining whether a country is qualified, the fund’s investment adviser considers such factors as the country’s per capita gross domestic product, the percentage of the country’s economy that is industrialized, market capital as a percentage of gross domestic product, the overall regulatory environment, the presence of government regulation limiting or banning foreign ownership, and restrictions on repatriation of initial capital, dividends, interest and/or capital gains. The fund’s investment adviser maintains a list of qualified countries and securities in which the fund may invest.
The fund may invest in equity securities of any company, regardless of where it is based, if the fund’s investment adviser determines that a significant portion of the company’s assets or revenues (generally 20% or more) is attributable to developing countries. In addition, the fund may invest up to 25% of its assets in nonconvertible debt securities of issuers, including issuers of lower rated bonds and government bonds, that are primarily based in qualified countries or that have a significant portion of their assets or revenues attributable to developing countries. The fund may also, to a limited extent, invest in securities of issuers based in nonqualified developing countries.
58
S-58
American Funds Insurance Series – New World Fund / Summary prospectus 2
The investment adviser uses a system of multiple portfolio managers in managing the fund’s assets. Under this approach, the portfolio of the fund is divided into segments managed by individual managers who decide how their respective segments will be invested.
The fund relies on the professional judgment of its investment adviser to make decisions about the fund’s portfolio investments. The basic investment philosophy of the investment adviser is to seek to invest in attractively valued companies that, in its opinion, represent good, long-term investment opportunities. The investment adviser believes that an important way to accomplish this is through fundamental analysis, which may include meeting with company executives and employees, suppliers, customers and competitors. Securities may be sold when the investment adviser believes that they no longer represent relatively attractive investment opportunities.
Principal risks This section describes the principal risks associated with the fund’s principal investment strategies. You may lose money by investing in the fund. The likelihood of loss may be greater if you invest for a shorter period of time. Investors in the fund should have a long-term perspective and be able to tolerate potentially sharp declines in value.
Market conditions — The prices of, and the income generated by, the common stocks and other securities held by the fund may decline – sometimes rapidly or unpredictably – due to various factors, including events or conditions affecting the general economy or particular industries; overall market changes; local, regional or global political, social or economic instability; governmental or governmental agency responses to economic conditions; and currency exchange rate, interest rate and commodity price fluctuations.
Issuer risks — The prices of, and the income generated by, securities held by the fund may decline in response to various factors directly related to the issuers of such securities, including reduced demand for an issuer’s goods or services, poor management performance and strategic initiatives such as mergers, acquisitions or dispositions and the market response to any such initiatives.
Investing in growth-oriented stocks — Growth-oriented common stocks and other equity-type securities (such as preferred stocks, convertible preferred stocks and convertible bonds) may involve larger price swings and greater potential for loss than other types of investments. These risks may be even greater in the case of smaller capitalization stocks.
Investing outside the United States — Securities of issuers domiciled outside the United States, or with significant operations or revenues outside the United States, may lose value because of adverse political, social, economic or market developments (including social instability, regional conflicts, terrorism and war) in the countries or regions in which the issuers operate or generate revenue. These securities may also lose value due to changes in foreign currency exchange rates against the U.S. dollar and/or currencies of other countries. Issuers of these securities may be more susceptible to actions of foreign governments, such as the imposition of price controls or punitive taxes, that could adversely impact revenues. Securities markets in certain countries may be more volatile and/or less liquid than those in the United States. Investments outside the United States may also be subject to different accounting practices and different regulatory, legal and reporting standards and practices, and may be more difficult to value, than those in the United States. In addition, the value of investments outside the United States may be reduced by foreign taxes, including foreign withholding taxes on interest and dividends. Further, there may be increased risks of delayed settlement of securities purchased or sold by the fund. The risks of investing outside the United States may be heightened in connection with investments in emerging markets.
Investing in developing countries — Investing in countries with developing economies and/or markets may involve risks in addition to and greater than those generally associated with investing in developed countries. For instance, developing countries may have less developed legal and accounting systems than those in developed countries. The governments of these countries may be less stable and more likely to impose capital controls, nationalize a company or industry, place restrictions on foreign ownership and on withdrawing sale proceeds of securities from the country, and/or impose punitive taxes that could adversely affect the prices of securities. In addition, the economies of these countries may be dependent on relatively few industries that are more susceptible to local and global changes. Securities markets in these countries can also be relatively small and have substantially lower trading volumes. As a result, securities issued in these countries may be more volatile and less liquid, and may be more difficult to value, than securities issued in countries with more developed economies and/or markets. Less certainty with respect to security valuations may lead to additional challenges and risks in calculating the fund’s net asset value. Additionally, there may be increased settlement risks for transactions in local securities.
Investing in small companies — Investing in smaller companies may pose additional risks. For example, it is often more difficult to value or dispose of small company stocks and more difficult to obtain information about smaller companies than about larger companies. Furthermore, smaller companies often have limited product lines, operating histories, markets and/or financial resources, may be dependent on one or a few key persons for management, and can be more susceptible to losses. Moreover, the prices of their stocks may be more volatile than stocks of larger, more established companies.
59
S-59

3 American Funds Insurance Series – New World Fund / Summary prospectus
Investing in debt instruments — The prices of, and the income generated by, bonds and other debt securities held by the fund may be affected by changing interest rates and by changes in the effective maturities and credit ratings of these securities.
Rising interest rates will generally cause the prices of bonds and other debt securities to fall. Falling interest rates may cause an issuer to redeem, call or refinance a debt security before its stated maturity, which may result in the fund having to reinvest the proceeds in lower yielding securities. Longer maturity debt securities generally have greater sensitivity to changes in interest rates and may be subject to greater price fluctuations than shorter maturity debt securities.
Bonds and other debt securities are also subject to credit risk, which is the possibility that the credit strength of an issuer will weaken and/or an issuer of a debt security will fail to make timely payments of principal or interest and the security will go into default. Lower quality debt securities generally have higher rates of interest and may be subject to greater price fluctuations than higher quality debt securities. Credit risk is gauged, in part, by the credit ratings of the debt securities in which the fund invests. However, ratings are only the opinions of the rating agencies issuing them and are not guarantees as to credit quality or an evaluation of market risk. The fund’s investment adviser relies on its own credit analysts to research issuers and issues in seeking to mitigate various credit and default risks.
Investing in lower rated debt instruments — Lower rated bonds and other lower rated debt securities generally have higher rates of interest and involve greater risk of default or price declines due to changes in the issuer’s creditworthiness than those of higher quality debt securities. The market prices of these securities may fluctuate more than the prices of higher quality debt securities and may decline significantly in periods of general economic difficulty. These risks may be increased with respect to investments in junk bonds.
Thinly traded securities — There may be little trading in the secondary market for particular bonds or other debt securities, which may make them more difficult to value, acquire or sell.
Management — The investment adviser to the fund actively manages the fund’s investments. Consequently, the fund is subject to the risk that the methods and analyses employed by the investment adviser in this process may not produce the desired results. This could cause the fund to lose value or its investment results to lag relevant benchmarks or other funds with similar objectives.
Your investment in the fund is not a bank deposit and is not insured or guaranteed by the Federal Deposit Insurance Corporation or any other governmental agency, entity or person. You should consider how this fund fits into your overall investment program.
Investment results The following bar chart shows how the investment results of the Class 2 shares of the fund have varied from year to year, and the following table shows how the fund’s average annual total returns for various periods compare with different broad measures of market results. This information provides some indication of the risks of investing in the fund. The MSCI Emerging Markets Index reflects the market sectors and securities in which the fund primarily invests. Past investment results (before and after taxes) are not predictive of future investment results. Figures shown reflect fees and expenses associated with an investment in the fund, but do not reflect insurance contract fees and expenses. If insurance contract fees and expenses were included, results would have been lower. Updated information on the fund’s investment results can be obtained by visiting americanfunds.com/afis.
Calendar year total returns
Highest/Lowest quarterly results during this period were:
Highest 23.92% (quarter ended June 30, 2009)
Lowest –22.30% (quarter ended December 31, 2008)
(%)
0
20
40
60
–40
–20
–60
’12’06 ’07 ’08 ’09 ’10
17.87
’11 ’13
32.21
–80
49.65
–42.37
17.8232.59
11.38
–13.95
’14
–7.87
’15
–3.14
Average annual total returns For the periods ended December 31, 2015: 1 year 5 years 10 years Lifetime
Fund (inception date — 6/17/99) –3.14% 0.15% 6.03% 7.58%
MSCI All Country World Index (reflects no deduction for sales charges, account fees, expenses or U.S. federal income taxes)
–2.36 6.09 4.76 3.72
MSCI Emerging Markets Index (reflects no deduction for sales charges, account fees, expenses or U.S. federal income taxes)
–14.92 –4.81 3.61 6.47
60
S-60

INA2IPX-076-0516P Printed in USA CGD/AFD/8024 Investment Company File No. 811-03857
Management Investment adviser Capital Research and Management CompanySM
Portfolio managers The individuals primarily responsible for the portfolio management of the fund are:
Portfolio manager/ Series title (if applicable)
Portfolio manager experience in this fund
Primary title with investment adviser
Carl M. Kawaja Vice President
17 years Partner – Capital World Investors
Nicholas J. Grace 4 years Partner – Capital World Investors
Galen Hoskin 10 years Partner – Capital World Investors
Robert H. Neithart 4 years Partner – Capital Fixed Income Investors Tax information See your variable insurance contract prospectus for information regarding the federal income tax treatment of your variable insurance contract and related distributions.
Payments to broker-dealers and other financial intermediaries If you purchase shares of the fund through a broker-dealer or other financial intermediary (such as an insurance company), the fund and the fund’s distributor or its affiliates may pay the intermediary for the sale of fund shares and related services. These payments may create a conflict of interest by influencing the broker-dealer or other intermediary and your individual financial advisor to recommend the fund over another investment. Ask your individual financial advisor or visit your financial intermediary’s website for more information. The fund is not sold directly to the general public but instead is offered as an underlying investment option for variable insurance contracts. In addition to payments described above, the fund and its related companies may make payments to the sponsoring insurance company (or its affiliates) for distribution and/or other services. These payments may be a factor that the insurance company considers in including the fund as an underlying investment option in the variable insurance contract. The prospectus (or other offering document) for your variable insurance contract may contain additional information about these payments.
61
S-61

SUMMARY PROSPECTUS - MAY 1, 2016 1
SUMMARY PROSPECTUSMay 1, 2016
CALVERT VP EAFE INTERNATIONAL INDEXPORTFOLIOClass: FLink to Prospectus (Table of Contents) Link to Statement of Additional Information (Table of Contents)
Before you invest, you may want to review the Portfolio's Prospectus, which contains more information about the Portfolio and its risks. The Portfolio's Prospectus and Statement of Additional Information (the "SAI"), both dated May 1, 2016, are incorporated by reference into this Summary Prospectus. You can find the Portfolio's Prospectus, the SAI, and other information about the Portfolio online at www.calvert.com/variable. You can also get this information at no cost by calling 1-800-368-2745 or by sending an e-mail request to [email protected], or by asking a financial professional who offers shares of the Portfolio.
INVESTMENT OBJECTIVEThe Portfolio seeks investment results that correspond to the total return performance of common stocks as represented by the MSCI EAFE (Standard) Index (“MSCI EAFE Index”).
FEES AND EXPENSES OF THE PORTFOLIOThis table describes the fees and expenses that you may pay if you invest in shares of the Portfolio.
The table and the following example do not reflect fees and charges imposed under the variable annuity contracts and life insurance policies (each a “Policy”) through which an investment may be made. If those fees and charges were included, costs would be higher. Please consult the prospectus for your Policy for information regarding those fees and charges.
Shareholder Fees (fees paid directly from your investment)Maximum sales charge (load) on purchases NoneMaximum deferred sales charge (load) None
Annual Fund Operating Expenses (expenses that you pay each yearas a % of the value of your investment)Management fees1 0.68%Distribution and service (12b-1) fees 0.20%Other expenses 0.38%Acquired fund fees and expenses 0.01%Total annual fund operating expenses 1.27%Less fee waiver and/or expense reimbursement2 (0.07%)Total annual fund operating expenses after fee waiverand/or expense reimbursement 1.20%
1 Management fees are restated to reflect current contractual fees rather than the fees paid during the previous fiscal year.
2 The investment advisor has agreed to contractually limit direct net annual fund operating expenses to 1.19% through April 30, 2017. This expense limitation does not limit the acquired fund fees and expenses paid indirectly by a shareholder. Only the Board of Directors of the Portfolio may terminate the Portfolio’s expense limitation before the contractual period expires, upon 60 days' prior notice to shareholders. The contractual administrative fee is 0.12%. Calvert has agreed to contractually waive 0.02% of the administrative fee through April 30, 2018.
ExampleThis example is intended to help you compare the cost of investing in the Portfolio with the cost of investing in other mutual funds. The example assumes that:
• you invest $10,000 in the Portfolio for the time periodsindicated;
• your investment has a 5% return each year;• the Portfolio’s operating expenses remain the same; and• any Calvert expense limitation and/or fee waiver is in
effect for the period indicated in the fee table above.
Although your actual costs may be higher or lower, under these assumptions your costs would be:
1 Year 3 Years 5 Years 10 Years$122 $394 $688 $1,526
Portfolio TurnoverThe Portfolio pays transaction costs, such as commissions, when it buys and sells securities (“turns over” its portfolio). A higher portfolio turnover rate may indicate higher transaction costs. These costs, which are not reflected in annual fund operating expenses or in the “Example”, affect the Portfolio’s performance. During the most recent fiscal year, the Portfolio’s portfolio turnover rate was 10% of its portfolio’s average value.
INVESTMENTS, RISKS AND PERFORMANCEPrincipal Investment StrategiesThe Portfolio seeks to substantially replicate the total return of the securities composing the MSCI EAFE Index, taking into consideration redemptions, sales of additional shares, and other adjustments described below. The MSCI EAFE Index is a widely accepted benchmark of international stock performance that emphasizes the stocks of companies in major markets in Europe, Australia and Asia (including the Far East). As of December 31, 2015, the market capitalization of the MSCI EAFE Index companies ranged from $54 million to $237.5 billion with a weighted average level of $48.6 billion. The MSCI EAFE Index is capitalization-weighted, meaning that companies with larger market capitalizations will contribute
62
S-62

2 SUMMARY PROSPECTUS - MAY 1, 2016
more to the Index’s value than companies with smaller market capitalizations.
The Portfolio will invest primarily in common stocks of the companies that compose the MSCI EAFE Index. The Portfolio may also invest in EAFE iShares® or other investment companies that provide the same exposure to the MSCI EAFE Index. EAFE iShares® are units of beneficial interest in a unit investment trust, representing proportionate undivided interests in a portfolio of securities in substantially the same weighting as the common stocks that compose the MSCI EAFE Index. Derivatives such as options and futures, and options on such futures, that provide exposure to the stocks in the MSCI EAFE Index may also be held by the Portfolio incidental to its main investment strategy. The Portfolio may also sell covered calls on futures contracts or individual securities held in the Portfolio. The investments described in this paragraph are considered to have economic characteristics that are the same as those in the MSCI EAFE Index. The Portfolio may also add new investments in the future that it believes provide effective economic exposure to the MSCI EAFE Index.
The Portfolio may not hold investments in common stocks of all of the companies in the MSCI EAFE Index. In that case, the Portfolio will typically choose to hold all of the stocks that make up the largest portion of the MSCI EAFE Index’s market capitalization value in approximately the same proportion as the Index. When choosing the smaller market capitalization stocks in the MSCI EAFE Index, the Portfolio will attempt to select a sampling of stocks that will match the industry and risk characteristics of these companies without buying all of those stocks. This approach attempts to maximize liquidity while minimizing costs. At such time as the Subadvisor believes the Portfolio has achieved sufficient size, the Subadvisor may attempt to fully replicate the Index. Full replication would be achieved when the Portfolio holds all of the securities in the Index in, as nearly as practicable, identical weightings as the Index.
Under normal circumstances, the Portfolio will invest at least 80% of its net assets in investments (described above) with economic characteristics similar to the stocks represented in the MSCI EAFE Index. The Portfolio will provide shareholders with at least 60 days’ notice before changing this 80% policy. While not required, the Portfolio generally will sell securities that the Index manager removes from the Index. Although the Subadvisor will attempt to invest as much of the Portfolio’s assets as is practical in stocks included among the MSCI EAFE Index and futures contracts and options relating thereto under normal market conditions, a portion of the Portfolio may be invested in money market instruments pending investment or to meet redemption requests or other needs for liquid assets.
The Portfolio may invest in American Depositary Receipts (“ADRs”) which may be sponsored or unsponsored.
Principal RisksYou could lose money on your investment in the Portfolio, or the Portfolio could underperform, because of the risks described below. An investment in the Portfolio is not a bank deposit and
is not insured or guaranteed by the Federal Deposit Insurance Corporation or any other government agency.
Management Risk. Individual investments of the Portfolio may not perform as expected, and the portfolio management practices may not achieve the desired result.
Stock Market Risk. The market prices of stocks held by the Portfolio may fall.
Index Tracking Risk. An index fund has operating expenses; a market index does not. The Portfolio, while expected to track its target index as closely as possible, will not be able to match the performance of the index exactly.
Common Stock Risk. Although common stocks have a history of long-term growth in value, their prices fluctuate based on changes in a company’s financial condition, on overall market and economic conditions, and on investors’ perception of a company’s well-being.
Large-Cap Company Risk. Large-cap companies may be unable to respond quickly to new competitive challenges such as changes in technology, and also may not be able to attain the high growth rate of successful smaller companies, especially during extended periods of economic expansion.
Foreign Securities Risk. Investing in foreign securities involves additional risks relating to political, social, and economic developments abroad. Other risks result from the differences between the regulations to which U.S. and foreign issuers and markets are subject, and the potential for foreign markets to be less liquid and more volatile than U.S. markets. Foreign securities include ADRs. Unsponsored ADRs involve additional risks because U.S. reporting requirements do not apply and the issuing bank will recover shareholder distribution costs from movement of share prices and payment of dividends.
Foreign Currency Risk. Securities that trade or are denominated in currencies other than the U.S. dollar may be adversely affected by fluctuations in currency exchange rates. When the U.S. dollar strengthens relative to a foreign currency, the U.S. dollar value of an investment denominated in that currency will typically fall. ADRs indirectly bear currency risk because they represent an interest in securities that are not denominated in U.S. dollars.
Foreign Currency Hedge and Derivatives Risk. Transactions in foreign currency and foreign currency derivatives in connection with the purchase and sale of investments in foreign markets may result in foreign currency exposure and the potential for losses due to fluctuations in currency exchange rates without regard to the quality or performance of the investment itself. The use of foreign currency and foreign currency derivatives may also prevent the Portfolio from realizing profits on favorable movements in exchange rates. In addition, the value of a foreign currency derivative may not correlate to the value of the underlying foreign currency to the extent expected. Derivative instruments are subject to a number of risks, including the risk of changes in the market price of the underlying asset, credit risk with respect to the counterparty, and liquidity risk. The Portfolio’s use of certain derivatives may also have a leveraging effect, which may increase the volatility of
63
S-63
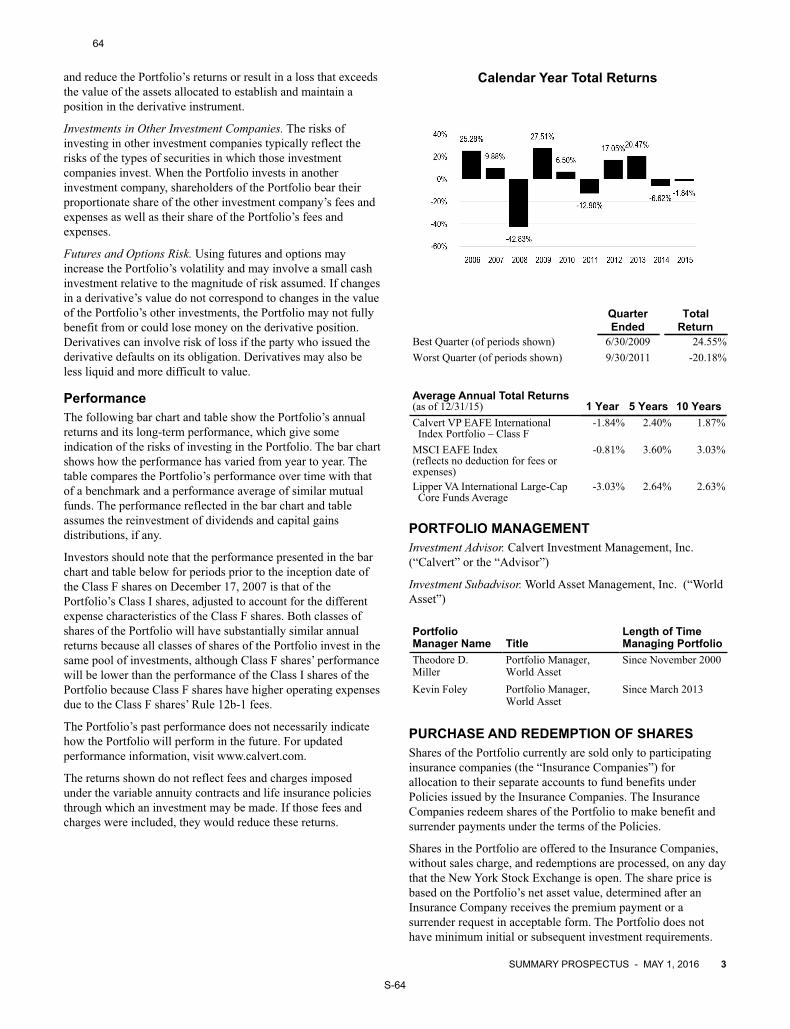
SUMMARY PROSPECTUS - MAY 1, 2016 3
and reduce the Portfolio’s returns or result in a loss that exceeds the value of the assets allocated to establish and maintain a position in the derivative instrument.
Investments in Other Investment Companies. The risks of investing in other investment companies typically reflect the risks of the types of securities in which those investment companies invest. When the Portfolio invests in another investment company, shareholders of the Portfolio bear their proportionate share of the other investment company’s fees and expenses as well as their share of the Portfolio’s fees and expenses.
Futures and Options Risk. Using futures and options may increase the Portfolio’s volatility and may involve a small cash investment relative to the magnitude of risk assumed. If changes in a derivative’s value do not correspond to changes in the value of the Portfolio’s other investments, the Portfolio may not fully benefit from or could lose money on the derivative position. Derivatives can involve risk of loss if the party who issued the derivative defaults on its obligation. Derivatives may also be less liquid and more difficult to value.
PerformanceThe following bar chart and table show the Portfolio’s annual returns and its long-term performance, which give some indication of the risks of investing in the Portfolio. The bar chart shows how the performance has varied from year to year. The table compares the Portfolio’s performance over time with that of a benchmark and a performance average of similar mutual funds. The performance reflected in the bar chart and table assumes the reinvestment of dividends and capital gains distributions, if any.
Investors should note that the performance presented in the bar chart and table below for periods prior to the inception date of the Class F shares on December 17, 2007 is that of the Portfolio’s Class I shares, adjusted to account for the different expense characteristics of the Class F shares. Both classes of shares of the Portfolio will have substantially similar annual returns because all classes of shares of the Portfolio invest in the same pool of investments, although Class F shares’ performance will be lower than the performance of the Class I shares of the Portfolio because Class F shares have higher operating expenses due to the Class F shares’ Rule 12b-1 fees.
The Portfolio’s past performance does not necessarily indicate how the Portfolio will perform in the future. For updated performance information, visit www.calvert.com.
The returns shown do not reflect fees and charges imposed under the variable annuity contracts and life insurance policies through which an investment may be made. If those fees and charges were included, they would reduce these returns.
Calendar Year Total Returns
QuarterEnded
TotalReturn
Best Quarter (of periods shown) 6/30/2009 24.55%Worst Quarter (of periods shown) 9/30/2011 -20.18%
Average Annual Total Returns (as of 12/31/15) 1 Year 5 Years 10 YearsCalvert VP EAFE International Index Portfolio – Class F
-1.84% 2.40% 1.87%
MSCI EAFE Index (reflects no deduction for fees or expenses)
-0.81% 3.60% 3.03%
Lipper VA International Large-Cap Core Funds Average
-3.03% 2.64% 2.63%
PORTFOLIO MANAGEMENTInvestment Advisor. Calvert Investment Management, Inc. (“Calvert” or the “Advisor”)
Investment Subadvisor. World Asset Management, Inc. (“World Asset”)
PortfolioManager Name Title
Length of TimeManaging Portfolio
Theodore D.Miller
Portfolio Manager,World Asset
Since November 2000
Kevin Foley Portfolio Manager,World Asset
Since March 2013
PURCHASE AND REDEMPTION OF SHARESShares of the Portfolio currently are sold only to participating insurance companies (the “Insurance Companies”) for allocation to their separate accounts to fund benefits under Policies issued by the Insurance Companies. The Insurance Companies redeem shares of the Portfolio to make benefit and surrender payments under the terms of the Policies.
Shares in the Portfolio are offered to the Insurance Companies, without sales charge, and redemptions are processed, on any day that the New York Stock Exchange is open. The share price is based on the Portfolio’s net asset value, determined after an Insurance Company receives the premium payment or a surrender request in acceptable form. The Portfolio does not have minimum initial or subsequent investment requirements.
64
S-64

4 SUMMARY PROSPECTUS - MAY 1, 2016
A Policy owner’s interest in the shares of the Portfolio is subject to the terms of the particular Policy described in the prospectus for that Policy. If you are considering purchasing a Policy, you should carefully review the prospectus for that Policy.
TAX INFORMATIONAs a regulated investment company under the Internal Revenue Code, the Portfolio is not subject to federal income tax, or to federal excise tax, to the extent that it distributes its net investment income and realized capital gains to the separate accounts of the Insurance Companies. The Portfolio intends to distribute its net investment income and realized capital gains to the extent necessary to remain qualified as a regulated investment company.
Since the only shareholders of the Portfolio are the Insurance Companies, no discussion is included here regarding the federal income tax consequences at the Policy owner level. For information on the federal tax consequences to you as a purchaser of a Policy, see the prospectus for your Policy.
PAYMENTS TO INSURANCE COMPANIES AND THEIR AFFILIATESThe Portfolio is not sold directly to the general public but instead is offered as an underlying investment option for the Policies. The Portfolio and its related companies may make payments to a sponsoring Insurance Company (or its affiliates) for distribution and/or other services. These payments may be a factor that the Insurance Company considers in including the Portfolio as an underlying investment option in the Policy and may create a conflict of interest. The prospectus (or other offering document) for your Policy may contain additional information about these payments.
Investment Company Act file:
No. 811-04000 Calvert Variable Products, Inc.
Link to Prospectus (Table of Contents) Link to Statement of Additional Information (Table of Contents)
65
S-65

SUMMARY PROSPECTUS - MAY 1, 2016 1
SUMMARY PROSPECTUSMay 1, 2016
CALVERT VP INVESTMENT GRADE BOND INDEXPORTFOLIOClass: ILink to Prospectus (Table of Contents) Link to Statement of Additional Information (Table of Contents)
Before you invest, you may want to review the Portfolio's Prospectus, which contains more information about the Portfolio and its risks. The Portfolio's Prospectus and Statement of Additional Information (the "SAI"), both dated May 1, 2016, are incorporated by reference into this Summary Prospectus. You can find the Portfolio's Prospectus, the SAI, and other information about the Portfolio online at www.calvert.com/variable. You can also get this information at no cost by calling 1-800-368-2745 or by sending an e-mail request to [email protected], or by asking a financial professional who offers shares of the Portfolio.
INVESTMENT OBJECTIVEThe Portfolio seeks investment results that correspond to the total return performance of the bond market, as represented by the Barclays U.S. Aggregate Bond Index (the “Barclays Index”).
FEES AND EXPENSES OF THE PORTFOLIOThis table describes the fees and expenses that you may pay if you invest in shares of the Portfolio.
The table and the following example do not reflect fees and charges imposed under the variable annuity contracts and life insurance policies (each a “Policy”) through which an investment may be made. If those fees and charges were included, costs would be higher. Please consult the prospectus for your Policy for information regarding those fees and charges.
Shareholder Fees (fees paid directly from your investment)Maximum sales charge (load) on purchases NoneMaximum deferred sales charge (load) None
Annual Fund Operating Expenses (expenses that you pay each yearas a % of the value of your investment)Management fees1 0.42%Other expenses 0.12%Total annual fund operating expenses 0.54%Less fee waiver and/or expense reimbursement2 (0.08)%Total annual fund operating expenses after fee waiverand/or expense reimbursement 0.46%
1 Management fees are restated to reflect current contractual fees rather than the fees paid during the previous fiscal year.
2 The investment advisor has agreed to contractually limit direct net annual fund operating expenses to 0.46% through April 30, 2017. This expense limitation does not limit the acquired fund fees and expenses paid indirectly by a shareholder. Only the Board of Directors of the Portfolio may terminate the Portfolio’s expense limitation before the contractual period expires, upon 60 days' prior notice to shareholders. The contractual administrative fee is 0.12%. Calvert has agreed to contractually waive 0.02% of the administrative fee through April 30, 2018.
ExampleThis example is intended to help you compare the cost of investing in the Portfolio with the cost of investing in other mutual funds. The example assumes that:
• you invest $10,000 in the Portfolio for the time periodsindicated;
• your investment has a 5% return each year;• the Portfolio’s operating expenses remain the same; and• any Calvert expense limitation and/or fee waiver is in
effect for the period indicated in the fee table above.
Although your actual costs may be higher or lower, under these assumptions your costs would be:
1 Year 3 Years 5 Years 10 Years$47 $163 $292 $667
Portfolio TurnoverThe Portfolio pays transaction costs, such as commissions, when it buys and sells securities (“turns over” its portfolio). A higher portfolio turnover rate may indicate higher transaction costs. These costs, which are not reflected in annual fund operating expenses or in the “Example”, affect the Portfolio’s performance. During the most recent fiscal year, the Portfolio’s portfolio turnover rate was 6% of its portfolio’s average value.
INVESTMENTS, RISKS AND PERFORMANCEPrincipal Investment StrategiesThe Portfolio seeks to substantially replicate the total return of the securities composing the Barclays Index, taking into consideration redemptions, sales of additional shares, and other adjustments described below. The Barclays Index is an unmanaged index of 9,720 U.S. Treasury, government-related and investment grade corporate and securitized fixed-income securities with a total market value of $18 trillion as of December 31, 2015. The Barclays Index is primarily composed of:• Obligations issued or guaranteed by the U.S. Government or
its agencies or instrumentalities; and
66
S-66

2 SUMMARY PROSPECTUS - MAY 1, 2016
• Publicly-traded or 144A corporate and securitized fixed-income securities that either have a rating of BBB- or higher from Standard & Poor’s Ratings Services or Baa3 or higher from Moody’s Investors Service, Inc., or an equivalent rating from another nationally recognized statistical rating organization (“NRSRO”), or are expected to be rated at that level based on the actual ratings of the issuer’s other “index-eligible” fixed-income securities.
Certain securities, such as floating-rate issues, bonds with equity-type features, private placements, inflation-linked bonds, and SEC Rule 144A securities without registration rights, among others, are excluded from the Barclays Index. As of December 31, 2015, the weighted average maturity of the securities in the Barclays Index was 7.94 years, the weighted average coupon was 3.18% and the weighted average modified duration was 5.68 years. The Barclays Index includes all “index-eligible” securities that meet minimum par amounts outstanding.
The Portfolio will invest primarily in fixed-income securities that compose the Barclays Index and unrated fixed-income securities with a credit quality, as determined by the Advisor or Subadvisor, that is comparable to the securities that compose the Barclays Index. The Portfolio may also invest in Barclays Capital iShares® or other investment companies that provide the same exposure to the Barclays Index or its component indices. Barclays Capital iShares® are units of beneficial interest in a unit investment trust, representing proportionate undivided interests in a portfolio of securities in substantially the same weighting as the securities that compose the Barclays Index. Derivatives such as options and futures, and options on futures, may also be held by the Portfolio incidental to its main investment strategy in an attempt to replicate the total return performance of the Barclays index. The Portfolio may also write covered call options on U.S. Treasury securities and options on futures contracts for such securities.
The Portfolio will not purchase bonds that are rated below investment grade, which are commonly known as junk bonds, as assessed at the time of purchase. However, if a bond held in the Portfolio is downgraded to a rating below investment grade, the Portfolio may continue to hold the security until such time as the Subadvisor deems it most advantageous to dispose of the security. An investment grade debt security is rated BBB- or higher by a nationally recognized statistical rating organization (“NRSRO”), or is an unrated debt security determined by the Advisor to be of comparable credit quality.
The Portfolio will not directly purchase common stocks. However, it may retain up to 5% of the value of its total assets in common stocks acquired either by conversion of fixed-income securities or by the exercise of warrants attached thereto.
Under normal circumstances, the Portfolio will invest at least 80% of its net assets in investments with economic characteristics similar to the fixed-income securities represented in the Barclays Index. The Portfolio will provide shareholders with at least 60 days’ notice before changing this 80% policy. While not required, the Portfolio will generally sell securities that the Index manager removes from the Index. Although the
Subadvisor will attempt to invest and maintain as much of the Portfolio’s assets as is practical in fixed-income securities included among the Barclays Index and futures contracts and options relating thereto under normal market conditions, a portion of the Portfolio may be invested in money market instruments pending investment or to meet redemption requests or other needs for liquid assets.
Principal RisksYou could lose money on your investment in the Portfolio, or the Portfolio could underperform, because of the risks described below. An investment in the Portfolio is not a bank deposit and is not insured or guaranteed by the Federal Deposit Insurance Corporation or any other government agency.
Management Risk. Individual investments of the Portfolio may not perform as expected, and the portfolio management practices may not achieve the desired result.
Bond Market Risk. The market prices of bonds held by the Portfolio may fall.
Index Tracking Risk. An index fund has operating expenses; a market index does not. The Portfolio, while expected to track its target index as closely as possible, will not be able to match the performance of the index exactly.
Credit Risk. The credit quality of fixed-income securities may deteriorate, which could lead to default or bankruptcy of the issuer where the issuer becomes unable to pay its obligations when due.
Mortgage-Backed and Asset-Backed Securities Risk. The value of investments in mortgage-backed and asset-backed securities is subject to interest rate risk and credit risk. These securities are also subject to the risk that borrowers will prepay the principal on their loans more quickly than expected (prepayment risk) or more slowly than expected (extension risk), which will affect the yield, average life and price of the securities. In addition, faster-than-expected prepayments may cause the Portfolio to invest the prepaid principal in lower yielding securities and slower than expected prepayments may reduce the potential for the Portfolio to invest in higher yielding securities.
Mortgage-Backed Security Risk (Government-Sponsored Enterprises). Debt and mortgage-backed securities issued by government-sponsored enterprises (“GSEs”) such as the Federal National Mortgage Association (“FNMA”) and the Federal Home Loan Mortgage Corporation (“FHLMC”) are neither insured nor guaranteed by the U.S. Treasury and are not backed by the full faith and credit of the U.S. government. Such securities are only supported by the credit of the applicable GSE. The U.S. government has provided financial support to FNMA and FHLMC, but there can be no assurance that it will support these or other GSEs in the future.
Collateralized Mortgage Obligation (“CMO”) and Structured Asset-Backed Securities (“ABS”) Risk. A CMO is a multiclass bond that is backed by a pool of mortgage loans or mortgage-backed securities. A structured ABS is a multiclass bond that is typically backed by a pool of auto loans, credit card receivables, home equity loans or student loans. A CMO or structured ABS is subject to interest rate risk, credit risk, prepayment risk and
67
S-67
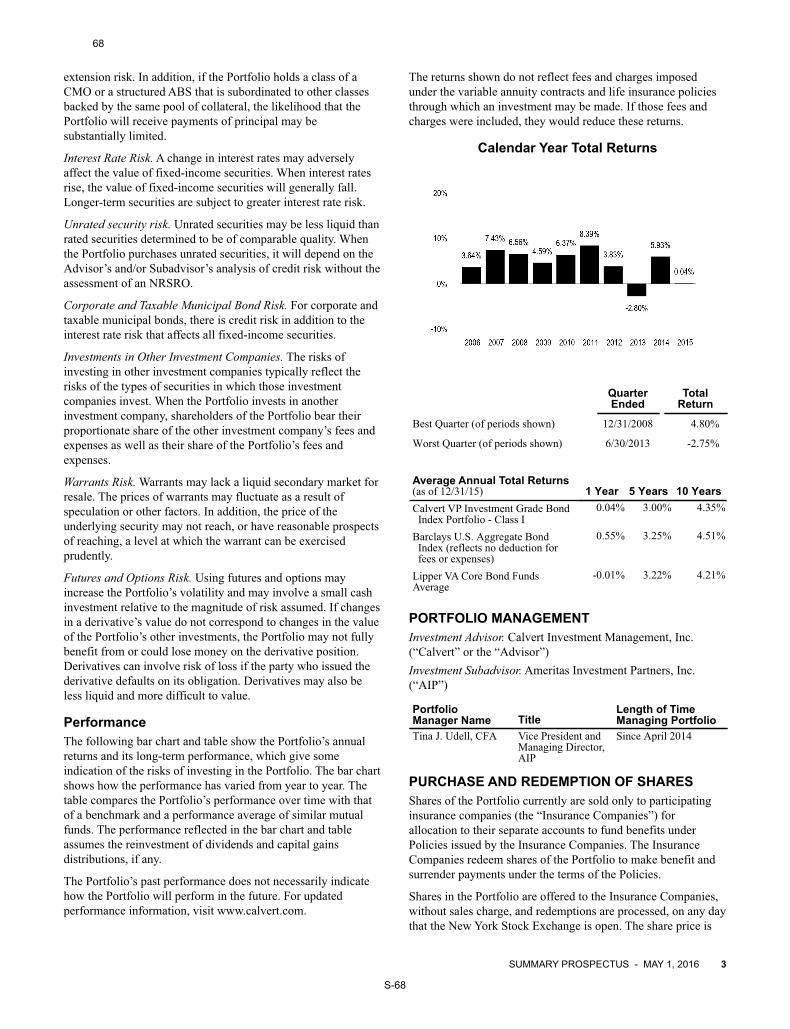
SUMMARY PROSPECTUS - MAY 1, 2016 3
extension risk. In addition, if the Portfolio holds a class of a CMO or a structured ABS that is subordinated to other classes backed by the same pool of collateral, the likelihood that the Portfolio will receive payments of principal may be substantially limited.
Interest Rate Risk. A change in interest rates may adversely affect the value of fixed-income securities. When interest rates rise, the value of fixed-income securities will generally fall. Longer-term securities are subject to greater interest rate risk.
Unrated security risk. Unrated securities may be less liquid than rated securities determined to be of comparable quality. When the Portfolio purchases unrated securities, it will depend on the Advisor’s and/or Subadvisor’s analysis of credit risk without the assessment of an NRSRO.
Corporate and Taxable Municipal Bond Risk. For corporate and taxable municipal bonds, there is credit risk in addition to the interest rate risk that affects all fixed-income securities.
Investments in Other Investment Companies. The risks of investing in other investment companies typically reflect the risks of the types of securities in which those investment companies invest. When the Portfolio invests in another investment company, shareholders of the Portfolio bear their proportionate share of the other investment company’s fees and expenses as well as their share of the Portfolio’s fees and expenses.
Warrants Risk. Warrants may lack a liquid secondary market for resale. The prices of warrants may fluctuate as a result of speculation or other factors. In addition, the price of the underlying security may not reach, or have reasonable prospects of reaching, a level at which the warrant can be exercised prudently.
Futures and Options Risk. Using futures and options may increase the Portfolio’s volatility and may involve a small cash investment relative to the magnitude of risk assumed. If changes in a derivative’s value do not correspond to changes in the value of the Portfolio’s other investments, the Portfolio may not fully benefit from or could lose money on the derivative position. Derivatives can involve risk of loss if the party who issued the derivative defaults on its obligation. Derivatives may also be less liquid and more difficult to value.
PerformanceThe following bar chart and table show the Portfolio’s annual returns and its long-term performance, which give some indication of the risks of investing in the Portfolio. The bar chart shows how the performance has varied from year to year. The table compares the Portfolio’s performance over time with that of a benchmark and a performance average of similar mutual funds. The performance reflected in the bar chart and table assumes the reinvestment of dividends and capital gains distributions, if any.
The Portfolio’s past performance does not necessarily indicate how the Portfolio will perform in the future. For updated performance information, visit www.calvert.com.
The returns shown do not reflect fees and charges imposed under the variable annuity contracts and life insurance policies through which an investment may be made. If those fees and charges were included, they would reduce these returns.
Calendar Year Total Returns
QuarterEnded
TotalReturn
Best Quarter (of periods shown) 12/31/2008 4.80%
Worst Quarter (of periods shown) 6/30/2013 -2.75%
Average Annual Total Returns (as of 12/31/15) 1 Year 5 Years 10 YearsCalvert VP Investment Grade Bond Index Portfolio - Class I
0.04% 3.00% 4.35%
Barclays U.S. Aggregate BondIndex (reflects no deduction forfees or expenses)
0.55% 3.25% 4.51%
Lipper VA Core Bond Funds Average
-0.01% 3.22% 4.21%
PORTFOLIO MANAGEMENTInvestment Advisor. Calvert Investment Management, Inc. (“Calvert” or the “Advisor”)Investment Subadvisor. Ameritas Investment Partners, Inc. (“AIP”)
PortfolioManager Name Title
Length of TimeManaging Portfolio
Tina J. Udell, CFA Vice President and Managing Director, AIP
Since April 2014
PURCHASE AND REDEMPTION OF SHARESShares of the Portfolio currently are sold only to participating insurance companies (the “Insurance Companies”) for allocation to their separate accounts to fund benefits under Policies issued by the Insurance Companies. The Insurance Companies redeem shares of the Portfolio to make benefit and surrender payments under the terms of the Policies.
Shares in the Portfolio are offered to the Insurance Companies, without sales charge, and redemptions are processed, on any day that the New York Stock Exchange is open. The share price is
68
S-68

4 SUMMARY PROSPECTUS - MAY 1, 2016
based on the Portfolio’s net asset value, determined after an Insurance Company receives the premium payment or a surrender request in acceptable form. The Portfolio does not have minimum initial or subsequent investment requirements.
A Policy owner’s interest in the shares of the Portfolio is subject to the terms of the particular Policy described in the prospectus for that Policy. If you are considering purchasing a Policy, you should carefully review the prospectus for that Policy.
TAX INFORMATIONAs a regulated investment company under the Internal Revenue Code, the Portfolio is not subject to federal income tax, or to federal excise tax, to the extent that it distributes its net investment income and realized capital gains to the separate accounts of the Insurance Companies. The Portfolio intends to distribute its net investment income and realized capital gains to the extent necessary to remain qualified as a regulated investment company.
Since the only shareholders of the Portfolio are the Insurance Companies, no discussion is included here regarding the federal income tax consequences at the Policy owner level. For information on the federal tax consequences to you as a purchaser of a Policy, see the prospectus for your Policy.
PAYMENTS TO INSURANCE COMPANIES AND THEIR AFFILIATESThe Portfolio is not sold directly to the general public but instead is offered as an underlying investment option for the Policies. The Portfolio and its related companies may make payments to a sponsoring Insurance Company (or its affiliates) for distribution and/or other services. These payments may be a factor that the Insurance Company considers in including the Portfolio as an underlying investment option in the Policy and may create a conflict of interest. The prospectus (or other offering document) for your Policy may contain additional information about these payments.
Investment Company Act file:
No. 811-04000 Calvert Variable Products, Inc.
Link to Prospectus (Table of Contents) Link to Statement of Additional Information (Table of Contents)
69
S-69
SUMMARY PROSPECTUS - MAY 1, 2016 1
SUMMARY PROSPECTUSMay 1, 2016
CALVERT VP RUSSELL 2000 SMALL CAP INDEXPORTFOLIOClass: FLink to Prospectus (Table of Contents) Link to Statement of Additional Information (Table of Contents)
Before you invest, you may want to review the Portfolio's Prospectus, which contains more information about the Portfolio and its risks. The Portfolio's Prospectus and Statement of Additional Information (the "SAI"), both dated May 1, 2016, are incorporated by reference into this Summary Prospectus. You can find the Portfolio's Prospectus, the SAI, and other information about the Portfolio online at www.calvert.com/variable. You can also get this information at no cost by calling 1-800-368-2745 or by sending an e-mail request to [email protected], or by asking a financial professional who offers shares of the Portfolio.
INVESTMENT OBJECTIVEThe Portfolio seeks investment results that correspond to the investment performance of U.S. common stocks, as represented by the Russell 2000 Index.
FEES AND EXPENSES OF THE PORTFOLIOThis table describes the fees and expenses that you may pay if you invest in shares of the Portfolio.
The table and the following example do not reflect fees and charges imposed under the variable annuity contracts and life insurance policies (each a “Policy”) through which an investment may be made. If those fees and charges were included, costs would be higher. Please consult the prospectus for your Policy for information regarding those fees and charges.
Shareholder Fees (fees paid directly from your investment)Maximum sales charge (load) on purchases NoneMaximum deferred sales charge (load) None
Annual Fund Operating Expenses (expenses that you pay each yearas a % of the value of your investment)Management fees1 0.47%Distribution and service (12b-1) fees 0.20%Other expenses 0.36%Total annual fund operating expenses 1.03%Less fee waiver and/or expense reimbursement2 (0.25%)Total annual fund operating expenses after fee waiverand/or expense reimbursement 0.78%
1 Management fees are restated to reflect current contractual fees rather than the fees paid during the previous fiscal year.
2 The investment advisor has agreed to contractually limit direct net annual fund operating expenses to 0.78% through April 30, 2017. This expense limitation does not limit the acquired fund fees and expenses paid indirectly by a shareholder. Only the Board of Directors of the Portfolio may terminate the Portfolio’s expense limitation before the contractual period expires, upon 60 days' prior notice to shareholders. The contractual administrative fee is 0.12%. Calvert has agreed to contractually waive 0.02% of the administrative fee through April 30, 2018.
ExampleThis example is intended to help you compare the cost of investing in the Portfolio with the cost of investing in other mutual funds. The example assumes that:
• you invest $10,000 in the Portfolio for the time periodsindicated;
• your investment has a 5% return each year;• the Portfolio’s operating expenses remain the same; and• any Calvert expense limitation and/or fee waiver is in
effect for the period indicated in the fee table above.
Although your actual costs may be higher or lower, under these assumptions your costs would be:
1 Year 3 Years 5 Years 10 Years$80 $301 $542 $1,235
Portfolio TurnoverThe Portfolio pays transaction costs, such as commissions, when it buys and sells securities (“turns over” its portfolio). A higher portfolio turnover rate may indicate higher transaction costs. These costs, which are not reflected in annual fund operating expenses or in the “Example”, affect the Portfolio’s performance. During the most recent fiscal year, the Portfolio’s portfolio turnover rate was 14% of its portfolio’s average value.
INVESTMENTS, RISKS AND PERFORMANCE Principal Investment StrategiesThe Portfolio seeks to substantially replicate the total return of the securities composing the Russell 2000 Index, taking into consideration redemptions, sales of additional shares, and other adjustments described below. The Russell 2000 Index is an unmanaged index comprising common stocks of approximately 2000 smaller U.S. companies that aims to include approximately 10% of the total market capitalization of the broader Russell 3000 Index. As of December 31, 2015, the market capitalization of the Russell 2000 Index companies ranged from $15 million to $5.9 billion with a weighted average level of $1.9 billion. The Russell 2000 Index is capitalization-weighted, meaning that companies with larger market
70
S-70

2 SUMMARY PROSPECTUS - MAY 1, 2016
capitalizations will contribute more to the Index’s value than companies whose securities have smaller market capitalizations.
The Portfolio will invest primarily in common stocks of the companies that compose the Russell 2000 Index. The Portfolio may also invest in Russell 2000 iShares® or other investment companies that provide the same exposure to the Russell 2000 Index. Russell 2000 iShares® are units of beneficial interest in a unit investment trust, representing proportionate undivided interests in a portfolio of securities in substantially the same weighting as the common stocks that compose the Russell 2000 Index. Derivatives such as Russell 2000 Index options and futures, and options on such futures (or S&P MidCap 400 or S&P 500 Index options and futures, and options on such futures, if, in the opinion of the Advisor or Subadvisor, it is not practical to invest in Russell 2000 index options or futures, or options on such futures, at a particular time due to liquidity or price considerations), may also be held by the Portfolio incidental to its main investment strategy in order to invest uncommitted cash balances, to maintain liquidity to meet shareholder redemptions, or minimize trading costs. The Portfolio may also sell covered calls on futures contracts or individual securities held in the Portfolio.
Under normal circumstances, the Portfolio will invest at least 80% of its net assets in investments with economic characteristics similar to small cap stocks as represented in the Russell 2000 Index. The Portfolio will provide shareholders with at least 60 days’ notice before changing this 80% policy. While not required, the Portfolio will generally sell securities that the Index manager removes from the Index. Although the Subadvisor will attempt to invest and maintain as much of the Portfolio’s assets as is practical in stocks included among the Russell 2000 Index and futures contracts and options relating thereto under normal market conditions, a portion of the Portfolio may be invested in money market instruments pending investment or to meet redemption requests or other needs for liquid assets.
Principal RisksYou could lose money on your investment in the Portfolio, or the Portfolio could underperform, because of the risks described below. An investment in the Portfolio is not a bank deposit and is not insured or guaranteed by the Federal Deposit Insurance Corporation or any other government agency.
Management Risk. Individual investments of the Portfolio may not perform as expected, and the portfolio management practices may not achieve the desired result.
Stock Market Risk. The market prices of stocks held by the Portfolio may fall.
Index Tracking Risk. An index fund has operating expenses; a market index does not. The Portfolio, while expected to track its target index as closely as possible, will not be able to match the performance of the index exactly.
Common Stock Risk. Although common stocks have a history of long-term growth in value, their prices fluctuate based on changes in a company’s financial condition, on overall market
and economic conditions, and on investors’ perception of a company’s well-being.
Small-Cap Company Risk. Prices of small-cap stocks can be more volatile than those of larger, more established companies. Small-cap companies are more likely to have more limited product lines, fewer capital resources and less depth of management than larger companies.
Investments in Other Investment Companies. The risks of investing in other investment companies typically reflect the risks of the types of securities in which those investment companies invest. When the Portfolio invests in another investment company, shareholders of the Portfolio bear their proportionate share of the other investment company’s fees and expenses as well as their share of the Portfolio’s fees and expenses.
Futures and Options Risk. Using futures and options may increase the Portfolio’s volatility and may involve a small cash investment relative to the magnitude of risk assumed. If changes in a derivative’s value do not correspond to changes in the value of the Portfolio’s other investments, the Portfolio may not fully benefit from or could lose money on the derivative position. Derivatives can involve risk of loss if the party who issued the derivative defaults on its obligation. Derivatives may also be less liquid and more difficult to value.
PerformanceThe following bar chart and table show the Portfolio’s annual returns and its long-term performance, which give some indication of the risks of investing in the Portfolio. The bar chart shows how the performance has varied from year to year. The table compares the Portfolio’s performance over time with that of a benchmark and a performance average of similar mutual funds. The performance reflected in the bar chart and table assumes the reinvestment of dividends and capital gains distributions, if any.
Investors should note that the performance presented in the bar chart and table below for periods prior to the inception date of the Class F shares on October 4, 2005 is that of the Portfolio’s Class I shares, adjusted to account for the different expense characteristics of the Class F shares. Both classes of shares of the Portfolio will have substantially similar annual returns because all classes of shares of the Portfolio invest in the same pool of investments, although Class F shares’ performance will be lower than the performance of the Class I shares of the Portfolio because Class F shares have higher operating expenses due to the Class F shares’ Rule 12b-1 fees.
The Portfolio’s past performance does not necessarily indicate how the Portfolio will perform in the future. For updated performance information, visit www.calvert.com.
The returns shown do not reflect fees and charges imposed under the variable annuity contracts and life insurance policies through which an investment may be made. If those fees and charges were included, they would reduce these returns.
71
S-71
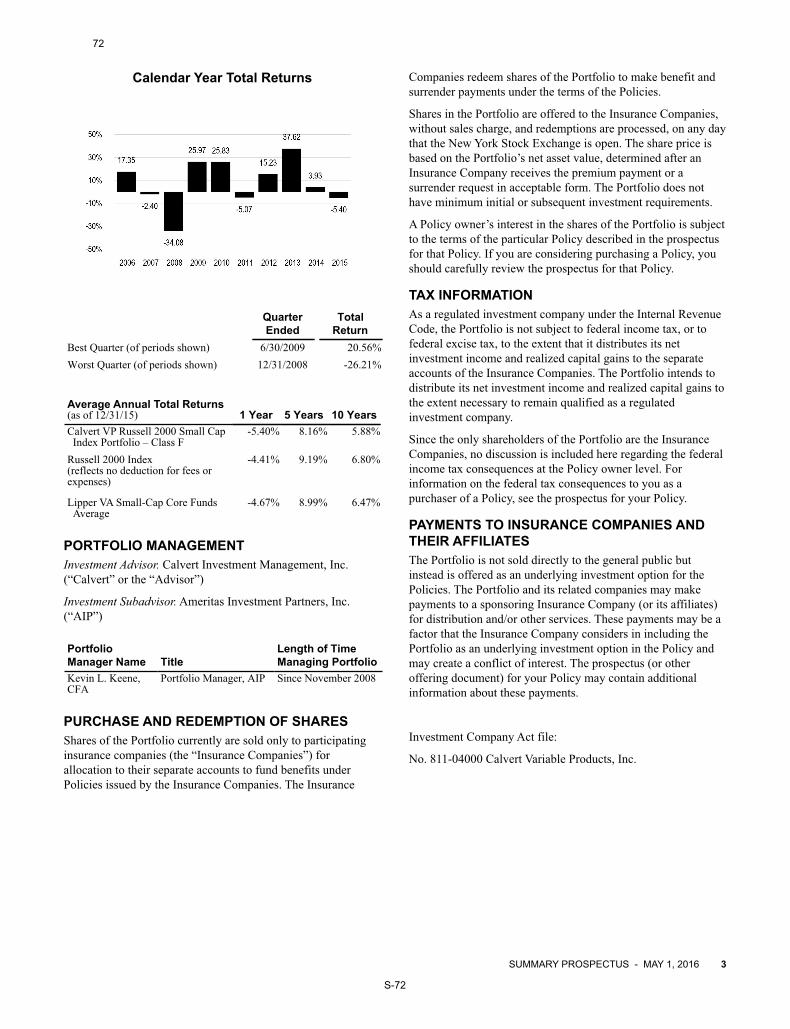
SUMMARY PROSPECTUS - MAY 1, 2016 3
Calendar Year Total Returns
QuarterEnded
TotalReturn
Best Quarter (of periods shown) 6/30/2009 20.56%Worst Quarter (of periods shown) 12/31/2008 -26.21%
Average Annual Total Returns (as of 12/31/15) 1 Year 5 Years 10 YearsCalvert VP Russell 2000 Small Cap Index Portfolio – Class F
-5.40% 8.16% 5.88%
Russell 2000 Index (reflects no deduction for fees or expenses)
-4.41% 9.19% 6.80%
Lipper VA Small-Cap Core Funds Average
-4.67% 8.99% 6.47%
PORTFOLIO MANAGEMENTInvestment Advisor. Calvert Investment Management, Inc. (“Calvert” or the “Advisor”)
Investment Subadvisor. Ameritas Investment Partners, Inc. (“AIP”)
PortfolioManager Name Title
Length of TimeManaging Portfolio
Kevin L. Keene,CFA
Portfolio Manager, AIP Since November 2008
PURCHASE AND REDEMPTION OF SHARESShares of the Portfolio currently are sold only to participating insurance companies (the “Insurance Companies”) for allocation to their separate accounts to fund benefits under Policies issued by the Insurance Companies. The Insurance
Companies redeem shares of the Portfolio to make benefit and surrender payments under the terms of the Policies.
Shares in the Portfolio are offered to the Insurance Companies, without sales charge, and redemptions are processed, on any day that the New York Stock Exchange is open. The share price is based on the Portfolio’s net asset value, determined after an Insurance Company receives the premium payment or a surrender request in acceptable form. The Portfolio does not have minimum initial or subsequent investment requirements.
A Policy owner’s interest in the shares of the Portfolio is subject to the terms of the particular Policy described in the prospectus for that Policy. If you are considering purchasing a Policy, you should carefully review the prospectus for that Policy.
TAX INFORMATIONAs a regulated investment company under the Internal Revenue Code, the Portfolio is not subject to federal income tax, or to federal excise tax, to the extent that it distributes its net investment income and realized capital gains to the separate accounts of the Insurance Companies. The Portfolio intends to distribute its net investment income and realized capital gains to the extent necessary to remain qualified as a regulated investment company.
Since the only shareholders of the Portfolio are the Insurance Companies, no discussion is included here regarding the federal income tax consequences at the Policy owner level. For information on the federal tax consequences to you as a purchaser of a Policy, see the prospectus for your Policy.
PAYMENTS TO INSURANCE COMPANIES AND THEIR AFFILIATESThe Portfolio is not sold directly to the general public but instead is offered as an underlying investment option for the Policies. The Portfolio and its related companies may make payments to a sponsoring Insurance Company (or its affiliates) for distribution and/or other services. These payments may be a factor that the Insurance Company considers in including the Portfolio as an underlying investment option in the Policy and may create a conflict of interest. The prospectus (or other offering document) for your Policy may contain additional information about these payments.
Investment Company Act file:
No. 811-04000 Calvert Variable Products, Inc.
Link to Prospectus (Table of Contents) Link to Statement of Additional Information (Table of Contents)
72
S-72

Summary Prospectus May 1, 2016
Share class (Symbol): I (QLMMIX)
CLEARBRIDGEVARIABLE MID CAPPORTFOLIOShares of the fund are offered only to insurance company separate accounts that fund certainvariable annuity and variable life insurance contracts and to qualified retirement and pensionplans. This Summary Prospectus should be read together with the prospectus for thosecontracts and information for those plans.
Before you invest, you may want to review the fund’s Prospectus, which contains moreinformation about the fund and its risks. You can find the fund’s Prospectus and other informationabout the fund, including the fund’s statement of additional information and shareholder reports,online at http://www.leggmason.com/individualinvestors/variable-investment-prospectuses (clickon the name of the fund). You can also get this information at no cost by calling the fund at1-877-721-1926 or by sending an e-mail request to [email protected], or from yourfinancial intermediary. The fund’s Prospectus, dated May 1, 2016 and as may be amended orfurther supplemented, the fund’s statement of additional information, dated May 1, 2016 and asmay be amended or further supplemented, and the independent registered public accountingfirm’s report and financial statements in the fund’s annual report to shareholders, datedDecember 31, 2015, are incorporated by reference into this Summary Prospectus.
Investment objectiveThe fund seeks long-term growth of capital.
Fees and expenses of the fundThe accompanying table describes the fees and expenses that you may pay if you buy and holdClass I shares of the fund. The fee table and expense example do not reflect expenses incurredfrom investing through a separate account or qualified plan and do not reflect variable annuity orlife insurance contract charges. If they did, the overall fees and expenses would be higher thanthose shown. Detailed information about the cost of investing in this fund through a separate
INVESTMENT PRODUCTS: NOT FDIC INSURED • NO BANK GUARANTEE • MAY LOSE VALUE
73
S-73

account or qualified plan is presented in the contract prospectus through which the fund’s sharesare offered to you or in the information provided by your plan.
Shareholder fees(fees paid directly from your investment)
Maximum sales charge (load) imposed on purchases N/A
Maximum deferred sales charge (load) N/A
Annual fund operating expenses (%)(expenses that you pay each year as a percentage of the value of your investment)
Management fees 0.75
Distribution and/or service (12b-1) fees None
Other expenses 0.10
Total annual fund operating expenses 0.85
ExampleThis example is intended to help you compare the cost of investing in Class I shares of the fundwith the cost of investing in other mutual funds. The example does not include expenses incurredfrom investing through a separate account or qualified plan. If the example included theseexpenses, the figures shown would be higher. The example assumes:
‰ You invest $10,000 in the fund for the time periods indicated‰ Your investment has a 5% return each year and the fund’s operating expenses remain the same‰ You reinvest all distributions and dividends without a sales charge
Although your actual costs may be higher or lower, based on these assumptions your costs would be:
Number of years you own your shares ($)1 year 3 years 5 years 10 years
Class I (with or without redemption at end of period) 87 271 471 1,048
Portfolio turnover. The fund pays transaction costs, such as commissions, when it buys and sellssecurities (or “turns over” its portfolio). A higher portfolio turnover rate may indicate highertransaction costs. These costs, which are not reflected in annual fund operating expenses or inthe example, affect the fund’s performance. During the most recent fiscal year, the fund’sportfolio turnover rate was 48% of the average value of its portfolio.
Principal investment strategiesUnder normal circumstances, the fund invests at least 80% of its net assets, plus borrowings forinvestment purposes, if any, in equity securities, or other investments with similar economiccharacteristics, of medium capitalization companies. The fund may invest up to 20% of its assetsin equity securities of companies other than medium capitalization companies.
The fund may invest up to 25% of its net assets in foreign securities.
2 ClearBridge Variable Mid Cap Portfolio
74
S-74
Principal risksRisk is inherent in all investing. The value of your investment in the fund, as well as the amountof return you receive on your investment, may fluctuate significantly. You may lose part or all ofyour investment in the fund or your investment may not perform as well as other similarinvestments. The following is a summary description of certain risks of investing in the fund.
Stock market and equity securities risk. The securities markets are volatile and the market pricesof the fund’s securities may decline generally. Securities fluctuate in price based on changes in acompany’s financial condition and overall market and economic conditions. If the market prices ofthe securities owned by the fund fall, the value of your investment in the fund will decline.
Market events risk. In the past several years financial markets, such as those in the UnitedStates, Europe, Asia and elsewhere, have experienced increased volatility, depressed valuations,decreased liquidity and heightened uncertainty. Governmental and non-governmental issuershave defaulted on, or been forced to restructure, their debts. These conditions may continue,recur, worsen or spread.
The U.S. government and the Federal Reserve, as well as certain foreign governments and centralbanks, have taken steps to support financial markets, including by keeping interest rates athistorically low levels. This and other government intervention may not work as intended,particularly if the efforts are perceived by investors as being unlikely to achieve the desiredresults. The Federal Reserve recently has reduced its market support activities. Further reductionor withdrawal of Federal Reserve or other U.S. or non-U.S. governmental or central bank support,including interest rate increases, could negatively affect financial markets generally, increasemarket volatility and reduce the value and liquidity of securities in which the fund invests.
Policy and legislative changes in the United States and in other countries are affecting manyaspects of financial regulation, and may in some instances contribute to decreased liquidity andincreased volatility in the financial markets. The impact of these changes on the markets, and thepractical implications for market participants, may not be fully known for some time.
Economies and financial markets throughout the world are becoming increasingly interconnected.As a result, whether or not the fund invests in securities of issuers located in or with significantexposure to countries experiencing economic and financial difficulties, the value and liquidity ofthe fund’s investments may be negatively affected.
Medium capitalization company risk. The fund will be exposed to additional risks as a result of itsinvestments in the securities of medium capitalization companies. Medium capitalizationcompanies may fall out of favor with investors; may have limited product lines, operatinghistories, markets or financial resources; or may be dependent upon a limited management group.The prices of securities of medium capitalization companies generally are more volatile thanthose of large capitalization companies and are more likely to be adversely affected than largecapitalization companies by changes in earnings results and investor expectations or pooreconomic or market conditions, including those experienced during a recession. Securities ofmedium capitalization companies may underperform large capitalization companies, may beharder to sell at times and at prices the portfolio managers believe appropriate and may offergreater potential for losses.
ClearBridge Variable Mid Cap Portfolio 3
75
S-75

Issuer risk. The value of a security can go up or down more than the market as a whole and canperform differently from the value of the market as a whole, often due to disappointing earningsreports by the issuer, unsuccessful products or services, loss of major customers, major litigationagainst the issuer or changes in government regulations affecting the issuer or the competitiveenvironment. The fund may experience a substantial or complete loss on an individual security.
Liquidity risk. Some assets held by the fund may be impossible or difficult to sell, particularlyduring times of market turmoil. These illiquid assets may also be difficult to value. If the fund isforced to sell an illiquid asset to meet redemption requests or other cash needs, the fund may beforced to sell at a loss.
Foreign investments risk. The fund’s investments in securities of foreign issuers or issuers withsignificant exposure to foreign markets involve additional risk. Foreign countries in which the fundmay invest may have markets that are less liquid, less regulated and more volatile than U.S.markets. The value of the fund’s investments may decline because of factors affecting theparticular issuer as well as foreign markets and issuers generally, such as unfavorable orunsuccessful government actions, reduction of government or central bank support and politicalor financial instability. Lack of information may also affect the value of these securities.
The risks of foreign investments are heightened when investing in issuers in emerging marketcountries.
Currency risk. The value of investments in securities denominated in foreign currencies increasesor decreases as the rates of exchange between those currencies and the U.S. dollar change.Currency conversion costs and currency fluctuations could erase investment gains or add toinvestment losses. Currency exchange rates can be volatile, and are affected by factors such asgeneral economic conditions, the actions of the U.S. and foreign governments or central banks,the imposition of currency controls and speculation.
Portfolio management risk. The value of your investment may decrease if the subadviser’sjudgment about the attractiveness or value of, or market trends affecting a particular security,industry, sector or region, or about market movements is incorrect, or if there are imperfections,errors or limitations in the tools and data used by the subadviser. In addition, the fund’sinvestment strategies or policies may change from time to time. Those changes may not lead tothe results intended by the subadviser and could have an adverse effect on the value orperformance of the fund.
Cybersecurity risk. Cybersecurity incidents may allow an unauthorized party to gain access to fundassets, customer data (including private shareholder information), or proprietary information, orcause the fund, the manager, any subadviser and/or its service providers (including, but notlimited to, fund accountants, custodians, sub-custodians, transfer agents and financialintermediaries) to suffer data breaches, data corruption or lose operational functionality.
These risks are discussed in more detail in the fund’s Prospectus or in the statement of additionalinformation (“SAI”).
PerformanceThe accompanying bar chart and table provide some indication of the risks of investing in Class Ishares of the fund. The bar chart shows changes in the fund’s performance from year to year of
4 ClearBridge Variable Mid Cap Portfolio
76
S-76
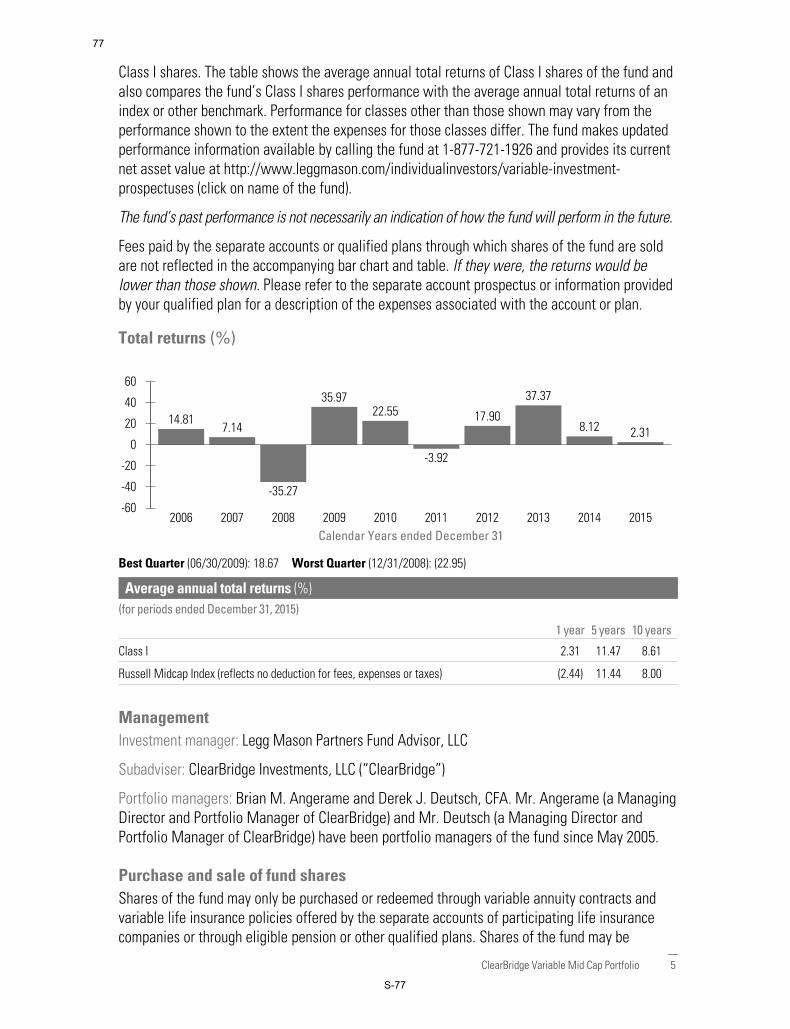
Class I shares. The table shows the average annual total returns of Class I shares of the fund andalso compares the fund’s Class I shares performance with the average annual total returns of anindex or other benchmark. Performance for classes other than those shown may vary from theperformance shown to the extent the expenses for those classes differ. The fund makes updatedperformance information available by calling the fund at 1-877-721-1926 and provides its currentnet asset value at http://www.leggmason.com/individualinvestors/variable-investment-prospectuses (click on name of the fund).
The fund’s past performance is not necessarily an indication of how the fund will perform in the future.
Fees paid by the separate accounts or qualified plans through which shares of the fund are soldare not reflected in the accompanying bar chart and table. If they were, the returns would belower than those shown. Please refer to the separate account prospectus or information providedby your qualified plan for a description of the expenses associated with the account or plan.
Total returns (%)
-40
-60
-20
0
20
40
60
Calendar Years ended December 312006 2007 2008 2009 2010 2011 2012 2013 2014 2015
14.817.14
-35.27
35.9722.55
-3.92
17.90
37.37
8.12 2.31
Best Quarter (06/30/2009): 18.67 Worst Quarter (12/31/2008): (22.95)
Average annual total returns (%)(for periods ended December 31, 2015)
1 year 5 years 10 years
Class I 2.31 11.47 8.61
Russell Midcap Index (reflects no deduction for fees, expenses or taxes) (2.44) 11.44 8.00
ManagementInvestment manager: Legg Mason Partners Fund Advisor, LLC
Subadviser: ClearBridge Investments, LLC (“ClearBridge”)
Portfolio managers: Brian M. Angerame and Derek J. Deutsch, CFA. Mr. Angerame (a ManagingDirector and Portfolio Manager of ClearBridge) and Mr. Deutsch (a Managing Director andPortfolio Manager of ClearBridge) have been portfolio managers of the fund since May 2005.
Purchase and sale of fund sharesShares of the fund may only be purchased or redeemed through variable annuity contracts andvariable life insurance policies offered by the separate accounts of participating life insurancecompanies or through eligible pension or other qualified plans. Shares of the fund may be
ClearBridge Variable Mid Cap Portfolio 5
77
S-77

purchased and redeemed each day the New York Stock Exchange is open, at the fund’s net assetvalue determined after receipt of a request in good order.
The fund does not have any initial or subsequent investment minimums. However, your insurancecompany, pension plan or retirement plan may impose investment minimums.
Tax informationDistributions made by the fund to an insurance company separate account, and exchanges andredemptions of fund shares made by a separate account, ordinarily do not cause thecorresponding contract holder to recognize income or gain for federal income tax purposes. Seethe accompanying contract prospectus for information regarding the federal income tax treatmentof the distributions to separate accounts and the holders of the contracts.
Payments to broker/dealers and other financial intermediariesThe fund’s related companies may pay broker/dealers or other financial intermediaries (such as abank or an insurance company) for the sale of fund shares, shareholder services and otherpurposes. These payments create a conflict of interest by influencing your broker/dealer or otherintermediary or its employees or associated persons to recommend the fund over anotherinvestment. Ask your financial adviser or salesperson or visit your financial intermediary’s orsalesperson’s website for more information.
6 ClearBridge Variable Mid Cap Portfolio
78
S-78

FDXX010718SP 05/16
79
S-79

Summary Prospectus May 1, 2016
Share class (Symbol): I (QLMSIX)
CLEARBRIDGEVARIABLE SMALL CAPGROWTH PORTFOLIOShares of the fund are offered only to insurance company separate accounts that fund certainvariable annuity and variable life insurance contracts and to qualified retirement and pensionplans. This Summary Prospectus should be read together with the prospectus for thosecontracts and information for those plans.
Before you invest, you may want to review the fund’s Prospectus, which contains moreinformation about the fund and its risks. You can find the fund’s Prospectus and other informationabout the fund, including the fund’s statement of additional information and shareholder reports,online at http://www.leggmason.com/individualinvestors/variable-investment-prospectuses (clickon the name of the fund). You can also get this information at no cost by calling the fund at1-877-721-1926 or by sending an e-mail request to [email protected], or from yourfinancial intermediary. The fund’s Prospectus, dated May 1, 2016 and as may be amended orfurther supplemented, the fund’s statement of additional information, dated May 1, 2016 and asmay be amended or further supplemented, and the independent registered public accountingfirm’s report and financial statements in the fund’s annual report to shareholders, datedDecember 31, 2015, are incorporated by reference into this Summary Prospectus.
Investment objectiveThe fund seeks long-term growth of capital.
Fees and expenses of the fundThe accompanying table describes the fees and expenses that you may pay if you buy and holdClass I shares of the fund. The fee table and expense example do not reflect expenses incurredfrom investing through a separate account or qualified plan and do not reflect variable annuity orlife insurance contract charges. If they did, the overall fees and expenses would be higher than
INVESTMENT PRODUCTS: NOT FDIC INSURED • NO BANK GUARANTEE • MAY LOSE VALUE
80
S-80

those shown. Detailed information about the cost of investing in this fund through a separateaccount or qualified plan is presented in the contract prospectus through which the fund’s sharesare offered to you or in the information provided by your plan.
Shareholder fees(fees paid directly from your investment)
Maximum sales charge (load) imposed on purchases N/A
Maximum deferred sales charge (load) N/A
Annual fund operating expenses (%)(expenses that you pay each year as a percentage of the value of your investment)
Management fees 0.75
Distribution and/or service (12b-1) fees None
Other expenses 0.07
Total annual fund operating expenses 0.82
ExampleThis example is intended to help you compare the cost of investing in Class I shares of the fundwith the cost of investing in other mutual funds. The example does not include expenses incurredfrom investing through a separate account or qualified plan. If the example included theseexpenses, the figures shown would be higher. The example assumes:
‰ You invest $10,000 in the fund for the time periods indicated‰ Your investment has a 5% return each year and the fund’s operating expenses remain the same‰ You reinvest all distributions and dividends without a sales charge
Although your actual costs may be higher or lower, based on these assumptions your costs would be:
Number of years you own your shares ($)1 year 3 years 5 years 10 years
Class I (with or without redemption at end of period) 84 262 456 1,015
Portfolio turnover. The fund pays transaction costs, such as commissions, when it buys and sellssecurities (or “turns over” its portfolio). A higher portfolio turnover rate may indicate highertransaction costs. These costs, which are not reflected in annual fund operating expenses or inthe example, affect the fund’s performance. During the most recent fiscal year, the fund’sportfolio turnover rate was 18% of the average value of its portfolio.
Principal investment strategiesUnder normal circumstances, the fund invests at least 80% of its assets in equity securities ofcompanies with small market capitalizations and related investments.
The portfolio managers use a growth-oriented investment style that emphasizes small U.S.companies.
2 ClearBridge Variable Small Cap Growth Portfolio
81
S-81
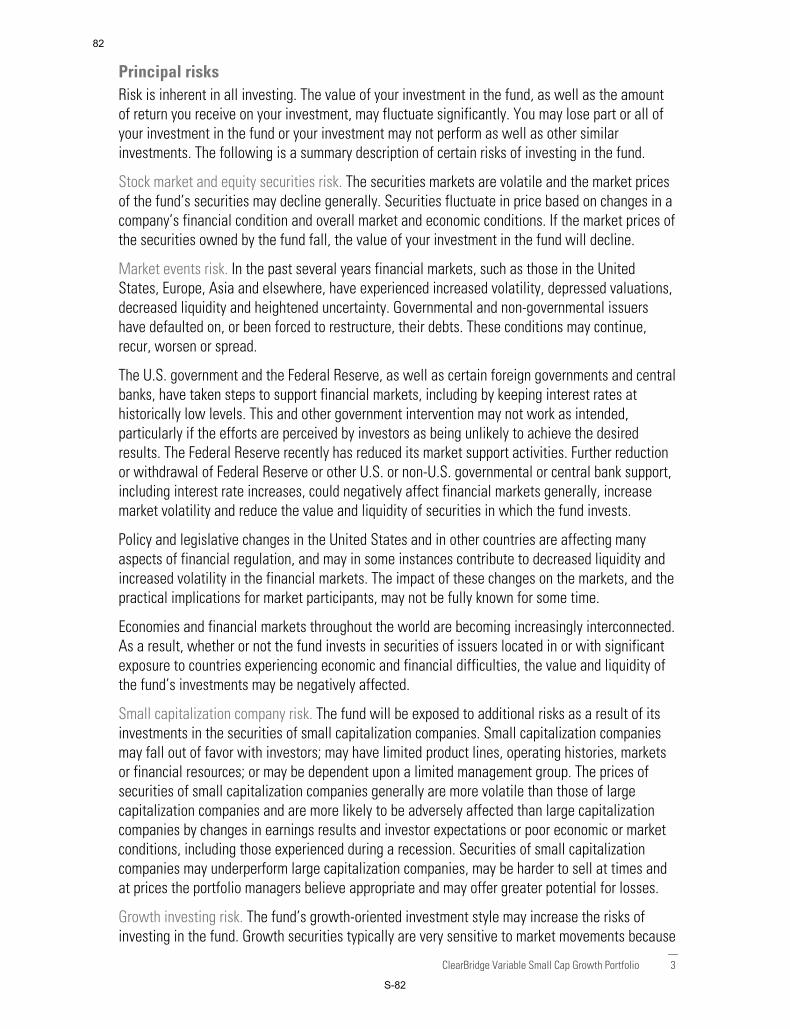
Principal risksRisk is inherent in all investing. The value of your investment in the fund, as well as the amountof return you receive on your investment, may fluctuate significantly. You may lose part or all ofyour investment in the fund or your investment may not perform as well as other similarinvestments. The following is a summary description of certain risks of investing in the fund.
Stock market and equity securities risk. The securities markets are volatile and the market pricesof the fund’s securities may decline generally. Securities fluctuate in price based on changes in acompany’s financial condition and overall market and economic conditions. If the market prices ofthe securities owned by the fund fall, the value of your investment in the fund will decline.
Market events risk. In the past several years financial markets, such as those in the UnitedStates, Europe, Asia and elsewhere, have experienced increased volatility, depressed valuations,decreased liquidity and heightened uncertainty. Governmental and non-governmental issuershave defaulted on, or been forced to restructure, their debts. These conditions may continue,recur, worsen or spread.
The U.S. government and the Federal Reserve, as well as certain foreign governments and centralbanks, have taken steps to support financial markets, including by keeping interest rates athistorically low levels. This and other government intervention may not work as intended,particularly if the efforts are perceived by investors as being unlikely to achieve the desiredresults. The Federal Reserve recently has reduced its market support activities. Further reductionor withdrawal of Federal Reserve or other U.S. or non-U.S. governmental or central bank support,including interest rate increases, could negatively affect financial markets generally, increasemarket volatility and reduce the value and liquidity of securities in which the fund invests.
Policy and legislative changes in the United States and in other countries are affecting manyaspects of financial regulation, and may in some instances contribute to decreased liquidity andincreased volatility in the financial markets. The impact of these changes on the markets, and thepractical implications for market participants, may not be fully known for some time.
Economies and financial markets throughout the world are becoming increasingly interconnected.As a result, whether or not the fund invests in securities of issuers located in or with significantexposure to countries experiencing economic and financial difficulties, the value and liquidity ofthe fund’s investments may be negatively affected.
Small capitalization company risk. The fund will be exposed to additional risks as a result of itsinvestments in the securities of small capitalization companies. Small capitalization companiesmay fall out of favor with investors; may have limited product lines, operating histories, marketsor financial resources; or may be dependent upon a limited management group. The prices ofsecurities of small capitalization companies generally are more volatile than those of largecapitalization companies and are more likely to be adversely affected than large capitalizationcompanies by changes in earnings results and investor expectations or poor economic or marketconditions, including those experienced during a recession. Securities of small capitalizationcompanies may underperform large capitalization companies, may be harder to sell at times andat prices the portfolio managers believe appropriate and may offer greater potential for losses.
Growth investing risk. The fund’s growth-oriented investment style may increase the risks ofinvesting in the fund. Growth securities typically are very sensitive to market movements because
ClearBridge Variable Small Cap Growth Portfolio 3
82
S-82

their market prices tend to reflect future expectations. When it appears those expectations willnot be met, the prices of growth securities typically fall. Growth stocks as a group may be out offavor and underperform the overall equity market while the market concentrates on value stocks.Although the fund will not concentrate its investments in any one industry or industry group, itmay, like many growth funds, weight its investments toward certain industries, thus increasing itsexposure to factors adversely affecting issuers within those industries.
Foreign investments and emerging market risk. The fund’s investments in securities of foreignissuers or issuers with significant exposure to foreign markets involve additional risk. Foreigncountries in which the fund may invest may have markets that are less liquid, less regulated andmore volatile than U.S. markets. The value of the fund’s investments may decline because offactors affecting the particular issuer as well as foreign markets and issuers generally, such asunfavorable or unsuccessful government actions, reduction of government or central bank supportand political or financial instability. Lack of information may also affect the value of thesesecurities.
The risks of foreign investments are heightened when investing in issuers in emerging marketcountries.
Currency risk. The value of investments in securities denominated in foreign currencies increasesor decreases as the rates of exchange between those currencies and the U.S. dollar change.Currency conversion costs and currency fluctuations could erase investment gains or add toinvestment losses. Currency exchange rates can be volatile, and are affected by factors such asgeneral economic conditions, the actions of the U.S. and foreign governments or central banks,the imposition of currency controls and speculation.
Liquidity risk. Some assets held by the fund may be impossible or difficult to sell, particularlyduring times of market turmoil. These illiquid assets may also be difficult to value. If the fund isforced to sell an illiquid asset to meet redemption requests or other cash needs, the fund may beforced to sell at a loss.
Portfolio management risk. The value of your investment may decrease if the subadviser’sjudgment about the attractiveness or value of, or market trends affecting a particular security,industry, sector or region, or about market movements, is incorrect, or if there are imperfections,errors or limitations in the tools and data used by the subadviser. In addition, the fund’sinvestment strategies or policies may change from time to time. Those changes may not lead tothe results intended by the subadviser and could have an adverse effect on the value orperformance of the fund.
Issuer risk. The value of a security can go up or down more than the market as a whole and canperform differently from the value of the market as a whole, often due to disappointing earningsreports by the issuer, unsuccessful products or services, loss of major customers, major litigationagainst the issuer or changes in government regulations affecting the issuer or the competitiveenvironment. The fund may experience a substantial or complete loss on an individual security.Historically, the prices of securities of small and medium capitalization companies have generallygone up or down more than those of large capitalization companies, although even largecapitalization companies may fall out of favor with investors.
4 ClearBridge Variable Small Cap Growth Portfolio
83
S-83
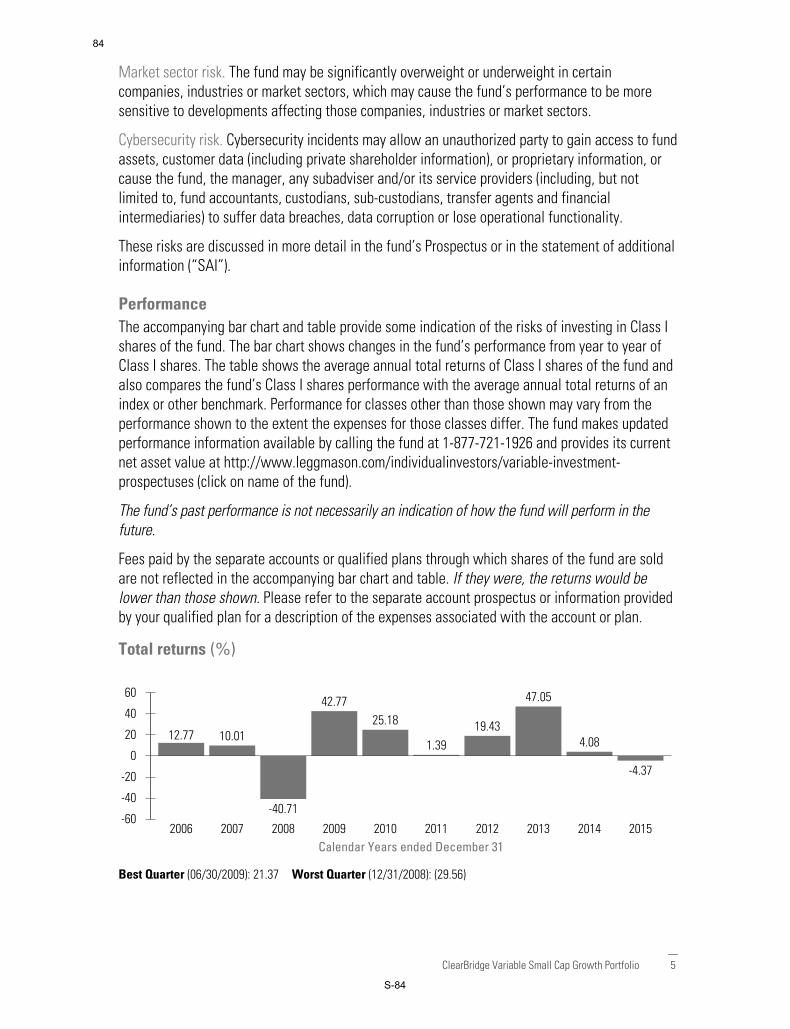
Market sector risk. The fund may be significantly overweight or underweight in certaincompanies, industries or market sectors, which may cause the fund’s performance to be moresensitive to developments affecting those companies, industries or market sectors.
Cybersecurity risk. Cybersecurity incidents may allow an unauthorized party to gain access to fundassets, customer data (including private shareholder information), or proprietary information, orcause the fund, the manager, any subadviser and/or its service providers (including, but notlimited to, fund accountants, custodians, sub-custodians, transfer agents and financialintermediaries) to suffer data breaches, data corruption or lose operational functionality.
These risks are discussed in more detail in the fund’s Prospectus or in the statement of additionalinformation (“SAI”).
PerformanceThe accompanying bar chart and table provide some indication of the risks of investing in Class Ishares of the fund. The bar chart shows changes in the fund’s performance from year to year ofClass I shares. The table shows the average annual total returns of Class I shares of the fund andalso compares the fund’s Class I shares performance with the average annual total returns of anindex or other benchmark. Performance for classes other than those shown may vary from theperformance shown to the extent the expenses for those classes differ. The fund makes updatedperformance information available by calling the fund at 1-877-721-1926 and provides its currentnet asset value at http://www.leggmason.com/individualinvestors/variable-investment-prospectuses (click on name of the fund).
The fund’s past performance is not necessarily an indication of how the fund will perform in thefuture.
Fees paid by the separate accounts or qualified plans through which shares of the fund are soldare not reflected in the accompanying bar chart and table. If they were, the returns would belower than those shown. Please refer to the separate account prospectus or information providedby your qualified plan for a description of the expenses associated with the account or plan.
Total returns (%)
2015201420132012201120102009200820072006
-40
-60
-20
0
20
40
60
25.18
-40.71
42.77
12.77
-4.37
1.3910.01
47.05
19.434.08
Calendar Years ended December 31
Best Quarter (06/30/2009): 21.37 Worst Quarter (12/31/2008): (29.56)
ClearBridge Variable Small Cap Growth Portfolio 5
84
S-84
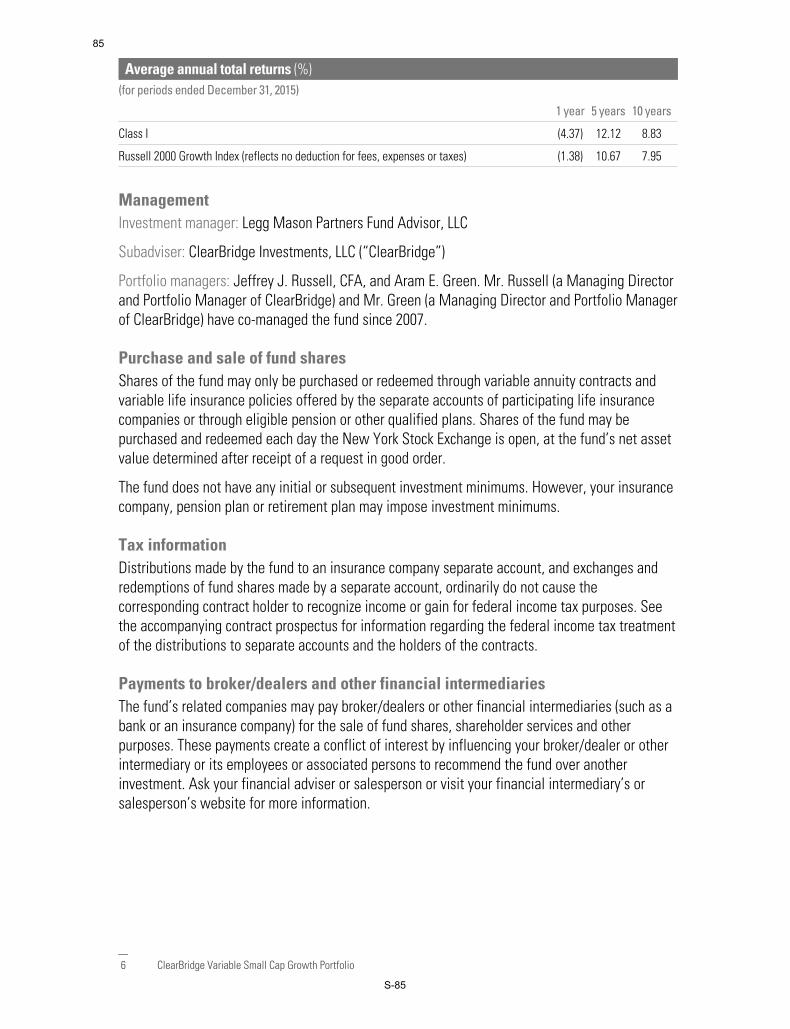
Average annual total returns (%)(for periods ended December 31, 2015)
1 year 5 years 10 years
Class I (4.37) 12.12 8.83
Russell 2000 Growth Index (reflects no deduction for fees, expenses or taxes) (1.38) 10.67 7.95
ManagementInvestment manager: Legg Mason Partners Fund Advisor, LLC
Subadviser: ClearBridge Investments, LLC (“ClearBridge”)
Portfolio managers: Jeffrey J. Russell, CFA, and Aram E. Green. Mr. Russell (a Managing Directorand Portfolio Manager of ClearBridge) and Mr. Green (a Managing Director and Portfolio Managerof ClearBridge) have co-managed the fund since 2007.
Purchase and sale of fund sharesShares of the fund may only be purchased or redeemed through variable annuity contracts andvariable life insurance policies offered by the separate accounts of participating life insurancecompanies or through eligible pension or other qualified plans. Shares of the fund may bepurchased and redeemed each day the New York Stock Exchange is open, at the fund’s net assetvalue determined after receipt of a request in good order.
The fund does not have any initial or subsequent investment minimums. However, your insurancecompany, pension plan or retirement plan may impose investment minimums.
Tax informationDistributions made by the fund to an insurance company separate account, and exchanges andredemptions of fund shares made by a separate account, ordinarily do not cause thecorresponding contract holder to recognize income or gain for federal income tax purposes. Seethe accompanying contract prospectus for information regarding the federal income tax treatmentof the distributions to separate accounts and the holders of the contracts.
Payments to broker/dealers and other financial intermediariesThe fund’s related companies may pay broker/dealers or other financial intermediaries (such as abank or an insurance company) for the sale of fund shares, shareholder services and otherpurposes. These payments create a conflict of interest by influencing your broker/dealer or otherintermediary or its employees or associated persons to recommend the fund over anotherinvestment. Ask your financial adviser or salesperson or visit your financial intermediary’s orsalesperson’s website for more information.
6 ClearBridge Variable Small Cap Growth Portfolio
85
S-85

FD04189SP 05/16
86
S-86
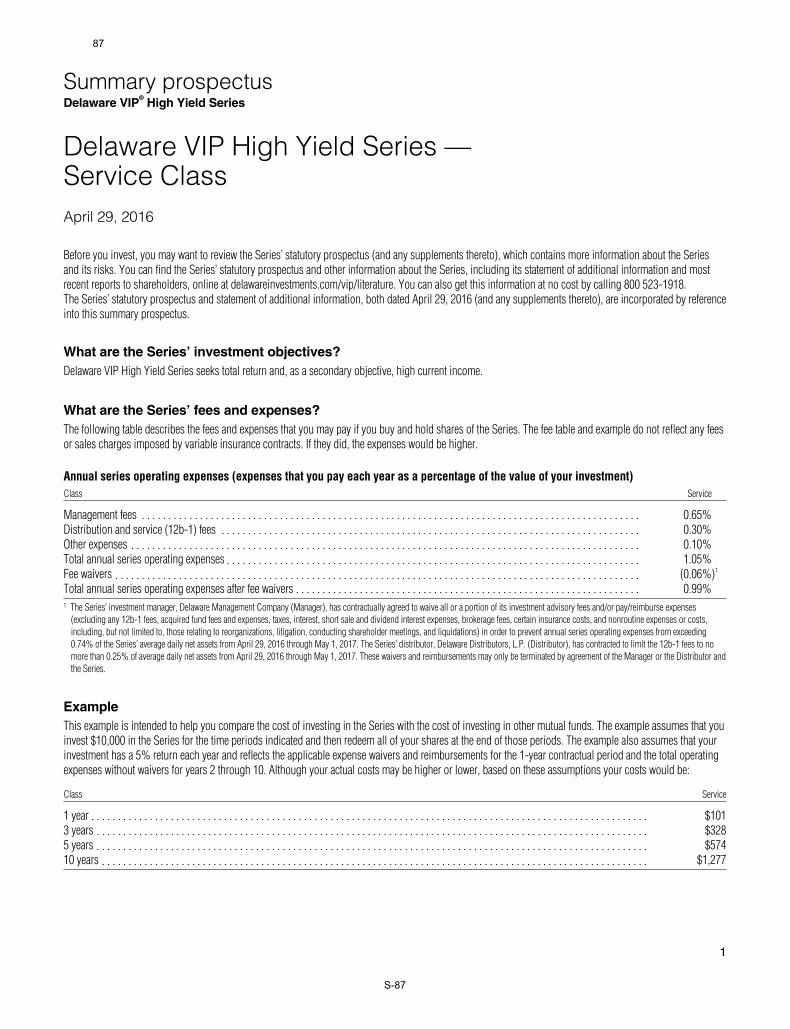
Delaware VIP High Yield Series —Service ClassApril 29, 2016
Before you invest, you may want to review the Series’ statutory prospectus (and any supplements thereto), which contains more information about the Seriesand its risks. You can find the Series’ statutory prospectus and other information about the Series, including its statement of additional information and mostrecent reports to shareholders, online at delawareinvestments.com/vip/literature. You can also get this information at no cost by calling 800 523-1918.The Series’ statutory prospectus and statement of additional information, both dated April 29, 2016 (and any supplements thereto), are incorporated by referenceinto this summary prospectus.
What are the Series’ investment objectives?
Delaware VIP High Yield Series seeks total return and, as a secondary objective, high current income.
What are the Series’ fees and expenses?
The following table describes the fees and expenses that you may pay if you buy and hold shares of the Series. The fee table and example do not reflect any feesor sales charges imposed by variable insurance contracts. If they did, the expenses would be higher.
Annual series operating expenses (expenses that you pay each year as a percentage of the value of your investment)Class Service
Management fees 0.65%Distribution and service (12b-1) fees 0.30%Other expenses 0.10%Total annual series operating expenses 1.05%Fee waivers (0.06%)1
Total annual series operating expenses after fee waivers 0.99%1 The Series’ investment manager, Delaware Management Company (Manager), has contractually agreed to waive all or a portion of its investment advisory fees and/or pay/reimburse expenses
(excluding any 12b-1 fees, acquired fund fees and expenses, taxes, interest, short sale and dividend interest expenses, brokerage fees, certain insurance costs, and nonroutine expenses or costs,
including, but not limited to, those relating to reorganizations, litigation, conducting shareholder meetings, and liquidations) in order to prevent annual series operating expenses from exceeding
0.74% of the Series’ average daily net assets from April 29, 2016 through May 1, 2017. The Series’ distributor, Delaware Distributors, L.P. (Distributor), has contracted to limit the 12b-1 fees to no
more than 0.25% of average daily net assets from April 29, 2016 through May 1, 2017. These waivers and reimbursements may only be terminated by agreement of the Manager or the Distributor and
the Series.
Example
This example is intended to help you compare the cost of investing in the Series with the cost of investing in other mutual funds. The example assumes that youinvest $10,000 in the Series for the time periods indicated and then redeem all of your shares at the end of those periods. The example also assumes that yourinvestment has a 5% return each year and reflects the applicable expense waivers and reimbursements for the 1-year contractual period and the total operatingexpenses without waivers for years 2 through 10. Although your actual costs may be higher or lower, based on these assumptions your costs would be:
Class Service
1 year $1013 years $3285 years $57410 years $1,277
Summary prospectusDelaware VIP
® High Yield Series
1
87
S-87

Portfolio turnover
The Series pays transaction costs, such as commissions, when it buys and sells securities (or “turns over” its portfolio). A higher portfolio turnover rate mayindicate higher transaction costs. These costs, which are not reflected in the annual series operating expenses or in the example, affect the Series’ performance.During the most recent fiscal year, the Series’ portfolio turnover rate was 99% of the average value of its portfolio.
What are the Series’ principal investment strategies?
Under normal circumstances, the Series will invest at least 80% of its net assets, plus the amount of any borrowings for investment purposes, in corporatebonds rated at the time of purchase lower than BBB- by Standard & Poor’s Financial Services LLC (S&P) and lower than Baa3 by Moody’s Investors Service,Inc. (Moody’s), or similarly rated by another nationally recognized statistical rating organization (NRSRO) (80% policy). These are commonly known as highyield bonds or “junk bonds” and involve greater risks than investment grade bonds. The Series may also invest in unrated bonds that the Series’ investmentmanager, Delaware Management Company (Manager), judges to be of comparable quality. Unrated bonds may be more speculative in nature than rated bonds.The Series may also invest in U.S. and foreign government securities and corporate bonds of foreign issuers. The Series may invest up to 40% of its net assetsin foreign securities; however, the Series’ total non-U.S.-dollar currency exposure will be limited, in the aggregate, to no more than 25% of the Series’ netassets, and investments in emerging market securities will be limited to 20% of the Series’ net assets. In selecting bonds for the portfolio, the Managerevaluates the income provided by the bond and the bond’s appreciation potential as well as the issuer’s ability to make income and principal payments.
The Series’ 80% policy is nonfundamental and may be changed without shareholder approval. Series shareholders would be given at least 60 days’ notice priorto any such change.
What are the principal risks of investing in the Series?
Investing in any mutual fund involves the risk that you may lose part or all of the money you invest. Over time, the value of your investment in the Series willincrease and decrease according to changes in the value of the securities in the Series’ portfolio. Principal risks include:
Market risk — The risk that all or a majority of the securities in a certain market — such as the stock or bond market — will decline in value because offactors such as adverse political or economic conditions, future expectations, investor confidence, or heavy institutional selling.
Interest rate risk — The risk that securities will decrease in value if interest rates rise. This risk is generally associated with bonds.
Credit risk — The risk that an issuer of a debt security, including a governmental issuer or an entity that insures a bond, may be unable to make interestpayments and repay principal in a timely manner.
High yield (junk bond) risk — The risk that high yield securities, commonly known as “junk bonds,” are subject to reduced creditworthiness of issuers;increased risk of default and a more limited and less liquid secondary market; and greater price volatility and risk of loss of income and principal than arehigher-rated securities. High yield bonds are sometimes issued by municipalities that have less financial strength and therefore have less ability to makeprojected debt payments on the bonds.
Derivatives risk — Derivatives contracts, such as futures, options, and swaps, may involve additional expenses (such as the payment of premiums) and aresubject to significant loss if a security, or a securities index to which a derivatives contract is associated, moves in the opposite direction from what the portfoliomanager anticipated.
Counterparty risk — The risk that a counterparty to a derivatives contract (such as a swap, futures, or options contract) or a repurchase agreement may fail toperform its obligations under the contract or agreement due to, among other reasons, financial difficulties (such as a bankruptcy or reorganization).
Foreign risk — The risk that foreign securities (particularly in emerging markets) may be adversely affected by political instability, changes in currencyexchange rates, inefficient markets and higher transaction costs, foreign economic conditions, the imposition of economic or trade sanctions, or inadequate ordifferent regulatory and accounting standards.
Loans and other indebtedness risk — The risk that the portfolio will not receive payment of principal, interest, and other amounts due in connection withthese investments and will depend primarily on the financial condition of the borrower and the lending institution. A portfolio’s ability to sell its loans or torealize their full value upon sale may also be impaired due to the lack of an active trading market, irregular trading activity, wide bid/ask spreads, contractualrestrictions, and extended trade settlement periods. In addition, certain loans in which a series invests may not be considered securities. A series therefore maynot be able to rely upon the anti-fraud provisions of the federal securities laws with respect to these investments.
Liquidity risk — The possibility that securities cannot be readily sold within seven days at approximately the price at which a portfolio has valued them.
Summary prospectus
2
88
S-88

Valuation risk — The risk that a less liquid secondary market may make it more difficult for a series to obtain precise valuations of certain securities in itsportfolio.
Redemption risk — If investors redeem more shares of a series than are purchased for an extended period of time, a series may be required to sell securitieswithout regard to the investment merits of such actions. This could decrease a series’ asset base, potentially resulting in a higher expense ratio.
Government and regulatory risk — The risk that governments or regulatory authorities have, from time to time, taken or considered actions that couldadversely affect various sectors of the securities markets and significantly affect series performance.
Investments not guaranteed by Delaware Management Company (Manager) or its affiliates — Neither the Manager nor its affiliates noted inthis document are authorized deposit-taking institutions for the purposes of the Banking Act 1959 (Commonwealth of Australia). The obligations of theseentities do not represent deposits or other liabilities of Macquarie Bank Limited (MBL). MBL does not guarantee or otherwise provide assurance in respect ofthe obligations of these entities, unless noted otherwise.
How has Delaware VIP® High Yield Series performed?
The bar chart and table below provide some indication of the risks of investing in the Series by showing changes in the Series’ performance from year to yearand by showing how the Series’ average annual total returns for the 1-, 5-, and 10-year periods compare with those of a broad measure of market performance.The Series’ past performance (before and after taxes) is not necessarily an indication of how it will perform in the future. The returns reflect any expense caps ineffect during these periods. The returns would be lower without the expense caps. You may obtain the Series’ most recently available month-end performanceby calling 800 523-1918 or by visiting our website at delawareinvestments.com/vip/performance.
Performance reflects all Series expenses but does not include any fees or sales charges imposed by variable insurance contracts. If they had been included, thereturns shown below would be lower. Investors should consult the variable contract prospectus for more information.
Year-by-year total return (Service Class)
12.19%2.55%
-24.43%
48.65%
14.91%2.33%
17.35%8.98%
-0.54% -6.87%
2006 2007 2008 2009 2010 2011 2012 2013 2014 2015-60%
-40%
-20%
0%
20%
40%
60%
80%
During the periods illustrated in this bar chart, the Class’s highest quarterly return was 18.44% for the quarter ended June 30, 2009 and its lowest quarterlyreturn was -16.90% for the quarter ended Dec. 31, 2008.
Average annual total returns for periods ended December 31, 2015
1 year 5 years 10 years
Delaware VIP High Yield Series — Service Class -6.87% 3.92% 6.06%BofA Merrill Lynch U.S. High Yield Constrained Index (reflects no deduction for
fees, expenses, or taxes) -4.61% 4.84% 6.81%
3
89
S-89
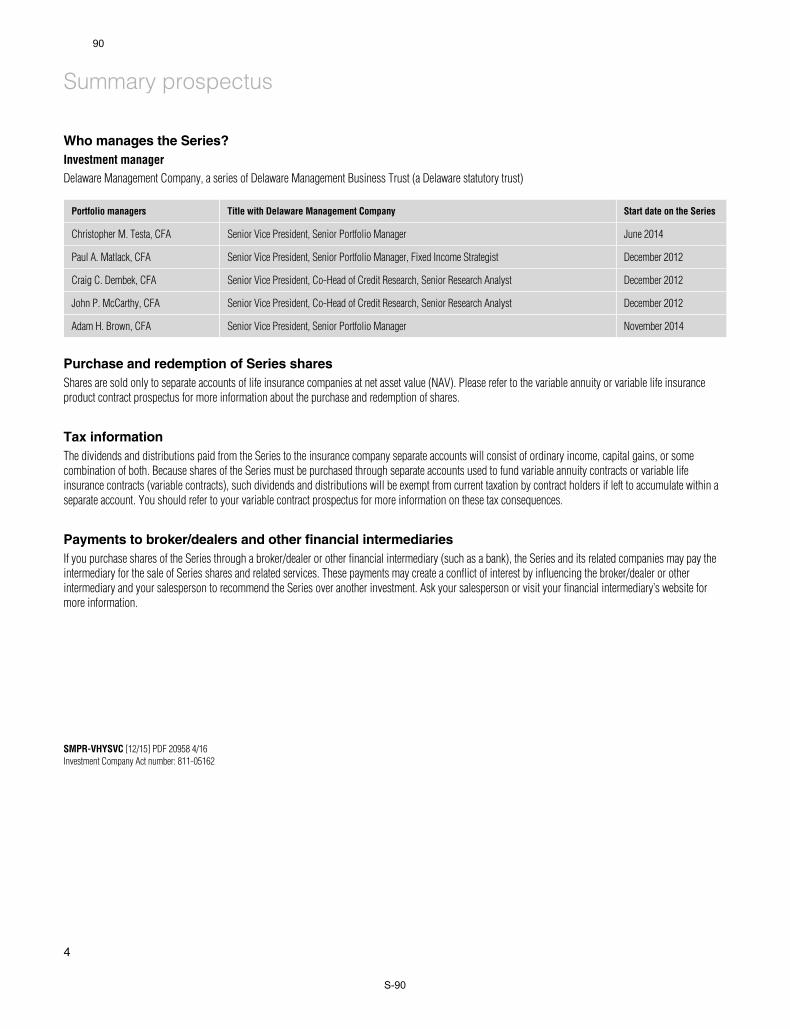
Who manages the Series?
Investment managerDelaware Management Company, a series of Delaware Management Business Trust (a Delaware statutory trust)
Portfolio managers Title with Delaware Management Company Start date on the Series
Christopher M. Testa, CFA Senior Vice President, Senior Portfolio Manager June 2014
Paul A. Matlack, CFA Senior Vice President, Senior Portfolio Manager, Fixed Income Strategist December 2012
Craig C. Dembek, CFA Senior Vice President, Co-Head of Credit Research, Senior Research Analyst December 2012
John P. McCarthy, CFA Senior Vice President, Co-Head of Credit Research, Senior Research Analyst December 2012
Adam H. Brown, CFA Senior Vice President, Senior Portfolio Manager November 2014
Purchase and redemption of Series shares
Shares are sold only to separate accounts of life insurance companies at net asset value (NAV). Please refer to the variable annuity or variable life insuranceproduct contract prospectus for more information about the purchase and redemption of shares.
Tax information
The dividends and distributions paid from the Series to the insurance company separate accounts will consist of ordinary income, capital gains, or somecombination of both. Because shares of the Series must be purchased through separate accounts used to fund variable annuity contracts or variable lifeinsurance contracts (variable contracts), such dividends and distributions will be exempt from current taxation by contract holders if left to accumulate within aseparate account. You should refer to your variable contract prospectus for more information on these tax consequences.
Payments to broker/dealers and other financial intermediaries
If you purchase shares of the Series through a broker/dealer or other financial intermediary (such as a bank), the Series and its related companies may pay theintermediary for the sale of Series shares and related services. These payments may create a conflict of interest by influencing the broker/dealer or otherintermediary and your salesperson to recommend the Series over another investment. Ask your salesperson or visit your financial intermediary’s website formore information.
SMPR-VHYSVC [12/15] PDF 20958 4/16
Investment Company Act number: 811-05162
Summary prospectus
4
90
S-90

Delaware VIP Small Cap Value Series —Service ClassApril 29, 2016
Before you invest, you may want to review the Series’ statutory prospectus (and any supplements thereto), which contains more information about the Seriesand its risks. You can find the Series’ statutory prospectus and other information about the Series, including its statement of additional information and mostrecent reports to shareholders, online at delawareinvestments.com/vip/literature. You can also get this information at no cost by calling 800 523-1918.The Series’ statutory prospectus and statement of additional information, both dated April 29, 2016 (and any supplements thereto), are incorporated by referenceinto this summary prospectus.
What is the Series’ investment objective?
Delaware VIP Small Cap Value Series seeks capital appreciation.
What are the Series’ fees and expenses?
The following table describes the fees and expenses that you may pay if you buy and hold shares of the Series. The fee table and example do not reflect any feesor sales charges imposed by variable insurance contracts. If they did, the expenses would be higher.
Annual series operating expenses (expenses that you pay each year as a percentage of the value of your investment)Class Service
Management fees 0.72%Distribution and service (12b-1) fees 0.30%Other expenses 0.08%Total annual series operating expenses 1.10%Fee waivers (0.05%)1
Total annual series operating expenses after fee waivers 1.05%1 The Series’ distributor, Delaware Distributors, L.P. (Distributor), has contracted to limit the 12b-1 fees to no more than 0.25% of average daily net assets from April 29, 2016 through
May 1, 2017. This waiver may be terminated only by agreement of the Distributor and the Series.
Example
This example is intended to help you compare the cost of investing in the Series with the cost of investing in other mutual funds. The example assumes that youinvest $10,000 in the Series for the time periods indicated and then redeem all of your shares at the end of those periods. The example also assumes that yourinvestment has a 5% return each year and reflects the Distributor’s expense waiver for the 1-year contractual period and the total operating expenses withoutwaivers for years 2 through 10. Although your actual costs may be higher or lower, based on these assumptions your costs would be:
Class Service
1 year $1073 years $3455 years $60110 years $1,336
Portfolio turnover
The Series pays transaction costs, such as commissions, when it buys and sells securities (or “turns over” its portfolio). A higher portfolio turnover rate mayindicate higher transaction costs. These costs, which are not reflected in the annual series operating expenses or in the example, affect the Series’ performance.During the most recent fiscal year, the Series’ portfolio turnover rate was 18% of the average value of its portfolio.
Summary prospectusDelaware VIP
® Small Cap Value Series
1
91
S-91

What are the Series’ principal investment strategies?
The Series invests primarily in investments of small companies whose stock prices, in the portfolio managers’ opinion, appear low relative to their underlyingvalue or future potential. Among other factors, the Series’ investment manager, Delaware Management Company (Manager), considers the financial strength of acompany, its management, the prospects for its industry, and any anticipated changes within the company that might suggest a more favorable outlook goingforward. The Manager focuses on free cash flow in its individual stock selection, seeking companies that the Manager believes have a sustainable ability to buyback shares, lower debt, and/or increase or initiate dividends. Under normal circumstances, at least 80% of the Series’ net assets, plus the amount of anyborrowings for investment purposes, will be in investments of small-capitalization companies (80% policy). The Series considers small-capitalizationcompanies to be companies with a market capitalization generally less than 3.5 times the dollar-weighted, median market capitalization of the Russell 2000®
Index at the time of purchase. The Series may invest up to 15% of its net assets in real estate investment trusts (REITs).
The Series’ 80% policy is nonfundamental and may be changed without shareholder approval. Series shareholders would be given at least 60 days’ notice priorto any such change.
What are the principal risks of investing in the Series?
Investing in any mutual fund involves the risk that you may lose part or all of the money you invest. Over time, the value of your investment in the Series willincrease and decrease according to changes in the value of the securities in the Series’ portfolio. Principal risks include:
Market risk — The risk that all or a majority of the securities in a certain market — such as the stock or bond market — will decline in value because offactors such as adverse political or economic conditions, future expectations, investor confidence, or heavy institutional selling.
Industry risk — The risk that the value of securities in a particular industry (such as financial services or manufacturing) will decline because of changingexpectations for the performance of that industry.
Company size risk — The risk that investments in small- and/or medium-sized companies may be more volatile than those of larger companies because oflimited financial resources or dependence on narrow product lines.
Interest rate risk — The risk that securities will decrease in value if interest rates rise. The risk is generally associated with bonds; however, because small-and medium-sized companies and companies in the real estate sector often borrow money to finance their operations, they may be adversely affected by risinginterest rates.
Foreign risk — The risk that foreign securities (particularly in emerging markets) may be adversely affected by political instability, changes in currencyexchange rates, inefficient markets and higher transaction costs, foreign economic conditions, the imposition of economic or trade sanctions, or inadequate ordifferent regulatory and accounting standards.
Real estate industry risk — This risk includes, among others: possible declines in the value of real estate; risks related to general and local economicconditions; possible lack of availability of mortgage funds; overbuilding; extended vacancies of properties; increases in competition, property taxes, andoperating expenses; changes in zoning laws; costs resulting from the cleanup of, and liability to third parties resulting from, environmental problems; casualtyfor condemnation losses; uninsured damages from floods, earthquakes, or other natural disasters; limitations on and variations in rents; and changes in interestrates.
Liquidity risk — The possibility that securities cannot be readily sold within seven days at approximately the price at which a portfolio has valued them.
Counterparty risk — The risk that a counterparty to a derivatives contract (such as a swap, futures, or options contract) or a repurchase agreement may fail toperform its obligations under the contract or agreement due to, among other reasons, financial difficulties (such as a bankruptcy or reorganization).
Government and regulatory risk — The risk that governments or regulatory authorities have, from time to time, taken or considered actions that couldadversely affect various sectors of the securities markets and significantly affect series performance.
Investments not guaranteed by Delaware Management Company (Manager) or its affiliates — Neither the Manager nor its affiliates noted inthis document are authorized deposit-taking institutions for the purposes of the Banking Act 1959 (Commonwealth of Australia). The obligations of theseentities do not represent deposits or other liabilities of Macquarie Bank Limited (MBL). MBL does not guarantee or otherwise provide assurance in respect ofthe obligations of these entities, unless noted otherwise.
Summary prospectus
2
92
S-92

How has Delaware VIP® Small Cap Value Series performed?
The bar chart and table below provide some indication of the risks of investing in the Series by showing changes in the Series’ performance from year to yearand by showing how the Series’ average annual total returns for the 1-, 5-, and 10-year periods compare with those of a broad measure of market performance.The Series’ past performance (before and after taxes) is not necessarily an indication of how it will perform in the future. The returns reflect any expense caps ineffect during these periods. The returns would be lower without the expense caps. You may obtain the Series’ most recently available month-end performanceby calling 800 523-1918 or by visiting our website at delawareinvestments.com/vip/performance.
Performance reflects all Series expenses but does not include any fees or sales charges imposed by variable insurance contracts. If they had been included, thereturns shown below would be lower. Investors should consult the variable contract prospectus for more information.
Year-by-year total return (Service Class)
15.89%
-6.84%
-30.07%
31.56% 31.92%
-1.59%
13.63%
33.17%
5.62%
-6.46%
2006 2007 2008 2009 2010 2011 2012 2013 2014 2015-60%
-40%
-20%
0%
20%
40%
60%
During the periods illustrated in this bar chart, the Class’s highest quarterly return was 22.71% for the quarter ended Sept. 30, 2009 and its lowest quarterlyreturn was -24.37% for the quarter ended Dec. 31, 2008.
Average annual total returns for periods ended December 31, 2015
1 year 5 years 10 years
Delaware VIP® Small Cap Value Series — Service Class -6.46% 8.03% 6.78%Russell 2000 Value Index (reflects no deduction for fees, expenses, or taxes) -7.47% 7.67% 5.57%
Russell Investment Group is the source and owner of the trademarks, service marks, and copyrights related to the Russell Indexes. Russell® is a trademark of the Russell Investment Group.
Who manages the Series?
Investment managerDelaware Management Company, a series of Delaware Management Business Trust (a Delaware statutory trust)
Portfolio managers Title with Delaware Management Company Start date on the Series
Christopher S. Beck, CFA Senior Vice President, Chief Investment Officer — Small-Cap Value / Mid-Cap Value Equity May 1997
Steven G. Catricks, CFA Vice President, Portfolio Manager, Equity Analyst July 2012
Kent P. Madden, CFA Vice President, Portfolio Manager, Equity Analyst July 2012
Kelley A. McKee, CFA Vice President, Portfolio Manager, Equity Analyst July 2012
3
93
S-93
Purchase and redemption of Series shares
Shares are sold only to separate accounts of life insurance companies at net asset value (NAV). Please refer to the variable annuity or variable life insuranceproduct contract prospectus for more information about the purchase and redemption of shares.
Tax information
The dividends and distributions paid from the Series to the insurance company separate accounts will consist of ordinary income, capital gains, or somecombination of both. Because shares of the Series must be purchased through separate accounts used to fund variable annuity contracts or variable lifeinsurance contracts (variable contracts), such dividends and distributions will be exempt from current taxation by contract holders if left to accumulate within aseparate account. You should refer to your variable contract prospectus for more information on these tax consequences.
Payments to broker/dealers and other financial intermediaries
If you purchase shares of the Series through a broker/dealer or other financial intermediary (such as a bank), the Series and its related companies may pay theintermediary for the sale of Series shares and related services. These payments may create a conflict of interest by influencing the broker/dealer or otherintermediary and your salesperson to recommend the Series over another investment. Ask your salesperson or visit your financial intermediary’s website formore information.
SMPR-VSCVSVC [12/15] PDF 20966 4/16
Investment Company Act number: 811-05162
Summary prospectus
4
94
S-94
Summary Prospectus | May 1, 2016
Deutsche Alternative Asset Allocation VIP
Class B
Before you invest, you may want to review the fund’s prospectus, which contains more information about the fund and its risks.You can findthe fund’s prospectus, Statement of Additional Information and other information about the fund online at deutschefunds.com/vipros.You canalso get this information at no cost by e-mailing a request to [email protected], calling (800) 728-3337 or by contacting your insurance company.The prospectus and Statement of Additional Information, both dated May 1, 2016, as supplemented, are incorporated by reference into thisSummary Prospectus.
INVESTMENT OBJECTIVE
The fund seeks capital appreciation.
FEES AND EXPENSES OF THE FUND
This table describes the fees and expenses you may pay ifyou buy and hold shares of the fund. This information doesnot reflect fees associated with the separate account thatinvests in the fund or any variable life insurance policy orvariable annuity contract for which the fund is an invest-ment option. These fees will increase expenses.
SHAREHOLDER FEES(paid directly from your investment) None
ANNUAL FUND OPERATING EXPENSES(expenses that you pay each year as a % of the value of your investment)
Management fee 0.31
Distribution/service (12b-1) fees 0.25
Other expenses 0.27
Acquired funds fees and expenses 1.12
Total annual fund operating expenses 1.95
Fee waiver/expense reimbursement 0.24
Total annual fund operating expenses after fee waiver/expense reimbursement 1.71
The Advisor has contractually agreed through April 30,2017 to waive its fees and/or reimburse certain operatingexpenses of the fund to the extent necessary to main-tain the fund’s total annual operating expenses (excludingcertain expenses such as extraordinary expenses, taxes,brokerage, interest expenses and acquired funds (under-lying funds) fees and expenses) at a ratio no higher than0.59% for Class B shares. The agreement may only beterminated with the consent of the fund’s Board.
EXAMPLEThis Example is intended to help you compare the cost ofinvesting in the fund with the cost of investing in othermutual funds. The Example assumes that you invest$10,000 in the fund for the time periods indicated and then
redeem all of your shares at the end of those periods. TheExample also assumes that your investment has a 5%return each year and that the fund’s operating expenses(including one year of capped expenses in each period)remain the same. This example does not reflect any feesor sales charges imposed by a variable contract for whichthe fund is an investment option. If they were included,your costs would be higher.
Although your actual costs may be higher or lower, basedon these assumptions your costs would be:
1Year 3Years 5Years 10Years
$174 $589 $1,030 $2,255
PORTFOLIO TURNOVERThe fund pays transaction costs, such as commissions,when it buys and sells securities (or “turns over” its port-folio). A higher portfolio turnover may indicate highertransaction costs. These costs are not reflected in annualfund operating expenses or in the expense example, butcan affect the fund’s performance.
Portfolio turnover rate for fiscal year 2015: 21%.
PRINCIPAL INVESTMENT STRATEGY
Main Investments.The fund seeks to achieve its objectiveby investing in alternative (or non-traditional) investmentstrategies. Investments may be made in other Deutschefunds (i.e., mutual funds, exchange-traded funds (ETFs)and other pooled investment vehicles managed byDeutsche Investment Management Americas Inc., thefund’s investment advisor, or one of its affiliates), ordirectly in the securities and derivative instruments inwhich such Deutsche fund could invest. The fund may alsoinvest in securities of unaffiliated mutual funds or ETFsto gain a desired economic exposure to a particular assetcategory or investment strategy that is not availablethrough a Deutsche fund (Deutsche funds and unaffiliated
1
95
S-95

mutual funds and ETFs are collectively referred to as“underlying funds”). The fund’s allocations among directinvestments and underlying funds may vary over time.
Management process. Portfolio management utilizes astrategic asset allocation process to determine thenon-traditional or alternative investment strategies thatshould be represented in the fund’s portfolio. Investmentstrategies generally will fall into the following categories:Commodities, Real Return, Hedge Strategy, Currency andOpportunistic. Commodities investments seek to provideexposure to hard assets. Real Return investments seek toprovide a measure of inflation protection. Hedge Strategyinvestments seek to generate returns independent of thebroader markets. Currency investments seek to offer expo-sure to foreign investments, many of which are notdenominated in US dollars. Opportunistic investmentsseek to offer exposure to categories generally not includedin investors’ allocations. Portfolio management also utilizesa tactical asset allocation process to adjust allocations inresponse to short-term market changes.
As of December 31, 2015, the fund’s allocation amonginvestment strategies and the underlying funds (excludingcash equivalents) was:
Commodity 12%
Deutsche Enhanced Commodity Strategy Fund 12%
Real Return 39%
Deutsche Global Infrastructure Fund 18%
Deutsche Global Inflation Fund 10%
Deutsche Real Estate Securities Fund 7%
Deutsche Global Real Estate Securities Income Fund 3%
Deutsche Real Estate Securities Income Fund 1%
Hedge Strategy 14%
Deutsche Diversified Market Neutral Fund 13%
Deutsche Strategic Equity Long/Short Fund 1%
Currency 13%
Deutsche Enhanced Emerging Markets Fixed Income Fund 13%
Opportunistic 22%
Deutsche Floating Rate Fund 13%
SPDR Barclays Convertible Securities ETF 9%
The fund’s allocations among investment strategies andunderlying funds will change over time and there should beno expectation that current or past positions will be main-tained in the future.
Currency and interest rate strategies. In addition to thefund’s or an underlying fund’s main investment strategy,portfolio management of the fund or certain underlyingfunds may, from time to time, seek to enhance returns byemploying proprietary quantitative currency strategiesacross developed and emerging market currencies usingderivatives (contracts whose values are based on, forexample, indices, currencies or securities), in particularforward currency contracts. Three main strategies may beemployed: a carry strategy, a momentum strategy and a
valuation strategy. In implementing the carry strategy, port-folio management of certain underlying funds will use a“relative value” analysis, seeking to systematically sell lowinterest rate currencies and buy high interest rate curren-cies. In implementing the momentum strategy, portfoliomanagement of certain underlying funds will use multi-year exchange rate trends, seeking to systematically selllower returning currencies and buy higher returning curren-cies. In implementing the valuation strategy, portfoliomanagement of certain underlying funds will use a “fairvalue” analysis, seeking to systematically buy “under-valued” currencies and sell “overvalued” currencies.
Portfolio management of the fund or certain underlyingfunds also may, from time to time, seek to enhancereturns by employing various strategies to identify interestrate trends across developed markets using derivatives,in particular buying and selling interest rate futurescontracts. In implementing these strategies, portfoliomanagement of the fund or certain underlying funds mayutilize proprietary rules-based interest rate indices.
The notional amount of the fund’s or an underlying fund’saggregate currency and interest rate exposure resultingfrom these strategies may significantly exceed the netassets of the fund or an underlying fund (and at times mayexceed two times the fund’s or an underlying fund’s netassets).
Derivatives. Outside of the currency and interest rate strat-egies, the fund and the underlying funds in which the fundinvests, may also use other types of derivatives (e.g.,options, futures, forward currency contracts, commodity-linked derivatives, interest rate swaps and total returnswaps) (i) for hedging purposes; (ii) for risk management;(iii) for non-hedging purposes to seek to enhance potentialgains; or (iv) as a substitute for direct investment in aparticular asset class or to keep cash on hand to meetshareholder redemptions.
Securities Lending.The fund may lend securities (up toone-third of total assets) to approved institutions.
MAIN RISKS
There are several risk factors that could hurt the fund’sperformance, cause you to lose money or cause the fund’sperformance to trail that of other investments. The fundmay not achieve its investment objective, and is notintended to be a complete investment program. An invest-ment in the fund is not a deposit of a bank and is notinsured or guaranteed by the Federal Deposit InsuranceCorporation or any other governmental agency.
Because the fund invests in underlying funds, the riskslisted here include those of the various underlying funds aswell as those of the fund itself. Therefore, in these riskdescriptions the term “the fund” may refer to the funditself, one or more underlying funds, or both.
2 Deutsche Alternative Asset Allocation VIP
Summary Prospectus May 1, 2016
96
S-96

Asset allocation risk. Portfolio management may favorone or more types of investments or assets thatunderperform other investments, assets, or securitiesmarkets as a whole. Anytime portfolio management buysor sells securities in order to adjust the fund’s asset alloca-tion this will increase portfolio turnover and generatetransaction costs.
Security selection risk.The securities in the fund’s port-folio may decline in value. Portfolio management could bewrong in its analysis of industries, companies, economictrends, the relative attractiveness of different securities orother matters.
Stock market risk. When stock prices fall, you shouldexpect the value of your investment to fall as well. Stockprices can be hurt by poor management on the part of thestock’s issuer, shrinking product demand and other busi-ness risks. These may affect single companies as well asgroups of companies. In addition, movements in financialmarkets may adversely affect a stock’s price, regardless ofhow well the company performs. The market as a wholemay not favor the types of investments the fund makes,which could affect the fund’s ability to sell them at anattractive price. To the extent that the fund invests in aparticular geographic region, capitalization or sector, thefund’s performance may be affected by the general perfor-mance of that region, capitalization or sector.
Underlying funds risk. Because the fund may invest inunderlying funds, the fund’s performance will be directlyrelated to the performance of the underlying funds. To theextent that a given underlying fund underperforms itsbenchmark or its fund peer group, it may contribute tounderperformance by the fund.
In addition, the fund indirectly pays a portion of theexpenses incurred by the underlying funds, which lowersperformance. To the extent that the fund’s allocations favorunderlying funds with higher expenses, the overall costof investing paid by the fund will be higher.
The fund is also subject to the risk that an underlying fundmay pay a redemption request made by the fund, whollyor partly, by an in-kind distribution of portfolio securitiesrather than in cash. The fund may hold such portfolio secu-rities until the Advisor determines to dispose of them,and the fund will bear the market risk of the securitiesreceived in the redemption until their disposition. Upondisposing of such portfolio securities, the fund may experi-ence increased brokerage commissions.
Concentration risk – underlying funds. Any underlyingfund that concentrates in a particular segment of themarket (such as commodities, gold-related investments,infrastructure-related companies and real estate securities)will generally be more volatile than a fund that investsmore broadly. Any market price movements, regulatory ortechnological changes, or economic conditions affecting
the particular market segment in which the underlying fundconcentrates will have a significant impact on the under-lying fund’s performance.
While the fund does not concentrate in a particularindustry, it may concentrate in an underlying Deutschefund, and there is risk for the fund with respect to theaggregation of holdings of underlying funds. The aggrega-tion of holdings of underlying funds may result in the fundindirectly having concentrated assets in a particularindustry or group of industries, or in a single issuer. Suchindirect concentration may have the effect of increasingthe volatility of the fund’s returns. The fund does notcontrol the investments of the underlying funds, and anyindirect concentration occurs as a result of the underlyingfunds following their own investment objectives andstrategies.
ETF risk. Because ETFs trade on a securities exchange,their shares may trade at a premium or discount to theirnet asset value. An ETF is subject to the risks of the assetsin which it invests as well as those of the investmentstrategy it follows. The fund incurs brokerage costs whenit buys and sells shares of an ETF and also bears its propor-tionate share of the ETF’s fees and expenses, which arepassed through to ETF shareholders.
Foreign investment risk. The fund faces the risksinherent in foreign investing. Adverse political, economicor social developments could undermine the value of thefund’s investments or prevent the fund from realizing thefull value of its investments. Financial reporting standardsfor companies based in foreign markets differ from thosein the US. Additionally, foreign securities markets generallyare smaller and less liquid than US markets. To the extentthat the fund invests in non-US dollar denominated foreignsecurities, changes in currency exchange rates may affectthe US dollar value of foreign securities or the income orgain received on these securities.
Emerging markets risk. Foreign investment risks aregreater in emerging markets than in developed markets.Investments in emerging markets are often consideredspeculative.
Interest rate strategies risk.The success of the interestrate futures strategies depends, in part, on the effective-ness and implementation of portfolio management’sproprietary strategies. If portfolio management’s analysisproves to be incorrect, losses to the fund may be signifi-cant. The risk of loss is heightened during periods of rapidrises in interest rates.
Derivatives risk. Risks associated with derivatives mayinclude the risk that the derivative is not well correlatedwith the security, index or currency to which it relates; therisk that derivatives may result in losses or missed opportu-nities; the risk that the fund will be unable to sell thederivative because of an illiquid secondary market; the riskthat a counterparty is unwilling or unable to meet its obli-gation; and the risk that the derivative transaction could
3 Deutsche Alternative Asset Allocation VIP
Summary Prospectus May 1, 2016
97
S-97
expose the fund to the effects of leverage, which couldincrease the fund’s exposure to the market and magnifypotential losses.
Currency strategies risk. The success of the currencystrategies depends, in part, on the effectiveness and imple-mentation of portfolio management’s proprietarystrategies. If portfolio management’s analysis proves to beincorrect, losses to the fund may be significant and maysubstantially exceed the intended level of market exposurefor the currency strategies.
As part of the currency strategies, the fund will havesubstantial exposure to the risks of non-US currencymarkets. Foreign currency rates may fluctuate significantlyover short periods of time for a number of reasons,including changes in interest rates and economic orpolitical developments in the US or abroad. As a result, thefund’s exposure to foreign currencies could cause lowerreturns or even losses to the fund. Although portfoliomanagement seeks to limit these risks through the aggre-gation of various long and short positions, there can beno assurance that it will be able to do so.
Interest rate risk. When interest rates rise, prices of debtsecurities generally decline. The fund may be subject toa greater risk of rising interest rates due to the currentperiod of historically low rates. The longer the duration ofthe fund’s debt securities, the more sensitive the fund willbe to interest rate changes. (As a general rule, a 1% risein interest rates means a 1% fall in value for every year ofduration.)
Inflation-indexed bond risk. Any rise in interest rates maycause inflation-indexed bonds to decline in price, hurtingfund performance. If interest rates rise due to reasonsother than inflation, the fund’s investment in these securi-ties may not be fully protected from the effects of risinginterest rates. The fund may be subject to a greater risk ofrising interest rates due to the current period of histori-cally low rates. The performance of any bonds that areindexed to non-US rates of inflation may be higher or lowerthan those indexed to US inflation rates. The fund’s actualreturns could fail to match the real rate of inflation.
Credit risk.The fund’s performance could be hurt if anissuer of a debt security suffers an adverse change in finan-cial condition that results in the issuer not making timelypayments of interest or principal, a security downgrade oran inability to meet a financial obligation. Credit risk isgreater for lower-rated securities.
Because the issuers of high-yield debt securities or junkbonds (debt securities rated below the fourth highestcredit rating category) may be in uncertain financial health,the prices of their debt securities can be more vulnerableto bad economic news, or even the expectation of badnews, than investment-grade debt securities. Credit riskfor high-yield securities is greater than for higher-ratedsecurities.
High-yield debt securities risk. High-yield debt securitiesor junk bonds are generally regarded as speculative withrespect to the issuer’s continuing ability to meet principaland interest payments. High-yield debt securities’ totalreturn and yield may generally be expected to fluctuatemore than the total return and yield of investment-gradedebt securities. A real or perceived economic downturn oran increase in market interest rates could cause a declinein the value of high-yield debt securities, result inincreased redemptions and/or result in increased portfolioturnover, which could result in a decline in net asset valueof the fund, reduce liquidity for certain investments and/orincrease costs. High-yield debt securities are often thinlytraded and can be more difficult to sell and value accuratelythan investment-grade debt securities as there may beno established secondary market. Investments in high-yield debt securities could increase liquidity risk for thefund. In addition, the market for high-yield debt securitiescan experience sudden and sharp volatility which is gener-ally associated more with investments in stocks.
Senior loans risk. The fund invests in senior loans thatmay not be rated by a rating agency, registered with theSecurities and Exchange Commission or any state securi-ties commission or listed on any national securitiesexchange. Therefore, there may be less publicly availableinformation about them than for registered or exchange-listed securities. The Advisor relies on its own evaluation ofthe creditworthiness of borrowers, but will consider, andmay rely in part on, analyses performed by others. As aresult, the fund is particularly dependent on the analyticalabilities of the Advisor.
Senior loans may not be considered “securities,” andpurchasers, such as the fund, therefore may not be entitledto rely on the anti-fraud and misrepresentation protec-tions of the federal securities laws. Senior loans involveother risks, including credit risk, interest rate risk, liquidityrisk, and prepayment and extension risk.
Affiliates of the Advisor may participate in the primary andsecondary market for senior loans. Because of limitationsimposed by applicable law, the presence of the Advisor’saffiliates in the senior loan market may restrict the fund’sability to participate in a restructuring of a senior loan or toacquire some senior loans, or affect the timing or price ofsuch acquisition. The fund also may be in possession ofmaterial non-public information about a borrower as aresult of its ownership of a senior loan. Because of prohibi-tions on trading in securities of issuers while inpossession of such information, the fund might be unableto enter into a transaction in a publicly-traded security ofthat borrower when it would otherwise be advantageousto do so. If the Advisor wishes to invest in the publiclytraded securities of a borrower, it may not have access tomaterial non-public information regarding the borrowerto which other lenders have access.
4 Deutsche Alternative Asset Allocation VIP
Summary Prospectus May 1, 2016
98
S-98

Prepayment and extension risk. When interest rates fall,issuers of high interest debt obligations may pay off thedebts earlier than expected (prepayment risk), and thefund may have to reinvest the proceeds at lower yields.When interest rates rise, issuers of lower interest debtobligations may pay off the debts later than expected(extension risk), thus keeping the fund’s assets tied up inlower interest debt obligations. Ultimately, any unexpectedbehavior in interest rates could increase the volatility ofthe fund’s share price and yield and could hurt fundperformance.
Commodities-related investments risk.Thecommodities-linked derivative instruments in which thefund invests tend to be more volatile than many othertypes of securities and may subject the fund to specialrisks that do not apply to all derivatives transactions. Forexample, the value of commodity-linked derivative instru-ments may be affected by changes in overall marketmovements, commodity index volatility, changes ininterest rates, or factors affecting a particular industry orcommodity, such as drought, floods, weather, livestockdisease, changes in storage costs, embargoes, tariffs, poli-cies of commodity cartels and international economic,political and regulatory developments.
Real estate securities risk. Real estate companies,including REITs, can be affected by the risks associatedwith direct ownership of real estate, such as general orlocal economic conditions, decreases in real estate value,increases in property taxes and operating expenses, liabili-ties or losses due to environmental problems, delays incompletion of construction, falling rents (whether due topoor demand, increased competition, overbuilding, or limi-tations on rents), zoning changes, rising interest rates,lack of credit, failure of borrowers to repay loans andlosses from casualty or condemnation. In addition, manyreal estate companies, including REITs, utilize leverage(and some may be highly leveraged), which increasesinvestment risk. Further, REITs are dependent uponmanagement skills, may not be diversified and may haverelatively small market capitalizations, which can increasevolatility. REITs must satisfy certain requirements in orderto qualify for favorable tax treatment under applicable taxlaws, and a failure to qualify could adversely affect thevalue of the REIT. By investing in REITs through a fund, ashareholder will bear expenses of the REITs in addition toexpenses of the fund.
Infrastructure-related companies risk. Infrastructure-related companies can be affected by various factors,including general or local economic conditions and politicaldevelopments, general changes in market sentimenttowards infrastructure assets, high interest costs inconnection with capital construction and improvementprograms, difficulty in raising capital, costs associated withcompliance with changes in regulations, regulation or inter-vention by various government authorities, includinggovernment regulation of rates, inexperience with and
potential losses resulting from the deregulation of aparticular industry or sector, changes in tax laws, environ-mental problems, technological changes, surplus capacity,casualty losses, threat of terrorist attacks and changes ininterest rates.
Focus risk.To the extent that the fund focuses its invest-ments in particular industries, asset classes or sectorsof the economy, any market price movements, regulatoryor technological changes, or economic conditions affectingcompanies in those industries, asset classes or sectorsmay have a significant impact on the fund’s performance.
Short sale risk. If the fund sells a security short and subse-quently has to buy the security back at a higher price, thefund will lose money on the transaction. Any loss will beincreased by the amount of compensation, interest or divi-dends and transaction costs the fund must pay to a lenderof the security. The amount the fund could lose on a shortsale is theoretically unlimited (as compared to a long posi-tion, where the maximum loss is the amount invested).The use of short sales, which has the effect of leveragingthe fund, could increase the exposure of the fund to themarket, increase losses and increase the volatility ofreturns.
The fund may not always be able to close out a short posi-tion at a particular time or at an acceptable price. A lendermay request that borrowed securities be returned to it onshort notice, and the fund may have to buy the borrowedsecurities at an unfavorable price. If this occurs at a timethat other short sellers of the same security also want toclose out their positions, it is more likely that the fund willhave to cover its short sale at an unfavorable price andpotentially reduce or eliminate any gain, or cause a loss, asa result of the short sale.
Market direction risk. Since certain underlying funds willtypically hold both long and short positions, an investmentin the fund will involve market risks associated withdifferent types of investment decisions than those madefor a typical “long only” fund. The underlying fund’s resultswill suffer both when there is a general market advanceand the underlying fund holds significant short positions, orwhen there is a general market decline and the under-lying fund holds significant long positions. In recent years,the markets have shown considerable volatility from dayto day and even in intra-day trading.
Counterparty risk. A financial institution or othercounterparty with whom the fund does business, or thatunderwrites, distributes or guarantees any investments orcontracts that the fund owns or is otherwise exposed to,may decline in financial health and become unable tohonor its commitments. This could cause losses for thefund or could delay the return or delivery of collateral orother assets to the fund.
5 Deutsche Alternative Asset Allocation VIP
Summary Prospectus May 1, 2016
99
S-99

Liquidity risk. In certain situations, it may be difficult orimpossible to sell an investment and/or the fund may sellcertain investments at a price or time that is not advan-tageous in order to meet redemption requests or othercash needs. Unusual market conditions, such as an unusu-ally high volume of redemptions or other similar conditionscould increase liquidity risk for the fund.
Pricing risk. If market conditions make it difficult to valuesome investments, the fund may value these investmentsusing more subjective methods, such as fair value pricing.In such cases, the value determined for an investmentcould be different from the value realized upon such invest-ment’s sale. As a result, you could pay more than themarket value when buying fund shares or receive less thanthe market value when selling fund shares.
Tax status risk. Income and gains from commodities orcertain commodity-linked derivatives do not constitute“qualifying income” to the fund for purposes of qualifica-tion as a “regulated investment company” for federalincome tax purposes. If such income were determined tocause the fund’s nonqualifying income to exceed 10%of the fund’s gross income, the fund would be subject to atax at the fund level.
Securities lending risk. Any decline in the value of a port-folio security that occurs while the security is out on loanis borne by the fund and will adversely affect performance.Also, there may be delays in recovery of securities loanedor even a loss of rights in the collateral should theborrower of the securities fail financially while holding thesecurity.
Subsidiary risk. Certain underlying funds may invest in awholly-owned subsidiary of the underlying fund formedunder the laws of the Cayman Islands (the Subsidiary) thatis not registered as an investment company under theInvestment Company Act of 1940, as amended, and there-fore it is not subject to all of the investor protections ofthe Investment Company Act of 1940. A regulatory changein the US or the Cayman Islands that impacts the Subsid-iary or how the underlying fund invests in the Subsidiary,such as a change in tax law, could adversely affect theunderlying fund and the fund. By investing in the Subsid-iary, the underlying funds and the fund are exposed to therisks associated with the Subsidiary’s investments, whichgenerally include the risks of investing in derivatives andcommodities-related investments.
Multi-manager approach risk. While the investment strat-egies employed by certain underlying funds’ investmentmanagement teams are intended to be complementary,they may not in fact be complementary. The interplay ofthe various strategies employed by the fund’s multipleinvestment management teams may result in a fundholding a significant amount of certain types of securities.This may be beneficial or detrimental to the fund’s perfor-mance depending upon the performance of thosesecurities and the overall economic environment. Theinvestment management teams selected for a fund may
underperform the market generally or other investmentmanagement teams that could have been selected for thefund. The multi-manager approach could increase a fund’sportfolio turnover rate which may result in higher levels ofrealized capital gains or losses with respect to a fund’sportfolio securities, higher brokerage commissions andother transaction costs. The success of a fund’s invest-ment strategy depends on, among other things, both theAdvisor’s skill in selecting investment management teamsand allocating assets to those investment managementteams and on an investment management team’s skill inexecuting the relevant investment strategy and selectinginvestments for a fund. The degree of correlation amongthe investment management teams’ investment strategiesand the market as a whole will vary as a result of marketconditions and other factors, and certain investmentmanagement teams could have a greater degree of corre-lation with each other and with the market than otherinvestment management teams.
Operational and technology risk. Cyber-attacks, disrup-tions, or failures that affect the fund’s service providers orcounterparties, issuers of securities held by the fund, orother market participants may adversely affect the fundand its shareholders, including by causing losses for thefund or impairing fund operations.
PAST PERFORMANCE
How a fund’s returns vary from year to year can give anidea of its risk; so can comparing fund performance tooverall market performance (as measured by an appro-priate market index). Past performance may not indicatefuture results. All performance figures below assume thatdividends and distributions were reinvested. For morerecent performance figures, go to deutschefunds.com (theWeb site does not form a part of this prospectus) or callthe phone number included in this prospectus. This informa-tion doesn’t reflect fees associated with the separateaccount that invests in the fund or any variable life insur-ance policy or variable annuity contract for which the fundis an investment option. These fees will reduce returns.
Prior to July 12, 2013, the fund had a subadvisor and adifferent investment management team that operated witha different investment strategy. Performance would havebeen different if the fund’s current investment strategyhad been in effect.
CALENDAR YEAR TOTAL RETURNS (%) (Class B)
12.15
-3.12
9.36
0.753.24
-6.54
-20
-10
0
10
20
2006 2007 2008 2009 2010 2011 2012 2013 2014 2015
6 Deutsche Alternative Asset Allocation VIP
Summary Prospectus May 1, 2016
100
S-100

Returns Period ending
Best Quarter 9.04% September 30, 2010Worst Quarter -8.38% September 30, 2011Year-to-Date 2.07% March 31, 2016
AVERAGE ANNUAL TOTAL RETURNS(For periods ended 12/31/2015 expressed as a %)
ClassInception
1Year
5Years
SinceInception
Class B 5/18/2009 -6.54 0.59 4.52
MSCIWorld Index(reflects no deduction forfees, expenses or taxes) -0.87 7.59 11.10
Barclays U.S. AggregateBond Index (reflects nodeduction for fees,expenses or taxes) 0.55 3.25 4.40
Blended Index (reflectsno deduction for fees,expenses or taxes) -0.24 6.52 9.44
The Blended Index consists of 70% MSCI World Index and 30% BarclaysU.S. Aggregate Bond Index.
The Advisor believes that the MCSI World Index, BarclaysU.S. Aggregate Bond Index, and the blend of each of theseindexes, reflect the different components of the fund’stypical asset allocations.
MANAGEMENT
Investment Advisor
Deutsche Investment Management Americas Inc.
Subadvisor
RREEF America L.L.C.
Portfolio Manager(s)
Pankaj Bhatnagar, PhD, Managing Director. PortfolioManager of the fund. Began managing the fund in 2013.
Darwei Kung, Director. Portfolio Manager of the fund.Began managing the fund in 2013.
PURCHASE AND SALE OF FUND SHARES
The fund is intended for use in a variable insurance
product.You should contact the sponsoring insurancecompany for information on how to purchase and sellshares of the fund.
TAX INFORMATION
The fund normally distributes its net investment incomeand realized capital gains, if any, to its shareholders, theseparate accounts of participating insurance companies.These distributions may not be taxable to the holders ofvariable annuity contracts and variable life insurance poli-cies. For information concerning the federal income tax
consequences for the holders of such contracts or poli-cies, holders should consult the prospectus used inconnection with the issuance of their particular contractsor policies.
PAYMENTS TO FINANCIAL INTERMEDIARIES
If you purchase the fund through selected affiliated andunaffiliated brokers, dealers, participating insurance compa-nies or other financial intermediaries, the fund, theAdvisor, and/or the Advisor’s affiliates, may pay the finan-cial intermediary for the sale of fund shares and relatedservices. These payments may create a conflict of interestby influencing the financial intermediary and your sales-person to recommend the fund over another investment.Ask your salesperson or visit your insurance company’sWeb site for more information.
7 Deutsche Alternative Asset Allocation VIP
Summary Prospectus May 1, 2016 2B-AAA-SUM
101
S-101

Summary Prospectus | May 1, 2016
Deutsche Small Mid Cap Value VIP
Class B
Before you invest, you may want to review the fund’s prospectus, which contains more information about the fund and its risks.You can findthe fund’s prospectus, Statement of Additional Information and other information about the fund online at deutschefunds.com/vipros.You canalso get this information at no cost by e-mailing a request to [email protected], calling (800) 728-3337 or by contacting your insurance company.The prospectus and Statement of Additional Information, both dated May 1, 2016, as supplemented, are incorporated by reference into thisSummary Prospectus.
INVESTMENT OBJECTIVE
The fund seeks long-term capital appreciation.
FEES AND EXPENSES OF THE FUND
This table describes the fees and expenses you may pay ifyou buy and hold shares of the fund. This information doesnot reflect fees associated with the separate account thatinvests in the fund or any variable life insurance policy orvariable annuity contract for which the fund is an invest-ment option. These fees will increase expenses.
SHAREHOLDER FEES(paid directly from your investment) None
ANNUAL FUND OPERATING EXPENSES(expenses that you pay each year as a % of the value of your investment)
Management fee 0.65
Distribution/service (12b-1) fees 0.25
Other expenses 0.26
Total annual fund operating expenses 1.16
EXAMPLEThis Example is intended to help you compare the cost ofinvesting in the fund with the cost of investing in othermutual funds. The Example assumes that you invest$10,000 in the fund for the time periods indicated and thenredeem all of your shares at the end of those periods. TheExample also assumes that your investment has a 5%return each year and that the fund’s operating expensesremain the same. This example does not reflect any fees orsales charges imposed by a variable contract for whichthe fund is an investment option. If they were included,your costs would be higher.
Although your actual costs may be higher or lower, basedon these assumptions your costs would be:
1Year 3Years 5Years 10Years
$118 $368 $638 $1,409
PORTFOLIO TURNOVERThe fund pays transaction costs, such as commissions,when it buys and sells securities (or “turns over” its port-folio). A higher portfolio turnover may indicate highertransaction costs. These costs are not reflected in annualfund operating expenses or in the expense example, butcan affect the fund’s performance.
Portfolio turnover rate for fiscal year 2015: 25%.
PRINCIPAL INVESTMENT STRATEGY
Main investments. Under normal circumstances, the fundinvests at least 80% of net assets, plus the amount ofany borrowings for investment purposes, in undervaluedcommon stocks of small and mid-size US companies. Thefund defines small companies as those that are similarin market value to those in the Russell 2000® Value Index.While the market capitalization range of the Russell 2000®
Value Index changes throughout the year, as of the mostrecent reconstitution date of the index (June 26, 2015),companies in the index had a median market capitalizationof approximately $796 million. The fund defines mid-sizecompanies as those that are similar in market value tothose in the Russell Midcap® Value Index. While themarket capitalization range of the Russell Midcap® ValueIndex changes throughout the year, as of the most recentreconstitution date of the index (June 26, 2015), compa-nies in the index had a median market capitalization ofapproximately $5.96 billion. The fund intends to investprimarily in companies whose market capitalizations fallwithin the normal range of each index.
While the fund invests mainly in US stocks, it could investup to 20% of net assets in foreign securities.
1
102
S-102

The fund’s equity investments are mainly common stocks,but may also include other types of equities such aspreferred or convertible stocks. The fund may also invest ininitial public offerings and real estate investment trusts(REITs).
Management process. In choosing stocks, portfoliomanagement focuses on individual security selectionrather than industry selection. Portfolio management usesan active process that combines financial analysis withcompany visits to evaluate management and strategies.Company research lies at the heart of the investmentprocess. Portfolio management emphasizes individualselection of stocks across all economic sectors, focusingon companies that it believes have strong management,identifiable catalysts (e.g., acquisitions or new products),and valuations that offer an attractive risk/reward trade-off.
Portfolio management utilizes multiple sources for ideageneration as it believes quantitative screens by them-selves are not robust enough to consistently sourceattractive investment ideas. Portfolio management’s inten-sive proprietary research starts with thorough backgroundresearch to gain an understanding of a company’s busi-ness model and financials. Management meetings aregenerally conducted to assess corporate culture and theability to execute on the business model with a focus oncapital allocation decisions. Portfolio management thenanalyzes valuations by determining the appropriate metricand establishing internal estimates. Portfolio managementreviews a stock’s investment thesis, catalysts and risks todetermine if the stock fits into the portfolio. Portfoliomanagement normally will sell a stock when it believesthe investment thesis proves incorrect, fundamentalsweaken, catalysts fail to materialize as expected, or if astock becomes fully valued.
Securities Lending.The fund may lend securities (up toone-third of total assets) to approved institutions.
MAIN RISKS
There are several risk factors that could hurt the fund’sperformance, cause you to lose money or cause the fund’sperformance to trail that of other investments. The fundmay not achieve its investment objective, and is notintended to be a complete investment program. An invest-ment in the fund is not a deposit of a bank and is notinsured or guaranteed by the Federal Deposit InsuranceCorporation or any other governmental agency.
Stock market risk. When stock prices fall, you shouldexpect the value of your investment to fall as well. Stockprices can be hurt by poor management on the part of thestock’s issuer, shrinking product demand and other busi-ness risks. These may affect single companies as well asgroups of companies. In addition, movements in financialmarkets may adversely affect a stock’s price, regardless ofhow well the company performs. The market as a wholemay not favor the types of investments the fund makes,which could affect the fund’s ability to sell them at an
attractive price. To the extent the fund invests in aparticular capitalization or sector, the fund’s performancemay be affected by the general performance of thatparticular capitalization or sector.
Small company risk. Small company stocks tend to bemore volatile than medium-sized or large company stocks.Because stock analysts are less likely to follow smallcompanies, less information about them is available toinvestors. Industry-wide reversals may have a greaterimpact on small companies, since they may lack the finan-cial resources of larger companies. Small company stocksare typically less liquid than large company stocks.
Medium-sized company risk. Medium-sized companystocks tend to be more volatile than large company stocks.Because stock analysts are less likely to follow medium-sized companies, less information about them is availableto investors. Industry-wide reversals may have a greaterimpact on medium-sized companies, since they lack thefinancial resources of larger companies. Medium-sizedcompany stocks are typically less liquid than largecompany stocks.
Value investing risk. As a category, value stocks mayunderperform growth stocks (and the stock market as awhole) over any period of time. In addition, value stocksselected for investment by portfolio management may notperform as anticipated.
Security selection risk.The securities in the fund’s port-folio may decline in value. Portfolio management could bewrong in its analysis of industries, companies, economictrends, the relative attractiveness of different securities orother matters.
Focus risk.To the extent that the fund focuses its invest-ments in particular industries, asset classes or sectorsof the economy, any market price movements, regulatoryor technological changes, or economic conditions affectingcompanies in those industries, asset classes or sectorsmay have a significant impact on the fund’s performance.
Foreign investment risk. The fund faces the risksinherent in foreign investing. Adverse political, economicor social developments could undermine the value of thefund’s investments or prevent the fund from realizing thefull value of its investments. Financial reporting standardsfor companies based in foreign markets differ from thosein the US. Additionally, foreign securities markets generallyare smaller and less liquid than US markets. To the extentthat the fund invests in non-US dollar denominated foreignsecurities, changes in currency exchange rates may affectthe US dollar value of foreign securities or the income orgain received on these securities.
Real estate securities risk.The value of real estate securi-ties in general, and REITs in particular, are subject to thesame risks as direct investments and will depend on thevalue of the underlying properties or the underlying loansor interest. The value of these securities will rise and fall inresponse to many factors, including economic conditions,
2 Deutsche Small Mid Cap Value VIP
Summary Prospectus May 1, 2016
103
S-103

the demand for rental property and interest rates. Inparticular, the value of these securities may decline wheninterest rates rise and will also be affected by the realestate market and by the management of the underlyingproperties. REITs may be more volatile and/or more illiquidthan other types of equity securities.
Pricing risk. If market conditions make it difficult to valuesome investments, the fund may value these investmentsusing more subjective methods, such as fair value pricing.In such cases, the value determined for an investmentcould be different from the value realized upon such invest-ment’s sale. As a result, you could pay more than themarket value when buying fund shares or receive less thanthe market value when selling fund shares.
Securities lending risk. Any decline in the value of a port-folio security that occurs while the security is out on loanis borne by the fund and will adversely affect performance.Also, there may be delays in recovery of securities loanedor even a loss of rights in the collateral should theborrower of the securities fail financially while holding thesecurity.
Liquidity risk. In certain situations, it may be difficult orimpossible to sell an investment and/or the fund may sellcertain investments at a price or time that is not advan-tageous in order to meet redemption requests or othercash needs. Unusual market conditions, such as an unusu-ally high volume of redemptions or other similar conditionscould increase liquidity risk for the fund.
IPO risk. Prices of securities bought in an initial publicoffering (IPO) may rise and fall rapidly, often because ofinvestor perceptions rather than economic reasons. To theextent a mutual fund is small in size, its IPO investmentsmay have a significant impact on its performance sincethey may represent a larger proportion of the fund’s overallportfolio as compared to the portfolio of a larger fund.
Operational and technology risk. Cyber-attacks, disrup-tions, or failures that affect the fund’s service providers orcounterparties, issuers of securities held by the fund, orother market participants may adversely affect the fundand its shareholders, including by causing losses for thefund or impairing fund operations.
PAST PERFORMANCE
How a fund’s returns vary from year to year can give anidea of its risk; so can comparing fund performance tooverall market performance (as measured by an appro-priate market index). Past performance may not indicatefuture results. All performance figures below assume thatdividends and distributions were reinvested. For morerecent performance figures, go to deutschefunds.com (theWeb site does not form a part of this prospectus) or callthe phone number included in this prospectus. This informa-tion doesn’t reflect fees associated with the separate
account that invests in the fund or any variable life insur-ance policy or variable annuity contract for which the fundis an investment option. These fees will reduce returns.
Prior to September 3, 2013, the fund had a sub-advisor anda different investment management team that operatedwith a different investment strategy. Prior to November 3,2006, the fund was named DWS Dreman Small Cap ValueVIP and operated with a different investment strategy.Performance would have been different if the fund’scurrent investment strategy had been in effect.
CALENDAR YEAR TOTAL RETURNS (%) (Class B)
24.59
2.67
-33.67
29.2822.66
-6.33
13.38
34.70
5.09
-2.21
-60
-40
-20
0
20
40
60
2006 2007 2008 2009 2010 2011 2012 2013 2014 2015
Returns Period ending
Best Quarter 21.15% September 30, 2009Worst Quarter -20.85% September 30, 2011Year-to-Date 0.88% March 31, 2016
AVERAGE ANNUAL TOTAL RETURNS(For periods ended 12/31/2015 expressed as a %)
ClassInception
1Year
5Years
10Years
Class B 7/1/2002 -2.21 8.01 7.06
Russell 2500ValueIndex (reflects no deduc-tion for fees, expensesor taxes) -5.49 9.23 6.51
MANAGEMENT
Investment Advisor
Deutsche Investment Management Americas Inc.
Portfolio Manager(s)
Richard Hanlon, CFA, Director. Portfolio Manager of thefund. Began managing the fund in 2016.
Mary Schafer, Director. Portfolio Manager of the fund.Began managing the fund in 2016.
PURCHASE AND SALE OF FUND SHARES
The fund is intended for use in a variable insurance
product.You should contact the sponsoring insurancecompany for information on how to purchase and sellshares of the fund.
3 Deutsche Small Mid Cap Value VIP
Summary Prospectus May 1, 2016
104
S-104

TAX INFORMATION
The fund normally distributes its net investment incomeand realized capital gains, if any, to its shareholders, theseparate accounts of participating insurance companies.These distributions may not be taxable to the holders ofvariable annuity contracts and variable life insurance poli-cies. For information concerning the federal income taxconsequences for the holders of such contracts or policies,holders should consult the prospectus used in connec-tion with the issuance of their particular contracts orpolicies.
PAYMENTS TO FINANCIAL INTERMEDIARIES
If you purchase the fund through selected affiliated andunaffiliated brokers, dealers, participating insurance compa-nies or other financial intermediaries, the fund, theAdvisor, and/or the Advisor’s affiliates, may pay the finan-cial intermediary for the sale of fund shares and relatedservices. These payments may create a conflict of interestby influencing the financial intermediary and your sales-person to recommend the fund over another investment.Ask your salesperson or visit your insurance company’sWeb site for more information.
4 Deutsche Small Mid Cap Value VIP
Summary Prospectus May 1, 2016 2B-SMCV-SUM
105
S-105

0172SP0416
Core Value PortfolioA Series of Dreyfus Investment Portfolios
Summary Prospectus April 29, 2016
Initial Shares Service Shares
Before you invest, you may want to review the fund's prospectus, which contains more information about the fund and its risks. You can find the fund's prospectus and other information about the fund, including the statement of additional information and most recent reports to shareholders, online at www.dreyfus.com/vifunddocuments. You can also get this information at no cost by calling 1-800-DREYFUS (inside the U.S. only) or by sending an e-mail request to [email protected]. The fund's prospectus and statement of additional information, dated April 29, 2016 (each as revised or supplemented), are incorporated by reference into this summary prospectus.
Investment Objective The fund seeks long-term growth of capital, with current income as a secondary objective.
Fees and Expenses This table describes the fees and expenses that you may pay if you buy and hold shares of the fund. These figures do not reflect any fees or charges imposed by participating insurance companies under their Variable Annuity contracts (VA contracts) or Variable Life Insurance policies (VLI policies), and if such fees and/or charges were included, the fees and expenses would be higher. Annual Fund Operating Expenses (expenses that you pay each year as a percentage of the value of your investment)
Initial Shares Service Shares
Management fees .75 .75 Distribution and/or service (12b-1) fees none .25 Other expenses .32 .32 Total annual fund operating expenses 1.07 1.32
Example
The Example is intended to help you compare the cost of investing in the fund with the cost of investing in other mutual funds. The Example assumes that you invest $10,000 in the fund for the time periods indicated and then redeem all of your shares at the end of those periods. The Example also assumes that your investment has a 5% return each year and that the fund's operating expenses remain the same. The Example does not reflect fees and expenses incurred under VA contracts and VLI policies; if they were reflected, the figures in the Example would be higher. Although your actual costs may be higher or lower, based on these assumptions your costs would be:
1 Year 3 Years 5 Years 10 Years
Initial Shares $109 $340 $590 $1,306 Service Shares $134 $418 $723 $1,590
Portfolio Turnover
The fund pays transaction costs, such as commissions, when it buys and sells securities (or "turns over" its portfolio). A higher portfolio turnover may indicate higher transaction costs. These costs, which are not reflected in annual fund operating expenses or in the Example, affect the fund's performance. During the most recent fiscal year, the fund's portfolio turnover rate was 105.48% of the average value of its portfolio.
106
S-106
Core Value Portfolio Summary 2
Principal Investment Strategy To pursue its goals, the fund normally invests at least 80% of its net assets, plus any borrowings for investment purposes, in stocks (or other instruments with similar economic characteristics). The fund focuses on stocks of large-cap value companies (market capitalizations of $1 billion and above). The fund typically invests mainly in the stocks of U.S. issuers, and will limit its holdings of foreign stocks (i.e., issued by companies organized under the laws of countries other than the U.S.) to 20% of the value of its total assets.
In choosing stocks, the portfolio manager focuses on individual stock selection (a "bottom-up" approach) rather than forecasting stock market trends (a "top-down" approach), and looks for value companies. A three-step value screening process is used to select stocks, which includes screenings for value, sound business fundamentals and positive business momentum.
Principal Risks An investment in the fund is not a bank deposit. It is not insured or guaranteed by the Federal Deposit Insurance Corporation (FDIC) or any other government agency. It is not a complete investment program. The fund's share price fluctuates, sometimes dramatically, which means you could lose money.
� Risks of stock investing. Stocks generally fluctuate more in value than bonds and may decline significantly over short time periods. There is the chance that stock prices overall will decline because stock markets tend to move in cycles, with periods of rising prices and falling prices. The market value of a stock may decline due to general market conditions or because of factors that affect the particular company or the company's industry.
� Value stock risk. Value stocks involve the risk that they may never reach their expected full market value, either because the market fails to recognize the stock's intrinsic worth or the expected value was misgauged. They also may decline in price even though in theory they are already undervalued.
� Foreign investment risk. To the extent the fund invests in foreign securities, the fund's performance will be influenced by political, social and economic factors affecting investments in foreign issuers. Special risks associated with investments in foreign issuers include exposure to currency fluctuations, less liquidity, less developed or less efficient trading markets, lack of comprehensive company information, political and economic instability and differing auditing and legal standards. Investments denominated in foreign currencies are subject to the risk that such currencies will decline in value relative to the U.S. dollar and affect the value of these investments held by the fund.
� Portfolio turnover risk. The fund may engage in short-term trading, which could produce higher transaction costs.
� Large cap stock risk. To the extent the fund invests in large capitalization stocks, the fund may underperform funds that invest primarily in the stocks of lower quality, smaller capitalization companies during periods when the stocks of such companies are in favor.
Performance The following bar chart and table provide some indication of the risks of investing in the fund. The bar chart shows changes in the performance of the fund's Initial shares from year to year. The table compares the average annual total returns of the fund's shares to those of a broad measure of market performance. The fund's past performance is not necessarily an indication of how the fund will perform in the future. More recent performance information may be available at www.dreyfus.com.
Performance information reflects the fund's expenses only and does not reflect the fees and charges imposed by participating insurance companies under their VA contracts or VLI policies. Because these fees and charges will reduce total return, policyowners should consider them when evaluating and comparing the fund's performance. Policyowners should consult the prospectus for their contract or policy for more information.
107
S-107

Core Value Portfolio Summary 3
Year-by-Year Total Returns as of 12/31 each year (%) Initial Shares
15141312111009080706
18.34
37.87
10.31
-2.22
21.31
3.00
-35.91
18.18 13.21
-5.82
Best Quarter Q2, 2009: 16.83% Worst Quarter Q3, 2011: -22.14%
Average Annual Total Returns (as of 12/31/15)
1 Year 5 Years 10 Years
Initial Shares -2.22% 10.63% 5.91% Service Shares -2.50% 10.36% 5.70% Russell 1000® Value Index reflects no deduction for fees, expenses or taxes -3.83% 11.27% 6.16%
Portfolio Management The fund's investment adviser is The Dreyfus Corporation (Dreyfus).
Brian C. Ferguson is the fund's primary portfolio manager, a position he has held since April 2004. Mr. Ferguson is a senior vice president and the director of the U.S. Large Cap Value Equity Team of The Boston Company Asset Management, LLC, an affiliate of Dreyfus. He also is an employee of Dreyfus.
Purchase and Sale of Fund Shares Fund shares are offered only to separate accounts established by insurance companies to fund VA contracts and VLI policies. Individuals may not purchase shares directly from, or place sell orders directly with, the fund. The VA contracts and the VLI policies are described in the separate prospectuses issued by the participating insurance companies, over which the fund assumes no responsibility. Policyowners should consult the prospectus of the separate account of the participating insurance company for more information about buying, selling (redeeming), or exchanging fund shares.
Tax Information The fund's distributions are taxable as ordinary income or capital gains. Since the fund's shareholders are the participating insurance companies and their separate accounts, the tax treatment of dividends and distributions will depend on the tax status of the participating insurance company. Accordingly, no discussion is included as to the federal personal income tax consequences to policyowners. For this information, policyowners should consult the prospectus of the separate account of the participating insurance company or their tax advisers.
Payments to Broker-Dealers and Other Financial Intermediaries If you purchase shares through a broker-dealer or other financial intermediary (such as an insurance company), the fund and its related companies may pay the intermediary for the sale of fund shares and related services. These payments may create a conflict of interest by influencing the broker-dealer or other intermediary and your salesperson to recommend the fund over another investment. Ask your salesperson or visit your financial intermediary's website for more information.
This prospectus does not constitute an offer or solicitation in any state or jurisdiction in which, or to any person to whom, such offering or solicitation may not lawfully be made.
108
S-108
0174SP0416
MidCap Stock PortfolioA Series of Dreyfus Investment Portfolios
Summary Prospectus April 29, 2016
Initial Shares Service Shares
Before you invest, you may want to review the fund's prospectus, which contains more information about the fund and its risks. You can find the fund's prospectus and other information about the fund, including the statement of additional information and most recent reports to shareholders, online at www.dreyfus.com/vifunddocuments. You can also get this information at no cost by calling 1-800-DREYFUS (inside the U.S. only) or by sending an e-mail request to [email protected]. The fund's prospectus and statement of additional information, dated April 29, 2016 (each as revised or supplemented), are incorporated by reference into this summary prospectus.
Investment Objective The fund seeks investment results that are greater than the total return performance of publicly traded common stocks of medium-size domestic companies in the aggregate, as represented by the Standard & Poor's MidCap 400® Index (S&P 400 Index), and if such fees and/or charges were included, the fees and expenses would be higher.
Fees and Expenses This table describes the fees and expenses that you may pay if you buy and hold shares of the fund. These figures do not reflect any fees or charges imposed by participating insurance companies under their Variable Annuity contracts (VA contracts) or Variable Life Insurance policies (VLI policies), and if such fees and/or charges were included, the fees and expenses would be higher. Annual Fund Operating Expenses (expenses that you pay each year as a percentage of the value of your investment)
Initial Shares Service Shares
Management fees .75 .75 Distribution and/or service (12b-1) fees none .25 Other expenses .10 .10 Total annual fund operating expenses .85 1.10
Example
The Example is intended to help you compare the cost of investing in the fund with the cost of investing in other mutual funds. The Example assumes that you invest $10,000 in the fund for the time periods indicated and then redeem all of your shares at the end of those periods. The Example also assumes that your investment has a 5% return each year and that the fund's operating expenses remain the same. The Example does not reflect fees and expenses incurred under VA contracts and VLI policies; if they were reflected, the figures in the Example would be higher. Although your actual costs may be higher or lower, based on these assumptions your costs would be:
1 Year 3 Years 5 Years 10 Years
Initial Shares $87 $271 $471 $1,049 Service Shares $112 $350 $606 $1,340
Portfolio Turnover
The fund pays transaction costs, such as commissions, when it buys and sells securities (or "turns over" its portfolio). A higher portfolio turnover may indicate higher transaction costs. These costs, which are not reflected in annual fund operating expenses
109
S-109

MidCap Stock Portfolio Summary 2
or in the Example, affect the fund's performance. During the most recent fiscal year, the fund's portfolio turnover rate was 80.27% of the average value of its portfolio.
Principal Investment Strategy To pursue its goal, the fund normally invests at least 80% of its net assets, plus any borrowings for investment purposes, in stocks of mid-cap companies. The fund invests in growth and value stocks, which are chosen through a disciplined investment process that combines computer modeling techniques, fundamental analysis and risk management. Consistency of returns compared to the S&P 400 Index, the fund's benchmark, is a primary goal of the investment process.
The portfolio managers select stocks through a "bottom-up," structured approach that seeks to identify undervalued securities using a quantitative ranking process. The process is driven by a proprietary quantitative model that measures a diverse set of corporate characteristics to identify and rank stocks based on valuation, momentum and sentiment and earnings quality measures.
Next, the fund's portfolio managers construct the portfolio through a risk controlled process, focusing on stock selection as opposed to making proactive decisions as to industry and sector exposure. The portfolio managers seek to maintain a portfolio that has exposure to industries and market capitalizations that are generally similar to the fund's benchmark. Finally, within each sector and style subset, the fund will seek to overweight the most attractive stocks and underweight or not hold the stocks that have been ranked least attractive.
Principal Risks An investment in the fund is not a bank deposit. It is not insured or guaranteed by the Federal Deposit Insurance Corporation (FDIC) or any other government agency. It is not a complete investment program. The fund's share price fluctuates, sometimes dramatically, which means you could lose money.
� Risks of stock investing. Stocks generally fluctuate more in value than bonds and may decline significantly over short time periods. There is the chance that stock prices overall will decline because stock markets tend to move in cycles, with periods of rising prices and falling prices. The market value of a stock may decline due to general market conditions or because of factors that affect the particular company or the company's industry.
� Midsize company risk. Midsize companies carry additional risks because the operating histories of these companies tend to be more limited, their earnings and revenues less predictable (and some companies may be experiencing significant losses), and their share prices more volatile than those of larger, more established companies.
� Growth and value stock risk. By investing in a mix of growth and value companies, the fund assumes the risks of both. Investors often expect growth companies to increase their earnings at a certain rate. If these expectations are not met, investors can punish the stocks inordinately, even if earnings do increase. In addition, growth stocks may lack the dividend yield that may cushion stock prices in market downturns. Value stocks involve the risk that they may never reach their expected full market value, either because the market fails to recognize the stock's intrinsic worth, or the expected value was misgauged. They also may decline in price even though in theory they are already undervalued.
Performance The following bar chart and table provide some indication of the risks of investing in the fund. The bar chart shows changes in the performance of the fund's Initial shares from year to year. The table compares the average annual total returns of the fund's shares to those of a broad measure of market performance. The fund's past performance is not necessarily an indication of how the fund will perform in the future. More recent performance information may be available at www.dreyfus.com.
Performance information reflects the fund's expenses only and does not reflect the fees and charges imposed by participating insurance companies under their VA contracts or VLI policies. Because these fees and charges will reduce total return, policyowners should consider them when evaluating and comparing the fund's performance. Policyowners should consult the prospectus for their contract or policy for more information.
110
S-110

MidCap Stock Portfolio Summary 3
Year-by-Year Total Returns as of 12/31 each year (%) Initial Shares
15141312111009080706
19.6734.99
12.09
-2.29
7.751.50
-40.42
35.5127.10
0.40
Best Quarter Q3, 2009: 18.20% Worst Quarter Q4, 2008: -27.18%
Average Annual Total Returns (as of 12/31/15)
1 Year 5 Years 10 Years
Initial Shares -2.29% 12.18% 7.14% Service Shares -2.52% 11.90% 6.96% S&P MidCap 400® Index reflects no deduction for fees, expenses or taxes -2.18% 10.68% 8.18%
Portfolio Management The fund's investment adviser is The Dreyfus Corporation (Dreyfus).
Investment decisions for the fund are made by members of the Active Equity Team of Mellon Capital Management Corporation (Mellon Capital), an affiliate of Dreyfus. The team members are C. Wesley Boggs, William S. Cazalet, CAIA and Ronald P. Gala, CFA. Messrs. Boggs and Gala have each served as a primary portfolio manager of the fund since May 2012, and Mr. Cazalet has served as a primary portfolio manager of the fund since December 2014. Mr. Boggs is a vice president and senior portfolio manager at Mellon Capital. Mr. Cazalet is a managing director and head of active equity strategies at Mellon Capital. Mr. Gala is a managing director and senior portfolio manager at Mellon Capital. Each member of the team also is an employee of Dreyfus.
Purchase and Sale of Fund Shares Fund shares are offered only to separate accounts established by insurance companies to fund VA contracts and VLI policies. Individuals may not purchase shares directly from, or place sell orders directly with, the fund. The VA contracts and the VLI policies are described in the separate prospectuses issued by the participating insurance companies, over which the fund assumes no responsibility. Policyowners should consult the prospectus of the separate account of the participating insurance company for more information about buying, selling (redeeming), or exchanging fund shares.
Tax Information The fund's distributions are taxable as ordinary income or capital gains. Since the fund's shareholders are the participating insurance companies and their separate accounts, the tax treatment of dividends and distributions will depend on the tax status of the participating insurance company. Accordingly, no discussion is included as to the federal personal income tax consequences to policyowners. For this information, policyowners should consult the prospectus of the separate account of the participating insurance company or their tax advisers.
Payments to Broker-Dealers and Other Financial Intermediaries If you purchase shares through a broker-dealer or other financial intermediary (such as an insurance company), the fund and its related companies may pay the intermediary for the sale of fund shares and related services. These payments may create a conflict of interest by influencing the broker-dealer or other intermediary and your salesperson to recommend the fund over another investment. Ask your salesperson or visit your financial intermediary's website for more information.
This prospectus does not constitute an offer or solicitation in any state or jurisdiction in which, or to any person to whom, such offering or solicitation may not lawfully be made.
111
S-111

0175SP0416
Technology Growth Portfolio
A Series of Dreyfus Investment Portfolios
Summary Prospectus April 29, 2016
Initial Shares Service Shares
Before you invest, you may want to review the fund's prospectus, which contains more information about the fund and its risks. You can find the fund's prospectus and other information about the fund, including the statement of additional information and most recent reports to shareholders, online at www.dreyfus.com/vifunddocuments. You can also get this information at no cost by calling 1-800-DREYFUS (inside the U.S. only) or by sending an e-mail request to [email protected]. The fund's prospectus and statement of additional information, dated April 29, 2016 (each as revised or supplemented), are incorporated by reference into this summary prospectus.
Investment Objective The fund seeks capital appreciation.
Fees and Expenses This table describes the fees and expenses that you may pay if you buy and hold shares of the fund. These figures do not reflect any fees or charges imposed by participating insurance companies under their Variable Annuity contracts (VA contracts) or Variable Life Insurance policies (VLI policies), and if such fees and/or charges were included, the fees and expenses would be higher. Annual Fund Operating Expenses (expenses that you pay each year as a percentage of the value of your investment)
Initial Shares Service Shares
Management fees .75 .75 Distribution and/or service (12b-1) fees none .25 Other expenses .08 .08 Total annual fund operating expenses .83 1.08
Example
The Example is intended to help you compare the cost of investing in the fund with the cost of investing in other mutual funds. The Example assumes that you invest $10,000 in the fund for the time periods indicated and then redeem all of your shares at the end of those periods. The Example also assumes that your investment has a 5% return each year and that the fund's operating expenses remain the same. The Example does not reflect fees and expenses incurred under VA contracts and VLI policies; if they were reflected, the figures in the Example would be higher. Although your actual costs may be higher or lower, based on these assumptions your costs would be:
1 Year 3 Years 5 Years 10 Years
Initial Shares $85 $265 $460 $1,025 Service Shares $110 $343 $595 $1,317
Portfolio Turnover
The fund pays transaction costs, such as commissions, when it buys and sells securities (or "turns over" its portfolio). A higher portfolio turnover may indicate higher transaction costs. These costs, which are not reflected in annual fund operating expenses or in the Example, affect the fund's performance. During the most recent fiscal year, the fund's portfolio turnover rate was 70.33% of the average value of its portfolio.
112
S-112

Technology Growth Portfolio Summary 2
Principal Investment Strategy To pursue its goal, the fund normally invests at least 80% of its net assets, plus any borrowings for investment purposes, in the stocks of growth companies of any size that The Dreyfus Corporation believes to be leading producers or beneficiaries of technological innovation. Up to 25% of the fund's assets may be invested in foreign securities (i.e., securities issued by companies organized under the laws of countries other than the U.S.).
In choosing stocks, the fund looks for technology companies with the potential for strong earnings or revenue growth rates, although some of the fund's investments may currently be experiencing losses. The fund's investment process centers on a multi-dimensional approach that looks for opportunities across emerging growth, cyclical or stable growth companies. The fund's investment approach seeks companies that appear to have strong earnings momentum, positive earnings revisions, favorable growth, product or market cycles and/or favorable valuations.
Principal Risks An investment in the fund is not a bank deposit. It is not insured or guaranteed by the Federal Deposit Insurance Corporation (FDIC) or any other government agency. It is not a complete investment program. The fund's share price fluctuates, sometimes dramatically, which means you could lose money.
� Risks of stock investing. Stocks generally fluctuate more in value than bonds and may decline significantly over short time periods. There is the chance that stock prices overall will decline because stock markets tend to move in cycles, with periods of rising prices and falling prices. The market value of a stock may decline due to general market conditions or because of factors that affect the particular company or the company's industry.
� Growth stock risk. Investors often expect growth companies to increase their earnings at a certain rate. If these expectations are not met, investors can punish the stocks inordinately, even if earnings do increase. In addition, growth stocks may lack the dividend yield that may cushion stock prices in market downturns.
� Technology company risk. The technology sector has been among the most volatile sectors of the stock market. Because the fund's investments are concentrated in the technology sector, its performance will be significantly affected by developments in that sector. Technology companies, especially small-cap technology companies, involve greater risk because their revenue and/or earnings tend to be less predictable (and some companies may be experiencing significant losses) and their share prices tend to be more volatile. Certain technology companies may have limited product lines, markets or financial resources, or may depend on a limited management group. In addition, these companies are strongly affected by worldwide technological developments, and their products and services may not be economically successful or may quickly become outdated. Investor perception may play a greater role in determining the day-to-day value of tech stocks than it does in other sectors. Fund investments made in anticipation of future products and services may decline dramatically in value if the anticipated products or services are delayed or cancelled. The risks associated with technology companies are magnified in the case of small-cap technology companies. The shares of smaller technology companies tend to trade less frequently than those of larger, more established companies, which can have an adverse effect on the pricing of these securities and on the fund's ability to sell these securities.
� Foreign investment risk. To the extent the fund invests in foreign securities, the fund's performance will be influenced by political, social and economic factors affecting investments in foreign issuers. Special risks associated with investments in foreign issuers include exposure to currency fluctuations, less liquidity, less developed or less efficient trading markets, lack of comprehensive company information, political and economic instability and differing auditing and legal standards. Investments denominated in foreign currencies are subject to the risk that such currencies will decline in value relative to the U.S. dollar and affect the value of these investments held by the fund.
� Liquidity risk. When there is little or no active trading market for specific types of securities, it can become more difficult to sell the securities in a timely manner at or near their perceived value. In such a market, the value of such securities and the fund's share price may fall dramatically. Investments that are illiquid or that trade in lower volumes may be more difficult to value.
Performance The following bar chart and table provide some indication of the risks of investing in the fund. The bar chart shows changes in the performance of the fund's Initial shares from year to year. The table compares the average annual total returns of the fund's shares to those of a broad measure of market performance. The fund's past performance is not necessarily an indication of how the fund will perform in the future. More recent performance information may be available at www.dreyfus.com.
Performance information reflects the fund's expenses only and does not reflect the fees and charges imposed by participating insurance companies under their VA contracts or VLI policies. Because these fees and charges will reduce total return, policyowners should consider them when evaluating and comparing the fund's performance. Policyowners should consult the prospectus for their contract or policy for more information.
113
S-113
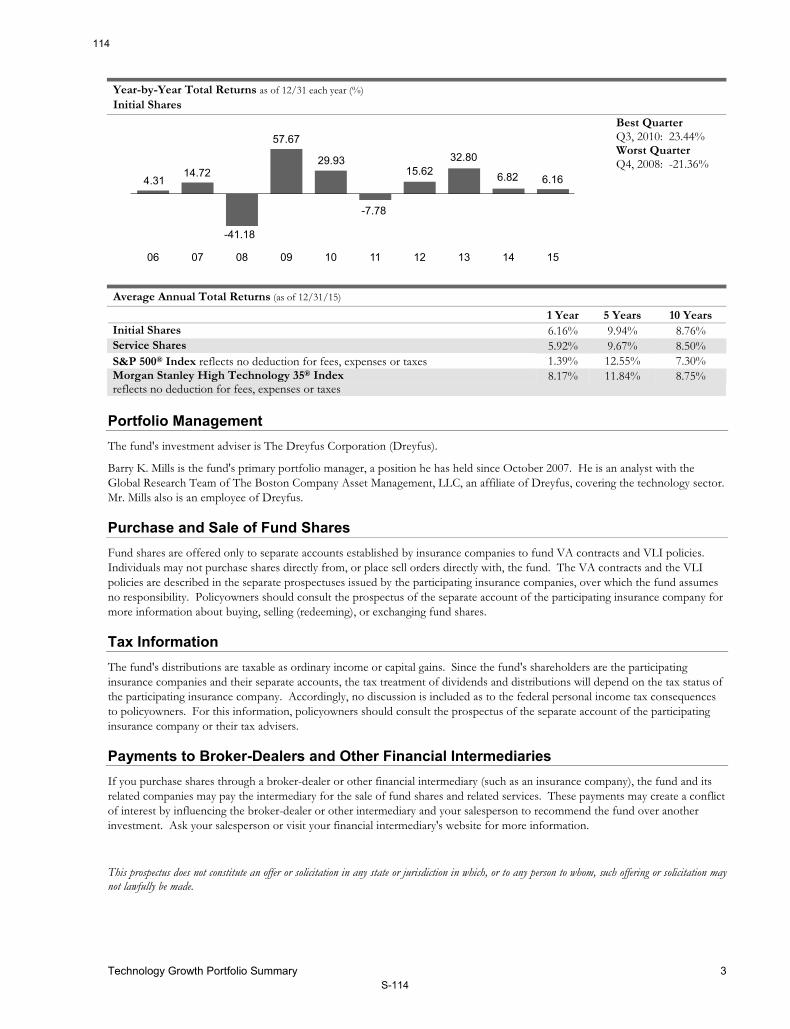
Technology Growth Portfolio Summary 3
Year-by-Year Total Returns as of 12/31 each year (%) Initial Shares
15141312111009080706
15.6232.80
6.82 6.164.3114.72
-41.18
57.67
29.93
-7.78
Best Quarter Q3, 2010: 23.44% Worst Quarter Q4, 2008: -21.36%
Average Annual Total Returns (as of 12/31/15)
1 Year 5 Years 10 Years
Initial Shares 6.16% 9.94% 8.76% Service Shares 5.92% 9.67% 8.50% S&P 500® Index reflects no deduction for fees, expenses or taxes 1.39% 12.55% 7.30% Morgan Stanley High Technology 35® Index reflects no deduction for fees, expenses or taxes
8.17% 11.84% 8.75%
Portfolio Management The fund's investment adviser is The Dreyfus Corporation (Dreyfus).
Barry K. Mills is the fund's primary portfolio manager, a position he has held since October 2007. He is an analyst with the Global Research Team of The Boston Company Asset Management, LLC, an affiliate of Dreyfus, covering the technology sector. Mr. Mills also is an employee of Dreyfus.
Purchase and Sale of Fund Shares Fund shares are offered only to separate accounts established by insurance companies to fund VA contracts and VLI policies. Individuals may not purchase shares directly from, or place sell orders directly with, the fund. The VA contracts and the VLI policies are described in the separate prospectuses issued by the participating insurance companies, over which the fund assumes no responsibility. Policyowners should consult the prospectus of the separate account of the participating insurance company for more information about buying, selling (redeeming), or exchanging fund shares.
Tax Information The fund's distributions are taxable as ordinary income or capital gains. Since the fund's shareholders are the participating insurance companies and their separate accounts, the tax treatment of dividends and distributions will depend on the tax status of the participating insurance company. Accordingly, no discussion is included as to the federal personal income tax consequences to policyowners. For this information, policyowners should consult the prospectus of the separate account of the participating insurance company or their tax advisers.
Payments to Broker-Dealers and Other Financial Intermediaries If you purchase shares through a broker-dealer or other financial intermediary (such as an insurance company), the fund and its related companies may pay the intermediary for the sale of fund shares and related services. These payments may create a conflict of interest by influencing the broker-dealer or other intermediary and your salesperson to recommend the fund over another investment. Ask your salesperson or visit your financial intermediary's website for more information.
This prospectus does not constitute an offer or solicitation in any state or jurisdiction in which, or to any person to whom, such offering or solicitation may not lawfully be made.
114
S-114

0111SP0416
The Dreyfus Socially Responsible Growth
Fund, Inc.
Summary Prospectus April 29, 2016
Initial Shares Service Shares
Before you invest, you may want to review the fund's prospectus, which contains more information about the fund and its risks. You can find the fund's prospectus and other information about the fund, including the statement of additional information and most recent reports to shareholders, online at www.dreyfus.com/vifunddocuments. You can also get this information at no cost by calling 1-800-DREYFUS (inside the U.S. only) or by sending an e-mail request to [email protected]. The fund's prospectus and statement of additional information, dated April 29, 2016 (each as revised or supplemented), are incorporated by reference into this summary prospectus.
Investment Objective The fund seeks to provide capital growth, with current income as a secondary goal.
Fees and Expenses This table describes the fees and expenses that you may pay if you buy and hold shares of the fund. These figures do not reflect any fees or charges imposed by participating insurance companies under their Variable Annuity contracts (VA contracts) or Variable Life Insurance policies (VLI policies), and if such fees and/or charges were included, the fees and expenses would be higher. Annual Fund Operating Expenses (expenses that you pay each year as a percentage of the value of your investment)
Initial Shares Service Shares
Management fees .75 .75 Distribution (12b-1) fees none .25 Other expenses (including shareholder services fees) .11 .11 Total annual fund operating expenses .86 1.11
Example
The Example is intended to help you compare the cost of investing in the fund with the cost of investing in other mutual funds. The Example assumes that you invest $10,000 in the fund for the time periods indicated and then redeem all of your shares at the end of those periods. The Example also assumes that your investment has a 5% return each year and that the fund's operating expenses remain the same. The Example does not reflect fees and expenses incurred under VA contracts and VLI policies; if they were reflected, the figures in the Example would be higher. Although your actual costs may be higher or lower, based on these assumptions your costs would be:
1 Year 3 Years 5 Years 10 Years
Initial Shares $88 $274 $477 $1,061 Service Shares $113 $353 $612 $1,352
Portfolio Turnover
The fund pays transaction costs, such as commissions, when it buys and sells securities (or "turns over" its portfolio). A higher portfolio turnover may indicate higher transaction costs. These costs, which are not reflected in annual fund operating expenses or in the Example, affect the fund's performance. During the most recent fiscal year, the fund's portfolio turnover rate was 59.57% of the average value of its portfolio.
115
S-115

The Dreyfus Socially Responsible Growth Fund Summary 2
Principal Investment Strategy To pursue its goals, the fund, under normal circumstances, invests at least 80% of its net assets in the common stocks of companies that, in the opinion of the fund's management, meet traditional investment standards and conduct their business in a manner that contributes to the enhancement of the quality of life in America.
The fund's investment strategy combines a disciplined investment process that consists of computer modeling techniques, fundamental analysis and risk management with a social investment process. In selecting stocks, the portfolio managers begin by using computer models to identify and rank stocks within an industry or sector, based on several characteristics, including value, growth and financial profile.
Next, based on fundamental analysis, the portfolio managers designate the most attractive of the higher ranked securities as potential purchase candidates, drawing on a variety of sources, including company management and internal as well as Wall Street research.
The portfolio managers then evaluate each stock considered to be a potential purchase candidate to determine whether the com-pany enhances the quality of life in America by considering its record in the areas of protection and improvement of the environment and the proper use of our natural resources, occupational health and safety, consumer protection and product purity and equal employment opportunity.
The portfolio managers then further examine the companies determined to be eligible for purchase, by industry or sector, and select investments from those companies the portfolio managers consider to be the most attractive based on financial considera-tions.
Principal Risks An investment in the fund is not a bank deposit. It is not insured or guaranteed by the Federal Deposit Insurance Corporation (FDIC) or any other government agency. It is not a complete investment program. The fund's share price fluctuates, sometimes dramatically, which means you could lose money.
� Risks of stock investing. Stocks generally fluctuate more in value than bonds and may decline significantly over short time periods. There is the chance that stock prices overall will decline because stock markets tend to move in cycles, with periods of rising prices and falling prices. The market value of a stock may decline due to general market conditions or because of factors that affect the particular company or the company's industry.
� Social investment risk. Socially responsible investment criteria may limit the number of investment opportunities available to the fund, and as a result, at times the fund's returns may be lower than those funds that are not subject to such special investment considerations.
� Market sector risk. The fund may significantly overweight or underweight certain companies, industries or market sectors, which may cause the fund's performance to be more or less sensitive to developments affecting those companies, industries or sectors.
Performance The following bar chart and table provide some indication of the risks of investing in the fund. The bar chart shows changes in the performance of the fund's Initial shares from year to year. The table compares the average annual total returns of the fund's shares to those of a broad measure of market performance. The fund's past performance is not necessarily an indication of how the fund will perform in the future. More recent performance information may be available at www.dreyfus.com.
Performance information reflects the fund's expenses only and does not reflect the fees and charges imposed by participating insurance companies under their VA contracts or VLI policies. Because these fees and charges will reduce total return, policyowners should consider them when evaluating and comparing the fund's performance. Policyowners should consult the prospectus for their contract or policy for more information.
116
S-116

The Dreyfus Socially Responsible Growth Fund Summary 3
Year-by-Year Total Returns as of 12/31 each year (%) Initial Shares
15141312111009080706
11.98
34.34
13.45
-3.20
9.20 7.78
-34.42
33.75
14.82
0.90
Best Quarter Q2, 2009: 17.32% Worst Quarter Q4, 2008: -21.47%
Average Annual Total Returns (as of 12/31/15)
1 Year 5 Years 10 Years
Initial Shares -3.20% 10.76% 7.05% Service Shares -3.41% 10.48% 6.78% S&P 500® Index reflects no deduction for fees, expenses or taxes 1.39% 12.55% 7.30%
Portfolio Management The fund's investment adviser is The Dreyfus Corporation (Dreyfus).
Investment decisions for the fund are made by members of the Active Equity Team of Mellon Capital Management Corporation (Mellon Capital), an affiliate of Dreyfus. The team members are C. Wesley Boggs, William S. Cazalet, CAIA and Ronald P. Gala, CFA. Messrs. Boggs and Gala have each served as a primary portfolio manager of the fund since May 2012, and Mr. Cazalet has served as a primary portfolio manager of the fund since December 2014. Mr. Boggs is a vice president, senior portfolio manager and active equity strategist at Mellon Capital. Mr. Cazalet is a managing director and head of active equity strategies at Mellon Capital. Mr. Gala is a managing director and senior portfolio manager at Mellon Capital. Each member of the team also is an employee of Dreyfus.
Purchase and Sale of Fund Shares Fund shares are offered only to separate accounts established by insurance companies to fund VA contracts and VLI policies. Individuals may not purchase shares directly from, or place sell orders directly with, the fund. The VA contracts and the VLI policies are described in the separate prospectuses issued by the participating insurance companies, over which the fund assumes no responsibility. Policyowners should consult the prospectus of the separate account of the participating insurance company for more information about buying, selling (redeeming), or exchanging fund shares.
Tax Information The fund's distributions are taxable as ordinary income or capital gains. Since the fund's shareholders are the participating insurance companies and their separate accounts, the tax treatment of dividends and distributions will depend on the tax status of the participating insurance company. Accordingly, no discussion is included as to the federal personal income tax consequences to policyowners. For this information, policyowners should consult the prospectus of the separate account of the participating insurance company or their tax advisers.
Payments to Broker-Dealers and Other Financial Intermediaries If you purchase shares through a broker-dealer or other financial intermediary (such as an insurance company), the fund and its related companies may pay the intermediary for the sale of fund shares and related services. These payments may create a conflict of interest by influencing the broker-dealer or other intermediary and your salesperson to recommend the fund over another investment. Ask your salesperson or visit your financial intermediary's website for more information.
This prospectus does not constitute an offer or solicitation in any state or jurisdiction in which, or to any person to whom, such offering or solicitation may not lawfully be made.
117
S-117

The Dreyfus Socially Responsible Growth Fund Summary 4
This page has been left intentionally blank
Printed on recycled paper. 50% post-consumer. Process chlorine free. Vegetable-based ink.
118
S-118

0112SP0416
Appreciation PortfolioA Series of Dreyfus Variable Investment Fund
Summary Prospectus April 29, 2016
Initial Shares Service Shares
Before you invest, you may want to review the fund's prospectus, which contains more information about the fund and its risks. You can find the fund's prospectus and other information about the fund, including the statement of additional information and most recent reports to shareholders, online at www.dreyfus.com/vifunddocuments. You can also get this information at no cost by calling 1-800-DREYFUS (inside the U.S. only) or by sending an e-mail request to [email protected]. The fund's prospectus and statement of additional information, dated April 29, 2016 (each as revised or supplemented), are incorporated by reference into this summary prospectus.
Investment Objective The fund seeks long-term capital growth consistent with the preservation of capital. Its secondary goal is current income.
Fees and Expenses This table describes the fees and expenses that you may pay if you buy and hold shares of the fund. These figures do not reflect any fees or charges imposed by participating insurance companies under their Variable Annuity contracts (VA contracts) or Variable Life Insurance policies (VLI policies), and if such fees and/or charges were included, the fees and expenses would be higher. Annual Fund Operating Expenses (expenses that you pay each year as a percentage of the value of your investment)
Initial Shares Service Shares
Management fees .75 .75 Distribution and/or service (12b-1) fees none .25 Other expenses .05 .05 Total annual fund operating expenses .80 1.05
Example
The Example is intended to help you compare the cost of investing in the fund with the cost of investing in other mutual funds. The Example assumes that you invest $10,000 in the fund for the time periods indicated and then redeem all of your shares at the end of those periods. The Example also assumes that your investment has a 5% return each year and that the fund's operating expenses remain the same. The Example does not reflect fees and expenses incurred under VA contracts and VLI policies; if they were reflected, the figures in the Example would be higher. Although your actual costs may be higher or lower, based on these assumptions your costs would be:
1 Year 3 Years 5 Years 10 Years
Initial Shares $82 $255 $444 $990 Service Shares $107 $334 $579 $1,283
Portfolio Turnover
The fund pays transaction costs, such as commissions, when it buys and sells securities (or "turns over" its portfolio). A higher portfolio turnover may indicate higher transaction costs. These costs, which are not reflected in annual fund operating expenses or in the Example, affect the fund's performance. During the most recent fiscal year, the fund's portfolio turnover rate was 11.97% of the average value of its portfolio.
119
S-119
Appreciation Portfolio Summary 2
Principal Investment Strategy To pursue its goals, the fund normally invests at least 80% of its net assets, plus any borrowings for investment purposes, in common stocks. The fund focuses on "blue chip" companies with total market capitalizations of more than $5 billion at the time of purchase, including multinational companies. These are established companies that have demonstrated sustained patterns of profitability, strong balance sheets, an expanding global presence and the potential to achieve predictable, above-average earnings growth. Multinational companies may be subject to certain of the risks involved in investing in foreign securities.
In choosing stocks, the fund's portfolio managers first identify economic sectors they believe will expand over the next three to five years or longer. Using fundamental analysis, the fund's portfolio managers then seek companies within these sectors that have proven track records and dominant positions in their industries. The fund also may invest in companies which the portfolio managers consider undervalued in terms of earnings, assets or growth prospects.
The fund employs a "buy-and-hold" investment strategy, which generally has resulted in an annual portfolio turnover of below 15%. A low portfolio turnover rate, which helps reduce the fund's trading costs and minimizes tax liability by limiting the distribution of capital gains.
Principal Risks An investment in the fund is not a bank deposit. It is not insured or guaranteed by the Federal Deposit Insurance Corporation (FDIC) or any other government agency. It is not a complete investment program. The fund's share price fluctuates, sometimes dramatically, which means you could lose money.
� Risks of stock investing. Stocks generally fluctuate more in value than bonds and may decline significantly over short time periods. There is the chance that stock prices overall will decline because stock markets tend to move in cycles, with periods of rising prices and falling prices. The market value of a stock may decline due to general market conditions or because of factors that affect the particular company or the company's industry.
� Blue chip risk. By focusing on large capitalization, high quality stocks, the fund may underperform funds that invest in the stocks of lower quality, smaller capitalization companies during periods when the stocks of such companies are in favor.
� Market sector risk. The fund may significantly overweight or underweight certain companies, industries or market sectors, which may cause the fund's performance to be more or less sensitive to developments affecting those companies, industries or sectors.
� Foreign investment risk. To the extent the fund invests in foreign securities, the fund's performance will be influenced by political, social and economic factors affecting investments in foreign issuers. Special risks associated with investments in foreign issuers include exposure to currency fluctuations, less liquidity, less developed or less efficient trading markets, lack of comprehensive company information, political and economic instability and differing auditing and legal standards. Investments denominated in foreign currencies are subject to the risk that such currencies will decline in value relative to the U.S. dollar and affect the value of these investments held by the fund.
Performance The following bar chart and table provide some indication of the risks of investing in the fund. The bar chart shows changes in the performance of the fund's Initial shares from year to year. The table compares the average annual total returns of the fund's shares to those of a broad measure of market performance. The fund's past performance is not necessarily an indication of how the fund will perform in the future. More recent performance information may be available at www.dreyfus.com.
Performance information reflects the fund's expenses only and does not reflect the fees and charges imposed by participating insurance companies under their VA contracts or VLI policies. Because these fees and charges will reduce total return, policyowners should consider them when evaluating and comparing the fund's performance. Policyowners should consult the prospectus for their contract or policy for more information.
120
S-120
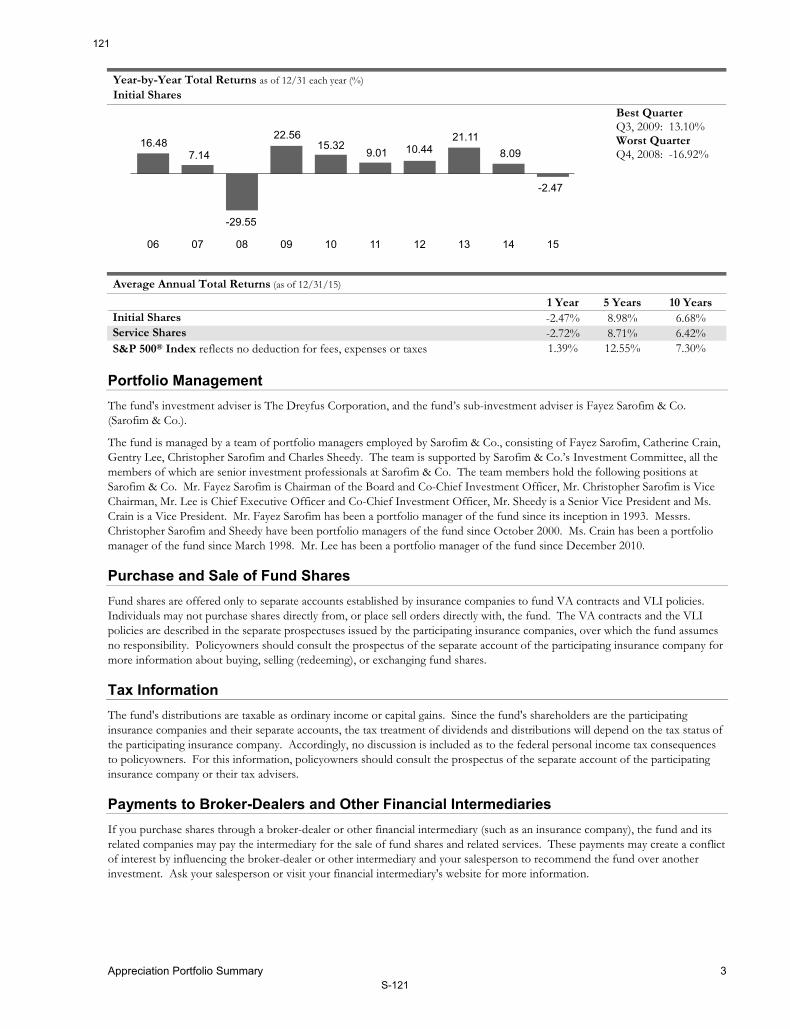
Appreciation Portfolio Summary 3
Year-by-Year Total Returns as of 12/31 each year (%) Initial Shares
15141312111009080706
10.4421.11
8.09
-2.47
16.487.14
-29.55
22.5615.32
9.01
Best Quarter Q3, 2009: 13.10% Worst Quarter Q4, 2008: -16.92%
Average Annual Total Returns (as of 12/31/15)
1 Year 5 Years 10 Years
Initial Shares -2.47% 8.98% 6.68% Service Shares -2.72% 8.71% 6.42% S&P 500® Index reflects no deduction for fees, expenses or taxes 1.39% 12.55% 7.30%
Portfolio Management The fund's investment adviser is The Dreyfus Corporation, and the fund’s sub-investment adviser is Fayez Sarofim & Co. (Sarofim & Co.).
The fund is managed by a team of portfolio managers employed by Sarofim & Co., consisting of Fayez Sarofim, Catherine Crain, Gentry Lee, Christopher Sarofim and Charles Sheedy. The team is supported by Sarofim & Co.’s Investment Committee, all the members of which are senior investment professionals at Sarofim & Co. The team members hold the following positions at Sarofim & Co. Mr. Fayez Sarofim is Chairman of the Board and Co-Chief Investment Officer, Mr. Christopher Sarofim is Vice Chairman, Mr. Lee is Chief Executive Officer and Co-Chief Investment Officer, Mr. Sheedy is a Senior Vice President and Ms. Crain is a Vice President. Mr. Fayez Sarofim has been a portfolio manager of the fund since its inception in 1993. Messrs. Christopher Sarofim and Sheedy have been portfolio managers of the fund since October 2000. Ms. Crain has been a portfolio manager of the fund since March 1998. Mr. Lee has been a portfolio manager of the fund since December 2010.
Purchase and Sale of Fund Shares Fund shares are offered only to separate accounts established by insurance companies to fund VA contracts and VLI policies. Individuals may not purchase shares directly from, or place sell orders directly with, the fund. The VA contracts and the VLI policies are described in the separate prospectuses issued by the participating insurance companies, over which the fund assumes no responsibility. Policyowners should consult the prospectus of the separate account of the participating insurance company for more information about buying, selling (redeeming), or exchanging fund shares.
Tax Information The fund's distributions are taxable as ordinary income or capital gains. Since the fund's shareholders are the participating insurance companies and their separate accounts, the tax treatment of dividends and distributions will depend on the tax status of the participating insurance company. Accordingly, no discussion is included as to the federal personal income tax consequences to policyowners. For this information, policyowners should consult the prospectus of the separate account of the participating insurance company or their tax advisers.
Payments to Broker-Dealers and Other Financial Intermediaries If you purchase shares through a broker-dealer or other financial intermediary (such as an insurance company), the fund and its related companies may pay the intermediary for the sale of fund shares and related services. These payments may create a conflict of interest by influencing the broker-dealer or other intermediary and your salesperson to recommend the fund over another investment. Ask your salesperson or visit your financial intermediary's website for more information.
121
S-121

Appreciation Portfolio Summary 4
This prospectus does not constitute an offer or solicitation in any state or jurisdiction in which, or to any person to whom, such offering or solicitation may not lawfully be made.
122
S-122

Fidelity® Variable Insurance Products
Initial Class, Service Class, and Service Class 2Contrafund® Portfolio
Summary ProspectusApril 28, 2016
Before you invest, you may want to review the fund’s prospectus, which contains more information about the fund and its risks. You can find the fund’s prospectus and other information about the fund (including the fund’s SAI) online at advisor.fidelity.com/vipfunddocuments. You can also get this information at no cost by calling 1-866-997-1254 or by sending an e-mail request to [email protected]. The fund’s prospectus and SAI dated April 28, 2016 are incorporated herein by reference.
245 Summer Street, Boston, MA 02210
123
S-123

2Summary Prospectus
Fund Summary
Fund/Class:VIP ContrafundSM Portfolio/Initial Class, Service Class, Service Class 2
Investment ObjectiveThe fund seeks long-term capital appreciation.
Fee TableThe following table describes the fees and expenses that may be incurred, directly or indirectly, when you, as a variable product
owner, buy and hold interests in a separate account that invests in shares of the fund. The table does not include any fees or other expenses of any variable annuity or variable life insurance product; if it did, overall fees and expenses would be higher.
Fees(fees paid directly from your investment) Not Applicable
Annual Operating Expenses(expenses that you pay each year as a % of the value of your investment)
Initial ClassService Class
Service Class 2
Management fee 0.55% 0.55% 0.55%
Distribution and/or Service (12b-1) fees None 0.10% 0.25%
Other expenses 0.08% 0.08% 0.08%
Total annual operating expenses 0.63% 0.73% 0.88%
This example helps compare the cost of investing in the fund with the cost of investing in other funds.
Let’s say, hypothetically, that the annual return for shares of the fund is 5% and that the fees and the annual operating expenses for shares of the fund are exactly as described in the fee table. This example illustrates the effect of fees and expenses, but is not meant
to suggest actual or expected fees and expenses or returns, all of which may vary. This example does not include any fees or other expenses of any variable annuity or variable life insurance product; if it did, overall expenses would be higher. For every $10,000 invested, here’s how much you, as a variable product owner, would pay in total expenses if all interests in a separate account that invests in shares of the fund were redeemed at the end of each time period indicated:
Initial Class Service Class Service Class 2
1 year $ 64 $ 75 $ 90
3 years $ 202 $ 233 $ 281
5 years $ 351 $ 406 $ 488
10 years $ 786 $ 906 $ 1,084
Portfolio TurnoverThe fund pays transaction costs, such as commissions, when it buys and sells securities (or “turns over” its portfolio). A higher portfolio turnover rate may indicate higher transaction costs. These costs, which are not reflected in annual operating expenses or in the example, affect the fund’s performance. During the most recent fiscal year, the fund’s portfolio turnover rate was 80% of the average value of its portfolio.
Principal Investment Strategies• Normally investing primarily in common stocks.
• Investing in securities of companies whose value Fidelity Management & Research Company (FMR) believes is not fully recognized by the public.
• Investing in domestic and foreign issuers.
• Allocating the fund’s assets across different market sectors (at present, consumer discretionary, consumer staples, energy, finan-cials, health care, industrials, information technology, materials, telecom services, and utilities), using different Fidelity managers.
• Investing in either “growth” stocks or “value” stocks or both.
• Using fundamental analysis of factors such as each issuer’s finan-cial condition and industry position, as well as market and economic conditions, to select investments.
Principal Investment Risks• Stock Market Volatility. Stock markets are volatile and can decline significantly in response to adverse issuer, political, regula-tory, market, or economic developments. Different parts of the market, including different market sectors, and different types of securities can react differently to these developments.
124
S-124
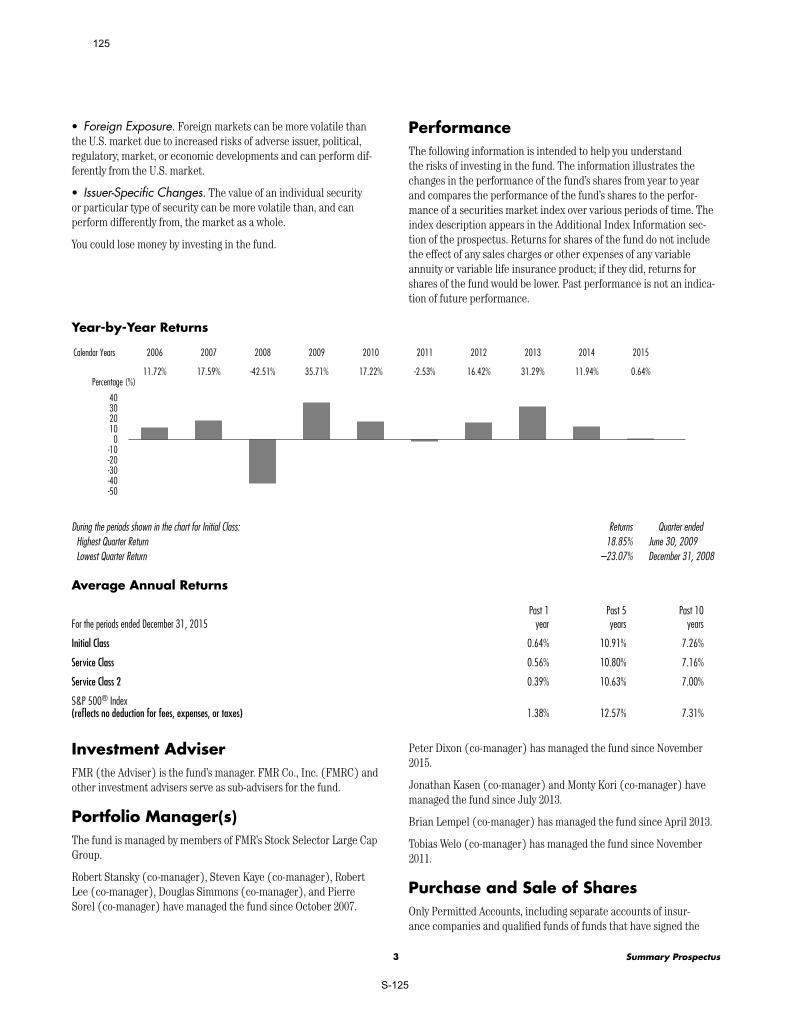
3 Summary Prospectus
• Foreign Exposure. Foreign markets can be more volatile than the U.S. market due to increased risks of adverse issuer, political, regulatory, market, or economic developments and can perform dif-ferently from the U.S. market.
• Issuer-Specific Changes. The value of an individual security or particular type of security can be more volatile than, and can perform differently from, the market as a whole.
You could lose money by investing in the fund.
PerformanceThe following information is intended to help you understand the risks of investing in the fund. The information illustrates the changes in the performance of the fund’s shares from year to year and compares the performance of the fund’s shares to the perfor-mance of a securities market index over various periods of time. The index description appears in the Additional Index Information sec-tion of the prospectus. Returns for shares of the fund do not include the effect of any sales charges or other expenses of any variable annuity or variable life insurance product; if they did, returns for shares of the fund would be lower. Past performance is not an indica-tion of future performance.
Year-by-Year Returns
40302010
0-10-20-30-40-50
2015201420132012201120102009200820072006
0.64%11.94%31.29%16.42%-2.53%17.22%35.71%-42.51%17.59%11.72%
Calendar Years
Percentage (%)
During the periods shown in the chart for Initial Class: Returns Quarter endedHighest Quarter Return 18.85% June 30, 2009Lowest Quarter Return –23.07% December 31, 2008
Average Annual Returns
For the periods ended December 31, 2015Past 1
yearPast 5 years
Past 10 years
Initial Class 0.64% 10.91% 7.26%
Service Class 0.56% 10.80% 7.16%
Service Class 2 0.39% 10.63% 7.00%
S&P 500® Index (reflects no deduction for fees, expenses, or taxes) 1.38% 12.57% 7.31%
Investment AdviserFMR (the Adviser) is the fund’s manager. FMR Co., Inc. (FMRC) and other investment advisers serve as sub-advisers for the fund.
Portfolio Manager(s)The fund is managed by members of FMR’s Stock Selector Large Cap Group.
Robert Stansky (co-manager), Steven Kaye (co-manager), Robert Lee (co-manager), Douglas Simmons (co-manager), and Pierre Sorel (co-manager) have managed the fund since October 2007.
Peter Dixon (co-manager) has managed the fund since November 2015.
Jonathan Kasen (co-manager) and Monty Kori (co-manager) have managed the fund since July 2013.
Brian Lempel (co-manager) has managed the fund since April 2013.
Tobias Welo (co-manager) has managed the fund since November 2011.
Purchase and Sale of SharesOnly Permitted Accounts, including separate accounts of insur-ance companies and qualified funds of funds that have signed the
125
S-125
4Summary Prospectus
Fund Summary – continued
appropriate agreements with the fund, if applicable, can buy or sell shares. Insurance companies offer variable annuity and variable life insurance products through separate accounts. A qualified fund of funds is an eligible insurance-dedicated mutual fund that invests in other mutual funds.
Permitted Accounts - not variable product owners - are the share-holders of the fund. Variable product owners hold interests in separate accounts, including separate accounts that are sharehold-ers of qualified funds of funds. The terms of the offering of interests in separate accounts are included in the variable annuity or variable life insurance product prospectus.
The price to buy one share is its net asset value per share (NAV). Shares will be bought at the NAV next calculated after an order is received in proper form.
The price to sell one share is its NAV. Shares will be sold at the NAV next calculated after an order is received in proper form.
The fund is open for business each day the New York Stock Exchange (NYSE) is open.
The fund has no minimum investment requirement.
Tax InformationVariable product owners seeking to understand the tax conse-quences of their investment should consult with their tax advisers or the insurance company that issued their variable product, or refer to their variable annuity or variable life insurance product prospectus. Insurance company separate accounts generally do not pay tax on dividends or capital gain distributions from the fund.
Payments to Broker-Dealers and Other Financial IntermediariesThe fund, the Adviser, Fidelity Distributors Corporation (FDC), and/or their affiliates may pay intermediaries, which may include insur-ance companies and their affiliated broker-dealers and service-pro-viders (who may be affiliated with the Adviser or FDC), for the sale of fund shares and related services. These payments may create a conflict of interest by influencing your intermediary and your invest-ment professional to recommend the fund over another investment. Ask your investment professional or visit your intermediary’s web site for more information.
126
S-126
FDC is a member of the Securities Investor Protection Corporation (SIPC). You may obtain information about SIPC, including the SIPC brochure, by visiting www.sipc.org or calling SIPC at 202-371-8300.
Fidelity, Contrafund, and Fidelity Investments & Pyramid Design are registered service marks of FMR LLC. © 2016 FMR LLC. All rights reserved.
VIP Contrafund is a service mark of FMR LLC.
Any third-party marks that may appear above are the marks of their respective owners.
The term “VIP” as used in this document refers to Fidelity® Variable Insurance Products.
1.907822.111 VCON-SUM-0416
127
S-127
Fidelity® Variable Insurance Products
Initial Class, Service Class, and Service Class 2Equity-Income Portfolio
Summary ProspectusApril 28, 2016
Before you invest, you may want to review the fund’s prospectus, which contains more information about the fund and its risks. You can find the fund’s prospectus and other information about the fund (including the fund’s SAI) online at advisor.fidelity.com/vipfunddocuments. You can also get this information at no cost by calling 1-866-997-1254 or by sending an e-mail request to [email protected]. The fund’s prospectus and SAI dated April 28, 2016 are incorporated herein by reference.
245 Summer Street, Boston, MA 02210
128
S-128

2Summary Prospectus
Fund Summary
Fund/Class:VIP Equity-Income PortfolioSM/Initial Class, Service Class, Service Class 2
Investment ObjectiveThe fund seeks reasonable income. The fund will also consider the potential for capital appreciation. The fund’s goal is to achieve a yield which exceeds the composite yield on the securities comprising the S&P 500® Index.
Fee TableThe following table describes the fees and expenses that may be incurred, directly or indirectly, when you, as a variable product owner, buy and hold interests in a separate account that invests in shares of the fund. The table does not include any fees or other expenses of any variable annuity or variable life insurance product; if it did, overall fees and expenses would be higher.
Fees(fees paid directly from your investment) Not Applicable
Annual Operating Expenses(expenses that you pay each year as a % of the value of your investment)
Initial ClassService Class
Service Class 2
Management fee 0.45% 0.45% 0.45%
Distribution and/or Service (12b-1) fees None 0.10% 0.25%
Other expenses 0.09% 0.09% 0.09%
Acquired fund fees and expenses 0.08% 0.08% 0.08%
Total annual operating expenses 0.62%(a) 0.72%(a) 0.87%(a)
(a) Differs from the ratios of expenses to average net assets in the Financial Highlights section of the prospectus because of acquired fund fees and expenses.
This example helps compare the cost of investing in the fund with the cost of investing in other funds.
Let’s say, hypothetically, that the annual return for shares of the fund is 5% and that the fees and the annual operating expenses for shares of the fund are exactly as described in the fee table. This example illustrates the effect of fees and expenses, but is not meant
to suggest actual or expected fees and expenses or returns, all of which may vary. This example does not include any fees or other expenses of any variable annuity or variable life insurance product; if it did, overall expenses would be higher. For every $10,000 invested, here’s how much you, as a variable product owner, would pay in total expenses if all interests in a separate account that invests in shares of the fund were redeemed at the end of each time period indicated:
Initial Class Service Class Service Class 2
1 year $ 63 $ 74 $ 89
3 years $ 199 $ 230 $ 278
5 years $ 346 $ 401 $ 482
10 years $ 774 $ 894 $ 1,073
Portfolio TurnoverThe fund pays transaction costs, such as commissions, when it buys and sells securities (or “turns over” its portfolio). A higher portfolio turnover rate may indicate higher transaction costs. These costs, which are not reflected in annual operating expenses or in the example, affect the fund’s performance. During the most recent fiscal year, the fund’s portfolio turnover rate was 46% of the average value of its portfolio.
Principal Investment Strategies• Normally investing at least 80% of assets in equity securities.
• Normally investing primarily in income-producing equity securi-ties, which tends to lead to investments in large cap “value” stocks.
• Potentially investing in other types of equity securities and debt securities, including lower-quality debt securities (those of less than investment-grade quality, also referred to as high yield debt securi-ties or junk bonds).
• Investing in domestic and foreign issuers.
• Using fundamental analysis of factors such as each issuer’s finan-cial condition and industry position, as well as market and economic conditions, to select investments.
129
S-129

3 Summary Prospectus
• Potentially using covered call options as tools in managing the fund’s assets.
Principal Investment Risks• Stock Market Volatility. Stock markets are volatile and can decline significantly in response to adverse issuer, political, regula-tory, market, or economic developments. Different parts of the market, including different market sectors, and different types of securities can react differently to these developments.
• Interest Rate Changes. Interest rate increases can cause the price of a debt security to decrease.
• Foreign Exposure. Foreign markets can be more volatile than the U.S. market due to increased risks of adverse issuer, political, regulatory, market, or economic developments and can perform dif-ferently from the U.S. market.
• Issuer-Specific Changes. The value of an individual security or particular type of security can be more volatile than, and can perform differently from, the market as a whole. Lower-quality debt securities (those of less than investment-grade quality, also referred to as high yield debt securities or junk bonds) and certain types of other securities involve greater risk of default or price changes due
to changes in the credit quality of the issuer. The value of lower-quality debt securities and certain types of other securities can be more volatile due to increased sensitivity to adverse issuer, political, regulatory, market, or economic developments.
• “Value” Investing. “Value” stocks can perform differently from the market as a whole and other types of stocks and can continue to be undervalued by the market for long periods of time.
You could lose money by investing in the fund.
PerformanceThe following information is intended to help you understand the risks of investing in the fund. The information illustrates the changes in the performance of the fund’s shares from year to year and compares the performance of the fund’s shares to the perfor-mance of a securities market index over various periods of time. The index description appears in the Additional Index Information sec-tion of the prospectus. Returns for shares of the fund do not include the effect of any sales charges or other expenses of any variable annuity or variable life insurance product; if they did, returns for shares of the fund would be lower. Past performance is not an indica-tion of future performance.
Year-by-Year Returns
40302010
0-10-20-30-40-50
2015201420132012201120102009200820072006
-4.08%8.85%28.15%17.31%0.97%15.15%30.21%-42.65%1.53%20.19%
Calendar Years
Percentage (%)
During the periods shown in the chart for Initial Class: Returns Quarter endedHighest Quarter Return 20.75% June 30, 2009Lowest Quarter Return –24.36% December 31, 2008
Average Annual Returns
For the periods ended December 31, 2015Past 1
yearPast 5 years
Past 10 years
Initial Class –4.08% 9.65% 5.22%
Service Class –4.17% 9.53% 5.11%
Service Class 2 –4.32% 9.36% 4.96%
Russell 3000® Value Index (reflects no deduction for fees, expenses, or taxes) –4.13% 10.98% 6.11%
130
S-130

4Summary Prospectus
Fund Summary – continued
Investment AdviserFidelity Management & Research Company (FMR) (the Adviser) is the fund’s manager. FMR Co., Inc. (FMRC) and other investment advisers serve as sub-advisers for the fund.
Portfolio Manager(s)James Morrow (lead portfolio manager) and Adam Kramer (co-manager) have managed the fund since April 2011.
Purchase and Sale of SharesOnly Permitted Accounts, including separate accounts of insur-ance companies and qualified funds of funds that have signed the appropriate agreements with the fund, if applicable, can buy or sell shares. Insurance companies offer variable annuity and variable life insurance products through separate accounts. A qualified fund of funds is an eligible insurance-dedicated mutual fund that invests in other mutual funds.
Permitted Accounts - not variable product owners - are the share-holders of the fund. Variable product owners hold interests in separate accounts, including separate accounts that are sharehold-ers of qualified funds of funds. The terms of the offering of interests in separate accounts are included in the variable annuity or variable life insurance product prospectus.
The price to buy one share is its net asset value per share (NAV). Shares will be bought at the NAV next calculated after an order is received in proper form.
The price to sell one share is its NAV. Shares will be sold at the NAV next calculated after an order is received in proper form.
The fund is open for business each day the New York Stock Exchange (NYSE) is open.
The fund has no minimum investment requirement.
Tax InformationVariable product owners seeking to understand the tax conse-quences of their investment should consult with their tax advisers or the insurance company that issued their variable product, or refer to their variable annuity or variable life insurance product prospectus. Insurance company separate accounts generally do not pay tax on dividends or capital gain distributions from the fund.
Payments to Broker-Dealers and Other Financial IntermediariesThe fund, the Adviser, Fidelity Distributors Corporation (FDC), and/or their affiliates may pay intermediaries, which may include insur-ance companies and their affiliated broker-dealers and service-pro-viders (who may be affiliated with the Adviser or FDC), for the sale of fund shares and related services. These payments may create a conflict of interest by influencing your intermediary and your invest-ment professional to recommend the fund over another investment.
Ask your investment professional or visit your intermediary’s web site for more information.
131
S-131

FDC is a member of the Securities Investor Protection Corporation (SIPC). You may obtain information about SIPC, including the SIPC brochure, by visiting www.sipc.org or calling SIPC at 202-371-8300.
Fidelity and Fidelity Investments & Pyramid Design are registered service marks of FMR LLC. © 2016 FMR LLC. All rights reserved.
Any third-party marks that may appear above are the marks of their respective owners.
The term “VIP” as used in this document refers to Fidelity® Variable Insurance Products.
1.907801.109 VIPEI-SUM-0416
132
S-132

Fidelity® Variable Insurance Products
Before you invest, you may want to review the fund’s prospectus, which contains more information about the fund and its risks. You can find the fund’s prospectus and other information about the fund (including the fund’s SAI) online at advisor.fidelity.com/vipfunddocuments. You can also get this information at no cost by calling 1-866-997-1254 or by sending an e-mail request to [email protected]. The fund’s prospectus and SAI dated April 28, 2016 are incorporated herein by reference.
245 Summer Street, Boston, MA 02210
Initial Class, Service Class, and Service Class 2Government Money Market Portfolio(formerly Money Market Portfolio)
Summary ProspectusApril 28, 2016
133
S-133

2Summary Prospectus
Fund Summary
Fund/Class:VIP Government Money Market Portfolio/Initial Class, Service Class, Service Class 2
Investment ObjectiveThe fund seeks as high a level of current income as is consistent with preservation of capital and liquidity.
Fee TableThe following table describes the fees and expenses that may be incurred, directly or indirectly, when you, as a variable product owner, buy and hold interests in a separate account that invests in shares of the fund. The table does not include any fees or other expenses of any variable annuity or variable life insurance product; if it did, overall fees and expenses would be higher.
Fees(fees paid directly from your investment) Not Applicable
Annual Operating Expenses(expenses that you pay each year as a % of the value of your investment)
Initial ClassService Class
Service Class 2
Management fee 0.17% 0.17% 0.17%
Distribution and/or Service (12b-1) fees None 0.10% 0.25%
Other expenses 0.08% 0.08% 0.08%
Total annual operating expenses 0.25% 0.35% 0.50%
This example helps compare the cost of investing in the fund with the cost of investing in other funds.
Let’s say, hypothetically, that the annual return for shares of the fund is 5% and that the fees and the annual operating expenses for shares of the fund are exactly as described in the fee table. This example illustrates the effect of fees and expenses, but is not meant
to suggest actual or expected fees and expenses or returns, all of which may vary. This example does not include any fees or other expenses of any variable annuity or variable life insurance product; if it did, overall expenses would be higher. For every $10,000 invested, here’s how much you, as a variable product owner, would pay in total expenses if all interests in a separate account that invests in shares of the fund were redeemed at the end of each time period indicated:
Initial Class Service Class Service Class 2
1 year $ 26 $ 36 $ 51
3 years $ 80 $ 113 $ 160
5 years $ 141 $ 197 $ 280
10 years $ 318 $ 443 $ 628
Principal Investment Strategies• Normally investing at least 99.5% of total assets in cash, U.S. Government securities and/or repurchase agreements that are collateralized fully (i.e., collateralized by cash or government securities).
• Investing in U.S. Government securities issued by entities that are chartered or sponsored by Congress but whose securities are neither issued nor guaranteed by the U.S. Treasury.
• Investing in compliance with industry-standard regulatory requirements for money market funds for the quality, maturity, liquidity, and diversification of investments. In addition, the fund normally invests at least 80% of its assets in
U.S. Government securities and repurchase agreements for those securities.
Principal Investment Risks• Interest Rate Changes. Interest rate increases can cause the price of a money market security to decrease.
• Issuer-Specific Changes. A decline in the credit quality of an issuer or a provider of credit support or a maturity-shortening struc-ture for a security can cause the price of a money market security to decrease.
You could lose money by investing in the fund. Although the fund seeks to preserve the value of your investment at $1.00 per share, it cannot guarantee it will do so. An investment in the fund is not insured or guaranteed by the Federal Deposit Insurance Corporation
134
S-134
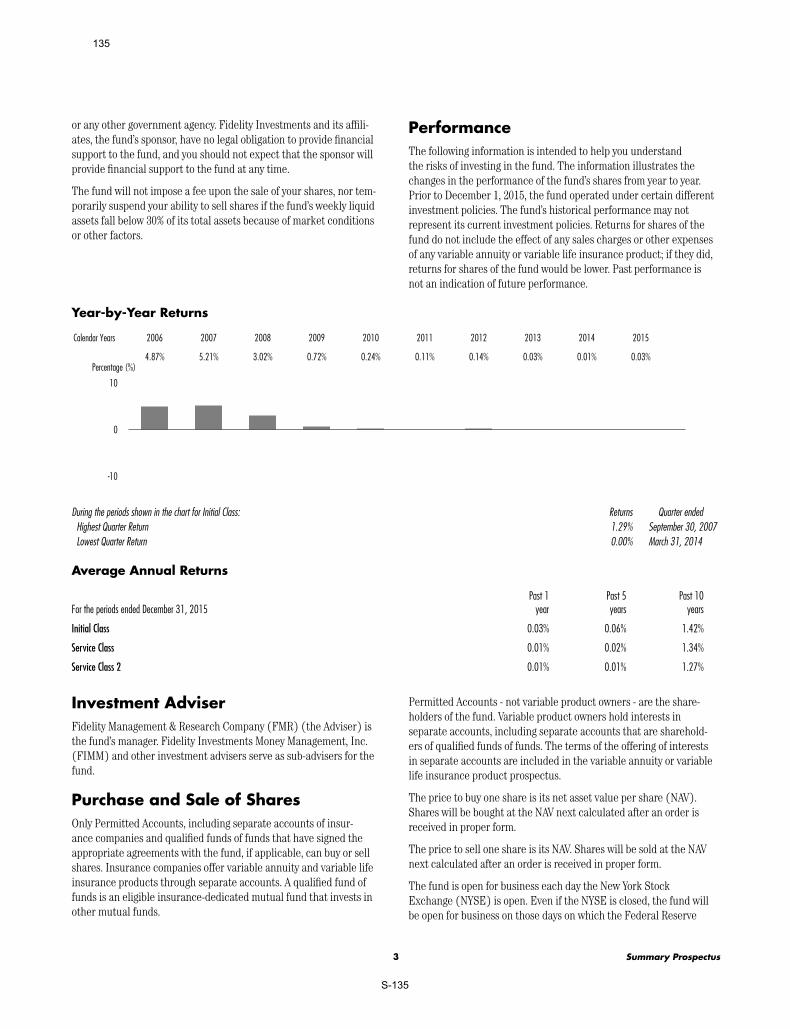
3 Summary Prospectus
or any other government agency. Fidelity Investments and its affili-ates, the fund’s sponsor, have no legal obligation to provide financial support to the fund, and you should not expect that the sponsor will provide financial support to the fund at any time.
The fund will not impose a fee upon the sale of your shares, nor tem-porarily suspend your ability to sell shares if the fund’s weekly liquid assets fall below 30% of its total assets because of market conditions or other factors.
PerformanceThe following information is intended to help you understand the risks of investing in the fund. The information illustrates the changes in the performance of the fund’s shares from year to year. Prior to December 1, 2015, the fund operated under certain different investment policies. The fund’s historical performance may not represent its current investment policies. Returns for shares of the fund do not include the effect of any sales charges or other expenses of any variable annuity or variable life insurance product; if they did, returns for shares of the fund would be lower. Past performance is not an indication of future performance.
Year-by-Year Returns
10
0
-10
2015201420132012201120102009200820072006
0.03%0.01%0.03%0.14%0.11%0.24%0.72%3.02%5.21%4.87%
Calendar Years
Percentage (%)
During the periods shown in the chart for Initial Class: Returns Quarter endedHighest Quarter Return 1.29% September 30, 2007Lowest Quarter Return 0.00% March 31, 2014
Average Annual Returns
For the periods ended December 31, 2015Past 1
yearPast 5 years
Past 10 years
Initial Class 0.03% 0.06% 1.42%
Service Class 0.01% 0.02% 1.34%
Service Class 2 0.01% 0.01% 1.27%
Investment AdviserFidelity Management & Research Company (FMR) (the Adviser) is the fund’s manager. Fidelity Investments Money Management, Inc. (FIMM) and other investment advisers serve as sub-advisers for the fund.
Purchase and Sale of SharesOnly Permitted Accounts, including separate accounts of insur-ance companies and qualified funds of funds that have signed the appropriate agreements with the fund, if applicable, can buy or sell shares. Insurance companies offer variable annuity and variable life insurance products through separate accounts. A qualified fund of funds is an eligible insurance-dedicated mutual fund that invests in other mutual funds.
Permitted Accounts - not variable product owners - are the share-holders of the fund. Variable product owners hold interests in separate accounts, including separate accounts that are sharehold-ers of qualified funds of funds. The terms of the offering of interests in separate accounts are included in the variable annuity or variable life insurance product prospectus.
The price to buy one share is its net asset value per share (NAV). Shares will be bought at the NAV next calculated after an order is received in proper form.
The price to sell one share is its NAV. Shares will be sold at the NAV next calculated after an order is received in proper form.
The fund is open for business each day the New York Stock Exchange (NYSE) is open. Even if the NYSE is closed, the fund will be open for business on those days on which the Federal Reserve
135
S-135

4Summary Prospectus
Fund Summary – continued
Bank of New York (New York Fed) is open, the primary trading markets for the fund’s portfolio instruments are open, and the fund’s management believes there is an adequate market to meet purchase and redemption requests.
The fund has no minimum investment requirement.
Tax InformationVariable product owners seeking to understand the tax conse-quences of their investment should consult with their tax advisers or the insurance company that issued their variable product, or refer to their variable annuity or variable life insurance product prospectus. Insurance company separate accounts generally do not pay tax on dividends or capital gain distributions from the fund.
Payments to Broker-Dealers and Other Financial IntermediariesThe fund, the Adviser, Fidelity Distributors Corporation (FDC), and/or their affiliates may pay intermediaries, which may include insur-ance companies and their affiliated broker-dealers and service-pro-viders (who may be affiliated with the Adviser or FDC), for the sale of fund shares and related services. These payments may create a conflict of interest by influencing your intermediary and your invest-ment professional to recommend the fund over another investment. Ask your investment professional or visit your intermediary’s web site for more information.
136
S-136

FDC is a member of the Securities Investor Protection Corporation (SIPC). You may obtain information about SIPC, including the SIPC brochure, by visiting www.sipc.org or calling SIPC at 202-371-8300.
Fidelity and Fidelity Investments & Pyramid Design are registered service marks of FMR LLC. © 2016 FMR LLC. All rights reserved.
Any third-party marks that may appear above are the marks of their respective owners.
The term “VIP” as used in this document refers to Fidelity® Variable Insurance Products.
1.907893.113 VMM-SUM-0416
137
S-137

Fidelity® Variable Insurance Products
Initial Class, Service Class, and Service Class 2High Income Portfolio
Summary ProspectusApril 28, 2016
Before you invest, you may want to review the fund’s prospectus, which contains more information about the fund and its risks. You can find the fund’s prospectus and other information about the fund (including the fund’s SAI) online at advisor.fidelity.com/vipfunddocuments. You can also get this information at no cost by calling 1-866-997-1254 or by sending an e-mail request to [email protected]. The fund’s prospectus and SAI dated April 28, 2016 are incorporated herein by reference.
245 Summer Street, Boston, MA 02210
138
S-138

2Summary Prospectus
Fund Summary
Fund/Class:VIP High Income Portfolio/Initial Class, Service Class, Service Class 2
Investment ObjectiveThe fund seeks a high level of current income, while also considering growth of capital.
Fee TableThe following table describes the fees and expenses that may be incurred, directly or indirectly, when you, as a variable product owner, buy and hold interests in a separate account that invests in shares of the fund. The table does not include any fees or other expenses of any variable annuity or variable life insurance product; if it did, overall fees and expenses would be higher.
Fees(fees paid directly from your investment) Not Applicable
Annual Operating Expenses(expenses that you pay each year as a % of the value of your investment)
Initial ClassService Class
Service Class 2
Management fee 0.56% 0.56% 0.56%
Distribution and/or Service (12b-1) fees None 0.10% 0.25%
Other expenses 0.12% 0.12% 0.12%
Total annual operating expenses 0.68% 0.78% 0.93%
This example helps compare the cost of investing in the fund with the cost of investing in other funds.
Let’s say, hypothetically, that the annual return for shares of the fund is 5% and that the fees and the annual operating expenses for shares of the fund are exactly as described in the fee table. This example illustrates the effect of fees and expenses, but is not meant
to suggest actual or expected fees and expenses or returns, all of which may vary. This example does not include any fees or other expenses of any variable annuity or variable life insurance product; if it did, overall expenses would be higher. For every $10,000 invested, here’s how much you, as a variable product owner, would pay in total expenses if all interests in a separate account that invests in shares of the fund were redeemed at the end of each time period indicated:
Initial Class Service Class Service Class 2
1 year $ 69 $ 80 $ 95
3 years $ 218 $ 249 $ 296
5 years $ 379 $ 433 $ 515
10 years $ 847 $ 966 $ 1,143
Portfolio TurnoverThe fund pays transaction costs, such as commissions, when it buys and sells securities (or “turns over” its portfolio). A higher portfolio turnover rate may indicate higher transaction costs. These costs, which are not reflected in annual operating expenses or in the example, affect the fund’s performance. During the most recent fiscal year, the fund’s portfolio turnover rate was 69% of the average value of its portfolio.
Principal Investment Strategies• Normally investing primarily in income-producing debt securities, preferred stocks, and convertible securities, with an emphasis on lower-quality debt securities (those of less than investment-grade quality, also referred to as high yield debt securities or junk bonds).
• Potentially investing in non-income producing securities, includ-ing defaulted securities and common stocks.
• Investing in companies in troubled or uncertain financial condition.
• Investing in domestic and foreign issuers.
• Using fundamental analysis of each issuer’s financial condition and industry position and market and economic conditions to select investments.
Principal Investment Risks• Stock Market Volatility. Stock markets are volatile and can decline significantly in response to adverse issuer, political, regula-tory, market, or economic developments. Different parts of the
139
S-139
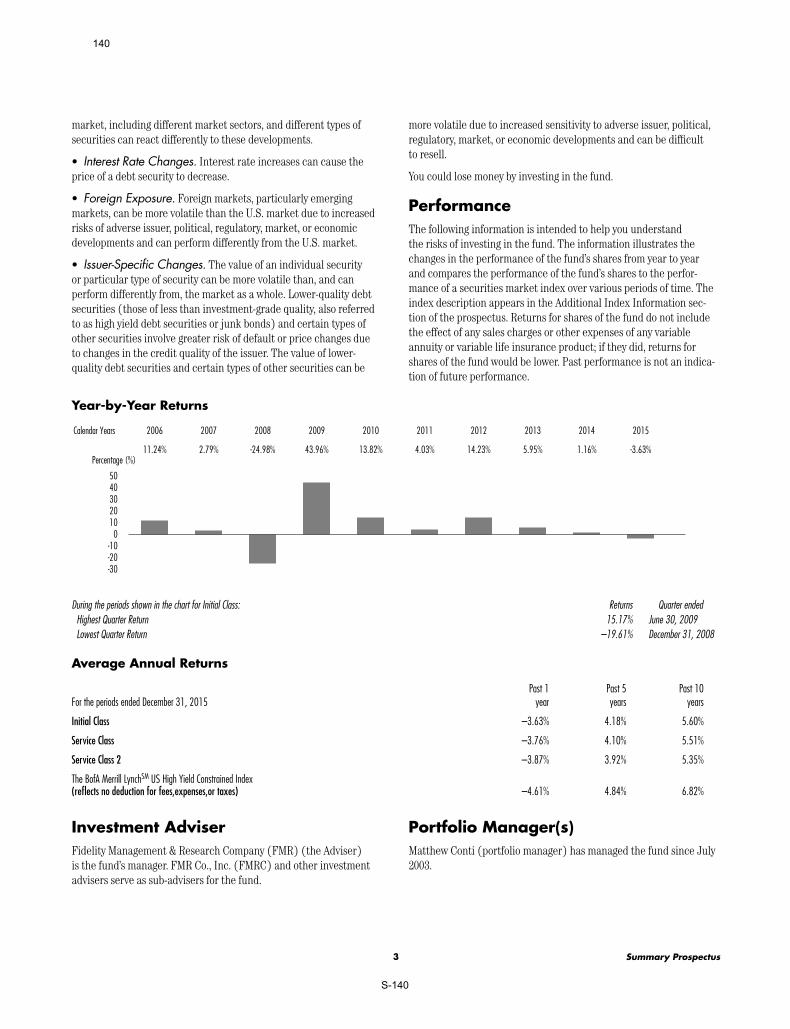
3 Summary Prospectus
market, including different market sectors, and different types of securities can react differently to these developments.
• Interest Rate Changes. Interest rate increases can cause the price of a debt security to decrease.
• Foreign Exposure. Foreign markets, particularly emerging markets, can be more volatile than the U.S. market due to increased risks of adverse issuer, political, regulatory, market, or economic developments and can perform differently from the U.S. market.
• Issuer-Specific Changes. The value of an individual security or particular type of security can be more volatile than, and can perform differently from, the market as a whole. Lower-quality debt securities (those of less than investment-grade quality, also referred to as high yield debt securities or junk bonds) and certain types of other securities involve greater risk of default or price changes due to changes in the credit quality of the issuer. The value of lower-quality debt securities and certain types of other securities can be
more volatile due to increased sensitivity to adverse issuer, political, regulatory, market, or economic developments and can be difficult to resell.
You could lose money by investing in the fund.
PerformanceThe following information is intended to help you understand the risks of investing in the fund. The information illustrates the changes in the performance of the fund’s shares from year to year and compares the performance of the fund’s shares to the perfor-mance of a securities market index over various periods of time. The index description appears in the Additional Index Information sec-tion of the prospectus. Returns for shares of the fund do not include the effect of any sales charges or other expenses of any variable annuity or variable life insurance product; if they did, returns for shares of the fund would be lower. Past performance is not an indica-tion of future performance.
Year-by-Year Returns
5040302010
0-10-20-30
2015201420132012201120102009200820072006
-3.63%1.16%5.95%14.23%4.03%13.82%43.96%-24.98%2.79%11.24%
Calendar Years
Percentage (%)
During the periods shown in the chart for Initial Class: Returns Quarter endedHighest Quarter Return 15.17% June 30, 2009Lowest Quarter Return –19.61% December 31, 2008
Average Annual Returns
For the periods ended December 31, 2015Past 1
yearPast 5 years
Past 10 years
Initial Class –3.63% 4.18% 5.60%
Service Class –3.76% 4.10% 5.51%
Service Class 2 –3.87% 3.92% 5.35%
The BofA Merrill LynchSM US High Yield Constrained Index (reflects no deduction for fees,expenses,or taxes) –4.61% 4.84% 6.82%
Investment AdviserFidelity Management & Research Company (FMR) (the Adviser) is the fund’s manager. FMR Co., Inc. (FMRC) and other investment advisers serve as sub-advisers for the fund.
Portfolio Manager(s)Matthew Conti (portfolio manager) has managed the fund since July 2003.
140
S-140
4Summary Prospectus
Fund Summary – continued
Purchase and Sale of SharesOnly Permitted Accounts, including separate accounts of insur-ance companies and qualified funds of funds that have signed the appropriate agreements with the fund, if applicable, can buy or sell shares. Insurance companies offer variable annuity and variable life insurance products through separate accounts. A qualified fund of funds is an eligible insurance-dedicated mutual fund that invests in other mutual funds.
Permitted Accounts - not variable product owners - are the share-holders of the fund. Variable product owners hold interests in separate accounts, including separate accounts that are sharehold-ers of qualified funds of funds. The terms of the offering of interests in separate accounts are included in the variable annuity or variable life insurance product prospectus.
The price to buy one share is its net asset value per share (NAV). Shares will be bought at the NAV next calculated after an order is received in proper form.
The price to sell one share is its NAV. Shares will be sold at the NAV next calculated after an order is received in proper form.
The fund is open for business each day the New York Stock Exchange (NYSE) is open.
The fund has no minimum investment requirement.
Tax InformationVariable product owners seeking to understand the tax conse-quences of their investment should consult with their tax advisers or the insurance company that issued their variable product, or refer to their variable annuity or variable life insurance product prospectus. Insurance company separate accounts generally do not pay tax on dividends or capital gain distributions from the fund.
Payments to Broker-Dealers and Other Financial IntermediariesThe fund, the Adviser, Fidelity Distributors Corporation (FDC), and/or their affiliates may pay intermediaries, which may include insur-ance companies and their affiliated broker-dealers and service-pro-viders (who may be affiliated with the Adviser or FDC), for the sale of fund shares and related services. These payments may create a conflict of interest by influencing your intermediary and your invest-ment professional to recommend the fund over another investment. Ask your investment professional or visit your intermediary’s web site for more information.
141
S-141

FDC is a member of the Securities Investor Protection Corporation (SIPC). You may obtain information about SIPC, including the SIPC brochure, by visiting www.sipc.org or calling SIPC at 202-371-8300.
Fidelity and Fidelity Investments & Pyramid Design are registered service marks of FMR LLC. © 2016 FMR LLC. All rights reserved.
Any third-party marks that may appear above are the marks of their respective owners.
The term “VIP” as used in this document refers to Fidelity® Variable Insurance Products.
1.907810.107 VHI-SUM-0416
142
S-142

Fidelity® Variable Insurance Products
Initial Class, Service Class, and Service Class 2Mid Cap Portfolio
Summary ProspectusApril 28, 2016
Before you invest, you may want to review the fund’s prospectus, which contains more information about the fund and its risks. You can find the fund’s prospectus and other information about the fund (including the fund’s SAI) online at advisor.fidelity.com/vipfunddocuments. You can also get this information at no cost by calling 1-866-997-1254 or by sending an e-mail request to [email protected]. The fund’s prospectus and SAI dated April 28, 2016, are incorporated herein by reference.
245 Summer Street, Boston, MA 02210
143
S-143

2Summary Prospectus
Fund Summary
Fund/Class:VIP Mid Cap Portfolio/Initial Class, Service Class, Service Class 2
Investment ObjectiveThe fund seeks long-term growth of capital.
Fee TableThe following table describes the fees and expenses that may be incurred, directly or indirectly, when you, as a variable product
owner, buy and hold interests in a separate account that invests in shares of the fund. The table does not include any fees or other expenses of any variable annuity or variable life insurance product; if it did, overall fees and expenses would be higher.
Fees(fees paid directly from your investment) Not Applicable
Annual Operating Expenses(expenses that you pay each year as a % of the value of your investment)
Initial ClassService Class
Service Class 2
Management fee 0.55% 0.55% 0.55%
Distribution and/or Service (12b-1) fees None 0.10% 0.25%
Other expenses 0.08% 0.08% 0.08%
Total annual operating expenses 0.63% 0.73% 0.88%
This example helps compare the cost of investing in the fund with the cost of investing in other funds.
Let’s say, hypothetically, that the annual return for shares of the fund is 5% and that the fees and the annual operating expenses for shares of the fund are exactly as described in the fee table. This example illustrates the effect of fees and expenses, but is not meant
to suggest actual or expected fees and expenses or returns, all of which may vary. This example does not include any fees or other expenses of any variable annuity or variable life insurance product; if it did, overall expenses would be higher. For every $10,000 invested, here’s how much you, as a variable product owner, would pay in total expenses if all interests in a separate account that invests in shares of the fund were redeemed at the end of each time period indicated:
Initial Class Service Class Service Class 2
1 year $ 64 $ 75 $ 90
3 years $ 202 $ 233 $ 281
5 years $ 351 $ 406 $ 488
10 years $ 786 $ 906 $ 1,084
Portfolio TurnoverThe fund pays transaction costs, such as commissions, when it buys and sells securities (or “turns over” its portfolio). A higher portfolio turnover rate may indicate higher transaction costs. These costs, which are not reflected in annual operating expenses or in the example, affect the fund’s performance. During the most recent fiscal year, the fund’s portfolio turnover rate was 26% of the average value of its portfolio.
Principal Investment Strategies• Normally investing primarily in common stocks.
• Normally investing at least 80% of assets in securities of compa-nies with medium market capitalizations (which, for purposes of this fund, are those companies with market capitalizations similar
to companies in the Russell Midcap® Index or the S&P MidCap 400® Index).
• Potentially investing in companies with smaller or larger market capitalizations.
• Investing in domestic and foreign issuers.
• Investing in either “growth” stocks or “value” stocks or both.
• Using fundamental analysis of factors such as each issuer’s finan-cial condition and industry position, as well as market and economic conditions, to select investments.
Principal Investment Risks• Stock Market Volatility. Stock markets are volatile and can decline significantly in response to adverse issuer, political, regula-tory, market, or economic developments. Different parts of the
144
S-144

3 Summary Prospectus
market, including different market sectors, and different types of securities can react differently to these developments.
• Foreign Exposure. Foreign markets can be more volatile than the U.S. market due to increased risks of adverse issuer, political, regulatory, market, or economic developments and can perform dif-ferently from the U.S. market.
• Issuer-Specific Changes. The value of an individual security or particular type of security can be more volatile than, and can per-form differently from, the market as a whole. The value of securities of smaller issuers can be more volatile than that of larger issuers.
• Mid Cap Investing. The value of securities of medium size, less well-known issuers can perform differently from the market as a whole and other types of stocks and can be more volatile than that of larger issuers.
You could lose money by investing in the fund.
PerformanceThe following information is intended to help you understand the risks of investing in the fund. The information illustrates the changes in the performance of the fund’s shares from year to year and compares the performance of the fund’s shares to the perfor-mance of a securities market index over various periods of time. The index description appears in the Additional Index Information sec-tion of the prospectus. Returns for shares of the fund do not include the effect of any sales charges or other expenses of any variable annuity or variable life insurance product; if they did, returns for shares of the fund would be lower. Past performance is not an indica-tion of future performance.
Year-by-Year Returns
5040302010
0-10-20-30-40
2015201420132012201120102009200820072006
-1.39%6.29%36.23%14.83%-10.61%28.83%40.09%-39.44%15.63%12.70%
Calendar Years
Percentage (%)
During the periods shown in the chart for Initial Class: Returns Quarter endedHighest Quarter Return 19.29% June 30, 2009Lowest Quarter Return –23.63% December 31, 2008
Average Annual Returns
For the periods ended December 31, 2015Past 1
yearPast 5 years
Past 10 years
Initial Class –1.39% 7.94% 7.64%
Service Class –1.50% 7.84% 7.53%
Service Class 2 –1.63% 7.68% 7.37%
S&P MidCap 400® Index (reflects no deduction for fees, expenses, or taxes) –2.18% 10.68% 8.18%
Investment AdviserFidelity Management & Research Company (FMR) (the Adviser) is the fund’s manager. FMR Co., Inc. (FMRC) and other investment advisers serve as sub-advisers for the fund.
Portfolio Manager(s)Tom Allen (portfolio manager) has managed the fund since June 2001.
Purchase and Sale of SharesOnly Permitted Accounts, including separate accounts of insur-ance companies and qualified funds of funds that have signed the appropriate agreements with the fund, if applicable, can buy or sell shares. Insurance companies offer variable annuity and variable life insurance products through separate accounts. A qualified fund of funds is an eligible insurance-dedicated mutual fund that invests in other mutual funds.
145
S-145
4Summary Prospectus
Fund Summary – continued
Permitted Accounts - not variable product owners - are the share-holders of the fund. Variable product owners hold interests in separate accounts, including separate accounts that are sharehold-ers of qualified funds of funds. The terms of the offering of interests in separate accounts are included in the variable annuity or variable life insurance product prospectus.
The price to buy one share is its net asset value per share (NAV). Shares will be bought at the NAV next calculated after an order is received in proper form.
The price to sell one share is its NAV. Shares will be sold at the NAV next calculated after an order is received in proper form.
The fund is open for business each day the New York Stock Exchange (NYSE) is open.
The fund has no minimum investment requirement.
Tax InformationVariable product owners seeking to understand the tax conse-quences of their investment should consult with their tax advisers or the insurance company that issued their variable product, or refer to their variable annuity or variable life insurance product prospectus. Insurance company separate accounts generally do not pay tax on dividends or capital gain distributions from the fund.
Payments to Broker-Dealers and Other Financial IntermediariesThe fund, the Adviser, Fidelity Distributors Corporation (FDC), and/or their affiliates may pay intermediaries, which may include insur-ance companies and their affiliated broker-dealers and service-pro-viders (who may be affiliated with the Adviser or FDC), for the sale of fund shares and related services. These payments may create a conflict of interest by influencing your intermediary and your invest-ment professional to recommend the fund over another investment. Ask your investment professional or visit your intermediary’s web site for more information.
146
S-146

FDC is a member of the Securities Investor Protection Corporation (SIPC). You may obtain information about SIPC, including the SIPC brochure, by visiting www.sipc.org or calling SIPC at 202-371-8300.
Fidelity and Fidelity Investments & Pyramid Design are a registered service marks of FMR LLC. © 2016 FMR LLC. All rights reserved.
Any third-party marks that may appear above are the marks of their respective owners.
The term “VIP” as used in this document refers to Fidelity® Variable Insurance Products.
1.907844.107 VMC-SUM-0416
147
S-147
MAY 1, 2016
Before you invest, you may want to review the Fund’s prospectus, which contains more information about the
Fund and its risks. You can find the Fund’s prospectus, statement of additional information and other information
about the Fund online at franklintempleton.com/ftviptfunds. You can also get this information at no cost by calling
1-888-FRANKLIN or by sending an e-mail request to [email protected]. The Fund’s
prospectus and statement of additional information, both dated May 1, 2016, as may be amended from time to
time, are incorporated by reference into this Summary prospectus, which means that they are legally a part of this
Summary prospectus. Shares of the insurance funds of Franklin Templeton Variable Insurance Products Trust are
not offered to the public; they are offered and sold only to: (1) insurance company separate accounts to serve as the
underlying investment vehicles for variable contracts; (2) certain qualified plans; and (3) other mutual funds (fund
of funds). This Summary prospectus is not intended for use by other investors. Please check with your insurance
company for availability. Please read this Summary prospectus together with your variable annuity or variable life
insurance product prospectus.
SUMMARY PROSPECTUSFRANKLIN TEMPLETON VARIABLE INSURANCE PRODUCTS TRUST | CLASS 2
Franklin Income VIP Fund
148
S-148

S U M M A RY P RO S P E C T U S
2 - Franklin Income VIP Fund - Class 2
Investment GoalTo maximize income while maintaining prospects for capital appreciation.
Fees and Expenses of the FundThis table describes the fees and expenses that you may pay if you buy and hold shares of the Fund. The table and the example do not include any fees or sales charges imposed by variable insurance contracts, qualified retirement plans or funds of funds. If they were included, your costs would be higher.
Annual Fund Operating Expenses(expenses that you pay each year as a percentage of the value of your investment)
Class 2
Management fees 0.45%
Distribution and service (12b-1) fees 0.25%
Other expenses 0.01%
Total annual Fund operating expenses 0.71%
ExampleThis Example is intended to help you compare the cost of investing in the Fund with the cost of investing in other mutual funds. The Example assumes that you invest $10,000 in the Fund for the time periods indicated and then redeem all of your shares at the end of the period. The Example also assumes that your investment has a 5% return each year and that the Fund’s operating expenses remain the same. The Example reflects adjustments made to the Fund’s operating expenses due to the fee waivers and/or expense reimbursements by management for the 1 Year numbers only. Although your actual costs may be higher or lower, based on these assumptions your costs would be:
1 Year 3 Years 5 Years 10 Years
Class 2 $73 $227 $395 $883
Portfolio TurnoverThe Fund pays transaction costs, such as commissions, when it buys and sells securities (or “turns over” its portfolio). A higher portfolio turnover rate may indicate higher transaction costs. These costs, which are not reflected in annual Fund
operating expenses or in the example, affect the Fund’s performance. During the most recent fiscal year, the Fund’s portfolio turnover rate was 31.53% of the average value of its portfolio.
Principal Investment StrategiesUnder normal market conditions, the Fund invests in a diversified portfolio of debt and equity securities. The Fund may shift its investments from one asset class to another based on the investment manager’s analysis of the best opportunities for the Fund’s portfolio in a given market. The equity securities in which the Fund invests consist primarily of common stocks. Debt securities include all varieties of fixed, floating and variable rate instruments, including secured and unsecured bonds, bonds convertible into common stock, senior floating rate and term loans, mortgage-backed securities and other asset-backed securities, debentures, and shorter term instruments. The Fund seeks income by selecting investments such as corporate, foreign and U.S. Treasury bonds, as well as stocks with dividend yields the investment manager believes are attractive. The Fund may invest up to 100% of its total assets in debt securities that are rated below investment grade (also known as “junk bonds”), including a portion in defaulted securities. The Fund maintains the flexibility to invest in securities of companies from a variety of sectors, but from time to time, based on economic conditions, the Fund may have significant investments in particular sectors. The Fund may also invest up to 25% of its assets in foreign securities, either directly or through depositary receipts.
The Fund may invest up to 15% of its net assets in equity-linked notes, which are hybrid derivative-type instruments that are specially designed to combine the characteristics of one or more reference securities (usually a single stock, a stock index or a basket of stocks (underlying securities)) and a related equity derivative, such as a put or call option, in a single note form.
The Fund’s investment manager searches for undervalued or out-of-favor securities it believes offer opportunities for income today and significant growth tomorrow. It generally performs independent analysis of the debt securities being considered for the Fund’s portfolio, rather than relying principally on the ratings
149
S-149

S U M M A RY P RO S P E C T U S
3 - Franklin Income VIP Fund - Class 2
assigned by rating organizations. In analyzing both debt and equity securities, the investment manager considers a variety of factors, including:
a security’s relative value based on such factors as anticipated cash flow, interest or dividend coverage, asset coverage, and earnings prospects;
the experience and strength of the company’s management;
the company’s changing financial condition and market recognition of the change;
the company’s sensitivity to changes in interest rates and business conditions; and
the company’s debt maturity schedules and borrowing requirements.
When choosing equity investments for the Fund, the investment manager applies a “bottom-up,” value oriented, long-term approach, focusing on the market price of a company’s securities relative to the investment manager’s evaluation of the company’s long-term earnings, asset value and cash flow potential. The investment manager also considers a company’s price/earnings ratio, profit margins and liquidation value.
Principal RisksYou could lose money by investing in the Fund. Mutual fund shares are not deposits or obligations of, or guaranteed or endorsed by, any bank, and are not insured by the Federal Deposit Insurance Corporation, the Federal Reserve Board, or any other agency of the U.S. government.
Market The market values of securities or other investments owned by the Fund will go up or down, sometimes rapidly or unpredictably. The market value of a security or other investment may be reduced by market activity or other results of supply and demand unrelated to the issuer. This is a basic risk associated with all securities. When there are more sellers than buyers, prices tend to fall. Likewise, when there are more buyers than sellers, prices tend to rise.
Stock prices tend to go up and down more dramatically than those of debt securities. A slower-growth or recessionary economic environment could
have an adverse effect on the prices of the various stocks held by the Fund.
High-Yield Debt Securities Issuers of lower-rated or “high-yield” debt securities (also known as “junk bonds”) are not as strong financially as those issuing higher credit quality debt securities. High-yield debt securities are generally considered predominantly speculative by the applicable rating agencies as their issuers are more likely to encounter financial difficulties and are more vulnerable to changes in the relevant economy, such as a recession or a sustained period of rising interest rates, that could affect their ability to make interest and principal payments when due. The prices of high-yield debt securities generally fluctuate more than those of higher credit quality. High-yield debt securities are generally more illiquid (harder to sell) and harder to value.
Interest Rate When interest rates rise, debt security prices generally fall. The opposite is also generally true: debt security prices rise when interest rates fall. Interest rate changes are influenced by a number of factors, including government policy, monetary policy, inflation expectations, perceptions of risk, and supply and demand of bonds. In general, securities with longer maturities or durations are more sensitive to these interest rate changes.
Credit An issuer of debt securities may fail to make interest payments or repay principal when due, in whole or in part. Changes in an issuer’s financial strength or in a security’s credit rating may affect a security’s value.
Income Because the Fund can only distribute what it earns, the Fund’s distributions to shareholders may decline when prevailing interest rates fall, when dividend income from investments in stocks decline, or when the Fund experiences defaults on debt securities it holds.
Prepayment Prepayment risk occurs when a debt security can be repaid in whole or in part prior to the security’s maturity and the Fund must reinvest the proceeds it receives, during periods of declining interest rates, in securities that pay a lower rate of interest. Also, if a security has been purchased at a premium, the value of the premium would be lost in the event of prepayment. Prepayments generally increase when interest rates fall.
150
S-150

S U M M A RY P RO S P E C T U S
4 - Franklin Income VIP Fund - Class 2
Foreign Securities Investing in foreign securities typically involves more risks than investing in U.S. securities, including risks related to currency exchange rates and policies, country or government specific issues, less favorable trading practices or regulation and greater price volatility. Certain of these risks also may apply to securities of U.S. companies with significant foreign operations.
Focus To the extent that the Fund focuses on particular countries, regions, industries, sectors or types of investment from time to time, the Fund may be subject to greater risks of adverse developments in such areas of focus than a fund that invests in a wider variety of countries, regions, industries, sectors or investments.
Equity-Linked Notes (ELNs) ELNs may not perform as expected and could cause the Fund to realize
significant losses including its entire principal investment. Other risks include counterparty risk, liquidity risk and imperfect correlation between ELNs and the underlying securities.
Management The Fund is subject to management risk because it is an actively managed investment portfolio. The Fund’s investment manager applies investment techniques and risk analyses in making investment decisions for the Fund, but there can be no guarantee that these decisions will produce the desired results.
Value Style Investing A value stock may not increase in price as anticipated by the investment manager if other investors fail to recognize the company’s value and bid up the price, the markets favor faster-growing companies, or the factors that the investment manager believes will increase the price of the security do not occur.
151
S-151

S U M M A RY P RO S P E C T U S
5 - Franklin Income VIP Fund - Class 2
PerformanceThe following bar chart and table provide some indication of the risks of investing in the Fund. The bar chart shows changes in the Fund’s performance from year to year for Class 2 shares. The table shows how the Fund’s average annual returns for 1 year, 5 years, 10 years or since inception, as applicable, compare with those of a broad measure of market performance. The Fund’s past performance is not necessarily an indication of how the Fund will perform in the future.
The inclusion of the Barclays U.S. Aggregate Index shows how the Fund’s performance compares to a group of securities in an additional leading bond index.
Performance reflects all Fund expenses but does not include any fees or sales charges imposed by variable insurance contracts, qualified plans or funds of funds. If they had been included, the returns shown below would be lower. Investors should consult the variable insurance contract prospectus, or the disclosure documents for qualified plans or funds of funds for more information.
Annual Total Returns
Best Quarter: Q2’09 17.28%
Worst Quarter: Q3’08 -14.85%
As of March 31, 2016, the Fund’s year-to-date return was 1.27%.
-7.05%
4.62%
13.94%12.65%
2.38%
12.67%
35.59%
-29.66%3.76%
18.24%
2015201420132012201120102009200820072006Year
Average Annual Total ReturnsFor the periods ended December 31, 2015
1 Year 5 Years 10 Years
Franklin Income VIP Fund - Class 2 -7.05% 5.03% 5.35%
S&P 500® Index (index reflects no deduction for fees, expenses or taxes) 1.38% 12.57% 7.31%
Barclays U.S. Aggregate Index (index reflects no deduction for fees, expenses or taxes) 0.55% 3.25% 4.51%
No one index is representative of the Fund’s portfolio.
152
S-152

S U M M A RY P RO S P E C T U S
6 - Franklin Income VIP Fund - Class 2
Investment ManagerFranklin Advisers, Inc. (Advisers)
Portfolio ManagersEdward D. Perks, CFAExecutive Vice President of Advisers and portfolio manager of the Fund since 2002.Matthew D. QuinlanVice President of Advisers and portfolio manager of the Fund since 2012.Alex W. Peters, CFAVice President of Advisers and portfolio manager of the Fund since 2012.
Purchase and Sale of Fund SharesShares of the Fund are sold to insurance companies’ separate accounts (Insurers) to fund variable annuity or variable life insurance contracts and to qualified plans. Insurance companies offer variable annuity and variable life insurance products through separate accounts. Shares of the Fund may also be sold to other mutual funds, either as underlying funds in a fund of funds or in other structures. In addition, Fund shares are held by a limited number of Insurers, qualified retirement plans and, when applicable, funds of funds. Substantial withdrawals by one or more Insurers, qualified retirement plans or funds of funds could reduce Fund assets, causing total Fund expenses to become higher than the numbers shown in the fees and expenses table above.
The terms of the offering of interests in separate accounts are included in the variable annuity or variable life insurance product prospectus. The terms of offerings of funds of funds are included in those funds’ prospectuses. The terms of offering of qualified
retirement plans are described in their disclosure documents. Investors should consult the variable contract prospectus, fund of fund prospectus, or plan disclosure documents for more information on fees and expenses imposed by variable insurance contracts, funds of funds or qualified retirement plans, respectively.
TaxesBecause shares of the Fund are generally purchased through variable annuity contracts or variable life insurance contracts, the Fund’s distributions (which the Fund expects, based on its investment goals and strategies to consist of ordinary income, capital gains or some combination of both) will be exempt from current taxation if left to accumulate within the variable contract. You should refer to your contract prospectus for more information on these tax consequences.
Payments to Sponsoring Insurance Companies and Other Financial IntermediariesThe Fund or its distributor (and related companies) may pay broker/dealers or other financial intermediaries (such as banks and insurance companies, or their related companies) for the sale and retention of variable contracts which offer Fund shares and/or for other services. These payments may create a conflict of interest for an intermediary or be a factor in the insurance company’s decision to include the Fund as an investment option in its variable contract. For more information, ask your financial advisor, visit your intermediary’s website, or consult the Contract prospectus or this Fund prospectus.
153
S-153

Investment Company Act file #811-05583
© 2016 Franklin Templeton Investments. All rights reserved. 770 PSUM 05/16
154
S-154

MAY 1, 2016
Before you invest, you may want to review the Fund’s prospectus, which contains more information about the
Fund and its risks. You can find the Fund’s prospectus, statement of additional information and other information
about the Fund online at franklintempleton.com/ftviptfunds. You can also get this information at no cost by calling
1-888-FRANKLIN or by sending an e-mail request to [email protected]. The Fund’s
prospectus and statement of additional information, both dated May 1, 2016, as may be amended from time to
time, are incorporated by reference into this Summary prospectus, which means that they are legally a part of this
Summary prospectus. Shares of the insurance funds of Franklin Templeton Variable Insurance Products Trust are
not offered to the public; they are offered and sold only to: (1) insurance company separate accounts to serve as the
underlying investment vehicles for variable contracts; (2) certain qualified plans; and (3) other mutual funds (fund
of funds). This Summary prospectus is not intended for use by other investors. Please check with your insurance
company for availability. Please read this Summary prospectus together with your variable annuity or variable life
insurance product prospectus.
SUMMARY PROSPECTUSFRANKLIN TEMPLETON VARIABLE INSURANCE PRODUCTS TRUST | CLASS 2
Franklin Mutual Global Discovery VIP Fund
155
S-155

S U M M A RY P RO S P E C T U S
2 - Franklin Mutual Global Discovery VIP Fund - Class 2
Investment GoalCapital appreciation.
Fees and Expenses of the FundThis table describes the fees and expenses that you may pay if you buy and hold shares of the Fund. The table and the example do not include any fees or sales charges imposed by variable insurance contracts, qualified retirement plans or funds of funds. If they were included, your costs would be higher.
Annual Fund Operating Expenses(expenses that you pay each year as a percentage of the value of your investment)
Class 2
Management fees 0.94%
Distribution and service (12b-1) fees 0.25%
Other expenses 0.08%
Total annual Fund operating expenses 1.27%
ExampleThis Example is intended to help you compare the cost of investing in the Fund with the cost of investing in other mutual funds. The Example assumes that you invest $10,000 in the Fund for the time periods indicated and then redeem all of your shares at the end of the period. The Example also assumes that your investment has a 5% return each year and that the Fund’s operating expenses remain the same. The Example reflects adjustments made to the Fund’s operating expenses due to the fee waivers and/or expense reimbursements by management for the 1 Year numbers only. Although your actual costs may be higher or lower, based on these assumptions your costs would be:
1 Year 3 Years 5 Years 10 Years
Class 2 $129 $403 $697 $1,534
Portfolio TurnoverThe Fund pays transaction costs, such as commissions, when it buys and sells securities (or “turns over” its portfolio). A higher portfolio turnover rate may indicate higher transaction costs. These costs, which are not reflected in annual Fund operating expenses or in the example, affect the Fund’s
performance. During the most recent fiscal year, the Fund’s portfolio turnover rate was 21.88% of the average value of its portfolio.
Principal Investment StrategiesUnder normal market conditions, the Fund invests primarily in equity securities (including securities convertible into, or that the investment manager expects to be exchanged for, common or preferred stock) of U.S. and foreign companies that the investment manager believes are available at market prices less than their value based on certain recognized or objective criteria (intrinsic value). Following this value-oriented strategy, the Fund invests primarily in undervalued securities (securities trading at a discount to intrinsic value). The equity securities in which the Fund invests are primarily common stock. To a lesser extent, the Fund also invests in merger arbitrage securities and the debt and equity of distressed companies.
The Fund is not limited to pre-set maximums or minimums governing the size of the companies in which it may invest. However, the Fund currently invests the equity portion of its portfolio primarily to predominantly in mid- and large-cap companies, with the remaining portion of its equity portfolio in smaller companies.
The Fund may invest substantially and potentially up to 100% of its assets in foreign securities, which may include sovereign debt and participations in foreign government debt. The Fund presently does not intend to invest more than a portion (no more than 25%) of its assets in securities of issuers located in emerging market countries.
The Fund regularly attempts to hedge (protect) against currency risks, largely using currency forward contracts and currency futures contracts (including currency index futures contracts) when, in the investment manager’s opinion, it would be advantageous to the Fund to do so. The Fund may also, from time to time, attempt to hedge against market risk using a variety of derivatives.
Portfolio SelectionThe investment manager employs a research driven, fundamental value strategy for the Fund. Investments are generally selected based on the investment
156
S-156

S U M M A RY P RO S P E C T U S
3 - Franklin Mutual Global Discovery VIP Fund - Class 2
manager’s own analysis of the security’s intrinsic value, including for equity securities, an analysis of book value, cash flow potential, long-term earnings and multiples of earnings. The investment manager examines each investment separately and there are no set criteria as to specific value parameters, asset size, earnings or industry type.
Principal RisksYou could lose money by investing in the Fund. Mutual fund shares are not deposits or obligations of, or guaranteed or endorsed by, any bank, and are not insured by the Federal Deposit Insurance Corporation, the Federal Reserve Board, or any other agency of the U.S. government.
Market The market values of securities or other investments owned by the Fund will go up or down, sometimes rapidly or unpredictably. The market value of a security or other investment may be reduced by market activity or other results of supply and demand unrelated to the issuer. This is a basic risk associated with all securities. When there are more sellers than buyers, prices tend to fall. Likewise, when there are more buyers than sellers, prices tend to rise.
Stock prices tend to go up and down more dramatically than those of debt securities. A slower-growth or recessionary economic environment could have an adverse effect on the prices of the various stocks held by the Fund.
Value Style Investing A value stock may not increase in price as anticipated by the investment manager if other investors fail to recognize the company’s value and bid up the price, the markets favor faster-growing companies, or the factors that the investment manager believes will increase the price of the security do not occur.
Foreign Securities Investing in foreign securities typically involves more risks than investing in U.S. securities, and includes risks associated with: internal and external political and economic developments – e.g., the political, economic and social policies and structures of some foreign countries may be less stable and more volatile than those in the U.S. or some foreign countries may be subject to trading restrictions or economic sanctions; trading practices – e.g., government supervision and regulation of foreign
securities and currency markets, trading systems and brokers may be less than in the U.S.; availability of information – e.g., foreign issuers may not be subject to the same disclosure, accounting and financial reporting standards and practices as U.S. issuers; limited markets – e.g., the securities of certain foreign issuers may be less liquid (harder to sell) and more volatile; and currency exchange rate fluctuations and policies. The risks of foreign investments may be greater in developing or emerging market countries.
Smaller and Midsize Companies Securities issued by smaller and midsize companies may be more volatile in price than those of larger companies, involve substantial risks and should be considered speculative. Such risks may include greater sensitivity to economic conditions, less certain growth prospects, lack of depth of management and funds for growth and development, and limited or less developed product lines and markets. In addition, smaller and midsize companies may be particularly affected by interest rate increases, as they may find it more difficult to borrow money to continue or expand operations, or may have difficulty in repaying any loans.
Derivative Instruments The performance of derivative instruments depends largely on the performance of an underlying instrument, such as a currency, security, interest rate or index, and such instruments often have risks similar to the underlying instrument, in addition to other risks. Derivatives involve costs and can create economic leverage in the Fund’s portfolio which may result in significant volatility and cause the Fund to participate in losses (as well as gains) in an amount that exceeds the Fund’s initial investment. Other risks include illiquidity, mispricing or improper valuation of the derivative instrument, and imperfect correlation between the value of the derivative and the underlying instrument so that the Fund may not realize the intended benefits. When a derivative is used for hedging, the change in value of the derivative may also not correlate specifically with the currency, security, interest rate, index or other risk being hedged. Derivatives also may present the risk that the other party to the transaction will fail to perform.
Merger Arbitrage Securities and Distressed Companies A merger or other restructuring, or a tender or exchange offer, proposed or pending at the time the Fund invests in merger arbitrage securities
157
S-157
S U M M A RY P RO S P E C T U S
4 - Franklin Mutual Global Discovery VIP Fund - Class 2
may not be completed on the terms or within the time frame contemplated, which may result in losses to the Fund. Debt obligations of distressed companies typically are unrated, lower-rated, in default or close to default and are generally more likely to become worthless than the securities of more financially stable companies.
Management The Fund is subject to management risk because it is an actively managed investment portfolio. The Fund’s investment manager applies investment techniques and risk analyses in making investment decisions for the Fund, but there can be no guarantee that these decisions will produce the desired results.
158
S-158
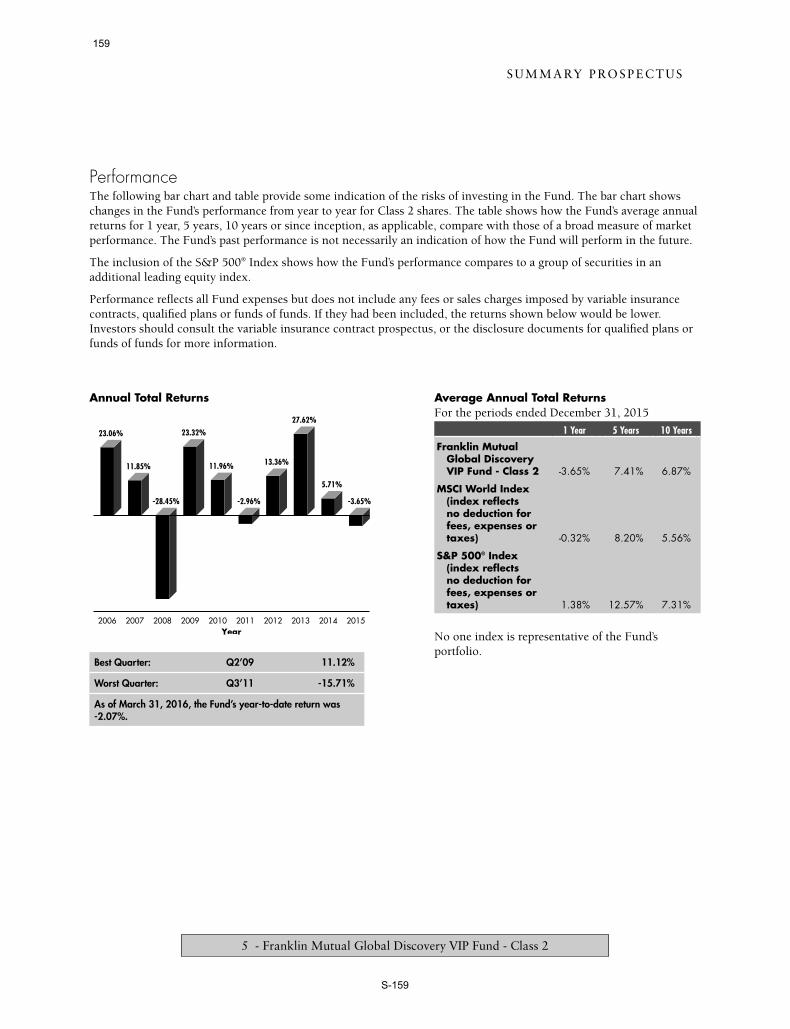
S U M M A RY P RO S P E C T U S
5 - Franklin Mutual Global Discovery VIP Fund - Class 2
PerformanceThe following bar chart and table provide some indication of the risks of investing in the Fund. The bar chart shows changes in the Fund’s performance from year to year for Class 2 shares. The table shows how the Fund’s average annual returns for 1 year, 5 years, 10 years or since inception, as applicable, compare with those of a broad measure of market performance. The Fund’s past performance is not necessarily an indication of how the Fund will perform in the future.
The inclusion of the S&P 500® Index shows how the Fund’s performance compares to a group of securities in an additional leading equity index.
Performance reflects all Fund expenses but does not include any fees or sales charges imposed by variable insurance contracts, qualified plans or funds of funds. If they had been included, the returns shown below would be lower. Investors should consult the variable insurance contract prospectus, or the disclosure documents for qualified plans or funds of funds for more information.
Annual Total Returns
Best Quarter: Q2’09 11.12%
Worst Quarter: Q3’11 -15.71%
As of March 31, 2016, the Fund’s year-to-date return was -2.07%.
-3.65%
5.71%
27.62%
13.36%
-2.96%
11.96%
23.32%
-28.45%
11.85%
23.06%
2015201420132012201120102009200820072006Year
Average Annual Total ReturnsFor the periods ended December 31, 2015
1 Year 5 Years 10 Years
Franklin Mutual Global Discovery VIP Fund - Class 2 -3.65% 7.41% 6.87%
MSCI World Index (index reflects no deduction for fees, expenses or taxes) -0.32% 8.20% 5.56%
S&P 500® Index (index reflects no deduction for fees, expenses or taxes) 1.38% 12.57% 7.31%
No one index is representative of the Fund’s portfolio.
159
S-159
S U M M A RY P RO S P E C T U S
6 - Franklin Mutual Global Discovery VIP Fund - Class 2
Investment ManagerFranklin Mutual Advisers, LLC (Franklin Mutual)
Portfolio ManagersPeter A. LangermanChairman, President and Chief Executive Officer of Franklin Mutual and portfolio manager of the Fund since 2009.Philippe Brugere-TrelatExecutive Vice President of Franklin Mutual and portfolio manager of the Fund since 2009.Timothy Rankin, CFAPortfolio Manager of Franklin Mutual and portfolio manager of the Fund since 2010.
Purchase and Sale of Fund SharesShares of the Fund are sold to insurance companies’ separate accounts (Insurers) to fund variable annuity or variable life insurance contracts and to qualified plans. Insurance companies offer variable annuity and variable life insurance products through separate accounts. Shares of the Fund may also be sold to other mutual funds, either as underlying funds in a fund of funds or in other structures. In addition, Fund shares are held by a limited number of Insurers, qualified retirement plans and, when applicable, funds of funds. Substantial withdrawals by one or more Insurers, qualified retirement plans or funds of funds could reduce Fund assets, causing total Fund expenses to become higher than the numbers shown in the fees and expenses table above.
The terms of the offering of interests in separate accounts are included in the variable annuity or variable life insurance product prospectus. The terms of offerings of funds of funds are included in those funds’ prospectuses. The terms of offering of qualified
retirement plans are described in their disclosure documents. Investors should consult the variable contract prospectus, fund of fund prospectus, or plan disclosure documents for more information on fees and expenses imposed by variable insurance contracts, funds of funds or qualified retirement plans, respectively.
TaxesBecause shares of the Fund are generally purchased through variable annuity contracts or variable life insurance contracts, the Fund’s distributions (which the Fund expects, based on its investment goals and strategies to consist of ordinary income, capital gains or some combination of both) will be exempt from current taxation if left to accumulate within the variable contract. You should refer to your contract prospectus for more information on these tax consequences.
Payments to Sponsoring Insurance Companies and Other Financial IntermediariesThe Fund or its distributor (and related companies) may pay broker/dealers or other financial intermediaries (such as banks and insurance companies, or their related companies) for the sale and retention of variable contracts which offer Fund shares and/or for other services. These payments may create a conflict of interest for an intermediary or be a factor in the insurance company’s decision to include the Fund as an investment option in its variable contract. For more information, ask your financial advisor, visit your intermediary’s website, or consult the Contract prospectus or this Fund prospectus.
160
S-160

Investment Company Act file #811-05583
© 2016 Franklin Templeton Investments. All rights reserved. 754 PSUM 05/16
161
S-161

MAY 1, 2016
Before you invest, you may want to review the Fund’s prospectus, which contains more information about the
Fund and its risks. You can find the Fund’s prospectus, statement of additional information and other information
about the Fund online at franklintempleton.com/ftviptfunds. You can also get this information at no cost by calling
1-888-FRANKLIN or by sending an e-mail request to [email protected]. The Fund’s
prospectus and statement of additional information, both dated May 1, 2016, as may be amended from time to
time, are incorporated by reference into this Summary prospectus, which means that they are legally a part of this
Summary prospectus. Shares of the insurance funds of Franklin Templeton Variable Insurance Products Trust are
not offered to the public; they are offered and sold only to: (1) insurance company separate accounts to serve as the
underlying investment vehicles for variable contracts; (2) certain qualified plans; and (3) other mutual funds (fund
of funds). This Summary prospectus is not intended for use by other investors. Please check with your insurance
company for availability. Please read this Summary prospectus together with your variable annuity or variable life
insurance product prospectus.
SUMMARY PROSPECTUSFRANKLIN TEMPLETON VARIABLE INSURANCE PRODUCTS TRUST | CLASS 2
Franklin Mutual Shares VIP Fund
162
S-162

S U M M A RY P RO S P E C T U S
2 - Franklin Mutual Shares VIP Fund - Class 2
Investment GoalCapital appreciation. Its secondary goal is income.
Fees and Expenses of the FundThis table describes the fees and expenses that you may pay if you buy and hold shares of the Fund. The table and the example do not include any fees or sales charges imposed by variable insurance contracts, qualified retirement plans or funds of funds. If they were included, your costs would be higher.
Annual Fund Operating Expenses(expenses that you pay each year as a percentage of the value of your investment)
Class 2
Management fees 0.69%
Distribution and service (12b-1) fees 0.25%
Other expenses 0.04%
Total annual Fund operating expenses 0.98%
ExampleThis Example is intended to help you compare the cost of investing in the Fund with the cost of investing in other mutual funds. The Example assumes that you invest $10,000 in the Fund for the time periods indicated and then redeem all of your shares at the end of the period. The Example also assumes that your investment has a 5% return each year and that the Fund’s operating expenses remain the same. The Example reflects adjustments made to the Fund’s operating expenses due to the fee waivers and/or expense reimbursements by management for the 1 Year numbers only. Although your actual costs may be higher or lower, based on these assumptions your costs would be:
1 Year 3 Years 5 Years 10 Years
Class 2 $100 $312 $542 $1,201
Portfolio TurnoverThe Fund pays transaction costs, such as commissions, when it buys and sells securities (or “turns over” its portfolio). A higher portfolio turnover rate may indicate higher transaction costs. These costs, which are not reflected in annual Fund operating expenses or in the example, affect the Fund’s
performance. During the most recent fiscal year, the Fund’s portfolio turnover rate was 19.88% of the average value of its portfolio.
Principal Investment StrategiesUnder normal market conditions, the Fund invests primarily in equity securities (including securities convertible into, or that the investment manager expects to be exchanged for, common or preferred stock) of U.S. and foreign companies that the investment manager believes are available at market prices less than their value based on certain recognized or objective criteria (intrinsic value). Following this value-oriented strategy, the Fund invests primarily in undervalued securities (securities trading at a discount to intrinsic value). The equity securities in which the Fund invests are primarily common stock. To a lesser extent, the Fund also invests in merger arbitrage securities and the debt and equity of distressed companies.
The Fund may invest a significant portion of its assets (up to 35%) in foreign securities, which may include sovereign debt and participations in foreign government debt. The Fund presently does not intend to invest more than 20% of its assets in foreign securities.
The Fund is not limited to pre-set maximums or minimums governing the size of the companies in which it may invest. However, the Fund generally invests the equity portion of its portfolio primarily to predominantly in companies with market capitalizations greater than $5 billion, with a portion or significant amount in smaller companies.
The Fund regularly attempts to hedge (protect) against currency risks, largely using currency forward contracts and currency futures contracts (including currency index futures contracts) when, in the investment manager’s opinion, it would be advantageous to the Fund to do so. The Fund may also, from time to time, attempt to hedge against market risk using a variety of derivatives.
Portfolio SelectionThe investment manager employs a research driven, fundamental value strategy for the Fund. Investments are generally selected based on the investment manager’s own analysis of the security’s intrinsic
163
S-163
S U M M A RY P RO S P E C T U S
3 - Franklin Mutual Shares VIP Fund - Class 2
value, including for equity securities, an analysis of book value, cash flow potential, long-term earnings and multiples of earnings. The investment manager examines each investment separately and there are no set criteria as to specific value parameters, asset size, earnings or industry type.
Principal RisksYou could lose money by investing in the Fund. Mutual fund shares are not deposits or obligations of, or guaranteed or endorsed by, any bank, and are not insured by the Federal Deposit Insurance Corporation, the Federal Reserve Board, or any other agency of the U.S. government.
Market The market values of securities or other investments owned by the Fund will go up or down, sometimes rapidly or unpredictably. The market value of a security or other investment may be reduced by market activity or other results of supply and demand unrelated to the issuer. This is a basic risk associated with all securities. When there are more sellers than buyers, prices tend to fall. Likewise, when there are more buyers than sellers, prices tend to rise.
Stock prices tend to go up and down more dramatically than those of debt securities. A slower-growth or recessionary economic environment could have an adverse effect on the prices of the various stocks held by the Fund.
Value Style Investing A value stock may not increase in price as anticipated by the investment manager if other investors fail to recognize the company’s value and bid up the price, the markets favor faster-growing companies, or the factors that the investment manager believes will increase the price of the security do not occur.
Foreign Securities Investing in foreign securities typically involves more risks than investing in U.S. securities, including risks related to currency exchange rates and policies, country or government specific issues, less favorable trading practices or regulation and greater price volatility. Certain of these risks also may apply to securities of U.S. companies with significant foreign operations.
Smaller and Midsize Companies Securities issued by smaller and midsize companies may be more volatile in price than those of larger companies, involve
substantial risks and should be considered speculative. Such risks may include greater sensitivity to economic conditions, less certain growth prospects, lack of depth of management and funds for growth and development, and limited or less developed product lines and markets. In addition, smaller and midsize companies may be particularly affected by interest rate increases, as they may find it more difficult to borrow money to continue or expand operations, or may have difficulty in repaying any loans.
Derivative Instruments The performance of derivative instruments depends largely on the performance of an underlying instrument, such as a currency, security, interest rate or index, and such instruments often have risks similar to the underlying instrument, in addition to other risks. Derivatives involve costs and can create economic leverage in the Fund’s portfolio which may result in significant volatility and cause the Fund to participate in losses (as well as gains) in an amount that exceeds the Fund’s initial investment. Other risks include illiquidity, mispricing or improper valuation of the derivative instrument, and imperfect correlation between the value of the derivative and the underlying instrument so that the Fund may not realize the intended benefits. When a derivative is used for hedging, the change in value of the derivative may also not correlate specifically with the currency, security, interest rate, index or other risk being hedged. Derivatives also may present the risk that the other party to the transaction will fail to perform.
Merger Arbitrage Securities and Distressed Companies A merger or other restructuring, or a tender or exchange offer, proposed or pending at the time the Fund invests in merger arbitrage securities may not be completed on the terms or within the time frame contemplated, which may result in losses to the Fund. Debt obligations of distressed companies typically are unrated, lower-rated, in default or close to default and are generally more likely to become worthless than the securities of more financially stable companies.
Management The Fund is subject to management risk because it is an actively managed investment portfolio. The Fund’s investment manager applies investment techniques and risk analyses in making investment decisions for the Fund, but there can be no guarantee that these decisions will produce the desired results.
164
S-164
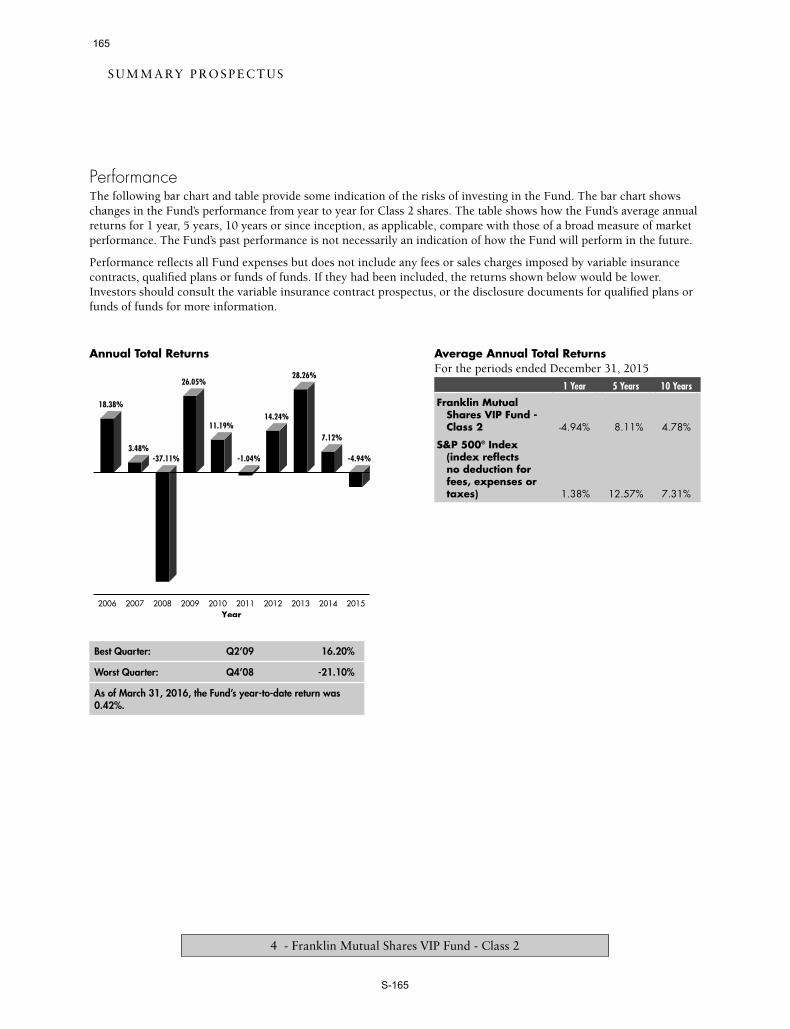
S U M M A RY P RO S P E C T U S
4 - Franklin Mutual Shares VIP Fund - Class 2
PerformanceThe following bar chart and table provide some indication of the risks of investing in the Fund. The bar chart shows changes in the Fund’s performance from year to year for Class 2 shares. The table shows how the Fund’s average annual returns for 1 year, 5 years, 10 years or since inception, as applicable, compare with those of a broad measure of market performance. The Fund’s past performance is not necessarily an indication of how the Fund will perform in the future.
Performance reflects all Fund expenses but does not include any fees or sales charges imposed by variable insurance contracts, qualified plans or funds of funds. If they had been included, the returns shown below would be lower. Investors should consult the variable insurance contract prospectus, or the disclosure documents for qualified plans or funds of funds for more information.
Annual Total Returns
Best Quarter: Q2’09 16.20%
Worst Quarter: Q4’08 -21.10%
As of March 31, 2016, the Fund’s year-to-date return was 0.42%.
-4.94%
7.12%
28.26%
14.24%
-1.04%
11.19%
26.05%
-37.11%3.48%
18.38%
2015201420132012201120102009200820072006Year
Average Annual Total ReturnsFor the periods ended December 31, 2015
1 Year 5 Years 10 Years
Franklin Mutual Shares VIP Fund - Class 2 -4.94% 8.11% 4.78%
S&P 500® Index (index reflects no deduction for fees, expenses or taxes) 1.38% 12.57% 7.31%
165
S-165

S U M M A RY P RO S P E C T U S
5 - Franklin Mutual Shares VIP Fund - Class 2
Investment ManagerFranklin Mutual Advisers, LLC (Franklin Mutual)
Portfolio ManagersPeter A. LangermanChairman, President and Chief Executive Officer of Franklin Mutual and portfolio manager of the Fund since 2005.F. David Segal, CFAPortfolio Manager of Franklin Mutual and portfolio manager of the Fund since 2002.Debbie A. Turner, CFAPortfolio Manager of Franklin Mutual and portfolio manager of the Fund since 2001.
Purchase and Sale of Fund SharesShares of the Fund are sold to insurance companies’ separate accounts (Insurers) to fund variable annuity or variable life insurance contracts and to qualified plans. Insurance companies offer variable annuity and variable life insurance products through separate accounts. Shares of the Fund may also be sold to other mutual funds, either as underlying funds in a fund of funds or in other structures. In addition, Fund shares are held by a limited number of Insurers, qualified retirement plans and, when applicable, funds of funds. Substantial withdrawals by one or more Insurers, qualified retirement plans or funds of funds could reduce Fund assets, causing total Fund expenses to become higher than the numbers shown in the fees and expenses table above.
The terms of the offering of interests in separate accounts are included in the variable annuity or variable life insurance product prospectus. The terms of offerings of funds of funds are included in those funds’ prospectuses. The terms of offering of qualified
retirement plans are described in their disclosure documents. Investors should consult the variable contract prospectus, fund of fund prospectus, or plan disclosure documents for more information on fees and expenses imposed by variable insurance contracts, funds of funds or qualified retirement plans, respectively.
TaxesBecause shares of the Fund are generally purchased through variable annuity contracts or variable life insurance contracts, the Fund’s distributions (which the Fund expects, based on its investment goals and strategies to consist of ordinary income, capital gains or some combination of both) will be exempt from current taxation if left to accumulate within the variable contract. You should refer to your contract prospectus for more information on these tax consequences.
Payments to Sponsoring Insurance Companies and Other Financial IntermediariesThe Fund or its distributor (and related companies) may pay broker/dealers or other financial intermediaries (such as banks and insurance companies, or their related companies) for the sale and retention of variable contracts which offer Fund shares and/or for other services. These payments may create a conflict of interest for an intermediary or be a factor in the insurance company’s decision to include the Fund as an investment option in its variable contract. For more information, ask your financial advisor, visit your intermediary’s website, or consult the Contract prospectus or this Fund prospectus.
166
S-166

Investment Company Act file #811-05583
© 2016 Franklin Templeton Investments. All rights reserved. 744 PSUM 05/16
167
S-167

MAY 1, 2016
Before you invest, you may want to review the Fund’s prospectus, which contains more information about the
Fund and its risks. You can find the Fund’s prospectus, statement of additional information and other information
about the Fund online at franklintempleton.com/ftviptfunds. You can also get this information at no cost by calling
1-888-FRANKLIN or by sending an e-mail request to [email protected]. The Fund’s
prospectus and statement of additional information, both dated May 1, 2016, as may be amended from time to
time, are incorporated by reference into this Summary prospectus, which means that they are legally a part of this
Summary prospectus. Shares of the insurance funds of Franklin Templeton Variable Insurance Products Trust are
not offered to the public; they are offered and sold only to: (1) insurance company separate accounts to serve as the
underlying investment vehicles for variable contracts; (2) certain qualified plans; and (3) other mutual funds (fund
of funds). This Summary prospectus is not intended for use by other investors. Please check with your insurance
company for availability. Please read this Summary prospectus together with your variable annuity or variable life
insurance product prospectus.
SUMMARY PROSPECTUSFRANKLIN TEMPLETON VARIABLE INSURANCE PRODUCTS TRUST | CLASS 2
Franklin Rising Dividends VIP Fund
168
S-168

S U M M A RY P RO S P E C T U S
2 - Franklin Rising Dividends VIP Fund - Class 2
Investment GoalLong-term capital appreciation. Preservation of capital, while not a goal, is also an important consideration.
Fees and Expenses of the FundThis table describes the fees and expenses that you may pay if you buy and hold shares of the Fund. The table and the example do not include any fees or sales charges imposed by variable insurance contracts, qualified retirement plans or funds of funds. If they were included, your costs would be higher.
Annual Fund Operating Expenses(expenses that you pay each year as a percentage of the value of your investment)
Class 2
Management fees 0.61%
Distribution and service (12b-1) fees 0.25%
Other expenses 0.02%
Total annual Fund operating expenses 0.88%
ExampleThis Example is intended to help you compare the cost of investing in the Fund with the cost of investing in other mutual funds. The Example assumes that you invest $10,000 in the Fund for the time periods indicated and then redeem all of your shares at the end of the period. The Example also assumes that your investment has a 5% return each year and that the Fund’s operating expenses remain the same. The Example reflects adjustments made to the Fund’s operating expenses due to the fee waivers and/or expense reimbursements by management for the 1 Year numbers only. Although your actual costs may be higher or lower, based on these assumptions your costs would be:
1 Year 3 Years 5 Years 10 Years
Class 2 $90 $281 $488 $1,084
Portfolio TurnoverThe Fund pays transaction costs, such as commissions, when it buys and sells securities (or “turns over” its portfolio). A higher portfolio turnover rate may indicate higher transaction costs. These costs, which are not reflected in annual Fund
operating expenses or in the example, affect the Fund’s performance. During the most recent fiscal year, the Fund’s portfolio turnover rate was 4.74% of the average value of its portfolio.
Principal Investment StrategiesUnder normal market conditions, the Fund invests at least 80% of its net assets in equity securities of financially sound companies that have paid consistently rising dividends. The Fund invests predominantly in equity securities, mostly common stocks. Companies that have paid consistently rising dividends include those companies that currently pay dividends on their common stocks and have maintained or increased their dividend rate during the last four consecutive years.
Under normal market conditions, the Fund invests at least 65% of its net assets in securities of companies that have:
consistently increased dividends in at least 8 out of the last 10 years and have not decreased dividends during that time;
increased dividends substantially (at least 100%) over the last 10 years;
reinvested earnings, paying out less than 65% of current earnings in dividends;
either long-term debt that is no more than 50% of total capitalization or senior debt that has been rated investment grade by at least one of the major bond rating organizations; and
attractive prices, either: (1) in the lower half of the stock’s price/earnings ratio range for the past 10 years; or (2) less than price/earnings ratio of the Standard & Poor’s® 500 Stock Index.
The Fund typically invests the rest of its assets in equity securities of companies that pay dividends but do not meet all of these criteria. The Fund may invest in companies of any size, across the entire market spectrum. Although the investment manager searches for investments that it believes to meet the criteria across all sectors, from time to time, based on economic conditions, the Fund may have significant positions in particular sectors.
169
S-169

S U M M A RY P RO S P E C T U S
3 - Franklin Rising Dividends VIP Fund - Class 2
The investment manager is a research driven, fundamental investor. As a “bottom-up” investor focusing primarily on individual securities, the investment manager looks for companies that it believes meet the criteria above and are fundamentally sound and attempts to acquire them at attractive prices. In following these criteria, the Fund does not necessarily focus on companies whose securities pay a high dividend rate but rather on companies that consistently increase their dividends.
The Fund may invest up to 25% of its total assets in foreign securities.
Principal RisksYou could lose money by investing in the Fund. Mutual fund shares are not deposits or obligations of, or guaranteed or endorsed by, any bank, and are not insured by the Federal Deposit Insurance Corporation, the Federal Reserve Board, or any other agency of the U.S. government.
Market The market values of securities or other investments owned by the Fund will go up or down, sometimes rapidly or unpredictably. The market value of a security or other investment may be reduced by market activity or other results of supply and demand unrelated to the issuer. This is a basic risk associated with all securities. When there are more sellers than buyers, prices tend to fall. Likewise, when there are more buyers than sellers, prices tend to rise.
Stock prices tend to go up and down more dramatically than those of debt securities. A slower-growth or recessionary economic environment could have an adverse effect on the prices of the various stocks held by the Fund.
Dividend-Oriented Companies Companies that have historically paid regular dividends to shareholders may decrease or eliminate dividend payments in the future.
A decrease in dividend payments by an issuer may result in a decrease in the value of the issuer’s stock and less available income for the Fund.
Smaller and Midsize Companies Securities issued by smaller and midsize companies may be more volatile in price than those of larger companies, involve substantial risks and should be considered speculative. Such risks may include greater sensitivity to economic conditions, less certain growth prospects, lack of depth of management and funds for growth and development, and limited or less developed product lines and markets. In addition, smaller and midsize companies may be particularly affected by interest rate increases, as they may find it more difficult to borrow money to continue or expand operations, or may have difficulty in repaying any loans.
Focus To the extent that the Fund focuses on particular countries, regions, industries, sectors or types of investment from time to time, the Fund may be subject to greater risks of adverse developments in such areas of focus than a fund that invests in a wider variety of countries, regions, industries, sectors or investments.
Foreign Securities Investing in foreign securities typically involves more risks than investing in U.S. securities, including risks related to currency exchange rates and policies, country or government specific issues, less favorable trading practices or regulation and greater price volatility. Certain of these risks also may apply to securities of U.S. companies with significant foreign operations.
Management The Fund is subject to management risk because it is an actively managed investment portfolio. The Fund’s investment manager applies investment techniques and risk analyses in making investment decisions for the Fund, but there can be no guarantee that these decisions will produce the desired results.
170
S-170
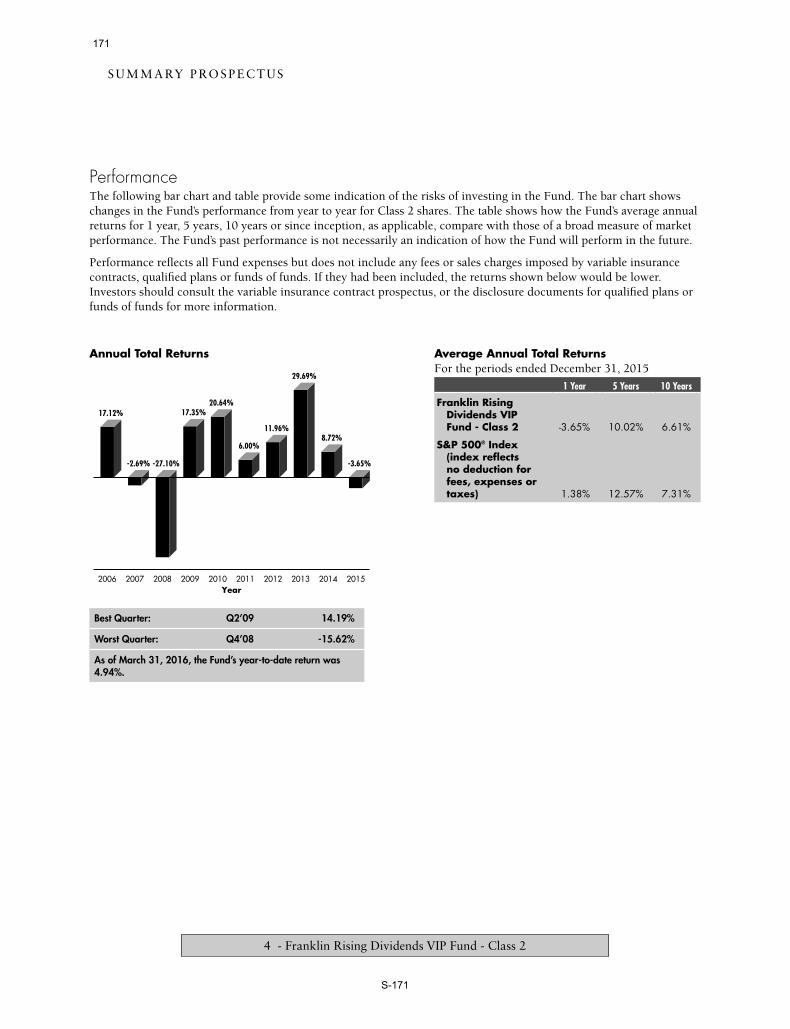
S U M M A RY P RO S P E C T U S
4 - Franklin Rising Dividends VIP Fund - Class 2
PerformanceThe following bar chart and table provide some indication of the risks of investing in the Fund. The bar chart shows changes in the Fund’s performance from year to year for Class 2 shares. The table shows how the Fund’s average annual returns for 1 year, 5 years, 10 years or since inception, as applicable, compare with those of a broad measure of market performance. The Fund’s past performance is not necessarily an indication of how the Fund will perform in the future.
Performance reflects all Fund expenses but does not include any fees or sales charges imposed by variable insurance contracts, qualified plans or funds of funds. If they had been included, the returns shown below would be lower. Investors should consult the variable insurance contract prospectus, or the disclosure documents for qualified plans or funds of funds for more information.
Annual Total Returns
Best Quarter: Q2’09 14.19%
Worst Quarter: Q4’08 -15.62%
As of March 31, 2016, the Fund’s year-to-date return was 4.94%.
-3.65%
8.72%
29.69%
11.96%
6.00%
20.64%17.35%
-27.10%-2.69%
17.12%
2015201420132012201120102009200820072006Year
Average Annual Total ReturnsFor the periods ended December 31, 2015
1 Year 5 Years 10 Years
Franklin Rising Dividends VIP Fund - Class 2 -3.65% 10.02% 6.61%
S&P 500® Index (index reflects no deduction for fees, expenses or taxes) 1.38% 12.57% 7.31%
171
S-171
S U M M A RY P RO S P E C T U S
5 - Franklin Rising Dividends VIP Fund - Class 2
Investment ManagerFranklin Advisory Services, LLC (Advisory Services)
Portfolio ManagersDonald G. Taylor, CPAPresident and Chief Investment Officer of Advisory Services and portfolio manager of the Fund since 1996.Nicholas P. B. Getaz, CFAResearch Analyst of Advisory Services and portfolio manager of the Fund since 2014.Bruce C. Baughman, CPASenior Vice President of Advisory Services and portfolio manager of the Fund since inception (1992).
Purchase and Sale of Fund SharesShares of the Fund are sold to insurance companies’ separate accounts (Insurers) to fund variable annuity or variable life insurance contracts and to qualified plans. Insurance companies offer variable annuity and variable life insurance products through separate accounts. Shares of the Fund may also be sold to other mutual funds, either as underlying funds in a fund of funds or in other structures. In addition, Fund shares are held by a limited number of Insurers, qualified retirement plans and, when applicable, funds of funds. Substantial withdrawals by one or more Insurers, qualified retirement plans or funds of funds could reduce Fund assets, causing total Fund expenses to become higher than the numbers shown in the fees and expenses table above.
The terms of the offering of interests in separate accounts are included in the variable annuity or variable life insurance product prospectus. The terms of offerings of funds of funds are included in those funds’ prospectuses. The terms of offering of qualified
retirement plans are described in their disclosure documents. Investors should consult the variable contract prospectus, fund of fund prospectus, or plan disclosure documents for more information on fees and expenses imposed by variable insurance contracts, funds of funds or qualified retirement plans, respectively.
TaxesBecause shares of the Fund are generally purchased through variable annuity contracts or variable life insurance contracts, the Fund’s distributions (which the Fund expects, based on its investment goals and strategies to consist of ordinary income, capital gains or some combination of both) will be exempt from current taxation if left to accumulate within the variable contract. You should refer to your contract prospectus for more information on these tax consequences.
Payments to Sponsoring Insurance Companies and Other Financial IntermediariesThe Fund or its distributor (and related companies) may pay broker/dealers or other financial intermediaries (such as banks and insurance companies, or their related companies) for the sale and retention of variable contracts which offer Fund shares and/or for other services. These payments may create a conflict of interest for an intermediary or be a factor in the insurance company’s decision to include the Fund as an investment option in its variable contract. For more information, ask your financial advisor, visit your intermediary’s website, or consult the Contract prospectus or this Fund prospectus.
172
S-172

Investment Company Act file #811-05583
© 2016 Franklin Templeton Investments. All rights reserved. 774 PSUM 05/16
173
S-173

MAY 1, 2016
Before you invest, you may want to review the Fund’s prospectus, which contains more information about the
Fund and its risks. You can find the Fund’s prospectus, statement of additional information and other information
about the Fund online at franklintempleton.com/ftviptfunds. You can also get this information at no cost by calling
1-888-FRANKLIN or by sending an e-mail request to [email protected]. The Fund’s
prospectus and statement of additional information, both dated May 1, 2016, as may be amended from time to
time, are incorporated by reference into this Summary prospectus, which means that they are legally a part of this
Summary prospectus. Shares of the insurance funds of Franklin Templeton Variable Insurance Products Trust are
not offered to the public; they are offered and sold only to: (1) insurance company separate accounts to serve as the
underlying investment vehicles for variable contracts; (2) certain qualified plans; and (3) other mutual funds (fund
of funds). This Summary prospectus is not intended for use by other investors. Please check with your insurance
company for availability. Please read this Summary prospectus together with your variable annuity or variable life
insurance product prospectus.
SUMMARY PROSPECTUSFRANKLIN TEMPLETON VARIABLE INSURANCE PRODUCTS TRUST | CLASS 2
Franklin Small Cap Value VIP Fund
174
S-174

S U M M A RY P RO S P E C T U S
2 - Franklin Small Cap Value VIP Fund - Class 2
Investment GoalLong-term total return.
Fees and Expenses of the FundThis table describes the fees and expenses that you may pay if you buy and hold shares of the Fund. The table and the example do not include any fees or sales charges imposed by variable insurance contracts, qualified retirement plans or funds of funds. If they were included, your costs would be higher.
Annual Fund Operating Expenses(expenses that you pay each year as a percentage of the value of your investment)
Class 2
Management fees 0.62%
Distribution and service (12b-1) fees 0.25%
Other expenses 0.03%
Acquired fund fees and expenses1 0.01%
Total annual Fund operating expenses 0.91%
Fee waiver and/or expense reimbursement2 -0.01%
Total annual Fund operating expenses after fee waiver and/or expense reimbursement1,2 0.90%
1. Total annual Fund operating expenses differ from the ratio of expenses to average net assets shown in the Financial Highlights, which reflect the operating expenses of the Fund and do not include acquired fund fees and expenses.
2. The investment manager has contractually agreed in advance to reduce its fee as a result of the Fund’s investment in a Franklin Templeton money fund (acquired fund) for at least the next 12-month period. Contractual fee waiver and/or expense reimbursement agreements may not be changed or terminated during the time periods set forth above.
ExampleThis Example is intended to help you compare the cost of investing in the Fund with the cost of investing in other mutual funds. The Example assumes that you invest $10,000 in the Fund for the time periods indicated and then redeem all of your shares at the end of the period. The Example also assumes that your investment has a 5% return each year and that the Fund’s operating expenses remain the same. The Example reflects adjustments made to the Fund’s operating expenses due to the fee waivers and/or expense reimbursements by management as described
above for the 1 Year numbers only. Although your actual costs may be higher or lower, based on these assumptions your costs would be:
1 Year 3 Years 5 Years 10 Years
Class 2 $92 $289 $503 $1,119
Portfolio TurnoverThe Fund pays transaction costs, such as commissions, when it buys and sells securities (or “turns over” its portfolio). A higher portfolio turnover rate may indicate higher transaction costs. These costs, which are not reflected in annual Fund operating expenses or in the example, affect the Fund’s performance. During the most recent fiscal year, the Fund’s portfolio turnover rate was 27.05% of the average value of its portfolio.
Principal Investment StrategiesUnder normal market conditions, the Fund invests at least 80% of its net assets in investments of small-capitalization (small-cap) companies. Small-cap companies are companies with market capitalizations (the total market value of a company’s outstanding stock) under $3.5 billion at the time of purchase.
The Fund generally invests in equity securities that the Fund’s investment manager believes are undervalued at the time of purchase and have the potential for capital appreciation. The Fund invests predominantly in common stocks. A stock price is undervalued, or is a “value,” when it trades at less than the price at which the investment manager believes it would trade if the market reflected all factors relating to the company’s worth. Following this strategy, the Fund invests in companies that the investment manager believes have, for example: stock prices that are low relative to current, or historical or future earnings, book value, cash flow or sales; recent sharp price declines but the potential for good long-term earnings prospects; and valuable intangibles not reflected in the stock price. The Fund also may invest in equity real estate investment trusts (REITs).
The types of companies the Fund may invest in include those that may be considered out of favor, such as companies attempting to recover from bankruptcy, business setbacks or adverse events
175
S-175

S U M M A RY P RO S P E C T U S
3 - Franklin Small Cap Value VIP Fund - Class 2
(turnarounds) or cyclical downturns, or that may be considered potential takeover targets.
The Fund may invest up to 25% of its total assets in foreign securities.
Principal RisksYou could lose money by investing in the Fund. Mutual fund shares are not deposits or obligations of, or guaranteed or endorsed by, any bank, and are not insured by the Federal Deposit Insurance Corporation, the Federal Reserve Board, or any other agency of the U.S. government.
Market The market values of securities or other investments owned by the Fund will go up or down, sometimes rapidly or unpredictably. The market value of a security or other investment may be reduced by market activity or other results of supply and demand unrelated to the issuer. This is a basic risk associated with all securities. When there are more sellers than buyers, prices tend to fall. Likewise, when there are more buyers than sellers, prices tend to rise.
Stock prices tend to go up and down more dramatically than those of debt securities. A slower-growth or recessionary economic environment could have an adverse effect on the prices of the various stocks held by the Fund.
Value Style Investing A value stock may not increase in price as anticipated by the investment manager if other investors fail to recognize the company’s value and bid up the price, the markets favor faster-growing companies, or the factors that the investment manager believes will increase the price of the security do not occur.
Cyclical stocks in which the Fund may invest tend to lose value more quickly in periods of anticipated economic downturns than non-cyclical stocks. Companies that may be considered out of favor, particularly companies emerging from bankruptcy, may tend to lose value more quickly in periods of anticipated economic downturns, may have difficulty retaining customers and suppliers and, during economic downturns, may have difficulty paying their debt obligations or finding additional financing.
Smaller Companies Securities issued by smaller companies may be more volatile in price than those of
larger companies, involve substantial risks and should be considered speculative. Such risks may include greater sensitivity to economic conditions, less certain growth prospects, lack of depth of management and funds for growth and development and limited or less developed product lines and markets. In addition, smaller companies may be particularly affected by interest rate increases, as they may find it more difficult to borrow money to continue or expand operations, or may have difficulty in repaying any loans.
Real Estate Investment Trusts (REITs) A REIT’s performance depends on the types, values and locations of the properties it owns and how well those properties are managed. A decline in rental income may occur because of extended vacancies, increased competition from other properties, tenants’ failure to pay rent or poor management. Because a REIT may be invested in a limited number of projects or in a particular market segment, it may be more susceptible to adverse developments affecting a single project or market segment than more broadly diversified investments. Loss of status as a qualified REIT under the U.S. federal tax laws could adversely affect the value of a particular REIT or the market for REITs as a whole.
Focus To the extent that the Fund focuses on particular countries, regions, industries, sectors or types of investment from time to time, the Fund may be subject to greater risks of adverse developments in such areas of focus than a fund that invests in a wider variety of countries, regions, industries, sectors or investments.
Foreign Securities Investing in foreign securities typically involves more risks than investing in U.S. securities, including risks related to currency exchange rates and policies, country or government specific issues, less favorable trading practices or regulation and greater price volatility. Certain of these risks also may apply to securities of U.S. companies with significant foreign operations.
Management The Fund is subject to management risk because it is an actively managed investment portfolio. The Fund’s investment manager applies investment techniques and risk analyses in making investment decisions for the Fund, but there can be no guarantee that these decisions will produce the desired results.
176
S-176

S U M M A RY P RO S P E C T U S
4 - Franklin Small Cap Value VIP Fund - Class 2
PerformanceThe following bar chart and table provide some indication of the risks of investing in the Fund. The bar chart shows changes in the Fund’s performance from year to year for Class 2 shares. The table shows how the Fund’s average annual returns for 1 year, 5 years, 10 years or since inception, as applicable, compare with those of a broad measure of market performance. The Fund’s past performance is not necessarily an indication of how the Fund will perform in the future.
Performance reflects all Fund expenses but does not include any fees or sales charges imposed by variable insurance contracts, qualified plans or funds of funds. If they had been included, the returns shown below would be lower. Investors should consult the variable insurance contract prospectus, or the disclosure documents for qualified plans or funds of funds for more information.
Annual Total Returns
Best Quarter: Q2’09 24.33%
Worst Quarter: Q4’08 -27.34%
As of March 31, 2016, the Fund’s year-to-date return was 5.15%.
-7.39%0.57%
36.24%
18.39%
-3.76%
28.22%29.16%
-33.02%-2.38%
16.98%
2015201420132012201120102009200820072006Year
Average Annual Total ReturnsFor the periods ended December 31, 2015
1 Year 5 Years 10 Years
Franklin Small Cap Value VIP Fund - Class 2 -7.39% 7.65% 6.24%
Russell 2500™ Value Index (index reflects no deduction for fees, expenses or taxes) -5.49% 9.23% 6.51%
177
S-177

S U M M A RY P RO S P E C T U S
5 - Franklin Small Cap Value VIP Fund - Class 2
Investment ManagerFranklin Advisory Services, LLC (Advisory Services)
Portfolio ManagersSteven B. RaineriVice President of Advisory Services and portfolio manager of the Fund since 2012.Christopher Meeker, CFAPortfolio Manager of Advisory Services and portfolio manager of the Fund since 2015.Donald G. Taylor, CPAPresident and Chief Investment Officer of Advisory Services and portfolio manager of the Fund since inception (1998).
Purchase and Sale of Fund SharesShares of the Fund are sold to insurance companies’ separate accounts (Insurers) to fund variable annuity or variable life insurance contracts and to qualified plans. Insurance companies offer variable annuity and variable life insurance products through separate accounts. Shares of the Fund may also be sold to other mutual funds, either as underlying funds in a fund of funds or in other structures. In addition, Fund shares are held by a limited number of Insurers, qualified retirement plans and, when applicable, funds of funds. Substantial withdrawals by one or more Insurers, qualified retirement plans or funds of funds could reduce Fund assets, causing total Fund expenses to become higher than the numbers shown in the fees and expenses table above.
The terms of the offering of interests in separate accounts are included in the variable annuity or variable life insurance product prospectus. The terms of offerings of funds of funds are included in those funds’ prospectuses. The terms of offering of qualified
retirement plans are described in their disclosure documents. Investors should consult the variable contract prospectus, fund of fund prospectus, or plan disclosure documents for more information on fees and expenses imposed by variable insurance contracts, funds of funds or qualified retirement plans, respectively.
TaxesBecause shares of the Fund are generally purchased through variable annuity contracts or variable life insurance contracts, the Fund’s distributions (which the Fund expects, based on its investment goals and strategies to consist of ordinary income, capital gains or some combination of both) will be exempt from current taxation if left to accumulate within the variable contract. You should refer to your contract prospectus for more information on these tax consequences.
Payments to Sponsoring Insurance Companies and Other Financial IntermediariesThe Fund or its distributor (and related companies) may pay broker/dealers or other financial intermediaries (such as banks and insurance companies, or their related companies) for the sale and retention of variable contracts which offer Fund shares and/or for other services. These payments may create a conflict of interest for an intermediary or be a factor in the insurance company’s decision to include the Fund as an investment option in its variable contract. For more information, ask your financial advisor, visit your intermediary’s website, or consult the Contract prospectus or this Fund prospectus.
178
S-178

Investment Company Act file #811-05583
© 2016 Franklin Templeton Investments. All rights reserved. 776 PSUM 05/16
179
S-179

MAY 1, 2016
Before you invest, you may want to review the Fund’s prospectus, which contains more information about the
Fund and its risks. You can find the Fund’s prospectus, statement of additional information and other information
about the Fund online at franklintempleton.com/ftviptfunds. You can also get this information at no cost by calling
1-888-FRANKLIN or by sending an e-mail request to [email protected]. The Fund’s
prospectus and statement of additional information, both dated May 1, 2016, as may be amended from time to
time, are incorporated by reference into this Summary prospectus, which means that they are legally a part of this
Summary prospectus. Shares of the insurance funds of Franklin Templeton Variable Insurance Products Trust are
not offered to the public; they are offered and sold only to: (1) insurance company separate accounts to serve as the
underlying investment vehicles for variable contracts; (2) certain qualified plans; and (3) other mutual funds (fund
of funds). This Summary prospectus is not intended for use by other investors. Please check with your insurance
company for availability. Please read this Summary prospectus together with your variable annuity or variable life
insurance product prospectus.
SUMMARY PROSPECTUSFRANKLIN TEMPLETON VARIABLE INSURANCE PRODUCTS TRUST | CLASS 2
Franklin Strategic Income VIP Fund
180
S-180

S U M M A RY P RO S P E C T U S
2 - Franklin Strategic Income VIP Fund - Class 2
Investment GoalHigh level of current income. A secondary goal is long-term capital appreciation.
Fees and Expenses of the FundThis table describes the fees and expenses that you may pay if you buy and hold shares of the Fund. The table and the example do not include any fees or sales charges imposed by variable insurance contracts, qualified retirement plans or funds of funds. If they were included, your costs would be higher.
Annual Fund Operating Expenses(expenses that you pay each year as a percentage of the value of your investment)
Class 2
Management fees 0.58%
Distribution and service (12b-1) fees 0.25%
Other expenses 0.05%
Acquired fund fees and expenses1 0.01%
Total annual Fund operating expenses 0.89%
Fee waiver and/or expense reimbursement2 -0.01%
Total annual Fund operating expenses after fee waiver and/or expense reimbursement1,2 0.88%
1. Total annual Fund operating expenses differ from the ratio of expenses to average net assets shown in the Financial Highlights, which reflect the operating expenses of the Fund and do not include acquired fund fees and expenses.
2. The investment manager has contractually agreed in advance to reduce its fee as a result of the Fund’s investment in a Franklin Templeton money fund (acquired fund) for at least the next 12-month period. Contractual fee waiver and/or expense reimbursement agreements may not be changed or terminated during the time periods set forth above.
ExampleThis Example is intended to help you compare the cost of investing in the Fund with the cost of investing in other mutual funds. The Example assumes that you invest $10,000 in the Fund for the time periods indicated and then redeem all of your shares at the end of the period. The Example also assumes that your investment has a 5% return each year and that the Fund’s operating expenses remain the same. The Example reflects adjustments made to the Fund’s operating expenses due to the fee waivers and/or
expense reimbursements by management as described above for the 1 Year numbers only. Although your actual costs may be higher or lower, based on these assumptions your costs would be:
1 Year 3 Years 5 Years 10 Years
Class 2 $91 $286 $498 $1,107
Portfolio TurnoverThe Fund pays transaction costs, such as commissions, when it buys and sells securities (or “turns over” its portfolio). A higher portfolio turnover rate may indicate higher transaction costs. These costs, which are not reflected in annual Fund operating expenses or in the example, affect the Fund’s performance. During the most recent fiscal year, the Fund’s portfolio turnover rate was 85.85% of the average value of its portfolio.
Principal Investment StrategiesUnder normal market conditions, the Fund invests its assets primarily to predominantly in U.S. and foreign debt securities, including those in emerging markets. Debt securities include all varieties of fixed and floating rate income securities, including bonds, U.S. and foreign government and agency securities, corporate loans (and loan participations), mortgage-backed securities and other asset-backed securities, convertible securities and municipal securities. The Fund shifts its investments among various classes of debt securities and at any given time may have a substantial amount of its assets invested in any class of debt security.
The Fund may invest up to 100% of its assets in high yield, lower-quality debt securities (also known as “junk bonds”). The below-investment grade debt securities in which the Fund invests are generally rated at least Caa by Moody’s Investors Service (Moody’s) or CCC by Standard & Poor’s (S&P®) or are unrated securities the Fund’s investment manager determines are of comparable quality.
The Fund may also invest in many different securities issued or guaranteed by the U.S. government or by non-U.S. governments or their respective agencies or instrumentalities, including mortgage-backed securities and inflation-indexed securities issued by the U.S. Treasury.
181
S-181
S U M M A RY P RO S P E C T U S
3 - Franklin Strategic Income VIP Fund - Class 2
For purposes of pursuing its investment goals, the Fund regularly enters into various currency-related transactions involving derivative instruments, including currency and cross currency forwards, currency swaps, currency and currency index futures contracts and currency options. The Fund may also enter into interest rate and credit-related transactions involving derivative instruments, including interest rate, fixed income total return and credit default swaps and bond/interest rate futures contracts. The use of these derivative transactions may allow the Fund to obtain net long or net short exposures to selected currencies, interest rates, countries, durations or credit risks. These derivative instruments may be used for hedging purposes, to enhance Fund returns or to obtain exposure to various market sectors.
The Fund uses an active allocation strategy to try to achieve its investment goals. The investment manager uses a “top-down” analysis of macroeconomic trends combined with a “bottom-up” fundamental analysis of market sectors, industries, and issuers to try to take advantage of varying sector reactions to economic events.
Principal RisksYou could lose money by investing in the Fund. Mutual fund shares are not deposits or obligations of, or guaranteed or endorsed by, any bank, and are not insured by the Federal Deposit Insurance Corporation, the Federal Reserve Board, or any other agency of the U.S. government.
Credit An issuer of debt securities may fail to make interest payments or repay principal when due, in whole or in part. Changes in an issuer’s financial strength or in a security’s credit rating may affect a security’s value.
Interest Rate When interest rates rise, debt security prices generally fall. The opposite is also generally true: debt security prices rise when interest rates fall. Interest rate changes are influenced by a number of factors, including government policy, monetary policy, inflation expectations, perceptions of risk, and supply and demand of bonds. In general, securities with longer maturities or durations are more sensitive to these interest rate changes.
High-Yield Debt Securities Issuers of lower-rated or “high-yield” debt securities (also known as “junk bonds”) are not as strong financially as those issuing higher credit quality debt securities. High-yield debt securities are generally considered predominantly speculative by the applicable rating agencies as their issuers are more likely to encounter financial difficulties and are more vulnerable to changes in the relevant economy, such as a recession or a sustained period of rising interest rates, that could affect their ability to make interest and principal payments when due. The prices of high-yield debt securities generally fluctuate more than those of higher credit quality. High-yield debt securities are generally more illiquid (harder to sell) and harder to value.
Market The market values of securities or other investments owned by the Fund will go up or down, sometimes rapidly or unpredictably. The market value of a security or other investment may be reduced by market activity or other results of supply and demand unrelated to the issuer. This is a basic risk associated with all securities. When there are more sellers than buyers, prices tend to fall. Likewise, when there are more buyers than sellers, prices tend to rise.
Income Because the Fund can only distribute what it earns, the Fund’s distributions to shareholders may decline when prevailing interest rates fall or when the Fund experiences defaults on debt securities it holds.
Variable Rate Securities Because changes in interest rates on variable rate securities (including floating rate securities) may lag behind changes in market rates, the value of such securities may decline during periods of rising interest rates until their interest rates reset to market rates. During periods of declining interest rates, because the interest rates on variable rate securities generally reset downward, their market value is unlikely to rise to the same extent as the value of comparable fixed rate securities.
Foreign Securities Investing in foreign securities typically involves more risks than investing in U.S. securities, and includes risks associated with: internal and external political and economic developments – e.g., the political, economic and social policies and structures of some foreign countries may be less stable and more volatile than those in the U.S. or some foreign countries may be subject to trading restrictions or economic sanctions; trading practices –
182
S-182

S U M M A RY P RO S P E C T U S
4 - Franklin Strategic Income VIP Fund - Class 2
e.g., government supervision and regulation of foreign securities and currency markets, trading systems and brokers may be less than in the U.S.; availability of information – e.g., foreign issuers may not be subject to the same disclosure, accounting and financial reporting standards and practices as U.S. issuers; limited markets – e.g., the securities of certain foreign issuers may be less liquid (harder to sell) and more volatile; and currency exchange rate fluctuations and policies. The risks of foreign investments may be greater in developing or emerging market countries.
Sovereign Debt Securities Sovereign debt securities are subject to various risks in addition to those relating to debt securities and foreign securities generally, including, but not limited to, the risk that a governmental entity may be unwilling or unable to pay interest and repay principal on its sovereign debt, or otherwise meet its obligations when due because of cash flow problems, insufficient foreign reserves, the relative size of the debt service burden to the economy as a whole, the government’s policy towards principal international lenders such as the International Monetary Fund, or the political considerations to which the government may be subject. If a sovereign debtor defaults (or threatens to default) on its sovereign debt obligations, the indebtedness may be restructured. Some sovereign debtors have in the past been able to restructure their debt payments without the approval of some or all debt holders or to declare moratoria on payments. In the event of a default on sovereign debt, the Fund may also have limited legal recourse against the defaulting government entity.
Emerging Market Countries The Fund’s investments in emerging market countries are subject to all of the risks of foreign investing generally, and have additional heightened risks due to a lack of established legal, political, business and social frameworks to support securities markets, including: delays in settling portfolio securities transactions; currency and capital controls; greater sensitivity to interest rate changes; pervasiveness of corruption and crime; currency exchange rate volatility; and inflation, deflation or currency devaluation.
Mortgage-Backed and Asset-Backed Securities Mortgage-backed securities differ from conventional debt securities because principal is paid back periodically over the life of the security rather
than at maturity. The Fund may receive unscheduled payments of principal due to voluntary prepayments, refinancings or foreclosures on the underlying mortgage loans. Because of prepayments, mortgage-backed securities may be less effective than some other types of debt securities as a means of “locking in” long-term interest rates and may have less potential for capital appreciation during periods of falling interest rates. A reduction in the anticipated rate of principal prepayments, especially during periods of rising interest rates, may increase or extend the effective maturity of mortgage-backed securities, making them more sensitive to interest rate changes, subject to greater price volatility, and more susceptible than some other debt securities to a decline in market value when interest rates rise.
Issuers of asset-backed securities may have limited ability to enforce the security interest in the underlying assets, and credit enhancements provided to support the securities, if any, may be inadequate to protect investors in the event of default. Like mortgage-backed securities, asset-backed securities may be subject to prepayment and extension risks.
Floating Rate Corporate Investments Floating rate corporate loans and corporate debt securities generally have credit ratings below investment grade and may be subject to resale restrictions. They are often issued in connection with highly leveraged transactions, and may be subject to greater credit risks than other investments including the possibility of default or bankruptcy. A significant portion of floating rate investments may be “covenant lite” loans that may contain fewer or less restrictive constraints on the borrower or other borrower-friendly characteristics.
Derivative Instruments The performance of derivative instruments depends largely on the performance of an underlying instrument, such as a currency, security, interest rate or index, and such instruments often have risks similar to the underlying instrument, in addition to other risks. Derivatives involve costs and can create economic leverage in the Fund’s portfolio which may result in significant volatility and cause the Fund to participate in losses (as well as gains) in an amount that exceeds the Fund’s initial investment. Other risks include illiquidity, mispricing or improper valuation of the derivative instrument, and imperfect correlation between the value of the derivative and
183
S-183
S U M M A RY P RO S P E C T U S
5 - Franklin Strategic Income VIP Fund - Class 2
the underlying instrument so that the Fund may not realize the intended benefits. When a derivative is used for hedging, the change in value of the derivative may also not correlate specifically with the currency, security, interest rate, index or other risk being hedged. Derivatives also may present the risk that the other party to the transaction will fail to perform.
Currency Management Strategies Currency management strategies may substantially change the Fund’s exposure to currency exchange rates and could result in losses to the Fund if currencies do not perform as the investment manager expects. In addition, currency management strategies, to the extent that they reduce the Fund’s exposure to currency risks, may also reduce the Fund’s ability to benefit from favorable changes in currency exchange rates. Using currency management strategies for purposes other than hedging further increases the Fund’s exposure to foreign investment losses.
Currency markets generally are not as regulated as securities markets. In addition, currency rates may fluctuate significantly over short periods of time, and can reduce returns.
Liquidity From time to time, the trading market for a particular security or type of security in which the Fund invests may become less liquid or even illiquid. Reduced liquidity will have an adverse impact on the Fund’s ability to sell such securities when necessary to meet the Fund’s liquidity needs or in response to a specific economic event and will also generally lower the value of a security. Market prices for such securities may be volatile.
Management The Fund is subject to management risk because it is an actively managed investment portfolio. The Fund’s investment manager applies investment techniques and risk analyses in making investment decisions for the Fund, but there can be no guarantee that these decisions will produce the desired results.
184
S-184

S U M M A RY P RO S P E C T U S
6 - Franklin Strategic Income VIP Fund - Class 2
PerformanceThe following bar chart and table provide some indication of the risks of investing in the Fund. The bar chart shows changes in the Fund’s performance from year to year for Class 2 shares. The table shows how the Fund’s average annual returns for 1 year, 5 years, 10 years or since inception, as applicable, compare with those of a broad measure of market performance. The Fund’s past performance is not necessarily an indication of how the Fund will perform in the future.
The inclusion of the Lipper Multi-Sector Income Funds Classification Average shows how the Fund’s performance compares with the returns of an index of funds with similar investment objectives.
Performance reflects all Fund expenses but does not include any fees or sales charges imposed by variable insurance contracts, qualified plans or funds of funds. If they had been included, the returns shown below would be lower. Investors should consult the variable insurance contract prospectus, or the disclosure documents for qualified plans or funds of funds for more information.
Annual Total Returns
Best Quarter: Q2’09 9.65%
Worst Quarter: Q4’08 -5.96%
As of March 31, 2016, the Fund’s year-to-date return was 1.18%.
-3.87%1.86%3.32%
12.75%
2.57%
10.91%
25.75%
-11.24%
5.91%8.24%
2015201420132012201120102009200820072006Year
Average Annual Total ReturnsFor the periods ended December 31, 2015
1 Year 5 Years 10 Years
Franklin Strategic Income VIP Fund - Class 2 -3.87% 3.19% 5.20%
Barclays U.S. Aggregate Index (index reflects no deduction for fees, expenses or taxes) 0.55% 3.25% 4.51%
Lipper Multi-Sector Income Fund Average (index reflects no deduction for fees, expenses or taxes) -1.68% 3.46% 4.74%
No one index is representative of the Fund’s portfolio.
185
S-185

S U M M A RY P RO S P E C T U S
7 - Franklin Strategic Income VIP Fund - Class 2
Investment ManagerFranklin Advisers, Inc. (Advisers)
Portfolio ManagersChristopher J. Molumphy, CFAExecutive Vice President and Director of Advisers and portfolio manager of the Fund since inception (1999).Roger Bayston, CFASenior Vice President of Advisers and portfolio manager of the Fund since 2015.Patricia O’Connor, CFAVice President of Advisers and portfolio manager of the Fund since February 2016.
Purchase and Sale of Fund SharesShares of the Fund are sold to insurance companies’ separate accounts (Insurers) to fund variable annuity or variable life insurance contracts and to qualified plans. Insurance companies offer variable annuity and variable life insurance products through separate accounts. Shares of the Fund may also be sold to other mutual funds, either as underlying funds in a fund of funds or in other structures. In addition, Fund shares are held by a limited number of Insurers, qualified retirement plans and, when applicable, funds of funds. Substantial withdrawals by one or more Insurers, qualified retirement plans or funds of funds could reduce Fund assets, causing total Fund expenses to become higher than the numbers shown in the fees and expenses table above.
The terms of the offering of interests in separate accounts are included in the variable annuity or variable life insurance product prospectus. The terms of offerings of funds of funds are included in those funds’ prospectuses. The terms of offering of qualified
retirement plans are described in their disclosure documents. Investors should consult the variable contract prospectus, fund of fund prospectus, or plan disclosure documents for more information on fees and expenses imposed by variable insurance contracts, funds of funds or qualified retirement plans, respectively.
TaxesBecause shares of the Fund are generally purchased through variable annuity contracts or variable life insurance contracts, the Fund’s distributions (which the Fund expects, based on its investment goals and strategies to consist of ordinary income, capital gains or some combination of both) will be exempt from current taxation if left to accumulate within the variable contract. You should refer to your contract prospectus for more information on these tax consequences.
Payments to Sponsoring Insurance Companies and Other Financial IntermediariesThe Fund or its distributor (and related companies) may pay broker/dealers or other financial intermediaries (such as banks and insurance companies, or their related companies) for the sale and retention of variable contracts which offer Fund shares and/or for other services. These payments may create a conflict of interest for an intermediary or be a factor in the insurance company’s decision to include the Fund as an investment option in its variable contract. For more information, ask your financial advisor, visit your intermediary’s website, or consult the Contract prospectus or this Fund prospectus.
186
S-186

Investment Company Act file #811-05583
© 2016 Franklin Templeton Investments. All rights reserved. 780 PSUM 05/16
187
S-187

MAY 1, 2016
Before you invest, you may want to review the Fund’s prospectus, which contains more information about the
Fund and its risks. You can find the Fund’s prospectus, statement of additional information and other information
about the Fund online at franklintempleton.com/ftviptfunds. You can also get this information at no cost by calling
1-888-FRANKLIN or by sending an e-mail request to [email protected]. The Fund’s
prospectus and statement of additional information, both dated May 1, 2016, as may be amended from time to
time, are incorporated by reference into this Summary prospectus, which means that they are legally a part of this
Summary prospectus. Shares of the insurance funds of Franklin Templeton Variable Insurance Products Trust are
not offered to the public; they are offered and sold only to: (1) insurance company separate accounts to serve as the
underlying investment vehicles for variable contracts; (2) certain qualified plans; and (3) other mutual funds (fund
of funds). This Summary prospectus is not intended for use by other investors. Please check with your insurance
company for availability. Please read this Summary prospectus together with your variable annuity or variable life
insurance product prospectus.
SUMMARY PROSPECTUSFRANKLIN TEMPLETON VARIABLE INSURANCE PRODUCTS TRUST | CLASS 2
Franklin U.S. Government Securities VIP Fund
188
S-188

S U M M A RY P RO S P E C T U S
2 - Franklin U.S. Government Securities VIP Fund - Class 2
Investment GoalIncome.
Fees and Expenses of the FundThis table describes the fees and expenses that you may pay if you buy and hold shares of the Fund. The table and the example do not include any fees or sales charges imposed by variable insurance contracts, qualified retirement plans or funds of funds. If they were included, your costs would be higher.
Annual Fund Operating Expenses(expenses that you pay each year as a percentage of the value of your investment)
Class 2
Management fees 0.47%
Distribution and service (12b-1) fees 0.25%
Other expenses 0.03%
Total annual Fund operating expenses 0.75%
ExampleThis Example is intended to help you compare the cost of investing in the Fund with the cost of investing in other mutual funds. The Example assumes that you invest $10,000 in the Fund for the time periods indicated and then redeem all of your shares at the end of the period. The Example also assumes that your investment has a 5% return each year and that the Fund’s operating expenses remain the same. Although your actual costs may be higher or lower, based on these assumptions your costs would be:
1 Year 3 Years 5 Years 10 Years
Class 2 $77 $240 $417 $930
Portfolio TurnoverThe Fund pays transaction costs, such as commissions, when it buys and sells securities (or “turns over” its portfolio). A higher portfolio turnover rate may indicate higher transaction costs. These costs, which are not reflected in annual Fund operating expenses or in the example, affect the Fund’s performance. During the most recent fiscal year, the Fund’s portfolio turnover rate was 61.91% of the average value of its portfolio.
Principal Investment StrategiesUnder normal market conditions, the Fund invests at least 80% of its net assets in U.S. government securities. The Fund invests primarily to predominantly in fixed rate and variable rate mortgage-backed securities, a significant to substantial amount of which is in securities issued by the Government National Mortgage Association (Ginnie Maes). Ginnie Maes represent an ownership interest in mortgage loans pooled together for sale to investors to finance purchases of homes. The mortgage loans may have either fixed or adjustable interest rates. As the underlying mortgage loans are paid off, Ginnie Maes provide investors with monthly payments of interest and principal as well as any unscheduled prepayments on the underlying mortgage loans.
Ginnie Maes carry a guarantee as to the timely repayment of principal and interest that is backed by the full faith and credit of the U.S. government. The full faith and credit guarantee does not apply to the market prices and yields of the Ginnie Maes or to the net asset value or performance of the Fund, which will vary with changes in interest rates and other market conditions.
The Fund may also invest in mortgage-backed and other securities issued or guaranteed by the Federal National Mortgage Association (Fannie Mae) or the Federal Home Loan Mortgage Corporation (Freddie Mac). Securities issued or guaranteed by Fannie Mae and Freddie Mac are not backed by the full faith and credit of the U.S. government, but rather are generally supported only by the creditworthiness of the issuer.
The Fund may invest in U.S. Treasury STRIPS, bills, bonds and notes.
Government agency or instrumentality issues have different levels of credit support. Ginnie Mae pass-through mortgage certificates are backed by the full faith and credit of the U.S. government. U.S. government-sponsored entities, such as Fannie Mae and Freddie Mac, may be chartered by Acts of Congress, but their securities are neither issued nor guaranteed by the U.S. government. Although the U.S. government has provided financial support to Fannie Mae and Freddie Mac, no assurance can be given that the U.S. government will continue to do so. Accordingly, securities issued by Fannie Mae
189
S-189

S U M M A RY P RO S P E C T U S
3 - Franklin U.S. Government Securities VIP Fund - Class 2
and Freddie Mac may involve a risk of non-payment of principal and interest. Investors should remember that guarantees of timely prepayment of principal and interest do not apply to the market prices and yields of the securities or to the net asset value or performance of the Fund, which will vary with changes in interest rates and other market conditions.
The Fund may also invest in other U.S. government securities, which may or may not be backed by the full faith and credit of the U.S. government.
Principal RisksYou could lose money by investing in the Fund. Mutual fund shares are not deposits or obligations of, or guaranteed or endorsed by, any bank, and are not insured by the Federal Deposit Insurance Corporation, the Federal Reserve Board, or any other agency of the U.S. government.
Interest Rate When interest rates rise, debt security prices generally fall. The opposite is also generally true: debt security prices rise when interest rates fall. Interest rate changes are influenced by a number of factors, including government policy, monetary policy, inflation expectations, perceptions of risk, and supply and demand of bonds. In general, securities with longer maturities or durations are more sensitive to these interest rate changes.
Prepayment Prepayment risk occurs when a debt security can be repaid in whole or in part prior to the security’s maturity and the Fund must reinvest the proceeds it receives, during periods of declining interest rates, in securities that pay a lower rate of interest. Also, if a security has been purchased at a premium, the value of the premium would be lost in the event of prepayment. Prepayments generally increase when interest rates fall.
Mortgage-Backed Securities Mortgage-backed securities differ from conventional debt securities because principal is paid back periodically over the life of the security rather than at maturity. The Fund may receive unscheduled payments of principal due to voluntary prepayments, refinancings or foreclosures
on the underlying mortgage loans. Because of prepayments, mortgage-backed securities may be less effective than some other types of debt securities as a means of “locking in” long-term interest rates and may have less potential for capital appreciation during periods of falling interest rates. A reduction in the anticipated rate of principal prepayments, especially during periods of rising interest rates, may increase or extend the effective maturity of mortgage-backed securities, making them more sensitive to interest rate changes, subject to greater price volatility, and more susceptible than some other debt securities to a decline in market value when interest rates rise.
Income Because the Fund can only distribute what it earns, the Fund’s distributions to shareholders may decline when prevailing interest rates fall or when the Fund experiences defaults on debt securities it holds.
Credit An issuer of debt securities may fail to make interest payments and repay principal when due, in whole or in part. Changes in an issuer’s financial strength or in a security’s credit rating may affect a security’s value. While securities issued by Ginnie Mae are backed by the full faith and credit of the U.S. government, not all securities of the various U.S. government agencies are, including those of Fannie Mae and Freddie Mac. Accordingly, securities issued by Fannie Mae and Freddie Mac may involve a risk of non-payment of principal and interest.
Management The Fund is subject to management risk because it is an actively managed investment portfolio. The Fund’s investment manager applies investment techniques and risk analyses in making investment decisions for the Fund, but there can be no guarantee that these decisions will produce the desired results.
Market The market values of securities or other investments owned by the Fund will go up or down, sometimes rapidly or unpredictably. The market value of a security or other investment may be reduced by market activity or other results of supply and demand unrelated to the issuer. This is a basic risk associated with all securities. When there are more sellers than buyers, prices tend to fall. Likewise, when there are more buyers than sellers, prices tend to rise.
190
S-190

S U M M A RY P RO S P E C T U S
4 - Franklin U.S. Government Securities VIP Fund - Class 2
PerformanceThe following bar chart and table provide some indication of the risks of investing in the Fund. The bar chart shows changes in the Fund’s performance from year to year for Class 2 shares. The table shows how the Fund’s average annual returns for 1 year, 5 years, 10 years or since inception, as applicable, compare with those of a broad measure of market performance. The Fund’s past performance is not necessarily an indication of how the Fund will perform in the future.
The inclusion of the Lipper VIP General U.S. Government Funds Classification Average shows how the Fund’s performance compares with the returns of an index of funds with similar investment objectives.
Performance reflects all Fund expenses but does not include any fees or sales charges imposed by variable insurance contracts, qualified plans or funds of funds. If they had been included, the returns shown below would be lower. Investors should consult the variable insurance contract prospectus, or the disclosure documents for qualified plans or funds of funds for more information.
Annual Total Returns
Best Quarter: Q4’08 4.42%
Worst Quarter: Q2’13 -2.25%
As of March 31, 2016, the Fund’s year-to-date return was 1.44%.
0.47%3.38%
-2.24%1.89%
5.68%5.28%3.09%
7.59%6.61%4.02%
2015201420132012201120102009200820072006Year
Average Annual Total ReturnsFor the periods ended December 31, 2015
1 Year 5 Years 10 Years
Franklin U.S. Government Securities VIP Fund - Class 2 0.47% 1.80% 3.54%
Barclays U.S. Government Index: Intermediate Component (index reflects no deduction for fees, expenses or taxes) 1.18% 2.03% 3.71%
Lipper VIP General U.S. Government Funds Classification Average (index reflects no deduction for fees, expenses or taxes) 0.07% 2.85% 3.86%
No one index is representative of the Fund’s portfolio.
191
S-191

S U M M A RY P RO S P E C T U S
5 - Franklin U.S. Government Securities VIP Fund - Class 2
Investment ManagerFranklin Advisers, Inc. (Advisers)
Portfolio ManagersPaul VarunokPortfolio Manager of Advisers and portfolio manager of the Fund since 2004.Patrick Klein, Ph.D.Research Analyst of Advisers and portfolio manager of the Fund since 2010.
Purchase and Sale of Fund SharesShares of the Fund are sold to insurance companies’ separate accounts (Insurers) to fund variable annuity or variable life insurance contracts and to qualified plans. Insurance companies offer variable annuity and variable life insurance products through separate accounts. Shares of the Fund may also be sold to other mutual funds, either as underlying funds in a fund of funds or in other structures. In addition, Fund shares are held by a limited number of Insurers, qualified retirement plans and, when applicable, funds of funds. Substantial withdrawals by one or more Insurers, qualified retirement plans or funds of funds could reduce Fund assets, causing total Fund expenses to become higher than the numbers shown in the fees and expenses table above.
The terms of the offering of interests in separate accounts are included in the variable annuity or variable life insurance product prospectus. The terms of offerings of funds of funds are included in those funds’ prospectuses. The terms of offering of qualified retirement plans are described in their disclosure
documents. Investors should consult the variable contract prospectus, fund of fund prospectus, or plan disclosure documents for more information on fees and expenses imposed by variable insurance contracts, funds of funds or qualified retirement plans, respectively.
TaxesBecause shares of the Fund are generally purchased through variable annuity contracts or variable life insurance contracts, the Fund’s distributions (which the Fund expects, based on its investment goals and strategies to consist of primarily ordinary income) will be exempt from current taxation if left to accumulate within the variable contract. You should refer to your contract prospectus for more information on these tax consequences.
Payments to Sponsoring Insurance Companies and Other Financial IntermediariesThe Fund or its distributor (and related companies) may pay broker/dealers or other financial intermediaries (such as banks and insurance companies, or their related companies) for the sale and retention of variable contracts which offer Fund shares and/or for other services. These payments may create a conflict of interest for an intermediary or be a factor in the insurance company’s decision to include the Fund as an investment option in its variable contract. For more information, ask your financial advisor, visit your intermediary’s website, or consult the Contract prospectus or this Fund prospectus.
192
S-192

Investment Company Act file #811-05583
© 2016 Franklin Templeton Investments. All rights reserved. 782 PSUM 05/16
193
S-193

Summary Prospectus April 29, 2016
Invesco V.I. American Franchise Fund
Series II shares
Before you invest, you may want to review the Fund’s prospectus, which contains more information about the Fund and its risks. You can find theFund’s prospectus and other information about the Fund online at www.invesco.com/prospectus. You can also get this information at no cost bycalling (800) 959-4246 or by sending an e-mail request to [email protected]. The Fund’s prospectus and statement of additionalinformation, both dated April 29, 2016 (as each may be amended or supplemented), are incorporated by reference into this Summary Prospectusand may be obtained, free of charge, at the Web site, phone number or e-mail address noted above.
Investment Objective(s)The Fund’s investment objective is to seek capital growth.
Fees and Expenses of the FundThis table describes the fees and expenses that are incurred, directly orindirectly, when a variable product owner buys, holds, or redeems interest inan insurance company separate account that invests in the Series II sharesof the Fund but does not represent the effect of any fees or other expensesassessed in connection with your variable product, and if it did, expenseswould be higher.
Shareholder Fees (fees paid directly from your investment)
Series II sharesMaximum Sales Charge (Load) Imposed on Purchases (as a percentage ofoffering price) None............................................................................................................................................Maximum Deferred Sales Charge (Load) (as a percentage of originalpurchase price or redemption proceeds, whichever is less) None............................................................................................................................................
Annual Fund Operating Expenses (expenses that you pay each year as a percentage of thevalue of your investment)
Series II sharesManagement Fees 0.67%............................................................................................................................................Distribution and/or Service (12b-1) Fees 0.25............................................................................................................................................Other Expenses 0.29............................................................................................................................................Total Annual Fund Operating Expenses 1.21............................................................................................................................................
Example. This Example is intended to help you compare the cost ofinvesting in the Fund with the cost of investing in other mutual funds.
This Example does not represent the effect of any fees or expensesassessed in connection with your variable product, and if it did, expenseswould be higher.
The Example assumes that you invest $10,000 in the Fund for the timeperiods indicated and then redeem all of your shares at the end of thoseperiods. The Example also assumes that your investment has a 5% returneach year and that the Fund’s operating expenses remain the same.
Although your actual costs may be higher or lower, based on theseassumptions, your costs would be:
1 Year 3 Years 5 Years 10 YearsSeries II shares $123 $384 $665 $1,466............................................................................................................................................
Portfolio Turnover. The Fund pays transaction costs, such ascommissions, when it buys and sells securities (or “turns over” its portfolio).
A higher portfolio turnover rate may indicate higher transaction costs. Thesecosts, which are not reflected in annual Fund operating expenses or in theexample, affect the Fund’s performance. During the most recent fiscal year,the Fund’s portfolio turnover rate was 68% of the average value of itsportfolio.
Principal Investment Strategies of the FundThe Fund invests, under normal circumstances, at least 80% of its netassets (plus any borrowings for investment purposes) in securities ofU.S. issuers. The Fund deems an issuer to be a U.S. issuer if (i) its principalsecurities trading market (i.e., a U.S. stock exchange, NASDAQ orover-the-counter markets) is in the U.S.; (ii) alone or on a consolidated basisit derives 50% or more of its annual revenue from either goods produced,sales made or services performed in the U.S.; or (iii) it is organized underthe laws of, or has a principal office in the U.S. The Fund invests primarily inequity securities of mid- and large- capitalization issuers. The principal typeof equity security in which the Fund invests is common stock.
The Fund invests primarily in securities that are considered by theFund’s portfolio managers to have potential for earnings or revenue growth.
The Fund may invest up to 20% of its net assets in securities of foreignissuers.
The Fund’s investment adviser, Invesco Advisers, Inc. (Invesco or theAdviser), uses a bottom-up stock selection process designed to seek alpha(return on investments in excess of the Russell 1000® Growth Index), aswell as a disciplined portfolio construction process designed to manage risk.The Adviser uses a holistic approach that closely examines companyfundamentals, including detailed modeling of a company’s financialstatements and discussions with company management teams, suppliers,distributors, competitors, and customers. The Adviser uses a variety ofvaluation techniques based on the company in question, the industry inwhich the company operates, the stage of the company’s business cycle,and other factors that best reflect a company’s value. The Adviser seeks toinvest in companies with attractive growth outlooks at compelling valuationlevels, including both stable and catalyst-driven growth opportunities.
The Adviser considers whether to sell a particular security when acompany hits the price target, a company’s fundamentals deteriorate or thecatalysts for growth are no longer present or reflected in the stock price.
Principal Risks of Investing in the FundAs with any mutual fund investment, loss of money is a risk of investing. Aninvestment in the Fund is not a deposit in a bank and is not insured orguaranteed by the Federal Deposit Insurance Corporation or any othergovernmental agency. The risks associated with an investment in the Fund
1 Invesco V.I. American Franchise Fund invesco.com/us VK-VIAMFR-SUMPRO-2
194
S-194

75%
50%
25%
0%
-25%
-50%’06 ’07 ’08 ’09 ’10 ’11 ’12 ’13 ’14 ’15
2.62% 16.64% (49.11)% 65.64% 19.57% (6.39)% 13.40% 39.79% 8.17% 4.75%
can increase during times of significant market volatility. The principal risksof investing in the Fund are:
Foreign Securities Risk. The Fund’s foreign investments may beadversely affected by political and social instability, changes in economic ortaxation policies, difficulty in enforcing obligations, decreased liquidity orincreased volatility. Foreign investments also involve the risk of the possibleseizure, nationalization or expropriation of the issuer or foreign deposits (inwhich the Fund could lose its entire investments in a certain market) andthe possible adoption of foreign governmental restrictions such as exchangecontrols. Unless the Fund has hedged its foreign securities risk, foreignsecurities risk also involves the risk of negative foreign currency ratefluctuations, which may cause the value of securities denominated in suchforeign currency (or other instruments through which the Fund has exposureto foreign currencies) to decline in value. Currency exchange rates mayfluctuate significantly over short periods of time. Currency hedgingstrategies, if used, are not always successful.
Growth Investing Risk. Growth stocks tend to be more expensive relativeto the issuing company’s earnings or assets compared with other types ofstock. As a result, they tend to be more sensitive to changes in, or investors’expectations of, the issuing company’s earnings and can be more volatile.
Management Risk. The Fund is actively managed and depends heavilyon the Adviser’s judgment about markets, interest rates or theattractiveness, relative values, liquidity, or potential appreciation of particularinvestments made for the Fund’s portfolio. The Fund could experiencelosses if these judgments prove to be incorrect. Additionally, legislative,regulatory, or tax developments may adversely affect management of theFund and, therefore, the ability of the Fund to achieve its investmentobjective.
Market Risk. The market values of the Fund’s investments, andtherefore the value of the Fund’s shares, will go up and down, sometimesrapidly or unpredictably. Market risk may affect a single issuer, industry orsection of the economy, or it may affect the market as a whole. Individualstock prices tend to go up and down more dramatically than those of certainother types of investments, such as bonds. During a general downturn in thefinancial markets, multiple asset classes may decline in value. Whenmarkets perform well, there can be no assurance that specific investmentsheld by the Fund will rise in value.
Mid-Capitalization Companies Risk. Mid-capitalization companies tendto be more vulnerable to changing market conditions and may have morelimited product lines and markets, less experienced management and fewerfinancial resources than larger companies. These companies’ securities maybe more volatile and less liquid than those of more established companies,and their returns may vary, sometimes significantly, from the overallsecurities market.
Sector Focus Risk. The Fund may from time to time invest a significantamount of its assets (i.e. over 25%) in one market sector or group of relatedindustries. In this event, the Fund’s performance will depend to a greaterextent on the overall condition of the sector or group of industries and thereis increased risk that the Fund will lose significant value if conditionsadversely affect that sector or group of industries.
Performance InformationThe bar chart and performance table provide an indication of the risks ofinvesting in the Fund. The bar chart shows changes in the performance ofthe Fund from year to year as of December 31. The performance tablecompares the Fund’s and the Van Kampen Life Investment Trust CapitalGrowth Portfolio’s (the predecessor fund) performance to that of abroad-based securities market benchmark, a style specific benchmark anda peer group benchmark comprised of funds with investment objectives andstrategies similar to those of the Fund. For more information on thebenchmarks used see the “Benchmark Descriptions” section in theprospectus. The bar chart and performance table below do not reflectcharges assessed in connection with your variable product; if they did, the
performance shown would be lower. The Fund’s and the predecessor fund’spast performance is not necessarily an indication of its future performance.
The returns shown prior to June 1, 2010 are those of the Class IIshares of the predecessor fund, which are not offered by the Fund. Thepredecessor fund was advised by Van Kampen Asset Management. Thepredecessor fund was reorganized into Series II shares of the Fund onJune 1, 2010. Series II shares’ returns will be different from thepredecessor fund as they have different expenses.
All performance shown assumes the reinvestment of dividends andcapital gains and the effect of the Fund’s expenses.
Series I shares are not offered by this prospectus. The Series I sharesand Series II shares invest in the same portfolio of securities and will havesubstantially similar performance, except to the extent that the expensesborne by each share class differ. Series II shares have higher expenses (andtherefore lower performance) resulting from its Rule 12b-1 plan, whichprovides for a maximum fee equal to an annual rate of 0.25% (expressed asa percentage of average daily net assets of the Fund).
Annual Total Returns
Best Quarter (ended September 30, 2009): 21.01%Worst Quarter (ended December 31, 2008): -29.10%
Average Annual Total Returns (for the periods ended December 31, 2015)
1Year
5Years
10Years
Series II shares: Inception (9/18/2000) 4.75% 10.95% 7.33%............................................................................................................................................S&P 500® Index (reflects no deductions for fees, expenses or taxes) 1.38 12.57 7.31............................................................................................................................................Russell 1000® Growth Index (reflects no deductions for fees,
expenses or taxes) 5.67 13.53 8.53............................................................................................................................................Lipper VUF Large-Cap Growth Funds Index 7.52 12.62 7.51............................................................................................................................................
Management of the FundInvestment Adviser: Invesco Advisers, Inc.
Portfolio Managers Title Length of Service on the FundErik Voss Portfolio Manager (lead) 2010............................................................................................................................................Ido Cohen Portfolio Manager 2010............................................................................................................................................
Purchase and Sale of Fund SharesYou cannot purchase or sell (redeem) shares of the Fund directly. Pleasecontact the insurance company that issued your variable product for moreinformation on the purchase and sale of Fund shares. For more information,see “Other Information—Purchase and Redemption of Shares” in theprospectus.
Tax InformationThe Fund expects, based on its investment objective and strategies, that itsdistributions, if any, will consist of ordinary income, capital gains, or somecombination of both. Because shares of the Fund must be purchasedthrough variable products, such distributions will be exempt from currenttaxation if left to accumulate within the variable product. Consult yourvariable insurance contract prospectus for additional tax information.
Payments to Insurance CompaniesIf you purchase the Fund through an insurance company or other financialintermediary, the Fund and the Fund’s distributor or its related companiesmay pay the intermediary for the sale of Fund shares and related services.
2 Invesco V.I. American Franchise Fund invesco.com/us VK-VIAMFR-SUMPRO-2
195
S-195

These payments may create a conflict of interest by influencing theinsurance company or other intermediary and your salesperson or financialadviser to recommend the Fund over another investment. Ask yoursalesperson or financial adviser or visit your financial intermediary’s Website for more information.
3 Invesco V.I. American Franchise Fund invesco.com/us VK-VIAMFR-SUMPRO-2
196
S-196

Summary Prospectus April 29, 2016
Invesco V.I. American Value Fund
Series I shares
Before you invest, you may want to review the Fund’s prospectus, which contains more information about the Fund and its risks. You can find theFund’s prospectus and other information about the Fund online at www.invesco.com/prospectus. You can also get this information at no cost bycalling (800) 959-4246 or by sending an e-mail request to [email protected]. The Fund’s prospectus and statement of additionalinformation, both dated April 29, 2016 (as each may be amended or supplemented), are incorporated by reference into this Summary Prospectusand may be obtained, free of charge, at the Web site, phone number or e-mail address noted above.
Investment Objective(s)The Fund’s investment objective is to provide above-average total returnover a market cycle of three to five years by investing in common stocksand other equity securities.
Fees and Expenses of the FundThis table describes the fees and expenses that are incurred, directly orindirectly, when a variable product owner buys, holds, or redeems interest inan insurance company separate account that invests in the Series I sharesof the Fund but does not represent the effect of any fees or other expensesassessed in connection with your variable product, and if it did, expenseswould be higher.
Shareholder Fees (fees paid directly from your investment)
Series I sharesMaximum Sales Charge (Load) Imposed on Purchases (as a percentage ofoffering price) None............................................................................................................................................Maximum Deferred Sales Charge (Load) (as a percentage of originalpurchase price or redemption proceeds, whichever is less) None............................................................................................................................................
Annual Fund Operating Expenses (expenses that you pay each year as a percentage of thevalue of your investment)
Series I sharesManagement Fees 0.72%............................................................................................................................................Distribution and/or Service (12b-1) Fees None............................................................................................................................................Other Expenses 0.27............................................................................................................................................Acquired Fund Fees and Expenses 0.11............................................................................................................................................Total Annual Fund Operating Expenses 1.10............................................................................................................................................
Example. This Example is intended to help you compare the cost ofinvesting in the Fund with the cost of investing in other mutual funds.
This Example does not represent the effect of any fees or expensesassessed in connection with your variable product, and if it did, expenseswould be higher.
The Example assumes that you invest $10,000 in the Fund for the timeperiods indicated and then redeem all of your shares at the end of thoseperiods. The Example also assumes that your investment has a 5% returneach year and that the Fund’s operating expenses remain the same.
Although your actual costs may be higher or lower, based on theseassumptions, your costs would be:
1 Year 3 Years 5 Years 10 YearsSeries I shares $112 $350 $606 $1,340............................................................................................................................................
Portfolio Turnover. The Fund pays transaction costs, such ascommissions, when it buys and sells securities (or “turns over” its portfolio).A higher portfolio turnover rate may indicate higher transaction costs. Thesecosts, which are not reflected in annual Fund operating expenses or in theexample, affect the Fund’s performance. During the most recent fiscal year,the Fund’s portfolio turnover rate was 26% of the average value of theportfolio.
Principal Investment Strategies of the FundThe Fund invests, under normal circumstances, at least 80% of its netassets (plus any borrowings for investment purposes) in securities of U.S.issuers and in derivatives and other instruments that have economiccharacteristics similar to such securities. The Fund deems an issuer to be aU.S. issuer if (i) its principal securities trading market (i.e., a U.S. stockexchange, NASDAQ or over-the-counter markets) is in the U.S.; (ii) alone oron a consolidated basis it derives 50% or more of its annual revenue fromgoods produced, sales made or services performed in the U.S.; or (iii) it isorganized under the laws of, or has a principal office in the U.S.
Under normal market conditions, the Fund invests at least 65% of itsnet assets in equity securities of small- to mid-capitalization companies. Theprincipal type of equity security in which the Fund invests is common stock.The Fund also may invest in larger companies.
The Fund may invest up to 20% of its net assets in real estateinvestment trusts (REITs).
The Fund may invest up to 20% of its net assets in securities of foreignissuers and depositary receipts.
The Fund can invest in derivative instruments, including forward foreigncurrency contracts, futures contracts and options.
The Fund can use forward foreign currency contracts to hedge againstadverse movements in the foreign currencies in which portfolio securitiesare denominated.
The Fund can use futures contracts, including index futures, to seekexposure to certain asset classes.
The Fund can use options to seek alpha (return on investments inexcess of the Russell Midcap® Value Index) or to mitigate risk and to hedgeagainst adverse movements in the foreign currencies in which portfoliosecurities are denominated.
1 Invesco V.I. American Value Fund invesco.com/us VK-VIAMVA-SUMPRO-1
197
S-197

The Fund emphasizes a value style of investing. Invesco Advisers, Inc.(Invesco or the Adviser), the Fund’s investment adviser, seeks attractivelyvalued companies experiencing a change that could have a positive impacton a company’s outlook. In selecting securities, the Adviser focuses oncompanies that it believes possess characteristics for improved valuation.The Adviser looks for catalysts for change that may positively impact acompany, such as improved operational efficiency, new management, anindustry development or regulatory change. The aim is to uncover thesecatalysts for change, and then benefit from potential stock priceappreciation as a result of the change taking place at the company.
The Adviser will consider selling a security if it reaches the Adviser’sestimate of fair value or if a more attractive investment opportunity isidentified.
Principal Risks of Investing in the FundAs with any mutual fund investment, loss of money is a risk of investing. Aninvestment in the Fund is not a deposit in a bank and is not insured orguaranteed by the Federal Deposit Insurance Corporation or any othergovernmental agency. The risks associated with an investment in the Fundcan increase during times of significant market volatility. The principal risksof investing in the Fund are:
Depositary Receipts Risk. Investing in depositary receipts involves thesame risks as direct investments in foreign securities. In addition, theunderlying issuers of certain depositary receipts are under no obligation todistribute shareholder communications or pass through any voting rightswith respect to the deposited securities to the holders of such receipts. TheFund may therefore receive less timely information or have less control thanif it invested directly in the foreign issuer.
Derivatives Risk. The value of a derivative instrument depends largely on(and is derived from) the value of an underlying security, currency,commodity, interest rate, index or other asset (each referred to as anunderlying asset). In addition to risks relating to the underlying assets, theuse of derivatives may include other, possibly greater, risks, includingcounterparty, leverage and liquidity risks. Counterparty risk is the risk thatthe counterparty to the derivative contract will default on its obligation to paythe Fund the amount owed or otherwise perform under the derivativecontract. Derivatives create leverage risk because they do not requirepayment up front equal to the economic exposure created by owning thederivative. As a result, an adverse change in the value of the underlyingasset could result in the Fund sustaining a loss that is substantially greaterthan the amount invested in the derivative, which may make the Fund’sreturns more volatile and increase the risk of loss. Derivative instrumentsmay also be less liquid than more traditional investments and the Fund maybe unable to sell or close out its derivative positions at a desirable time orprice. This risk may be more acute under adverse market conditions, duringwhich the Fund may be most in need of liquidating its derivative positions.Derivatives may also be harder to value, less tax efficient and subject tochanging government regulation that could impact the Fund’s ability to usecertain derivatives or their cost. Also, derivatives used for hedging or to gainor limit exposure to a particular market segment may not provide theexpected benefits, particularly during adverse market conditions.
Foreign Securities Risk. The Fund’s foreign investments may beadversely affected by political and social instability, changes in economic ortaxation policies, difficulty in enforcing obligations, decreased liquidity orincreased volatility. Foreign investments also involve the risk of the possibleseizure, nationalization or expropriation of the issuer or foreign deposits (inwhich the Fund could lose its entire investments in a certain market) andthe possible adoption of foreign governmental restrictions such as exchangecontrols. Unless the Fund has hedged its foreign securities risk, foreignsecurities risk also involves the risk of negative foreign currency ratefluctuations, which may cause the value of securities denominated in suchforeign currency (or other instruments through which the Fund has exposureto foreign currencies) to decline in value. Currency exchange rates may
fluctuate significantly over short periods of time. Currency hedgingstrategies, if used, are not always successful.
Management Risk. The Fund is actively managed and depends heavilyon the Adviser’s judgment about markets, interest rates or theattractiveness, relative values, liquidity, or potential appreciation of particularinvestments made for the Fund’s portfolio. The Fund could experiencelosses if these judgments prove to be incorrect. Additionally, legislative,regulatory, or tax developments may adversely affect management of theFund and, therefore, the ability of the Fund to achieve its investmentobjective.
Market Risk. The market values of the Fund’s investments, andtherefore the value of the Fund’s shares, will go up and down, sometimesrapidly or unpredictably. Market risk may affect a single issuer, industry orsection of the economy, or it may affect the market as a whole. Individualstock prices tend to go up and down more dramatically than those of certainother types of investments, such as bonds. During a general downturn in thefinancial markets, multiple asset classes may decline in value. Whenmarkets perform well, there can be no assurance that specific investmentsheld by the Fund will rise in value.
REIT Risk/Real Estate Risk. Investments in real estate relatedinstruments may be affected by economic, legal, cultural, environmental ortechnological factors that affect property values, rents or occupancies ofreal estate related to the Fund’s holdings. Shares of real estate relatedcompanies, which tend to be small- and mid-cap companies, may be morevolatile and less liquid.
Sector Focus Risk. The Fund may from time to time invest a significantamount of its assets (i.e. over 25%) in one market sector or group of relatedindustries. In this event, the Fund’s performance will depend to a greaterextent on the overall condition of the sector or group of industries and thereis increased risk that the Fund will lose significant value if conditionsadversely affect that sector or group of industries.
Small- and Mid-Capitalization Companies Risks. Small- andmid-capitalization companies tend to be more vulnerable to changingmarket conditions, may have little or no operating history or track record ofsuccess, and may have more limited product lines and markets, lessexperienced management and fewer financial resources than largercompanies. These companies’ securities may be more volatile and lessliquid than those of more established companies, and their returns mayvary, sometimes significantly, from the overall securities market.
Value Investing Style Risk. A value investing style subjects the Fund tothe risk that the valuations never improve or that the returns on value equitysecurities are less than returns on other styles of investing or the overallstock market.
Performance InformationThe bar chart and performance table provide an indication of the risks ofinvesting in the Fund. The bar chart shows changes in the performance ofthe Fund from year to year as of December 31. The performance tablecompares the Fund’s and The Universal Institutional Funds, Inc. U.S. MidCap Value Portfolio’s (the predecessor fund) performance to that of a stylespecific benchmark, a peer group benchmark comprised of funds withinvestment objectives and strategies similar to those of the Fund and abroad-based securities market benchmark. For more information on thebenchmarks used see the “Benchmark Descriptions” section in theprospectus. The bar chart and performance table below do not reflectcharges assessed in connection with your variable product; if they did, theperformance shown would be lower. The Fund’s and the predecessor fund’spast performance is not necessarily an indication of its future performance.
The returns shown prior to June 1, 2010 are those of the Class I sharesof the predecessor fund, which are not offered by the Fund. Thepredecessor fund was advised by Morgan Stanley Investment ManagementInc. The predecessor fund was reorganized into Series I shares of the Fundon June 1, 2010. Series I shares’ returns will be different from thepredecessor fund as they have different expenses.
2 Invesco V.I. American Value Fund invesco.com/us VK-VIAMVA-SUMPRO-1
198
S-198

40%
20%
0%
-20%
-40%
-60%’06 ’07 ’08 ’09 ’10 ’11 ’12 ’13 ’14 ’15
20.70% 7.85% (41.29)% 39.21% 22.24% 0.92% 17.31% 34.27% 9.75% (9.13)%
All performance shown assumes the reinvestment of dividends andcapital gains and the effect of the Fund’s expenses.
Annual Total Returns
Best Quarter (ended September 30, 2009): 23.70%Worst Quarter (ended December 31, 2008): -28.40%
Average Annual Total Returns (for the periods ended December 31, 2015)
1Year
5Years
10Years
Series I shares: Inception (1/2/1997) -9.13% 9.65% 7.50%............................................................................................................................................Russell Midcap® Value Index (reflects no deductions for fees,
expenses or taxes) -4.78 11.25 7.61............................................................................................................................................Lipper VUF Mid-Cap Value Funds Index -4.84 9.62 6.39............................................................................................................................................S&P 500® Index (reflects no deductions for fees, expenses or taxes) 1.38 12.57 7.31............................................................................................................................................
Management of the FundInvestment Adviser: Invesco Advisers, Inc.
Portfolio Managers Title Length of Service on the FundThomas R. Copper Portfolio Manager (co-lead) 2010 (predecessor fund 2005)............................................................................................................................................John Mazanec Portfolio Manager (co-lead) 2010 (predecessor fund 2008)............................................................................................................................................Sergio Marcheli Portfolio Manager 2010 (predecessor fund 2003)............................................................................................................................................
Purchase and Sale of Fund SharesYou cannot purchase or sell (redeem) shares of the Fund directly. Pleasecontact the insurance company that issued your variable product for moreinformation on the purchase and sale of Fund shares. For more information,see “Other Information—Purchase and Redemption of Shares” in theprospectus.
Tax InformationThe Fund expects, based on its investment objective and strategies, that itsdistributions, if any, will consist of ordinary income, capital gains, or somecombination of both. Because shares of the Fund must be purchasedthrough variable products, such distributions will be exempt from currenttaxation if left to accumulate within the variable product. Consult yourvariable insurance contract prospectus for additional tax information.
Payments to Insurance CompaniesIf you purchase the Fund through an insurance company or other financialintermediary, the Fund and the Fund’s distributor or its related companiesmay pay the intermediary for the sale of Fund shares and related services.These payments may create a conflict of interest by influencing theinsurance company or other intermediary and your salesperson or financialadviser to recommend the Fund over another investment. Ask yoursalesperson or financial adviser or visit your financial intermediary’s Website for more information.
3 Invesco V.I. American Value Fund invesco.com/us VK-VIAMVA-SUMPRO-1
199
S-199
Summary Prospectus April 29, 2016
Invesco V.I. Core Equity Fund
Series II shares
Before you invest, you may want to review the Fund’s prospectus, which contains more information about the Fund and its risks. You can find theFund’s prospectus and other information about the Fund online at www.invesco.com/prospectus. You can also get this information at no cost bycalling (800) 959-4246 or by sending an e-mail request to [email protected]. The Fund’s prospectus and statement of additionalinformation, both dated April 29, 2016 (as each may be amended or supplemented), are incorporated by reference into this Summary Prospectusand may be obtained, free of charge, at the Web site, phone number or e-mail address noted above.
Investment Objective(s)The Fund’s investment objective is long-term growth of capital.
Fees and Expenses of the FundThis table describes the fees and expenses that are incurred, directly orindirectly, when a variable product owner buys, holds, or redeems interest inan insurance company separate account that invests in the Series II sharesof the Fund but does not represent the effect of any fees or other expensesassessed in connection with your variable product, and if it did, expenseswould be higher.
Shareholder Fees (fees paid directly from your investment)
Series II sharesMaximum Sales Charge (Load) Imposed on Purchases (as a percentage ofoffering price) None............................................................................................................................................Maximum Deferred Sales Charge (Load) (as a percentage of originalpurchase price or redemption proceeds, whichever is less) None............................................................................................................................................
Annual Fund Operating Expenses (expenses that you pay each year as a percentage of thevalue of your investment)
Series II sharesManagement Fees 0.61%............................................................................................................................................Distribution and/or Service (12b-1) Fees 0.25............................................................................................................................................Other Expenses 0.29............................................................................................................................................Acquired Fund Fees and Expenses 0.01............................................................................................................................................Total Annual Fund Operating Expenses 1.16............................................................................................................................................Fee Waiver and/or Expense Reimbursement1 0.01............................................................................................................................................Total Annual Fund Operating Expenses After Fee Waiver and/or Expense
Reimbursement 1.15............................................................................................................................................1 Invesco Advisers, Inc. (Invesco or the Adviser) has contractually agreed to waive a portion of
the Fund’s management fee in an amount equal to the net management fee that Invescoearns on the Fund’s investments in certain affiliated funds, which will have the effect ofreducing Acquired Fund Fees and Expenses. Unless Invesco continues the fee waiveragreement, it will terminate on June 30, 2017. The fee waiver agreement cannot beterminated during its term.
Example. This Example is intended to help you compare the cost ofinvesting in the Fund with the cost of investing in other mutual funds.
This Example does not represent the effect of any fees or expensesassessed in connection with your variable product, and if it did, expenseswould be higher.
The Example assumes that you invest $10,000 in the Fund for the timeperiods indicated and then redeem all of your shares at the end of thoseperiods. The Example also assumes that your investment has a 5% return
each year and that the Fund’s operating expenses remain equal to the TotalAnnual Fund Operating Expenses After Fee Waiver and/or ExpenseReimbursement in the first year and the Total Annual Fund OperatingExpenses thereafter.
Although your actual costs may be higher or lower, based on theseassumptions, your costs would be:
1 Year 3 Years 5 Years 10 YearsSeries II shares $117 $367 $637 $1,408............................................................................................................................................
Portfolio Turnover. The Fund pays transaction costs, such ascommissions, when it buys and sells securities (or “turns over” its portfolio).A higher portfolio turnover rate may indicate higher transaction costs. Thesecosts, which are not reflected in annual Fund operating expenses or in theexample, affect the Fund’s performance. During the most recent fiscal year,the Fund’s portfolio turnover rate was 45% of the average value of itsportfolio.
Principal Investment Strategies of the FundThe portfolio management team seeks to construct a portfolio of issuersthat have high or improving return on invested capital (ROIC), qualitymanagement, a strong competitive position and which are trading atattractive valuations. The Fund invests, under normal circumstances, at least80% of its net assets (plus any borrowings for investment purposes) inequity securities and in derivatives and other instruments that haveeconomic characteristics similar to such securities. The principal type ofequity securities in which the Fund invests is common stock. The Fund mayinvest in the securities of issuers of all capitalization sizes; however, asubstantial number of the issuers in which the Fund invests arelarge-capitalization issuers.
The Fund may invest up to 25% of its net assets in foreign securities.The Fund may also invest up to 20% of its net assets in debt securities,including foreign government debt securities.
The Fund employs a risk management strategy to help minimize loss ofcapital and reduce excessive volatility. Pursuant to this strategy, the Fundgenerally invests a substantial amount of its assets in cash and cashequivalents. As a result, the Fund may not achieve its investment objective.
The Fund can invest in derivative instruments, including futurescontracts and forward foreign currency contracts.
The Fund can use futures contracts, including index futures, to gainexposure to the broad market by equitizing cash and as a hedge againstdownside risk.
1 Invesco V.I. Core Equity Fund invesco.com/us VICEQ-SUMPRO-2
200
S-200

The Fund can use forward foreign currency contracts to hedge againstadverse movements in the foreign currencies in which portfolio securitiesare denominated.
In selecting securities for the Fund, the portfolio managers conductfundamental research of issuers to gain a thorough understanding of theirbusiness prospects, appreciation potential and ROIC. The process they useto identify potential investments for the Fund includes three phases:financial analysis, business analysis and valuation analysis. Financialanalysis evaluates an issuer’s capital allocation, and provides vital insightinto historical and potential ROIC which is a key indicator of business qualityand caliber of management. Business analysis allows the team to assess anissuer’s competitive positioning by identifying key drivers of the issuer,understanding industry challenges and evaluating the sustainability ofcompetitive advantages. Both the financial and business analyses serve as abasis to construct valuation models that help estimate an issuer’s value. Theportfolio managers use three primary valuation techniques: discounted cashflow, traditional valuation multiples and net asset value. At the conclusion oftheir research process, the portfolio managers will generally invest in anissuer when they have determined it potentially has high or improving ROIC,quality management with a long-term perspective, a strong competitiveposition and is trading at an attractive valuation.
The portfolio managers consider selling a security when it exceeds thetarget price, has not shown a demonstrable improvement in fundamentalsor a more compelling investment opportunity exists.
Principal Risks of Investing in the FundAs with any mutual fund investment, loss of money is a risk of investing. Aninvestment in the Fund is not a deposit in a bank and is not insured orguaranteed by the Federal Deposit Insurance Corporation or any othergovernmental agency. The risks associated with an investment in the Fundcan increase during times of significant market volatility. The principal risksof investing in the Fund are:
Cash/Cash Equivalents Risk. In rising markets, holding cash or cashequivalents will negatively affect the Fund’s performance relative to itsbenchmark.
Debt Securities Risk. The prices of debt securities held by the Fund willbe affected by changes in interest rates, the creditworthiness of the issuerand other factors. An increase in prevailing interest rates typically causesthe value of existing debt securities to fall and often has a greater impact onlonger-duration debt securities and higher quality debt securities. Fallinginterest rates will cause the Fund to reinvest the proceeds of debt securitiesthat have been repaid by the issuer at lower interest rates. Falling interestrates may also reduce the Fund’s distributable income because interestpayments on floating rate debt instruments held by the Fund will decline.The Fund could lose money on investments in debt securities if the issuer orborrower fails to meet its obligations to make interest payments and/or torepay principal in a timely manner. Changes in an issuer’s financial strength,the market’s perception of such strength or in the credit rating of the issueror the security may affect the value of debt securities. The Adviser’s creditanalysis may fail to anticipate such changes, which could result in buying adebt security at an inopportune time or failing to sell a debt security inadvance of a price decline or other credit event.
Derivatives Risk. The value of a derivative instrument depends largely on(and is derived from) the value of an underlying security, currency,commodity, interest rate, index or other asset (each referred to as anunderlying asset). In addition to risks relating to the underlying assets, theuse of derivatives may include other, possibly greater, risks, includingcounterparty, leverage and liquidity risks. Counterparty risk is the risk thatthe counterparty to the derivative contract will default on its obligation to paythe Fund the amount owed or otherwise perform under the derivativecontract. Derivatives create leverage risk because they do not requirepayment up front equal to the economic exposure created by owning thederivative. As a result, an adverse change in the value of the underlyingasset could result in the Fund sustaining a loss that is substantially greater
than the amount invested in the derivative, which may make the Fund’sreturns more volatile and increase the risk of loss. Derivative instrumentsmay also be less liquid than more traditional investments and the Fund maybe unable to sell or close out its derivative positions at a desirable time orprice. This risk may be more acute under adverse market conditions, duringwhich the Fund may be most in need of liquidating its derivative positions.Derivatives may also be harder to value, less tax efficient and subject tochanging government regulation that could impact the Fund’s ability to usecertain derivatives or their cost. Also, derivatives used for hedging or to gainor limit exposure to a particular market segment may not provide theexpected benefits, particularly during adverse market conditions.
Foreign Government Debt Risk. Investments in foreign government debtsecurities (sometimes referred to as sovereign debt securities) involvecertain risks in addition to those relating to foreign securities or debtsecurities generally. The issuer of the debt or the governmental authoritiesthat control the repayment of the debt may be unable or unwilling to repayprincipal or interest when due in accordance with the terms of such debt,and the Fund may have limited recourse in the event of a default against thedefaulting government. Without the approval of debt holders, somegovernmental debtors have in the past been able to reschedule orrestructure their debt payments or declare moratoria on payments.
Foreign Securities Risk. The Fund’s foreign investments may beadversely affected by political and social instability, changes in economic ortaxation policies, difficulty in enforcing obligations, decreased liquidity orincreased volatility. Foreign investments also involve the risk of the possibleseizure, nationalization or expropriation of the issuer or foreign deposits (inwhich the Fund could lose its entire investments in a certain market) andthe possible adoption of foreign governmental restrictions such as exchangecontrols. Unless the Fund has hedged its foreign securities risk, foreignsecurities risk also involves the risk of negative foreign currency ratefluctuations, which may cause the value of securities denominated in suchforeign currency (or other instruments through which the Fund has exposureto foreign currencies) to decline in value. Currency exchange rates mayfluctuate significantly over short periods of time. Currency hedgingstrategies, if used, are not always successful.
Management Risk. The Fund is actively managed and depends heavilyon the Adviser’s judgment about markets, interest rates or theattractiveness, relative values, liquidity, or potential appreciation of particularinvestments made for the Fund’s portfolio. The Fund could experiencelosses if these judgments prove to be incorrect. Additionally, legislative,regulatory, or tax developments may adversely affect management of theFund and, therefore, the ability of the Fund to achieve its investmentobjective.
Market Risk. The market values of the Fund’s investments, andtherefore the value of the Fund’s shares, will go up and down, sometimesrapidly or unpredictably. Market risk may affect a single issuer, industry orsection of the economy, or it may affect the market as a whole. Individualstock prices tend to go up and down more dramatically than those of certainother types of investments, such as bonds. During a general downturn in thefinancial markets, multiple asset classes may decline in value. Whenmarkets perform well, there can be no assurance that specific investmentsheld by the Fund will rise in value.
Small- and Mid-Capitalization Companies Risks. Small- andmid-capitalization companies tend to be more vulnerable to changingmarket conditions, may have little or no operating history or track record ofsuccess, and may have more limited product lines and markets, lessexperienced management and fewer financial resources than largercompanies. These companies’ securities may be more volatile and lessliquid than those of more established companies, and their returns mayvary, sometimes significantly, from the overall securities market.
Performance InformationThe bar chart and performance table provide an indication of the risks ofinvesting in the Fund. The bar chart shows changes in the performance of
2 Invesco V.I. Core Equity Fund invesco.com/us VICEQ-SUMPRO-2
201
S-201

30%20%10%0%
-10%-20%-30%-40%
’06 ’07 ’08 ’09 ’10 ’11 ’12 ’13 ’14 ’1516.42% 7.88% (30.32)% 27.98% 9.25% (0.29)% 13.61% 28.94% 7.85% (6.00)%
the Fund from year to year as of December 31. The performance tablecompares the Fund’s performance to that of a broad-based securitiesmarket benchmark, a style specific benchmark and a peer groupbenchmark comprised of funds with investment objectives and strategiessimilar to those of the Fund. For more information on the benchmarks usedsee the “Benchmark Descriptions” section in the prospectus. The bar chartand performance table below do not reflect charges assessed in connectionwith your variable product; if they did, the performance shown would belower. The Fund’s past performance is not necessarily an indication of itsfuture performance.
All performance shown assumes the reinvestment of dividends andcapital gains and the effect of the Fund’s expenses.
Series I shares are not offered by this prospectus. The Series I sharesand Series II shares invest in the same portfolio of securities and will havesubstantially similar performance, except to the extent that the expensesborne by each share class differ. Series II shares have higher expenses (andtherefore lower performance) resulting from its Rule 12b-1 plan, whichprovides for a maximum fee equal to an annual rate of 0.25% (expressed asa percentage of average daily net assets of the Fund).
Annual Total Returns
Best Quarter (ended June 30, 2009): 16.94%Worst Quarter (ended December 31, 2008): -21.08%
Average Annual Total Returns (for the periods ended December 31, 2015)
1Year
5Years
10Years
Series II shares: Inception (10/24/2001) -6.00% 8.17% 6.12%............................................................................................................................................S&P 500® Index (reflects no deductions for fees, expenses or taxes) 1.38 12.57 7.31............................................................................................................................................Russell 1000® Index (reflects no deductions for fees, expenses or
taxes) 0.92 12.44 7.40............................................................................................................................................Lipper VUF Large-Cap Core Funds Index 0.53 10.95 6.51............................................................................................................................................
Management of the FundInvestment Adviser: Invesco Advisers, Inc. (Invesco or the Adviser)
Portfolio Managers Title Length of Service on the FundRonald Sloan Portfolio Manager (lead) 2002............................................................................................................................................Brian Nelson Portfolio Manager 2007............................................................................................................................................
Purchase and Sale of Fund SharesYou cannot purchase or sell (redeem) shares of the Fund directly. Pleasecontact the insurance company that issued your variable product for moreinformation on the purchase and sale of Fund shares. For more information,see “Other Information—Purchase and Redemption of Shares” in theprospectus.
Tax InformationThe Fund expects, based on its investment objective and strategies, that itsdistributions, if any, will consist of ordinary income, capital gains, or somecombination of both. Because shares of the Fund must be purchasedthrough variable products, such distributions will be exempt from currenttaxation if left to accumulate within the variable product. Consult yourvariable insurance contract prospectus for additional tax information.
Payments to Insurance CompaniesIf you purchase the Fund through an insurance company or other financialintermediary, the Fund and the Fund’s distributor or its related companiesmay pay the intermediary for the sale of Fund shares and related services.These payments may create a conflict of interest by influencing theinsurance company or other intermediary and your salesperson or financialadviser to recommend the Fund over another investment. Ask yoursalesperson or financial adviser or visit your financial intermediary’s Website for more information.
3 Invesco V.I. Core Equity Fund invesco.com/us VICEQ-SUMPRO-2
202
S-202

Summary Prospectus April 29, 2016
Invesco V.I. Global Health Care Fund
Series I shares
Before you invest, you may want to review the Fund’s prospectus, which contains more information about the Fund and its risks. You can find theFund’s prospectus and other information about the Fund online at www.invesco.com/prospectus. You can also get this information at no cost bycalling (800) 959-4246 or by sending an e-mail request to [email protected]. The Fund’s prospectus and statement of additionalinformation, both dated April 29, 2016 (as each may be amended or supplemented), are incorporated by reference into this Summary Prospectusand may be obtained, free of charge, at the Web site, phone number or e-mail address noted above.
Investment Objective(s)The Fund’s investment objective is long-term growth of capital.
Fees and Expenses of the FundThis table describes the fees and expenses that are incurred, directly orindirectly, when a variable product owner buys, holds, or redeems interest inan insurance company separate account that invests in the Series I sharesof the Fund but does not represent the effect of any fees or other expensesassessed in connection with your variable product, and if it did, expenseswould be higher.
Shareholder Fees (fees paid directly from your investment)
Series I sharesMaximum Sales Charge (Load) Imposed on Purchases (as a percentage ofoffering price) None............................................................................................................................................Maximum Deferred Sales Charge (Load) (as a percentage of originalpurchase price or redemption proceeds, whichever is less) None............................................................................................................................................
Annual Fund Operating Expenses (expenses that you pay each year as a percentage of thevalue of your investment)
Series I sharesManagement Fees 0.75%............................................................................................................................................Distribution and/or Service (12b-1) Fees None............................................................................................................................................Other Expenses 0.32............................................................................................................................................Acquired Fund Fees and Expenses 0.01............................................................................................................................................Total Annual Fund Operating Expenses 1.08............................................................................................................................................Fee Waiver and/or Expense Reimbursement1 0.01............................................................................................................................................Total Annual Fund Operating Expenses After Fee Waiver and/or Expense
Reimbursement 1.07............................................................................................................................................1 Invesco Advisers, Inc. (Invesco or the Adviser) has contractually agreed to waive a portion of
the Fund’s management fee in an amount equal to the net management fee that Invescoearns on the Fund’s investments in certain affiliated funds, which will have the effect ofreducing Acquired Fund Fees and Expenses. Unless Invesco continues the fee waiveragreement, it will terminate on June 30, 2017. The fee waiver agreement cannot beterminated during its term.
Example. This Example is intended to help you compare the cost ofinvesting in the Fund with the cost of investing in other mutual funds.
This Example does not represent the effect of any fees or expensesassessed in connection with your variable product, and if it did, expenseswould be higher.
The Example assumes that you invest $10,000 in the Fund for the timeperiods indicated and then redeem all of your shares at the end of thoseperiods. The Example also assumes that your investment has a 5% return
each year and that the Fund’s operating expenses remain equal to the TotalAnnual Fund Operating Expenses After Fee Waiver and/or ExpenseReimbursement in the first year and the Total Annual Fund OperatingExpenses thereafter.
Although your actual costs may be higher or lower, based on theseassumptions, your costs would be:
1 Year 3 Years 5 Years 10 YearsSeries I shares $109 $342 $595 $1,316............................................................................................................................................
Portfolio Turnover. The Fund pays transaction costs, such ascommissions, when it buys and sells securities (or “turns over” its portfolio).A higher portfolio turnover rate may indicate higher transaction costs. Thesecosts, which are not reflected in annual Fund operating expenses or in theexample, affect the Fund’s performance. During the most recent fiscal year,the Fund’s portfolio turnover rate was 42% of the average value of itsportfolio.
Principal Investment Strategies of the FundThe Fund invests, under normal circumstances, at least 80% of its netassets (plus any borrowings for investment purposes) in securities of issuersengaged primarily in health care-related industries, and in derivatives andother instruments that have economic characteristics similar to suchsecurities.
The Fund uses various criteria to determine whether an issuer isengaged in health care-related industries, including whether (1) it derives50% or more of its gross income or its net sales from activities in the healthcare industry; (2) it devotes 50% or more of its assets to producingrevenues from the health care industry; or (3) based on other availableinformation, the Fund’s portfolio manager determines that its primarybusiness is within the health care industry. Issuers engaged in health carerelated industries include those that design, manufacture, or sell products orservices used for or in connection with health care or medicine (such aspharmaceutical issuers, biotechnology research firms, companies that sellmedical products, and companies that own or operate health care facilities).
The Fund invests primarily in equity securities, securities convertibleinto equity securities, and depositary receipts. The principal types of equitysecurities in which the Fund invests are common and preferred stock.
The Fund may invest in the securities of issuers of all capitalizationsizes; however, the Fund may invest a significant amount of its net assets inthe securities of small- and mid-capitalization issuers.
Under normal circumstances, the Fund will provide exposure toinvestments that are economically tied to at least three different countries,
1 Invesco V.I. Global Health Care Fund invesco.com/us I-VIGHC-SUMPRO-1
203
S-203

including the U.S. The Fund may invest up to 20% of its net assets insecurities of issuers located in emerging markets countries, i.e., those thatare in the early stages of their industrial cycles.
The Fund can invest in derivative instruments including forward foreigncurrency contracts.
The Fund can use forward foreign currency contracts to hedge againstadverse movements in the foreign currencies in which portfolio securitiesare denominated.
In selecting securities for the Fund, the portfolio manager first screensthe global investment universe. Securities of issuers with a minimum marketcapitalization threshold are considered for further evaluation if they areidentified as having attractive growth prospects relative to their currentvaluations. The portfolio manager uses a research-oriented bottom-upinvestment approach, focusing on issuer fundamentals in an effort touncover future growth prospects which are not yet appreciated by themarket.
In analyzing specific industries, the portfolio manager ordinarily looks forabove-average growth and demand; below-average reimbursement risk;and high barriers to entry. In analyzing specific issuers, the portfoliomanager ordinarily looks for leading issuers with defensible franchises;issuers with a solid 18- to 24 month outlook; value-added and/orniche-oriented products and/or services; potential to expand margins andimprove profitability; superior earnings-per-share growth; a strong balancesheet and moderate financial leverage; and a capable management teamand potential for downside risks.
Security selection is then further refined by valuation analysis. Ingeneral, the portfolio manager targets securities trading at attractivevaluations based upon one or more of the following parameters:price-to-earnings (P/E); P/E ratio versus expected earnings per share growthrate; enterprise value to earnings before interest, taxes, depreciation andamortization (EBITDA); discounted cash flow analysis; sum of parts analysisand asset/scarcity value. Additionally, position size is limited in an effort tomaximize risk-adjusted returns.
The portfolio manager will consider selling the security of an issuer if,among other things, (1) a security’s price reaches its valuation target; (2) anissuer’s fundamentals deteriorate; or (3) if more compelling opportunitiesexist.
Principal Risks of Investing in the FundAs with any mutual fund investment, loss of money is a risk of investing. Aninvestment in the Fund is not a deposit in a bank and is not insured orguaranteed by the Federal Deposit Insurance Corporation or any othergovernmental agency. The risks associated with an investment in the Fundcan increase during times of significant market volatility. The principal risksof investing in the Fund are:
Convertible Securities Risk. The market values of convertible securitiesare affected by market interest rates, the risk of actual issuer default oninterest or principal payments and the value of the underlying commonstock into which the convertible security may be converted. Additionally, aconvertible security is subject to the same types of market and issuer risksas apply to the underlying common stock. In addition, certain convertiblesecurities are subject to involuntary conversions and may undergo principalwrite-downs upon the occurrence of certain triggering events, and, as aresult, are subject to an increased risk of loss.
Depositary Receipts Risk. Investing in depositary receipts involves thesame risks as direct investments in foreign securities. In addition, theunderlying issuers of certain depositary receipts are under no obligation todistribute shareholder communications or pass through any voting rightswith respect to the deposited securities to the holders of such receipts. TheFund may therefore receive less timely information or have less control thanif it invested directly in the foreign issuer.
Derivatives Risk. The value of a derivative instrument depends largely on(and is derived from) the value of an underlying security, currency,commodity, interest rate, index or other asset (each referred to as an
underlying asset). In addition to risks relating to the underlying assets, theuse of derivatives may include other, possibly greater, risks, includingcounterparty, leverage and liquidity risks. Counterparty risk is the risk thatthe counterparty to the derivative contract will default on its obligation to paythe Fund the amount owed or otherwise perform under the derivativecontract. Derivatives create leverage risk because they do not requirepayment up front equal to the economic exposure created by owning thederivative. As a result, an adverse change in the value of the underlyingasset could result in the Fund sustaining a loss that is substantially greaterthan the amount invested in the derivative, which may make the Fund’sreturns more volatile and increase the risk of loss. Derivative instrumentsmay also be less liquid than more traditional investments and the Fund maybe unable to sell or close out its derivative positions at a desirable time orprice. This risk may be more acute under adverse market conditions, duringwhich the Fund may be most in need of liquidating its derivative positions.Derivatives may also be harder to value, less tax efficient and subject tochanging government regulation that could impact the Fund’s ability to usecertain derivatives or their cost. Also, derivatives used for hedging or to gainor limit exposure to a particular market segment may not provide theexpected benefits, particularly during adverse market conditions.
Emerging Markets Securities Risk. Emerging markets (also referred toas developing markets) are generally subject to greater market volatility,political, social and economic instability, uncertain trading markets and moregovernmental limitations on foreign investment than more developedmarkets. In addition, companies operating in emerging markets may besubject to lower trading volume and greater price fluctuations thancompanies in more developed markets. Securities law and the enforcementof systems of taxation in many emerging market countries may changequickly and unpredictably. In addition, investments in emerging marketssecurities may also be subject to additional transaction costs, delays insettlement procedures, and lack of timely information.
Foreign Securities Risk. The Fund’s foreign investments may beadversely affected by political and social instability, changes in economic ortaxation policies, difficulty in enforcing obligations, decreased liquidity orincreased volatility. Foreign investments also involve the risk of the possibleseizure, nationalization or expropriation of the issuer or foreign deposits (inwhich the Fund could lose its entire investments in a certain market) andthe possible adoption of foreign governmental restrictions such as exchangecontrols. Unless the Fund has hedged its foreign securities risk, foreignsecurities risk also involves the risk of negative foreign currency ratefluctuations, which may cause the value of securities denominated in suchforeign currency (or other instruments through which the Fund has exposureto foreign currencies) to decline in value. Currency exchange rates mayfluctuate significantly over short periods of time. Currency hedgingstrategies, if used, are not always successful.
Geographic Focus Risk. The Fund may from time to time invest asubstantial amount of its assets in securities of issuers located in a singlecountry or a limited number of countries. Adverse economic, political orsocial conditions in those countries may therefore have a significantnegative impact on the Fund’s investment performance.
Health Care Sector Risk. The Fund will concentrate its investments inthe securities of domestic and foreign issuers in the health care sector. Thehealth care sector is subject to significant government regulations,increases or decreases in the cost of medical products and services, andcompetitive forces that could negatively impact a health care company’sprofitability. The health care sector may also be affected by governmenthealth care programs.
Management Risk. The Fund is actively managed and depends heavilyon the Adviser’s judgment about markets, interest rates or theattractiveness, relative values, liquidity, or potential appreciation of particularinvestments made for the Fund’s portfolio. The Fund could experiencelosses if these judgments prove to be incorrect. Additionally, legislative,
2 Invesco V.I. Global Health Care Fund invesco.com/us I-VIGHC-SUMPRO-1
204
S-204

60%
40%
20%
0%
-20%
-40%’06 ’07 ’08 ’09 ’10 ’11 ’12 ’13 ’14 ’15
5.24% 11.85% (28.62)% 27.67% 5.29% 3.95% 20.90% 40.54% 19.67% 3.16%
regulatory, or tax developments may adversely affect management of theFund and, therefore, the ability of the Fund to achieve its investmentobjective.
Market Risk. The market values of the Fund’s investments, andtherefore the value of the Fund’s shares, will go up and down, sometimesrapidly or unpredictably. Market risk may affect a single issuer, industry orsection of the economy, or it may affect the market as a whole. Individualstock prices tend to go up and down more dramatically than those of certainother types of investments, such as bonds. During a general downturn in thefinancial markets, multiple asset classes may decline in value. Whenmarkets perform well, there can be no assurance that specific investmentsheld by the Fund will rise in value.
Preferred Securities Risk. Preferred securities are subject toissuer-specific and market risks applicable generally to equity securities.Preferred securities also may be subordinated to bonds or other debtinstruments, subjecting them to a greater risk of non-payment, may be lessliquid than many other securities, such as common stocks, and generallyoffer no voting rights with respect to the issuer.
Small- and Mid-Capitalization Companies Risks. Small- andmid-capitalization companies tend to be more vulnerable to changingmarket conditions, may have little or no operating history or track record ofsuccess, and may have more limited product lines and markets, lessexperienced management and fewer financial resources than largercompanies. These companies’ securities may be more volatile and lessliquid than those of more established companies, and their returns mayvary, sometimes significantly, from the overall securities market.
Performance InformationThe bar chart and performance table provide an indication of the risks ofinvesting in the Fund. The bar chart shows changes in the performance ofthe Fund from year to year as of December 31. The performance tablecompares the Fund’s performance to that of a broad-based securitiesmarket benchmark, a style specific benchmark and a peer groupbenchmark comprised of funds with investment objectives and strategiessimilar to those of the Fund. For more information on the benchmarks usedsee the “Benchmark Descriptions” section in the prospectus. The bar chartand performance table below do not reflect charges assessed in connectionwith your variable product; if they did, the performance shown would belower. The Fund’s past performance is not necessarily an indication of itsfuture performance.
All performance shown assumes the reinvestment of dividends andcapital gains and the effect of the Fund’s expenses.
Annual Total Returns
Best Quarter (ended March 31, 2013): 14.52%Worst Quarter (ended December 31, 2008): -18.84%
Average Annual Total Returns (for the periods ended December 31, 2015)
1Year
5Years
10Years
Series I shares: Inception (5/21/1997) 3.16% 16.87% 9.43%............................................................................................................................................MSCI World IndexSM (Net) (reflects reinvested dividends net of
withholding taxes, but reflects no deductions for fees, expenses orother taxes) -0.87 7.59 4.98............................................................................................................................................
MSCI World Health Care Index (Net) (reflects reinvested dividendsnet of withholding taxes, but reflects no deductions for fees,expenses or other taxes) 6.60 17.15 9.25............................................................................................................................................
Lipper VUF Health/Biotechnology Funds Classification Average 8.48 21.98 12.71............................................................................................................................................
Management of the FundInvestment Adviser: Invesco Advisers, Inc. (Invesco or the Adviser)
Portfolio Manager Title Length of Service on the FundDerek Taner Portfolio Manager 2005............................................................................................................................................
Purchase and Sale of Fund SharesYou cannot purchase or sell (redeem) shares of the Fund directly. Pleasecontact the insurance company that issued your variable product for moreinformation on the purchase and sale of Fund shares. For more information,see “Other Information—Purchase and Redemption of Shares” in theprospectus.
Tax InformationThe Fund expects, based on its investment objective and strategies, that itsdistributions, if any, will consist of ordinary income, capital gains, or somecombination of both. Because shares of the Fund must be purchasedthrough variable products, such distributions will be exempt from currenttaxation if left to accumulate within the variable product. Consult yourvariable insurance contract prospectus for additional tax information.
Payments to Insurance CompaniesIf you purchase the Fund through an insurance company or other financialintermediary, the Fund and the Fund’s distributor or its related companiesmay pay the intermediary for the sale of Fund shares and related services.These payments may create a conflict of interest by influencing theinsurance company or other intermediary and your salesperson or financialadviser to recommend the Fund over another investment. Ask yoursalesperson or financial adviser or visit your financial intermediary’s Website for more information.
3 Invesco V.I. Global Health Care Fund invesco.com/us I-VIGHC-SUMPRO-1
205
S-205

Summary Prospectus April 29, 2016
Invesco V.I. Global Real Estate Fund
Series I shares
Before you invest, you may want to review the Fund’s prospectus, which contains more information about the Fund and its risks. You can find theFund’s prospectus and other information about the Fund online at www.invesco.com/prospectus. You can also get this information at no cost bycalling (800) 959-4246 or by sending an e-mail request to [email protected]. The Fund’s prospectus and statement of additionalinformation, both dated April 29, 2016 (as each may be amended or supplemented), are incorporated by reference into this Summary Prospectusand may be obtained, free of charge, at the Web site, phone number or e-mail address noted above.
Investment Objective(s)The Fund’s investment objective is total return through growth of capital andcurrent income.
Fees and Expenses of the FundThis table describes the fees and expenses that are incurred, directly orindirectly, when a variable product owner buys, holds, or redeems interest inan insurance company separate account that invests in the Series I sharesof the Fund but does not represent the effect of any fees or other expensesassessed in connection with your variable product, and if it did, expenseswould be higher.
Shareholder Fees (fees paid directly from your investment)
Series I sharesMaximum Sales Charge (Load) Imposed on Purchases (as a percentage ofoffering price) None............................................................................................................................................Maximum Deferred Sales Charge (Load) (as a percentage of originalpurchase price or redemption proceeds, whichever is less) None............................................................................................................................................
Annual Fund Operating Expenses (expenses that you pay each year as a percentage of thevalue of your investment)
Series I sharesManagement Fees 0.75%............................................................................................................................................Distribution and/or Service (12b-1) Fees None............................................................................................................................................Other Expenses 0.36............................................................................................................................................Total Annual Fund Operating Expenses 1.11............................................................................................................................................
Example. This Example is intended to help you compare the cost ofinvesting in the Fund with the cost of investing in other mutual funds.
This Example does not represent the effect of any fees or expensesassessed in connection with your variable product, and if it did, expenseswould be higher.
The Example assumes that you invest $10,000 in the Fund for the timeperiods indicated and then redeem all of your shares at the end of thoseperiods. The Example also assumes that your investment has a 5% returneach year and that the Fund’s operating expenses remain the same.
Although your actual costs may be higher or lower, based on theseassumptions, your costs would be:
1 Year 3 Years 5 Years 10 YearsSeries I shares $113 $353 $612 $1,352............................................................................................................................................
Portfolio Turnover. The Fund pays transaction costs, such ascommissions, when it buys and sells securities (or “turns over” its portfolio).A higher portfolio turnover rate may indicate higher transaction costs. Thesecosts, which are not reflected in annual Fund operating expenses or in theexample, affect the Fund’s performance. During the most recent fiscal year,the Fund’s portfolio turnover rate was 72% of the average value of itsportfolio.
Principal Investment Strategies of the FundThe Fund invests, under normal circumstances, at least 80% of its netassets (plus any borrowings for investment purposes) in securities of realestate and real estate-related issuers, and in derivatives and otherinstruments that have economic characteristics similar to such securities.The Fund invests primarily in real estate investment trusts (REITs) and equitysecurities (including common and preferred stock, and convertiblesecurities) of domestic and foreign issuers.
The Fund considers an issuer to be a real estate or real estate-relatedissuer if at least 50% of its assets, gross income or net profits areattributable to ownership, construction, management or sale of residential,commercial or industrial real estate. These issuers include (i) REITs or otherreal estate operating companies that (a) own property, (b) make or invest inshort-term construction and development mortgage loans, or (c) invest inlong-term mortgages or mortgage pools, and (ii) companies whose productsand services are related to the real estate industry, such as manufacturersand distributors of building supplies and financial institutions that issue orservice mortgages.
The Fund may also invest in debt securities of domestic and foreignissuers (including corporate debt obligations and commercialmortgage-backed securities). The Fund may invest up to 10% of its netassets in non-investment grade debt securities (commonly known as “junkbonds”) of real estate and real estate-related issuers.
Under normal circumstances, the Fund will provide exposure toinvestments that are economically tied to at least three different countries,including the U.S. The Fund may invest up to 20% of its net assets insecurities of issuers located in emerging markets countries, i.e., those thatare in the early stages of their industrial cycles.
The Fund may invest in securities of issuers of all capitalization sizes.Real estate companies tend to have smaller asset bases compared withother market sectors, therefore, the Fund may hold a significant amount ofsecurities of small- and mid-capitalization issuers.
The Fund may engage in short sales of securities. The Fund mayengage in short sales with respect to securities it owns or securities it doesnot own. Generally, the Fund will sell a security short to (1) take advantage
1 Invesco V.I. Global Real Estate Fund invesco.com/us VIGRE-SUMPRO-1
206
S-206

of an expected decline in the security price in anticipation of purchasing thesame security at a later date at a lower price, or (2) to protect a profit in asecurity that it owns. The Fund will not sell a security short if, as a result ofsuch short sale, the aggregate market value of all securities sold shortexceeds 10% of the Fund’s net assets.
The Fund can invest in derivative instruments including forward foreigncurrency contracts.
The Fund can use forward foreign currency contracts to hedge againstadverse movements in the foreign currencies in which portfolio securitiesare denominated. Historically the Fund has not hedged the currencyexposure created by its investments in foreign securities but has the abilityto do so if deemed appropriate by the Fund’s portfolio managers.
When constructing the portfolio, the portfolio managers use afundamentals-driven investment process, including an evaluation of factorssuch as property market cycle analysis, property evaluation andmanagement and structure review to identify securities with characteristicsincluding (i) quality underlying properties, (ii) solid management teams withthe ability to effectively manage capital structure decisions and execute theirstated strategic plan, and (iii) attractive valuations relative to peerinvestment alternatives.
The portfolio managers and investment team focus on equity REITs andreal estate operating issuers. Each qualified security in the investmentuniverse is analyzed using fundamental real estate analysis and valuationreview to identify securities that appear to have relatively favorablelong-term prospects and attractive values. Some of the fundamental realestate factors that are considered include: forecasted occupancy and rentalrates of the various property markets in which a firm may operate, propertylocations, physical attributes, management depth and skill, insiderownership, overall debt levels, percentage of variable rate financing andfixed charge coverage ratios. The issuers that are believed to have the mostattractive fundamental real estate attributes are then evaluated on the basisof relative value. Some of the valuation factors that are considered include:cash flow consistency and growth, dividend yield, dividend coverage andgrowth, and cash flow and assets to price multiples.
The portfolio managers seek to construct a portfolio with riskcharacteristics similar to the FTSE EPRA/NAREIT Global Index. The Funduses this index as a guide in structuring the portfolio, but the Fund is not anindex fund.
The portfolio managers seek to limit risk through various controls, suchas diversifying the portfolio property types and geographic areas as well asby considering the relative liquidity of each security and limiting the size ofany one holding.
The portfolio managers will consider selling a security if they conclude(1) its relative valuation has fallen below desired levels, (2) its risk/returnprofile has changed significantly, (3) its fundamentals have changed, or (4) amore attractive investment opportunity is identified.
Principal Risks of Investing in the FundAs with any mutual fund investment, loss of money is a risk of investing. Aninvestment in the Fund is not a deposit in a bank and is not insured orguaranteed by the Federal Deposit Insurance Corporation or any othergovernmental agency. The risks associated with an investment in the Fundcan increase during times of significant market volatility. The principal risksof investing in the Fund are:
Convertible Securities Risk. The market values of convertible securitiesare affected by market interest rates, the risk of actual issuer default oninterest or principal payments and the value of the underlying commonstock into which the convertible security may be converted. Additionally, aconvertible security is subject to the same types of market and issuer risksas apply to the underlying common stock. In addition, certain convertiblesecurities are subject to involuntary conversions and may undergo principalwrite-downs upon the occurrence of certain triggering events, and, as aresult, are subject to an increased risk of loss.
Debt Securities Risk. The prices of debt securities held by the Fund willbe affected by changes in interest rates, the creditworthiness of the issuerand other factors. An increase in prevailing interest rates typically causesthe value of existing debt securities to fall and often has a greater impact onlonger-duration debt securities and higher quality debt securities. Fallinginterest rates will cause the Fund to reinvest the proceeds of debt securitiesthat have been repaid by the issuer at lower interest rates. Falling interestrates may also reduce the Fund’s distributable income because interestpayments on floating rate debt instruments held by the Fund will decline.The Fund could lose money on investments in debt securities if the issuer orborrower fails to meet its obligations to make interest payments and/or torepay principal in a timely manner. Changes in an issuer’s financial strength,the market’s perception of such strength or in the credit rating of the issueror the security may affect the value of debt securities. The Adviser’s creditanalysis may fail to anticipate such changes, which could result in buying adebt security at an inopportune time or failing to sell a debt security inadvance of a price decline or other credit event.
Derivatives Risk. The value of a derivative instrument depends largely on(and is derived from) the value of an underlying security, currency,commodity, interest rate, index or other asset (each referred to as anunderlying asset). In addition to risks relating to the underlying assets, theuse of derivatives may include other, possibly greater, risks, includingcounterparty, leverage and liquidity risks. Counterparty risk is the risk thatthe counterparty to the derivative contract will default on its obligation to paythe Fund the amount owed or otherwise perform under the derivativecontract. Derivatives create leverage risk because they do not requirepayment up front equal to the economic exposure created by owning thederivative. As a result, an adverse change in the value of the underlyingasset could result in the Fund sustaining a loss that is substantially greaterthan the amount invested in the derivative, which may make the Fund’sreturns more volatile and increase the risk of loss. Derivative instrumentsmay also be less liquid than more traditional investments and the Fund maybe unable to sell or close out its derivative positions at a desirable time orprice. This risk may be more acute under adverse market conditions, duringwhich the Fund may be most in need of liquidating its derivative positions.Derivatives may also be harder to value, less tax efficient and subject tochanging government regulation that could impact the Fund’s ability to usecertain derivatives or their cost. Also, derivatives used for hedging or to gainor limit exposure to a particular market segment may not provide theexpected benefits, particularly during adverse market conditions.
Emerging Markets Securities Risk. Emerging markets (also referred toas developing markets) are generally subject to greater market volatility,political, social and economic instability, uncertain trading markets and moregovernmental limitations on foreign investment than more developedmarkets. In addition, companies operating in emerging markets may besubject to lower trading volume and greater price fluctuations thancompanies in more developed markets. Securities law and the enforcementof systems of taxation in many emerging market countries may changequickly and unpredictably. In addition, investments in emerging marketssecurities may also be subject to additional transaction costs, delays insettlement procedures, and lack of timely information.
Foreign Securities Risk. The Fund’s foreign investments may beadversely affected by political and social instability, changes in economic ortaxation policies, difficulty in enforcing obligations, decreased liquidity orincreased volatility. Foreign investments also involve the risk of the possibleseizure, nationalization or expropriation of the issuer or foreign deposits (inwhich the Fund could lose its entire investments in a certain market) andthe possible adoption of foreign governmental restrictions such as exchangecontrols. Unless the Fund has hedged its foreign securities risk, foreignsecurities risk also involves the risk of negative foreign currency ratefluctuations, which may cause the value of securities denominated in suchforeign currency (or other instruments through which the Fund has exposureto foreign currencies) to decline in value. Currency exchange rates may
2 Invesco V.I. Global Real Estate Fund invesco.com/us VIGRE-SUMPRO-1
207
S-207

60%
40%
20%
0%
-20%
-40%
-60%’06 ’07 ’08 ’09 ’10 ’11 ’12 ’13 ’14 ’15
42.60% (5.54)% (44.65)% 31.53% 17.51% (6.51)% 28.12% 2.71% 14.62% (1.48)%
fluctuate significantly over short periods of time. Currency hedgingstrategies, if used, are not always successful.
Geographic Focus Risk. The Fund may from time to time invest asubstantial amount of its assets in securities of issuers located in a singlecountry or a limited number of countries. Adverse economic, political orsocial conditions in those countries may therefore have a significantnegative impact on the Fund’s investment performance.
High Yield Debt Securities (Junk Bond) Risk. Investments in high yielddebt securities (“junk bonds”) and other lower-rated securities will subjectthe Fund to substantial risk of loss. These securities are considered to bespeculative with respect to the issuer’s ability to pay interest and principalwhen due, are more susceptible to default or decline in market value andare less liquid than investment grade debt securities. Prices of high yielddebt securities tend to be very volatile.
Management Risk. The Fund is actively managed and depends heavilyon the Adviser’s judgment about markets, interest rates or theattractiveness, relative values, liquidity, or potential appreciation of particularinvestments made for the Fund’s portfolio. The Fund could experiencelosses if these judgments prove to be incorrect. Additionally, legislative,regulatory, or tax developments may adversely affect management of theFund and, therefore, the ability of the Fund to achieve its investmentobjective.
Market Risk. The market values of the Fund’s investments, andtherefore the value of the Fund’s shares, will go up and down, sometimesrapidly or unpredictably. Market risk may affect a single issuer, industry orsection of the economy, or it may affect the market as a whole. Individualstock prices tend to go up and down more dramatically than those of certainother types of investments, such as bonds. During a general downturn in thefinancial markets, multiple asset classes may decline in value. Whenmarkets perform well, there can be no assurance that specific investmentsheld by the Fund will rise in value.
Mortgage- and Asset-Backed Securities Risk. Mortgage- andasset-backed securities, including collateralized debt obligations andcollateralized mortgage obligations, are subject to prepayment or call risk,which is the risk that a borrower’s payments may be received earlier or laterthan expected due to changes in prepayment rates on underlying loans. Thiscould result in the Fund reinvesting these early payments at lower interestrates, thereby reducing the Fund’s income. Mortgage- and asset-backedsecurities also are subject to extension risk, which is the risk that anunexpected rise in interest rates could reduce the rate of prepayments,causing the price of the mortgage- and asset-backed securities and theFund’s share price to fall. An unexpectedly high rate of defaults on themortgages held by a mortgage pool may adversely affect the value ofmortgage-backed securities and could result in losses to the Fund. TheFund may invest in mortgage pools that include subprime mortgages, whichare loans made to borrowers with weakened credit histories or with lowercapacity to make timely payments on their mortgages. Privately issuedmortgage-related securities are not subject to the same underwritingrequirements as those with government or government-sponsored entityguarantees and, therefore, mortgage loans underlying privately issuedmortgage-related securities may have less favorable collateral, credit risk orother underwriting characteristics, and wider variances in interest rate, term,size, purpose and borrower characteristics.
Preferred Securities Risk. Preferred securities are subject toissuer-specific and market risks applicable generally to equity securities.Preferred securities also may be subordinated to bonds or other debtinstruments, subjecting them to a greater risk of non-payment, may be lessliquid than many other securities, such as common stocks, and generallyoffer no voting rights with respect to the issuer.
REIT Risk/Real Estate Risk. The Fund concentrates its investments inthe securities of real estate and real estate related companies. Investmentsin real estate related instruments may be affected by economic, legal,cultural, environmental or technological factors that affect property values,rents or occupancies of real estate related to the Fund’s holdings. Shares of
real estate related companies, which tend to be small- and mid-capcompanies, may be more volatile and less liquid than larger companies. If areal estate related company defaults on certain types of debt obligations,the Fund may own real estate directly, which involves additional risks suchas environmental liabilities; difficulty in valuing and selling the real estate;and economic or regulatory changes.
Short Position Risk. Because the Fund’s potential loss on a shortposition arises from increases in the value of the asset sold short, the Fundwill incur a loss on a short position, which is theoretically unlimited, if theprice of the asset sold short increases from the short sale price. Thecounterparty to a short position or other market factors may prevent theFund from closing out a short position at a desirable time or price and mayreduce or eliminate any gain or result in a loss. In a rising market, theFund’s short positions will cause the Fund to underperform the overallmarket and its peers that do not engage in shorting. If the Fund holds bothlong and short positions, and both positions decline simultaneously, theshort positions will not provide any buffer (hedge) from declines in value ofthe Fund’s long positions. Certain types of short positions involve leverage,which may exaggerate any losses, potentially more than the actual cost ofthe investment, and will increase the volatility of the Fund’s returns.
Small- and Mid-Capitalization Companies Risks. Small- andmid-capitalization companies tend to be more vulnerable to changingmarket conditions, may have little or no operating history or track record ofsuccess, and may have more limited product lines and markets, lessexperienced management and fewer financial resources than largercompanies. These companies’ securities may be more volatile and lessliquid than those of more established companies, and their returns mayvary, sometimes significantly, from the overall securities market.
Performance InformationThe bar chart and performance table provide an indication of the risks ofinvesting in the Fund. The bar chart shows changes in the performance ofthe Fund from year to year as of December 31. Effective July 3, 2006, theFund changed its investment objective. Performance shown for the Fundreflects the investment objective of the Fund in effect during the periodsshown. The performance table compares the Fund’s performance to that ofa broad-based securities market benchmark, a style specific benchmarkand a peer group benchmark comprised of funds with investment objectivesand strategies similar to those of the Fund. For more information on thebenchmarks used see the “Benchmark Descriptions” section in theprospectus. The bar chart and performance table below do not reflectcharges assessed in connection with your variable product; if they did, theperformance shown would be lower. The Fund’s past performance is notnecessarily an indication of its future performance.
All performance shown assumes the reinvestment of dividends andcapital gains and the effect of the Fund’s expenses.
Annual Total Returns
Best Quarter (ended June 30, 2009): 29.97%Worst Quarter (ended December 31, 2008): -29.26%
3 Invesco V.I. Global Real Estate Fund invesco.com/us VIGRE-SUMPRO-1
208
S-208

Average Annual Total Returns (for the periods ended December 31, 2015)
1Year
5Years
10Years
Series I shares: Inception (3/31/1998) -1.48% 6.80% 4.82%............................................................................................................................................MSCI World IndexSM (Net) (reflects reinvested dividends net of
withholding taxes, but reflects no deductions for fees, expenses orother taxes) -0.87 7.59 4.98............................................................................................................................................
Custom Invesco Global Real Estate Index -1.19 7.02 4.60............................................................................................................................................Lipper VUF Real Estate Funds Classification Average 2.33 11.29 6.97............................................................................................................................................
Management of the FundInvestment Adviser: Invesco Advisers, Inc. (Invesco or the Adviser)Investment Sub-Adviser: Invesco Asset Management Limited
Portfolio Managers Title Length of Service on the FundJoe Rodriguez, Jr. Portfolio Manager (lead) 2003............................................................................................................................................Mark Blackburn Portfolio Manager 2003............................................................................................................................................James Cowen Portfolio Manager 2008............................................................................................................................................Paul Curbo Portfolio Manager 2007............................................................................................................................................Darin Turner Portfolio Manager 2010............................................................................................................................................Ping-Ying Wang Portfolio Manager 2006............................................................................................................................................
Purchase and Sale of Fund SharesYou cannot purchase or sell (redeem) shares of the Fund directly. Pleasecontact the insurance company that issued your variable product for moreinformation on the purchase and sale of Fund shares. For more information,see “Other Information—Purchase and Redemption of Shares” in theprospectus.
Tax InformationThe Fund expects, based on its investment objective and strategies, that itsdistributions, if any, will consist of ordinary income, capital gains, or somecombination of both. Because shares of the Fund must be purchasedthrough variable products, such distributions will be exempt from currenttaxation if left to accumulate within the variable product. Consult yourvariable insurance contract prospectus for additional tax information.
Payments to Insurance CompaniesIf you purchase the Fund through an insurance company or other financialintermediary, the Fund and the Fund’s distributor or its related companiesmay pay the intermediary for the sale of Fund shares and related services.These payments may create a conflict of interest by influencing theinsurance company or other intermediary and your salesperson or financialadviser to recommend the Fund over another investment. Ask yoursalesperson or financial adviser or visit your financial intermediary’s Website for more information.
4 Invesco V.I. Global Real Estate Fund invesco.com/us VIGRE-SUMPRO-1
209
S-209

Summary Prospectus April 29, 2016
Invesco V.I. International Growth Fund
Series I shares
Before you invest, you may want to review the Fund’s prospectus, which contains more information about the Fund and its risks. You can find theFund’s prospectus and other information about the Fund online at www.invesco.com/prospectus. You can also get this information at no cost bycalling (800) 959-4246 or by sending an e-mail request to [email protected]. The Fund’s prospectus and statement of additionalinformation, both dated April 29, 2016 (as each may be amended or supplemented), are incorporated by reference into this Summary Prospectusand may be obtained, free of charge, at the Web site, phone number or e-mail address noted above.
Investment Objective(s)The Fund’s investment objective is long-term growth of capital.
Fees and Expenses of the FundThis table describes the fees and expenses that are incurred, directly orindirectly, when a variable product owner buys, holds, or redeems interest inan insurance company separate account that invests in the Series I sharesof the Fund but does not represent the effect of any fees or other expensesassessed in connection with your variable product, and if it did, expenseswould be higher.
Shareholder Fees (fees paid directly from your investment)
Series I sharesMaximum Sales Charge (Load) Imposed on Purchases (as a percentage ofoffering price) None............................................................................................................................................Maximum Deferred Sales Charge (Load) (as a percentage of originalpurchase price or redemption proceeds, whichever is less) None............................................................................................................................................
Annual Fund Operating Expenses (expenses that you pay each year as a percentage of thevalue of your investment)
Series I sharesManagement Fees 0.71%............................................................................................................................................Distribution and/or Service (12b-1) Fees None............................................................................................................................................Other Expenses 0.30............................................................................................................................................Acquired Fund Fees and Expenses 0.01............................................................................................................................................Total Annual Fund Operating Expenses 1.02............................................................................................................................................Fee Waiver and/or Expense Reimbursement1 0.01............................................................................................................................................Total Annual Fund Operating Expenses After Fee Waiver and/or Expense
Reimbursement 1.01............................................................................................................................................1 Invesco Advisers, Inc. (Invesco or the Adviser) has contractually agreed to waive a portion of
the Fund’s management fee in an amount equal to the net management fee that Invescoearns on the Fund’s investments in certain affiliated funds, which will have the effect ofreducing Acquired Fund Fees and Expenses. Unless Invesco continues the fee waiveragreement, it will terminate on June 30, 2017. The fee waiver agreement cannot beterminated during its term.
Example. This Example is intended to help you compare the cost ofinvesting in the Fund with the cost of investing in other mutual funds.
This Example does not represent the effect of any fees or expensesassessed in connection with your variable product, and if it did, expenseswould be higher.
The Example assumes that you invest $10,000 in the Fund for the timeperiods indicated and then redeem all of your shares at the end of thoseperiods. The Example also assumes that your investment has a 5% return
each year and that the Fund’s operating expenses remain equal to the TotalAnnual Fund Operating Expenses After Fee Waiver and/or ExpenseReimbursement in the first year and the Total Annual Fund OperatingExpenses thereafter.
Although your actual costs may be higher or lower, based on theseassumptions, your costs would be:
1 Year 3 Years 5 Years 10 YearsSeries I shares $103 $324 $562 $1,247............................................................................................................................................
Portfolio Turnover. The Fund pays transaction costs, such ascommissions, when it buys and sells securities (or “turns over” its portfolio).A higher portfolio turnover rate may indicate higher transaction costs. Thesecosts, which are not reflected in annual Fund operating expenses or in theexample, affect the Fund’s performance. During the most recent fiscal year,the Fund’s portfolio turnover rate was 22% of the average value of itsportfolio.
Principal Investment Strategies of the FundThe Fund invests primarily in equity securities and depositary receipts offoreign issuers. The principal types of equity securities in which the Fundinvests are common and preferred stock.
Under normal circumstances, the Fund will provide exposure toinvestments that are economically tied to at least three different countriesoutside of the U.S. The Fund may also invest up to 1.25 times the amount ofthe exposure to emerging markets countries, i.e., those that are in the earlystages of their industrial cycles, in the MSCI All Country World ex-U.S.Growth Index.
The Fund invests primarily in securities of issuers that are consideredby the Fund’s portfolio managers to have potential for earnings or revenuegrowth.
The Fund invests primarily in the securities of large-capitalizationissuers; however, the Fund may invest a significant amount of its net assetsin the securities of mid-capitalization issuers.
The Fund can invest in derivative instruments, including forward foreigncurrency contracts and futures contracts.
The Fund can use forward foreign currency contracts to hedge againstadverse movements in the foreign currencies in which portfolio securitiesare denominated. Historically the Fund has not hedged the currencyexposure created by its investments in foreign securities but has the abilityto do so if deemed appropriate by the Fund’s portfolio managers.
1 Invesco V.I. International Growth Fund invesco.com/us VIIGR-SUMPRO-1
210
S-210

The Fund can use futures contracts to gain exposure to the broadmarket in connection with managing cash balances or to hedge againstdownside risk.
The portfolio managers employ a disciplined investment strategy thatemphasizes fundamental research. The fundamental research primarilyfocuses on identifying quality growth companies and is supported byquantitative analysis, portfolio construction and risk management.Investments for the portfolio are selected bottom-up on asecurity-by-security basis. The focus is on the strengths of individualissuers, rather than sector or country trends. The portfolio managers’strategy primarily focuses on identifying issuers that they believe havesustainable earnings growth, efficient capital allocation, and attractiveprices.
The Fund’s portfolio managers may consider selling a security forseveral reasons, including when (1) its price changes such that they believeit has become too expensive, (2) the original investment thesis for thecompany is no longer valid, or (3) a more compelling investment opportunityis identified.
Principal Risks of Investing in the FundAs with any mutual fund investment, loss of money is a risk of investing. Aninvestment in the Fund is not a deposit in a bank and is not insured orguaranteed by the Federal Deposit Insurance Corporation or any othergovernmental agency. The risks associated with an investment in the Fundcan increase during times of significant market volatility. The principal risksof investing in the Fund are:
Depositary Receipts Risk. Investing in depositary receipts involves thesame risks as direct investments in foreign securities. In addition, theunderlying issuers of certain depositary receipts are under no obligation todistribute shareholder communications or pass through any voting rightswith respect to the deposited securities to the holders of such receipts. TheFund may therefore receive less timely information or have less control thanif it invested directly in the foreign issuer.
Derivatives Risk. The value of a derivative instrument depends largely on(and is derived from) the value of an underlying security, currency,commodity, interest rate, index or other asset (each referred to as anunderlying asset). In addition to risks relating to the underlying assets, theuse of derivatives may include other, possibly greater, risks, includingcounterparty, leverage and liquidity risks. Counterparty risk is the risk thatthe counterparty to the derivative contract will default on its obligation to paythe Fund the amount owed or otherwise perform under the derivativecontract. Derivatives create leverage risk because they do not requirepayment up front equal to the economic exposure created by owning thederivative. As a result, an adverse change in the value of the underlyingasset could result in the Fund sustaining a loss that is substantially greaterthan the amount invested in the derivative, which may make the Fund’sreturns more volatile and increase the risk of loss. Derivative instrumentsmay also be less liquid than more traditional investments and the Fund maybe unable to sell or close out its derivative positions at a desirable time orprice. This risk may be more acute under adverse market conditions, duringwhich the Fund may be most in need of liquidating its derivative positions.Derivatives may also be harder to value, less tax efficient and subject tochanging government regulation that could impact the Fund’s ability to usecertain derivatives or their cost. Also, derivatives used for hedging or to gainor limit exposure to a particular market segment may not provide theexpected benefits, particularly during adverse market conditions.
Emerging Markets Securities Risk. Emerging markets (also referred toas developing markets) are generally subject to greater market volatility,political, social and economic instability, uncertain trading markets and moregovernmental limitations on foreign investment than more developedmarkets. In addition, companies operating in emerging markets may besubject to lower trading volume and greater price fluctuations thancompanies in more developed markets. Securities law and the enforcementof systems of taxation in many emerging market countries may change
quickly and unpredictably. In addition, investments in emerging marketssecurities may also be subject to additional transaction costs, delays insettlement procedures, and lack of timely information.
Foreign Securities Risk. The Fund’s foreign investments may beadversely affected by political and social instability, changes in economic ortaxation policies, difficulty in enforcing obligations, decreased liquidity orincreased volatility. Foreign investments also involve the risk of the possibleseizure, nationalization or expropriation of the issuer or foreign deposits (inwhich the Fund could lose its entire investments in a certain market) andthe possible adoption of foreign governmental restrictions such as exchangecontrols. Unless the Fund has hedged its foreign securities risk, foreignsecurities risk also involves the risk of negative foreign currency ratefluctuations, which may cause the value of securities denominated in suchforeign currency (or other instruments through which the Fund has exposureto foreign currencies) to decline in value. Currency exchange rates mayfluctuate significantly over short periods of time. Currency hedgingstrategies, if used, are not always successful.
Geographic Focus Risk. The Fund may from time to time invest asubstantial amount of its assets in securities of issuers located in a singlecountry or a limited number of countries. Adverse economic, political orsocial conditions in those countries may therefore have a significantnegative impact on the Fund’s investment performance.
Growth Investing Risk. Growth stocks tend to be more expensive relativeto the issuing company’s earnings or assets compared with other types ofstock. As a result, they tend to be more sensitive to changes in, or investors’expectations of, the issuing company’s earnings and can be more volatile.
Investing in the European Union Risk. Investments in certain countries inthe European Union are susceptible to high economic risks associated withhigh levels of debt, such as investments in sovereign debt of Greece, Italyand Spain. Separately, the European Union faces issues involving itsmembership, structure, procedures and policies. The exit of one or moremember states from the European Union would place its currency andbanking system in jeopardy. Efforts of the member states to further unifytheir economic and monetary policies may increase the potential for thedownward movement of one member state’s market to cause a similareffect on other member states’ markets.
Management Risk. The Fund is actively managed and depends heavilyon the Adviser’s judgment about markets, interest rates or theattractiveness, relative values, liquidity, or potential appreciation of particularinvestments made for the Fund’s portfolio. The Fund could experiencelosses if these judgments prove to be incorrect. Additionally, legislative,regulatory, or tax developments may adversely affect management of theFund and, therefore, the ability of the Fund to achieve its investmentobjective.
Market Risk. The market values of the Fund’s investments, andtherefore the value of the Fund’s shares, will go up and down, sometimesrapidly or unpredictably. Market risk may affect a single issuer, industry orsection of the economy, or it may affect the market as a whole. Individualstock prices tend to go up and down more dramatically than those of certainother types of investments, such as bonds. During a general downturn in thefinancial markets, multiple asset classes may decline in value. Whenmarkets perform well, there can be no assurance that specific investmentsheld by the Fund will rise in value.
Mid-Capitalization Companies Risk. Mid-capitalization companies tendto be more vulnerable to changing market conditions and may have morelimited product lines and markets, less experienced management and fewerfinancial resources than larger companies. These companies’ securities maybe more volatile and less liquid than those of more established companies,and their returns may vary, sometimes significantly, from the overallsecurities market.
Preferred Securities Risk. Preferred securities are subject toissuer-specific and market risks applicable generally to equity securities.Preferred securities also may be subordinated to bonds or other debtinstruments, subjecting them to a greater risk of non-payment, may be less
2 Invesco V.I. International Growth Fund invesco.com/us VIIGR-SUMPRO-1
211
S-211

40%
20%
0%
-20%
-40%
-60%’06 ’07 ’08 ’09 ’10 ’11 ’12 ’13 ’14 ’15
28.23% 14.72% (40.38)% 35.24% 12.86% (6.74)% 15.53% 19.01% 0.33% (2.34)%
liquid than many other securities, such as common stocks, and generallyoffer no voting rights with respect to the issuer.
Performance InformationThe bar chart and performance table provide an indication of the risks ofinvesting in the Fund. The bar chart shows changes in the performance ofthe Fund from year to year as of December 31. The performance tablecompares the Fund’s performance to that of a broad-based securitiesmarket benchmark, a style specific benchmark and a peer groupbenchmark comprised of funds with investment objectives and strategiessimilar to those of the Fund. For more information on the benchmarks usedsee the “Benchmark Descriptions” section in the prospectus. The bar chartand performance table below do not reflect charges assessed in connectionwith your variable product; if they did, the performance shown would belower. The Fund’s past performance is not necessarily an indication of itsfuture performance.
All performance shown assumes the reinvestment of dividends andcapital gains and the effect of the Fund’s expenses.
Annual Total Returns
Best Quarter (ended June 30, 2009): 18.55%Worst Quarter (ended December 31, 2008): -19.64%
Average Annual Total Returns (for the periods ended December 31, 2015)
1Year
5Years
10Years
Series I shares: Inception (5/5/1993) -2.34% 4.67% 5.34%............................................................................................................................................MSCI All Country World ex U.S. Index (Net) (reflects reinvested
dividends net of withholding taxes, but reflects no deductions forfees, expenses or other taxes) -5.66 1.06 2.92............................................................................................................................................
Custom Invesco International Growth Index (Net) -1.25 2.94 3.20............................................................................................................................................Lipper VUF International Large-Cap Growth Funds Index -0.69 4.61 —............................................................................................................................................
Management of the FundInvestment Adviser: Invesco Advisers, Inc. (Invesco or the Adviser)
Portfolio Managers Title Length of Service on the FundClas Olsson Portfolio Manager 1997............................................................................................................................................Brent Bates Portfolio Manager 2013............................................................................................................................................Matthew Dennis Portfolio Manager 2003............................................................................................................................................Mark Jason Portfolio Manager 2011............................................................................................................................................Richard Nield Portfolio Manager 2013............................................................................................................................................
Purchase and Sale of Fund SharesYou cannot purchase or sell (redeem) shares of the Fund directly. Pleasecontact the insurance company that issued your variable product for moreinformation on the purchase and sale of Fund shares. For more information,see “Other Information—Purchase and Redemption of Shares” in theprospectus.
Tax InformationThe Fund expects, based on its investment objective and strategies, that itsdistributions, if any, will consist of ordinary income, capital gains, or somecombination of both. Because shares of the Fund must be purchasedthrough variable products, such distributions will be exempt from currenttaxation if left to accumulate within the variable product. Consult yourvariable insurance contract prospectus for additional tax information.
Payments to Insurance CompaniesIf you purchase the Fund through an insurance company or other financialintermediary, the Fund and the Fund’s distributor or its related companiesmay pay the intermediary for the sale of Fund shares and related services.These payments may create a conflict of interest by influencing theinsurance company or other intermediary and your salesperson or financialadviser to recommend the Fund over another investment. Ask yoursalesperson or financial adviser or visit your financial intermediary’s Website for more information.
3 Invesco V.I. International Growth Fund invesco.com/us VIIGR-SUMPRO-1
212
S-212
Summary Prospectus April 29, 2016
Invesco V.I. Mid Cap Core Equity Fund
Series II shares
Before you invest, you may want to review the Fund’s prospectus, which contains more information about the Fund and its risks. You can find theFund’s prospectus and other information about the Fund online at www.invesco.com/prospectus. You can also get this information at no cost bycalling (800) 959-4246 or by sending an e-mail request to [email protected]. The Fund’s prospectus and statement of additionalinformation, both dated April 29, 2016 (as each may be amended or supplemented), are incorporated by reference into this Summary Prospectusand may be obtained, free of charge, at the Web site, phone number or e-mail address noted above.
Investment Objective(s)The Fund’s investment objective is long-term growth of capital.
Fees and Expenses of the FundThis table describes the fees and expenses that are incurred, directly orindirectly, when a variable product owner buys, holds, or redeems interest inan insurance company separate account that invests in the Series II sharesof the Fund but does not represent the effect of any fees or other expensesassessed in connection with your variable product, and if it did, expenseswould be higher.
Shareholder Fees (fees paid directly from your investment)
Series II sharesMaximum Sales Charge (Load) Imposed on Purchases (as a percentage ofoffering price) None............................................................................................................................................Maximum Deferred Sales Charge (Load) (as a percentage of originalpurchase price or redemption proceeds, whichever is less) None............................................................................................................................................
Annual Fund Operating Expenses (expenses that you pay each year as a percentage of thevalue of your investment)
Series II sharesManagement Fees 0.73%............................................................................................................................................Distribution and/or Service (12b-1) Fees 0.25............................................................................................................................................Other Expenses 0.30............................................................................................................................................Acquired Fund Fees and Expenses 0.02............................................................................................................................................Total Annual Fund Operating Expenses 1.30............................................................................................................................................Fee Waiver and/or Expense Reimbursement1 0.02............................................................................................................................................Total Annual Fund Operating Expenses After Fee Waiver and/or Expense
Reimbursement 1.28............................................................................................................................................1 Invesco Advisers, Inc. (Invesco or the Adviser) has contractually agreed to waive a portion of
the Fund’s management fee in an amount equal to the net management fee that Invescoearns on the Fund’s investments in certain affiliated funds, which will have the effect ofreducing Acquired Fund Fees and Expenses. Unless Invesco continues the fee waiveragreement, it will terminate on June 30, 2017. The fee waiver agreement cannot beterminated during its term.
Example. This Example is intended to help you compare the cost ofinvesting in the Fund with the cost of investing in other mutual funds.
This Example does not represent the effect of any fees or expensesassessed in connection with your variable product, and if it did, expenseswould be higher.
The Example assumes that you invest $10,000 in the Fund for the timeperiods indicated and then redeem all of your shares at the end of thoseperiods. The Example also assumes that your investment has a 5% return
each year and that the Fund’s operating expenses remain equal to the TotalAnnual Fund Operating Expenses After Fee Waiver and/or ExpenseReimbursement in the first year and the Total Annual Fund OperatingExpenses thereafter.
Although your actual costs may be higher or lower, based on theseassumptions, your costs would be:
1 Year 3 Years 5 Years 10 YearsSeries II shares $130 $410 $711 $1,566............................................................................................................................................
Portfolio Turnover. The Fund pays transaction costs, such ascommissions, when it buys and sells securities (or “turns over” its portfolio).A higher portfolio turnover rate may indicate higher transaction costs. Thesecosts, which are not reflected in annual Fund operating expenses or in theexample, affect the Fund’s performance. During the most recent fiscal year,the Fund’s portfolio turnover rate was 44% of the average value of itsportfolio.
Principal Investment Strategies of the FundThe Fund invests, under normal circumstances, at least 80% of its netassets (plus any borrowings for investment purposes) in equity securities ofmid-capitalization companies and in derivatives and other instruments thathave economic characteristics similar to such securities. The principal typeof equity security in which the Fund invests is common stock.
The Fund considers an issuer to be a mid-capitalization issuer if it has amarket capitalization, at the time of purchase, within the range of the largestand smallest capitalized issuers included in the Russell Midcap® Indexduring the most recent 11-month period (based on month-end data) plusthe most recent data during the current month. As of December 31, 2015,the capitalization of issuers in the Russell Midcap® Index ranged from$149 million to $28.9 billion.
The Fund may invest up to 25% of its net assets in securities of foreignissuers, which may include securities of issuers located in emerging marketcountries; i.e., those that are in the early stages of their industrial cycles.
The Fund can invest in derivative instruments, including forward foreigncurrency contracts and futures contracts.
The Fund can use forward foreign currency contracts to hedge againstadverse movements in the foreign currencies in which portfolio securitiesare denominated.
The Fund can use futures contracts, including index futures, to gainexposure to the broad market by equitizing cash and as a hedge againstdownside risk.
1 Invesco V.I. Mid Cap Core Equity Fund invesco.com/us VIMCCE-SUMPRO-2
213
S-213
In selecting securities for the Fund, the portfolio managers conductfundamental research of issuers to gain a thorough understanding of theirbusiness prospects, appreciation potential and return on invested capital(ROIC). The process they use to identify potential investments for the Fundincludes three phases: financial analysis, business analysis and valuationanalysis. Financial analysis evaluates an issuer’s capital allocation, andprovides vital insight into historical and potential ROIC which is a keyindicator of business quality and caliber of management. Business analysisallows the team to determine an issuer’s competitive positioning byidentifying key drivers of the issuer, understanding industry challenges andevaluating the sustainability of competitive advantages. Both the financialand business analyses serve as a basis to construct valuation models thathelp estimate an issuer’s value. The portfolio managers use three primaryvaluation techniques: discounted cash flow, traditional valuation multiplesand net asset value. At the conclusion of their research process, theportfolio managers will generally invest in an issuer when they havedetermined it potentially has high or improving ROIC, quality managementwith a long-term perspective, a strong competitive position and is trading atan attractive valuation.
The portfolio managers consider selling a security when it exceeds thetarget price, has not shown a demonstrable improvement in fundamentalsor a more compelling investment opportunity exists.
The Fund employs a risk management strategy to help minimize loss ofcapital and reduce excessive volatility. Pursuant to this strategy, the Fundgenerally invests a substantial amount of its assets in cash and cashequivalents. As a result, the Fund may not achieve its investment objective.
Principal Risks of Investing in the FundAs with any mutual fund investment, loss of money is a risk of investing. Aninvestment in the Fund is not a deposit in a bank and is not insured orguaranteed by the Federal Deposit Insurance Corporation or any othergovernmental agency. The risks associated with an investment in the Fundcan increase during times of significant market volatility. The principal risksof investing in the Fund are:
Cash/Cash Equivalents Risk. In rising markets, holding cash or cashequivalents will negatively affect the Fund’s performance relative to itsbenchmark.
Derivatives Risk. The value of a derivative instrument depends largely on(and is derived from) the value of an underlying security, currency,commodity, interest rate, index or other asset (each referred to as anunderlying asset). In addition to risks relating to the underlying assets, theuse of derivatives may include other, possibly greater, risks, includingcounterparty, leverage and liquidity risks. Counterparty risk is the risk thatthe counterparty to the derivative contract will default on its obligation to paythe Fund the amount owed or otherwise perform under the derivativecontract. Derivatives create leverage risk because they do not requirepayment up front equal to the economic exposure created by owning thederivative. As a result, an adverse change in the value of the underlyingasset could result in the Fund sustaining a loss that is substantially greaterthan the amount invested in the derivative, which may make the Fund’sreturns more volatile and increase the risk of loss. Derivative instrumentsmay also be less liquid than more traditional investments and the Fund maybe unable to sell or close out its derivative positions at a desirable time orprice. This risk may be more acute under adverse market conditions, duringwhich the Fund may be most in need of liquidating its derivative positions.Derivatives may also be harder to value, less tax efficient and subject tochanging government regulation that could impact the Fund’s ability to usecertain derivatives or their cost. Also, derivatives used for hedging or to gainor limit exposure to a particular market segment may not provide theexpected benefits, particularly during adverse market conditions.
Emerging Markets Securities Risk. Emerging markets (also referred toas developing markets) are generally subject to greater market volatility,political, social and economic instability, uncertain trading markets and moregovernmental limitations on foreign investment than more developed
markets. In addition, companies operating in emerging markets may besubject to lower trading volume and greater price fluctuations thancompanies in more developed markets. Securities law and the enforcementof systems of taxation in many emerging market countries may changequickly and unpredictably. In addition, investments in emerging marketssecurities may also be subject to additional transaction costs, delays insettlement procedures, and lack of timely information.
Foreign Securities Risk. The Fund’s foreign investments may beadversely affected by political and social instability, changes in economic ortaxation policies, difficulty in enforcing obligations, decreased liquidity orincreased volatility. Foreign investments also involve the risk of the possibleseizure, nationalization or expropriation of the issuer or foreign deposits (inwhich the Fund could lose its entire investments in a certain market) andthe possible adoption of foreign governmental restrictions such as exchangecontrols. Unless the Fund has hedged its foreign securities risk, foreignsecurities risk also involves the risk of negative foreign currency ratefluctuations, which may cause the value of securities denominated in suchforeign currency (or other instruments through which the Fund has exposureto foreign currencies) to decline in value. Currency exchange rates mayfluctuate significantly over short periods of time. Currency hedgingstrategies, if used, are not always successful.
Management Risk. The Fund is actively managed and depends heavilyon the Adviser’s judgment about markets, interest rates or theattractiveness, relative values, liquidity, or potential appreciation of particularinvestments made for the Fund’s portfolio. The Fund could experiencelosses if these judgments prove to be incorrect. Additionally, legislative,regulatory, or tax developments may adversely affect management of theFund and, therefore, the ability of the Fund to achieve its investmentobjective.
Market Risk. The market values of the Fund’s investments, andtherefore the value of the Fund’s shares, will go up and down, sometimesrapidly or unpredictably. Market risk may affect a single issuer, industry orsection of the economy, or it may affect the market as a whole. Individualstock prices tend to go up and down more dramatically than those of certainother types of investments, such as bonds. During a general downturn in thefinancial markets, multiple asset classes may decline in value. Whenmarkets perform well, there can be no assurance that specific investmentsheld by the Fund will rise in value.
Mid-Capitalization Companies Risk. Mid-capitalization companies tendto be more vulnerable to changing market conditions and may have morelimited product lines and markets, less experienced management and fewerfinancial resources than larger companies. These companies’ securities maybe more volatile and less liquid than those of more established companies,and their returns may vary, sometimes significantly, from the overallsecurities market.
Performance InformationThe bar chart and performance table provide an indication of the risks ofinvesting in the Fund. The bar chart shows changes in the performance ofthe Fund from year to year as of December 31. The performance tablecompares the Fund’s performance to that of a broad-based securitiesmarket benchmark, a style specific benchmark and a peer groupbenchmark comprised of funds with investment objectives and strategiessimilar to those of the Fund. For more information on the benchmarks usedsee the “Benchmark Descriptions” section in the prospectus. The bar chartand performance table below do not reflect charges assessed in connectionwith your variable product; if they did, the performance shown would belower. The Fund’s past performance is not necessarily an indication of itsfuture performance.
All performance shown assumes the reinvestment of dividends andcapital gains and the effect of the Fund’s expenses.
Series I shares are not offered by this prospectus. The Series I sharesand Series II shares invest in the same portfolio of securities and will havesubstantially similar performance, except to the extent that the expenses
2 Invesco V.I. Mid Cap Core Equity Fund invesco.com/us VIMCCE-SUMPRO-2
214
S-214

30%
20%
10%
0%
-10%
-20%
-30%’06 ’07 ’08 ’09 ’10 ’11 ’12 ’13 ’14 ’15
10.98% 9.29% (28.68)% 29.85% 13.78% (6.50)% 10.62% 28.46% 4.17% (4.28)%
borne by each share class differ. Series II shares have higher expenses (andtherefore lower performance) resulting from its Rule 12b-1 plan, whichprovides for a maximum fee equal to an annual rate of 0.25% (expressed asa percentage of average daily net assets of the Fund).
Annual Total Returns
Best Quarter (ended June 30, 2009): 17.70%Worst Quarter (ended December 31, 2008): -22.28%
Average Annual Total Returns (for the periods ended December 31, 2015)
1Year
5Years
10Years
Series II shares: Inception (9/10/2001) -4.28% 5.79% 5.41%............................................................................................................................................S&P 500® Index (reflects no deductions for fees, expenses or taxes) 1.38 12.57 7.31............................................................................................................................................Russell Midcap® Index (reflects no deductions for fees, expenses or
taxes) -2.44 11.44 8.00............................................................................................................................................Lipper VUF Mid-Cap Core Funds Index -4.26 9.57 6.73............................................................................................................................................
Management of the FundInvestment Adviser: Invesco Advisers, Inc. (Invesco or the Adviser)
Portfolio Managers Title Length of Service on the FundRonald Sloan Portfolio Manager (lead) 2001............................................................................................................................................Brian Nelson Portfolio Manager 2007............................................................................................................................................
Purchase and Sale of Fund SharesYou cannot purchase or sell (redeem) shares of the Fund directly. Pleasecontact the insurance company that issued your variable product for moreinformation on the purchase and sale of Fund shares. For more information,see “Other Information—Purchase and Redemption of Shares” in theprospectus.
Tax InformationThe Fund expects, based on its investment objective and strategies, that itsdistributions, if any, will consist of ordinary income, capital gains, or somecombination of both. Because shares of the Fund must be purchasedthrough variable products, such distributions will be exempt from currenttaxation if left to accumulate within the variable product. Consult yourvariable insurance contract prospectus for additional tax information.
Payments to Insurance CompaniesIf you purchase the Fund through an insurance company or other financialintermediary, the Fund and the Fund’s distributor or its related companiesmay pay the intermediary for the sale of Fund shares and related services.These payments may create a conflict of interest by influencing theinsurance company or other intermediary and your salesperson or financialadviser to recommend the Fund over another investment. Ask yoursalesperson or financial adviser or visit your financial intermediary’s Website for more information.
3 Invesco V.I. Mid Cap Core Equity Fund invesco.com/us VIMCCE-SUMPRO-2
215
S-215
Summary Prospectus April 29, 2016
Invesco V.I. Mid Cap Growth Fund
Series I shares
Before you invest, you may want to review the Fund’s prospectus, which contains more information about the Fund and its risks. You can find theFund’s prospectus and other information about the Fund online at www.invesco.com/prospectus. You can also get this information at no cost bycalling (800) 959-4246 or by sending an e-mail request to [email protected]. The Fund’s prospectus and statement of additionalinformation, both dated April 29, 2016 (as each may be amended or supplemented), are incorporated by reference into this Summary Prospectusand may be obtained, free of charge, at the Web site, phone number or e-mail address noted above.
Investment ObjectiveThe Fund’s investment objective is to seek capital growth.
Fees and Expenses of the FundThis table describes the fees and expenses that are incurred, directly orindirectly, when a variable product owner buys, holds, or redeems interest inan insurance company separate account that invests in the Series I sharesof the Fund but does not represent the effect of any fees or other expensesassessed in connection with your variable product, and if it did, expenseswould be higher.
Shareholder Fees (fees paid directly from your investment)
Series I sharesMaximum Sales Charge (Load) Imposed on Purchases (as a percentage ofoffering price) None............................................................................................................................................Maximum Deferred Sales Charge (Load) (as a percentage of originalpurchase price or redemption proceeds, whichever is less) None............................................................................................................................................
Annual Fund Operating Expenses (expenses that you pay each year as a percentage of thevalue of your investment)
Series I sharesManagement Fees 0.75%............................................................................................................................................Distribution and/or Service (12b-1) Fees None............................................................................................................................................Other Expenses 0.32............................................................................................................................................Total Annual Fund Operating Expenses 1.07............................................................................................................................................
Example. This Example is intended to help you compare the cost ofinvesting in the Fund with the cost of investing in other mutual funds.
This Example does not represent the effect of any fees or expensesassessed in connection with your variable product, and if it did, expenseswould be higher.
The Example assumes that you invest $10,000 in the Fund for the timeperiods indicated and then redeem all of your shares at the end of thoseperiods. The Example also assumes that your investment has a 5% returneach year and that the Fund’s operating expenses remain the same.
Although your actual costs may be higher or lower, based on theseassumptions, your costs would be:
1 Year 3 Years 5 Years 10 YearsSeries I shares $109 $340 $590 $1,306............................................................................................................................................
Portfolio Turnover. The Fund pays transaction costs, such ascommissions, when it buys and sells securities (or “turns over” its portfolio).
A higher portfolio turnover rate may indicate higher transaction costs. Thesecosts, which are not reflected in annual Fund operating expenses or in theexample, affect the Fund’s performance. During the most recent fiscal year,the Fund’s portfolio turnover rate was 62% of the average value of itsportfolio.
Principal Investment Strategies of the FundThe Fund invests, under normal circumstances, at least 80% of its netassets (including any borrowings for investment purposes) in equitysecurities of mid-capitalization companies. The Fund invests primarily inequity securities. The principal type of equity security in which the Fundinvests is common stock.
The Fund considers an issuer to be a mid-capitalization issuer if it has amarket capitalization, at the time of purchase, within the range of the largestand smallest capitalized issuers included in the Russell Midcap® GrowthIndex during the most recent 11-month period (based on month-end data)plus the most recent data during the current month. As of December 31,2015, the capitalization of companies in the Russell Midcap® Growth Indexranged from $28.3 million to $28.9 billion.
The Fund may invest up to 25% of its net assets in securities of foreignissuers, which may include securities of issuers located in emergingmarkets countries, i.e., those that are in the early stages of their industrialcycles.
The Fund invests primarily in securities that are considered by theFund’s portfolio manager to have potential for earnings or revenue growth.
Invesco Advisers, Inc. (Invesco or the Adviser), the Fund’s investmentadviser, uses a bottom-up stock selection process designed to seek returnsin excess of the Russell Midcap® Growth Index as well as a disciplinedportfolio construction process designed to manage risk. The Adviser uses aholistic approach that closely examines company fundamentals, includingdetailed modeling of a company’s financial statements and discussions withcompany management teams, suppliers, distributors, competitors, andcustomers. The Adviser uses a variety of valuation techniques based on thecompany in question, the industry in which the company operates, the stageof the company’s business cycle, and other factors that best reflect acompany’s value. The Adviser seeks to invest in companies with attractivegrowth outlooks at compelling valuation levels, including both stable andcatalyst-driven growth opportunities.
The Adviser considers whether to sell a particular security when acompany hits the price target, a company’s fundamentals deteriorate, abetter opportunity emerges, or the catalysts for growth are no longerpresent or reflected in the stock price.
1 Invesco V.I. Mid Cap Growth Fund invesco.com/us VK-VIMCG-SUMPRO-1
216
S-216

75%
50%
25%
0%
-25%
-50%’06 ’07 ’08 ’09 ’10 ’11 ’12 ’13 ’14 ’15
4.92% 17.60% (46.83)% 56.37% 26.96% (8.89)% 11.60% 37.01% 8.04% 1.21%
Principal Risks of Investing in the FundAs with any mutual fund investment, loss of money is a risk of investing. Aninvestment in the Fund is not a deposit in a bank and is not insured orguaranteed by the Federal Deposit Insurance Corporation or any othergovernmental agency. The risks associated with an investment in the Fundcan increase during times of significant market volatility. The principal risksof investing in the Fund are:
Emerging Markets Securities Risk. Emerging markets (also referred toas developing markets) are generally subject to greater market volatility,political, social and economic instability, uncertain trading markets and moregovernmental limitations on foreign investment than more developedmarkets. In addition, companies operating in emerging markets may besubject to lower trading volume and greater price fluctuations thancompanies in more developed markets. Securities law and the enforcementof systems of taxation in many emerging market countries may changequickly and unpredictably. In addition, investments in emerging marketssecurities may also be subject to additional transaction costs, delays insettlement procedures, and lack of timely information.
Foreign Securities Risk. The Fund’s foreign investments may beadversely affected by political and social instability, changes in economic ortaxation policies, difficulty in enforcing obligations, decreased liquidity orincreased volatility. Foreign investments also involve the risk of the possibleseizure, nationalization or expropriation of the issuer or foreign deposits (inwhich the Fund could lose its entire investments in a certain market) andthe possible adoption of foreign governmental restrictions such as exchangecontrols. Unless the Fund has hedged its foreign securities risk, foreignsecurities risk also involves the risk of negative foreign currency ratefluctuations, which may cause the value of securities denominated in suchforeign currency (or other instruments through which the Fund has exposureto foreign currencies) to decline in value. Currency exchange rates mayfluctuate significantly over short periods of time. Currency hedgingstrategies, if used, are not always successful.
Growth Investing Risk. Growth stocks tend to be more expensive relativeto the issuing company’s earnings or assets compared with other types ofstock. As a result, they tend to be more sensitive to changes in, or investors’expectations of, the issuing company’s earnings and can be more volatile.
Management Risk. The Fund is actively managed and depends heavilyon the Adviser’s judgment about markets, interest rates or theattractiveness, relative values, liquidity, or potential appreciation of particularinvestments made for the Fund’s portfolio. The Fund could experiencelosses if these judgments prove to be incorrect. Additionally, legislative,regulatory, or tax developments may adversely affect management of theFund and, therefore, the ability of the Fund to achieve its investmentobjective.
Market Risk. The market values of the Fund’s investments, andtherefore the value of the Fund’s shares, will go up and down, sometimesrapidly or unpredictably. Market risk may affect a single issuer, industry orsection of the economy, or it may affect the market as a whole. Individualstock prices tend to go up and down more dramatically than those of certainother types of investments, such as bonds. During a general downturn in thefinancial markets, multiple asset classes may decline in value. Whenmarkets perform well, there can be no assurance that specific investmentsheld by the Fund will rise in value.
Mid-Capitalization Companies Risk. Mid-capitalization companies tendto be more vulnerable to changing market conditions and may have morelimited product lines and markets, less experienced management and fewerfinancial resources than larger companies. These companies’ securities maybe more volatile and less liquid than those of more established companies,and their returns may vary, sometimes significantly, from the overallsecurities market.
Performance InformationThe bar chart and performance table provide an indication of the risks ofinvesting in the Fund. The bar chart shows changes in the performance of
the Fund from year to year as of December 31. The performance tablecompares the Fund’s and Van Kampen Life Investment Trust Mid CapGrowth Portfolio’s (the predecessor fund) performance to that of abroad-based securities market benchmark, a style specific benchmark anda peer group benchmark comprised of funds with investment objectives andstrategies similar to those of the Fund. For more information on thebenchmarks used see the “Benchmark Descriptions” section in theprospectus. The bar chart and performance table below do not reflectcharges assessed in connection with your variable product; if they did, theperformance shown would be lower. The Fund’s and the predecessor fund’spast performance is not necessarily an indication of its future performance.
The returns shown for periods prior to June 1, 2010 are those of theClass II shares of the predecessor fund, which included 12b-1 fees of0.35% and are not offered by the Fund. The predecessor fund was advisedby Van Kampen Asset Management. The predecessor fund was reorganizedinto Series II shares of the Fund on June 1, 2010. Series I shares’ returnswill be different from the predecessor fund as they have different expenses.
All performance shown assumes the reinvestment of dividends andcapital gains and the effect of the Fund’s expenses.
Annual Total Returns
Best Quarter (ended June 30, 2009): 25.00%Worst Quarter (ended December 31, 2008): -26.88%
Average Annual Total Returns (for the periods ended December 31, 2015)
1Year
5Years
10Years
Series I shares1: Inception (6/1/2010) 1.21% 8.78% 7.09%............................................................................................................................................S&P 500® Index (reflects no deductions for fees, expenses or taxes) 1.38 12.57 7.31............................................................................................................................................Russell Midcap® Growth Index (reflects no deductions for fees,
expenses or taxes) -0.20 11.54 8.16............................................................................................................................................Lipper VUF Mid-Cap Growth Funds Index -0.20 9.57 7.62............................................................................................................................................1 Series I shares’ performance shown prior to the inception date is that of the predecessor
fund’s Class II shares at net asset value and reflects the expenses applicable to thepredecessor fund. The inception date of the predecessor fund’s Class II shares isSeptember 25, 2000.
Management of the FundInvestment Adviser: Invesco Advisers, Inc.
Portfolio Managers Title Length of Service on the FundJames Leach Portfolio Manager (lead) 2011............................................................................................................................................Elizabeth Bernstein Portfolio Manager 2016............................................................................................................................................
Purchase and Sale of Fund SharesYou cannot purchase or sell (redeem) shares of the Fund directly. Pleasecontact the insurance company that issued your variable product for moreinformation on the purchase and sale of Fund shares. For more information,see “Other Information—Purchase and Redemption of Shares” in theprospectus.
Tax InformationThe Fund expects, based on its investment objective and strategies, that itsdistributions, if any, will consist of ordinary income, capital gains, or somecombination of both. Because shares of the Fund must be purchasedthrough variable products, such distributions will be exempt from current
2 Invesco V.I. Mid Cap Growth Fund invesco.com/us VK-VIMCG-SUMPRO-1
217
S-217

taxation if left to accumulate within the variable product. Consult yourvariable insurance contract prospectus for additional tax information.
Payments to Insurance CompaniesIf you purchase the Fund through an insurance company or other financialintermediary, the Fund and the Fund’s distributor or its related companiesmay pay the intermediary for the sale of Fund shares and related services.These payments may create a conflict of interest by influencing theinsurance company or other intermediary and your salesperson or financialadviser to recommend the Fund over another investment. Ask yoursalesperson or financial adviser or visit your financial intermediary’s Website for more information.
3 Invesco V.I. Mid Cap Growth Fund invesco.com/us VK-VIMCG-SUMPRO-1
218
S-218

Summary Prospectus April 29, 2016
Invesco V.I. Small Cap Equity Fund
Series I shares
Before you invest, you may want to review the Fund’s prospectus, which contains more information about the Fund and its risks. You can find theFund’s prospectus and other information about the Fund online at www.invesco.com/prospectus. You can also get this information at no cost bycalling (800) 959-4246 or by sending an e-mail request to [email protected]. The Fund’s prospectus and statement of additionalinformation, both dated April 29, 2016 (as each may be amended or supplemented), are incorporated by reference into this Summary Prospectusand may be obtained, free of charge, at the Web site, phone number or e-mail address noted above.
Investment Objective(s)The Fund’s investment objective is long-term growth of capital.
Fees and Expenses of the FundThis table describes the fees and expenses that are incurred, directly orindirectly, when a variable product owner buys, holds, or redeems interest inan insurance company separate account that invests in the Series I sharesof the Fund but does not represent the effect of any fees or other expensesassessed in connection with your variable product, and if it did, expenseswould be higher.
Shareholder Fees (fees paid directly from your investment)
Series I sharesMaximum Sales Charge (Load) Imposed on Purchases (as a percentage ofoffering price) None............................................................................................................................................Maximum Deferred Sales Charge (Load) (as a percentage of originalpurchase price or redemption proceeds, whichever is less) None............................................................................................................................................
Annual Fund Operating Expenses (expenses that you pay each year as a percentage of thevalue of your investment)
Series I sharesManagement Fees 0.74%............................................................................................................................................Distribution and/or Service (12b-1) Fees None............................................................................................................................................Other Expenses 0.30............................................................................................................................................Total Annual Fund Operating Expenses 1.04............................................................................................................................................
Example. This Example is intended to help you compare the cost ofinvesting in the Fund with the cost of investing in other mutual funds.
This Example does not represent the effect of any fees or expensesassessed in connection with your variable product, and if it did, expenseswould be higher.
The Example assumes that you invest $10,000 in the Fund for the timeperiods indicated and then redeem all of your shares at the end of thoseperiods. The Example also assumes that your investment has a 5% returneach year and that the Fund’s operating expenses remain the same.
Although your actual costs may be higher or lower, based on theseassumptions, your costs would be:
1 Year 3 Years 5 Years 10 YearsSeries I shares $106 $331 $574 $1,271............................................................................................................................................
Portfolio Turnover. The Fund pays transaction costs, such ascommissions, when it buys and sells securities (or “turns over” its portfolio).
A higher portfolio turnover rate may indicate higher transaction costs. Thesecosts, which are not reflected in annual Fund operating expenses or in theexample, affect the Fund’s performance. During the most recent fiscal year,the Fund’s portfolio turnover rate was 31% of the average value of itsportfolio.
Principal Investment Strategies of the FundThe Fund invests, under normal circumstances, at least 80% of its netassets (plus any borrowings for investment purposes) in equity securities ofsmall-capitalization issuers. The principal type of equity securities in whichthe Fund invests is common stock.
The Fund considers an issuer to be a small-capitalization issuer if it hasa market capitalization, at the time of purchase, no larger than the largestcapitalized issuer included in the Russell 2000® Index during the mostrecent 11-month period (based on month-end data) plus the most recentdata during the current month. As of December 31, 2015, the capitalizationof companies in the Russell 2000® Index ranged from $2.2 million to$6.4 billion.
The Fund may also invest up to 25% of its net assets in foreignsecurities.
In selecting investments, the portfolio managers utilize a disciplinedportfolio construction process that aligns the Fund with the S&P SmallCap600® Index, which the portfolio managers believe represents the small capcore asset class. The security selection process is based on a three-stepprocess that includes fundamental, valuation and timeliness analysis.
� Fundamental analysis involves building a series of financial models,as well as conducting in-depth interviews with management. The goalis to find high quality, fundamentally sound issuers operating in anattractive industry
� Valuation analysis focuses on identifying attractively valued securitiesgiven their growth potential over a one- to two-year horizon
� Timeliness analysis is used to help identify the “timeliness” of apurchase. In this step, relative price strength, trading volumecharacteristics, and trend analysis are reviewed for signs ofdeterioration. If a security shows signs of deterioration, it will not beconsidered as a candidate for the portfolio
The portfolio managers consider selling a security if the investmentthesis for owning the security is no longer valid, the stock reaches its pricetarget or timeliness factors indicate that the risk/return characteristics of thestock as viewed in the market are no longer attractive.
1 Invesco V.I. Small Cap Equity Fund invesco.com/us VISCE-SUMPRO-1
219
S-219

40%
20%
0%
-20%
-40%’06 ’07 ’08 ’09 ’10 ’11 ’12 ’13 ’14 ’15
17.44% 5.19% (31.31)% 21.29% 28.54% (0.73)% 13.89% 37.47% 2.36% (5.52)%
Principal Risks of Investing in the FundAs with any mutual fund investment, loss of money is a risk of investing. Aninvestment in the Fund is not a deposit in a bank and is not insured orguaranteed by the Federal Deposit Insurance Corporation or any othergovernmental agency. The risks associated with an investment in the Fundcan increase during times of significant market volatility. The principal risksof investing in the Fund are:
Foreign Securities Risk. The Fund’s foreign investments may beadversely affected by political and social instability, changes in economic ortaxation policies, difficulty in enforcing obligations, decreased liquidity orincreased volatility. Foreign investments also involve the risk of the possibleseizure, nationalization or expropriation of the issuer or foreign deposits (inwhich the Fund could lose its entire investments in a certain market) andthe possible adoption of foreign governmental restrictions such as exchangecontrols. Unless the Fund has hedged its foreign securities risk, foreignsecurities risk also involves the risk of negative foreign currency ratefluctuations, which may cause the value of securities denominated in suchforeign currency (or other instruments through which the Fund has exposureto foreign currencies) to decline in value. Currency exchange rates mayfluctuate significantly over short periods of time. Currency hedgingstrategies, if used, are not always successful.
Management Risk. The Fund is actively managed and depends heavilyon the Adviser’s judgment about markets, interest rates or theattractiveness, relative values, liquidity, or potential appreciation of particularinvestments made for the Fund’s portfolio. The Fund could experiencelosses if these judgments prove to be incorrect. Additionally, legislative,regulatory, or tax developments may adversely affect management of theFund and, therefore, the ability of the Fund to achieve its investmentobjective.
Market Risk. The market values of the Fund’s investments, andtherefore the value of the Fund’s shares, will go up and down, sometimesrapidly or unpredictably. Market risk may affect a single issuer, industry orsection of the economy, or it may affect the market as a whole. Individualstock prices tend to go up and down more dramatically than those of certainother types of investments, such as bonds. During a general downturn in thefinancial markets, multiple asset classes may decline in value. Whenmarkets perform well, there can be no assurance that specific investmentsheld by the Fund will rise in value.
Sector Focus Risk. The Fund may from time to time invest a significantamount of its assets (i.e. over 25%) in one market sector or group of relatedindustries. In this event, the Fund’s performance will depend to a greaterextent on the overall condition of the sector or group of industries and thereis increased risk that the Fund will lose significant value if conditionsadversely affect that sector or group of industries.
Small- and Mid-Capitalization Companies Risks. Small- andmid-capitalization companies tend to be more vulnerable to changingmarket conditions, may have little or no operating history or track record ofsuccess, and may have more limited product lines and markets, lessexperienced management and fewer financial resources than largercompanies. These companies’ securities may be more volatile and lessliquid than those of more established companies, and their returns mayvary, sometimes significantly, from the overall securities market.
Performance InformationThe bar chart and performance table provide an indication of the risks ofinvesting in the Fund. The bar chart shows changes in the performance ofthe Fund from year to year as of December 31. The performance tablecompares the Fund’s performance to that of a broad-based securitiesmarket benchmark, a style specific benchmark and a peer groupbenchmark comprised of funds with investment objectives and strategiessimilar to those of the Fund. For more information on the benchmarks usedsee the “Benchmark Descriptions” section in the prospectus. The bar chartand performance table below do not reflect charges assessed in connectionwith your variable product; if they did, the performance shown would be
lower. The Fund’s past performance is not necessarily an indication of itsfuture performance.
All performance shown assumes the reinvestment of dividends andcapital gains and the effect of the Fund’s expenses.
Annual Total Returns
Best Quarter (ended June 30, 2009): 20.02%Worst Quarter (ended December 31, 2008): -23.80%
Average Annual Total Returns (for the periods ended December 31, 2015)
1Year
5Years
10Years
Series I shares: Inception (8/29/2003) -5.52% 8.49% 7.12%............................................................................................................................................S&P 500® Index (reflects no deductions for fees, expenses or taxes) 1.38 12.57 7.31............................................................................................................................................Russell 2000® Index (reflects no deductions for fees, expenses or
taxes) -4.41 9.19 6.80............................................................................................................................................Lipper VUF Small-Cap Core Funds Index -4.43 8.79 6.28............................................................................................................................................
Management of the FundInvestment Adviser: Invesco Advisers, Inc. (Invesco or the Adviser)
Portfolio Managers Title Length of Service on the FundJuliet Ellis Portfolio Manager (lead) 2004............................................................................................................................................Juan Hartsfield Portfolio Manager 2006............................................................................................................................................Davis Paddock Portfolio Manager 2016............................................................................................................................................
Purchase and Sale of Fund SharesYou cannot purchase or sell (redeem) shares of the Fund directly. Pleasecontact the insurance company that issued your variable product for moreinformation on the purchase and sale of Fund shares. For more information,see “Other Information—Purchase and Redemption of Shares” in theprospectus.
Tax InformationThe Fund expects, based on its investment objective and strategies, that itsdistributions, if any, will consist of ordinary income, capital gains, or somecombination of both. Because shares of the Fund must be purchasedthrough variable products, such distributions will be exempt from currenttaxation if left to accumulate within the variable product. Consult yourvariable insurance contract prospectus for additional tax information.
Payments to Insurance CompaniesIf you purchase the Fund through an insurance company or other financialintermediary, the Fund and the Fund’s distributor or its related companiesmay pay the intermediary for the sale of Fund shares and related services.These payments may create a conflict of interest by influencing theinsurance company or other intermediary and your salesperson or financialadviser to recommend the Fund over another investment. Ask yoursalesperson or financial adviser or visit your financial intermediary’s Website for more information.
2 Invesco V.I. Small Cap Equity Fund invesco.com/us VISCE-SUMPRO-1
220
S-220
Before you invest, you may want to review the Portfolio’s Prospectus, whichcontains more information about the Portfolio and its risks. You can find thePortfolio’s Prospectus and other information about the Portfolio online atjanus.com/variable-insurance. You can also get this information at no cost bycalling a Janus representative at 1-877-335-2687 or by sending an email requestto [email protected].
SUMMARY PROSPECTUS DATED MAY 1, 2016
Balanced PortfolioTicker: N/A Service Shares
INVESTMENT OBJECTIVE
Balanced Portfolio seeks long-term capital growth, consistent with preservation of capital and balanced by current income.
FEES AND EXPENSES OF THE PORTFOLIO
This table describes the fees and expenses that you may pay if you buy and hold Shares of the Portfolio. Owners of variableinsurance contracts that invest in the Shares should refer to the variable insurance contract prospectus for adescription of fees and expenses, as the following table and examples do not reflect deductions at the separateaccount level or contract level for any charges that may be incurred under a contract. Inclusion of these chargeswould increase the fees and expenses described below.
ANNUAL FUND OPERATING EXPENSES(expenses that you pay each year as a percentage of the value of your investment)
Management Fees 0.55%
Distribution/Service (12b-1) Fees 0.25%
Other Expenses 0.09%
Total Annual Fund Operating Expenses 0.89%
EXAMPLE:The Example is intended to help you compare the cost of investing in the Portfolio with the cost of investing in other mutualfunds. The Example assumes that you invest $10,000 in the Portfolio for the time periods indicated, reinvest all dividendsand distributions, and then redeem all of your Shares at the end of each period. The Example also assumes that yourinvestment has a 5% return each year and that the Portfolio’s operating expenses remain the same. Although your actual costsmay be higher or lower, based on these assumptions your costs would be:
1 Year 3 Years 5 Years 10 Years
Service Shares $ 91 $ 284 $ 493 $ 1,096
Portfolio Turnover: The Portfolio pays transaction costs, such as commissions, when it buys and sells securities (or “turnsover” its portfolio). A higher portfolio turnover rate may indicate higher transaction costs. These costs, which are not reflectedin annual fund operating expenses or in the Example, affect the Portfolio’s performance. During the most recent fiscal year,the Portfolio’s turnover rate was 73% of the average value of its portfolio.
PRINCIPAL INVESTMENT STRATEGIES
The Portfolio pursues its investment objective by normally investing 35-65% of its assets in equity securities and theremaining assets in fixed-income securities and cash equivalents. The Portfolio normally invests at least 25% of its assets infixed-income senior securities. The Portfolio’s fixed-income investments may reflect a broad range of credit qualities and mayinclude corporate debt securities, U.S. Government obligations, mortgage-backed securities and other mortgage-relatedproducts, and short-term securities. In addition, the Portfolio may invest up to 35% of its net assets in high-yield/high-riskbonds, also known as “junk” bonds. The Portfolio may also invest in foreign securities, which may include investments inemerging markets. As of December 31, 2015, approximately 60.75% of the Portfolio’s assets were held in equity securities,including common stocks and preferred stocks.
In choosing investments for the Portfolio, the portfolio managers apply a “bottom up” approach with two portfolio managersfocusing on the equity portion of the Portfolio and the other portfolio managers focusing on the fixed-income portion of thePortfolio. With respect to corporate issuers, the portfolio managers look at companies one at a time to determine if acompany is an attractive investment opportunity and if it is consistent with the Portfolio’s investment policies. The portfolio
1 Balanced Portfolio 109-56-81024 05-16
221
S-221
managers may also consider economic factors, such as the effect of interest rates on certain of the Portfolio’s fixed-incomeinvestments. The portfolio managers share day-to-day responsibility for the Portfolio’s investments.
The Portfolio may also invest its assets in derivatives, which are instruments that have a value derived from, or directly linkedto, an underlying asset, such as equity securities, fixed-income securities, commodities, currencies, interest rates, or marketindices. In particular, the Portfolio may use forward currency contracts to offset risks associated with an investment, currencyexposure, or market conditions.
The Portfolio may lend portfolio securities on a short-term or long-term basis, in an amount equal to up to one-third of itstotal assets as determined at the time of the loan origination.
PRINCIPAL INVESTMENT RISKS
The biggest risk is that the Portfolio’s returns will vary, and you could lose money. The Portfolio is designed for long-terminvestors seeking a balanced portfolio, including common stocks and bonds. Common stocks tend to be more volatile thanmany other investment choices.
Market Risk. The value of the Portfolio’s holdings may decrease if the value of an individual company or security, or multiplecompanies or securities, in the Portfolio decreases or if the portfolio managers’ belief about a company’s intrinsic worth isincorrect. Further, regardless of how well individual companies or securities perform, the value of the Portfolio’s holdingscould also decrease if there are deteriorating economic or market conditions. It is important to understand that the value ofyour investment may fall, sometimes sharply, in response to changes in the market, and you could lose money. Market riskmay affect a single issuer, industry, economic sector, or the market as a whole.
Growth Securities Risk. The Portfolio invests in companies after assessing their growth potential. Securities of companiesperceived to be “growth” companies may be more volatile than other stocks and may involve special risks. If the portfoliomanagers’ perception of a company’s growth potential is not realized, the securities purchased may not perform as expected,reducing the Portfolio’s returns. In addition, because different types of stocks tend to shift in and out of favor depending onmarket and economic conditions, “growth” stocks may perform differently from the market as a whole and other types ofsecurities.
Fixed-Income Securities Risk. The Portfolio may hold debt and other fixed-income securities to generate income. Typically,the values of fixed-income securities change inversely with prevailing interest rates. Therefore, a fundamental risk of fixed-income securities is interest rate risk, which is the risk that the value of such securities will generally decline as prevailinginterest rates rise, which may cause the Portfolio’s net asset value to likewise decrease. For example, while securities withlonger maturities and durations tend to produce higher yields, they also tend to be more sensitive to changes in prevailinginterest rates and are therefore more volatile than shorter-term securities and are subject to greater market fluctuations as aresult of changes in interest rates. The Portfolio may be subject to heightened interest rate risk because the Federal Reservehas ended its monetary stimulus program known as quantitative easing and interest rates are at historically low levels. Theconclusion of quantitative easing and/or rising interest rates may expose fixed-income markets to increased volatility and mayreduce the liquidity of certain Portfolio investments. These developments could cause the Portfolio’s net asset value tofluctuate or make it more difficult for the Portfolio to accurately value its securities. These developments or others also couldcause the Portfolio to face increased shareholder redemptions, which could force the Portfolio to liquidate investments atdisadvantageous times or prices, therefore adversely affecting the Portfolio as well as the value of your investment. Theamount of assets deemed illiquid remaining within the Portfolio may also increase, making it more difficult to meetshareholder redemptions and further adversely affecting the value of the Portfolio. How specific fixed-income securities mayreact to changes in interest rates will depend on the specific characteristics of each security. Fixed-income securities are alsosubject to credit risk, prepayment risk, valuation risk, and liquidity risk. Credit risk is the risk that the credit strength of anissuer of a fixed-income security will weaken and/or that the issuer will be unable to make timely principal and interestpayments and that the security may go into default. Prepayment risk is the risk that during periods of falling interest rates,certain fixed-income securities with higher interest rates, such as mortgage- and asset-backed securities, may be prepaid bytheir issuers thereby reducing the amount of interest payments. Valuation risk is the risk that one or more of the fixed-income securities in which the Portfolio invests are priced differently than the value realized upon such security’s sale. Intimes of market instability, valuation may be more difficult. Liquidity risk is the risk that fixed-income securities may bedifficult or impossible to sell at the time that the portfolio managers would like or at the price the portfolio managers believe
2 Janus Aspen Series
222
S-222

the security is currently worth. Liquidity risk may be increased to the extent that the Portfolio invests in Rule 144A andrestricted securities.
Sovereign Debt Risk. The Portfolio may invest in U.S. and non-U.S. government debt securities (“sovereign debt”).Investments in U.S. sovereign debt are considered low risk. However, investments in non-U.S. sovereign debt can involve ahigh degree of risk, including the risk that the governmental entity that controls the repayment of sovereign debt may not bewilling or able to repay the principal and/or to pay the interest on its sovereign debt in a timely manner. A sovereign debtor’swillingness or ability to satisfy its debt obligation may be affected by various factors including, but not limited to, its cashflow situation, the extent of its foreign currency reserves, the availability of foreign exchange when a payment is due, and therelative size of its debt position in relation to its economy as a whole. In the event of default, there may be limited or no legalremedies for collecting sovereign debt and there may be no bankruptcy proceedings through which the Portfolio may collectall or part of the sovereign debt that a governmental entity has not repaid. In addition, to the extent the Portfolio invests innon-U.S. sovereign debt, it may be subject to currency risk.
Mortgage- and Asset-Backed Securities Risk. Mortgage- and asset-backed securities represent interests in “pools” ofcommercial or residential mortgages or other assets, including consumer loans or receivables. Mortgage- and asset-backedsecurities tend to be more sensitive to changes in interest rates than other types of debt securities. Investments in mortgage-and asset-backed securities are subject to both extension risk, where borrowers pay off their debt obligations more slowly intimes of rising interest rates, and prepayment risk, where borrowers pay off their debt obligations sooner than expected intimes of declining interest rates. These risks may reduce the Portfolio’s returns. In addition, investments in mortgage- andasset-backed securities, including those comprised of subprime mortgages, may be subject to a higher degree of credit risk,valuation risk, and liquidity risk than various other types of fixed-income securities.
Foreign Exposure Risk. The Portfolio may have exposure to foreign markets as a result of its investments in foreignsecurities, including investments in emerging markets, which can be more volatile than the U.S. markets. As a result, itsreturns and net asset value may be affected to a large degree by fluctuations in currency exchange rates or political oreconomic conditions in a particular country. In some foreign markets, there may not be protection against failure by otherparties to complete transactions. It may not be possible for the Portfolio to repatriate capital, dividends, interest, and otherincome from a particular country or governmental entity. In addition, a market swing in one or more countries or regionswhere the Portfolio has invested a significant amount of its assets may have a greater effect on the Portfolio’s performancethan it would in a more geographically diversified portfolio. To the extent the Portfolio invests in foreign debt securities, suchinvestments are sensitive to changes in interest rates. Additionally, investments in securities of foreign governments involvethe risk that a foreign government may not be willing or able to pay interest or repay principal when due. The Portfolio’sinvestments in emerging market countries may involve risks greater than, or in addition to, the risks of investing in moredeveloped countries.
High-Yield/High-Risk Bond Risk. High-yield/high-risk bonds (also known as “junk” bonds) may be more sensitive than othertypes of bonds to economic changes, political changes, or adverse developments specific to the company that issued thebond, which may adversely affect their value.
Derivatives Risk. Derivatives can be highly volatile and involve risks in addition to the risks of the underlying referencedsecurities. Gains or losses from a derivative investment can be substantially greater than the derivative’s original cost, and cantherefore involve leverage. Leverage may cause the Portfolio to be more volatile than if it had not used leverage. Derivativescan be less liquid than other types of investments and entail the risk that the counterparty will default on its paymentobligations. To the extent that the Portfolio uses forward currency contracts, there is a risk that unanticipated changes incurrency prices may negatively impact the Portfolio’s performance, among other things.
Securities Lending Risk. The Portfolio may seek to earn additional income through lending its securities to certain qualifiedbroker-dealers and institutions. There is the risk that when portfolio securities are lent, the securities may not be returned ona timely basis, and the Portfolio may experience delays and costs in recovering the security or gaining access to the collateralprovided to the Portfolio to collateralize the loan. If the Portfolio is unable to recover a security on loan, the Portfolio mayuse the collateral to purchase replacement securities in the market. There is a risk that the value of the collateral coulddecrease below the cost of the replacement security by the time the replacement investment is made, resulting in a loss to thePortfolio.
3 Balanced Portfolio
223
S-223

Management Risk. The Portfolio is an actively managed investment portfolio and is therefore subject to the risk that theinvestment strategies employed for the Portfolio may fail to produce the intended results. The Portfolio may underperform itsbenchmark index or other mutual funds with similar investment objectives.
An investment in the Portfolio is not a bank deposit and is not insured or guaranteed by the Federal Deposit Insurance Corporation orany other government agency.
PERFORMANCE INFORMATION
The following information provides some indication of the risks of investing in the Portfolio by showing how the Portfolio’sperformance has varied over time. The Portfolio’s Service Shares commenced operations on December 31, 1999. The returnsshown for the Service Shares for periods prior to December 31, 1999 reflect the historical performance of a different class ofshares (the Institutional Shares), restated based on the Service Shares’ estimated fees and expenses (ignoring any fee andexpense limitations). The bar chart depicts the change in performance from year to year during the periods indicated, butdoes not include charges or expenses attributable to any insurance product, which would lower the performance illustrated.The Portfolio does not impose any sales or other charges that would affect total return computations. Total return figuresinclude the effect of the Portfolio’s expenses. The table compares the average annual returns for the Service Shares of thePortfolio for the periods indicated to broad-based securities market indices. The indices are not actively managed and are notavailable for direct investment. All figures assume reinvestment of dividends and distributions.
The Portfolio’s past performance does not necessarily indicate how it will perform in the future. Updated performance information isavailable at janus.com/variable-insurance or by calling 1-877-335-2687.
Annual Total Returns for Service Shares (calendar year-end)
2006 2007 2008 2009 2010 2011 2012 2013 2014 2015
10.41% 10.29%
– 16.06%
25.58%
8.12%1.35%
13.37%19.80%
8.24%0.41%
Best Quarter: 3rd Quarter 2009 11.42% Worst Quarter: 3rd Quarter 2011 – 11.06%
Average Annual Total Returns (periods ended 12/31/15)
1 Year 5 Years 10 Years
SinceInception(9/13/93)
Balanced Portfolio
Service Shares 0.41% 8.39% 7.58% 9.65%
S&P 500® Index(reflects no deduction for fees, expenses, or taxes)
1.38% 12.57% 7.31% 9.01%
Barclays U.S. Aggregate Bond Index(reflects no deduction for fees, expenses, or taxes)
0.55% 3.25% 4.51% 5.41%
Balanced Index(reflects no deduction for fees, expenses, or taxes)
1.25% 8.48% 6.30% 7.65%
The Portfolio’s primary benchmark index is the S&P 500® Index. The Portfolio also compares its performance to theBarclays U.S. Aggregate Bond Index and the Balanced Index. The indices are described below.
• The S&P 500® Index is a commonly recognized, market-capitalization weighted index of 500 widely held equity securities,designed to measure broad U.S. equity performance.
4 Janus Aspen Series
224
S-224
• The Barclays U.S. Aggregate Bond Index is made up of the Barclays U.S. Government/Corporate Bond Index, Mortgage-Backed Securities Index, and Asset-Backed Securities Index, including securities that are of investment grade quality orbetter, have at least one year to maturity, and have an outstanding par value of at least $100 million.
• The Balanced Index is an internally-calculated, hypothetical combination of unmanaged indices that combines total returnsfrom the S&P 500® Index (55%) and the Barclays U.S. Aggregate Bond Index (45%).
MANAGEMENT
Investment Adviser: Janus Capital Management LLC
Portfolio Managers: Jeremiah Buckley, CFA, is Executive Vice President and Co-Portfolio Manager of the Portfolio, whichhe has co-managed since December 2015. Marc Pinto, CFA, is Executive Vice President and Co-Portfolio Manager of thePortfolio, which he has co-managed since May 2005. Mayur Saigal is Executive Vice President and Co-Portfolio Manager ofthe Portfolio, which he has co-managed since December 2015. Darrell Watters is Executive Vice President and Co-PortfolioManager of the Portfolio, which he has co-managed since December 2015.
PURCHASE AND SALE OF PORTFOLIO SHARES
Purchases of Shares may be made only by the separate accounts of insurance companies for the purpose of funding variableinsurance contracts or by certain qualified retirement plans. Redemptions, like purchases, may be effected only through theseparate accounts of participating insurance companies or through qualified retirement plans. Requests are duly processed atthe NAV next calculated after your order is received in good order by the Portfolio or its agents. Refer to the appropriateseparate account prospectus or plan documents for details.
TAX INFORMATION
Because Shares of the Portfolio may be purchased only through variable insurance contracts and certain qualified retirementplans, it is anticipated that any income dividends or net capital gains distributions made by the Portfolio will be exempt fromcurrent federal income taxation if left to accumulate within the variable insurance contract or qualified retirement plan. Thefederal income tax status of your investment depends on the features of your qualified retirement plan or variable insurancecontract.
PAYMENTS TO INSURERS, BROKER-DEALERS, AND OTHER FINANCIAL INTERMEDIARIES
Portfolio shares are generally available only through an insurer’s variable contracts, or through certain employer or otherretirement plans (Retirement Products). Retirement Products are generally purchased through a broker-dealer or otherfinancial intermediary. The Portfolio or its distributor (and/or their related companies) may make payments to the insurerand/or its related companies for distribution and/or other services; some of the payments may go to broker-dealers and otherfinancial intermediaries. These payments may create a conflict of interest for an intermediary, or be a factor in the insurer’sdecision to include the Portfolio as an underlying investment option in a variable contract. Ask your financial advisor, visityour intermediary’s website, or consult your insurance contract prospectus for more information.
5 Balanced Portfolio
225
S-225

Before you invest, you may want to review the Portfolio’s Prospectus, whichcontains more information about the Portfolio and its risks. You can find thePortfolio’s Prospectus and other information about the Portfolio online atjanus.com/variable-insurance. You can also get this information at no cost bycalling a Janus representative at 1-877-335-2687 or by sending an email requestto [email protected].
SUMMARY PROSPECTUS DATED MAY 1, 2016
Enterprise PortfolioTicker: N/A Service Shares
INVESTMENT OBJECTIVE
Enterprise Portfolio seeks long-term growth of capital.
FEES AND EXPENSES OF THE PORTFOLIO
This table describes the fees and expenses that you may pay if you buy and hold Shares of the Portfolio. Owners of variableinsurance contracts that invest in the Shares should refer to the variable insurance contract prospectus for adescription of fees and expenses, as the following table and examples do not reflect deductions at the separateaccount level or contract level for any charges that may be incurred under a contract. Inclusion of these chargeswould increase the fees and expenses described below.
ANNUAL FUND OPERATING EXPENSES(expenses that you pay each year as a percentage of the value of your investment)
Management Fees 0.64%
Distribution/Service (12b-1) Fees 0.25%
Other Expenses 0.10%
Total Annual Fund Operating Expenses 0.99%
EXAMPLE:The Example is intended to help you compare the cost of investing in the Portfolio with the cost of investing in other mutualfunds. The Example assumes that you invest $10,000 in the Portfolio for the time periods indicated, reinvest all dividendsand distributions, and then redeem all of your Shares at the end of each period. The Example also assumes that yourinvestment has a 5% return each year and that the Portfolio’s operating expenses remain the same. Although your actual costsmay be higher or lower, based on these assumptions your costs would be:
1 Year 3 Years 5 Years 10 Years
Service Shares $ 101 $ 315 $ 547 $ 1,213
Portfolio Turnover: The Portfolio pays transaction costs, such as commissions, when it buys and sells securities (or “turnsover” its portfolio). A higher portfolio turnover rate may indicate higher transaction costs. These costs, which are not reflectedin annual fund operating expenses or in the Example, affect the Portfolio’s performance. During the most recent fiscal year,the Portfolio’s turnover rate was 22% of the average value of its portfolio.
PRINCIPAL INVESTMENT STRATEGIES
The Portfolio pursues its investment objective by investing primarily in common stocks selected for their growth potential,and normally invests at least 50% of its equity assets in medium-sized companies. Medium-sized companies are those whosemarket capitalization falls within the range of companies in the Russell Midcap® Growth Index. Market capitalization is acommonly used measure of the size and value of a company. The market capitalizations within the index will vary, but as ofDecember 31, 2015, they ranged from approximately $717 million to $30.4 billion. The Portfolio may also invest in foreignsecurities, which may include investments in emerging markets.
The portfolio manager applies a “bottom up” approach in choosing investments. In other words, the portfolio manager looksat companies one at a time to determine if a company is an attractive investment opportunity and if it is consistent with thePortfolio’s investment policies.
The Portfolio may also invest its assets in derivatives, which are instruments that have a value derived from, or directly linkedto, an underlying asset, such as equity securities, fixed-income securities, commodities, currencies, interest rates, or marketindices. In particular, the Portfolio may use forward currency contracts to offset risks associated with an investment, currencyexposure, or market conditions, or to hedge currency exposure relative to the Portfolio’s benchmark index.
1 Enterprise Portfolio 109-56-81124 05-16
226
S-226

The Portfolio may lend portfolio securities on a short-term or long-term basis, in an amount equal to up to one-third of itstotal assets as determined at the time of the loan origination.
PRINCIPAL INVESTMENT RISKS
The biggest risk is that the Portfolio’s returns will vary, and you could lose money. The Portfolio is designed for long-terminvestors seeking an equity portfolio, including common stocks. Common stocks tend to be more volatile than many otherinvestment choices.
Market Risk. The value of the Portfolio’s holdings may decrease if the value of an individual company or security, or multiplecompanies or securities, in the Portfolio decreases or if the portfolio manager’s belief about a company’s intrinsic worth isincorrect. Further, regardless of how well individual companies or securities perform, the value of the Portfolio’s holdingscould also decrease if there are deteriorating economic or market conditions. It is important to understand that the value ofyour investment may fall, sometimes sharply, in response to changes in the market, and you could lose money. Market riskmay affect a single issuer, industry, economic sector, or the market as a whole.
Mid-Sized Companies Risk. The Portfolio’s investments in securities issued by mid-sized companies may involve greater risksthan are customarily associated with larger, more established companies. Securities issued by mid-sized companies tend to bemore volatile than securities issued by larger or more established companies and may underperform as compared to thesecurities of larger companies.
Growth Securities Risk. The Portfolio invests in companies after assessing their growth potential. Securities of companiesperceived to be “growth” companies may be more volatile than other stocks and may involve special risks. If the portfoliomanager’s perception of a company’s growth potential is not realized, the securities purchased may not perform as expected,reducing the Portfolio’s returns. In addition, because different types of stocks tend to shift in and out of favor depending onmarket and economic conditions, “growth” stocks may perform differently from the market as a whole and other types ofsecurities.
Foreign Exposure Risk. The Portfolio may have exposure to foreign markets as a result of its investments in foreignsecurities, including investments in emerging markets, which can be more volatile than the U.S. markets. As a result, itsreturns and net asset value may be affected to a large degree by fluctuations in currency exchange rates or political oreconomic conditions in a particular country. In some foreign markets, there may not be protection against failure by otherparties to complete transactions. It may not be possible for the Portfolio to repatriate capital, dividends, interest, and otherincome from a particular country or governmental entity. In addition, a market swing in one or more countries or regionswhere the Portfolio has invested a significant amount of its assets may have a greater effect on the Portfolio’s performancethan it would in a more geographically diversified portfolio. To the extent the Portfolio invests in foreign debt securities, suchinvestments are sensitive to changes in interest rates. Additionally, investments in securities of foreign governments involvethe risk that a foreign government may not be willing or able to pay interest or repay principal when due.
Real Estate Securities Risk. The Portfolio’s performance may be affected by the risks associated with investments in realestate-related companies. The value of real estate-related companies’ securities is sensitive to changes in real estate values andrental income, property taxes, interest rates, tax and regulatory requirements, supply and demand, and the management skilland creditworthiness of the company. Investments in REITs involve the same risks as other real estate investments. Inaddition, a REIT could fail to qualify for tax-free pass-through of its income under the Internal Revenue Code or fail tomaintain its exemption from registration under the Investment Company Act of 1940, as amended, which could produceadverse economic consequences for the REIT and its investors, including the Portfolio.
Derivatives Risk. Derivatives can be highly volatile and involve risks in addition to the risks of the underlying referencedsecurities. Gains or losses from a derivative investment can be substantially greater than the derivative’s original cost, and cantherefore involve leverage. Leverage may cause the Portfolio to be more volatile than if it had not used leverage. Derivativescan be less liquid than other types of investments and entail the risk that the counterparty will default on its paymentobligations. To the extent that the Portfolio uses forward currency contracts, there is a risk that unanticipated changes incurrency prices may negatively impact the Portfolio’s performance, among other things.
Securities Lending Risk. The Portfolio may seek to earn additional income through lending its securities to certain qualifiedbroker-dealers and institutions. There is the risk that when portfolio securities are lent, the securities may not be returned ona timely basis, and the Portfolio may experience delays and costs in recovering the security or gaining access to the collateral
2 Janus Aspen Series
227
S-227

provided to the Portfolio to collateralize the loan. If the Portfolio is unable to recover a security on loan, the Portfolio mayuse the collateral to purchase replacement securities in the market. There is a risk that the value of the collateral coulddecrease below the cost of the replacement security by the time the replacement investment is made, resulting in a loss to thePortfolio.
Management Risk. The Portfolio is an actively managed investment portfolio and is therefore subject to the risk that theinvestment strategies employed for the Portfolio may fail to produce the intended results. The Portfolio may underperform itsbenchmark index or other mutual funds with similar investment objectives.
An investment in the Portfolio is not a bank deposit and is not insured or guaranteed by the Federal Deposit Insurance Corporation orany other government agency.
PERFORMANCE INFORMATION
The following information provides some indication of the risks of investing in the Portfolio by showing how the Portfolio’sperformance has varied over time. The Portfolio’s Service Shares commenced operations on December 31, 1999. The returnsshown for the Service Shares for periods prior to December 31, 1999 reflect the historical performance of a different class ofshares (the Institutional Shares), restated based on the Service Shares’ estimated fees and expenses (ignoring any fee andexpense limitations). The bar chart depicts the change in performance from year to year during the periods indicated, butdoes not include charges or expenses attributable to any insurance product, which would lower the performance illustrated.The Portfolio does not impose any sales or other charges that would affect total return computations. Total return figuresinclude the effect of the Portfolio’s expenses. The table compares the average annual returns for the Service Shares of thePortfolio for the periods indicated to a broad-based securities market index. The index is not actively managed and is notavailable for direct investment. All figures assume reinvestment of dividends and distributions.
The Portfolio’s past performance does not necessarily indicate how it will perform in the future. Updated performance information isavailable at janus.com/variable-insurance or by calling 1-877-335-2687.
Annual Total Returns for Service Shares (calendar year-end)
2006 2007 2008 2009 2010 2011 2012 2013 2014 2015
13.31%21.74%
– 43.86%
44.44%
25.52%
– 1.65%
16.99%32.04%
12.24%3.77%
Best Quarter: 2nd Quarter 2009 22.06% Worst Quarter: 4th Quarter 2008 – 29.14%
Average Annual Total Returns (periods ended 12/31/15)
1 Year 5 Years 10 Years
SinceInception(9/13/93)
Enterprise Portfolio
Service Shares 3.77% 12.09% 9.53% 10.05%
Russell Midcap® Growth Index(reflects no deduction for fees, expenses, or taxes)
– 0.20% 11.54% 8.16% 9.31%
The Portfolio’s primary benchmark index is the Russell Midcap® Growth Index. The index is described below.
• The Russell Midcap® Growth Index measures the performance of those Russell Midcap® companies with higher price-to-book ratios and higher forecasted growth values. The stocks are also members of the Russell 1000® Growth Index.
3 Enterprise Portfolio
228
S-228

MANAGEMENT
Investment Adviser: Janus Capital Management LLC
Portfolio Manager: Brian Demain, CFA, is Executive Vice President and Portfolio Manager of the Portfolio, which he hasmanaged since November 2007.
PURCHASE AND SALE OF PORTFOLIO SHARES
Purchases of Shares may be made only by the separate accounts of insurance companies for the purpose of funding variableinsurance contracts or by certain qualified retirement plans. Redemptions, like purchases, may be effected only through theseparate accounts of participating insurance companies or through qualified retirement plans. Requests are duly processed atthe NAV next calculated after your order is received in good order by the Portfolio or its agents. Refer to the appropriateseparate account prospectus or plan documents for details.
TAX INFORMATION
Because Shares of the Portfolio may be purchased only through variable insurance contracts and certain qualified retirementplans, it is anticipated that any income dividends or net capital gains distributions made by the Portfolio will be exempt fromcurrent federal income taxation if left to accumulate within the variable insurance contract or qualified retirement plan. Thefederal income tax status of your investment depends on the features of your qualified retirement plan or variable insurancecontract.
PAYMENTS TO INSURERS, BROKER-DEALERS, AND OTHER FINANCIAL INTERMEDIARIES
Portfolio shares are generally available only through an insurer’s variable contracts, or through certain employer or otherretirement plans (Retirement Products). Retirement Products are generally purchased through a broker-dealer or otherfinancial intermediary. The Portfolio or its distributor (and/or their related companies) may make payments to the insurerand/or its related companies for distribution and/or other services; some of the payments may go to broker-dealers and otherfinancial intermediaries. These payments may create a conflict of interest for an intermediary, or be a factor in the insurer’sdecision to include the Portfolio as an underlying investment option in a variable contract. Ask your financial advisor, visityour intermediary’s website, or consult your insurance contract prospectus for more information.
4 Janus Aspen Series
229
S-229
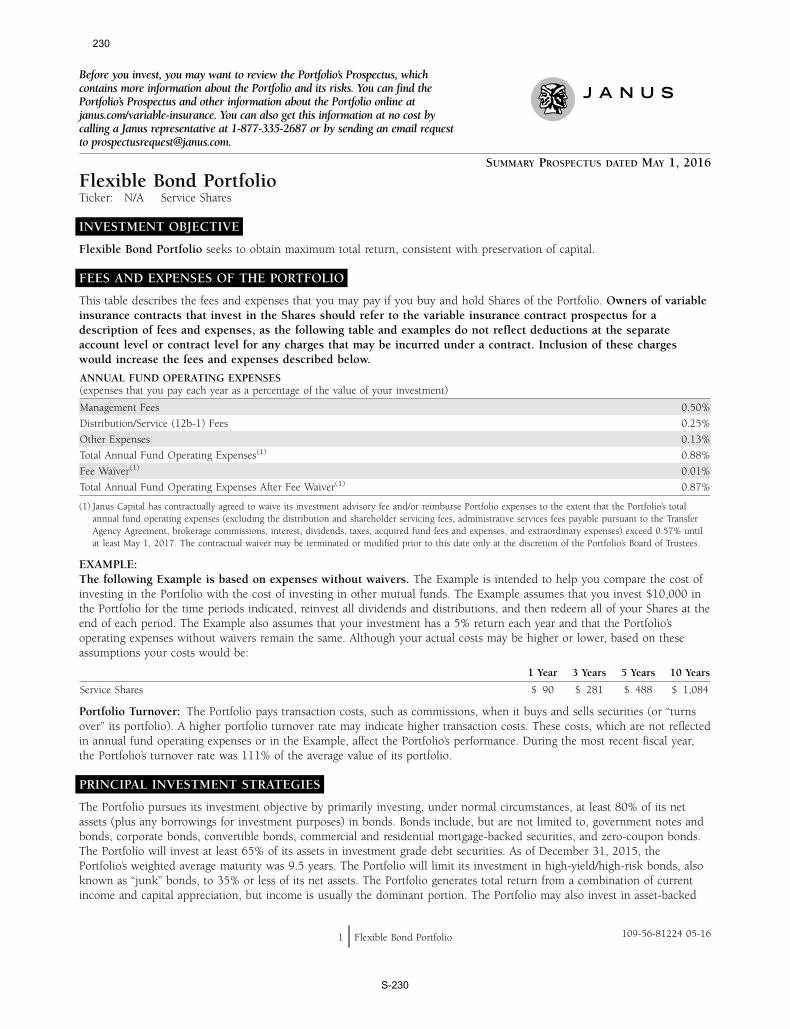
Before you invest, you may want to review the Portfolio’s Prospectus, whichcontains more information about the Portfolio and its risks. You can find thePortfolio’s Prospectus and other information about the Portfolio online atjanus.com/variable-insurance. You can also get this information at no cost bycalling a Janus representative at 1-877-335-2687 or by sending an email requestto [email protected].
SUMMARY PROSPECTUS DATED MAY 1, 2016
Flexible Bond PortfolioTicker: N/A Service Shares
INVESTMENT OBJECTIVE
Flexible Bond Portfolio seeks to obtain maximum total return, consistent with preservation of capital.
FEES AND EXPENSES OF THE PORTFOLIO
This table describes the fees and expenses that you may pay if you buy and hold Shares of the Portfolio. Owners of variableinsurance contracts that invest in the Shares should refer to the variable insurance contract prospectus for adescription of fees and expenses, as the following table and examples do not reflect deductions at the separateaccount level or contract level for any charges that may be incurred under a contract. Inclusion of these chargeswould increase the fees and expenses described below.
ANNUAL FUND OPERATING EXPENSES(expenses that you pay each year as a percentage of the value of your investment)
Management Fees 0.50%
Distribution/Service (12b-1) Fees 0.25%
Other Expenses 0.13%
Total Annual Fund Operating Expenses(1) 0.88%
Fee Waiver(1) 0.01%
Total Annual Fund Operating Expenses After Fee Waiver(1) 0.87%
(1) Janus Capital has contractually agreed to waive its investment advisory fee and/or reimburse Portfolio expenses to the extent that the Portfolio’s totalannual fund operating expenses (excluding the distribution and shareholder servicing fees, administrative services fees payable pursuant to the TransferAgency Agreement, brokerage commissions, interest, dividends, taxes, acquired fund fees and expenses, and extraordinary expenses) exceed 0.57% untilat least May 1, 2017. The contractual waiver may be terminated or modified prior to this date only at the discretion of the Portfolio’s Board of Trustees.
EXAMPLE:The following Example is based on expenses without waivers. The Example is intended to help you compare the cost ofinvesting in the Portfolio with the cost of investing in other mutual funds. The Example assumes that you invest $10,000 inthe Portfolio for the time periods indicated, reinvest all dividends and distributions, and then redeem all of your Shares at theend of each period. The Example also assumes that your investment has a 5% return each year and that the Portfolio’soperating expenses without waivers remain the same. Although your actual costs may be higher or lower, based on theseassumptions your costs would be:
1 Year 3 Years 5 Years 10 Years
Service Shares $ 90 $ 281 $ 488 $ 1,084
Portfolio Turnover: The Portfolio pays transaction costs, such as commissions, when it buys and sells securities (or “turnsover” its portfolio). A higher portfolio turnover rate may indicate higher transaction costs. These costs, which are not reflectedin annual fund operating expenses or in the Example, affect the Portfolio’s performance. During the most recent fiscal year,the Portfolio’s turnover rate was 111% of the average value of its portfolio.
PRINCIPAL INVESTMENT STRATEGIES
The Portfolio pursues its investment objective by primarily investing, under normal circumstances, at least 80% of its netassets (plus any borrowings for investment purposes) in bonds. Bonds include, but are not limited to, government notes andbonds, corporate bonds, convertible bonds, commercial and residential mortgage-backed securities, and zero-coupon bonds.The Portfolio will invest at least 65% of its assets in investment grade debt securities. As of December 31, 2015, thePortfolio’s weighted average maturity was 9.5 years. The Portfolio will limit its investment in high-yield/high-risk bonds, alsoknown as “junk” bonds, to 35% or less of its net assets. The Portfolio generates total return from a combination of currentincome and capital appreciation, but income is usually the dominant portion. The Portfolio may also invest in asset-backed
1 Flexible Bond Portfolio 109-56-81224 05-16
230
S-230

securities, money market instruments, commercial loans, and foreign debt securities (which may include investments inemerging markets). Due to the nature of the securities in which the Portfolio invests, it may have relatively high portfolioturnover compared to other portfolios.
Additionally, the Portfolio may invest its assets in derivatives, which are instruments that have a value derived from, ordirectly linked to, an underlying asset, such as equity securities, fixed-income securities, commodities, currencies, interestrates, or market indices. In particular, the Portfolio may use interest rate futures to manage portfolio risk. The Portfolio’sexposure to derivatives will vary. For purposes of meeting its 80% investment policy, the Portfolio may include derivativesthat have characteristics similar to the securities in which the Portfolio may directly invest.
In addition to considering economic factors such as the effect of interest rates on the Portfolio’s investments, the portfoliomanagers apply a “bottom up” approach in choosing investments. This means that the portfolio managers look at income-producing securities one at a time to determine if a security is an attractive investment opportunity and if it is consistent withthe Portfolio’s investment policies. The portfolio managers additionally consider the expected risk-adjusted return on aparticular investment and the Portfolio’s overall risk allocations and volatility.
The Portfolio may lend portfolio securities on a short-term or long-term basis, in an amount equal to up to one-third of itstotal assets as determined at the time of the loan origination.
PRINCIPAL INVESTMENT RISKS
Although the Portfolio may be less volatile than funds that invest most of their assets in common stocks, the Portfolio’sreturns and yields will vary, and you could lose money.
Fixed-Income Securities Risk. The Portfolio invests in a variety of fixed-income securities. Typically, the values of fixed-income securities change inversely with prevailing interest rates. Therefore, a fundamental risk of fixed-income securities isinterest rate risk, which is the risk that the value of such securities will generally decline as prevailing interest rates rise,which may cause the Portfolio’s net asset value to likewise decrease. For example, while securities with longer maturities anddurations tend to produce higher yields, they also tend to be more sensitive to changes in prevailing interest rates and aretherefore more volatile than shorter-term securities and are subject to greater market fluctuations as a result of changes ininterest rates. The Portfolio may be subject to heightened interest rate risk because the Federal Reserve has ended itsmonetary stimulus program known as quantitative easing and interest rates are at historically low levels. The conclusion ofquantitative easing and/or rising interest rates may expose fixed-income markets to increased volatility and may reduce theliquidity of certain Portfolio investments. These developments could cause the Portfolio’s net asset value to fluctuate or makeit more difficult for the Portfolio to accurately value its securities. These developments or others also could cause the Portfolioto face increased shareholder redemptions, which could force the Portfolio to liquidate investments at disadvantageous timesor prices, therefore adversely affecting the Portfolio as well as the value of your investment. The amount of assets deemedilliquid remaining within the Portfolio may also increase, making it more difficult to meet shareholder redemptions andfurther adversely affecting the value of the Portfolio. How specific fixed-income securities may react to changes in interestrates will depend on the specific characteristics of each security. Fixed-income securities are also subject to credit risk,prepayment risk, valuation risk, and liquidity risk. Credit risk is the risk that the credit strength of an issuer of a fixed-income security will weaken and/or that the issuer will be unable to make timely principal and interest payments and thatthe security may go into default. Prepayment risk is the risk that during periods of falling interest rates, certain fixed-incomesecurities with higher interest rates, such as mortgage- and asset-backed securities, may be prepaid by their issuers therebyreducing the amount of interest payments. Valuation risk is the risk that one or more of the fixed-income securities in whichthe Portfolio invests are priced differently than the value realized upon such security’s sale. In times of market instability,valuation may be more difficult. Liquidity risk is the risk that fixed-income securities may be difficult or impossible to sell atthe time that the portfolio managers would like or at the price the portfolio managers believe the security is currently worth.Liquidity risk may be increased to the extent that the Portfolio invests in Rule 144A and restricted securities.
Sovereign Debt Risk. The Portfolio may invest in U.S. and non-U.S. government debt securities (“sovereign debt”).Investments in U.S. sovereign debt are considered low risk. However, investments in non-U.S. sovereign debt can involve ahigh degree of risk, including the risk that the governmental entity that controls the repayment of sovereign debt may not bewilling or able to repay the principal and/or to pay the interest on its sovereign debt in a timely manner. A sovereign debtor’swillingness or ability to satisfy its debt obligation may be affected by various factors including, but not limited to, its cashflow situation, the extent of its foreign currency reserves, the availability of foreign exchange when a payment is due, and the
2 Janus Aspen Series
231
S-231

relative size of its debt position in relation to its economy as a whole. In the event of default, there may be limited or no legalremedies for collecting sovereign debt and there may be no bankruptcy proceedings through which the Portfolio may collectall or part of the sovereign debt that a governmental entity has not repaid. In addition, to the extent the Portfolio invests innon-U.S. sovereign debt, it may be subject to currency risk.
Mortgage- and Asset-Backed Securities Risk. Mortgage- and asset-backed securities represent interests in “pools” ofcommercial or residential mortgages or other assets, including consumer loans or receivables. Mortgage- and asset-backedsecurities tend to be more sensitive to changes in interest rates than other types of debt securities. Investments in mortgage-and asset-backed securities are subject to both extension risk, where borrowers pay off their debt obligations more slowly intimes of rising interest rates, and prepayment risk, where borrowers pay off their debt obligations sooner than expected intimes of declining interest rates. These risks may reduce the Portfolio’s returns. In addition, investments in mortgage- andasset-backed securities, including those comprised of subprime mortgages, may be subject to a higher degree of credit risk,valuation risk, and liquidity risk than various other types of fixed-income securities.
High-Yield/High-Risk Bond Risk. High-yield/high-risk bonds (also known as “junk” bonds) may be more sensitive than othertypes of bonds to economic changes, political changes, or adverse developments specific to the company that issued thebond, which may adversely affect their value.
Foreign Exposure Risk. The Portfolio may have exposure to foreign markets as a result of its investments in foreignsecurities, including investments in emerging markets, which can be more volatile than the U.S. markets. As a result, itsreturns and net asset value may be affected to a large degree by fluctuations in currency exchange rates or political oreconomic conditions in a particular country. In some foreign markets, there may not be protection against failure by otherparties to complete transactions. It may not be possible for the Portfolio to repatriate capital, dividends, interest, and otherincome from a particular country or governmental entity. In addition, a market swing in one or more countries or regionswhere the Portfolio has invested a significant amount of its assets may have a greater effect on the Portfolio’s performancethan it would in a more geographically diversified portfolio. To the extent the Portfolio invests in foreign debt securities, suchinvestments are sensitive to changes in interest rates. Additionally, investments in securities of foreign governments involvethe risk that a foreign government may not be willing or able to pay interest or repay principal when due. The Portfolio’sinvestments in emerging market countries may involve risks greater than, or in addition to, the risks of investing in moredeveloped countries.
Loan Risk. The Portfolio may invest in a variety of loans. Bank loans are obligations of companies or other entities enteredinto in connection with recapitalizations, acquisitions, and refinancings. The Portfolio’s investments in bank loans aregenerally acquired as a participation interest in, or assignment of, loans originated by a lender or other financial institution.These investments may include institutionally-traded floating and fixed-rate debt securities. The bank loans underlying thesesecurities often involve borrowers with low credit ratings whose financial conditions are troubled or uncertain, includingcompanies that are highly leveraged or in bankruptcy proceedings. Participation interests and assignments involve credit,interest rate, and liquidity risk.
Portfolio Turnover Risk. Increased portfolio turnover may result in higher costs, which may have a negative effect on thePortfolio’s performance.
Derivatives Risk. Derivatives can be highly volatile and involve risks in addition to the risks of the underlying referencedsecurities. Gains or losses from a derivative investment can be substantially greater than the derivative’s original cost, and cantherefore involve leverage. Leverage may cause the Portfolio to be more volatile than if it had not used leverage. Derivativescan be less liquid than other types of investments and entail the risk that the counterparty will default on its paymentobligations.
Securities Lending Risk. The Portfolio may seek to earn additional income through lending its securities to certain qualifiedbroker-dealers and institutions. There is the risk that when portfolio securities are lent, the securities may not be returned ona timely basis, and the Portfolio may experience delays and costs in recovering the security or gaining access to the collateralprovided to the Portfolio to collateralize the loan. If the Portfolio is unable to recover a security on loan, the Portfolio mayuse the collateral to purchase replacement securities in the market. There is a risk that the value of the collateral coulddecrease below the cost of the replacement security by the time the replacement investment is made, resulting in a loss to thePortfolio.
3 Flexible Bond Portfolio
232
S-232
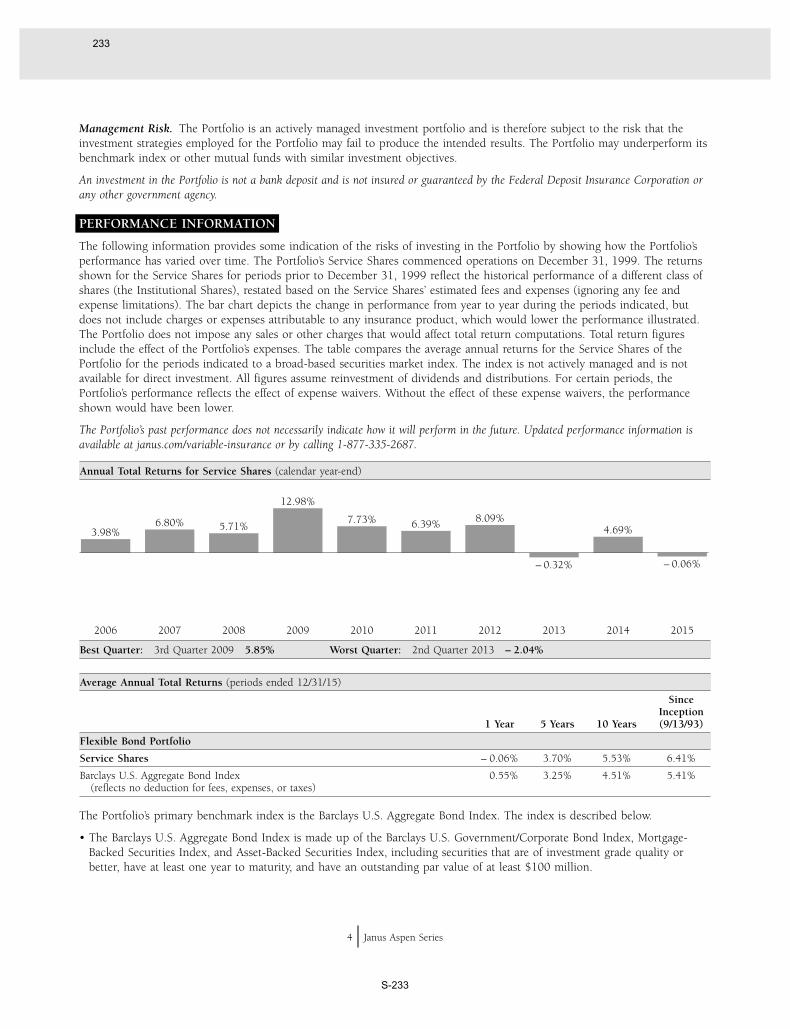
Management Risk. The Portfolio is an actively managed investment portfolio and is therefore subject to the risk that theinvestment strategies employed for the Portfolio may fail to produce the intended results. The Portfolio may underperform itsbenchmark index or other mutual funds with similar investment objectives.
An investment in the Portfolio is not a bank deposit and is not insured or guaranteed by the Federal Deposit Insurance Corporation orany other government agency.
PERFORMANCE INFORMATION
The following information provides some indication of the risks of investing in the Portfolio by showing how the Portfolio’sperformance has varied over time. The Portfolio’s Service Shares commenced operations on December 31, 1999. The returnsshown for the Service Shares for periods prior to December 31, 1999 reflect the historical performance of a different class ofshares (the Institutional Shares), restated based on the Service Shares’ estimated fees and expenses (ignoring any fee andexpense limitations). The bar chart depicts the change in performance from year to year during the periods indicated, butdoes not include charges or expenses attributable to any insurance product, which would lower the performance illustrated.The Portfolio does not impose any sales or other charges that would affect total return computations. Total return figuresinclude the effect of the Portfolio’s expenses. The table compares the average annual returns for the Service Shares of thePortfolio for the periods indicated to a broad-based securities market index. The index is not actively managed and is notavailable for direct investment. All figures assume reinvestment of dividends and distributions. For certain periods, thePortfolio’s performance reflects the effect of expense waivers. Without the effect of these expense waivers, the performanceshown would have been lower.
The Portfolio’s past performance does not necessarily indicate how it will perform in the future. Updated performance information isavailable at janus.com/variable-insurance or by calling 1-877-335-2687.
Annual Total Returns for Service Shares (calendar year-end)
2006 2007 2008 2009 2010 2011 2012 2013 2014 2015
3.98%6.80% 5.71%
12.98%
7.73% 6.39% 8.09%
– 0.32%
4.69%
– 0.06%
Best Quarter: 3rd Quarter 2009 5.85% Worst Quarter: 2nd Quarter 2013 – 2.04%
Average Annual Total Returns (periods ended 12/31/15)
1 Year 5 Years 10 Years
SinceInception(9/13/93)
Flexible Bond Portfolio
Service Shares – 0.06% 3.70% 5.53% 6.41%
Barclays U.S. Aggregate Bond Index(reflects no deduction for fees, expenses, or taxes)
0.55% 3.25% 4.51% 5.41%
The Portfolio’s primary benchmark index is the Barclays U.S. Aggregate Bond Index. The index is described below.
• The Barclays U.S. Aggregate Bond Index is made up of the Barclays U.S. Government/Corporate Bond Index, Mortgage-Backed Securities Index, and Asset-Backed Securities Index, including securities that are of investment grade quality orbetter, have at least one year to maturity, and have an outstanding par value of at least $100 million.
4 Janus Aspen Series
233
S-233

MANAGEMENT
Investment Adviser: Janus Capital Management LLC
Portfolio Managers: Michael Keough is Executive Vice President and Co-Portfolio Manager of the Portfolio, which he hasco-managed since December 2015. Mayur Saigal is Executive Vice President and Co-Portfolio Manager of the Portfolio,which he has co-managed since December 2015. Darrell Watters is Executive Vice President and Co-Portfolio Manager ofthe Portfolio, which he has co-managed since May 2007.
PURCHASE AND SALE OF PORTFOLIO SHARES
Purchases of Shares may be made only by the separate accounts of insurance companies for the purpose of funding variableinsurance contracts or by certain qualified retirement plans. Redemptions, like purchases, may be effected only through theseparate accounts of participating insurance companies or through qualified retirement plans. Requests are duly processed atthe NAV next calculated after your order is received in good order by the Portfolio or its agents. Refer to the appropriateseparate account prospectus or plan documents for details.
TAX INFORMATION
Because Shares of the Portfolio may be purchased only through variable insurance contracts and certain qualified retirementplans, it is anticipated that any income dividends or net capital gains distributions made by the Portfolio will be exempt fromcurrent federal income taxation if left to accumulate within the variable insurance contract or qualified retirement plan. Thefederal income tax status of your investment depends on the features of your qualified retirement plan or variable insurancecontract.
PAYMENTS TO INSURERS, BROKER-DEALERS, AND OTHER FINANCIAL INTERMEDIARIES
Portfolio shares are generally available only through an insurer’s variable contracts, or through certain employer or otherretirement plans (Retirement Products). Retirement Products are generally purchased through a broker-dealer or otherfinancial intermediary. The Portfolio or its distributor (and/or their related companies) may make payments to the insurerand/or its related companies for distribution and/or other services; some of the payments may go to broker-dealers and otherfinancial intermediaries. These payments may create a conflict of interest for an intermediary, or be a factor in the insurer’sdecision to include the Portfolio as an underlying investment option in a variable contract. Ask your financial advisor, visityour intermediary’s website, or consult your insurance contract prospectus for more information.
5 Flexible Bond Portfolio
234
S-234

Before you invest, you may want to review the Portfolio’s Prospectus, whichcontains more information about the Portfolio and its risks. You can find thePortfolio’s Prospectus and other information about the Portfolio online atjanus.com/variable-insurance. You can also get this information at no cost bycalling a Janus representative at 1-877-335-2687 or by sending an email requestto [email protected].
SUMMARY PROSPECTUS DATED MAY 1, 2016
Forty PortfolioTicker: N/A Service Shares
INVESTMENT OBJECTIVE
Forty Portfolio seeks long-term growth of capital.
FEES AND EXPENSES OF THE PORTFOLIO
This table describes the fees and expenses that you may pay if you buy and hold Shares of the Portfolio. Owners of variableinsurance contracts that invest in the Shares should refer to the variable insurance contract prospectus for adescription of fees and expenses, as the following table and examples do not reflect deductions at the separateaccount level or contract level for any charges that may be incurred under a contract. Inclusion of these chargeswould increase the fees and expenses described below.
ANNUAL FUND OPERATING EXPENSES(expenses that you pay each year as a percentage of the value of your investment)
Management Fees (may adjust up or down) 0.65%
Distribution/Service (12b-1) Fees 0.25%
Other Expenses 0.09%
Total Annual Fund Operating Expenses 0.99%
EXAMPLE:The Example is intended to help you compare the cost of investing in the Portfolio with the cost of investing in other mutualfunds. The Example assumes that you invest $10,000 in the Portfolio for the time periods indicated, reinvest all dividendsand distributions, and then redeem all of your Shares at the end of each period. The Example also assumes that yourinvestment has a 5% return each year and that the Portfolio’s operating expenses remain the same. Although your actual costsmay be higher or lower, based on these assumptions your costs would be:
1 Year 3 Years 5 Years 10 Years
Service Shares $ 101 $ 315 $ 547 $ 1,213
Portfolio Turnover: The Portfolio pays transaction costs, such as commissions, when it buys and sells securities (or “turnsover” its portfolio). A higher portfolio turnover rate may indicate higher transaction costs. These costs, which are not reflectedin annual fund operating expenses or in the Example, affect the Portfolio’s performance. During the most recent fiscal year,the Portfolio’s turnover rate was 55% of the average value of its portfolio.
PRINCIPAL INVESTMENT STRATEGIES
The Portfolio pursues its investment objective by normally investing primarily in a core group of 20-40 common stocksselected for their growth potential. The Portfolio may invest in companies of any size, from larger, well-established companiesto smaller, emerging growth companies. The Portfolio may also invest in foreign securities, which may include investments inemerging markets. As of December 31, 2015, the Portfolio held stocks of 37 companies. Of these holdings, 20 comprisedapproximately 65.92% of the Portfolio’s holdings.
The portfolio managers apply a “bottom up” approach in choosing investments. In other words, the portfolio managers lookat companies one at a time to determine if a company is an attractive investment opportunity and if it is consistent with thePortfolio’s investment policies.
The Portfolio may lend portfolio securities on a short-term or long-term basis, in an amount equal to up to one-third of itstotal assets as determined at the time of the loan origination.
1 Forty Portfolio 109-56-81324 05-16
235
S-235

PRINCIPAL INVESTMENT RISKS
The biggest risk is that the Portfolio’s returns will vary, and you could lose money. The Portfolio is designed for long-terminvestors seeking an equity portfolio, including common stocks. Common stocks tend to be more volatile than many otherinvestment choices.
Market Risk. The value of the Portfolio’s holdings may decrease if the value of an individual company or security, or multiplecompanies or securities, in the Portfolio decreases or if the portfolio managers’ belief about a company’s intrinsic worth isincorrect. Further, regardless of how well individual companies or securities perform, the value of the Portfolio’s holdingscould also decrease if there are deteriorating economic or market conditions. It is important to understand that the value ofyour investment may fall, sometimes sharply, in response to changes in the market, and you could lose money. Market riskmay affect a single issuer, industry, economic sector, or the market as a whole.
Growth Securities Risk. The Portfolio invests in companies after assessing their growth potential. Securities of companiesperceived to be “growth” companies may be more volatile than other stocks and may involve special risks. If the portfoliomanagers’ perception of a company’s growth potential is not realized, the securities purchased may not perform as expected,reducing the Portfolio’s returns. In addition, because different types of stocks tend to shift in and out of favor depending onmarket and economic conditions, “growth” stocks may perform differently from the market as a whole and other types ofsecurities.
Nondiversification Risk. The Portfolio is classified as nondiversified under the Investment Company Act of 1940, asamended. This gives the portfolio managers more flexibility to hold larger positions in a smaller number of securities. As aresult, an increase or decrease in the value of a single security held by the Portfolio may have a greater impact on thePortfolio’s NAV and total return.
Foreign Exposure Risk. The Portfolio may have exposure to foreign markets as a result of its investments in foreignsecurities, including investments in emerging markets, which can be more volatile than the U.S. markets. As a result, itsreturns and net asset value may be affected to a large degree by fluctuations in currency exchange rates or political oreconomic conditions in a particular country. In some foreign markets, there may not be protection against failure by otherparties to complete transactions. It may not be possible for the Portfolio to repatriate capital, dividends, interest, and otherincome from a particular country or governmental entity. In addition, a market swing in one or more countries or regionswhere the Portfolio has invested a significant amount of its assets may have a greater effect on the Portfolio’s performancethan it would in a more geographically diversified portfolio. To the extent the Portfolio invests in foreign debt securities, suchinvestments are sensitive to changes in interest rates. Additionally, investments in securities of foreign governments involvethe risk that a foreign government may not be willing or able to pay interest or repay principal when due. The Portfolio’sinvestments in emerging market countries may involve risks greater than, or in addition to, the risks of investing in moredeveloped countries.
Securities Lending Risk. The Portfolio may seek to earn additional income through lending its securities to certain qualifiedbroker-dealers and institutions. There is the risk that when portfolio securities are lent, the securities may not be returned ona timely basis, and the Portfolio may experience delays and costs in recovering the security or gaining access to the collateralprovided to the Portfolio to collateralize the loan. If the Portfolio is unable to recover a security on loan, the Portfolio mayuse the collateral to purchase replacement securities in the market. There is a risk that the value of the collateral coulddecrease below the cost of the replacement security by the time the replacement investment is made, resulting in a loss to thePortfolio.
Management Risk. The Portfolio is an actively managed investment portfolio and is therefore subject to the risk that theinvestment strategies employed for the Portfolio may fail to produce the intended results. The Portfolio may underperform itsbenchmark index or other mutual funds with similar investment objectives.
An investment in the Portfolio is not a bank deposit and is not insured or guaranteed by the Federal Deposit Insurance Corporation orany other government agency.
2 Janus Aspen Series
236
S-236

PERFORMANCE INFORMATION
The following information provides some indication of the risks of investing in the Portfolio by showing how the Portfolio’sperformance has varied over time. The Portfolio’s Service Shares commenced operations on December 31, 1999. The returnsshown for the Service Shares for periods prior to December 31, 1999 reflect the historical performance of a different class ofshares (the Institutional Shares), restated based on the Service Shares’ estimated fees and expenses (ignoring any fee andexpense limitations). The bar chart depicts the change in performance from year to year during the periods indicated, butdoes not include charges or expenses attributable to any insurance product, which would lower the performance illustrated.The Portfolio does not impose any sales or other charges that would affect total return computations. Total return figuresinclude the effect of the Portfolio’s expenses. The table compares the average annual returns for the Service Shares of thePortfolio for the periods indicated to broad-based securities market indices. The indices are not actively managed and are notavailable for direct investment. All figures assume reinvestment of dividends and distributions.
The Portfolio’s past performance does not necessarily indicate how it will perform in the future. Updated performance information isavailable at janus.com/variable-insurance or by calling 1-877-335-2687.
Annual Total Returns for Service Shares (calendar year-end)
2006 2007 2008 2009 2010 2011 2012 2013 2014 2015
9.12%
36.63%
– 44.31%
46.01%
6.48%
– 6.94%
23.86%30.89%
8.47% 11.94%
Best Quarter: 2nd Quarter 2009 22.06% Worst Quarter: 3rd Quarter 2008 – 25.39%
Average Annual Total Returns (periods ended 12/31/15)
1 Year 5 Years 10 Years
SinceInception(5/1/97)
Forty Portfolio
Service Shares 11.94% 12.87% 8.99% 10.71%
Russell 1000® Growth Index(reflects no deduction for fees, expenses, or taxes)
5.67% 13.53% 8.53% 6.61%
S&P 500® Index(reflects no deduction for fees, expenses, or taxes)
1.38% 12.57% 7.31% 7.13%
The Portfolio’s primary benchmark index is the Russell 1000® Growth Index. The Portfolio also compares its performance tothe S&P 500® Index. The Russell 1000® Growth Index is used to calculate the Portfolio’s performance fee adjustment. Theindices are described below.
• The Russell 1000® Growth Index measures the performance of those Russell 1000® companies with higher price-to-bookratios and higher forecasted growth values.
• The S&P 500® Index is a commonly recognized, market-capitalization weighted index of 500 widely held equity securities,designed to measure broad U.S. equity performance.
3 Forty Portfolio
237
S-237
MANAGEMENT
Investment Adviser: Janus Capital Management LLC
Portfolio Managers: A. Douglas Rao is Executive Vice President and Co-Portfolio Manager of the Portfolio, which he hasmanaged or co-managed since June 2013. Nick Schommer, CFA, is Executive Vice President and Co-Portfolio Manager ofthe Portfolio, which he has co-managed since January 2016.
PURCHASE AND SALE OF PORTFOLIO SHARES
Purchases of Shares may be made only by the separate accounts of insurance companies for the purpose of funding variableinsurance contracts or by certain qualified retirement plans. Redemptions, like purchases, may be effected only through theseparate accounts of participating insurance companies or through qualified retirement plans. Requests are duly processed atthe NAV next calculated after your order is received in good order by the Portfolio or its agents. Refer to the appropriateseparate account prospectus or plan documents for details.
TAX INFORMATION
Because Shares of the Portfolio may be purchased only through variable insurance contracts and certain qualified retirementplans, it is anticipated that any income dividends or net capital gains distributions made by the Portfolio will be exempt fromcurrent federal income taxation if left to accumulate within the variable insurance contract or qualified retirement plan. Thefederal income tax status of your investment depends on the features of your qualified retirement plan or variable insurancecontract.
PAYMENTS TO INSURERS, BROKER-DEALERS, AND OTHER FINANCIAL INTERMEDIARIES
Portfolio shares are generally available only through an insurer’s variable contracts, or through certain employer or otherretirement plans (Retirement Products). Retirement Products are generally purchased through a broker-dealer or otherfinancial intermediary. The Portfolio or its distributor (and/or their related companies) may make payments to the insurerand/or its related companies for distribution and/or other services; some of the payments may go to broker-dealers and otherfinancial intermediaries. These payments may create a conflict of interest for an intermediary, or be a factor in the insurer’sdecision to include the Portfolio as an underlying investment option in a variable contract. Ask your financial advisor, visityour intermediary’s website, or consult your insurance contract prospectus for more information.
4 Janus Aspen Series
238
S-238

Before you invest, you may want to review the Portfolio’s Prospectus, whichcontains more information about the Portfolio and its risks. You can find thePortfolio’s Prospectus and other information about the Portfolio online atjanus.com/variable-insurance. You can also get this information at no cost bycalling a Janus representative at 1-877-335-2687 or by sending an email requestto [email protected].
SUMMARY PROSPECTUS DATED MAY 1, 2016
Global Research PortfolioTicker: N/A Service Shares
INVESTMENT OBJECTIVE
Global Research Portfolio seeks long-term growth of capital.
FEES AND EXPENSES OF THE PORTFOLIO
This table describes the fees and expenses that you may pay if you buy and hold Shares of the Portfolio. Owners of variableinsurance contracts that invest in the Shares should refer to the variable insurance contract prospectus for adescription of fees and expenses, as the following table and examples do not reflect deductions at the separateaccount level or contract level for any charges that may be incurred under a contract. Inclusion of these chargeswould increase the fees and expenses described below.
ANNUAL FUND OPERATING EXPENSES(expenses that you pay each year as a percentage of the value of your investment)
Management Fees (may adjust up or down) 0.74%
Distribution/Service (12b-1) Fees 0.25%
Other Expenses 0.11%
Total Annual Fund Operating Expenses 1.10%
EXAMPLE:The Example is intended to help you compare the cost of investing in the Portfolio with the cost of investing in other mutualfunds. The Example assumes that you invest $10,000 in the Portfolio for the time periods indicated, reinvest all dividendsand distributions, and then redeem all of your Shares at the end of each period. The Example also assumes that yourinvestment has a 5% return each year and that the Portfolio’s operating expenses remain the same. Although your actual costsmay be higher or lower, based on these assumptions your costs would be:
1 Year 3 Years 5 Years 10 Years
Service Shares $ 112 $ 350 $ 606 $ 1,340
Portfolio Turnover: The Portfolio pays transaction costs, such as commissions, when it buys and sells securities (or “turnsover” its portfolio). A higher portfolio turnover rate may indicate higher transaction costs. These costs, which are not reflectedin annual fund operating expenses or in the Example, affect the Portfolio’s performance. During the most recent fiscal year,the Portfolio’s turnover rate was 50% of the average value of its portfolio.
PRINCIPAL INVESTMENT STRATEGIES
The Portfolio pursues its investment objective by investing primarily in common stocks selected for their growth potential.The Portfolio may invest in companies of any size located anywhere in the world, from larger, well-established companies tosmaller, emerging growth companies. The Portfolio typically invests at least 40% of its net assets in securities of issuers orcompanies that are economically tied to different countries throughout the world, excluding the United States. The Portfoliomay have significant exposure to emerging markets. Because the Portfolio’s investments in foreign securities are partially basedon the composition of the Portfolio’s benchmark index, the MSCI World IndexSM, the Portfolio’s exposure to foreign marketsmay fluctuate in connection with variations in the foreign exposure of the benchmark index. The Portfolio may also invest inforeign equity and debt securities.
Janus Capital’s equity research analysts, overseen by the Portfolio Oversight Team led by Janus Capital’s Director of ResearchCarmel Wellso (the “Research Team”), select investments for the Portfolio that represent the Research Team’s high-convictioninvestment ideas in all market capitalizations, styles, and geographies. The Research Team, comprised of sector specialists,conducts fundamental analysis with a focus on “bottom up” research, quantitative modeling, and valuation analysis. Usingthis research process, analysts rate their stocks based upon attractiveness. Analysts bring their high-conviction ideas to their
1 Global Research Portfolio 109-56-81724 05-16
239
S-239

respective sector teams. Sector teams compare the appreciation and risk potential of each of the team’s high-conviction ideasand construct a sector portfolio that is intended to maximize the best risk-reward opportunities.
Positions may be sold when, among other things, there is no longer high conviction in the return potential of the investmentor if the risk characteristics have caused a re-evaluation of the opportunity. This may occur if the stock has appreciated andreflects the anticipated value, if another company represents a better risk-reward opportunity, or if the investment’sfundamental characteristics deteriorate. Securities may also be sold from the portfolio to rebalance sector weightings.
Ms. Wellso oversees the investment process and is responsible for the day-to-day management of the Portfolio. It is expectedthat the Portfolio will be broadly diversified among a variety of industry sectors. The Portfolio intends to be fully investedunder normal circumstances. However, under unusual circumstances, if the Research Team does not have high conviction inenough investment opportunities, the Portfolio’s uninvested assets may be held in cash or similar instruments.
Additionally, the Portfolio may also invest its assets in derivatives, which are instruments that have a value derived from, ordirectly linked to, an underlying asset, such as equity securities, fixed-income securities, commodities, currencies, interestrates, or market indices. The types of derivatives in which the Portfolio may invest include options, forward currencycontracts, and swaps. The Portfolio may use derivatives to manage the Portfolio’s equity exposure, to offset risks associatedwith an investment, currency exposure, or market conditions, to hedge currency exposure relative to the Portfolio’sbenchmark index, and to gain access to markets where direct investment may be restricted or unavailable. The Portfolio mayalso hold derivatives, such as warrants, in connection with corporate actions.
The Portfolio may lend portfolio securities on a short-term or long-term basis, in an amount equal to up to one-third of itstotal assets as determined at the time of the loan origination.
PRINCIPAL INVESTMENT RISKS
The biggest risk is that the Portfolio’s returns will vary, and you could lose money. The Portfolio is designed for long-terminvestors seeking an equity portfolio, including common stocks. Common stocks tend to be more volatile than many otherinvestment choices.
Foreign Exposure Risk. The Portfolio normally has significant exposure to foreign markets as a result of its investments inforeign securities, including investments in emerging markets, which can be more volatile than the U.S. markets. As a result,its returns and net asset value may be affected to a large degree by fluctuations in currency exchange rates or political oreconomic conditions in a particular country. In some foreign markets, there may not be protection against failure by otherparties to complete transactions. It may not be possible for the Portfolio to repatriate capital, dividends, interest, and otherincome from a particular country or governmental entity. In addition, a market swing in one or more countries or regionswhere the Portfolio has invested a significant amount of its assets may have a greater effect on the Portfolio’s performancethan it would in a more geographically diversified portfolio. To the extent the Portfolio invests in foreign debt securities, suchinvestments are sensitive to changes in interest rates. Additionally, investments in securities of foreign governments involvethe risk that a foreign government may not be willing or able to pay interest or repay principal when due. The Portfolio’sinvestments in emerging market countries may involve risks greater than, or in addition to, the risks of investing in moredeveloped countries.
Emerging Markets Risk. The risks of foreign investing mentioned above are heightened when investing in emerging markets.Emerging markets securities involve a number of additional risks, which may result from less government supervision andregulation of business and industry practices (including the potential lack of strict finance and accounting controls andstandards), stock exchanges, brokers, and listed companies, making these investments potentially more volatile in price andless liquid than investments in developed securities markets, resulting in greater risk to investors. There is a risk indeveloping countries that a future economic or political crisis could lead to price controls, forced mergers of companies,expropriation or confiscatory taxation, imposition or enforcement of foreign ownership limits, seizure, nationalization,sanctions or imposition of restrictions by various governmental entities on investment and trading, or creation of governmentmonopolies, any of which may have a detrimental effect on the Portfolio’s investments. In addition, the Portfolio’s investmentsmay be denominated in foreign currencies and therefore, changes in the value of a country’s currency compared to the U.S.dollar may affect the value of the Portfolio’s investments. To the extent that the Portfolio invests a significant portion of itsassets in the securities of issuers in or companies of a single country or region, it is more likely to be impacted by events orconditions affecting that country or region, which could have a negative impact on the Portfolio’s performance. Some of therisks of investing directly in foreign and emerging market securities may be reduced when the Portfolio invests indirectly in
2 Janus Aspen Series
240
S-240

foreign securities through various other investment vehicles including derivatives, which also involve other risks. As ofDecember 31, 2015, approximately 3.3% of the Portfolio’s investments were in emerging markets.
Market Risk. The value of the Portfolio’s holdings may decrease if the value of an individual company or security, or multiplecompanies or securities, in the Portfolio decreases or if the investment personnel’s belief about a company’s intrinsic worth isincorrect. Further, regardless of how well individual companies or securities perform, the value of the Portfolio’s holdingscould also decrease if there are deteriorating economic or market conditions. It is important to understand that the value ofyour investment may fall, sometimes sharply, in response to changes in the market, and you could lose money. Market riskmay affect a single issuer, industry, economic sector, or the market as a whole.
Growth Securities Risk. The Portfolio invests in companies after assessing their growth potential. Securities of companiesperceived to be “growth” companies may be more volatile than other stocks and may involve special risks. If the investmentpersonnel’s perception of a company’s growth potential is not realized, the securities purchased may not perform as expected,reducing the Portfolio’s returns. In addition, because different types of stocks tend to shift in and out of favor depending onmarket and economic conditions, “growth” stocks may perform differently from the market as a whole and other types ofsecurities.
Derivatives Risk. Derivatives can be highly volatile and involve risks in addition to the risks of the underlying referencedsecurities. Gains or losses from a derivative investment can be substantially greater than the derivative’s original cost, and cantherefore involve leverage. Leverage may cause the Portfolio to be more volatile than if it had not used leverage. Derivativescan be less liquid than other types of investments and entail the risk that the counterparty will default on its paymentobligations. To the extent that the Portfolio uses forward currency contracts, there is a risk that unanticipated changes incurrency prices may negatively impact the Portfolio’s performance, among other things.
Securities Lending Risk. The Portfolio may seek to earn additional income through lending its securities to certain qualifiedbroker-dealers and institutions. There is the risk that when portfolio securities are lent, the securities may not be returned ona timely basis, and the Portfolio may experience delays and costs in recovering the security or gaining access to the collateralprovided to the Portfolio to collateralize the loan. If the Portfolio is unable to recover a security on loan, the Portfolio mayuse the collateral to purchase replacement securities in the market. There is a risk that the value of the collateral coulddecrease below the cost of the replacement security by the time the replacement investment is made, resulting in a loss to thePortfolio.
Management Risk. The Portfolio is an actively managed investment portfolio and is therefore subject to the risk that theinvestment strategies employed for the Portfolio may fail to produce the intended results. The Portfolio may underperform itsbenchmark index or other mutual funds with similar investment objectives.
An investment in the Portfolio is not a bank deposit and is not insured or guaranteed by the Federal Deposit Insurance Corporation orany other government agency.
3 Global Research Portfolio
241
S-241

PERFORMANCE INFORMATION
The following information provides some indication of the risks of investing in the Portfolio by showing how the Portfolio’sperformance has varied over time. The Portfolio’s Service Shares commenced operations on December 31, 1999. The returnsshown for the Service Shares for periods prior to December 31, 1999 reflect the historical performance of a different class ofshares (the Institutional Shares), restated based on the Service Shares’ estimated fees and expenses (ignoring any fee andexpense limitations). The bar chart depicts the change in performance from year to year during the periods indicated, butdoes not include charges or expenses attributable to any insurance product, which would lower the performance illustrated.The Portfolio does not impose any sales or other charges that would affect total return computations. Total return figuresinclude the effect of the Portfolio’s expenses. The table compares the average annual returns for the Service Shares of thePortfolio for the periods indicated to broad-based securities market indices. The indices are not actively managed and are notavailable for direct investment. All figures assume reinvestment of dividends and distributions. For certain periods, thePortfolio’s performance reflects the effect of expense waivers. Without the effect of these expense waivers, the performanceshown would have been lower.
The Portfolio’s past performance does not necessarily indicate how it will perform in the future. Updated performance information isavailable at janus.com/variable-insurance or by calling 1-877-335-2687.
Annual Total Returns for Service Shares (calendar year-end)
2006 2007 2008 2009 2010 2011 2012 2013 2014 2015
17.94%9.36%
– 44.81%
37.40%
15.52%
– 13.99%
19.86%28.08%
7.18%
– 2.53%
Best Quarter: 2nd Quarter 2009 22.84% Worst Quarter: 4th Quarter 2008 – 23.19%
Average Annual Total Returns (periods ended 12/31/15)
1 Year 5 Years 10 Years
SinceInception(9/13/93)
Global Research Portfolio
Service Shares – 2.53% 6.64% 4.54% 7.67%
MSCI World IndexSM
(reflects no deduction for fees, expenses, or taxes, except foreign withholding taxes)– 0.87% 7.59% 4.98% 6.53%
MSCI All Country World IndexSM
(reflects no deduction for fees, expenses, or taxes, except foreign withholding taxes)– 2.36% 6.09% 4.75% N/A
The Portfolio’s primary benchmark index is the MSCI World IndexSM. The Portfolio also compares its performance to theMSCI All Country World IndexSM. The MSCI World IndexSM is used to calculate the Portfolio’s performance fee adjustment.The indices are described below.
• The MSCI World IndexSM is a free float-adjusted market capitalization weighted index that is designed to measure the equitymarket performance of developed market countries in North America, Europe, and the Asia/Pacific Region. The indexincludes reinvestment of dividends, net of foreign withholding taxes.
• The MSCI All Country World IndexSM is an unmanaged, free float-adjusted, market capitalization weighted index composedof stocks of companies located in countries throughout the world. It is designed to measure equity market performance inglobal developed and emerging markets. The index includes reinvestment of dividends, net of foreign withholding taxes.
4 Janus Aspen Series
242
S-242
MANAGEMENT
Investment Adviser: Janus Capital Management LLC
Portfolio Management: Carmel Wellso, Janus Capital’s Director of Research and Executive Vice President of the Portfolio,provides general oversight of the Research Team and has done so since December 2014.
PURCHASE AND SALE OF PORTFOLIO SHARES
Purchases of Shares may be made only by the separate accounts of insurance companies for the purpose of funding variableinsurance contracts or by certain qualified retirement plans. Redemptions, like purchases, may be effected only through theseparate accounts of participating insurance companies or through qualified retirement plans. Requests are duly processed atthe NAV next calculated after your order is received in good order by the Portfolio or its agents. Refer to the appropriateseparate account prospectus or plan documents for details.
TAX INFORMATION
Because Shares of the Portfolio may be purchased only through variable insurance contracts and certain qualified retirementplans, it is anticipated that any income dividends or net capital gains distributions made by the Portfolio will be exempt fromcurrent federal income taxation if left to accumulate within the variable insurance contract or qualified retirement plan. Thefederal income tax status of your investment depends on the features of your qualified retirement plan or variable insurancecontract.
PAYMENTS TO INSURERS, BROKER-DEALERS, AND OTHER FINANCIAL INTERMEDIARIES
Portfolio shares are generally available only through an insurer’s variable contracts, or through certain employer or otherretirement plans (Retirement Products). Retirement Products are generally purchased through a broker-dealer or otherfinancial intermediary. The Portfolio or its distributor (and/or their related companies) may make payments to the insurerand/or its related companies for distribution and/or other services; some of the payments may go to broker-dealers and otherfinancial intermediaries. These payments may create a conflict of interest for an intermediary, or be a factor in the insurer’sdecision to include the Portfolio as an underlying investment option in a variable contract. Ask your financial advisor, visityour intermediary’s website, or consult your insurance contract prospectus for more information.
5 Global Research Portfolio
243
S-243

SUMMARY PROSPECTUS
Lord Abbett Series FundDeveloping Growth Portfolio
MAY 1, 2016
CLASS/TICKER
CLASS VC .. . . . . . . . . . . . . . . . . . . . . . . . . . . NO TICKER
Before you invest, you may want to review the Fund’s prospectus and statementof additional information, which contain more information about the Fund and itsrisks. You can find the Fund’s prospectus, statement of additional information andother information about the Fund at www.lordabbett.com/seriesfunds. You canalso get this information at no cost by calling 888-522-2388 (Option #2) or bysending an email request to [email protected]. The current prospectus andstatement of additional information dated May 1, 2016, as may be supplementedfrom time to time, are incorporated by reference into this summary prospectus.
INVESTMENT OBJECTIVE
The Fund’s investment objective is long-term growth of capital.
FEES AND EXPENSES
This table describes the fees and expenses that you may pay if you buy and holdshares of the Fund. The table does not reflect the fees and expenses of variableannuity contracts or variable life insurance policies (together, ‘‘VariableContracts’’). If such fees and expenses were reflected, expenses shown would behigher.
244
S-244
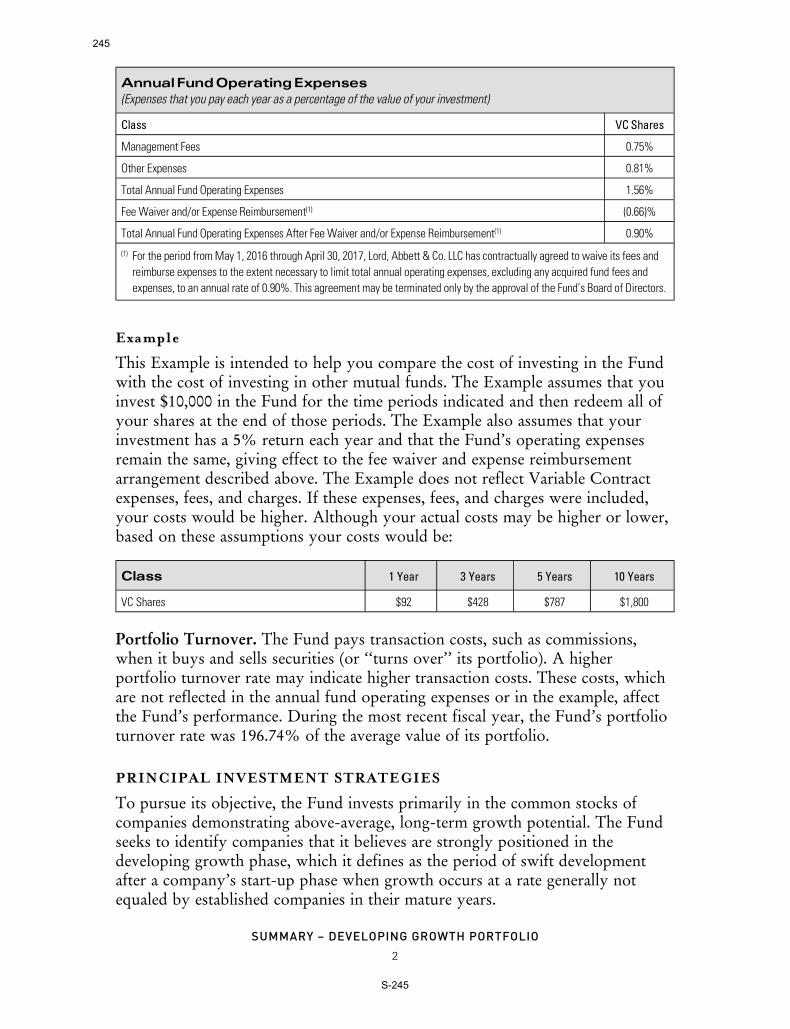
AnnualFundOperatingExpenses
(Expenses that you pay each year as a percentage of the value of your investment)
Class VC Shares
Management Fees 0.75%
Other Expenses 0.81%
Total Annual Fund Operating Expenses 1.56%
FeeWaiver and/or Expense Reimbursement(1) (0.66)%
Total Annual Fund Operating Expenses After FeeWaiver and/or Expense Reimbursement(1) 0.90%
(1) For the period fromMay 1, 2016 through April 30, 2017, Lord, Abbett & Co. LLC has contractually agreed to waive its fees and
reimburse expenses to the extent necessary to limit total annual operating expenses, excluding any acquired fund fees and
expenses, to an annual rate of 0.90%. This agreement may be terminated only by the approval of the Fund’s Board of Directors.
Example
This Example is intended to help you compare the cost of investing in the Fundwith the cost of investing in other mutual funds. The Example assumes that youinvest $10,000 in the Fund for the time periods indicated and then redeem all ofyour shares at the end of those periods. The Example also assumes that yourinvestment has a 5% return each year and that the Fund’s operating expensesremain the same, giving effect to the fee waiver and expense reimbursementarrangement described above. The Example does not reflect Variable Contractexpenses, fees, and charges. If these expenses, fees, and charges were included,your costs would be higher. Although your actual costs may be higher or lower,based on these assumptions your costs would be:
Class 1 Year 3 Years 5 Years 10 Years
VC Shares $92 $428 $787 $1,800
Portfolio Turnover. The Fund pays transaction costs, such as commissions,when it buys and sells securities (or ‘‘turns over’’ its portfolio). A higherportfolio turnover rate may indicate higher transaction costs. These costs, whichare not reflected in the annual fund operating expenses or in the example, affectthe Fund’s performance. During the most recent fiscal year, the Fund’s portfolioturnover rate was 196.74% of the average value of its portfolio.
PRINCIPAL INVESTMENT STRATEGIES
To pursue its objective, the Fund invests primarily in the common stocks ofcompanies demonstrating above-average, long-term growth potential. The Fundseeks to identify companies that it believes are strongly positioned in thedeveloping growth phase, which it defines as the period of swift developmentafter a company’s start-up phase when growth occurs at a rate generally notequaled by established companies in their mature years.
2
SUMMARY – DEVELOPING GROWTH PORTFOLIO
245
S-245

Under normal conditions, the Fund invests at least 65% of its net assets in equitysecurities of small companies. In selecting investments, the Fund may invest inU.S. and foreign (including emerging market) companies. Foreign companiesmay be traded on U.S. or non-U.S. securities exchanges, may be denominated inthe U.S. dollar or other currencies, and may include American DepositaryReceipts (‘‘ADRs’’). Although the Fund is diversified across many industries andsectors, its assets may, from time to time, be overweighted or underweighted tocertain industries and sectors relative to its benchmark index. The Fund’sprincipal investments include the following types of securities and other financialinstruments:
• Equity securities, including common stocks, preferred stocks, equityinterests in trusts (including real estate investment trusts (‘‘REITs’’) andprivately offered trusts), partnerships, joint ventures, limited liabilitycompanies, vehicles with similar legal structures, and other instruments withsimilar characteristics. The Fund may invest in any security that representsequity ownership in a company. The Fund considers equity securities toinclude rights offerings and investments that convert into the equitysecurities described above.
• Companies having a market capitalization at the time of purchase that fallswithin the market capitalization range of companies in the Russell 2000�Index. Such companies predominantly consist of small companies, but alsomay include mid-sized companies. Small company securities may be tradedin over-the-counter markets (which the Fund considers to include theNasdaq Stock Market).
• Growth companies that the Fund believes exhibit faster-than-average gainsin earnings and have the potential to continue profit growth at a high level.
The Fund engages in active and frequent trading of its portfolio securities inseeking to achieve its investment objective.
The Fund generally will sell a security when the Fund believes the security is lesslikely to benefit from the current market and economic environment, showssigns of deteriorating fundamentals, or has reached its valuation target, amongother reasons. The Fund seeks to remain fully invested in accordance with itsinvestment objective. The Fund may, however, deviate entirely from theinvestment strategy described above for temporary defensive purposes. The Fundmay miss certain investment opportunities if defensive strategies are used andthus may not achieve its investment objective.
3
SUMMARY – DEVELOPING GROWTH PORTFOLIO
246
S-246

PRINCIPAL RISKS
As with any investment in a mutual fund, investing in the Fund involves risk,including the risk that you may receive little or no return on your investment.When you redeem your shares, they may be worth more or less than what youpaid for them, which means that you may lose a portion or all of the money youinvested in the Fund. The principal risks of investing in the Fund, which couldadversely affect its performance, include:
• Portfolio Management Risk: If the strategies used and investments selectedby the Fund’s portfolio management team fail to produce the intended result,the Fund may suffer losses or underperform other funds with the sameinvestment objective or strategies, even in a rising market.
• Market Risk: The market values of securities will fluctuate, sometimessharply and unpredictably, based on overall economic conditions and otherfactors. Prices of equity securities tend to rise and fall more dramatically thanthose of debt securities.
• Equity Securities Risk: Equity securities, as well as equity-like securitiessuch as convertible debt securities, may experience significant volatility. Suchsecurities may fall sharply in response to adverse events affecting overallmarkets, a particular industry or sector, or an individual company’s financialcondition.
• Industry and Sector Risk: Although the Fund does not employ an industryor sector focus, its exposure to specific industries or sectors will increasefrom time to time based on the portfolio management team’s perception ofinvestment opportunities. If the Fund overweights a single industry or sectorrelative to its benchmark index, the Fund will face an increased risk that thevalue of its portfolio will decrease because of events disproportionatelyaffecting that industry or sector. Furthermore, investments in particularindustries or sectors may be more volatile than the broader market as awhole.
• Small and Mid-Sized Company Risk: Equity securities of small and mid-sized companies typically involve greater investment risks than larger, moreestablished companies. As compared to larger companies, small and mid-sized companies may have limited management experience or depth, limitedability to generate or borrow capital needed for growth, and limited productsor services, or operate in markets that have not yet been established. Inaddition, securities of small and mid-sized companies may be more volatileand present increased liquidity risk relative to securities issued by largercompanies. Accordingly, small and mid-sized company securities tend to bemore sensitive to changing economic, market and industry conditions andtend to be more volatile and less liquid than equity securities of larger
4
SUMMARY – DEVELOPING GROWTH PORTFOLIO
247
S-247
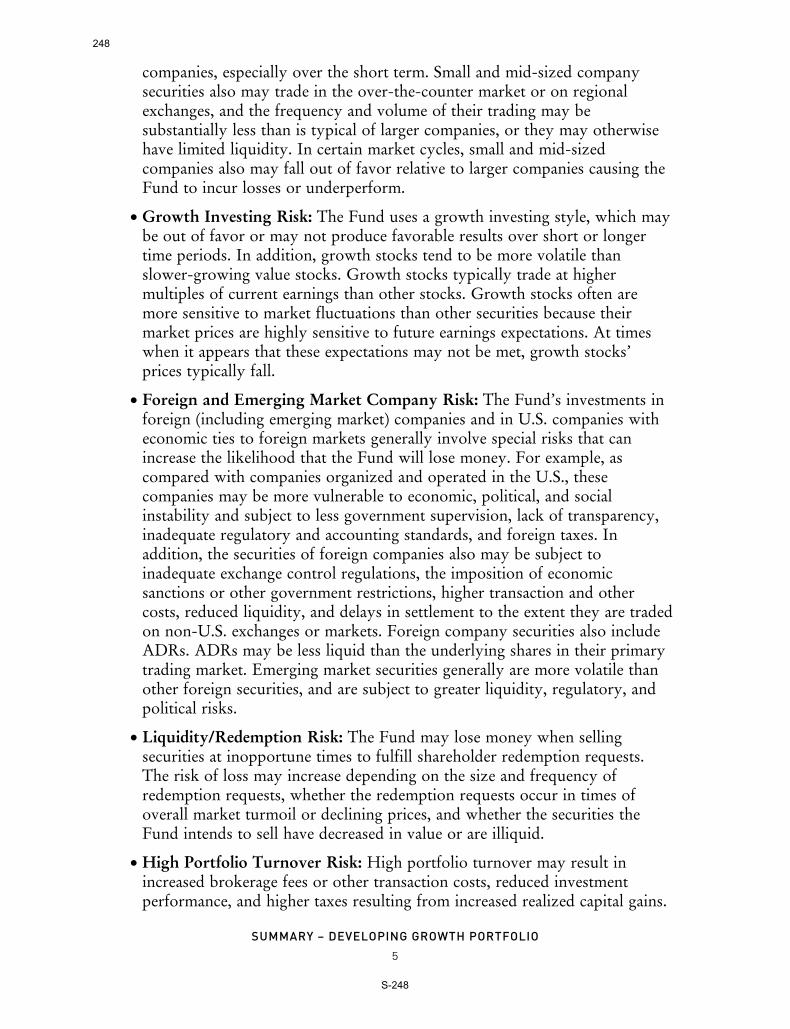
companies, especially over the short term. Small and mid-sized companysecurities also may trade in the over-the-counter market or on regionalexchanges, and the frequency and volume of their trading may besubstantially less than is typical of larger companies, or they may otherwisehave limited liquidity. In certain market cycles, small and mid-sizedcompanies also may fall out of favor relative to larger companies causing theFund to incur losses or underperform.
• Growth Investing Risk: The Fund uses a growth investing style, which maybe out of favor or may not produce favorable results over short or longertime periods. In addition, growth stocks tend to be more volatile thanslower-growing value stocks. Growth stocks typically trade at highermultiples of current earnings than other stocks. Growth stocks often aremore sensitive to market fluctuations than other securities because theirmarket prices are highly sensitive to future earnings expectations. At timeswhen it appears that these expectations may not be met, growth stocks’prices typically fall.
• Foreign and Emerging Market Company Risk: The Fund’s investments inforeign (including emerging market) companies and in U.S. companies witheconomic ties to foreign markets generally involve special risks that canincrease the likelihood that the Fund will lose money. For example, ascompared with companies organized and operated in the U.S., thesecompanies may be more vulnerable to economic, political, and socialinstability and subject to less government supervision, lack of transparency,inadequate regulatory and accounting standards, and foreign taxes. Inaddition, the securities of foreign companies also may be subject toinadequate exchange control regulations, the imposition of economicsanctions or other government restrictions, higher transaction and othercosts, reduced liquidity, and delays in settlement to the extent they are tradedon non-U.S. exchanges or markets. Foreign company securities also includeADRs. ADRs may be less liquid than the underlying shares in their primarytrading market. Emerging market securities generally are more volatile thanother foreign securities, and are subject to greater liquidity, regulatory, andpolitical risks.
• Liquidity/Redemption Risk: The Fund may lose money when sellingsecurities at inopportune times to fulfill shareholder redemption requests.The risk of loss may increase depending on the size and frequency ofredemption requests, whether the redemption requests occur in times ofoverall market turmoil or declining prices, and whether the securities theFund intends to sell have decreased in value or are illiquid.
• High Portfolio Turnover Risk: High portfolio turnover may result inincreased brokerage fees or other transaction costs, reduced investmentperformance, and higher taxes resulting from increased realized capital gains.
5
SUMMARY – DEVELOPING GROWTH PORTFOLIO
248
S-248

An investment in the Fund is not a deposit of any bank and is not insured orguaranteed by the Federal Deposit Insurance Corporation or any othergovernment agency. For more information on the principal risks of the Fund,please see the ‘‘More Information About the Fund – Principal Risks’’ section inthe prospectus.
PERFORMANCE
The bar chart and table below provide some indication of the risks of investingin the Fund by illustrating the variability of the Fund’s returns. Each assumesreinvestment of dividends and distributions. The Fund’s past performance is notnecessarily an indication of how the Fund will perform in the future.
The bar chart shows changes in the performance of the Fund’s Class VC sharesfrom calendar year to calendar year. This chart does not reflect the sales chargesor other expenses of Variable Contracts. If those sales charges and expenses werereflected, returns would be lower.
Bar Chart (per calendar year) — Class VC Shares
-40
0
40
80
'15'14'13'12'11
-2.14%
+12.11%
+56.68%
+3.71%
-8.21%
Best Quarter 3rd Q ’13 +18.81% Worst Quarter 3rd Q ’11 -22.58%
6
SUMMARY – DEVELOPING GROWTH PORTFOLIO
249
S-249

The table below shows how the Fund’s average annual total returns compare tothe returns of a securities market index with investment characteristics similar tothose of the Fund.
AverageAnnual Total Returns
(for the periods ended December 31, 2015)
Class 1 Year 5 Years Life of Class
InceptionDate for
Performance
Class VC Shares -8.21% 10.35% 13.34% 4/30/2010
Index
Russell 2000® Growth Index
(reflects no deduction for fees, expenses, or taxes) -1.38% 10.67% 12.10% 4/30/2010
MANAGEMENT
Investment Adviser. The Fund’s investment adviser is Lord, Abbett & Co. LLC.
Portfolio Managers.
PortfolioManager/Title
Member of
the Investment
Management
TeamSince
F. Thomas O’Halloran, III, Partner and Portfolio Manager 2010
Arthur K. Weise, Partner and Portfolio Manager 2010
PURCHASE AND SALE OF FUND SHARES
Because the Fund serves as an underlying investment vehicle for VariableContracts, Fund shares currently are available only to certain insurance companyseparate accounts at net asset value (‘‘NAV’’).
TAX INFORMATION
For information about the federal income tax treatment of Fund distributions tothe insurance company separate accounts that hold shares in the Fund, pleaserefer to the prospectus provided by the insurance company for your VariableContract. Because of the unique tax status of Variable Contracts, you shouldconsult your tax adviser regarding treatment under the federal, state, and localtax rules that apply to you.
7
SUMMARY – DEVELOPING GROWTH PORTFOLIO
250
S-250

PAYMENTS TO INSURANCE COMPANIES AND OTHER FINANCIALINTERMEDIARIES
The Fund and its related companies may make payments to the sponsoringinsurance company, its affiliates, or other financial intermediaries for distributionand/or other services. These payments may create a conflict of interest byinfluencing the insurance company or other financial intermediary to recommendthe Fund over another investment. Ask your individual financial professional orvisit your insurance company’s or financial intermediary’s website for moreinformation.
8
SUMMARY – DEVELOPING GROWTH PORTFOLIO
251
S-251

InvestmentCompanyActFile
Number:811-05876
SF-DGP8
(5/16)
252
S-252

SUMMARY PROSPECTUS
Lord Abbett Series FundInternational Opportunities Portfolio
MAY 1, 2016
CLASS/TICKER
CLASS VC .. . . . . . . . . . . . . . . . . . . . . . . . . . . NO TICKER
Before you invest, you may want to review the Fund’s prospectus and statementof additional information, which contain more information about the Fund and itsrisks. You can find the Fund’s prospectus, statement of additional information andother information about the Fund at www.lordabbett.com/seriesfunds. You canalso get this information at no cost by calling 888-522-2388 (Option #2) or bysending an email request to [email protected]. The current prospectus andstatement of additional information dated May 1, 2016, as may be supplementedfrom time to time, are incorporated by reference into this summary prospectus.
INVESTMENT OBJECTIVE
The Fund’s investment objective is long-term capital appreciation.
FEES AND EXPENSES
This table describes the fees and expenses that you may pay if you buy and holdshares of the Fund. The table does not reflect the fees and expenses of variableannuity contracts or variable life insurance policies (together, ‘‘VariableContracts’’). If such fees and expenses were reflected, expenses shown would behigher.
253
S-253

AnnualFundOperatingExpenses
(Expenses that you pay each year as a percentage of the value of your investment)
Class VC Shares
Management Fees 0.75%
Other Expenses 0.77%
Total Annual Fund Operating Expenses 1.52%
FeeWaiver and/or Expense Reimbursement(1) (0.32)%
Total Annual Fund Operating Expenses After FeeWaiver and/or Expense Reimbursement(1) 1.20%
(1) For the period fromMay 1, 2016 through April 30, 2017, Lord, Abbett & Co. LLC has contractually agreed to waive its fees and
reimburse expenses to the extent necessary to limit total annual operating expenses, excluding any acquired fund fees and
expenses, to an annual rate of 1.20%. This agreement may be terminated only by the approval of the Fund’s Board of Directors.
Example
This Example is intended to help you compare the cost of investing in the Fundwith the cost of investing in other mutual funds. The Example assumes that youinvest $10,000 in the Fund for the time periods indicated and then redeem all ofyour shares at the end of those periods. The Example also assumes that yourinvestment has a 5% return each year and that the Fund’s operating expensesremain the same, giving effect to the fee waiver and expense reimbursementarrangement described above. The Example does not reflect Variable Contractexpenses, fees, and charges. If these expenses, fees, and charges were included,your costs would be higher. Although your actual costs may be higher or lower,based on these assumptions your costs would be:
Class 1 Year 3 Years 5 Years 10 Years
VC Shares $122 $449 $799 $1,785
Portfolio Turnover. The Fund pays transaction costs, such as commissions,when it buys and sells securities (or ‘‘turns over’’ its portfolio). A higherportfolio turnover rate may indicate higher transaction costs. These costs, whichare not reflected in the annual fund operating expenses or in the example, affectthe Fund’s performance. During the most recent fiscal year, the Fund’s portfolioturnover rate was 87.07% of the average value of its portfolio.
PRINCIPAL INVESTMENT STRATEGIES
To pursue its objective, the Fund invests primarily in stocks of companiesprincipally based outside the United States. The Fund normally intends to investat least 65% of its net assets in equity securities of small companies generallyhaving a market capitalization at the time of purchase of less than $5 billion. The
2
SUMMARY – INTERNATIONAL OPPORTUNITIES PORTFOLIO
254
S-254
Fund may invest its remaining assets in equity securities of mid-sized or largercompanies. The Fund uses a ‘‘blend’’ strategy to gain investment exposure toboth growth and value stocks, or to stocks with characteristics of both.
The Fund’s principal investments include the following types of securities andother financial instruments:
• Equity securities of small and mid-sized companies. The Fund may invest inany security that represents equity ownership in a company. Equitysecurities usually include common stocks, preferred stocks, equity interests intrusts (including real estate investment trusts (‘‘REITs’’) and privately offeredtrusts), partnerships, joint ventures, limited liability companies, vehicles withsimilar legal structures, and other instruments with similar characteristics.The Fund considers equity securities to include rights offerings andinvestments that convert into the equity securities described above.
• Foreign companies whose securities may be traded on U.S. or non-U.S.securities exchanges, may be denominated in the U.S. dollar or othercurrencies, and may include American Depositary Receipts (‘‘ADRs’’).Although the Fund is not required to hedge its exposure to any currency, itmay choose to do so. The Fund may invest up to 15% of its net assets insecurities of foreign companies that are traded primarily on securities marketsor exchanges located in emerging market countries.
• Growth companies that the Fund’s portfolio management team believesexhibit faster-than-average gains in earnings and have the potential tocontinue profit growth at a high level.
• Value companies that the Fund’s portfolio management team believes to beundervalued according to certain financial measurements of intrinsic worthor business prospects and to have the potential for capital appreciation.
Consistent with its investment objective and policies, the Fund selectively mayinvest in derivatives. The Fund may use derivatives for risk managementpurposes, including to hedge against a decline in the value of certain investmentsand to adjust the investment characteristics of its portfolio. The Fund also mayinvest in derivatives for non-hedging purposes to increase its investment returnor income. For example, the Fund may manage cash by investing in futures orother derivatives that provide efficient short-term investment exposure to broadequity markets. Some examples of the types of derivatives in which the Fundmay invest are forward contracts, futures, options, and swap agreements.
The Fund generally will sell a security when the Fund believes the security is lesslikely to benefit from the current market and economic environment, showssigns of deteriorating fundamentals, or has reached its valuation target, amongother reasons. The Fund seeks to remain fully invested in accordance with itsinvestment objective. The Fund may, however, deviate entirely from the
3
SUMMARY – INTERNATIONAL OPPORTUNITIES PORTFOLIO
255
S-255

investment strategy described above for temporary defensive purposes. The Fundmay miss certain investment opportunities if defensive strategies are used andthus may not achieve its investment objective.
PRINCIPAL RISKS
As with any investment in a mutual fund, investing in the Fund involves risk,including the risk that you may receive little or no return on your investment.When you redeem your shares, they may be worth more or less than what youpaid for them, which means that you may lose a portion or all of the money youinvested in the Fund. The principal risks of investing in the Fund, which couldadversely affect its performance, include:
• Portfolio Management Risk: If the strategies used and investments selectedby the Fund’s portfolio management team fail to produce the intended result,the Fund may suffer losses or underperform other funds with the sameinvestment objective or strategies, even in a rising market.
• Market Risk: The market values of securities will fluctuate, sometimessharply and unpredictably, based on overall economic conditions and otherfactors. Prices of equity securities tend to rise and fall more dramatically thanthose of debt securities.
• Equity Securities Risk: Equity securities, as well as equity-like securitiessuch as convertible debt securities, may experience significant volatility. Suchsecurities may fall sharply in response to adverse events affecting overallmarkets, a particular industry or sector, or an individual company’s financialcondition.
• Industry and Sector Risk: Although the Fund does not employ an industryor sector focus, its exposure to specific industries or sectors will increasefrom time to time based on the portfolio management team’s perception ofinvestment opportunities. If the Fund overweights a single industry or sectorrelative to its benchmark index, the Fund will face an increased risk that thevalue of its portfolio will decrease because of events disproportionatelyaffecting that industry or sector. Furthermore, investments in particularindustries or sectors may be more volatile than the broader market as awhole.
• Mid-Sized and Small Company Risk: Investments in mid-sized and smallercompanies may involve greater risks than investments in larger, moreestablished companies. As compared to larger companies, mid-sized andsmaller companies may have limited management experience or depth,limited ability to generate or borrow capital needed for growth, and limitedproducts or services, or operate in less established markets. Accordingly,mid-sized and smaller company securities tend to be more sensitive tochanging economic, market, and industry conditions and tend to be more
4
SUMMARY – INTERNATIONAL OPPORTUNITIES PORTFOLIO
256
S-256

volatile and less liquid than equity securities of larger companies, especiallyover the short term. Mid-sized and smaller companies also may fall out offavor relative to larger companies in certain market cycles, causing the Fundto incur losses or underperform.
• Foreign and Emerging Market Company Risk: The Fund’s investments inforeign (including emerging market) companies and in U.S. companies witheconomic ties to foreign markets generally involve special risks that canincrease the likelihood that the Fund will lose money. For example, ascompared with companies organized and operated in the U.S., thesecompanies may be more vulnerable to economic, political, and socialinstability and subject to less government supervision, lack of transparency,inadequate regulatory and accounting standards, and foreign taxes. Inaddition, the securities of foreign companies also may be subject toinadequate exchange control regulations, the imposition of economicsanctions or other government restrictions, higher transaction and othercosts, reduced liquidity, and delays in settlement to the extent they are tradedon non-U.S. exchanges or markets. Foreign company securities also includeADRs. ADRs may be less liquid than the underlying shares in their primarytrading market. Emerging market securities generally are more volatile thanother foreign securities, and are subject to greater liquidity, regulatory, andpolitical risks. Investments in emerging markets may be consideredspeculative and generally are riskier than investments in more developedmarkets because such markets tend to develop unevenly and may never fullydevelop. Emerging markets are more likely to experience hyperinflation andcurrency devaluations. Securities of emerging market companies may have farlower trading volumes and less liquidity than securities of issuers indeveloped markets. The Fund may invest in securities of companies whoseeconomic fortunes are linked to emerging markets but which principally aretraded on a non-emerging market exchange. Such investments do not meetthe Fund’s definition of an emerging market security. To the extent the Fundinvests in this manner, the percentage of the Fund’s portfolio that is exposedto emerging market risks may be greater than the percentage of the Fund’sassets that the Fund defines as representing emerging market securities.
• Foreign Currency Risk: The Fund may invest in securities denominated inforeign currencies, which are subject to the risk that those currencies willdecline in value relative to the U.S. dollar, or, in the case of hedged positions,that the U.S. dollar will decline relative to the currency being hedged.Currency rates in foreign countries may fluctuate significantly over shortperiods of time.
5
SUMMARY – INTERNATIONAL OPPORTUNITIES PORTFOLIO
257
S-257
• Geographic Concentration Risk: To the extent the Fund focuses itsinvestments in a single country or only a few countries in a particulargeographic region, economic, political, regulatory or other conditionsaffecting such region may have a greater impact on Fund performancerelative to a more geographically diversified fund.
• Blend Style Risk: Growth stocks tend to be more volatile than slower-growing value stocks. Growth stocks typically trade at higher multiples ofcurrent earnings than other stocks. Growth stocks often are more sensitive tomarket fluctuations than other securities because their market prices arehighly sensitive to future earnings expectations. At times when it appears thatthese expectations may not be met, growth stocks’ prices typically fall. Theprices of value stocks may lag the stock market for long periods of time if themarket fails to recognize the company’s intrinsic worth. Value investing alsois subject to the risk that a company judged to be undervalued may actuallybe appropriately priced or even overpriced. A portfolio that combinesgrowth and value styles may diversify these risks and lower its volatility, butthere is no assurance this strategy will achieve that result.
• Derivatives Risk: Derivatives can increase the Fund’s volatility and/orreduce the Fund’s returns. Derivatives are subject to certain risks, includingthe risk that the value of the derivative may not correlate with the value ofthe underlying security, rate, or index in the manner anticipated by portfoliomanagement. Derivatives may be more sensitive to changes in economic ormarket conditions and may become illiquid. Derivatives are subject toleverage risk, which may increase the Fund’s volatility. Derivatives also aresubject to counterparty risk, which means that the counterparty may fail toperform its obligations under the derivative contract. Central clearing ofderivatives is intended to decrease counterparty risk but does not make thesetransactions risk-free. In addition, the Fund will be required to segregatepermissible liquid assets to cover its obligations under these transactions andmay have to liquidate positions before it is desirable to do so to fulfill itsrequirements to segregate. Whether the Fund’s use of derivatives is successfulwill depend on, among other things, the Fund’s ability to correctly forecastmarket movements and other factors. If the Fund incorrectly forecasts theseand other factors, the Fund’s performance could suffer.
• Liquidity/Redemption Risk: The Fund may lose money when sellingsecurities at inopportune times to fulfill shareholder redemption requests.The risk of loss may increase depending on the size and frequency ofredemption requests, whether the redemption requests occur in times ofoverall market turmoil or declining prices, and whether the securities theFund intends to sell have decreased in value or are illiquid.
6
SUMMARY – INTERNATIONAL OPPORTUNITIES PORTFOLIO
258
S-258

• High Portfolio Turnover Risk: High portfolio turnover may result inincreased brokerage fees or other transaction costs, reduced investmentperformance, and higher taxes resulting from increased realized capital gains.
An investment in the Fund is not a deposit of any bank and is not insured orguaranteed by the Federal Deposit Insurance Corporation or any othergovernment agency. For more information on the principal risks of the Fund,please see the ‘‘More Information About the Fund – Principal Risks’’ section inthe prospectus.
PERFORMANCE
The bar chart and table below provide some indication of the risks of investingin the Fund by illustrating the variability of the Fund’s returns. Each assumesreinvestment of dividends and distributions. The Fund’s past performance is notnecessarily an indication of how the Fund will perform in the future.
The bar chart shows changes in the performance of the Fund’s Class VC sharesfrom calendar year to calendar year. This chart does not reflect the sales chargesor other expenses of Variable Contracts. If those sales charges and expenses werereflected, returns would be lower.
Bar Chart (per calendar year) — Class VC Shares
-60
-40
-20
0
20
40
60
-51.53%
+29.08%
+47.87%
+21.22% +20.38%+4.73%
06 07 08 09 10 12 14 151311
-15.72%-5.76%
+31.70%
+11.10%
Best Quarter 2nd Q ’09 +35.51% Worst Quarter 3rd Q ’08 -25.17%
The table below shows how the Fund’s average annual total returns compare tothe returns of a securities market index with investment characteristics similar tothose of the Fund.
7
SUMMARY – INTERNATIONAL OPPORTUNITIES PORTFOLIO
259
S-259
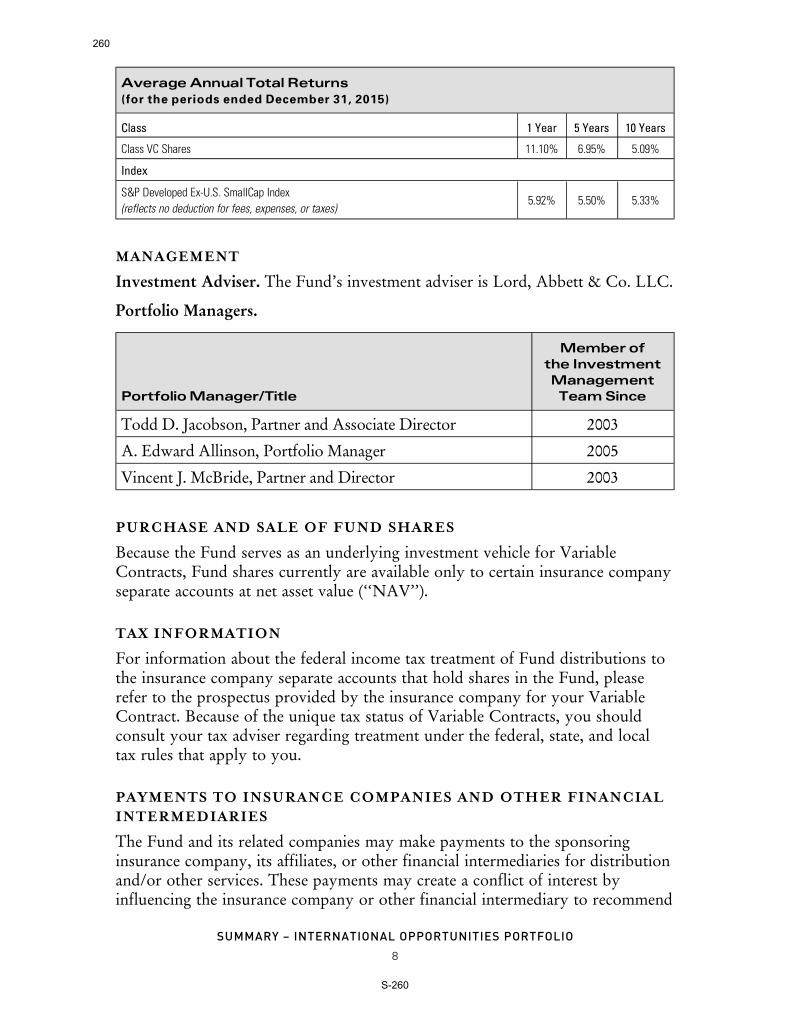
AverageAnnual Total Returns
(for the periods ended December 31, 2015)
Class 1 Year 5 Years 10 Years
Class VC Shares 11.10% 6.95% 5.09%
Index
S&P Developed Ex-U.S. SmallCap Index
(reflects no deduction for fees, expenses, or taxes)5.92% 5.50% 5.33%
MANAGEMENT
Investment Adviser. The Fund’s investment adviser is Lord, Abbett & Co. LLC.
Portfolio Managers.
PortfolioManager/Title
Member of
the Investment
Management
TeamSince
Todd D. Jacobson, Partner and Associate Director 2003
A. Edward Allinson, Portfolio Manager 2005
Vincent J. McBride, Partner and Director 2003
PURCHASE AND SALE OF FUND SHARES
Because the Fund serves as an underlying investment vehicle for VariableContracts, Fund shares currently are available only to certain insurance companyseparate accounts at net asset value (‘‘NAV’’).
TAX INFORMATION
For information about the federal income tax treatment of Fund distributions tothe insurance company separate accounts that hold shares in the Fund, pleaserefer to the prospectus provided by the insurance company for your VariableContract. Because of the unique tax status of Variable Contracts, you shouldconsult your tax adviser regarding treatment under the federal, state, and localtax rules that apply to you.
PAYMENTS TO INSURANCE COMPANIES AND OTHER FINANCIALINTERMEDIARIES
The Fund and its related companies may make payments to the sponsoringinsurance company, its affiliates, or other financial intermediaries for distributionand/or other services. These payments may create a conflict of interest byinfluencing the insurance company or other financial intermediary to recommend
8
SUMMARY – INTERNATIONAL OPPORTUNITIES PORTFOLIO
260
S-260

the Fund over another investment. Ask your individual financial professional orvisit your insurance company’s or financial intermediary’s website for moreinformation.
9
SUMMARY – INTERNATIONAL OPPORTUNITIES PORTFOLIO
261
S-261

InvestmentCompanyActFile
Number:811-05876
SF-IOP8
(5/16)
262
S-262
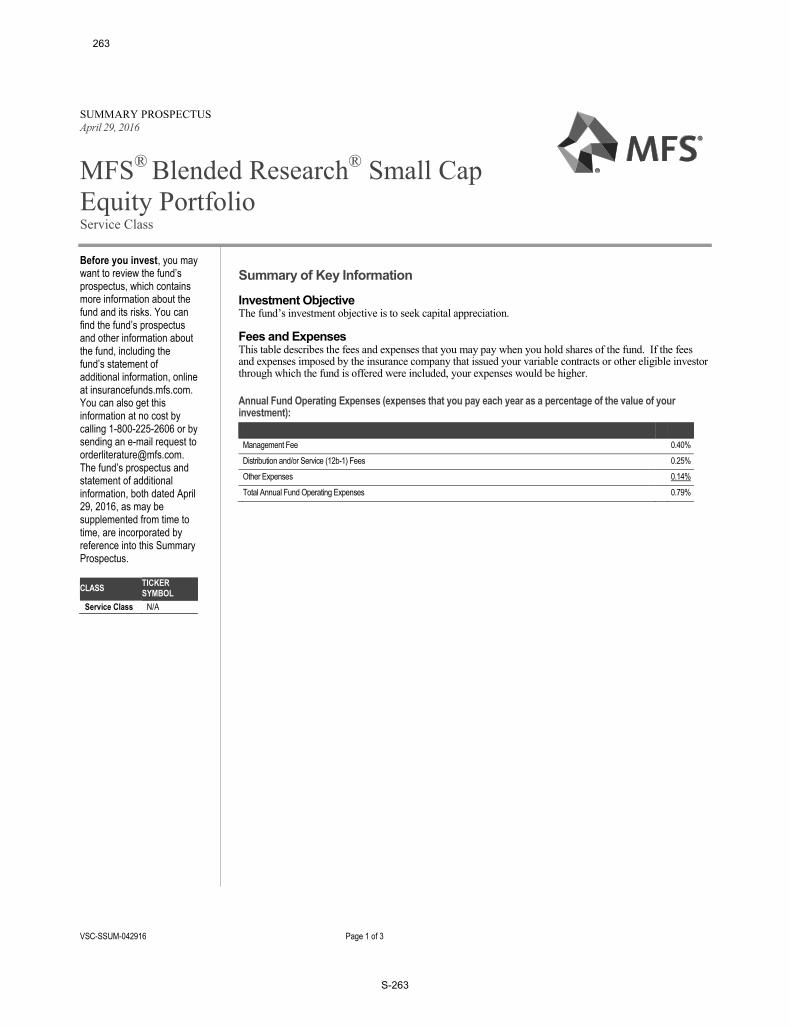
SUMMARY PROSPECTUS April 29, 2016
MFS® Blended Research® Small Cap Equity Portfolio Service Class
VSC-SSUM-042916 Page 1 of 3
Before you invest, you may want to review the fund’s prospectus, which contains more information about the fund and its risks. You can find the fund’s prospectus and other information about the fund, including the fund’s statement of additional information, online at insurancefunds.mfs.com. You can also get this information at no cost by calling 1-800-225-2606 or by sending an e-mail request to [email protected]. The fund’s prospectus and statement of additional information, both dated April 29, 2016, as may be supplemented from time to time, are incorporated by reference into this Summary Prospectus. CLASS TICKER
SYMBOL Service Class N/A
Summary of Key Information
Investment Objective ����������� ���ment objective is to seek capital appreciation.
Fees and Expenses This table describes the fees and expenses that you may pay when you hold shares of the fund. If the fees and expenses imposed by the insurance company that issued your variable contracts or other eligible investor through which the fund is offered were included, your expenses would be higher.
Annual Fund Operating Expenses (expenses that you pay each year as a percentage of the value of your investment): Management Fee 0.40%
Distribution and/or Service (12b-1) Fees 0.25% Other Expenses 0.14%
Total Annual Fund Operating Expenses 0.79%
263
S-263

MFS Blended Research Small Cap Equity Portfolio
Page 2 of 3
Example This example is intended to help you compare the cost of investing in the fund with the cost of investing in other mutual funds. If the fees and expenses imposed by the insurance company that issued your variable contracts or other eligible investor through which an investment in the fund is made were included, your expenses would be higher. The example assumes that: you invest $10,000 in the fund for the time periods indicated and you redeem your shares at the end of the time periods; your investment has a 5% return each year; and the ����������������������������������������� Although your actual costs will likely be higher or lower, under these assumptions your costs would be: 1 YEAR 3 YEARS 5 YEARS 10 YEARS
Service Class Shares $81 $252 $439 $978
Portfolio Turnover The fund pays transaction costs, such as commissions, when it buys a������������������������������� ���������������������������������������turnover rate may indicate higher transaction costs. These transaction costs, which are not reflected in �Annual Fund Operating Expenses� or in the �Example,� ����������������perform�����������������������������������������!����������portfolio turnover rate was 78% of the average value of its portfolio.
Principal Investment Strategies MFS (Massachusetts Financial Services Company, the fund's investment adviser) normally invests at l�����"#*�����������������assets in equity securities of issuers with small market capitalizations. MFS generally defines small market capitalization issuers as issuers with market capitalizations similar to those of issuers included in the Russell 2000® Index (the "Index") over the last 13 months at the time of purchase. As of March 31, 2016, the range of the market capitalizations of the issuers in the Index was between $14 million and $6.1 billion. Equity securities include common stocks, equity interests in real estate investment trusts (REITs), and other securities that represent an ownership interest (or right to acquire an ownership interest) in a company or other issuer. In selecting investments for the fund, MFS is not constrained to any particu������ ���������������<=>������� ���������������������������stocks of companies it believes to have above average earnings growth potential compared to other companies (growth companies), in the stocks of companies it believes are undervalued compared to their perceived worth (value companies), or in a combination of growth and value companies. <=>������� ������������������������������������������ MFS uses a bottom-up approach to buying and selling investments for the fund. Investments are selected primarily based on blending fundamental and quantitative research. MFS uses fundamental analysis of individual issuers to determine a fundamental rating for an issuer. MFS uses quantitative analysis to determine a quantitative rating for an issuer. MFS then constructs the portfolio considering the blended rating from combining the fundamental rating and the quantitative rating, as well as issuer, industry, and sector weightings, market capitalization, measures of expected volatility of the fund's return (e.g., predicted beta and predicted tracking error), and other factors, with a goal of constructing a portfolio that over time has a consistent level of active risk
compared to the Index. Active risk is the risk resulting from investment selection rather than market risk.
Principal Risks As with any mutual fund, the fund may not achieve its objective and/or you could lose money on your investment in the fund. An investment in the fund is not a bank deposit and is not insured or guaranteed by the Federal Deposit Insurance Corporation or any other governmental agency. The principal risks of investing in the fund are: Stock Market/Company Risk: Stock markets are volatile and can decline significantly in response to issuer, market, economic, industry, political, regulatory, geopolitical, and other conditions, as well as to investor perceptions of these conditions. The price of an equity security can decrease significantly in response to these conditions, and these conditions can affect a single issuer or type of security, issuers within a broad market sector, industry or geographic region, or the market in general. Investment Strategy Risk: The fund's strategy to blend fundamental and quantitative research and to have a consistent level of active risk over time may not produce the intended results. In addition, MFS fundamental research is not available for all issuers. Small Cap Risk: The stocks of small cap companies can be more volatile than stocks of larger companies. Foreign Risk: Exposure to foreign markets through issuers or currencies can involve additional risks relating to market, economic, industry, political, regulatory, geopolitical, and other conditions. These factors can make foreign investments, especially those in emerging markets, more volatile and less liquid than U.S. investments. In addition, foreign markets can react differently to these conditions than the U.S. market. Real Estate Investment Trust Risk: The risks of investing in REITs include certain risks associated with the direct ownership of real estate and the real estate industry in general. These include risks related to general, regional and local economic conditions; difficulties in valuing and disposing of real estate; fluctuations in interest rates and property tax rates; shifts in zoning laws, environmental regulations and other governmental action; cash flow dependency; increased operating expenses; lack of availability of mortgage funds; losses due to natural disasters; overbuilding; losses due to casualty or condemnation; changes in property values and rental rates; and other factors. The securities of smaller real estate-related issuers can be more volatile and less liquid than securities of larger issuers and their issuers can have more limited financial resources. Liquidity Risk: It may be difficult to value, and it may not be possible to sell, certain investments, types of investments, and/or investments in certain segments of the market, and the fund may have to sell certain of these investments at a price or time that is not advantageous in order to meet redemptions or other cash needs. Investment Selection Risk: MFS' investment analysis, its development and use of quantitative models, and its selection of investments may not produce the intended results and/or can lead to an investment focus that results in the fund underperforming other funds with similar investment strategies and/or underperforming the markets in which the fund invests. Investments selected using quantitative models may not produce the intended results due to the factors used in the models, the weight placed on each factor in the models, changing sources of market return, and technical issues in the design, development, implementation, and maintenance of the models (e.g., incomplete or inaccurate data, programming or other software issues, and technology failures).
264
S-264
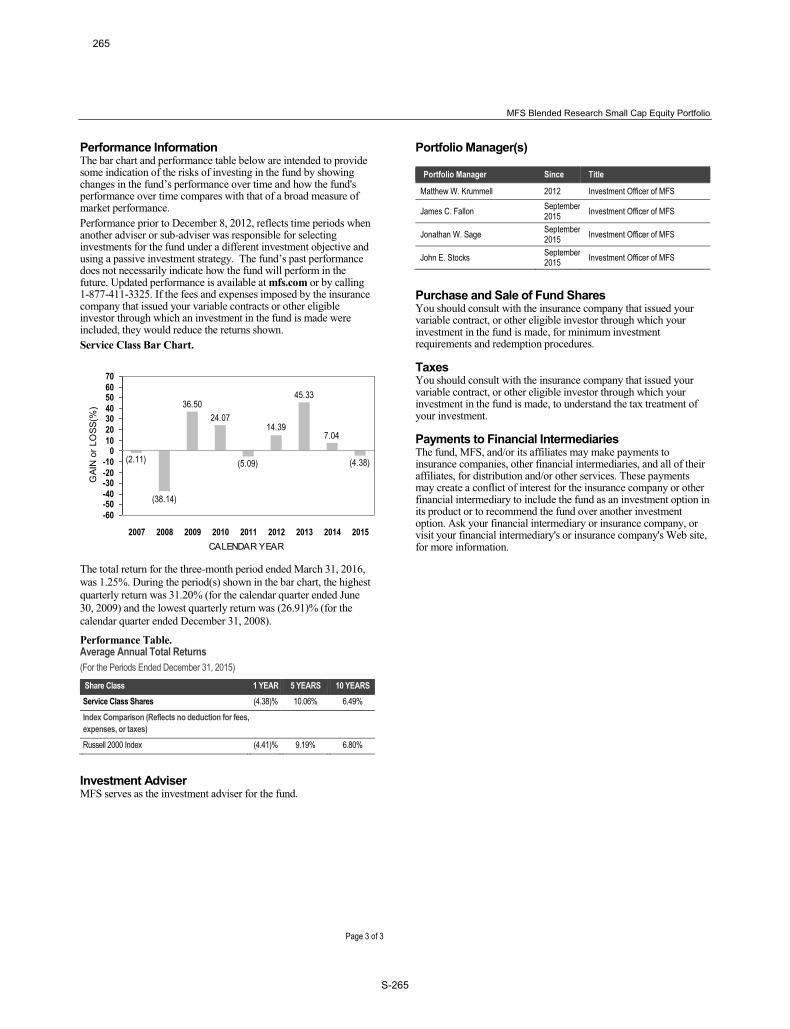
MFS Blended Research Small Cap Equity Portfolio
Page 3 of 3
Performance Information The bar chart and performance table below are intended to provide some indication of the risks of investing in the fund by showing ��������������������������������� ����ime and how the fund's performance over time compares with that of a broad measure of market performance. Performance prior to December 8, 2012, reflects time periods when another adviser or sub-adviser was responsible for selecting investments for the fund under a different investment objective and ������������� ���� ���������������������������������������������does not necessarily indicate how the fund will perform in the future. Updated performance is available at mfs.com or by calling 1-877-411-3325. If the fees and expenses imposed by the insurance company that issued your variable contracts or other eligible investor through which an investment in the fund is made were included, they would reduce the returns shown. Service Class Bar Chart.
(4.38)
7.04
45.33
14.39
(5.09)
24.0736.50
(38.14)
(2.11)
-60-50-40-30-20-10
010203040506070
2007 2008 2009 2010 2011 2012 2013 2014 2015CALENDAR YEAR
GAI
N o
r LO
SS(%
)
The total return for the three-month period ended March 31, 2016, was 1.25%. During the period(s) shown in the bar chart, the highest quarterly return was 31.20% (for the calendar quarter ended June 30, 2009) and the lowest quarterly return was (26.91)% (for the calendar quarter ended December 31, 2008).
Performance Table. Average Annual Total Returns (For the Periods Ended December 31, 2015)
Share Class 1 YEAR 5 YEARS 10 YEARS Service Class Shares (4.38)% 10.06% 6.49%
Index Comparison (Reflects no deduction for fees, expenses, or taxes)
Russell 2000 Index (4.41)% 9.19% 6.80%
Investment Adviser MFS serves as the investment adviser for the fund.
Portfolio Manager(s)
Portfolio Manager Since Title
Matthew W. Krummell 2012 Investment Officer of MFS
James C. Fallon September 2015 Investment Officer of MFS
Jonathan W. Sage September 2015 Investment Officer of MFS
John E. Stocks September 2015 Investment Officer of MFS
Purchase and Sale of Fund Shares You should consult with the insurance company that issued your variable contract, or other eligible investor through which your investment in the fund is made, for minimum investment requirements and redemption procedures.
Taxes You should consult with the insurance company that issued your variable contract, or other eligible investor through which your investment in the fund is made, to understand the tax treatment of your investment.
Payments to Financial Intermediaries The fund, MFS, and/or its affiliates may make payments to insurance companies, other financial intermediaries, and all of their affiliates, for distribution and/or other services. These payments may create a conflict of interest for the insurance company or other financial intermediary to include the fund as an investment option in its product or to recommend the fund over another investment option. Ask your financial intermediary or insurance company, or visit your financial intermediary's or insurance company's Web site, for more information.
265
S-265
SUMMARY PROSPECTUS April 29, 2016
MFS® Global Equity Series Service Class
VGE-SSUM-042916 Page 1 of 3
Before you invest, you may want to review the fund’s prospectus, which contains more information about the fund and its risks. You can find the fund’s prospectus and other information about the fund, including the fund’s statement of additional information, online at insurancefunds.mfs.com. You can also get this information at no cost by calling 1-800-225-2606 or by sending an e-mail request to [email protected]. The fund’s prospectus and statement of additional information, both dated April 29, 2016, as may be supplemented from time to time, are incorporated by reference into this Summary Prospectus.
CLASS TICKER SYMBOL
Service Class N/A
Summary of Key Information
Investment Objective ����������� ���ment objective is to seek capital appreciation.
Fees and Expenses This table describes the fees and expenses that you may pay when you hold shares of the fund. Expenses have been adjusted to reflect the current management fee set forth in the fund's Investment Advisory Agreement. If the fees and expenses imposed by the insurance company that issued your variable contracts or other eligible investor through which the fund is offered were included, your expenses would be higher.
Annual Fund Operating Expenses (expenses that you pay each year as a percentage of the value of your investment): Management Fee 0.90%
Distribution and/or Service (12b-1) Fees 0.25%
Other Expenses 0.26% Total Annual Fund Operating Expenses 1.41%
Fee Reductions and/or Expense Reimbursements1 (0.16)%
Total Annual Fund Operating Expenses After Fee Reductions and/or Expense Reimbursements 1.25% 1 Massachusetts Financial Services Company has agreed in writing to bear the fund’s expenses, excluding interest, taxes, extraordinary
expenses, brokerage and transaction costs, and investment-related expenses (such as interest and borrowing expenses incurred inconnection with the fund's investment activity), such that “Total Annual Fund Operating Expenses” do not exceed 1.25% of the fund’s average daily net assets annually for Service Class shares. This written agreement will continue until modified by the fund’s Board of Trustees, but such agreement will continue until at least April 30, 2017.
266
S-266
MFS Global Equity Series
Page 2 of 3
Example This example is intended to help you compare the cost of investing in the fund with the cost of investing in other mutual funds. If the fees and expenses imposed by the insurance company that issued your variable contracts or other eligible investor through which an investment in the fund is made were included, your expenses would be higher. The example assumes that: you invest $10,000 in the fund for the time periods indicated and you redeem your shares at the end of the time periods; your investment has a 5% return each year; and the ����������������������������������������� Although your actual costs will likely be higher or lower, under these assumptions your costs would be: 1 YEAR 3 YEARS 5 YEARS 10 YEARS Service Class Shares $127 $431 $756 $1,677
Portfolio Turnover The fund pays transaction costs, such as commissions, when it buys �������������������������������� ���������������������������������������turnover rate may indicate higher transaction costs. These transaction costs, which are not reflected in �Annual Fund Operating Expenses� or in the �Example,� ����������������������������������������������������������������!����������portfolio turnover rate was 12% of the average value of its portfolio.
Principal Investment Strategies <=>��<�������������=���������>�� �����?������!������������ ��������� ����������������� ��������������"#*�����������������assets in equity securities. Equity securities include common stocks and other securities that represent an ownership interest (or right to acquire an ownership interest) in a company or other issuer. In selecting investments for the fund, MFS is not constrained to any ������������� ���������������<=>������� ���������������������������stocks of companies it believes to have above average earnings growth potential compared to other companies (growth companies), in the stocks of companies it believes are undervalued compared to their perceived worth (value companies), or in a combination of growth and value companies. Z�����<=>������� ������������������������������������������[�!�MFS primarily invests in companies with large capitalizations. <=>��� ������������������������\�>�����������������������!�including emerging market securities. MFS normally allocates the fund's investments across different countries and regions, but MFS may invest a large percentage of the ������������������������������������������!������������]������countries, or a particular geographic region. MFS uses a bottom-up investment approach to buying and selling investments for the fund. Investments are selected primarily based on fundamental analysis of individual issuers. Quantitative models that systematically evaluate issuers may also be considered.
Principal Risks As with any mutual fund, the fund may not achieve its objective and/or you could lose money on your investment in the fund. An investment in the fund is not a bank deposit and is not insured or guaranteed by the Federal Deposit Insurance Corporation or any other governmental agency. The principal risks of investing in the fund are:
Stock Market/Company Risk: Stock markets are volatile and can decline significantly in response to issuer, market, economic, industry, political, regulatory, geopolitical, and other conditions, as well as to investor perceptions of these conditions. The price of an equity security can decrease significantly in response to these conditions, and these conditions can affect a single issuer or type of security, issuers within a broad market sector, industry or geographic region, or the market in general. Foreign Risk: Exposure to foreign markets through issuers or currencies can involve additional risks relating to market, economic, industry, political, regulatory, geopolitical, and other conditions. These factors can make foreign investments, especially those in emerging markets, more volatile and less liquid than U.S. investments. In addition, foreign markets can react differently to these conditions than the U.S. market. Emerging Markets Risk: Investments in emerging markets can involve additional and greater risks than the risks associated with investments in developed foreign markets. Emerging markets can have less developed markets, greater custody and operational risk, less developed legal, regulatory, and accounting systems, and greater political, social, and economic instability than developed markets. Currency Risk: The value of foreign currencies relative to the U.S. dollar fluctuates in response to market, economic, industry, political, regulatory, geopolitical, and other conditions, and a decline in the value of a foreign currency versus the U.S. dollar reduces the value in U.S. dollars of investments denominated in that foreign currency. Geographic Focus Risk: �����������������nce will be closely tied to the market, currency, economic, political, regulatory, geopolitical, and other conditions in the countries or regions in which the fund's assets are invested. Liquidity Risk: It may be difficult to value, and it may not be possible to sell, certain investments, types of investments, and/or investments in certain segments of the market, and the fund may have to sell certain of these investments at a price or time that is not advantageous in order to meet redemptions or other cash needs. Investment Selection Risk: MFS' investment analysis and its selection of investments may not produce the intended results and/or can lead to an investment focus that results in the fund underperforming other funds with similar investment strategies and/or underperforming the markets in which the fund invests.
Performance Information The bar chart and performance table below are intended to provide some indication of the risks of investing in the fund by showing ��������������������������������over time and how the fund's performance over time compares with that of a broad measure of market performance. ��������������������������������������������������������^�����fund will perform in the future. Updated performance is available at mfs.com or by calling 1-877-411-3325. If the fees and expenses imposed by the insurance company that issued your variable contracts or other eligible investor through which an investment in the fund is made were included, they would reduce the returns shown.
267
S-267

MFS Global Equity Series
Page 3 of 3
Service Class Bar Chart.
(1.67)
3.63
27.5222.98
(4.53)
12.05
31.80
(33.97)
8.97
24.02
-50-40-30-20-10
01020304050
2006 2007 2008 2009 2010 2011 2012 2013 2014 2015CALENDAR YEAR
GAI
N o
r LO
SS(%
)
The total return for the three-month period ended March 31, 2016, was 1.97%. During the period(s) shown in the bar chart, the highest quarterly return was 18.93% (for the calendar quarter ended June 30, 2009) and the lowest quarterly return was (18.27)% (for the calendar quarter ended December 31, 2008).
Performance Table. Average Annual Total Returns (For the Periods Ended December 31, 2015)
Share Class 1 YEAR 5 YEARS 10 YEARS Service Class Shares (1.67)% 8.82% 7.23%
Index Comparison (Reflects no deduction for fees, expenses, or taxes)
MSCI World Index (0.32)% 8.19% 5.56%
Investment Adviser MFS serves as the investment adviser for the fund.
Portfolio Manager(s)
Portfolio Manager Since Title
David Mannheim 1999 Investment Officer of MFS
Roger Morley 2009 Investment Officer of MFS
Purchase and Sale of Fund Shares You should consult with the insurance company that issued your variable contract, or other eligible investor through which your investment in the fund is made, for minimum investment requirements and redemption procedures.
Taxes You should consult with the insurance company that issued your variable contract, or other eligible investor through which your investment in the fund is made, to understand the tax treatment of your investment.
Payments to Financial Intermediaries The fund, MFS, and/or its affiliates may make payments to insurance companies, other financial intermediaries, and all of their affiliates, for distribution and/or other services. These payments may create a conflict of interest for the insurance company or other
financial intermediary to include the fund as an investment option in its product or to recommend the fund over another investment option. Ask your financial intermediary or insurance company, or visit your financial intermediary's or insurance company's Web site, for more information.
268
S-268

SUMMARY PROSPECTUS April 29, 2016
MFS® Growth Series Service Class
VEG-SSUM-042916 Page 1 of 3
Before you invest, you may want to review the fund’s prospectus, which contains more information about the fund and its risks. You can find the fund’s prospectus and other information about the fund, including the fund’s statement of additional information, online at insurancefunds.mfs.com. You can also get this information at no cost by calling 1-800-225-2606 or by sending an e-mail request to [email protected]. The fund’s prospectus and statement of additional information, both dated April 29, 2016, as may be supplemented from time to time, are incorporated by reference into this Summary Prospectus.
CLASS TICKER SYMBOL
Service Class N/A
Summary of Key Information
Investment Objective ����������� ���ment objective is to seek capital appreciation.
Fees and Expenses This table describes the fees and expenses that you may pay when you hold shares of the fund. If the fees and expenses imposed by the insurance company that issued your variable contracts or other eligible investor through which the fund is offered were included, your expenses would be higher.
Annual Fund Operating Expenses (expenses that you pay each year as a percentage of the value of your investment): Management Fee 0.71%
Distribution and/or Service (12b-1) Fees 0.25% Other Expenses 0.05%
Total Annual Fund Operating Expenses 1.01%
269
S-269

MFS Growth Series
Page 2 of 3
Example This example is intended to help you compare the cost of investing in the fund with the cost of investing in other mutual funds. If the fees and expenses imposed by the insurance company that issued your variable contracts or other eligible investor through which an investment in the fund is made were included, your expenses would be higher. The example assumes that: you invest $10,000 in the fund for the time periods indicated and you redeem your shares at the end of the time periods; your investment has a 5% return each year; and the ����������������������������������������� Although your actual costs will likely be higher or lower, under these assumptions your costs would be: 1 YEAR 3 YEARS 5 YEARS 10 YEARS
Service Class Shares $103 $322 $558 $1,236
Portfolio Turnover The fund pays transaction costs, such as commissions, when it buys �������������������������������� ���������������������������������������turnover rate may indicate higher transaction costs. These transaction costs, which are not reflected in �Annual Fund Operating Expenses� or in the �Example,� ����������������perf��������������������������������������������!����������portfolio turnover rate was 31% of the average value of its portfolio.
Principal Investment Strategies MFS (Massachusetts Financial Services Company, the fund's investment adviser) normally invests t����������������������������equity securities. Equity securities include common stocks and other securities that represent an ownership interest (or right to acquire an ownership interest) in a company or other issuer. <=>�������������� ��������������� assets in the stocks of companies it believes to have above average earnings growth potential compared to other companies (growth companies). Z�����<=>������� ������������������������������������������[�!�MFS primarily invests in companies with large capitalizations. <=>������� ������������������������������������������ MFS uses a bottom-up investment approach to buying and selling investments for the fund. Investments are selected primarily based on fundamental analysis of individual issuers. Quantitative models that systematically evaluate issuers may also be considered.
Principal Risks As with any mutual fund, the fund may not achieve its objective and/or you could lose money on your investment in the fund. An investment in the fund is not a bank deposit and is not insured or guaranteed by the Federal Deposit Insurance Corporation or any other governmental agency. The principal risks of investing in the fund are: Stock Market/Company Risk: Stock markets are volatile and can decline significantly in response to issuer, market, economic, industry, political, regulatory, geopolitical, and other conditions, as well as to investor perceptions of these conditions. The price of an equity security can decrease significantly in response to these conditions, and these conditions can affect a single issuer or type of security, issuers within a broad market sector, industry or geographic region, or the market in general.
Growth Company Risk: The stocks of growth companies can be ������������ ������������������earnings and more volatile than the market in general. Foreign Risk: Exposure to foreign markets through issuers or currencies can involve additional risks relating to market, economic, industry, political, regulatory, geopolitical, and other conditions. These factors can make foreign investments, especially those in emerging markets, more volatile and less liquid than U.S. investments. In addition, foreign markets can react differently to these conditions than the U.S. market. Liquidity Risk: It may be difficult to value, and it may not be possible to sell, certain investments, types of investments, and/or investments in certain segments of the market, and the fund may have to sell certain of these investments at a price or time that is not advantageous in order to meet redemptions or other cash needs. Investment Selection Risk: MFS' investment analysis and its selection of investments may not produce the intended results and/or can lead to an investment focus that results in the fund underperforming other funds with similar investment strategies and/or underperforming the markets in which the fund invests.
Performance Information The bar chart and performance table below are intended to provide some indication of the risks of investing in the fund by showing ��������������������������������� �������������^��������`��performance over time compares with that of a broad measure of market performance. ��������������������������������������������������������^�����fund will perform in the future. Updated performance is available at mfs.com or by calling 1-877-411-3325. If the fees and expenses imposed by the insurance company that issued your variable contracts or other eligible investor through which an investment in the fund is made were included, they would reduce the returns shown. Service Class Bar Chart.
7.308.68
36.49
17.07
(0.56)
15.02
37.33
(37.55)
20.87
7.61
-60-50-40-30-20-10
0102030405060
2006 2007 2008 2009 2010 2011 2012 2013 2014 2015CALENDAR YEAR
GAI
N o
r LO
SS(%
)
The total return for the three-month period ended March 31, 2016, was (1.61)%. During the period(s) shown in the bar chart, the highest quarterly return was 15.94% (for the calendar quarter ended June 30, 2009) and the lowest quarterly return was (22.02)% (for the calendar quarter ended December 31, 2008).
270
S-270

MFS Growth Series
Page 3 of 3
Performance Table. Average Annual Total Returns (For the Periods Ended December 31, 2015)
Share Class 1 YEAR 5 YEARS 10 YEARS Service Class Shares 7.30% 13.13% 9.05%
Index Comparison (Reflects no deduction for fees, expenses, or taxes)
Russell 1000 Growth Index 5.67% 13.53% 8.53%
Investment Adviser MFS serves as the investment adviser for the fund.
Portfolio Manager(s)
Portfolio Manager Since Title
Eric B. Fischman 2002 Investment Officer of MFS
Matthew D. Sabel 2014 Investment Officer of MFS
Purchase and Sale of Fund Shares You should consult with the insurance company that issued your variable contract, or other eligible investor through which your investment in the fund is made, for minimum investment requirements and redemption procedures.
Taxes You should consult with the insurance company that issued your variable contract, or other eligible investor through which your investment in the fund is made, to understand the tax treatment of your investment.
Payments to Financial Intermediaries The fund, MFS, and/or its affiliates may make payments to insurance companies, other financial intermediaries, and all of their affiliates, for distribution and/or other services. These payments may create a conflict of interest for the insurance company or other financial intermediary to include the fund as an investment option in its product or to recommend the fund over another investment option. Ask your financial intermediary or insurance company, or visit your financial intermediary's or insurance company's Web site, for more information.
271
S-271

SUMMARY PROSPECTUS April 29, 2016
MFS® Inflation-Adjusted Bond Portfolio Service Class
VIA-SSUM-042916 Page 1 of 3
Before you invest, you may want to review the fund’s prospectus, which contains more information about the fund and its risks. You can find the fund’s prospectus and other information about the fund, including the fund’s statement of additional information, online at insurancefunds.mfs.com. You can also get this information at no cost by calling 1-800-225-2606 or by sending an e-mail request to [email protected]. The fund’s prospectus and statement of additional information, both dated April 29, 2016, as may be supplemented from time to time, are incorporated by reference into this Summary Prospectus.
CLASS TICKER SYMBOL
Service Class N/A
Summary of Key Information
Investment Objective ����������� ����ent objective is to seek total return that exceeds the rate of inflation over the long-term, with an emphasis on current income, but also considering capital appreciation.
Fees and Expenses This table describes the fees and expenses that you may pay when you hold shares of the fund. If the fees and expenses imposed by the insurance company that issued your variable contracts or other eligible investor through which the fund is offered were included, your expenses would be higher.
Annual Fund Operating Expenses (expenses that you pay each year as a percentage of the value of your investment): Management Fee 0.50%
Distribution and/or Service (12b-1) Fees 0.25%
Other Expenses 0.06% Total Annual Fund Operating Expenses 0.81%
272
S-272

MFS Inflation-Adjusted Bond Portfolio
Page 2 of 3
Example This example is intended to help you compare the cost of investing in the fund with the cost of investing in other mutual funds. If the fees and expenses imposed by the insurance company that issued your variable contracts or other eligible investor through which an investment in the fund is made were included, your expenses would be higher. The example assumes that: you invest $10,000 in the fund for the time periods indicated and you redeem your shares at the end of the time periods; your investment has a 5% return each year; and the ����������������������������������������� Although your actual costs will likely be higher or lower, under these assumptions your costs would be: 1 YEAR 3 YEARS 5 YEARS 10 YEARS
Service Class Shares $83 $259 $450 $1,002
Portfolio Turnover The fund pays transaction costs, such as commissions, when it buys �������������������������������� ���������������������������������������turnover rate may indicate higher transaction costs. These transaction costs, which are not reflected in �Annual Fund Operating Expenses� or in the �Example,� ����������������������������������������������������������������!����������portfolio turnover rate was 44% of the average value of its portfolio.
Principal Investment Strategies MFS (Massachusetts Financial Services Company, the fund's �� ��������� ����������������� ��������������"#*�����������������assets in inflation-adjusted debt instruments and other instruments with similar economic characteristics. <=>�������������������������������������� ���������������������-adjusted debt instruments issued by U.S. and foreign governments. <=>������������ ��������������������������������-adjusted debt instruments of other issuers, other instruments with similar economic characteristics to these instruments, including derivatives, and non-inflation-adjusted debt instruments. <=>������������� �������������������������� �������������{�������debt instruments, but may also invest in below investment grade quality debt instruments. <=>��� ������������������������\�>������������������������ <=>������� ��������������������������������������������������������a single country, a small number of countries, or a particular geographic region. The fund is a non-diversified fund. This means that MFS may invest �������� ��������������������������������������������������������������a small number of issuers. While MFS may use derivatives for any investment purpose, to the extent MFS uses derivatives, MFS expects to use derivatives primarily to increase or decrease exposure to a particular market, segment of the market, or security, to increase or decrease interest rate or currency exposure, or as alternatives to direct investments. Derivatives include futures, forward contracts, options, structured securities, and swaps. <=>�������������������������������������������!�����������!����types of debt instruments based on its evaluation of U.S. and foreign macroeconomic factors, including interest rates, inflation rates, and monetary and fiscal policies. MFS uses a bottom-up investment approach to buying and selling investments for the fund. Investments are selected primarily based
on fundamental analysis of individual instruments and their issuers. Quantitative models that systematically evaluate instruments may also be considered. In structuring the fund, MFS may also consider top-down factors.
Principal Risks As with any mutual fund, the fund may not achieve its objective and/or you could lose money on your investment in the fund. An investment in the fund is not a bank deposit and is not insured or guaranteed by the Federal Deposit Insurance Corporation or any other governmental agency. The principal risks of investing in the fund are: Debt Market Risk: Debt markets can be volatile and can decline significantly in response to changes in, or investor perceptions of changes in, market, economic, industry, political, regulatory, geopolitical, and other conditions that affect a particular type of instrument, issuer, or borrower, and/or that affect the debt market generally. Interest Rate Risk: In general, the price of a debt instrument falls when interest rates rise and rises when interest rates fall. Interest rate risk is generally greater for instruments with longer maturities, or that do not pay current interest. Credit Risk: The price of a debt instrument depends, in part, on the credit quality of the issuer, borrower, counterparty, or other entity responsible for payment, or underlying collateral or assets and the terms of the instrument. The price of a debt instrument can decline in response to changes in the financial condition of the issuer, borrower, counterparty, or other entity, or underlying collateral or assets, or changes in specific or general market, economic, industry, political, regulatory, geopolitical, and other conditions. Below investment grade quality debt instruments (commonly �����������������������������������������|��}�]������������ �� ����substantially greater risk of default or can already be in default, and their values can decline significantly. Below investment grade quality debt instruments are regarded as having predominantly speculative characteristics. Below investment grade quality debt instruments tend to be more sensitive to adverse news about the issuer, or the market or economy in general, than higher quality debt instruments. Government securities not supported as to the payment of principal or interest by the full faith and credit of the government are subject to greater credit risk than are government securities supported by the full faith and credit of the government. Inflation-Adjusted Debt Instruments Risk: Interest payments on inflation-adjusted debt instruments can be unpredictable and vary based on the level of inflation. If inflation is negative, principal and income can both decline. Foreign Risk: Exposure to foreign markets through issuers or currencies can involve additional risks relating to market, economic, industry, political, regulatory, geopolitical, and other conditions. These factors can make foreign investments, especially those in emerging markets, more volatile and less liquid than U.S. investments. In addition, foreign markets can react differently to these conditions than the U.S. market. Geographic Focus Risk: ���������������������^����]����������tied to the market, currency, economic, political, regulatory, geopolitical, and other conditions in the countries or regions in which the fund's assets are invested. Non-Diversification Risk: Because MFS may invest a relatively �������������������������������������������������������������������]�������������!���������������������������]�����������������
273
S-273

MFS Inflation-Adjusted Bond Portfolio
Page 3 of 3
the value of that one issuer or issuers, and could be more volatile than the performance of diversified funds. Derivatives Risk: Derivatives can be highly volatile and involve risks in addition to the risks of the underlying indicator(s) on which the derivative is based. Gains or losses from derivatives can be ��]������������������������������� ��� �� original cost. Derivatives can involve leverage. Leveraging Risk: Leverage involves investment exposure in an amount exceeding the initial investment. Leverage can cause increased volatility by magnifying gains or losses. Counterparty and Third Party Risk: Transactions involving a counterparty or third party other than the issuer of the instrument are subject to the credit risk of the counterparty or third party, and to the ������������������������������]���������^�������������������������accordance with the terms of the transaction. Liquidity Risk: It may be difficult to value, and it may not be possible to sell, certain investments, types of investments, and/or investments in certain segments of the market, and the fund may have to sell certain of these investments at a price or time that is not advantageous in order to meet redemptions or other cash needs. Investment Selection Risk: MFS' investment analysis and its selection of investments may not produce the intended results and/or can lead to an investment focus that results in the fund underperforming other funds with similar investment strategies and/or underperforming the markets in which the fund invests.
Performance Information The bar chart and performance table below are intended to provide some indication of the risks of investing in the fund by showing ��������������������������������� �������������^��������`��performance over time compares with that of a broad measure of market performance. Performance prior to December 8, 2012, reflects time periods when another adviser or sub-adviser was responsible for selecting investments for the fund under a different investment objective and ����������� ��������������������������������������������������not necessarily indicate how the fund will perform in the future. Updated performance is available at mfs.com or by calling 1-877-411-3325. If the fees and expenses imposed by the insurance company that issued your variable contracts or other eligible investor through which an investment in the fund is made were included, they would reduce the returns shown. Service Class Bar Chart.
(5.27)
3.43
(5.28)
7.42
11.70
4.91
8.34
-10-8-6-4-202468
101214
2009 2010 2011 2012 2013 2014 2015CALENDAR YEAR
GAI
N o
r LO
SS(%
)
The total return for the three-month period ended March 31, 2016, was 4.24%. During the period(s) shown in the bar chart, the highest
quarterly return was 3.95% (for the calendar quarter ended September 30, 2011) and the lowest quarterly return was (6.14)% (for the calendar quarter ended June 30, 2013).
Performance Table. Average Annual Total Returns (For the Periods Ended December 31, 2015)
Share Class 1 YEAR 5 YEARS LIFE
(INCEPTION 10-1-2008)
Service Class Shares (5.27)% 2.18% 3.16%
Index Comparison (Reflects no deduction for fees, expenses, or taxes)
Barclays World Government Inflation-Linked Bond Index (4.70)% 2.24% 2.97%
Investment Adviser MFS serves as the investment adviser for the fund.
Portfolio Manager(s)
Portfolio Manager Since Title
Erik S. Weisman 2012 Investment Officer of MFS
Purchase and Sale of Fund Shares You should consult with the insurance company that issued your variable contract, or other eligible investor through which your investment in the fund is made, for minimum investment requirements and redemption procedures.
Taxes You should consult with the insurance company that issued your variable contract, or other eligible investor through which your investment in the fund is made, to understand the tax treatment of your investment.
Payments to Financial Intermediaries The fund, MFS, and/or its affiliates may make payments to insurance companies, other financial intermediaries, and all of their affiliates, for distribution and/or other services. These payments may create a conflict of interest for the insurance company or other financial intermediary to include the fund as an investment option in its product or to recommend the fund over another investment option. Ask your financial intermediary or insurance company, or visit your financial intermediary's or insurance company's Web site, for more information.
274
S-274

SUMMARY PROSPECTUS April 29, 2016
MFS® International Value Portfolio Service Class
FCG-SSUM-042916 Page 1 of 3
Before you invest, you may want to review the fund’s prospectus, which contains more information about the fund and its risks. You can find the fund’s prospectus and other information about the fund, including the fund’s statement of additional information, online at insurancefunds.mfs.com. You can also get this information at no cost by calling 1-800-225-2606 or by sending an e-mail request to [email protected]. The fund’s prospectus and statement of additional information, both dated April 29, 2016, as may be supplemented from time to time, are incorporated by reference into this Summary Prospectus.
CLASS TICKER SYMBOL
Service Class N/A
Summary of Key Information
Investment Objective ����������� ����ent objective is to seek capital appreciation.
Fees and Expenses This table describes the fees and expenses that you may pay when you hold shares of the fund. If the fees and expenses imposed by the insurance company that issued your variable contracts or other eligible investor through which the fund is offered were included, your expenses would be higher.
Annual Fund Operating Expenses (expenses that you pay each year as a percentage of the value of your investment): Management Fee 0.87%
Distribution and/or Service (12b-1) Fees 0.25% Other Expenses 0.06%
Total Annual Fund Operating Expenses 1.18%
Fee Reductions and/or Expense Reimbursements1 (0.03)% Total Annual Fund Operating Expenses After Fee Reductions and/or Expense Reimbursements 1.15%
1 Massachusetts Financial Services Company has agreed in writing to bear the fund's expenses, excluding interest, taxes, extraordinary
expenses, brokerage and transaction costs, and investment-related expenses (such as interest and borrowing expenses incurred in connection with the fund's investment activity), such that "Total Annual Fund Operating Expenses" do not exceed 1.15% of the fund's average daily net assets annually for Service Class shares. This written agreement will continue until modified by the fund's Board of Trustees, but such agreement will continue until at least April 30, 2017.
275
S-275
MFS International Value Portfolio
Page 2 of 3
Example This example is intended to help you compare the cost of investing in the fund with the cost of investing in other mutual funds. If the fees and expenses imposed by the insurance company that issued your variable contracts or other eligible investor through which an investment in the fund is made were included, your expenses would be higher. The example assumes that: you invest $10,000 in the fund for the time periods indicated and you redeem your shares at the end of the time periods; your investment has a 5% return each year; and the ����������������������������������������� Although your actual costs will likely be higher or lower, under these assumptions your costs would be: 1 YEAR 3 YEARS 5 YEARS 10 YEARS
Service Class Shares $117 $372 $646 $1,429
Portfolio Turnover The fund pays transaction costs, such as commissions, when it buys and ����������������������������� ���������������������������������������turnover rate may indicate higher transaction costs. These transaction costs, which are not reflected in �Annual Fund Operating Expenses� or in the �Example,� ����������������performanc��������������������������������������!����������portfolio turnover rate was 24% of the average value of its portfolio.
Principal Investment Strategies MFS (Massachusetts Financial Services Company, the fund's investment adviser) normally invests the fun����������������������foreign equity securities, including emerging market equity securities. Equity securities include common stocks and other securities that represent an ownership interest (or right to acquire an ownership interest) in a company or other issuer. <=>������� ��������������������������������������������������������a single country, a small number of countries, or a particular geographic region. MFS focuses on investing the fund's assets in the stocks of companies it believes are undervalued compared to their intrinsic value (value companies). These companies may have stock prices that are higher relative to their earnings, dividends, assets, or other financial measures than companies generally considered value companies. MFS may invest ��������������������������������������[�� While MFS may use derivatives for any investment purpose, to the extent MFS uses derivatives, MFS expects to use derivatives primarily to increase or decrease currency exposure. Derivatives include futures, forward contracts, options, and swaps. MFS uses a bottom-up investment approach to buying and selling investments for the fund. Investments are selected primarily based on fundamental analysis of individual issuers. Quantitative models that systematically evaluate issuers may also be considered.
Principal Risks As with any mutual fund, the fund may not achieve its objective and/or you could lose money on your investment in the fund. An investment in the fund is not a bank deposit and is not insured or guaranteed by the Federal Deposit Insurance Corporation or any other governmental agency. The principal risks of investing in the fund are:
Stock Market/Company Risk: Stock markets are volatile and can decline significantly in response to issuer, market, economic, industry, political, regulatory, geopolitical, and other conditions, as well as to investor perceptions of these conditions. The price of an equity security can decrease significantly in response to these conditions, and these conditions can affect a single issuer or type of security, issuers within a broad market sector, industry or geographic region, or the market in general. Value Company Risk: The stocks of value companies can continue to be undervalued for long periods of time and not realize their expected value and can be more volatile than the market in general. Foreign Risk: Exposure to foreign markets through issuers or currencies can involve additional risks relating to market, economic, industry, political, regulatory, geopolitical, and other conditions. These factors can make foreign investments, especially those in emerging markets, more volatile and less liquid than U.S. investments. In addition, foreign markets can react differently to these conditions than the U.S. market. Emerging Markets Risk: Investments in emerging markets can involve additional and greater risks than the risks associated with investments in developed foreign markets. Emerging markets can have less developed markets, greater custody and operational risk, less developed legal, regulatory, and accounting systems, and greater political, social, and economic instability than developed markets. Currency Risk: The value of foreign currencies relative to the U.S. dollar fluctuates in response to market, economic, industry, political, regulatory, geopolitical, and other conditions, and a decline in the value of a foreign currency versus the U.S. dollar reduces the value in U.S. dollars of investments denominated in that foreign currency. Geographic Focus Risk: �������� performance will be closely tied to the market, currency, economic, political, regulatory, geopolitical, and other conditions in the countries or regions in which the fund's assets are invested. Derivatives Risk: Derivatives can be highly volatile and involve risks in addition to the risks of the underlying indicator(s) on which the derivative is based. Gains or losses from derivatives can be ��]������������������������������� ��� ����������������������� ��� ���can involve leverage. Leveraging Risk: Leverage involves investment exposure in an amount exceeding the initial investment. Leverage can cause increased volatility by magnifying gains or losses. Counterparty and Third Party Risk: Transactions involving a counterparty or third party other than the issuer of the instrument are subject to the credit risk of the counterparty or third party, and to the ������������������������������]���������^�������������������������accordance with the terms of the transaction. Liquidity Risk: It may be difficult to value, and it may not be possible to sell, certain investments, types of investments, and/or investments in certain segments of the market, and the fund may have to sell certain of these investments at a price or time that is not advantageous in order to meet redemptions or other cash needs. Investment Selection Risk: MFS' investment analysis and its selection of investments may not produce the intended results and/or can lead to an investment focus that results in the fund underperforming other funds with similar investment strategies and/or underperforming the markets in which the fund invests.
276
S-276
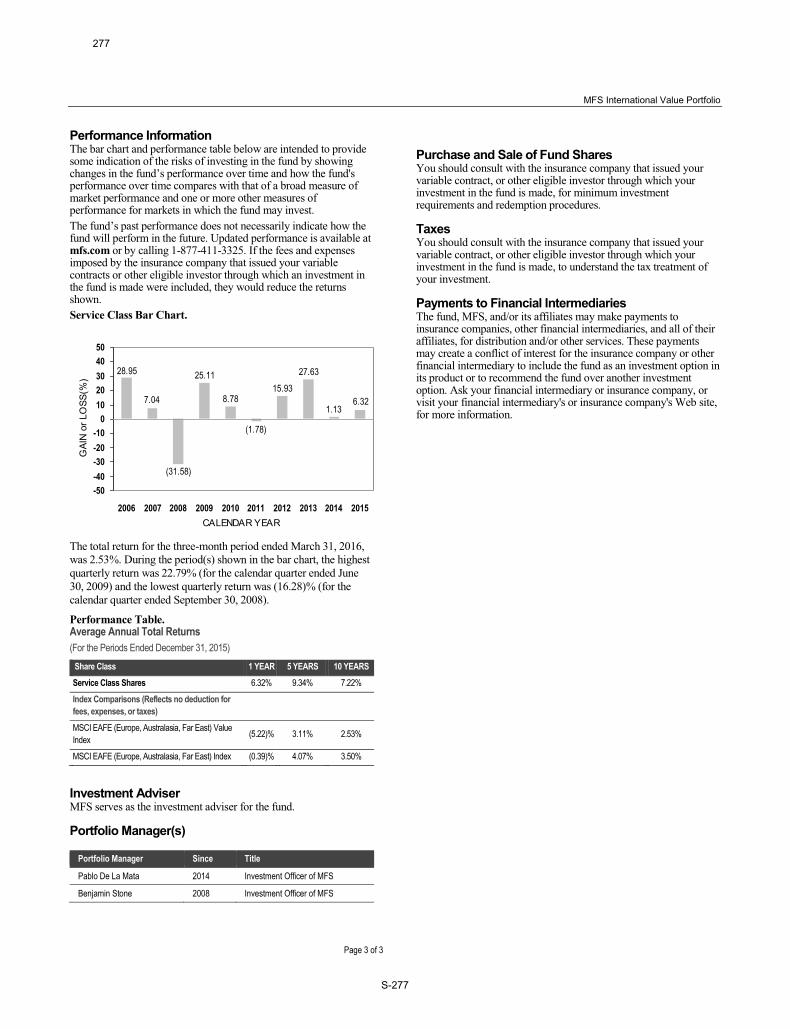
MFS International Value Portfolio
Page 3 of 3
Performance Information The bar chart and performance table below are intended to provide some indication of the risks of investing in the fund by showing ��������������������������������� �������������^��������`��performance over time compares with that of a broad measure of market performance and one or more other measures of performance for markets in which the fund may invest. ���������������������ance does not necessarily indicate how the fund will perform in the future. Updated performance is available at mfs.com or by calling 1-877-411-3325. If the fees and expenses imposed by the insurance company that issued your variable contracts or other eligible investor through which an investment in the fund is made were included, they would reduce the returns shown. Service Class Bar Chart.
6.321.13
27.6315.93
(1.78)
8.78
25.11
(31.58)
7.04
28.95
-50-40-30-20-10
01020304050
2006 2007 2008 2009 2010 2011 2012 2013 2014 2015CALENDAR YEAR
GAI
N o
r LO
SS(%
)
The total return for the three-month period ended March 31, 2016, was 2.53%. During the period(s) shown in the bar chart, the highest quarterly return was 22.79% (for the calendar quarter ended June 30, 2009) and the lowest quarterly return was (16.28)% (for the calendar quarter ended September 30, 2008).
Performance Table. Average Annual Total Returns (For the Periods Ended December 31, 2015)
Share Class 1 YEAR 5 YEARS 10 YEARS Service Class Shares 6.32% 9.34% 7.22%
Index Comparisons (Reflects no deduction for fees, expenses, or taxes)
MSCI EAFE (Europe, Australasia, Far East) Value Index (5.22)% 3.11% 2.53%
MSCI EAFE (Europe, Australasia, Far East) Index (0.39)% 4.07% 3.50%
Investment Adviser MFS serves as the investment adviser for the fund.
Portfolio Manager(s)
Portfolio Manager Since Title
Pablo De La Mata 2014 Investment Officer of MFS
Benjamin Stone 2008 Investment Officer of MFS
Purchase and Sale of Fund Shares You should consult with the insurance company that issued your variable contract, or other eligible investor through which your investment in the fund is made, for minimum investment requirements and redemption procedures.
Taxes You should consult with the insurance company that issued your variable contract, or other eligible investor through which your investment in the fund is made, to understand the tax treatment of your investment.
Payments to Financial Intermediaries The fund, MFS, and/or its affiliates may make payments to insurance companies, other financial intermediaries, and all of their affiliates, for distribution and/or other services. These payments may create a conflict of interest for the insurance company or other financial intermediary to include the fund as an investment option in its product or to recommend the fund over another investment option. Ask your financial intermediary or insurance company, or visit your financial intermediary's or insurance company's Web site, for more information.
277
S-277

SUMMARY PROSPECTUS April 29, 2016
MFS® Mid Cap Value Portfolio Service Class
VMC-SSUM-042916 Page 1 of 3
Before you invest, you may want to review the fund’s prospectus, which contains more information about the fund and its risks. You can find the fund’s prospectus and other information about the fund, including the fund’s statement of additional information, online at insurancefunds.mfs.com. You can also get this information at no cost by calling 1-800-225-2606 or by sending an e-mail request to [email protected]. The fund’s prospectus and statement of additional information, both dated April 29, 2016, as may be supplemented from time to time, are incorporated by reference into this Summary Prospectus. CLASS TICKER
SYMBOL Service Class N/A
Summary of Key Information
Investment Objective ����������� ���ment objective is to seek capital appreciation.
Fees and Expenses This table describes the fees and expenses that you may pay when you hold shares of the fund. If the fees and expenses imposed by the insurance company that issued your variable contracts or other eligible investor through which the fund is offered were included, your expenses would be higher.
Annual Fund Operating Expenses (expenses that you pay each year as a percentage of the value of your investment): Management Fee 0.75%
Distribution and/or Service (12b-1) Fees 0.25% Other Expenses 0.07%
Total Annual Fund Operating Expenses 1.07%
278
S-278

MFS Mid Cap Value Portfolio
Page 2 of 3
Example This example is intended to help you compare the cost of investing in the fund with the cost of investing in other mutual funds. If the fees and expenses imposed by the insurance company that issued your variable contracts or other eligible investor through which an investment in the fund is made were included, your expenses would be higher. The example assumes that: you invest $10,000 in the fund for the time periods indicated and you redeem your shares at the end of the time periods; your investment has a 5% return each year; and the ����������������������������������������� Although your actual costs will likely be higher or lower, under these assumptions your costs would be: 1 YEAR 3 YEARS 5 YEARS 10 YEARS
Service Class Shares $109 $340 $590 $1,306
Portfolio Turnover The fund pays transaction costs, such as commissions, when it buys �������������������������������� ���������������������������������������turnover rate may indicate higher transaction costs. These transaction costs, which are not reflected in �Annual Fund Operating Expenses� or in the �Example,� ����������������perf��������������������������������������������!����������portfolio turnover rate was 51% of the average value of its portfolio.
Principal Investment Strategies <=>��<�������������=���������>�� �����?������!����������investment adviser) normally invests a��������"#*�����������������assets in issuers with medium market capitalizations. MFS generally defines medium market capitalization issuers as issuers with market capitalizations similar to those of issuers included in the Russell Midcap® Value Index (the "Index") over the last 13 months at the time of purchase. As of March 31, 2016, the range of the market capitalizations of the issuers in the Index was between $171 million and $28.0 billion. <=>������������ �����������������������������������{�����securities. Equity securities include common stocks, equity interests in real estate investment trusts (REITs), and other securities that represent an ownership interest (or right to acquire an ownership interest) in a company or other issuer. MFS focuses on investing the fund's assets in the stocks of companies it believes are undervalued compared to their perceived worth (value companies). <=>������� ������������������������������������������ MFS uses a bottom-up investment approach to buying and selling investments for the fund. Investments are selected primarily based on fundamental analysis of individual issuers. Quantitative models that systematically evaluate issuers may also be considered.
Principal Risks As with any mutual fund, the fund may not achieve its objective and/or you could lose money on your investment in the fund. An investment in the fund is not a bank deposit and is not insured or guaranteed by the Federal Deposit Insurance Corporation or any other governmental agency. The principal risks of investing in the fund are: Stock Market/Company Risk: Stock markets are volatile and can decline significantly in response to issuer, market, economic, industry, political, regulatory, geopolitical, and other conditions, as
well as to investor perceptions of these conditions. The price of an equity security can decrease significantly in response to these conditions, and these conditions can affect a single issuer or type of security, issuers within a broad market sector, industry or geographic region, or the market in general. Value Company Risk: The stocks of value companies can continue to be undervalued for long periods of time and not realize their expected value and can be more volatile than the market in general. Mid Cap Risk: The stocks of mid cap companies can be more volatile than stocks of larger companies. Foreign Risk: Exposure to foreign markets through issuers or currencies can involve additional risks relating to market, economic, industry, political, regulatory, geopolitical, and other conditions. These factors can make foreign investments, especially those in emerging markets, more volatile and less liquid than U.S. investments. In addition, foreign markets can react differently to these conditions than the U.S. market. Real Estate Investment Trust Risk: The risks of investing in REITs include certain risks associated with the direct ownership of real estate and the real estate industry in general. These include risks related to general, regional and local economic conditions; difficulties in valuing and disposing of real estate; fluctuations in interest rates and property tax rates; shifts in zoning laws, environmental regulations and other governmental action; cash flow dependency; increased operating expenses; lack of availability of mortgage funds; losses due to natural disasters; overbuilding; losses due to casualty or condemnation; changes in property values and rental rates; and other factors. The securities of smaller real estate-related issuers can be more volatile and less liquid than securities of larger issuers and their issuers can have more limited financial resources. Liquidity Risk: It may be difficult to value, and it may not be possible to sell, certain investments, types of investments, and/or investments in certain segments of the market, and the fund may have to sell certain of these investments at a price or time that is not advantageous in order to meet redemptions or other cash needs. Investment Selection Risk: MFS' investment analysis and its selection of investments may not produce the intended results and/or can lead to an investment focus that results in the fund underperforming other funds with similar investment strategies and/or underperforming the markets in which the fund invests.
Performance Information The bar chart and performance table below are intended to provide some indication of the risks of investing in the fund by showing ��������������������������������� �������������^��������`��performance over time compares with that of a broad measure of market performance. Performance prior to December 8, 2012, reflects time periods when another adviser or sub-adviser was responsible for selecting investments for the fund under a different investment objective and different investment strategies. ������������������������������not necessarily indicate how the fund will perform in the future. Updated performance is available at mfs.com or by calling 1-877-411-3325. If the fees and expenses imposed by the insurance company that issued your variable contracts or other eligible investor through which an investment in the fund is made were included, they would reduce the returns shown.
279
S-279

MFS Mid Cap Value Portfolio
Page 3 of 3
Service Class Bar Chart.
(2.66)
10.16
36.52
16.01
2.34
21.6225.38
-20
-10
0
10
20
30
40
50
60
2009 2010 2011 2012 2013 2014 2015CALENDAR YEAR
GAI
N o
r LO
SS(%
)
The total return for the three-month period ended March 31, 2016, was 3.86%. During the period(s) shown in the bar chart, the highest quarterly return was 22.50% (for the calendar quarter ended September 30, 2009) and the lowest quarterly return was (17.29)% (for the calendar quarter ended September 30, 2011).
Performance Table. Average Annual Total Returns (For the Periods Ended December 31, 2015)
Share Class 1 YEAR 5 YEARS LIFE
(INCEPTION 3-7-2008)
Service Class Shares (2.66)% 11.69% 8.18%
Index Comparison (Reflects no deduction for fees, expenses, or taxes)
Russell Midcap Value Index (4.78)% 11.25% 8.94%
Investment Adviser MFS serves as the investment adviser for the fund.
Portfolio Manager(s)
Portfolio Manager Since Title
Kevin J. Schmitz 2012 Investment Officer of MFS
Brooks A. Taylor 2012 Investment Officer of MFS
Purchase and Sale of Fund Shares You should consult with the insurance company that issued your variable contract, or other eligible investor through which your investment in the fund is made, for minimum investment requirements and redemption procedures.
Taxes You should consult with the insurance company that issued your variable contract, or other eligible investor through which your investment in the fund is made, to understand the tax treatment of your investment.
Payments to Financial Intermediaries The fund, MFS, and/or its affiliates may make payments to insurance companies, other financial intermediaries, and all of their
affiliates, for distribution and/or other services. These payments may create a conflict of interest for the insurance company or other financial intermediary to include the fund as an investment option in its product or to recommend the fund over another investment option. Ask your financial intermediary or insurance company, or visit your financial intermediary's or insurance company's Web site, for more information.
280
S-280

SUMMARY PROSPECTUS April 29, 2016
MFS® New Discovery Series Service Class
VND-SSUM-042916 Page 1 of 3
Before you invest, you may want to review the fund’s prospectus, which contains more information about the fund and its risks. You can find the fund’s prospectus and other information about the fund, including the fund’s statement of additional information, online at insurancefunds.mfs.com. You can also get this information at no cost by calling 1-800-225-2606 or by sending an e-mail request to [email protected]. The fund’s prospectus and statement of additional information, both dated April 29, 2016, as may be supplemented from time to time, are incorporated by reference into this Summary Prospectus.
CLASS TICKER SYMBOL
Service Class N/A
Summary of Key Information
Investment Objective ����������� ���ment objective is to seek capital appreciation.
Fees and Expenses This table describes the fees and expenses that you may pay when you hold shares of the fund. If the fees and expenses imposed by the insurance company that issued your variable contracts or other eligible investor through which the fund is offered were included, your expenses would be higher.
Annual Fund Operating Expenses (expenses that you pay each year as a percentage of the value of your investment): Management Fee 0.90%
Distribution and/or Service (12b-1) Fees 0.25% Other Expenses 0.06%
Total Annual Fund Operating Expenses 1.21%
Fee Reductions and/or Expense Reimbursements1 (0.02)% Total Annual Fund Operating Expenses After Fee Reductions and/or Expense Reimbursements 1.19%
1 Massachusetts Financial Services Company has agreed in writing to bear the fund’s expenses, excluding interest, taxes, extraordinary
expenses, brokerage and transaction costs, and investment-related expenses (such as interest and borrowing expenses incurred in connection with the fund's investment activity), such that ‘‘Total Annual Fund Operating Expenses” do not exceed 1.19% of the fund’s average daily net assets annually for Service Class shares. This written agreement will continue until modified by the fund’s Board of Trustees, but such agreement will continue until at least April 30, 2017.
281
S-281

MFS New Discovery Series
Page 2 of 3
Example This example is intended to help you compare the cost of investing in the fund with the cost of investing in other mutual funds. If the fees and expenses imposed by the insurance company that issued your variable contracts or other eligible investor through which an investment in the fund is made were included, your expenses would be higher. The example assumes that: you invest $10,000 in the fund for the time periods indicated and you redeem your shares at the end of the time periods; your investment has a 5% return each year; and the ����������������������������������������� Although your actual costs will likely be higher or lower, under these assumptions your costs would be: 1 YEAR 3 YEARS 5 YEARS 10 YEARS
Service Class Shares $121 $382 $663 $1,464
Portfolio Turnover The fund pays transaction costs, such as commissions, when it buys an������������������������������ ���������������������������������������turnover rate may indicate higher transaction costs. These transaction costs, which are not reflected in �Annual Fund Operating Expenses� or in the �Example,� ����������������performa����������������������������������������!����������portfolio turnover rate was 60% of the average value of its portfolio.
Principal Investment Strategies MFS (Massachusetts Financial Services Company, the fund's investment adviser) normally invests the f������������������������equity securities. Equity securities include common stocks and other securities that represent an ownership interest (or right to acquire an ownership interest) in a company or other issuer. <=>�������������� �������������������ets in the stocks of companies it believes to have above average earnings growth potential compared to other companies (growth companies). Z�����<=>������� ������������������������������������������[�!�MFS primarily invests in companies with small capitalizations. <=>������� ������������������������������������������ MFS uses a bottom-up investment approach to buying and selling investments for the fund. Investments are selected primarily based on fundamental analysis of individual issuers. Quantitative models that systematically evaluate issuers may also be considered.
Principal Risks As with any mutual fund, the fund may not achieve its objective and/or you could lose money on your investment in the fund. An investment in the fund is not a bank deposit and is not insured or guaranteed by the Federal Deposit Insurance Corporation or any other governmental agency. The principal risks of investing in the fund are: Stock Market/Company Risk: Stock markets are volatile and can decline significantly in response to issuer, market, economic, industry, political, regulatory, geopolitical, and other conditions, as well as to investor perceptions of these conditions. The price of an equity security can decrease significantly in response to these conditions, and these conditions can affect a single issuer or type of security, issuers within a broad market sector, industry or geographic region, or the market in general.
Growth Company Risk: The stocks of growth companies can be ������������ ����������������������ings and more volatile than the market in general. Small Cap Risk: The stocks of small cap companies can be more volatile than stocks of larger companies. Foreign Risk: Exposure to foreign markets through issuers or currencies can involve additional risks relating to market, economic, industry, political, regulatory, geopolitical, and other conditions. These factors can make foreign investments, especially those in emerging markets, more volatile and less liquid than U.S. investments. In addition, foreign markets can react differently to these conditions than the U.S. market. Liquidity Risk: It may be difficult to value, and it may not be possible to sell, certain investments, types of investments, and/or investments in certain segments of the market, and the fund may have to sell certain of these investments at a price or time that is not advantageous in order to meet redemptions or other cash needs. Investment Selection Risk: MFS' investment analysis and its selection of investments may not produce the intended results and/or can lead to an investment focus that results in the fund underperforming other funds with similar investment strategies and/or underperforming the markets in which the fund invests.
Performance Information The bar chart and performance table below are intended to provide some indication of the risks of investing in the fund by showing ��������������������������������� �������������^��������`��performance over time compares with that of a broad measure of market performance. The ����������������������������������������������������^�����fund will perform in the future. Updated performance is available at mfs.com or by calling 1-877-411-3325. If the fees and expenses imposed by the insurance company that issued your variable contracts or other eligible investor through which an investment in the fund is made were included, they would reduce the returns shown. Service Class Bar Chart.
(2.15)(7.49)
41.22
20.90
(10.49)
35.94
62.92
(39.52)
2.2512.93
-60-50-40-30-20-10
01020304050607080
2006 2007 2008 2009 2010 2011 2012 2013 2014 2015CALENDAR YEAR
GAI
N o
r LO
SS(%
)
The total return for the three-month period ended March 31, 2016, was (5.05)%. During the period(s) shown in the bar chart, the highest quarterly return was 31.20% (for the calendar quarter ended June 30, 2009) and the lowest quarterly return was (27.58)% (for the calendar quarter ended December 31, 2008).
282
S-282

MFS New Discovery Series
Page 3 of 3
Performance Table. Average Annual Total Returns (For the Periods Ended December 31, 2015)
Share Class 1 YEAR 5 YEARS 10 YEARS Service Class Shares (2.15)% 6.70% 7.90%
Index Comparison (Reflects no deduction for fees, expenses, or taxes)
Russell 2000 Growth Index (1.38)% 10.67% 7.95%
Investment Adviser MFS serves as the investment adviser for the fund.
Portfolio Manager(s)
Portfolio Manager Since Title
Paul J. Gordon 2014 Investment Officer of MFS
Michael Grossman 2013 Investment Officer of MFS
Purchase and Sale of Fund Shares You should consult with the insurance company that issued your variable contract, or other eligible investor through which your investment in the fund is made, for minimum investment requirements and redemption procedures.
Taxes You should consult with the insurance company that issued your variable contract, or other eligible investor through which your investment in the fund is made, to understand the tax treatment of your investment.
Payments to Financial Intermediaries The fund, MFS, and/or its affiliates may make payments to insurance companies, other financial intermediaries, and all of their affiliates, for distribution and/or other services. These payments may create a conflict of interest for the insurance company or other financial intermediary to include the fund as an investment option in its product or to recommend the fund over another investment option. Ask your financial intermediary or insurance company, or visit your financial intermediary's or insurance company's Web site, for more information.
283
S-283

SUMMARY PROSPECTUS April 29, 2016
MFS® New Discovery Value Portfolio Service Class
VDV-SSUM-042916 Page 1 of 3
Before you invest, you may want to review the fund’s prospectus, which contains more information about the fund and its risks. You can find the fund’s prospectus and other information about the fund, including the fund’s statement of additional information, online at insurancefunds.mfs.com. You can also get this information at no cost by calling 1-800-225-2606 or by sending an e-mail request to [email protected]. The fund’s prospectus and statement of additional information, both dated April 29, 2016, as may be supplemented from time to time, are incorporated by reference into this Summary Prospectus.
CLASS TICKER SYMBOL
Service Class N/A
Summary of Key Information
Investment Objective ����������� ���ment objective is to seek capital appreciation.
Fees and Expenses This table describes the fees and expenses that you may pay when you hold shares of the fund. If the fees and expenses imposed by the insurance company that issued your variable contracts or other eligible investor through which the fund is offered were included, your expenses would be higher.
Annual Fund Operating Expenses (expenses that you pay each year as a percentage of the value of your investment): Management Fee 0.90%
Distribution and/or Service (12b-1) Fees 0.25% Other Expenses 0.20%
Total Annual Fund Operating Expenses 1.35%
Fee Reductions and/or Expense Reimbursements1 (0.22)% Total Annual Fund Operating Expenses After Fee Reductions and/or Expense Reimbursements 1.13%
1 Massachusetts Financial Services Company has agreed in writing to bear the fund’s expenses, excluding interest, taxes, extraordinary
expenses, brokerage and transaction costs, and investment-related expenses (such as interest and borrowing expenses incurred in connection with the fund's investment activity), such that "Total Annual Fund Operating Expenses" do not exceed 1.13% of the fund’s average daily net assets annually for Service Class shares. This written agreement will continue until modified by the fund's Board of Trustees, but such agreement will continue until at least April 30, 2017.
284
S-284

MFS New Discovery Value Portfolio
Page 2 of 3
Example This example is intended to help you compare the cost of investing in the fund with the cost of investing in other mutual funds. If the fees and expenses imposed by the insurance company that issued your variable contracts or other eligible investor through which an investment in the fund is made were included, your expenses would be higher. The example assumes that: you invest $10,000 in the fund for the time periods indicated and you redeem your shares at the end of the time periods; your investment has a 5% return each year; and the ����������������������������������������� Although your actual costs will likely be higher or lower, under these assumptions your costs would be: 1 YEAR 3 YEARS 5 YEARS 10 YEARS
Service Class Shares $115 $406 $718 $1,605
Portfolio Turnover The fund pays transaction costs, such as commissions, when it buys and ����������������������������� ���������������������������������������turnover rate may indicate higher transaction costs. These transaction costs, which are not reflected in �Annual Fund Operating Expenses� or in the �Example,� ����������������performan���������������������������������������!����������portfolio turnover rate was 53% of the average value of its portfolio.
Principal Investment Strategies MFS (Massachusetts Financial Services Company, the fund's investment adviser) normally invests the fu�����������������������equity securities. Equity securities include common stocks, real estate investment trusts (REITs), and other securities that represent an ownership interest (or right to acquire an ownership interest) in a company or other issuer. MFS focuses on investing the fund's assets in the stocks of companies it believes are undervalued compared to their perceived worth (value companies). Z�����<=>������� ������������������������������������������[�!�MFS primarily invests in companies with small capitalizations. <=>������� ������������������������������������������ MFS uses a bottom-up investment approach to buying and selling investments for the fund. Investments are selected primarily based on fundamental analysis of individual issuers. Quantitative models that systematically evaluate issuers may also be considered.
Principal Risks As with any mutual fund, the fund may not achieve its objective and/or you could lose money on your investment in the fund. An investment in the fund is not a bank deposit and is not insured or guaranteed by the Federal Deposit Insurance Corporation or any other governmental agency. The principal risks of investing in the fund are: Stock Market/Company Risk: Stock markets are volatile and can decline significantly in response to issuer, market, economic, industry, political, regulatory, geopolitical, and other conditions, as well as to investor perceptions of these conditions. The price of an equity security can decrease significantly in response to these conditions, and these conditions can affect a single issuer or type of security, issuers within a broad market sector, industry or geographic region, or the market in general.
Value Company Risk: The stocks of value companies can continue to be undervalued for long periods of time and not realize their expected value and can be more volatile than the market in general. Small Cap Risk: The stocks of small cap companies can be more volatile than stocks of larger companies. Foreign Risk: Exposure to foreign markets through issuers or currencies can involve additional risks relating to market, economic, industry, political, regulatory, geopolitical, and other conditions. These factors can make foreign investments, especially those in emerging markets, more volatile and less liquid than U.S. investments. In addition, foreign markets can react differently to these conditions than the U.S. market. Real Estate Investment Trust Risk: The risks of investing in REITs include certain risks associated with the direct ownership of real estate and the real estate industry in general. These include risks related to general, regional and local economic conditions; difficulties in valuing and disposing of real estate; fluctuations in interest rates and property tax rates; shifts in zoning laws, environmental regulations and other governmental action; cash flow dependency; increased operating expenses; lack of availability of mortgage funds; losses due to natural disasters; overbuilding; losses due to casualty or condemnation; changes in property values and rental rates; and other factors. The securities of smaller real estate-related issuers can be more volatile and less liquid than securities of larger issuers and their issuers can have more limited financial resources. Liquidity Risk: It may be difficult to value, and it may not be possible to sell, certain investments, types of investments, and/or investments in certain segments of the market, and the fund may have to sell certain of these investments at a price or time that is not advantageous in order to meet redemptions or other cash needs. Investment Selection Risk: MFS' investment analysis and its selection of investments may not produce the intended results and/or can lead to an investment focus that results in the fund underperforming other funds with similar investment strategies and/or underperforming the markets in which the fund invests.
Performance Information The bar chart and performance table below are intended to provide some indication of the risks of investing in the fund by showing ��������������������������������� �������������^��������`��performance over time compares with that of a broad measure of market performance. Performance prior to December 8, 2012, reflects time periods when another adviser or sub-adviser was responsible for selecting investments for the fund under a different investment objective and ����������� ��������������������������������������������������not necessarily indicate how the fund will perform in the future. Updated performance is available at mfs.com or by calling 1-877-411-3325. If the fees and expenses imposed by the insurance company that issued your variable contracts or other eligible investor through which an investment in the fund is made were included, they would reduce the returns shown.
285
S-285

MFS New Discovery Value Portfolio
Page 3 of 3
Service Class Bar Chart.
(2.90)
3.19
39.68
9.60
(6.50)
21.3330.07
-30-20-10
0102030405060
2009 2010 2011 2012 2013 2014 2015CALENDAR YEAR
GAI
N o
r LO
SS(%
)
The total return for the three-month period ended March 31, 2016, was 4.16%. During the period(s) shown in the bar chart, the highest quarterly return was 22.29% (for the calendar quarter ended June 30, 2009) and the lowest quarterly return was (21.52)% (for the calendar quarter ended September 30, 2011).
Performance Table. Average Annual Total Returns (For the Periods Ended December 31, 2015)
Share Class 1 YEAR 5 YEARS LIFE
(INCEPTION 10-1-2008)
Service Class Shares (2.90)% 7.48% 8.49%
Index Comparison (Reflects no deduction for fees, expenses, or taxes)
Russell 2000 Value Index (7.47)% 7.67% 6.98%
Investment Adviser MFS serves as the investment adviser for the fund.
Portfolio Manager(s)
Portfolio Manager Since Title
Kevin J. Schmitz 2012 Investment Officer of MFS
Purchase and Sale of Fund Shares You should consult with the insurance company that issued your variable contract, or other eligible investor through which your investment in the fund is made, for minimum investment requirements and redemption procedures.
Taxes You should consult with the insurance company that issued your variable contract, or other eligible investor through which your investment in the fund is made, to understand the tax treatment of your investment.
Payments to Financial Intermediaries The fund, MFS, and/or its affiliates may make payments to insurance companies, other financial intermediaries, and all of their affiliates, for distribution and/or other services. These payments may create a conflict of interest for the insurance company or other
financial intermediary to include the fund as an investment option in its product or to recommend the fund over another investment option. Ask your financial intermediary or insurance company, or visit your financial intermediary's or insurance company's Web site, for more information.
286
S-286

SUMMARY PROSPECTUS April 29, 2016
MFS® Research International Portfolio Service Class
RSS-SSUM-042916 Page 1 of 3
Before you invest, you may want to review the fund’s prospectus, which contains more information about the fund and its risks. You can find the fund’s prospectus and other information about the fund, including the fund’s statement of additional information, online at insurancefunds.mfs.com. You can also get this information at no cost by calling 1-800-225-2606 or by sending an e-mail request to [email protected]. The fund’s prospectus and statement of additional information, both dated April 29, 2016, as may be supplemented from time to time, are incorporated by reference into this Summary Prospectus.
CLASS TICKER SYMBOL
Service Class N/A
Summary of Key Information
Investment Objective ����������� ����ent objective is to seek capital appreciation.
Fees and Expenses This table describes the fees and expenses that you may pay when you hold shares of the fund. If the fees and expenses imposed by the insurance company that issued your variable contracts or other eligible investor through which the fund is offered were included, your expenses would be higher.
Annual Fund Operating Expenses (expenses that you pay each year as a percentage of the value of your investment): Management Fee 0.90%
Distribution and/or Service (12b-1) Fees 0.25% Other Expenses 0.10%
Total Annual Fund Operating Expenses 1.25%
287
S-287
MFS Research International Portfolio
Page 2 of 3
Example This example is intended to help you compare the cost of investing in the fund with the cost of investing in other mutual funds. If the fees and expenses imposed by the insurance company that issued your variable contracts or other eligible investor through which an investment in the fund is made were included, your expenses would be higher. The example assumes that: you invest $10,000 in the fund for the time periods indicated and you redeem your shares at the end of the time periods; your investment has a 5% return each year; and the ����������������������������������������� Although your actual costs will likely be higher or lower, under these assumptions your costs would be: 1 YEAR 3 YEARS 5 YEARS 10 YEARS
Service Class Shares $127 $397 $686 $1,511
Portfolio Turnover The fund pays transaction costs, such as commissions, when it buys �������������������������������� ���������������������������������������turnover rate may indicate higher transaction costs. These transaction costs, which are not reflected in �Annual Fund Operating Expenses� or in the �Example,� ����������������perfo�������������������������������������������!����������portfolio turnover rate was 38% of the average value of its portfolio.
Principal Investment Strategies MFS (Massachusetts Financial Services Company, the fund's investment adviser) normally invests th���������������������������foreign equity securities, including emerging market equity securities. Equity securities include common stocks and other securities that represent an ownership interest (or right to acquire an ownership interest) in a company or other issuer. In selecting investments for the fund, MFS is not constrained to any ������������� ���������������<=>������� ���������������������������stocks of companies it believes to have above average earnings growth potential compared to other companies (growth companies), in the stocks of companies it believes are undervalued compared to their perceived worth (value companies), or in a combination of growth and value companies. <=>������� ������������������������������������������[�� MFS may �� ��������������������������������������������������������a single country, a small number of countries, or a particular geographic region. A team of investment research analysts selects investments for the �����<=>�����������������������������������sts by broad market sectors. MFS uses a bottom-up investment approach to buying and selling investments for the fund. Investments are selected primarily based on fundamental analysis of individual issuers. Quantitative models that systematically evaluate issuers may also be considered.
Principal Risks As with any mutual fund, the fund may not achieve its objective and/or you could lose money on your investment in the fund. An investment in the fund is not a bank deposit and is not insured or guaranteed by the Federal Deposit Insurance Corporation or any other governmental agency. The principal risks of investing in the fund are:
Stock Market/Company Risk: Stock markets are volatile and can decline significantly in response to issuer, market, economic, industry, political, regulatory, geopolitical, and other conditions, as well as to investor perceptions of these conditions. The price of an equity security can decrease significantly in response to these conditions, and these conditions can affect a single issuer or type of security, issuers within a broad market sector, industry or geographic region, or the market in general. Foreign Risk: Exposure to foreign markets through issuers or currencies can involve additional risks relating to market, economic, industry, political, regulatory, geopolitical, and other conditions. These factors can make foreign investments, especially those in emerging markets, more volatile and less liquid than U.S. investments. In addition, foreign markets can react differently to these conditions than the U.S. market. Emerging Markets Risk: Investments in emerging markets can involve additional and greater risks than the risks associated with investments in developed foreign markets. Emerging markets can have less developed markets, greater custody and operational risk, less developed legal, regulatory, and accounting systems, and greater political, social, and economic instability than developed markets. Currency Risk: The value of foreign currencies relative to the U.S. dollar fluctuates in response to market, economic, industry, political, regulatory, geopolitical, and other conditions, and a decline in the value of a foreign currency versus the U.S. dollar reduces the value in U.S. dollars of investments denominated in that foreign currency. Geographic Focus Risk: ���������������������^����]����������tied to the market, currency, economic, political, regulatory, geopolitical, and other conditions in the countries or regions in which the fund's assets are invested. Liquidity Risk: It may be difficult to value, and it may not be possible to sell, certain investments, types of investments, and/or investments in certain segments of the market, and the fund may have to sell certain of these investments at a price or time that is not advantageous in order to meet redemptions or other cash needs. Investment Selection Risk: MFS' investment analysis and its selection of investments may not produce the intended results and/or can lead to an investment focus that results in the fund underperforming other funds with similar investment strategies and/or underperforming the markets in which the fund invests.
Performance Information The bar chart and performance table below are intended to provide some indication of the risks of investing in the fund by showing ��������������������������������� �������������^��������`��performance over time compares with that of a broad measure of market performance and one or more other measures of performance for markets in which the fund may invest. ��������������������������������������������������������^�����fund will perform in the future. Updated performance is available at mfs.com or by calling 1-877-411-3325. If the fees and expenses imposed by the insurance company that issued your variable contracts or other eligible investor through which an investment in the fund is made were included, they would reduce the returns shown.
288
S-288

MFS Research International Portfolio
Page 3 of 3
Service Class Bar Chart.
(2.20)(7.16)
18.7716.29
(11.06)
10.34
30.50
(42.60)
12.8127.25
-60-50-40-30-20-10
01020304050
2006 2007 2008 2009 2010 2011 2012 2013 2014 2015CALENDAR YEAR
GAI
N o
r LO
SS(%
)
The total return for the three-month period ended March 31, 2016, was (3.51)%. During the period(s) shown in the bar chart, the highest quarterly return was 23.60% (for the calendar quarter ended June 30, 2009) and the lowest quarterly return was (20.74)% (for the calendar quarter ended December 31, 2008).
Performance Table. Average Annual Total Returns (For the Periods Ended December 31, 2015)
Share Class 1 YEAR 5 YEARS 10 YEARS Service Class Shares (2.20)% 2.21% 2.84%
Index Comparisons (Reflects no deduction for fees, expenses, or taxes)
MSCI EAFE (Europe, Australasia, Far East) Index (0.39)% 4.07% 3.50%
MSCI All Country World (ex-US) Index (5.25)% 1.51% 3.38%
Investment Adviser MFS serves as the investment adviser for the fund.
Portfolio Manager(s)
Portfolio Manager Since Title
Jose Luis Garcia 2005 Investment Officer of MFS
Victoria Higley April 2016 Investment Officer of MFS
Thomas Melendez 2005 Investment Officer of MFS
Purchase and Sale of Fund Shares You should consult with the insurance company that issued your variable contract, or other eligible investor through which your investment in the fund is made, for minimum investment requirements and redemption procedures.
Taxes You should consult with the insurance company that issued your variable contract, or other eligible investor through which your investment in the fund is made, to understand the tax treatment of your investment.
Payments to Financial Intermediaries The fund, MFS, and/or its affiliates may make payments to insurance companies, other financial intermediaries, and all of their
affiliates, for distribution and/or other services. These payments may create a conflict of interest for the insurance company or other financial intermediary to include the fund as an investment option in its product or to recommend the fund over another investment option. Ask your financial intermediary or insurance company, or visit your financial intermediary's or insurance company's Web site, for more information.
289
S-289

SUMMARY PROSPECTUS April 29, 2016
MFS® Total Return Series Service Class
VTR-SSUM-042916 Page 1 of 3
Before you invest, you may want to review the fund’s prospectus, which contains more information about the fund and its risks. You can find the fund’s prospectus and other information about the fund, including the fund’s statement of additional information, online at insurancefunds.mfs.com. You can also get this information at no cost by calling 1-800-225-2606 or by sending an e-mail request to [email protected]. The fund’s prospectus and statement of additional information, both dated April 29, 2016, as may be supplemented from time to time, are incorporated by reference into this Summary Prospectus. CLASS TICKER
SYMBOL Service Class N/A
Summary of Key Information
Investment Objective ����������� ���ment objective is to seek total return.
Fees and Expenses This table describes the fees and expenses that you may pay when you hold shares of the fund. Expenses have been adjusted to reflect the current management fee set forth in the fund's Investment Advisory Agreement. If the fees and expenses imposed by the insurance company that issued your variable contracts or other eligible investor through which the fund is offered were included, your expenses would be higher.
Annual Fund Operating Expenses (expenses that you pay each year as a percentage of the value of your investment): Management Fee 0.66%
Distribution and/or Service (12b-1) Fees 0.25%
Other Expenses 0.04% Total Annual Fund Operating Expenses 0.95%
Fee Reductions and/or Expense Reimbursements1 (0.05)%
Total Annual Fund Operating Expenses After Fee Reductions and/or Expense Reimbursements 0.90% 1 MFS has agreed in writing to bear the fund’s expenses, excluding interest, taxes, extraordinary expenses, brokerage and transaction
costs, and investment-related expenses (such as interest and borrowing expenses incurred in connection with the fund's investment activity), such that “Total Annual Fund Operating Expenses” do not exceed 0.90% of the fund’s average daily net assets annually for Service Class shares. This written agreement will continue until modified by the fund’s Board of Trustees, but such agreement will continue until at least April 30, 2017.
290
S-290

MFS Total Return Series
Page 2 of 3
Example This example is intended to help you compare the cost of investing in the fund with the cost of investing in other mutual funds. If the fees and expenses imposed by the insurance company that issued your variable contracts or other eligible investor through which an investment in the fund is made were included, your expenses would be higher. The example assumes that: you invest $10,000 in the fund for the time periods indicated and you redeem your shares at the end of the time periods; your investment has a 5% return each year; and the �������������� expenses remain the same. Although your actual costs will likely be higher or lower, under these assumptions your costs would be: 1 YEAR 3 YEARS 5 YEARS 10 YEARS
Service Class Shares $92 $298 $521 $1,162
Portfolio Turnover The fund pays transaction costs, such as commissions, when it buys �������������������������������� ���������������������������������������turnover rate may indicate higher transaction costs. These transaction costs, which are not reflected in �Annual Fund Operating Expenses� or in the �Example,� ����������������������������������������������������������������!����������portfolio turnover rate was 41% of the average value of its portfolio.
Principal Investment Strategies MFS (Massachusetts Financial Services Company, the fund's �� ��������� �������� �������������������������{�������������������debt instruments. Equity securities include common stocks and other securities that represent an ownership interest (or right to acquire an ownership interest) in a company or other issuer. Debt instruments include corporate bonds, U.S. Government securities, asset-backed securities, foreign government securities, and other obligations to repay money borrowed. MFS seeks to invest between 40% and 75% of the ����������������{����������������������������~�*���������������������������-income senior securities. Of the fund's investments in equity securities, MFS focuses on investing the fund's assets in the stocks of companies it believes are undervalued compared to their perceived worth (value companies). Z�����<=>������� ���������{�����������������������������������companies of any size, MFS primarily invests in companies with large capitalizations. �������������� �������������]�������������!�<=>����erally invests substantially all of these investments in investment grade quality debt instruments. <=>������� ������������������������������������������ MFS uses a bottom-up investment approach to buying and selling investments for the fund. Investments are selected primarily based on fundamental analysis of individual issuers and instruments. Quantitative models that systematically evaluate issuers and instruments are used by certain of the fund's equity securities portfolio managers and may also be considered by other portfolio managers.
Principal Risks As with any mutual fund, the fund may not achieve its objective and/or you could lose money on your investment in the fund. An investment in the fund is not a bank deposit and is not insured or
guaranteed by the Federal Deposit Insurance Corporation or any other governmental agency. The principal risks of investing in the fund are: Stock Market/Company Risk: Stock markets are volatile and can decline significantly in response to issuer, market, economic, industry, political, regulatory, geopolitical, and other conditions, as well as to investor perceptions of these conditions. The price of an equity security can decrease significantly in response to these conditions, and these conditions can affect a single issuer or type of security, issuers within a broad market sector, industry or geographic region, or the market in general. Value Company Risk: The stocks of value companies can continue to be undervalued for long periods of time and not realize their expected value and can be more volatile than the market in general. Debt Market Risk: Debt markets can be volatile and can decline significantly in response to changes in, or investor perceptions of changes in, market, economic, industry, political, regulatory, geopolitical, and other conditions that affect a particular type of instrument, issuer, or borrower, and/or that affect the debt market generally. Interest Rate Risk: In general, the price of a debt instrument falls when interest rates rise and rises when interest rates fall. Interest rate risk is generally greater for instruments with longer maturities, or that do not pay current interest. Credit Risk: The price of a debt instrument depends, in part, on the credit quality of the issuer, borrower, counterparty, or other entity responsible for payment, or underlying collateral or assets and the terms of the instrument. The price of a debt instrument can decline in response to changes in the financial condition of the issuer, borrower, counterparty, or other entity, or underlying collateral or assets, or changes in specific or general market, economic, industry, political, regulatory, geopolitical, and other conditions. Foreign Risk: Exposure to foreign markets through issuers or currencies can involve additional risks relating to market, economic, industry, political, regulatory, geopolitical, and other conditions. These factors can make foreign investments, especially those in emerging markets, more volatile and less liquid than U.S. investments. In addition, foreign markets can react differently to these conditions than the U.S. market. Prepayment/Extension Risk: Instruments subject to prepayment and/or extension can reduce the potential for gain for the ����������������������������������������prepaid and increase the potential for loss if the maturity of the instrument is extended. Liquidity Risk: It may be difficult to value, and it may not be possible to sell, certain investments, types of investments, and/or investments in certain segments of the market, and the fund may have to sell certain of these investments at a price or time that is not advantageous in order to meet redemptions or other cash needs. Investment Selection Risk: MFS' investment analysis and its selection of investments may not produce the intended results and/or can lead to an investment focus that results in the fund underperforming other funds with similar investment strategies and/or underperforming the markets in which the fund invests.
Performance Information The bar chart and performance table below are intended to provide some indication of the risks of investing in the fund by showing ��������������������������������� �������������^��������`��performance over time compares with that of a broad measure of market performance and one or more other measures of performance for markets in which the fund may invest.
291
S-291

MFS Total Return Series
Page 3 of 3
��������������������������������������������������������^�����fund will perform in the future. Updated performance is available at mfs.com or by calling 1-877-411-3325. If the fees and expenses imposed by the insurance company that issued your variable contracts or other eligible investor through which an investment in the fund is made were included, they would reduce the returns shown. Service Class Bar Chart.
(0.58)
8.24
18.74
10.93
1.58
9.63
17.72
(22.32)
3.9411.62
-30-25-20-15-10-505
1015202530
2006 2007 2008 2009 2010 2011 2012 2013 2014 2015CALENDAR YEAR
GAI
N o
r LO
SS(%
)
The total return for the three-month period ended March 31, 2016, was 2.43%. During the period(s) shown in the bar chart, the highest quarterly return was 11.45% (for the calendar quarter ended June 30, 2009) and the lowest quarterly return was (12.01)% (for the calendar quarter ended December 31, 2008).
Performance Table. Average Annual Total Returns (For the Periods Ended December 31, 2015)
Share Class 1 YEAR 5 YEARS 10 YEARS Service Class Shares (0.58)% 7.56% 5.29%
Index Comparisons (Reflects no deduction for fees, expenses, or taxes)
Standard & Poor's 500 Stock Index 1.38% 12.57% 7.31% Barclays U.S. Aggregate Bond Index 0.55% 3.25% 4.51%
MFS Total Return Blended Index 1.28% 8.95% 6.48% As of December 31, 2015, the MFS Total Return Blended Index (the "Blended Index") consisted of the following indices and weightings: 60% Standard & Poor's 500 Stock Index and 40% Barclays U.S. Aggregate Bond Index. The components and weightings of the Blended Index may have differed during the period, and may differ in the future.
Investment Adviser MFS serves as the investment adviser for the fund.
Portfolio Manager(s)
Portfolio Manager Since Title
Brooks A. Taylor 2004 Investment Officer of MFS
Nevin P. Chitkara 2006 Investment Officer of MFS
William P. Douglas 2004 Investment Officer of MFS Steven R. Gorham 2002 Investment Officer of MFS
Richard O. Hawkins 2005 Investment Officer of MFS Joshua P. Marston 2008 Investment Officer of MFS Jonathan W. Sage 2013 Investment Officer of MFS
Purchase and Sale of Fund Shares You should consult with the insurance company that issued your variable contract, or other eligible investor through which your investment in the fund is made, for minimum investment requirements and redemption procedures.
Taxes You should consult with the insurance company that issued your variable contract, or other eligible investor through which your investment in the fund is made, to understand the tax treatment of your investment.
Payments to Financial Intermediaries The fund, MFS, and/or its affiliates may make payments to insurance companies, other financial intermediaries, and all of their affiliates, for distribution and/or other services. These payments may create a conflict of interest for the insurance company or other financial intermediary to include the fund as an investment option in its product or to recommend the fund over another investment option. Ask your financial intermediary or insurance company, or visit your financial intermediary's or insurance company's Web site, for more information.
292
S-292

SUMMARY PROSPECTUS April 29, 2016
MFS® Utilities Series Service Class
VUF-SSUM-042916 Page 1 of 4
Before you invest, you may want to review the fund’s prospectus, which contains more information about the fund and its risks. You can find the fund’s prospectus and other information about the fund, including the fund’s statement of additional information, online at insurancefunds.mfs.com. You can also get this information at no cost by calling 1-800-225-2606 or by sending an e-mail request to [email protected]. The fund’s prospectus and statement of additional information, both dated April 29, 2016, as may be supplemented from time to time, are incorporated by reference into this Summary Prospectus. CLASS TICKER
SYMBOL Service Class N/A
Summary of Key Information
Investment Objective ����������� ���ment objective is to seek total return.
Fees and Expenses This table describes the fees and expenses that you may pay when you hold shares of the fund. If the fees and expenses imposed by the insurance company that issued your variable contracts or other eligible investor through which the fund is offered were included, your expenses would be higher.
Annual Fund Operating Expenses (expenses that you pay each year as a percentage of the value of your investment): Management Fee 0.73%
Distribution and/or Service (12b-1) Fees 0.25% Other Expenses 0.06%
Total Annual Fund Operating Expenses 1.04%
293
S-293

MFS Utilities Series
Page 2 of 4
Example This example is intended to help you compare the cost of investing in the fund with the cost of investing in other mutual funds. If the fees and expenses imposed by the insurance company that issued your variable contracts or other eligible investor through which an investment in the fund is made were included, your expenses would be higher. The example assumes that: you invest $10,000 in the fund for the time periods indicated and you redeem your shares at the end of the time periods; your investment has a 5% return each year; and the ����������������������������������������� Although your actual costs will likely be higher or lower, under these assumptions your costs would be: 1 YEAR 3 YEARS 5 YEARS 10 YEARS
Service Class Shares $106 $331 $574 $1,271
Portfolio Turnover The fund pays transaction costs, such as commissions, when it buys and se��������������������������� ���������������������������������������turnover rate may indicate higher transaction costs. These transaction costs, which are not reflected in �Annual Fund Operating Expenses� or in the �Example,� ����������������performance. ����������������������������������!����������portfolio turnover rate was 42% of the average value of its portfolio.
Principal Investment Strategies <=>��<�������������=���������>�� �����?������!����������investment adviser) normally invests at least "#*�����������������assets in securities of issuers in the utilities industry. Issuers in the utilities industry include issuers engaged in the manufacture, production, generation, transmission, sale or distribution of electric, gas or other types of energy, and issuers engaged in telecommunications, including wireless, telephone, and cable (but not engaged in public broadcasting). <=>������������� �������������������������{���������������!�]�������also invest in debt instruments, including below investment grade quality debt instruments. Equity securities include common stocks, convertible securities, and other securities that represent an ownership interest (or right to acquire an ownership interest) in a company or other issuer. Debt instruments include corporate bonds and other obligations to repay money borrowed. <=>������� ������������������������������������������[�� <=>��� ������������������������\�>�����������������������!�including emerging market securities. MFS may invest a large perc����������������������������������������a single country, a small number of countries, or a particular geographic region. While MFS may use derivatives for any investment purpose, to the extent MFS uses derivatives, MFS expects to use derivatives primarily to increase or decrease currency exposure. Derivatives include futures, forward contracts, options, and swaps. MFS uses a bottom-up investment approach to buying and selling investments for the fund. Investments are selected primarily based on fundamental analysis of individual issuers and instruments. Quantitative models that systematically evaluate issuers and instruments may also be considered.
Principal Risks As with any mutual fund, the fund may not achieve its objective and/or you could lose money on your investment in the fund. An investment in the fund is not a bank deposit and is not insured or guaranteed by the Federal Deposit Insurance Corporation or any other governmental agency. The principal risks of investing in the fund are: Stock Market/Company Risk: Stock markets are volatile and can decline significantly in response to issuer, market, economic, industry, political, regulatory, geopolitical, and other conditions, as well as to investor perceptions of these conditions. The price of an equity security can decrease significantly in response to these conditions, and these conditions can affect a single issuer or type of security, issuers within a broad market sector, industry or geographic region, or the market in general. Utilities Concentration Risk: ���������������������^����]��closely tied to the performance of utilities issuers and, as a result, can be more volatile than the performance of more broadly-diversified funds. The price of stocks in the utilities sector can be very volatile due to supply and/or demand for services or fuel, financing costs, conservation efforts, the negative impact of regulation, and other factors. Debt Market Risk: Debt markets can be volatile and can decline significantly in response to changes in, or investor perceptions of changes in, market, economic, industry, political, regulatory, geopolitical, and other conditions that affect a particular type of instrument, issuer, or borrower, and/or that affect the debt market generally. Interest Rate Risk: In general, the price of a debt instrument falls when interest rates rise and rises when interest rates fall. Interest rate risk is generally greater for instruments with longer maturities, or that do not pay current interest. Credit Risk: The price of a debt instrument depends, in part, on the credit quality of the issuer, borrower, counterparty, or other entity responsible for payment, or underlying collateral or assets and the terms of the instrument. The price of a debt instrument can decline in response to changes in the financial condition of the issuer, borrower, counterparty, or other entity, or underlying collateral or assets, or changes in specific or general market, economic, industry, political, regulatory, geopolitical, and other conditions. Below investment grade quality debt instruments (commonly �����������������������������������������|��}�]������������ �� ����substantially greater risk of default or can already be in default, and their values can decline significantly. Below investment grade quality debt instruments are regarded as having predominantly speculative characteristics. Below investment grade quality debt instruments tend to be more sensitive to adverse news about the issuer, or the market or economy in general, than higher quality debt instruments. Foreign Risk: Exposure to foreign markets through issuers or currencies can involve additional risks relating to market, economic, industry, political, regulatory, geopolitical, and other conditions. These factors can make foreign investments, especially those in emerging markets, more volatile and less liquid than U.S. investments. In addition, foreign markets can react differently to these conditions than the U.S. market. Emerging Markets Risk: Investments in emerging markets can involve additional and greater risks than the risks associated with investments in developed foreign markets. Emerging markets can have less developed markets, greater custody and operational risk, less developed legal, regulatory, and accounting systems, and greater political, social, and economic instability than developed markets.
294
S-294

MFS Utilities Series
Page 3 of 4
Currency Risk: The value of foreign currencies relative to the U.S. dollar fluctuates in response to market, economic, industry, political, regulatory, geopolitical, and other conditions, and a decline in the value of a foreign currency versus the U.S. dollar reduces the value in U.S. dollars of investments denominated in that foreign currency. Geographic Focus Risk: ���������������������^����]����������tied to the market, currency, economic, political, regulatory, geopolitical, and other conditions in the countries or regions in which the fund's assets are invested. Derivatives Risk: Derivatives can be highly volatile and involve risks in addition to the risks of the underlying indicator(s) on which the derivative is based. Gains or losses from derivatives can be ��]������������������������������� ��� ����������������������� ��� ���can involve leverage. Leveraging Risk: Leverage involves investment exposure in an amount exceeding the initial investment. Leverage can cause increased volatility by magnifying gains or losses. Counterparty and Third Party Risk: Transactions involving a counterparty or third party other than the issuer of the instrument are subject to the credit risk of the counterparty or third party, and to the ������������������������������]���������^�������������������������accordance with the terms of the transaction. Liquidity Risk: It may be difficult to value, and it may not be possible to sell, certain investments, types of investments, and/or investments in certain segments of the market, and the fund may have to sell certain of these investments at a price or time that is not advantageous in order to meet redemptions or other cash needs. Investment Selection Risk: MFS' investment analysis and its selection of investments may not produce the intended results and/or can lead to an investment focus that results in the fund underperforming other funds with similar investment strategies and/or underperforming the markets in which the fund invests.
Performance Information The bar chart and performance table below are intended to provide some indication of the risks of investing in the fund by showing ��������������������������������� ���������� how the fund's performance over time compares with that of a broad measure of market performance and one or more other measures of performance for markets in which the fund may invest. ��������������������������������������������������������^�����fund will perform in the future. Updated performance is available at mfs.com or by calling 1-877-411-3325. If the fees and expenses imposed by the insurance company that issued your variable contracts or other eligible investor through which an investment in the fund is made were included, they would reduce the returns shown.
Service Class Bar Chart.
(14.76)
12.4720.21
13.216.51
13.51
33.09
(37.91)
27.5630.96
-60-50-40-30-20-10
01020304050
2006 2007 2008 2009 2010 2011 2012 2013 2014 2015CALENDAR YEAR
GAI
N o
r LO
SS(%
)
The total return for the three-month period ended March 31, 2016, was 7.87%. During the period(s) shown in the bar chart, the highest quarterly return was 20.64% (for the calendar quarter ended June 30, 2009) and the lowest quarterly return was (24.07)% (for the calendar quarter ended September 30, 2008).
Performance Table. Average Annual Total Returns (For the Periods Ended December 31, 2015)
Share Class 1 YEAR 5 YEARS 10 YEARS Service Class Shares (14.76)% 6.80% 8.09%
Index Comparisons (Reflects no deduction for fees, expenses, or taxes)
Standard & Poor's 500 Stock Index 1.38% 12.57% 7.31%
Standard & Poor's 500 Utilities Index (4.85)% 11.03% 7.41%
Investment Adviser MFS serves as the investment adviser for the fund.
Portfolio Manager(s)
Portfolio Manager Since Title
Claud P. Davis 2014 Investment Officer of MFS
Maura A. Shaughnessy 1993 Investment Officer of MFS
Purchase and Sale of Fund Shares You should consult with the insurance company that issued your variable contract, or other eligible investor through which your investment in the fund is made, for minimum investment requirements and redemption procedures.
Taxes You should consult with the insurance company that issued your variable contract, or other eligible investor through which your investment in the fund is made, to understand the tax treatment of your investment.
Payments to Financial Intermediaries The fund, MFS, and/or its affiliates may make payments to insurance companies, other financial intermediaries, and all of their
295
S-295

MFS Utilities Series
Page 4 of 4
affiliates, for distribution and/or other services. These payments may create a conflict of interest for the insurance company or other financial intermediary to include the fund as an investment option in its product or to recommend the fund over another investment option. Ask your financial intermediary or insurance company, or visit your financial intermediary's or insurance company's Web site, for more information.
296
S-296
SUMMARY PROSPECTUS April 29, 2016
MFS® Value Series Service Class
VLU-SSUM-042916 Page 1 of 3
Before you invest, you may want to review the fund’s prospectus, which contains more information about the fund and its risks. You can find the fund’s prospectus and other information about the fund, including the fund’s statement of additional information, online at insurancefunds.mfs.com. You can also get this information at no cost by calling 1-800-225-2606 or by sending an e-mail request to [email protected]. The fund’s prospectus and statement of additional information, both dated April 29, 2016, as may be supplemented from time to time, are incorporated by reference into this Summary Prospectus. CLASS TICKER
SYMBOL Service Class N/A
Summary of Key Information
Investment Objective ����������� ���ment objective is to seek capital appreciation.
Fees and Expenses This table describes the fees and expenses that you may pay when you hold shares of the fund. If the fees and expenses imposed by the insurance company that issued your variable contracts or other eligible investor through which the fund is offered were included, your expenses would be higher.
Annual Fund Operating Expenses (expenses that you pay each year as a percentage of the value of your investment): Management Fee 0.69%
Distribution and/or Service (12b-1) Fees 0.25% Other Expenses 0.04%
Total Annual Fund Operating Expenses 0.98%
297
S-297
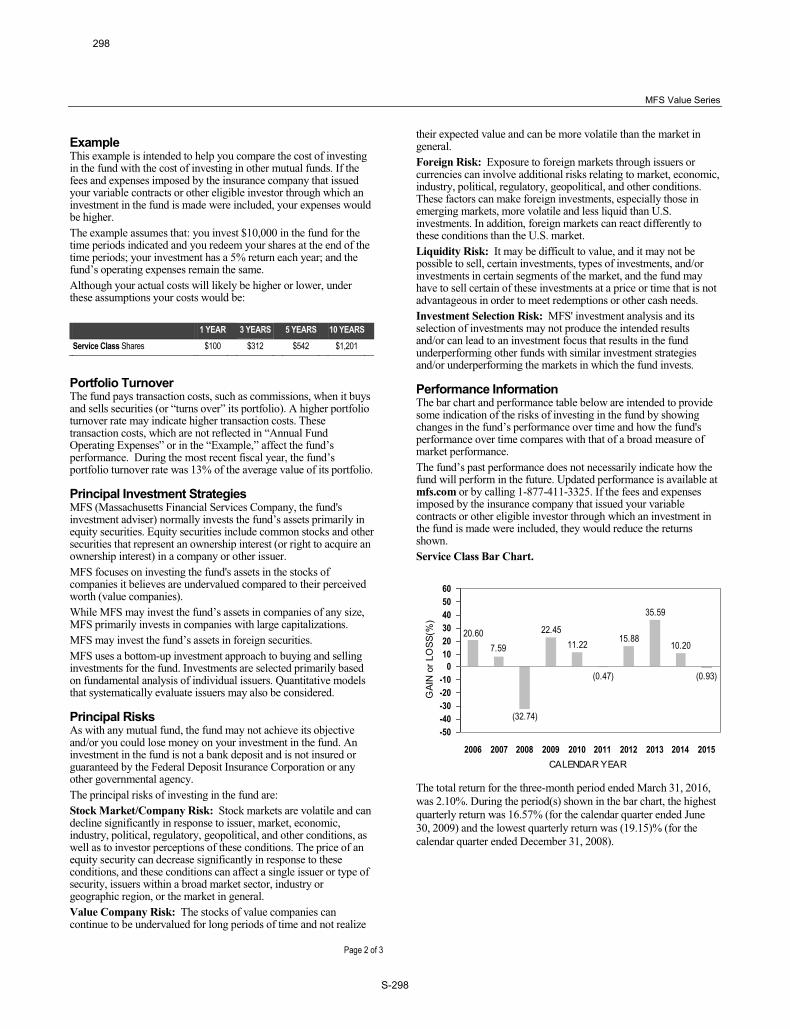
MFS Value Series
Page 2 of 3
Example This example is intended to help you compare the cost of investing in the fund with the cost of investing in other mutual funds. If the fees and expenses imposed by the insurance company that issued your variable contracts or other eligible investor through which an investment in the fund is made were included, your expenses would be higher. The example assumes that: you invest $10,000 in the fund for the time periods indicated and you redeem your shares at the end of the time periods; your investment has a 5% return each year; and the ����������������������������������������� Although your actual costs will likely be higher or lower, under these assumptions your costs would be: 1 YEAR 3 YEARS 5 YEARS 10 YEARS
Service Class Shares $100 $312 $542 $1,201
Portfolio Turnover The fund pays transaction costs, such as commissions, when it buys �������������������������������� ���������������������������������������turnover rate may indicate higher transaction costs. These transaction costs, which are not reflected in �Annual Fund Operating Expenses� or in the �Example,� ����������������perf��������������������������������������������!����������portfolio turnover rate was 13% of the average value of its portfolio.
Principal Investment Strategies MFS (Massachusetts Financial Services Company, the fund's investment adviser) normally invests t����������������������������equity securities. Equity securities include common stocks and other securities that represent an ownership interest (or right to acquire an ownership interest) in a company or other issuer. MFS focuses on investing the fund's assets in the stocks of companies it believes are undervalued compared to their perceived worth (value companies). Z�����<=>������� ������������������������������������������[�!�MFS primarily invests in companies with large capitalizations. MFS may inv������������������������������������������ MFS uses a bottom-up investment approach to buying and selling investments for the fund. Investments are selected primarily based on fundamental analysis of individual issuers. Quantitative models that systematically evaluate issuers may also be considered.
Principal Risks As with any mutual fund, the fund may not achieve its objective and/or you could lose money on your investment in the fund. An investment in the fund is not a bank deposit and is not insured or guaranteed by the Federal Deposit Insurance Corporation or any other governmental agency. The principal risks of investing in the fund are: Stock Market/Company Risk: Stock markets are volatile and can decline significantly in response to issuer, market, economic, industry, political, regulatory, geopolitical, and other conditions, as well as to investor perceptions of these conditions. The price of an equity security can decrease significantly in response to these conditions, and these conditions can affect a single issuer or type of security, issuers within a broad market sector, industry or geographic region, or the market in general. Value Company Risk: The stocks of value companies can continue to be undervalued for long periods of time and not realize
their expected value and can be more volatile than the market in general. Foreign Risk: Exposure to foreign markets through issuers or currencies can involve additional risks relating to market, economic, industry, political, regulatory, geopolitical, and other conditions. These factors can make foreign investments, especially those in emerging markets, more volatile and less liquid than U.S. investments. In addition, foreign markets can react differently to these conditions than the U.S. market. Liquidity Risk: It may be difficult to value, and it may not be possible to sell, certain investments, types of investments, and/or investments in certain segments of the market, and the fund may have to sell certain of these investments at a price or time that is not advantageous in order to meet redemptions or other cash needs. Investment Selection Risk: MFS' investment analysis and its selection of investments may not produce the intended results and/or can lead to an investment focus that results in the fund underperforming other funds with similar investment strategies and/or underperforming the markets in which the fund invests.
Performance Information The bar chart and performance table below are intended to provide some indication of the risks of investing in the fund by showing ��������������������������������� �������������^��������`��performance over time compares with that of a broad measure of market performance. ��������������������������������������������������������^�����fund will perform in the future. Updated performance is available at mfs.com or by calling 1-877-411-3325. If the fees and expenses imposed by the insurance company that issued your variable contracts or other eligible investor through which an investment in the fund is made were included, they would reduce the returns shown. Service Class Bar Chart.
(0.93)
10.20
35.59
15.88
(0.47)
11.2222.45
(32.74)
7.5920.60
-50-40-30-20-10
0102030405060
2006 2007 2008 2009 2010 2011 2012 2013 2014 2015CALENDAR YEAR
GAI
N o
r LO
SS(%
)
The total return for the three-month period ended March 31, 2016, was 2.10%. During the period(s) shown in the bar chart, the highest quarterly return was 16.57% (for the calendar quarter ended June 30, 2009) and the lowest quarterly return was (19.15)% (for the calendar quarter ended December 31, 2008).
298
S-298

MFS Value Series
Page 3 of 3
Performance Table. Average Annual Total Returns (For the Periods Ended December 31, 2015)
Share Class 1 YEAR 5 YEARS 10 YEARS Service Class Shares (0.93)% 11.29% 7.33%
Index Comparison (Reflects no deduction for fees, expenses, or taxes)
Russell 1000 Value Index (3.83)% 11.27% 6.16%
Investment Adviser MFS serves as the investment adviser for the fund.
Portfolio Manager(s)
Portfolio Manager Since Title
Nevin P. Chitkara 2006 Investment Officer of MFS
Steven R. Gorham 2002 Investment Officer of MFS
Purchase and Sale of Fund Shares You should consult with the insurance company that issued your variable contract, or other eligible investor through which your investment in the fund is made, for minimum investment requirements and redemption procedures.
Taxes You should consult with the insurance company that issued your variable contract, or other eligible investor through which your investment in the fund is made, to understand the tax treatment of your investment.
Payments to Financial Intermediaries The fund, MFS, and/or its affiliates may make payments to insurance companies, other financial intermediaries, and all of their affiliates, for distribution and/or other services. These payments may create a conflict of interest for the insurance company or other financial intermediary to include the fund as an investment option in its product or to recommend the fund over another investment option. Ask your financial intermediary or insurance company, or visit your financial intermediary's or insurance company's Web site, for more information.
299
S-299

May 1, 2016
GUARDIAN PORTFOLIO
SUMMARY PROSPECTUSClass I
The Fund is offered to certain life insurance companies to serve as an investment vehicle for premiums paid under their variable annuity and variable life insurance contracts(each, a “variable contract”) and to certain qualified pension and other retirement plans (each, a “qualified plan”). Before you invest, you may want to review the Fund’sprospectus, which contains more information about the Fund and its risks. You can find the Fund’s prospectus and other information about the Fund (including the Fund’sSAI) online at http://www.nb.com/amtportfolios. You can also get this information at no cost by calling 800-877-9700 or by sending an e-mail request to [email protected] can also get this information from your investment provider or any investment provider authorized to sell the Fund’s shares. The Fund’s prospectus and SAI, each datedMay 1, 2016 (as each may be amended or supplemented), are incorporated herein by reference.
GOALThe Fund seeks long-term growth of capital; current income is a secondary goal.
FEES AND EXPENSESThese tables describe the fees and expenses that you may pay if you buy, hold or sell shares of the Fund. These tables do not reflectany fees and expenses charged by your insurance company under your variable contract or by your qualified plan. If the tables didreflect such fees and expenses, the overall expenses would be higher than those shown. Please refer to the prospectus for yourvariable contract or your qualified plan documentation for information on their separate fees and expenses.
Shareholder Fees (fees paid directly from your investment) None
Annual Fund Operating Expenses (expenses that you pay each year as a % of the value of your investment)
Management fees 0.85
Distribution and/or shareholder service (12b-1) fees None
Other expenses 0.30
Total annual operating expenses 1.15
Expense ExampleThe expense example can help you compare costs among mutual funds. The example assumes that you invested $10,000 for theperiods shown, that you redeemed all of your shares at the end of those periods, that the Fund earned a hypothetical 5% totalreturn each year, and that the Fund’s expenses were those in the table. Actual performance and expenses may be higher or lower.
1 Year 3 Years 5 Years 10 Years
Expenses $117 $365 $633 $1,398
Portfolio TurnoverThe Fund pays transaction costs, such as commissions, when it buys and sells securities (or “turns over” its portfolio). A higherportfolio turnover rate may indicate higher transaction costs. These costs, which are not reflected in annual operating expenses orin the example, affect the Fund’s performance. During the most recent fiscal year, the Fund’s portfolio turnover rate was 51% ofthe average value of its portfolio.
PRINCIPAL INVESTMENT STRATEGIESTo pursue its goals, the Fund invests mainly in common stocks of companies across all market capitalizations.
The Portfolio Manager employs a research driven approach to stock selection, with a long term perspective that combines bothquantitative analysis and qualitative judgment. He looks for what he believes to be attractive businesses led by strong managementteams with a track record of success at compelling valuations. The Portfolio Manager generally intends to invest in companieswhich he believes are undervalued. His investment process involves applying a valuation framework that seeks to identifyinvestments that exhibit a demonstrated ability to produce profits that exceed the cost of capital. This measurement is known asEconomic Value Added. Additionally, he may employ other traditional valuation methods including: price to earnings, enterprisevalue to EBITDA, discounted cash flows or sum-of-the-parts analyses.
300
S-300

Although the Fund invests primarily in domestic stocks, it may also invest in stocks of foreign companies.
The Fund seeks to reduce risk by investing across many companies, sectors and industries. However, at times, the PortfolioManager may emphasize certain sectors or industries that he believes may benefit from current market or economic trends.
The Portfolio Manager follows a disciplined selling strategy that utilizes a process analyzing macro-economic and/or security-specific circumstances, and may sell a stock when it reaches a target price, if a company’s business fails to perform as expected, orwhen other opportunities appear more attractive.
The Fund may change its goals without shareholder approval, although it does not currently intend to do so.
PRINCIPAL INVESTMENT RISKSMost of the Fund’s performance depends on what happens in the stock market. The market’s behavior can be difficult to predict,particularly in the short term. There can be no guarantee that the Fund will achieve its goals. The Fund may take temporarydefensive and cash management positions; in such a case, it will not be pursuing its principal investment strategies.
The Fund is a mutual fund, not a bank deposit, and is not guaranteed or insured by the Federal Deposit Insurance Corporation orany other government agency. The value of your investment may fall, sometimes sharply, and you could lose money by investingin the Fund.
The following risks, which are described in alphabetical order and not in order of importance or potential exposure, cansignificantly affect the Fund’s performance:
Currency Risk. Changes in currency exchange rates could adversely impact investment gains or add to investment losses.Currency exchange rates can be affected unpredictably by intervention, or failure to intervene, by U.S. or foreign governments orcentral banks or by currency controls or political developments in the U.S. or abroad.
Foreign Risk. Foreign securities involve risks in addition to those associated with comparable U.S. securities. Additional risksinclude exposure to less developed or less efficient trading markets; social, political or economic instability; fluctuations in foreigncurrencies or currency redenomination; potential for default on sovereign debt; nationalization or expropriation of assets;settlement, custodial or other operational risks; and less stringent auditing and legal standards. As a result, foreign securities mayfluctuate more widely in price, and may also be less liquid, than comparable U.S. securities. World markets, or those in aparticular region, may all react in similar fashion to important economic or political developments. In addition, foreign marketsmay perform differently than the U.S. market.
Securities of issuers traded on exchanges may be suspended, either by the issuers themselves, by an exchange or by governmentalauthorities. Trading suspensions may be applied from time to time to the securities of individual issuers for reasons specific to thatissuer, or may be applied broadly by exchanges or governmental authorities in response to market events. In the event that theFund holds material positions in such suspended securities, the Fund’s ability to liquidate its positions or provide liquidity toinvestors may be compromised and the Fund could incur significant losses.
Issuer-Specific Risk. An individual security may be more volatile, and may perform differently, than the market as a whole.
The Fund’s portfolio may contain fewer securities than the portfolios of other mutual funds, which may increase the risk that thevalue of the Fund could go down because of the poor performance of one or a few investments.
Market Capitalization Risk. To the extent the Fund invests in securities of small-, mid-, or large-cap companies, it takes on theassociated risks. At times, any one of these market capitalizations may be out of favor with investors. Compared to small- and mid-cap companies, large-cap companies may be less responsive to changes and opportunities. Compared to large-cap companies,small- and mid-cap companies may depend on a more limited management group, may have a shorter history of operations, andmay have limited product lines, markets or financial resources. The securities of small- and mid-cap companies are often morevolatile and less liquid than the securities of larger companies and may be more affected than other types of securities by theunderperformance of a sector or during market downturns.
Market Volatility Risk. Markets may be volatile and values of individual securities and other investments, including those of aparticular type, may decline significantly in response to adverse issuer, political, regulatory, market, economic or otherdevelopments that may cause broad changes in market value, public perceptions concerning these developments, and adverseinvestor sentiment. If the Fund sells a portfolio position before it reaches its market peak, it may miss out on opportunities forbetter performance.
GUARDIAN PORTFOLIO May 1, 2016
2
301
S-301
Operational Risk. The Fund and its service providers, and your ability to transact with the Fund, may be negatively impacteddue to operational risks arising from, among other problems, systems and technology disruptions or failures, or cybersecurityincidents. It is not possible for the Manager or the other Fund service providers to identify all of the operational risks that mayaffect the Fund or to develop processes and controls to completely eliminate or mitigate their occurrence or effects. Cybersecurityincidents could also affect issuers of securities in which the Fund invests, leading to significant loss of value.
Recent Market Conditions. Since the financial crisis that started in 2008, the U.S. and many foreign economies continue toexperience its after-effects, which have resulted, and may continue to result, in an unusually high degree of volatility in thefinancial markets, both domestic and foreign. Because the impact on the markets has been widespread, it may be difficult toidentify both risks and opportunities using past models of the interplay of market forces, or to predict the duration of these marketconditions. In addition, global economies and financial markets are increasingly interconnected, which increases the possibilitiesthat conditions in one country or region might adversely impact issuers in a different country or region. A significant slowdown inChina’s economy is adversely affecting worldwide commodity prices and the economies of many countries, especially those thatdepend heavily on commodity production and/or trade with China. The severity or duration of adverse economic conditions mayalso be affected by policy changes made by governments or quasi-governmental organizations.
In addition, political events within the U.S. and abroad may affect investor and consumer confidence and may adversely impactfinancial markets and the broader economy, perhaps suddenly and to a significant degree. High public debt in the U.S. and othercountries creates ongoing systemic and market risks and policymaking uncertainty. Interest rates have been unusually low inrecent years in the U.S. and abroad. Because there is little precedent for this situation, it is difficult to predict the impact onvarious markets of a significant rate increase, whether brought about by U.S. policy makers or by dislocations in world markets. Inaddition, there is a risk that the prices of goods and services in the U.S. and many foreign economies may decline over time,known as deflation (the opposite of inflation). Deflation may have an adverse effect on stock prices and creditworthiness and maymake defaults on debt more likely.
Redemption Risk. The Fund may experience periods of heavy redemptions that could cause the Fund to sell assets atinopportune times or at a loss or depressed value. Redemption risk is heightened during periods of declining or illiquid markets.Heavy redemptions could hurt the Fund’s performance.
Risk Management. Risk is an essential part of investing. No risk management program can eliminate the Fund’s exposure toadverse events; at best, it may only reduce the possibility that the Fund will be affected by such events, and especially those risksthat are not intrinsic to the Fund’s investment program.
Risk of Increase in Expenses. A decline in the Fund’s average net assets during the current fiscal year due to market volatility orother factors could cause the Fund’s expenses for the current fiscal year to be higher than the expense information presented in“Fees and Expenses.”
Sector Risk. From time to time, based on market or economic conditions, the Fund may have significant positions in one ormore sectors of the market. To the extent the Fund invests more heavily in particular sectors, its performance will be especiallysensitive to developments that significantly affect those sectors. Individual sectors may be more volatile, and may performdifferently, than the broader market. The industries that constitute a sector may all react in the same way to economic, political orregulatory events.
Valuation Risk. The Fund may not be able to sell an investment at the price at which the Fund has valued the investment. TheFund’s ability to value its investments in an accurate and timely manner may be impacted by technological issues and/or errors bythird party service providers, such as pricing services or accounting agents.
Value Stock Risk. Value stocks may remain undervalued during a given period or may not ever realize their full value. This mayhappen, among other reasons, because of a failure to anticipate which stocks or industries would benefit from changing market oreconomic conditions.
PERFORMANCEThe following bar chart and table provide an indication of the risks of investing in the Fund. The bar chart shows how the Fund’sperformance has varied from year to year. The table next to the bar chart shows what the returns would equal if you averaged outactual performance over various lengths of time and compares the returns with the returns of a broad-based market index. Theindex, which is described in “Description of Benchmark Index” in the Fund’s prospectus, has characteristics relevant to the Fund’sinvestment strategy. The performance information does not reflect variable contract or qualified plan fees and expenses. If suchfees and expenses were reflected, returns would be less than those shown. Please refer to the prospectus for your variable contractor your qualified plan documentation for information on their separate fees and expenses.
GUARDIAN PORTFOLIO May 1, 2016
3
302
S-302
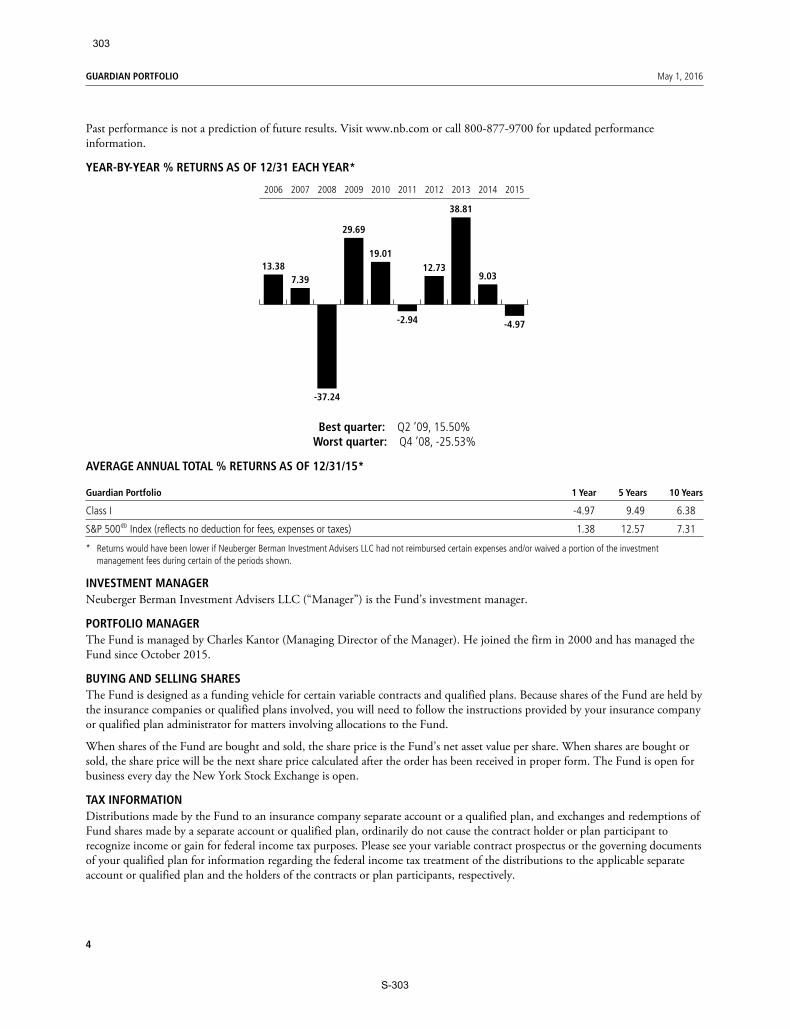
Past performance is not a prediction of future results. Visit www.nb.com or call 800-877-9700 for updated performanceinformation.
YEAR-BY-YEAR % RETURNS AS OF 12/31 EACH YEAR*
13.387.39
-37.24
29.69
19.01
-2.94
12.73
38.81
9.03
-4.97
2006 2007 2008 2009 2010 2011 2012 2013 2014 2015
Best quarter: Q2 ’09, 15.50%Worst quarter: Q4 ’08, -25.53%
AVERAGE ANNUAL TOTAL % RETURNS AS OF 12/31/15*
Guardian Portfolio 1 Year 5 Years 10 Years
Class I -4.97 9.49 6.38
S&P 500® Index (reflects no deduction for fees, expenses or taxes) 1.38 12.57 7.31
* Returns would have been lower if Neuberger Berman Investment Advisers LLC had not reimbursed certain expenses and/or waived a portion of the investmentmanagement fees during certain of the periods shown.
INVESTMENT MANAGERNeuberger Berman Investment Advisers LLC (“Manager”) is the Fund’s investment manager.
PORTFOLIO MANAGERThe Fund is managed by Charles Kantor (Managing Director of the Manager). He joined the firm in 2000 and has managed theFund since October 2015.
BUYING AND SELLING SHARESThe Fund is designed as a funding vehicle for certain variable contracts and qualified plans. Because shares of the Fund are held bythe insurance companies or qualified plans involved, you will need to follow the instructions provided by your insurance companyor qualified plan administrator for matters involving allocations to the Fund.
When shares of the Fund are bought and sold, the share price is the Fund’s net asset value per share. When shares are bought orsold, the share price will be the next share price calculated after the order has been received in proper form. The Fund is open forbusiness every day the New York Stock Exchange is open.
TAX INFORMATIONDistributions made by the Fund to an insurance company separate account or a qualified plan, and exchanges and redemptions ofFund shares made by a separate account or qualified plan, ordinarily do not cause the contract holder or plan participant torecognize income or gain for federal income tax purposes. Please see your variable contract prospectus or the governing documentsof your qualified plan for information regarding the federal income tax treatment of the distributions to the applicable separateaccount or qualified plan and the holders of the contracts or plan participants, respectively.
GUARDIAN PORTFOLIO May 1, 2016
4
303
S-303

PAYMENTS TO FINANCIAL INTERMEDIARIESNeuberger Berman Management LLC and/or its affiliates may pay insurance companies or their affiliates, qualified planadministrators, broker-dealers or other financial intermediaries, for services to current and prospective variable contract ownersand qualified plan participants who choose the Fund as an investment option. These payments may create a conflict of interest byinfluencing the financial intermediary and its employees to recommend the Fund over another investment or make the Fundavailable to their current or prospective variable contract owners and qualified plan participants. Ask your financial intermediaryor visit its website for more information.
The “Neuberger Berman” name and logo are registered service marks of Neuberger Berman Group LLC. “Neuberger Berman Investment Advisers LLC”and the individual Fund name in this prospectus are either service marks or registered service marks of Neuberger Berman Investment Advisers LLC.©2016 Neuberger Berman Management LLC, distributor. All rights reserved.
GUARDIAN PORTFOLIO May 1, 2016
304
S-304

GUARDIAN PORTFOLIO May 1, 2016
SEC File Number: 811-4255
K0044 05/16
305
S-305
May 1, 2016
LARGE CAP VALUE PORTFOLIO
SUMMARY PROSPECTUSClass I
The Fund is offered to certain life insurance companies to serve as an investment vehicle for premiums paid under their variable annuity and variable life insurance contracts(each, a “variable contract”) and to certain qualified pension and other retirement plans (each, a “qualified plan”). Before you invest, you may want to review the Fund’sprospectus, which contains more information about the Fund and its risks. You can find the Fund’s prospectus and other information about the Fund (including the Fund’sSAI) online at http://www.nb.com/amtportfolios/i. You can also get this information at no cost by calling 800-877-9700 or by sending an e-mail request to [email protected] can also get this information from your investment provider or any investment provider authorized to sell the Fund’s shares. The Fund’s prospectus and SAI, each datedMay 1, 2016 (as each may be amended or supplemented), are incorporated herein by reference.
GOALThe Fund seeks long-term growth of capital.
FEES AND EXPENSESThese tables describe the fees and expenses that you may pay if you buy, hold or sell shares of the Fund. These tables do not reflectany fees and expenses charged by your insurance company under your variable contract or by your qualified plan. If the tables didreflect such fees and expenses, the overall expenses would be higher than those shown. Please refer to the prospectus for yourvariable contract or your qualified plan documentation for information on their separate fees and expenses.
Shareholder Fees (fees paid directly from your investment) None
Annual Fund Operating Expenses (expenses that you pay each year as a % of the value of your investment)
Management fees 0.85
Distribution and/or shareholder service (12b-1) fees None
Other expenses 0.29
Total annual operating expenses 1.14
Expense ExampleThe expense example can help you compare costs among mutual funds. The example assumes that you invested $10,000 for theperiods shown, that you redeemed all of your shares at the end of those periods, that the Fund earned a hypothetical 5% totalreturn each year, and that the Fund’s expenses were those in the table. Actual performance and expenses may be higher or lower.
1 Year 3 Years 5 Years 10 Years
Expenses $116 $362 $628 $1,386
Portfolio TurnoverThe Fund pays transaction costs, such as commissions, when it buys and sells securities (or “turns over” its portfolio). A higherportfolio turnover rate may indicate higher transaction costs. These costs, which are not reflected in annual operating expenses orin the example, affect the Fund’s performance. During the most recent fiscal year, the Fund’s portfolio turnover rate was 153% ofthe average value of its portfolio.
PRINCIPAL INVESTMENT STRATEGIESTo pursue its goal, the Fund normally invests at least 80% of its net assets in equity securities of large-capitalization companies,which it defines as those with a market capitalization within the market capitalization range of the Russell 1000 Value Index at thetime of purchase.
The Portfolio Manager looks for what he believes to be well-managed companies whose stock prices are undervalued. ThePortfolio Manager seeks to identify companies with catalysts that he believes have the potential to improve the companies’earnings from depressed levels. Such catalysts may include: management changes, restructurings, new products, new services, ornew markets. The Portfolio Manager may also look for other characteristics in a company, such as a strong market position
306
S-306

relative to competitors, a high level of stock ownership among management, and a recent sharp decline in stock price that appearsto be the result of a short-term market overreaction to negative news.
Although the Fund invests primarily in domestic stocks, it may also invest in stocks of foreign companies.
The Fund seeks to reduce risk by diversifying among many companies and industries. However, at times, the Portfolio Managermay emphasize certain sectors or industries that he believes are undervalued relative to their historical valuations.
The Portfolio Manager follows a disciplined selling strategy and may sell a stock when it reaches a target price, if a company’sbusiness fails to perform as expected, or when other opportunities appear more attractive.
The Fund may change its goal without shareholder approval, although it does not currently intend to do so. The Fund will notchange its strategy of normally investing at least 80% of its net assets in equity securities of large-capitalization companies, withoutproviding shareholders at least 60 days’ notice. This test is applied at the time the Fund invests; later percentage changes caused bya change in Fund assets, market values or company circumstances will not require the Fund to dispose of a holding.
PRINCIPAL INVESTMENT RISKSMost of the Fund’s performance depends on what happens in the stock market. The market’s behavior can be difficult to predict,particularly in the short term. There can be no guarantee that the Fund will achieve its goal. The Fund may take temporarydefensive and cash management positions; in such a case, it will not be pursuing its principal investment strategies.
The Fund is a mutual fund, not a bank deposit, and is not guaranteed or insured by the Federal Deposit Insurance Corporation orany other government agency. The value of your investment may fall, sometimes sharply, and you could lose money by investingin the Fund.
The following risks, which are described in alphabetical order and not in order of importance or potential exposure, cansignificantly affect the Fund’s performance:
Catalyst Risk. Investing in companies in anticipation of a catalyst carries the risk that the catalyst may not happen as anticipated,possibly due to the actions of other market participants, or the market may react differently than expected to the catalyst. Certaincatalysts, such as companies emerging from, or restructuring as a result of, bankruptcy, carry additional risks, and the securities ofsuch companies may be more likely to lose value than the securities of more stable companies. It also may be difficult to obtaincomplete information about companies involved in certain situations and management of such companies may be addressing asituation with which it has little experience.
Currency Risk. Changes in currency exchange rates could adversely impact investment gains or add to investment losses.Currency exchange rates can be affected unpredictably by intervention, or failure to intervene, by U.S. or foreign governments orcentral banks or by currency controls or political developments in the U.S. or abroad.
Foreign Risk. Foreign securities involve risks in addition to those associated with comparable U.S. securities. Additional risksinclude exposure to less developed or less efficient trading markets; social, political or economic instability; fluctuations in foreigncurrencies or currency redenomination; potential for default on sovereign debt; nationalization or expropriation of assets;settlement, custodial or other operational risks; and less stringent auditing and legal standards. As a result, foreign securities mayfluctuate more widely in price, and may also be less liquid, than comparable U.S. securities. World markets, or those in aparticular region, may all react in similar fashion to important economic or political developments. In addition, foreign marketsmay perform differently than the U.S. market.
Securities of issuers traded on exchanges may be suspended, either by the issuers themselves, by an exchange or by governmentalauthorities. Trading suspensions may be applied from time to time to the securities of individual issuers for reasons specific to thatissuer, or may be applied broadly by exchanges or governmental authorities in response to market events. In the event that theFund holds material positions in such suspended securities, the Fund’s ability to liquidate its positions or provide liquidity toinvestors may be compromised and the Fund could incur significant losses.
Issuer-Specific Risk. An individual security may be more volatile, and may perform differently, than the market as a whole.
Market Volatility Risk. Markets may be volatile and values of individual securities and other investments, including those of aparticular type, may decline significantly in response to adverse issuer, political, regulatory, market, economic or otherdevelopments that may cause broad changes in market value, public perceptions concerning these developments, and adverseinvestor sentiment. If the Fund sells a portfolio position before it reaches its market peak, it may miss out on opportunities forbetter performance.
LARGE CAP VALUE PORTFOLIO May 1, 2016
2
307
S-307

Mid- and Large-Cap Companies Risk. At times, mid- and large-cap companies may be out of favor with investors. Compared tosmaller companies, large-cap companies may be less responsive to changes and opportunities. Compared to larger companies, mid-cap companies may depend on a more limited management group, may have a shorter history of operations, and may have limitedproduct lines, markets or financial resources. The securities of mid-cap companies are often more volatile and less liquid than thesecurities of larger companies and may be more affected than other types of securities by the underperformance of a sector orduring market downturns.
Operational Risk. The Fund and its service providers, and your ability to transact with the Fund, may be negatively impacteddue to operational risks arising from, among other problems, systems and technology disruptions or failures, or cybersecurityincidents. It is not possible for the Manager or the other Fund service providers to identify all of the operational risks that mayaffect the Fund or to develop processes and controls to completely eliminate or mitigate their occurrence or effects. Cybersecurityincidents could also affect issuers of securities in which the Fund invests, leading to significant loss of value.
Recent Market Conditions. Since the financial crisis that started in 2008, the U.S. and many foreign economies continue toexperience its after-effects, which have resulted, and may continue to result, in an unusually high degree of volatility in thefinancial markets, both domestic and foreign. Because the impact on the markets has been widespread, it may be difficult toidentify both risks and opportunities using past models of the interplay of market forces, or to predict the duration of these marketconditions. In addition, global economies and financial markets are increasingly interconnected, which increases the possibilitiesthat conditions in one country or region might adversely impact issuers in a different country or region. A significant slowdown inChina’s economy is adversely affecting worldwide commodity prices and the economies of many countries, especially those thatdepend heavily on commodity production and/or trade with China. The severity or duration of adverse economic conditions mayalso be affected by policy changes made by governments or quasi-governmental organizations.
In addition, political events within the U.S. and abroad may affect investor and consumer confidence and may adversely impactfinancial markets and the broader economy, perhaps suddenly and to a significant degree. High public debt in the U.S. and othercountries creates ongoing systemic and market risks and policymaking uncertainty. Interest rates have been unusually low inrecent years in the U.S. and abroad. Because there is little precedent for this situation, it is difficult to predict the impact onvarious markets of a significant rate increase, whether brought about by U.S. policy makers or by dislocations in world markets. Inaddition, there is a risk that the prices of goods and services in the U.S. and many foreign economies may decline over time,known as deflation (the opposite of inflation). Deflation may have an adverse effect on stock prices and creditworthiness and maymake defaults on debt more likely.
Redemption Risk. The Fund may experience periods of heavy redemptions that could cause the Fund to sell assets atinopportune times or at a loss or depressed value. Redemption risk is heightened during periods of declining or illiquid markets.Heavy redemptions could hurt the Fund’s performance.
Risk Management. Risk is an essential part of investing. No risk management program can eliminate the Fund’s exposure toadverse events; at best, it may only reduce the possibility that the Fund will be affected by such events, and especially those risksthat are not intrinsic to the Fund’s investment program.
Risk of Increase in Expenses. A decline in the Fund’s average net assets during the current fiscal year due to market volatility orother factors could cause the Fund’s expenses for the current fiscal year to be higher than the expense information presented in“Fees and Expenses.”
Sector Risk. From time to time, based on market or economic conditions, the Fund may have significant positions in one ormore sectors of the market. To the extent the Fund invests more heavily in particular sectors, its performance will be especiallysensitive to developments that significantly affect those sectors. Individual sectors may be more volatile, and may performdifferently, than the broader market. The industries that constitute a sector may all react in the same way to economic, political orregulatory events.
Valuation Risk. The Fund may not be able to sell an investment at the price at which the Fund has valued the investment. TheFund’s ability to value its investments in an accurate and timely manner may be impacted by technological issues and/or errors bythird party service providers, such as pricing services or accounting agents.
Value Stock Risk. Value stocks may remain undervalued during a given period or may not ever realize their full value. This mayhappen, among other reasons, because of a failure to anticipate which stocks or industries would benefit from changing market oreconomic conditions.
LARGE CAP VALUE PORTFOLIO May 1, 2016
3
308
S-308

PERFORMANCEThe following bar chart and table provide an indication of the risks of investing in the Fund. The bar chart shows how the Fund’sperformance has varied from year to year. The table next to the bar chart shows what the returns would equal if you averaged outactual performance over various lengths of time and compares the returns with the returns of a broad-based market index. Theindex, which is described in “Description of Benchmark Index” in the Fund’s prospectus, has characteristics relevant to the Fund’sinvestment strategy. The performance information does not reflect variable contract or qualified plan fees and expenses. If suchfees and expenses were reflected, returns would be less than those shown. Please refer to the prospectus for your variable contractor your qualified plan documentation for information on their separate fees and expenses.
Past performance is not a prediction of future results. Visit www.nb.com or call 800-877-9700 for updated performanceinformation.
YEAR-BY-YEAR % RETURNS AS OF 12/31 EACH YEAR*
12.24 9.34
-52.39
56.07
15.67
-11.36
16.60
31.14
9.85
-11.80
2006 2007 2008 2009 2010 2011 2012 2013 2014 2015
Best quarter: Q2 ’09, 28.06%Worst quarter: Q4 ‘08, -33.46%
AVERAGE ANNUAL TOTAL % RETURNS AS OF 12/31/15*
Large Cap Value Portfolio 1 Year 5 Years 10 Years
Class I -11.80 5.60 3.31
Russell 1000® Value Index (reflects no deduction for fees, expenses or taxes) -3.83 11.27 6.16
* Returns would have been lower if Neuberger Berman Investment Advisers LLC had not reimbursed certain expenses and/or waived a portion of the investmentmanagement fees during certain of the periods shown.
INVESTMENT MANAGERNeuberger Berman Investment Advisers LLC (“Manager”) is the Fund’s investment manager.
PORTFOLIO MANAGERThe Fund is managed by Eli M. Salzmann (Managing Director of the Manager). He has managed the Fund since December2011.
BUYING AND SELLING SHARESThe Fund is designed as a funding vehicle for certain variable contracts and qualified plans. Because shares of the Fund are held bythe insurance companies or qualified plans involved, you will need to follow the instructions provided by your insurance companyor qualified plan administrator for matters involving allocations to the Fund.
When shares of the Fund are bought and sold, the share price is the Fund’s net asset value per share. When shares are bought orsold, the share price will be the next share price calculated after the order has been received in proper form. The Fund is open forbusiness every day the New York Stock Exchange is open.
LARGE CAP VALUE PORTFOLIO May 1, 2016
4
309
S-309
TAX INFORMATIONDistributions made by the Fund to an insurance company separate account or a qualified plan, and exchanges and redemptions ofFund shares made by a separate account or qualified plan, ordinarily do not cause the contract holder or plan participant torecognize income or gain for federal income tax purposes. Please see your variable contract prospectus or the governing documentsof your qualified plan for information regarding the federal income tax treatment of the distributions to the applicable separateaccount or qualified plan and the holders of the contracts or plan participants, respectively.
PAYMENTS TO FINANCIAL INTERMEDIARIESNeuberger Berman Management LLC and/or its affiliates may pay insurance companies or their affiliates, qualified planadministrators, broker-dealers or other financial intermediaries, for services to current and prospective variable contract ownersand qualified plan participants who choose the Fund as an investment option. These payments may create a conflict of interest byinfluencing the financial intermediary and its employees to recommend the Fund over another investment or make the Fundavailable to their current or prospective variable contract owners and qualified plan participants. Ask your financial intermediaryor visit its website for more information.
The “Neuberger Berman” name and logo are registered service marks of Neuberger Berman Group LLC. “Neuberger Berman Investment Advisers LLC”and the individual Fund name in this prospectus are either service marks or registered service marks of Neuberger Berman Investment Advisers LLC.©2016 Neuberger Berman Management LLC, distributor. All rights reserved.
LARGE CAP VALUE PORTFOLIO May 1, 2016
310
S-310

LARGE CAP VALUE PORTFOLIO May 1, 2016
SEC File Number: 811-4255
K0050 05/16
311
S-311

May 1, 2016
MID CAP GROWTH PORTFOLIO
SUMMARY PROSPECTUSClass S
The Fund is offered to certain life insurance companies to serve as an investment vehicle for premiums paid under their variable annuity and variable life insurance contracts(each, a “variable contract”) and to certain qualified pension and other retirement plans (each, a “qualified plan”). Before you invest, you may want to review the Fund’sprospectus, which contains more information about the Fund and its risks. You can find the Fund’s prospectus and other information about the Fund (including the Fund’sSAI) online at http://www.nb.com/amtportfolios/s. You can also get this information at no cost by calling 800-877-9700 or by sending an e-mail request to [email protected] can also get this information from your investment provider or any investment provider authorized to sell the Fund’s shares. The Fund’s prospectus and SAI, each datedMay 1, 2016 (as each may be amended or supplemented), are incorporated herein by reference.
GOALThe Fund seeks growth of capital.
FEES AND EXPENSESThese tables describe the fees and expenses that you may pay if you buy, hold or sell shares of the Fund. These tables do not reflectany fees and expenses charged by your insurance company under your variable contract or by your qualified plan. If the tables didreflect such fees and expenses, the overall expenses would be higher than those shown. Please refer to the prospectus for yourvariable contract or your qualified plan documentation for information on their separate fees and expenses.
Shareholder Fees (fees paid directly from your investment) None
Annual Fund Operating Expenses (expenses that you pay each year as a % of the value of your investment)
Management fees 0.84
Distribution and/or shareholder service (12b-1) fees 0.25
Acquired fund fees and expenses 0.01
Other expenses 0.13
Total annual operating expenses 1.23
Expense ExampleThe expense example can help you compare costs among mutual funds. The example assumes that you invested $10,000 for theperiods shown, that you redeemed all of your shares at the end of those periods, that the Fund earned a hypothetical 5% totalreturn each year, and that the Fund’s expenses were those in the table. Actual performance and expenses may be higher or lower.
1 Year 3 Years 5 Years 10 Years
Expenses $125 $390 $676 $1,489
Portfolio TurnoverThe Fund pays transaction costs, such as commissions, when it buys and sells securities (or “turns over” its portfolio). A higherportfolio turnover rate may indicate higher transaction costs. These costs, which are not reflected in annual operating expenses orin the example, affect the Fund’s performance. During the most recent fiscal year, the Fund’s portfolio turnover rate was 58% ofthe average value of its portfolio.
PRINCIPAL INVESTMENT STRATEGIESTo pursue its goal, the Fund normally invests at least 80% of its net assets in common stocks of mid-capitalization companies,which it defines as those with a total market capitalization within the market capitalization range of the Russell Midcap Index atthe time of purchase.
The Fund seeks to reduce risk by diversifying among many companies, sectors and industries.
The Portfolio Manager employs a disciplined investment strategy when selecting growth stocks. Using fundamental research andquantitative analysis, he looks for what he believes to be fast-growing companies with above-average sales and competitive returns
312
S-312

on equity relative to their peers. In doing so, the Portfolio Manager analyzes such factors as: financial condition (such as debt toequity ratio); market share and competitive leadership of the company’s products; earnings growth relative to competitors; andmarket valuation in comparison to a stock’s own historical norms and the stocks of other mid-cap companies.
At times, the Portfolio Manager may emphasize certain sectors that he believes will benefit from market or economic trends.
The Portfolio Manager follows a disciplined selling strategy and may sell a stock when it reaches a target price, if a company’sbusiness fails to perform as expected, or when other opportunities appear more attractive.
The Fund may change its goal without shareholder approval, although it does not currently intend to do so. The Fund will notchange its strategy of normally investing at least 80% of its net assets in mid-capitalization companies, without providingshareholders at least 60 days’ notice. This test is applied at the time the Fund invests; later percentage changes caused by a changein Fund assets, market values or company circumstances will not require the Fund to dispose of a holding.
PRINCIPAL INVESTMENT RISKSMost of the Fund’s performance depends on what happens in the stock market. The market’s behavior can be difficult to predict,particularly in the short term. There can be no guarantee that the Fund will achieve its goal. The Fund may take temporarydefensive and cash management positions; in such a case, it will not be pursuing its principal investment strategies.
The Fund is a mutual fund, not a bank deposit, and is not guaranteed or insured by the Federal Deposit Insurance Corporation orany other government agency. The value of your investment may fall, sometimes sharply, and you could lose money by investingin the Fund.
The following risks, which are described in alphabetical order and not in order of importance or potential exposure, cansignificantly affect the Fund’s performance:
Foreign Exposure Risk. Securities issued by U.S. entities with substantial foreign operations may involve additional risks relatingto political, economic, or regulatory conditions in foreign countries, as well as currency exchange rates.
Growth Stock Risk. Because the prices of most growth stocks are based on future expectations, these stocks tend to be moresensitive than value stocks to bad economic news and negative earnings surprises. Bad economic news or changing investorperceptions may adversely affect growth stocks across several sectors and industries simultaneously.
Issuer-Specific Risk. An individual security may be more volatile, and may perform differently, than the market as a whole.
Market Volatility Risk. Markets may be volatile and values of individual securities and other investments, including those of aparticular type, may decline significantly in response to adverse issuer, political, regulatory, market, economic or otherdevelopments that may cause broad changes in market value, public perceptions concerning these developments, and adverseinvestor sentiment. If the Fund sells a portfolio position before it reaches its market peak, it may miss out on opportunities forbetter performance.
Mid-Cap Companies Risk. At times, mid-cap companies may be out of favor with investors. Compared to larger companies,mid-cap companies may depend on a more limited management group, may have a shorter history of operations, and may havelimited product lines, markets or financial resources. The securities of mid-cap companies are often more volatile and less liquidthan the securities of larger companies and may be more affected than other types of securities by the underperformance of asector or during market downturns.
Operational Risk. The Fund and its service providers, and your ability to transact with the Fund, may be negatively impacteddue to operational risks arising from, among other problems, systems and technology disruptions or failures, or cybersecurityincidents. It is not possible for the Manager or the other Fund service providers to identify all of the operational risks that mayaffect the Fund or to develop processes and controls to completely eliminate or mitigate their occurrence or effects. Cybersecurityincidents could also affect issuers of securities in which the Fund invests, leading to significant loss of value.
Recent Market Conditions. Since the financial crisis that started in 2008, the U.S. and many foreign economies continue toexperience its after-effects, which have resulted, and may continue to result, in an unusually high degree of volatility in thefinancial markets, both domestic and foreign. Because the impact on the markets has been widespread, it may be difficult toidentify both risks and opportunities using past models of the interplay of market forces, or to predict the duration of these marketconditions. In addition, global economies and financial markets are increasingly interconnected, which increases the possibilitiesthat conditions in one country or region might adversely impact issuers in a different country or region. A significant slowdown inChina’s economy is adversely affecting worldwide commodity prices and the economies of many countries, especially those that
MID CAP GROWTH PORTFOLIO May 1, 2016
2
313
S-313

depend heavily on commodity production and/or trade with China. The severity or duration of adverse economic conditions mayalso be affected by policy changes made by governments or quasi-governmental organizations.
In addition, political events within the U.S. and abroad may affect investor and consumer confidence and may adversely impactfinancial markets and the broader economy, perhaps suddenly and to a significant degree. High public debt in the U.S. and othercountries creates ongoing systemic and market risks and policymaking uncertainty. Interest rates have been unusually low inrecent years in the U.S. and abroad. Because there is little precedent for this situation, it is difficult to predict the impact onvarious markets of a significant rate increase, whether brought about by U.S. policy makers or by dislocations in world markets. Inaddition, there is a risk that the prices of goods and services in the U.S. and many foreign economies may decline over time,known as deflation (the opposite of inflation). Deflation may have an adverse effect on stock prices and creditworthiness and maymake defaults on debt more likely.
Redemption Risk. The Fund may experience periods of heavy redemptions that could cause the Fund to sell assets atinopportune times or at a loss or depressed value. Redemption risk is heightened during periods of declining or illiquid markets.Heavy redemptions could hurt the Fund’s performance.
Risk Management. Risk is an essential part of investing. No risk management program can eliminate the Fund’s exposure toadverse events; at best, it may only reduce the possibility that the Fund will be affected by such events, and especially those risksthat are not intrinsic to the Fund’s investment program.
Risk of Increase in Expenses. A decline in the Fund’s average net assets during the current fiscal year due to market volatility orother factors could cause the Fund’s expenses for the current fiscal year to be higher than the expense information presented in“Fees and Expenses.”
Sector Risk. From time to time, based on market or economic conditions, the Fund may have significant positions in one ormore sectors of the market. To the extent the Fund invests more heavily in particular sectors, its performance will be especiallysensitive to developments that significantly affect those sectors. Individual sectors may be more volatile, and may performdifferently, than the broader market. The industries that constitute a sector may all react in the same way to economic, political orregulatory events.
Valuation Risk. The Fund may not be able to sell an investment at the price at which the Fund has valued the investment. TheFund’s ability to value its investments in an accurate and timely manner may be impacted by technological issues and/or errors bythird party service providers, such as pricing services or accounting agents.
PERFORMANCEThe following bar chart and table provide an indication of the risks of investing in the Fund. The bar chart shows how the Fund’sperformance has varied from year to year. The table next to the bar chart shows what the returns would equal if you averaged outactual performance over various lengths of time and compares the returns with the returns of a broad-based market index and anadditional index. The indices, which are described in “Descriptions of Benchmark Indices” in the Fund’s prospectus, havecharacteristics relevant to the Fund’s investment strategy. The performance information does not reflect variable contract orqualified plan fees and expenses. If such fees and expenses were reflected, returns would be less than those shown. Please refer tothe prospectus for your variable contract or your qualified plan documentation for information on their separate fees and expenses.
MID CAP GROWTH PORTFOLIO May 1, 2016
3
314
S-314
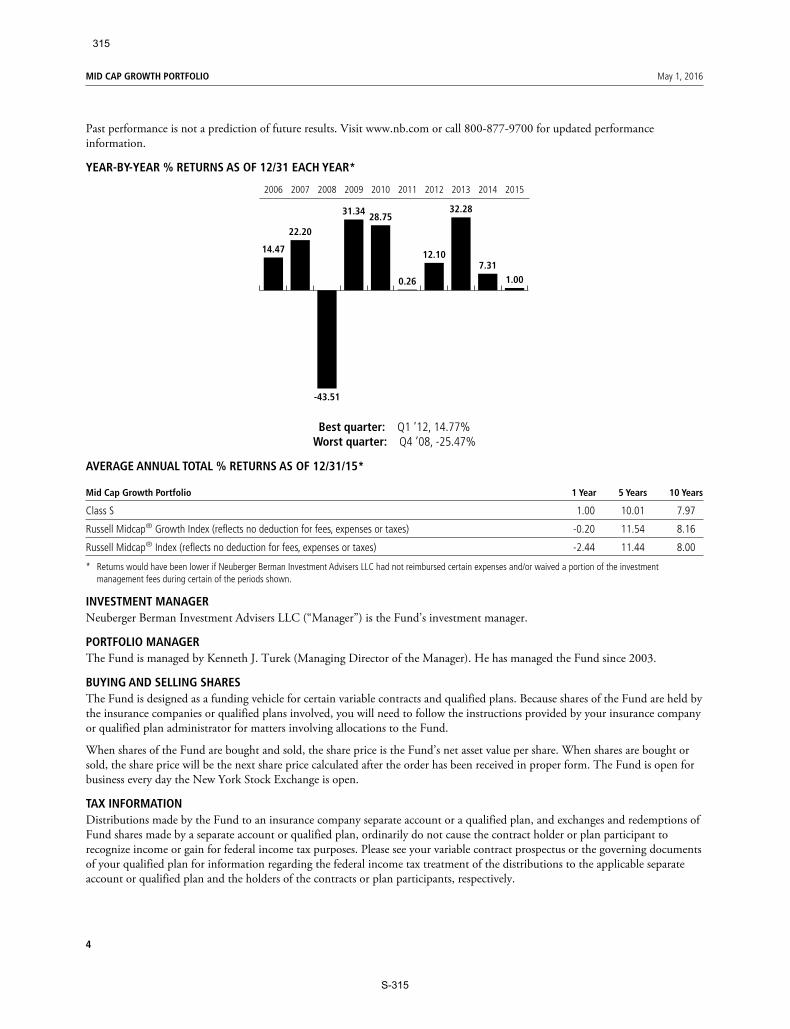
Past performance is not a prediction of future results. Visit www.nb.com or call 800-877-9700 for updated performanceinformation.
YEAR-BY-YEAR % RETURNS AS OF 12/31 EACH YEAR*
14.47
22.20
-43.51
31.3428.75
0.26
12.10
32.28
7.311.00
2006 2007 2008 2009 2010 2011 2012 2013 2014 2015
Best quarter: Q1 ’12, 14.77%Worst quarter: Q4 ’08, -25.47%
AVERAGE ANNUAL TOTAL % RETURNS AS OF 12/31/15*
Mid Cap Growth Portfolio 1 Year 5 Years 10 Years
Class S 1.00 10.01 7.97
Russell Midcap® Growth Index (reflects no deduction for fees, expenses or taxes) -0.20 11.54 8.16
Russell Midcap® Index (reflects no deduction for fees, expenses or taxes) -2.44 11.44 8.00
* Returns would have been lower if Neuberger Berman Investment Advisers LLC had not reimbursed certain expenses and/or waived a portion of the investmentmanagement fees during certain of the periods shown.
INVESTMENT MANAGERNeuberger Berman Investment Advisers LLC (“Manager”) is the Fund’s investment manager.
PORTFOLIO MANAGERThe Fund is managed by Kenneth J. Turek (Managing Director of the Manager). He has managed the Fund since 2003.
BUYING AND SELLING SHARESThe Fund is designed as a funding vehicle for certain variable contracts and qualified plans. Because shares of the Fund are held bythe insurance companies or qualified plans involved, you will need to follow the instructions provided by your insurance companyor qualified plan administrator for matters involving allocations to the Fund.
When shares of the Fund are bought and sold, the share price is the Fund’s net asset value per share. When shares are bought orsold, the share price will be the next share price calculated after the order has been received in proper form. The Fund is open forbusiness every day the New York Stock Exchange is open.
TAX INFORMATIONDistributions made by the Fund to an insurance company separate account or a qualified plan, and exchanges and redemptions ofFund shares made by a separate account or qualified plan, ordinarily do not cause the contract holder or plan participant torecognize income or gain for federal income tax purposes. Please see your variable contract prospectus or the governing documentsof your qualified plan for information regarding the federal income tax treatment of the distributions to the applicable separateaccount or qualified plan and the holders of the contracts or plan participants, respectively.
MID CAP GROWTH PORTFOLIO May 1, 2016
4
315
S-315

PAYMENTS TO FINANCIAL INTERMEDIARIESNeuberger Berman Management LLC and/or its affiliates may pay insurance companies or their affiliates, qualified planadministrators, broker-dealers or other financial intermediaries, for services to current and prospective variable contract ownersand qualified plan participants who choose the Fund as an investment option. These payments may create a conflict of interest byinfluencing the financial intermediary and its employees to recommend the Fund over another investment or make the Fundavailable to their current or prospective variable contract owners and qualified plan participants. Ask your financial intermediaryor visit its website for more information.
The “Neuberger Berman” name and logo are registered service marks of Neuberger Berman Group LLC. “Neuberger Berman Investment Advisers LLC”and the individual Fund name in this prospectus are either service marks or registered service marks of Neuberger Berman Investment Advisers LLC.©2016 Neuberger Berman Management LLC, distributor. All rights reserved.
MID CAP GROWTH PORTFOLIO May 1, 2016
316
S-316

MID CAP GROWTH PORTFOLIO May 1, 2016
SEC File Number: 811-4255
K0049 05/16
317
S-317

Investment Objective. The Fund seeks capital appreciation.
Fees and Expenses of the Fund.�This table describes the fees and expenses that you may pay if you buy and hold or redeem shares ofthe Fund. The accompanying prospectus of the participating insurance company provides information on initial or contingent deferredsales charges, exchange fees or redemption fees for that variable life insurance policy, variable annuity or other investment product. Thefees and expenses of those products are not charged by the Fund and are not reflected in this table. Expenses would be higher if those feeswere included.
Shareholder Fees � �(fees paid directly from your investment) Non-Service Service
Maximum Sales Charge (Load) imposed on purchases (as % of offering price) None None
Maximum Deferred Sales Charge (Load) (as % of the lower of original offering price or redemption proceeds) None None
Annual Fund Operating Expenses � � � �(expenses that you pay each year as a percentage of the value of your investment) Non-Service Service
Management Fees 0.68% 0.68%
Distribution and/or Service (12b-1) Fees None 0.25%
Other Expenses 0.12% 0.12%
Total Annual Fund Operating Expenses 0.80% 1.05%
Example.�The following Example is intended to help you compare the cost of investing in the Fund with the cost of investing in othermutual funds. The Example assumes that you invest $10,000 in a class of shares of the Fund for the time periods indicated. The Examplealso assumes that your investment has a 5% return each year and that the Fund’s operating expenses remain the same. Although youractual costs may be higher or lower, based on these assumptions your expenses would be as follows, whether or not you redeemed yourshares:
� 1 Year 3 Years 5 Years 10 Years
Non-Service $ 82� $ 256� $ 446� $ 994�
Service $ 108� $ 336� $ 582� $ 1,289�
Portfolio Turnover. The Fund pays transaction costs, such as commissions, when it buys and sells securities (or “turns over” its portfolio).A higher portfolio turnover rate may indicate higher transaction costs. These costs, which are not reflected in the annual fund operatingexpenses or in the example, affect the Fund’s performance. During the most recent fiscal year, the Fund’s portfolio turnover rate was 43% ofthe average value of its portfolio.
Principal Investment Strategies.�Under normal market conditions, the Fund will invest at least 80% of its net assets, including anyborrowings for investment purposes, in securities of “small-cap” companies. A company’s “market capitalization” is the value of itsoutstanding common stock. The Fund considers small-cap companies to be those having a market capitalization in the range of the Russell2000® Index. The capitalization range of that index is subject to change at any time due to market activity or changes in the composition ofthe index. The range of the Russell 2000® Index generally widens over time and it is reconstituted annually to preserve its�market capcharacteristics. The Fund measures a company’s capitalization at the time the Fund buys a security and is not required to sell a security ifthe company’s capitalization moves outside of the Fund’s capitalization definition.���� Although the Fund mainly invests in U.S. companies, it can invest in securities issued by companies or governments in any country. The
OPPENHEIMER
Main Street Small Cap Fund/VA®
A series of Oppenheimer Variable Account Funds
Summary Prospectus April 29, 2016
Share Classes:�����Non-Service Shares�����Service Shares
Before you invest, you may want to review the Fund’s prospectus, which contains more information about the Fund and its risks. Youcan find the Fund’s prospectus, Statement of Additional Information, Annual Report and other information about the Fund online athttps://www.oppenheimerfunds.com/fund/MainStreetSmallCapFundVA. You can also get this information at no cost by calling1.800.225.5677 or by sending an email request to: [email protected].
The Fund’s prospectus and Statement of Additional Information (“SAI”), both dated April 29, 2016, and through page�25 of its most recentAnnual Report, dated December 31, 2015, are incorporated by reference into this Summary Prospectus. You can access the Fund’sprospectus�and SAI at https://www.oppenheimerfunds.com/fund/MainStreetSmallCapFundVA.�The Fund’s prospectus is also available fromfinancial intermediaries who are authorized to sell Fund shares.
318
S-318

Fund primarily invests in common stock but may also invest in other types of securities that are consistent with its investment objective.�������� The portfolio managers use both fundamental research and quantitative models to identify investment opportunities. While theprocess may change over time or vary in particular cases, in general the selection process currently:� aims to maintain broad diversification across all major economic sectors;� uses a fundamental approach to analyze issuers based on factors such as a company’s financial performance, competitive strength,
industry position, business practices and management;� also uses quantitative models, including sector-specific factors, to rank securities within each economic sector; and� considers market trends, current industry outlooks and general economic conditions.
���� In constructing the portfolio, the Fund seeks to limit exposure to so-called “top-down” or “macro” risks, such as overall stock marketmovements, economic cycles, and interest rate or currency fluctuations. Instead, the portfolio managers seek to add value by selectingindividual securities with superior company-specific fundamental attributes or relative valuations that they expect to outperform theirindustry and sector peers. This is commonly referred to as a “bottom-up” approach to portfolio construction.���� The portfolio managers consider stock rankings, benchmark weightings and capitalization outlooks in determining security weightingsfor individual issuers.������ The portfolio managers might sell a security if the price is approaching their price target, if the company’s competitive position hasdeteriorated or the company’s management has performed poorly, or if they have identified more attractive investment prospects.
Principal Risks. The price of the Fund’s shares can go up and down substantially. The value of the Fund’s investments may changebecause of broad changes in the markets in which the Fund invests or because of�poor�investment selection, which could cause the Fundto underperform other funds with similar investment objectives. There is no assurance that the Fund will achieve its investment objective.When you redeem your shares, they may be worth less than what you paid for them. These risks mean that you can lose money by investingin the Fund.
Risks of Investing in Stocks. The value of�the�Fund’s portfolio may be affected by changes in the stock markets. Stock markets mayexperience significant short-term volatility and may fall sharply at times. Adverse events in any part of the equity or fixed-income marketsmay have unexpected negative effects on other market segments. Different stock markets may behave differently from each other and U.S.stock markets may move in the opposite direction from one or more foreign stock markets.
The prices of individual stocks generally do not all move in the same direction at the same time. For example, “growth” stocks may performwell under circumstances in which “value” stocks in general have fallen. A variety of factors can affect the price of a particular company’sstock. These factors may include, but are not limited to: poor earnings reports, a loss of customers, litigation against the company, generalunfavorable performance of the company’s sector or industry, or changes in government regulations affecting the company or its industry.To the extent that securities of a particular type are emphasized (for example foreign stocks, stocks of small- or mid-cap companies,growth or value stocks, or stocks of companies in a particular industry), fund share values may fluctuate more in response to eventsaffecting the market for those types of securities.
����Industry and Sector Focus. At times the Fund may increase the relative emphasis of its investments in a particular industry or sector.The prices of stocks of issuers in a particular industry or sector may go up and down in response to changes in economic conditions,government regulations, availability of basic resources or supplies, or other events that affect that industry or sector more than others. Tothe extent that the Fund increases the relative emphasis of its investments in a particular industry or sector, its share values may fluctuate inresponse to events affecting that industry or sector. To some extent that risk may be limited by the Fund’s policy of not concentratingits�investments in any one industry.�
Risks of Small-Cap Companies. Small-cap companies may be either established or newer companies, including “unseasoned” companiesthat have typically been in operation for less than three years. While smaller companies might offer greater opportunities for gain thanlarger companies, they also involve greater risk of loss. They may be more sensitive to changes in a company’s earnings expectations andmay experience more abrupt and erratic price movements. Smaller companies’ securities often trade in lower volumes and it might beharder for the Fund to dispose of its holdings at an acceptable price when it wants to sell them. Small-cap companies may not haveestablished markets for their products or services and may have fewer customers and product lines. They may have more limited access tofinancial resources and may not have the financial strength to sustain them through business downturns or adverse market conditions.Since small-cap companies typically reinvest a high proportion of their earnings in their business, they may�not pay dividends for sometime, particularly if they are newer companies. Small-cap companies may have unseasoned management or less depth in management skillthan larger, more established companies. They may be more reliant on the efforts of particular members of their management team andmanagement changes may pose a greater risk to the success of the business. It may take a substantial period of time before the Fundrealizes a gain on an investment in a small-sized company, if it realizes any gain at all.
Who Is the Fund Designed For? The Fund’s shares are available only as an investment option under certain variable annuity contracts,variable life insurance policies and investment plans offered through insurance company separate accounts of participating insurancecompanies. The Fund is designed primarily for investors seeking capital appreciation. Those investors should be willing to assume thegreater risks of short-term share price fluctuations that are typical for a fund focusing on long-term capital appreciation of stocks of smallsized�companies. The Fund is not designed for investors needing current income. The Fund is not a complete investment program and maynot be appropriate for all investors. You should carefully consider your own investment goals and risk tolerance before investing in theFund.
An investment in the Fund is not a deposit of any bank and is not insured or guaranteed by the Federal Deposit InsuranceCorporation or any other government agency.
The Fund’s Past Performance. The bar chart and table below provide some indication of the risks of investing in the Fund by showingchanges in the Fund’s Non-Service Shares performance from calendar year to calendar year and by showing how the Fund’s average annual
.2
319
S-319