Prince William Forest Park Terrestrial Climate Change ...
10
September23,2019 P. 1 CLIMATE CHANGE VULNERABILITY OF TERRESTRIAL AREAS - PRINCE WILLIAM FOREST PARK National Park Service U.S. Department of the Interior National Capital Region Natural Resources and Science Climate Change Vulnerability of Terrestrial Areas: Prince William Forest Park Located in a zone of ecological transition, near where three physiographic provinces meet, Prince William Forest Park (PRWI), supports a diversity of natural communities. As a protected area within a landscape heavily pressured by development, the park provides opportunities for ecological adaptation in the face of environmental change. However, as global temperatures rise and precipitation patterns become more extreme (Intergovernmental Panel for Climate Change (IPCC) 2013), the natural habitats (see glossary, page 9, for definition of italicized words) of Prince William Forest Park are increasingly vulnerable to climate-driven stresses. To begin to understand how climate change will impact terrestrial habitats in the National Capital Region (NCR), the National Park Service partnered with NatureServe to conduct climate change vulnerability assessments. This initial assessment for Prince William Forest Park examines how climate and landscape influence vulnerability and identify areas most and least vulnerable today and in the near future. Our goal is to help park managers and visitors an understand levels of vulnerability and support the development of informed management strategies. VULNERABILITY Describes whether the ecological condition of a region or habitat is at risk from climate change impacts. EXPOSURE Describes the nature and magnitude of changes in temperature and precipitation by comparing a given time period against a historical baseline. ADAPTIVE CAPACITY Describes the ability of a region or habitat to maintain species and ecological processes as climate changes. Adaptive capacity at a specific location considers the area’s unique physical features and its connectivity to other natural areas. IMPORTANT TERMS Virginia PRINCE WILLIAM FOREST PARK is located in the southeastern portion of the NCR, adjacent to Marine Corps Base Quantico. We consider the implications of climate change for the park within the context of the NCR surrounding area and the Mid- Atlantic region. WHAT IS CLIMATE CHANGE VULNERABILITY? We define VULNERABILITY as the risk of losing species and ecosystem processes due to rapid environmental change. We integrate two components of vulnerability, EXPOSURE and ADAPTIVE CAPACITY, to arrive at a single measure. Areas most at risk are those likely to experience big changes in temperature and precipitation (i.e., high exposure) but have little capacity to adapt (i.e., low adaptive capacity). To understand how the climate of Prince William Forest Park is changing over time, we analyzed temperature and precipitation over two time periods: observed (1981 – 2014) and near future (through 2040), compared to a mid-century baseline (1948 – 1980). The results presented here are part of a broader regional assessment of vulnerability for 11 NCR parks and the surrounding National Capital Region, interpreted in the context of regional environmental change in the Mid-Atlantic. Our approach describes drivers of climate change vulnerability, how vulnerability is spatially distributed, and a framework for park managers to anticipate and address changes in the coming decades. PLANNING FOR CHANGE
Transcript of Prince William Forest Park Terrestrial Climate Change ...

Prince William Forest Park
September 23, 2019 P. 1CLIMATE CHANGE VULNERABILITY OF TERRESTRIAL AREAS - PRINCE WILLIAM FOREST PARK
National Park ServiceU.S. Department of the Interior
National Capital RegionNatural Resources and Science
Climate Change Vulnerability of Terrestrial Areas: Prince William Forest Park
Located in a zone of ecological transition, near where three physiographic provinces meet, Prince William Forest Park (PRWI), supports a diversity of natural communities. As a protected area within a landscape heavily pressured by development, the park provides opportunities for ecological adaptation in the face of environmental change. However, as global temperatures rise and precipitation patterns become more extreme (Intergovernmental Panel for Climate Change (IPCC) 2013), the natural habitats (see glossary, page 9, for definition of italicized words) of Prince William Forest Park are increasingly vulnerable to climate-driven stresses. To begin to understand how climate change will impact terrestrial habitats in the National Capital Region (NCR), the National Park Service partnered with NatureServe to conduct climate change vulnerability assessments. This initial assessment for Prince William Forest Park examines how climate and landscape influence vulnerability and identify areas most and least vulnerable today and in the near future. Our goal is to help park managers and visitors an understand levels of vulnerability and support the development of informed management strategies.
VULNERABILITY Describes whether the ecological condition of a region or habitat is at risk from climate change impacts.
EXPOSURE Describes the nature and magnitude of changes in temperature and precipitation by comparing a given time period against a historical baseline.
ADAPTIVE CAPACITY Describes the ability of a region or habitat to maintain species and ecological processes as climate changes. Adaptive capacity at a specific location considers the area’s unique physical features and its connectivity to other natural areas.
IMPORTANT TERMSVirginia
PRINCE WILLIAM FOREST PARK is located in the southeastern portion of the NCR, adjacent to Marine Corps Base Quantico. We consider the implications of climate change for the park within the context of the NCR surrounding area and the Mid-Atlantic region.
WHAT IS CLIMATE CHANGE VULNERABILITY?We define VULNERABILITY as the risk of losing species and ecosystem processes due to rapid environmental change. We integrate two components of vulnerability, EXPOSURE and ADAPTIVE CAPACITY, to arrive at a single measure. Areas most at risk are those likely to experience big changes in temperature and precipitation (i.e., high exposure) but have little capacity to adapt (i.e., low adaptive capacity). To understand how the climate of Prince William Forest Park is changing over time, we analyzed temperature and precipitation over two time periods: observed (1981 – 2014) and near future (through 2040), compared to a mid-century baseline (1948 – 1980). The results presented here are part of a broader regional assessment of vulnerability for 11 NCR parks and the surrounding National Capital Region, interpreted in the context of regional environmental change in the Mid-Atlantic. Our approach describes drivers of climate change vulnerability, how vulnerability is spatially distributed, and a framework for park managers to anticipate and address changes in the coming decades.
PLANNING FOR CHANGE

September 23, 2019 P. 2CLIMATE CHANGE VULNERABILITY OF TERRESTRIAL AREAS - PRINCE WILLIAM FOREST PARK
HOW VULNERABLE IS PRINCE WILLIAM FOREST PARK?
MANASSAS NATIONAL BAT TLEF IELD PARK
NATIONAL CAPITAL
PARKS - EAST
GEORGE WASHINGTON
MEMORIAL PARKWAY
No
rth
ern
Pie
dm
on
t
Pie
dm
on
t
Sout
heas
tern
Pla
ins
Potom
ac Riv
er
PR INCE WILL IAM FOREST PARK
PRINCE WILLIAM FOREST PARK IN CONTEXT. The Southeastern Plains (pink) and Piedmont (blue) ecoregions meet within PRWI, and the park is not far from the Northern Piedmont (yellow). Areas of natural vegetation cover are represented by darker shading on the map.
Prince William Forest Park is located in northern Virginia, within a highly urbanized and rapidly growing area of the Mid-Atlantic, but an area that also supports high levels of biodiversity. Two ecoregions, the Piedmont and Southeastern Plains (i.e., Coastal Plain), come together within the park, and a third, the Northern Piedmont, is located to the west. These ecoregions, which represent provinces of unique physiography, soils, climate, and vegetation, together contain a diversity of natural communities. As the climate changes, the park can play an important role as part of a network of refugia and stepping stones, connecting natural communities and providing opportunities for adaptation. To better understand how management actions can protect park resources and enhance the ecological role of the park in a changing world, we first assess the overall VULNERABILTY of terrestrial habitats at Prince William Forest Park by combining measurements of EXPOSURE and ADAPTIVE CAPACITY. Next, we characterize the drivers of EXPOSURE (changes in temperature and precipitation) and ADAPTIVE CAPACITY (landscape characteristics).
Research Highlights During the observed time period (1981 – 2014), we find vulnerability is low for most of Prince William Forest Park reflecting low to moderate climate change exposure for most of the area. Differences in vulnerability are primarily driven by differences in adaptive capacity across the landscape. Because of the park’s enduring features, and connectivity to other natural areas, adaptive capacity is average to above average for much of the park, particularly when compared to the region as a whole. In the near future (through 2040), vulnerability is moderate to high for the park due to a sharp increase in exposure, though not as high as in portions of the surrounding area. Increased exposure is expected to lead to species turnover, but as a result of high adaptive capacity, the park is expected to continue to support robust communities of diverse plants and animals into the future especially if connectivity to other natural lands is maintained.
Observed Climate Change Vulnerability(1981 – 2014)
70% 27% 3%
80% 20%<1%
NCR surrounding area
Prince William Forest Park
OBSERVED VULNERABILITY. Vulnerability is low (blue) for 80% of PRWI. Less than 1% of the park has high vulnerability (orange), and there are no areas of very high vulnerability (red). Higher vulnerability occurs where adaptive capacity, especially connectivity, is low, such as in areas along roads or near adjacent urban expansion.
Near Future Climate Change Vulnerability (through 2040)
40% 60% <1%
14% 60% 25%
NCR surrounding area
Prince William Forest Park
NEAR FUTURE VULNERABILITY. In the future, vulnerability increases dramatically due to increased exposure, with moderate to high values (yellow and orange) recorded for PRWI. However, high adaptive capacity means PRWI is less vulnerable than the NCR surrounding area. Less than 1% of the park has very high vulnerability (red).
LOW
MODERATE
HIGH
VERY HIGH
VULNERABILITY SCORE

September 23, 2019 P. 3CLIMATE CHANGE VULNERABILITY OF TERRESTRIAL AREAS - PRINCE WILLIAM FOREST PARK
Exposure
COMPONENTS OF VULNERABILITY
To understand how global climate change impacts Prince William Forest Park, we analyze EXPOSURE, defined as the nature and magnitude of changes in temperature and precipitation patterns. Analyses of annual and seasonal climate data reveal that the park is already experiencing climate change and indicate that park managers can anticipate significantly more change in the near future.EXPOSURE is measured by analyzing annual and seasonal changes in temperature and precipitation over three time periods. We first characterize a mid-20th century baseline (1948 – 1980) and quantify its natural variability. We compare observed climate (1981 – 2014), and near future climate (through 2040) to baseline conditions and measure the changes. Baseline and observed climate data is derived from weather station measurements, which reduces uncertainty. Near future projections are derived from an ensemble of 15 global climate models from the IPCC 5th Assessment Report (Taylor et al. 2012, IPCC 2013). Full methods will be documented in a technical report available on the NPS IRMA portal after project completion.
SIGNIFICANCE OF CHANGE
warmer
no changelow
high
Near Future Change
Baseline Mean Temperature
+0.7°C
+0.7°C
+0.8°C
+1.6°C
+ 1.9°C
+1.4°C
(+1.3°F )
(+1.3°F)
(+1.4°F)
(+2.9°F )
(+3.4°F)
(+2.5°F )
12.9°C
(55.2°F)
(73.8°F)
2.1°C
(35.8°F)
23.2°C
Observed Change
Annual
Summer(warmest/wettest quarters)
Winter(coldest/driest quarters)
CHANGES IN TEMPERATURE. Between the baseline and observed periods, an annual temperature increase of 0.7°C (1.3°F) has already occurred at PRWI, pushing the mean observed temperature up to 13.6°C (56.5°F). Continued increases are expected in the near future, especially in summer where the average temperature is nearly 2°C (3.4°F) higher than that of the baseline. These increases in near future temperature are a statistically significant departure from baseline conditions, as indicated by greater saturation in color (dark red).
SIGNIFICANCE OF CHANGE
wetter
drier
high
high
low
+31.6 mm
+15.6 mm
+7.9 mm
+38.7 mm
-76.7 mm
+77.1 mm
(+1.2 in)
(+0.6 in)
(+0.3 in)
(+1.5 in)
(-3.0 in)
(+3.0 in)
1034 mm
(40.7 in)
374 mm
(14.7 in)
153 mm
(6.0 in)
Near Future Change
Baseline Total Precipitation
Observed Change
CHANGES IN PRECIPITATION. In the observed period, slight increases in precipitation were recorded across seasons. In the near future, that pattern is projected to change with decreases in precipitation for the wettest quarter (summer) and increases for the driest (winter). Greater saturation in color represents values that are more statistically significant. The most notable change is the near future increase of 3 inches in winter precipitation which represents a statistically significant departure from baseline conditions.
Research Highlights
At Prince William Forest Park, temperatures in the observed period (green) already show evidence of warming when compared to the baseline (blue). Modest increases in both summer and winter precipitation are detected.
In the near future (purple), we anticipate dramatic shifts to warmer and drier summers and warmer and wetter winters. Models indicate that by 2040, precipitation may decrease by 20% in the summer as temperatures rise 2°C (3.4°F). In the winter, precipitation is forecast to increase by nearly 50% while temperatures rise 1.4°C (3.1°F).
Baseline (1948 – 1980) Observed (1981 – 2014) Near Future (through 2040)
Prec
ip o
f W
ette
st Q
uar
ter
(mm
)
Temp of Warmest Quarter (ºC)
Summer
Temp of Coldest Quarter (ºC)
Prec
ip o
f D
ries
t Q
uar
ter
(mm
)
Winter
SEASONAL TEMPERATURE AND PRECIPITATION PATTERNS. Each dot represents the 30-year average for a 1 km2 area within PRWI and the immediate surroundings.

September 23, 2019 P. 4CLIMATE CHANGE VULNERABILITY OF TERRESTRIAL AREAS - PRINCE WILLIAM FOREST PARK
Exposure
COMPONENTS OF VULNERABILITY
The Magnitude of Change
The magnitude of change refers to how much EXPOSURE Prince William Forest Park has experienced in recent decades and how much is projected for the near future. By comparing the climate in the observed (1981 – 2014) time period to the historical variability in the baseline (1948 – 1980), we can understand whether temperature and precipitation patterns today are typical of the range of conditions experienced in the past. Temperature and precipitation values falling completely outside their historical range would indicate novel climatic conditions, to which ecosystems may not be adapted. The projected climate of the near future is assessed against the baseline in the same way. Analyzing and mapping EXPOSURE gives managers an understanding of the nature and magnitude of climate change, how it may vary across the landscape, and how exposure contributes to overall vulnerability.
BaselineHistorical Variability Observed ClimateTem
per
atu
re o
f th
e W
arm
est
Qu
arte
r
MEASURING THE MAGNITUDE OF CHANGE. The summer temperature for PRWI has increased since the mid-century baseline. The average temperature for the observed period (solid red line) is higher than recorded average annual temperatures (dots) for almost all years in the baseline, falling nearly outside the range of historical variability (shaded gray bar). The average summer temperature for the near future is projected to be over 25.1°C (not shown), and does fall completely outside the range of historical variability.
Year
Research Highlights
There is already evidence of changing climate in parts of the Mid-Atlantic region (pink), though observed climate averages do not fall completely outside the range of variation experienced in the past. Temperatures in the observed period have risen, but precipitation patterns are close to historical norms, and overall exposure for Prince William Forest Park is relatively low (purple). In the near future, the Mid-Atlantic region and Prince William Forest Park rapidly move towards high levels of exposure and novel climate conditions (yellow). The near future overall exposure score of 0.20 for the near future indicates that by 2040, conditions at the park are likely to be more extreme than in 80% of the baseline years. Extreme temperatures are the primary driver of the exposure score, though shifts in precipitation towards drier summers and wetter winters also contribute.
Observed Exposure (1981 – 2014)
Near Future Exposure(through 2040)
Value
lTypica Novel
PRWI observed
1 0.8
PRWI near future
0.6 0.4 0.2 0

September 23, 2019 P. 5CLIMATE CHANGE VULNERABILITY OF TERRESTRIAL AREAS - PRINCE WILLIAM FOREST PARK
Adaptive Capacity
COMPONENTS OF VULNERABILITY
Adaptive Capacity is the ability of a region or habitat to maintain species and ecological processes as the climate changes. In this study, we focus on two key characteristics of adaptive capacity, LANDSCAPE DIVERSITY and LOCAL CONNECTEDNESS (Anderson et al. 2016), to assess Prince William Forest Park and the terrestrial habitats within it. We identify places that are more or less resilient to the disturbances associated with climate change to help park managers develop informed adaptation strategies.
30%
24%
29%
9%
2%5%FAR ABOVE AVERAGE
SLIGHTLY BELOW AVERAGE
DEVELOPED
BELOW AVERAGE
FAR BELOW AVERAGE
ABOVE AVERAGE
SLIGHTLY ABOVE AVERAGE
AVERAGE
ADAPTIVE CAPACITY CATEGORIES
ADAPTIVE CAPACITY AT PRWI. On balance, adaptive capacity at PRWI is average to above average when compared to similar settings in the region. Areas of higher adaptive capacity are found where the connectivity of natural habitats is high, including along creeks and in backcountry areas. Lower adaptive capacity is found in areas with lower landscape diversity and below average connectivity, including the Taylor Farm site and areas bordering major roads.
Landscape Diversity
Areas with high LANDSCAPE DIVERSITY contain a range of physical conditions and habitats that can support species as they adapt to a changing climate. Within a geophysical setting, landscape diversity is scored highest if there is a diversity of landforms or enduring features (e.g., high ridges, steep slopes, coves, river floodplains), wide ranges in elevation, and a range of soil types.
Percent of area within adaptive capacity category
0 20 40 60 80 100
Dry Oak-Pine Forest 20%
Dry Oak-Pine Forest and Woodland 9%
Coastal Plain Stream and River 3%Coastal Plain Hardwood Forest <1%
Hemlock-Northern Hardwood Forest <1%Basin Swamp and Wet Hardwood Forest <1%
Upland Depression Swamp <1%
Mesic Hardwood Forest 40%
LANDSCAPE DIVERSITY BY ECOLOGICAL SYSTEM. For the ecological systems occurring at PRWI, we show the proportion of area in each of 8 adaptive capacity categories based on landscape diversity. Dark colors indicate higher landscape diversity and thus higher adaptive capacity. Taller bars designate ecological systems that occupy a greater percentage of the park. Some of the more uncommon ecological systems (shortest bars) have the highest landscape diversity. Coastal Plain Hardwood Forest and Hemlock-Northern Hardwood Forest each occupy less than 1% of the park but have landscape diversity that is far above average (dark purple).
Research Highlights
Landscape diversity is average to above average for most of Prince William Forest Park. While the Piedmont and Coastal Plain regions provide relatively little variety in topographic features, the low hills and narrow stream valleys present at the park provide more microhabitat variation than is found in similar geophysical settings elsewhere.

September 23, 2019 P. 6CLIMATE CHANGE VULNERABILITY OF TERRESTRIAL AREAS - PRINCE WILLIAM FOREST PARK
Adaptive Capacity
COMPONENTS OF VULNERABILITY
Local Connectedness
LOCAL CONNECTEDNESS measures the degree to which current land cover patterns (e.g., agriculture, forest, wetlands) are likely to support important ecological processes and the movement and dispersal of species. When natural areas are connected, opportunities are present for climate change adaptation, and vulnerability is reduced.
Dry Oak-Pine Forest 20%
Dry Oak-Pine Forest and Woodland 9%
Coastal Plain Stream and River 3%Coastal Plain Hardwood Forest <1%
Hemlock-Northern Hardwood Forest <1%Basin Swamp and Wet Hardwood Forest <1%
Upland Depression Swamp <1%
Mesic Hardwood Forest 40%
0 20 40 60 80 100
FAR ABOVE AVERAGE
SLIGHTLY BELOW AVERAGE
DEVELOPED
BELOW AVERAGE
FAR BELOW AVERAGE
ABOVE AVERAGE
SLIGHTLY ABOVE AVERAGE
AVERAGE
ADAPTIVE CAPACITY CATEGORIES
Percent of area within adaptive capacity category
LOCAL CONNECTEDNESS BY ECOLOGICAL SYSTEM. For the ecological systems occurring at PRWI, we show the proportion of area in each category of adaptive capacity based on local connectedness. Dark colors indicate higher connectivity and thus higher adaptive capacity. Taller bars designate ecological systems that occupy a greater percentage of the park. Connectivity is mostly above average (blue to purple) for all systems except Upland Depression Swamp, which comprises less than 1% of the park. Mesic Hardwood Forest is the most extensive ecological system at PRWI, occupying 40% of the park, and has above or far above average adaptive capacity over 60% of its distribution.
Research HighlightsLocal connectedness is the biggest driver of high adaptive capacity at Prince William Forest Park. Vegetation along creeks provides terrestrial corridors for species movement, and backcountry areas are not divided by major roads. To the south, nearly 50,000 undeveloped acres of forest and wetland at Marine Corps Base Quantico provide connections between the park and other natural areas.
A creek cuts through the Chopawamsic backcountry area, an area characterized by high local connectedness and high adaptive capacity. Prince William Forest Park, National Park Service.
September 23, 2019 P. 7CLIMATE CHANGE VULNERABILITY OF TERRESTRIAL AREAS - PRINCE WILLIAM FOREST PARK
PATTERNS OF VULNERABILITYLocal Trends
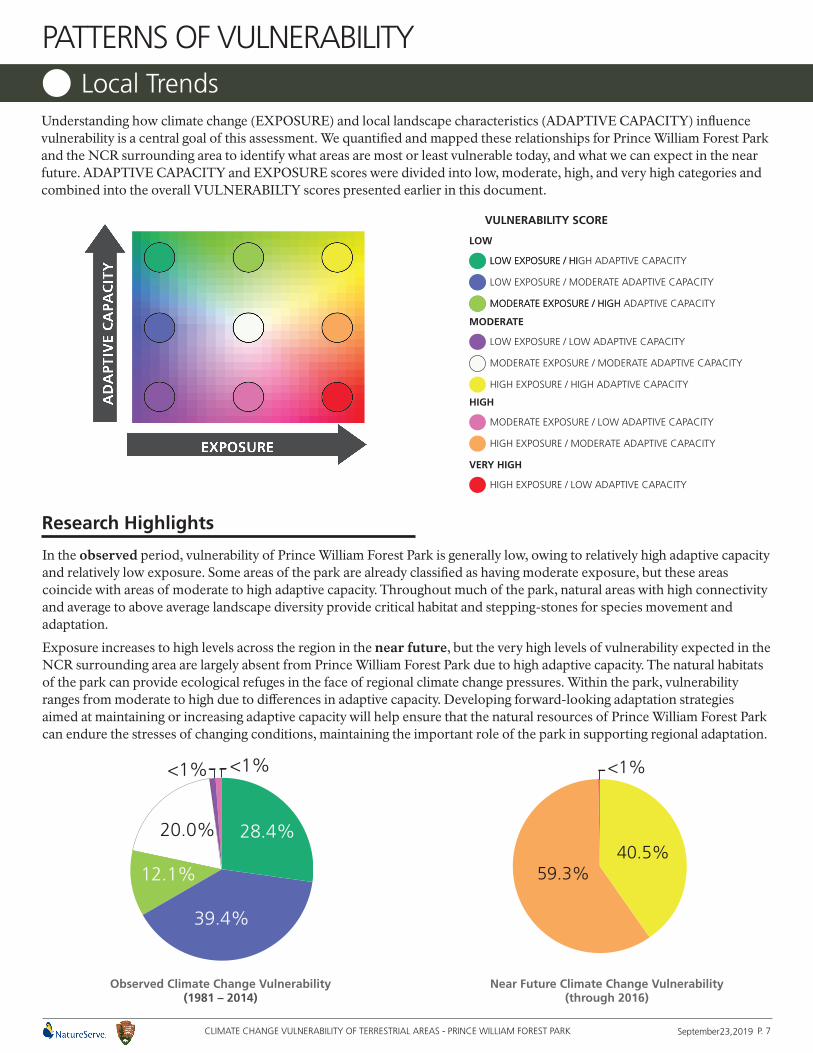
Understanding how climate change (EXPOSURE) and local landscape characteristics (ADAPTIVE CAPACITY) influence vulnerability is a central goal of this assessment. We quantified and mapped these relationships for Prince William Forest Park and the NCR surrounding area to identify what areas are most or least vulnerable today, and what we can expect in the near future. ADAPTIVE CAPACITY and EXPOSURE scores were divided into low, moderate, high, and very high categories and combined into the overall VULNERABILTY scores presented earlier in this document.
MODERATE
LOW EXPOSURE / LOW ADAPTIVE CAPACITY
HIGH EXPOSURE / HIGH ADAPTIVE CAPACITY
MODERATE EXPOSURE / MODERATE ADAPTIVE CAPACITY
LOW
LOW EXPOSURE / HIGH ADAPTIVE CAPACITY
MODERATE EXPOSURE / HIGH ADAPTIVE CAPACITY
LOW EXPOSURE / MODERATE ADAPTIVE CAPACITY
LOW EXPOSURE / HI
MODERATE EXPOSURE / HIGH
HIGH
MODERATE EXPOSURE / LOW ADAPTIVE CAPACITY
HIGH EXPOSURE / MODERATE ADAPTIVE CAPACITY
VULNERABILITY SCORE
VERY HIGH
HIGH EXPOSURE / LOW ADAPTIVE CAPACITY
Research Highlights
In the observed period, vulnerability of Prince William Forest Park is generally low, owing to relatively high adaptive capacity and relatively low exposure. Some areas of the park are already classified as having moderate exposure, but these areas coincide with areas of moderate to high adaptive capacity. Throughout much of the park, natural areas with high connectivity and average to above average landscape diversity provide critical habitat and stepping-stones for species movement and adaptation.
Exposure increases to high levels across the region in the near future, but the very high levels of vulnerability expected in the NCR surrounding area are largely absent from Prince William Forest Park due to high adaptive capacity. The natural habitats of the park can provide ecological refuges in the face of regional climate change pressures. Within the park, vulnerability ranges from moderate to high due to differences in adaptive capacity. Developing forward-looking adaptation strategies aimed at maintaining or increasing adaptive capacity will help ensure that the natural resources of Prince William Forest Park can endure the stresses of changing conditions, maintaining the important role of the park in supporting regional adaptation.
<1%
39.4%
28.4%20.0%
12.1%
<1%
Observed Climate Change Vulnerability (1981 – 2014)
Near Future Climate Change Vulnerability(through 2016)
<1%
40.5%59.3%
September 23, 2019 P. 8CLIMATE CHANGE VULNERABILITY OF TERRESTRIAL AREAS - PRINCE WILLIAM FOREST PARK
WHAT WE CAN DORecommendations & Management Strategies
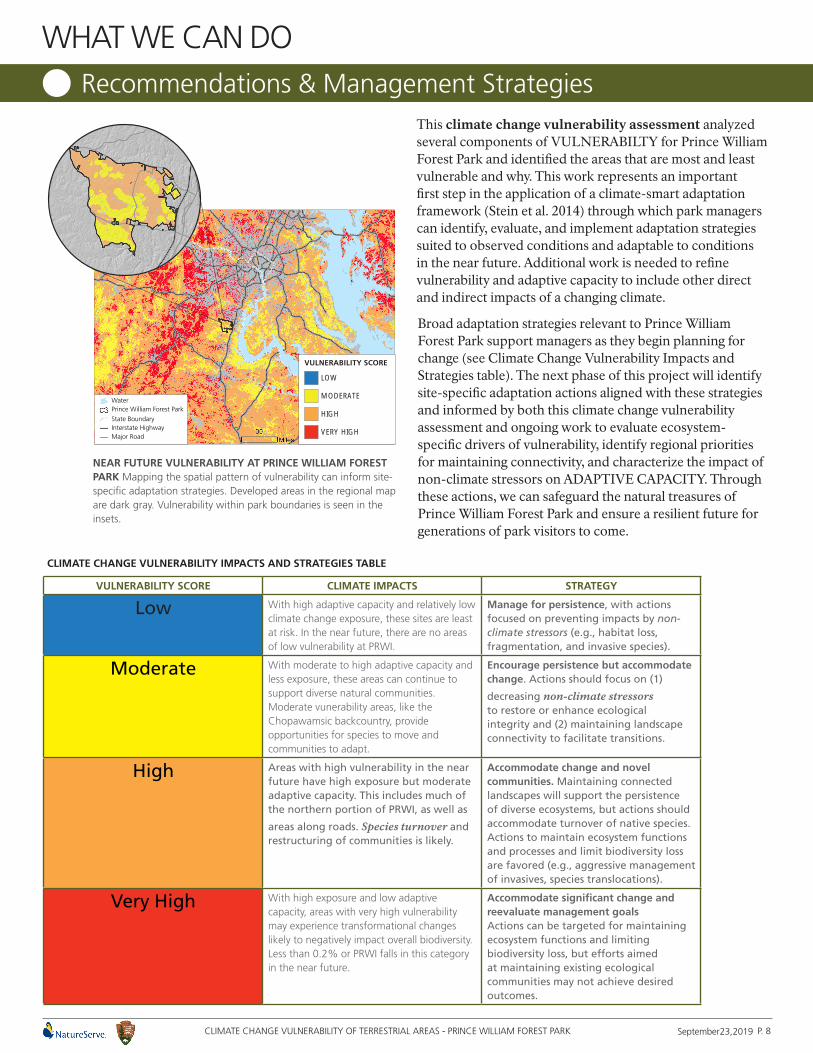
This climate change vulnerability assessment analyzed several components of VULNERABILTY for Prince William Forest Park and identified the areas that are most and least vulnerable and why. This work represents an important first step in the application of a climate-smart adaptation framework (Stein et al. 2014) through which park managers can identify, evaluate, and implement adaptation strategies suited to observed conditions and adaptable to conditions in the near future. Additional work is needed to refine vulnerability and adaptive capacity to include other direct and indirect impacts of a changing climate.
Broad adaptation strategies relevant to Prince William Forest Park support managers as they begin planning for change (see Climate Change Vulnerability Impacts and Strategies table). The next phase of this project will identify site-specific adaptation actions aligned with these strategies and informed by both this climate change vulnerability assessment and ongoing work to evaluate ecosystem-specific drivers of vulnerability, identify regional priorities for maintaining connectivity, and characterize the impact of non-climate stressors on ADAPTIVE CAPACITY. Through these actions, we can safeguard the natural treasures of Prince William Forest Park and ensure a resilient future for generations of park visitors to come.
WaterPrince William Forest Park
State BoundaryInterstate HighwayMajor Road
LOW
MODERATE
HIGH
VERY HIGH
VULNERABILITY SCORE
NEAR FUTURE VULNERABILITY AT PRINCE WILLIAM FOREST PARK Mapping the spatial pattern of vulnerability can inform site-specific adaptation strategies. Developed areas in the regional map are dark gray. Vulnerability within park boundaries is seen in the insets.
CLIMATE CHANGE VULNERABILITY IMPACTS AND STRATEGIES TABLE
VULNERABILITY SCORE CLIMATE IMPACTS STRATEGY
Low With high adaptive capacity and relatively low climate change exposure, these sites are least at risk. In the near future, there are no areas of low vulnerability at PRWI.
Manage for persistence, with actions focused on preventing impacts by non-climate stressors (e.g., habitat loss, fragmentation, and invasive species).
Moderate With moderate to high adaptive capacity and less exposure, these areas can continue to support diverse natural communities.Moderate vunerability areas, like the Chopawamsic backcountry, provide opportunities for species to move and communities to adapt.
Encourage persistence but accommodate change. Actions should focus on (1)
decreasing non-climate stressors to restore or enhance ecological integrity and (2) maintaining landscape connectivity to facilitate transitions.
High Areas with high vulnerability in the near future have high exposure but moderate adaptive capacity. This includes much of the northern portion of PRWI, as well as
areas along roads. Species turnover and restructuring of communities is likely.
Accommodate change and novel communities. Maintaining connected landscapes will support the persistence of diverse ecosystems, but actions should accommodate turnover of native species. Actions to maintain ecosystem functions and processes and limit biodiversity loss are favored (e.g., aggressive management of invasives, species translocations).
Very High With high exposure and low adaptive capacity, areas with very high vulnerability may experience transformational changes likely to negatively impact overall biodiversity. Less than 0.2% or PRWI falls in this category in the near future.
Accommodate significant change and reevaluate management goals Actions can be targeted for maintaining ecosystem functions and limiting biodiversity loss, but efforts aimed at maintaining existing ecological communities may not achieve desired outcomes.
September 23, 2019 P. 9CLIMATE CHANGE VULNERABILITY OF TERRESTRIAL AREAS - PRINCE WILLIAM FOREST PARK
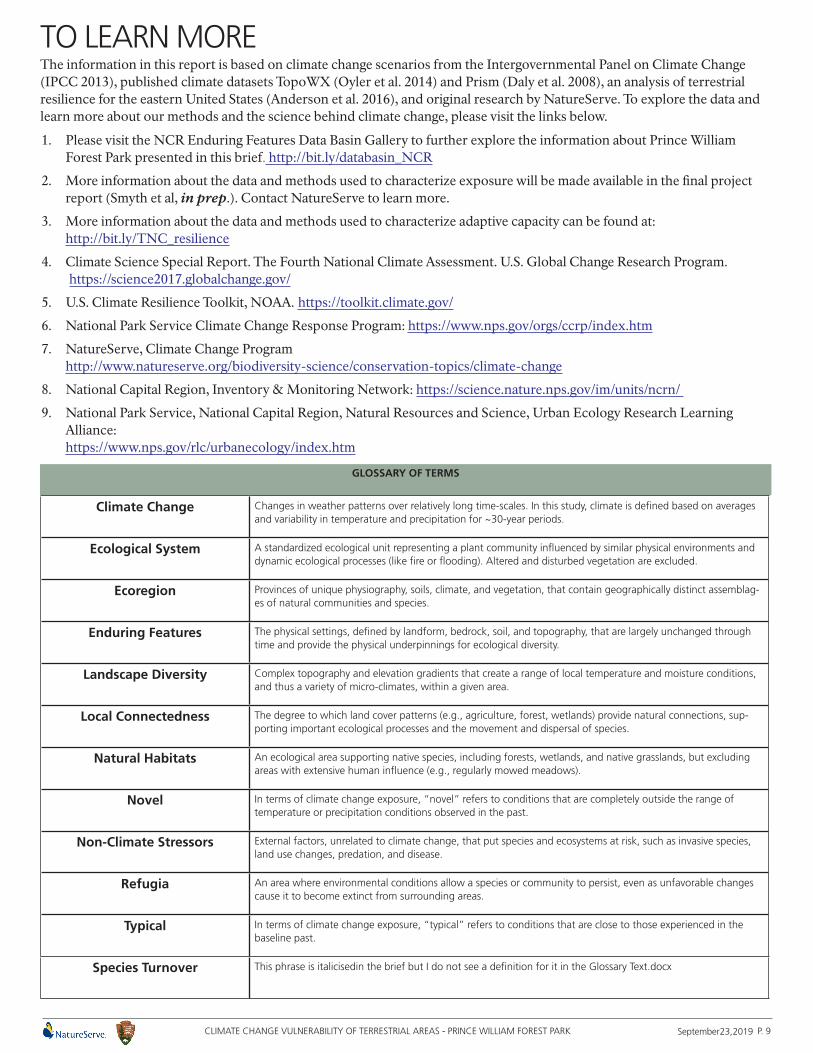
TO LEARN MOREThe information in this report is based on climate change scenarios from the Intergovernmental Panel on Climate Change (IPCC 2013), published climate datasets TopoWX (Oyler et al. 2014) and Prism (Daly et al. 2008), an analysis of terrestrial resilience for the eastern United States (Anderson et al. 2016), and original research by NatureServe. To explore the data and learn more about our methods and the science behind climate change, please visit the links below.
1. Please visit the NCR Enduring Features Data Basin Gallery to further explore the information about Prince William Forest Park presented in this brief. http://bit.ly/databasin_NCR
2. More information about the data and methods used to characterize exposure will be made available in the final project report (Smyth et al, in prep.). Contact NatureServe to learn more.
3. More information about the data and methods used to characterize adaptive capacity can be found at: http://bit.ly/TNC_resilience
4. Climate Science Special Report. The Fourth National Climate Assessment. U.S. Global Change Research Program. https://science2017.globalchange.gov/
5. U.S. Climate Resilience Toolkit, NOAA. https://toolkit.climate.gov/
6. National Park Service Climate Change Response Program: https://www.nps.gov/orgs/ccrp/index.htm
7. NatureServe, Climate Change Program http://www.natureserve.org/biodiversity-science/conservation-topics/climate-change
8. National Capital Region, Inventory & Monitoring Network: https://science.nature.nps.gov/im/units/ncrn/
9. National Park Service, National Capital Region, Natural Resources and Science, Urban Ecology Research Learning Alliance: https://www.nps.gov/rlc/urbanecology/index.htm
GLOSSARY OF TERMS
Climate Change Changes in weather patterns over relatively long time-scales. In this study, climate is defined based on averages and variability in temperature and precipitation for ~30-year periods.
Ecological System A standardized ecological unit representing a plant community influenced by similar physical environments and dynamic ecological processes (like fire or flooding). Altered and disturbed vegetation are excluded.
Ecoregion Provinces of unique physiography, soils, climate, and vegetation, that contain geographically distinct assemblag-es of natural communities and species.
Enduring Features The physical settings, defined by landform, bedrock, soil, and topography, that are largely unchanged through time and provide the physical underpinnings for ecological diversity.
Landscape Diversity Complex topography and elevation gradients that create a range of local temperature and moisture conditions, and thus a variety of micro-climates, within a given area.
Local Connectedness The degree to which land cover patterns (e.g., agriculture, forest, wetlands) provide natural connections, sup-porting important ecological processes and the movement and dispersal of species.
Natural Habitats An ecological area supporting native species, including forests, wetlands, and native grasslands, but excluding areas with extensive human influence (e.g., regularly mowed meadows).
Novel In terms of climate change exposure, “novel” refers to conditions that are completely outside the range of temperature or precipitation conditions observed in the past.
Non-Climate Stressors External factors, unrelated to climate change, that put species and ecosystems at risk, such as invasive species, land use changes, predation, and disease.
Refugia An area where environmental conditions allow a species or community to persist, even as unfavorable changes cause it to become extinct from surrounding areas.
Typical In terms of climate change exposure, “typical” refers to conditions that are close to those experienced in the baseline past.
Species Turnover This phrase is italicisedin the brief but I do not see a definition for it in the Glossary Text.docx

September 23, 2019P. 10CLIMATE CHANGE VULNERABILITY OF TERRESTRIAL AREAS - PRINCE WILLIAM FOREST PARK
REFERENCES1. IPCC, 2013: Climate Change 2013: The Physical Science Basis. Contribution of Working Group I to the Fifth Assessment
Report of the Intergovernmental Panel on Climate Change [Stocker, T.F., D. Qin, G.-K. Plattner, M. Tignor, S.K. Allen, J. Boschung, A. Nauels, Y. Xia, V. Bex and P.M. Midgley (eds.)]. Cambridge University Press, Cambridge, United Kingdom and New York, NY, USA, 1535 pp.
2. Smyth, R.L., D. Pavek, S. Auer, J Teague, and A. Kenlan. In preparation. Climate Change Adaptation Planning of Enduring Features; Terrestrial Habitats of the National Capital Region. Natural Resource Report. NPS/NCCN/NRDS—xxxx/xxxx National Park Service. Fort Collins, Colorado
3. Taylor, K. E., R.J. Stouffer, and G.A. Meehl. 2012. An overview of CMIP5 and the experiment design. Bulletin of the American Meteorological Society, 93(4), 485-498.
4. Anderson, M.G., A. Barnett, M. Clark, C. Ferree, A. Olivero Sheldon, and J. Prince. 2016. Resilient Sites for Terrestrial Conservation in Eastern North America. The Nature Conservancy, Eastern Conservation Science.
5. Stein, B.A., P. Glick, N. Edelson, and A. Staudt (eds.). 2014. Climate-Smart Conservation: Putting Adaptation Principles into Practice. National Wildlife Federation, Washington, D.C. www.nwf.org/ClimateSmartGuide
6. Daly, C., M. Halbleib, J.I. Smith, W.P. Gibson, M.K. Doggett, G.H. Taylor, J. Curtis, and P.P. Pasteris. 2008. Physiographically sensitive mapping of climatological temperature and precipitation across the conterminous United States. International journal of climatology, 28(15), pp.2031-2064.
7. Oyler, J.W., A. Ballantyne, K. Jencso, M. Sweet, and S.W. Running. 2014. Creating a topoclimatic daily air temperature dataset for the conterminous United States using homogenized station data and remotely sensed land skin temperature. International Journal of Climatology, http://dx.doi.org/10.1002/joc.4127.
Produced by NatureServe for the National Capital Region with the support of the National Park Service Climate Change Response Program. Special thanks for reviews by the National Park Service.
Suggested citation: Smyth, Regan, Judy Teague, Stephanie Auer, Allison Kenlan, and Healy Hamilton, 2017. Climate Change Vulnerability of Terrestrial Areas, Prince William Forest Park. Unpublished Resource Brief, Department of the Interior, National Park Service. 10 p.
Acknowledgments