Primer on energy efficiency for Water and Wastewater Treatment · Energy Required to Produce Clean...
34
Click To Edit Master Title Style Primer on Energy Efficiency for Water and Wastewater Treatment Quarterly Webinar # 3 March 24, 2016
Transcript of Primer on energy efficiency for Water and Wastewater Treatment · Energy Required to Produce Clean...

Click To Edit Master
Title Style
Primer on Energy
Efficiency for Water and
Wastewater Treatment
Quarterly Webinar # 3
March 24, 2016

Welcome/Introductions
Water-Energy Nexus/Current State of Industry
Energy Intensity
Potable Water Sector
Wastewater Treatment
Performance Opportunities
Case studies
Conclusion
Agenda

Water-Energy Nexus

Water/Wastewater Treatment - Energy
Significance!
Small fraction of National
Electrical Use:
Large fraction of Municipal
Electrical Use:

Why Water & Energy Efficiency
1. Resource uncertainty Increasing variability of energy costs
Drought conditions in different parts of the U.S.
2. Water / wastewater industry developments
Vintageness & condition of water/wastewater infrastructure
Population & economic growth adds to demand
More stringent water quality regulations
3. Sustainability Viability of infrastructure
Keep operating costs under control
Be ready for more stringent regulations
4. Benefits Prevent/forestall rate hikes
Improve public image
Use energy cost savings internally

Barriers to Energy Efficiency
Water/Wastewater Sector Culture of focusing on primary mission (water quality, service)
Skepticism of energy savings, permit jeopardy, lack of EE knowledge
Funding for EE assessment/training services
Technologies Existing technologies have uneven adoption rates
New/advanced technologies not always accepted by regulators
Difficulty assessing energy consumption/performance
Financing Many energy utility incentives do not apply to water/wastewater
agencies
Water/wastewater agencies not always aware of funding sources

Energy Intensity
[1] Electric Power Research Institute (EPRI). Water & Sustainability (Volume 4): U.S. Electricity
Consumption for the Water Supply & Treatment–The Next Half Century. Topical Report1006787. Palo
Alto, CA: EPRI, March 2002.
1.4
1.82
2.35 - 3.3
3.79 - 9.46
9.77 - 32.18
Energy Required to Produce Clean Water
Lake or River
Groundwater
Wastewater Treatment
Wastewater Reuse
Desalination
kWh/1000 gallons
Source/Process
Energy among top 3 costs of water/wastewater treatment
agencies (around 35% of municipal energy use)
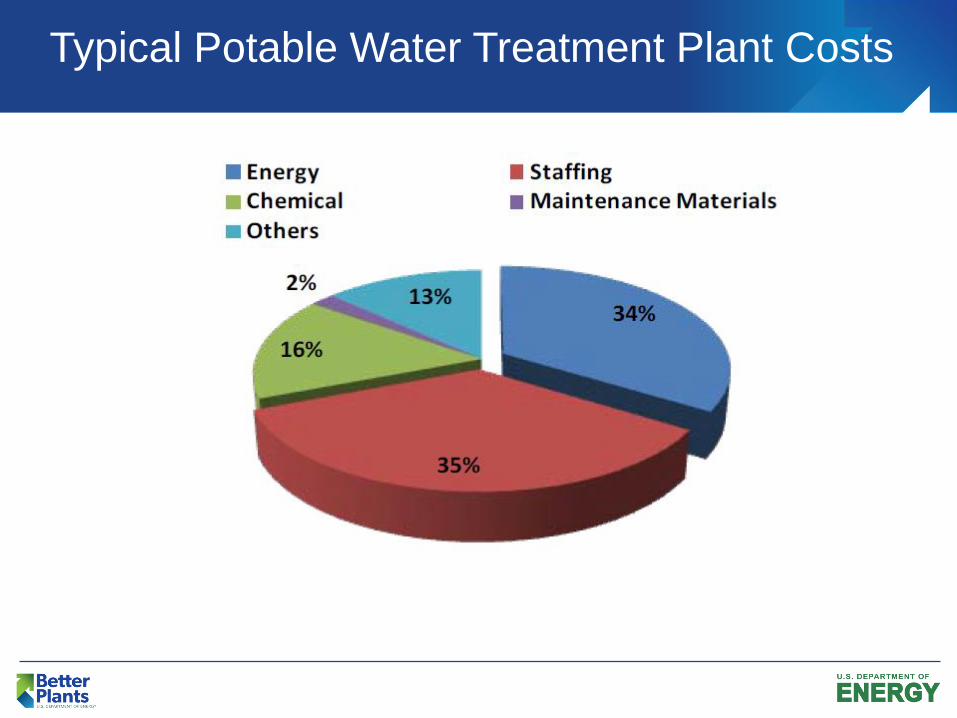
Typical Potable Water Treatment Plant Costs

Example: Leaks in Water Delivery System
• Whenever water is lost to leaks, the energy
and cost of energy embodied in that water
is also lost
• Many distribution systems around the world
are leaky
– Industrialized countries: Where infrastructure is old
– In the U.S. 35 water utilities had 15% leakage rate in 2003
– In developing countries leakage rates can be as much as 50%
• Often water conservation focuses on end-users (homes,
businesses)
• Water and energy efficiency in the water supply
infrastructure can yield important water and energy savings
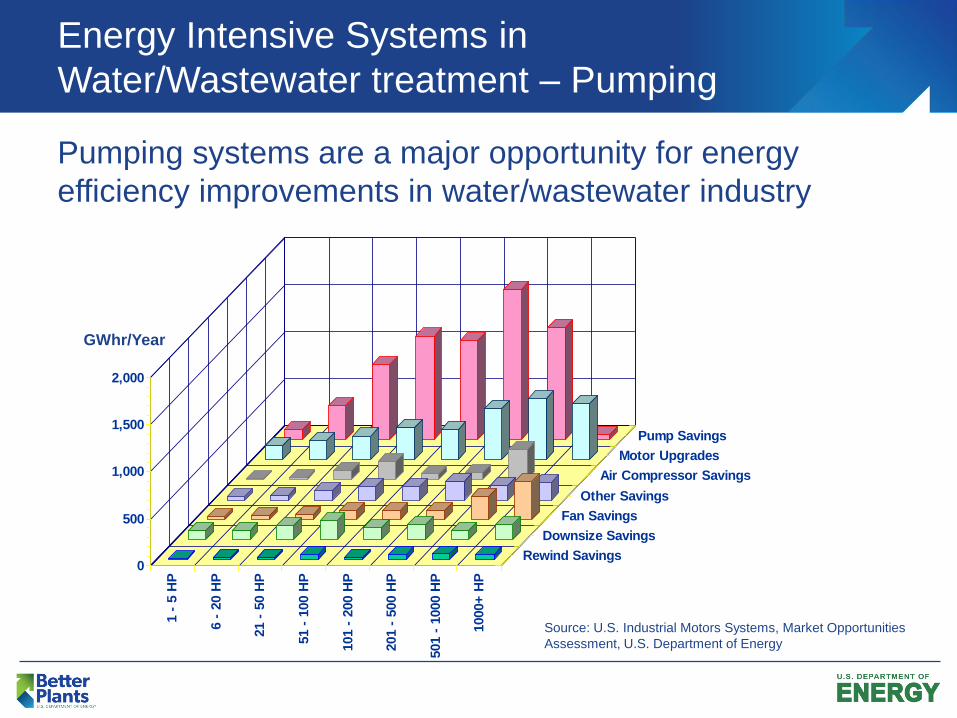
Energy Intensive Systems in
Water/Wastewater treatment – Pumping
Pumping systems are a major opportunity for energy
efficiency improvements in water/wastewater industry
0
500
1,000
1,500
2,000
1 -
5 H
P
6 -
20 H
P
21 -
50 H
P
51 -
100 H
P
101 -
200 H
P
201 -
500 H
P
501 -
1000 H
P
1000+
HP
Rewind Savings
Downsize Savings
Fan Savings
Other Savings
Air Compressor Savings
Motor Upgrades
Pump Savings
Source: U.S. Industrial Motors Systems, Market Opportunities
Assessment, U.S. Department of Energy
GWhr/Year

Power varies with the cube of the speed
- Affinity Laws for Pumps and Fans
• Flow ∝ RPM
• Head ∝ RPM2
• Power ∝ RPM3

Municipal WWT Process Overview
Chlorination
or UVInfluent Treated
Effluent
Screens
Grit Removal
Primary
Settling
Aeration
Final
SettlingDisinfection
Sludge Disposal
Return Activated Sludge
Primary
Treatment Secondary
Treatment
Tertiary
Treatment
Sludge Treatment
Thickening
Dewatering
Digestion/Stabilization
GritScreened
Material

Municipal WWT Process Overview
Effluent OUT
To Landfill
To Land Application
To Biomass to Energy Facility
To Fertilizer Distributor
Wastewater IN

Typical Energy Use Profile (for 10-mgd secondary treatment processes)
Source: Energy Conservation in Water and Wastewater Facilities - Manual of Practice. McGraw-Hill
Professional, 2009.
Main
Pumping
Primary
Treatment
Secondary
TreatmentSludge
Treatment
0
1.0
2.0
Po
wer
Use –
Millio
n k
Wh
/year
30
ft
TD
H
60
ft
TD
H
Pri
ma
ry T
rea
tme
nt
Pri
ma
ry S
ett
lin
g
Tri
ck
lin
g R
oc
k
Tri
ck
lin
g F
ilte
r -
Pla
sti
c
RB
C
Ac
tiva
ted
Slu
dg
e –
Co
ars
e B
ub
ble
Ac
tiva
ted
Slu
dg
e –
Fin
e B
ub
ble
Gra
vit
y T
hic
ke
nin
g
DA
F T
hic
ke
nin
g
An
ae
rob
ic D
ige
sti
on
Ae
rob
ic D
ige
sti
on
Va
cu
um
Filte
rs
Cen
trif
ug
es
Belt
Filte
rs

Source: Wastewater Treatment Energy Savings Guide: Energy Trust of Oregon
Typical WWTP Energy Use Distribution

Historical Wastewater Process Electrical
Demand
-40
-20
0
20
40
60
80
Trickling Filter ActivatedSludge
AS/Nitrification
kW
/MG
D
Other
Anaerobic Digestion
Aeration
Pumping
Biogas Recovery
29% 20%33%
Source: WEF MOP MFD-2 (1997)
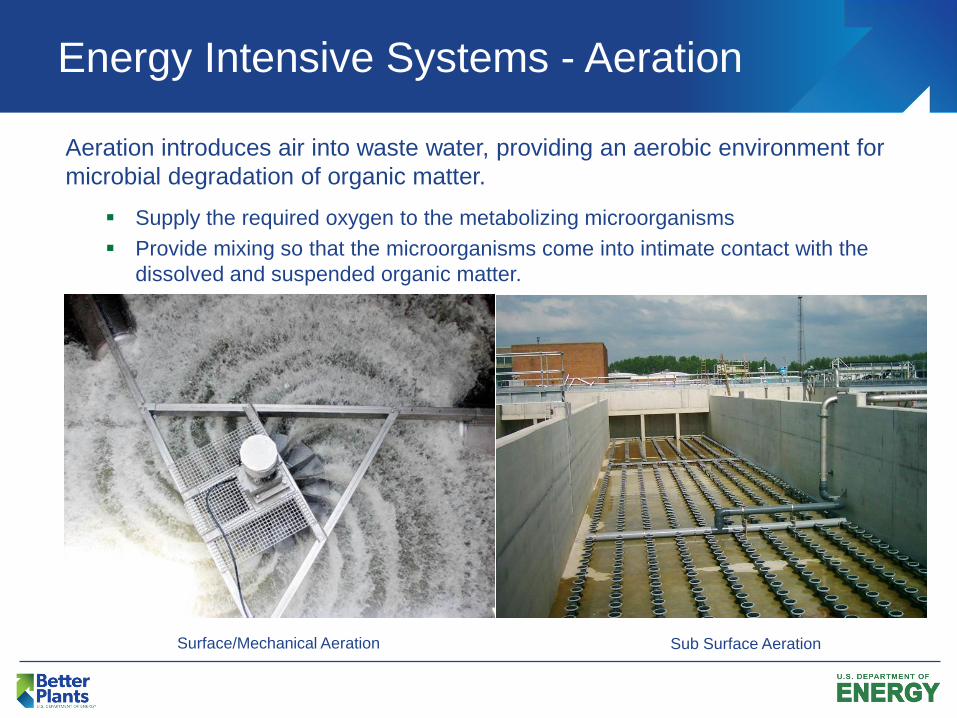
Energy Intensive Systems - Aeration
Supply the required oxygen to the metabolizing microorganisms
Provide mixing so that the microorganisms come into intimate contact with the
dissolved and suspended organic matter.
Aeration introduces air into waste water, providing an aerobic environment for
microbial degradation of organic matter.
Surface/Mechanical Aeration Sub Surface Aeration

Aeration Control: Fluctuations in Biological Load
A typical WWTP can experience load fluctuations by as
much as a factor of 5 over a 24-hour period
Manual or poor control of aeration can cause excess
energy consumption by as much as 50-65%
0 4 8 12 16 20 24 4 6 12 0 4 8 12 16 20 24 4 6 12

Best Alternative Depends on
Time perspective
Local conditions
Alternative electricity and heat generation
Waste transports
.
Energy Intensive Systems - Sludge Treatment /
Solids Handling
Alternative to Landfill
Anaerobic Digester
• Breaks down
biodegradable material
in the absence of
oxygen.
• Anaerobic digestion
provides biogas and
fertilizer.
Incinerator
• Burns Waste material at
high temperature.
• Reduces Volume and
Landfill Cost
• Heat can be recovered to
generate electricity and
provide space heating.
• Air emissions concerns
• Requires supplemental fuel
Composting
• Compost provides large
quantities of organic matter
and nutrients (such as
nitrogen and potassium) to
the soil.
• Bulking agents must be
added.
• Turning, monitoring, or
process control is necessary

Energy Efficiency Opportunities – Fans/Blowers
Proper application of variable speed drives
Retrofit diffusers with fine bubble type diffusers
System control strategy - SCADA System, feedback loops & ERP
systems
Automated DO control system and DO sensor technology, optical
sensor technology
Ammonia Derived DO Control
Improve oxygen transfer efficiency
Premium efficiency equipment (motors, single stage vs. turbo
blowers)
Apply synchronous Drive Belts

Use the Biogas/Methane formed in the anaerobic digestion of sludge As a source of process, space, and water heating through on-site boilers.
Treat the gas and use this gas in an internal-combustion engine, in gas turbines.
As feedstock for fuel cells.
Maximize methane production (e.g. the use of fats, oils and greases [FOG])
Potential for variable speed drive technology
System monitoring and control
Reuse of other solid waste
Conversion from vacuum filters to more efficient technologies
Solar sludge drying
Energy Efficiency - Sludge Treatment / Solids
Handling
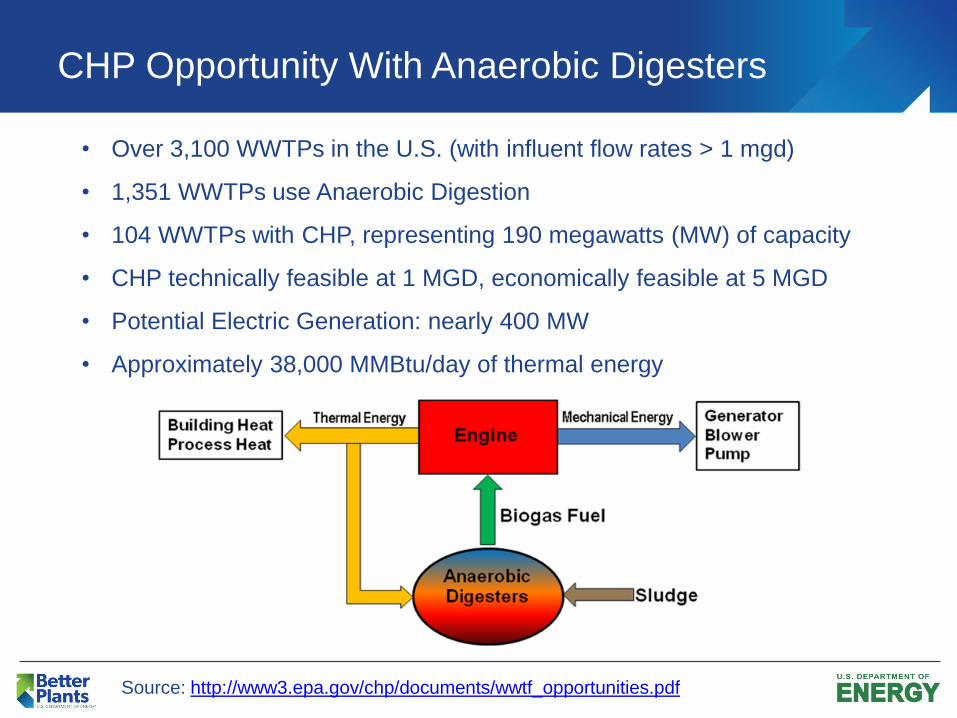
CHP Opportunity With Anaerobic Digesters
• Over 3,100 WWTPs in the U.S. (with influent flow rates > 1 mgd)
• 1,351 WWTPs use Anaerobic Digestion
• 104 WWTPs with CHP, representing 190 megawatts (MW) of capacity
• CHP technically feasible at 1 MGD, economically feasible at 5 MGD
• Potential Electric Generation: nearly 400 MW
• Approximately 38,000 MMBtu/day of thermal energy
Source: http://www3.epa.gov/chp/documents/wwtf_opportunities.pdf

Energy Efficiency Opportunities – Pumping
Proper application of variable speed control and multi-stage
pumping strategies
Optimize pump operation – match pump type and size (hp) to
task
Intelligent pump control & strategy - SCADA System, feedback
loops & ERP systems
Premium efficiency equipment (after system issues are resolved)
Clog Free Pumping technologies/Blockage removal Practices
Reduce system head (proper design of pipe system) and
strategic placement of storage to take maximum advantage of
gravity flow

Energy intensive systems – Biological
Nitrogen Removal
Source: www.pncwa.org

Ammonia-based Aeration Control System
DO set point chosen to minimize historical
NH4 breakthroughUpstream NH3. Min & Max limiting DO. Downstream NH4
Typical Aeration Basin Control Strategy Ammonia-based Aeration Control System
Source: www.pncwa.org
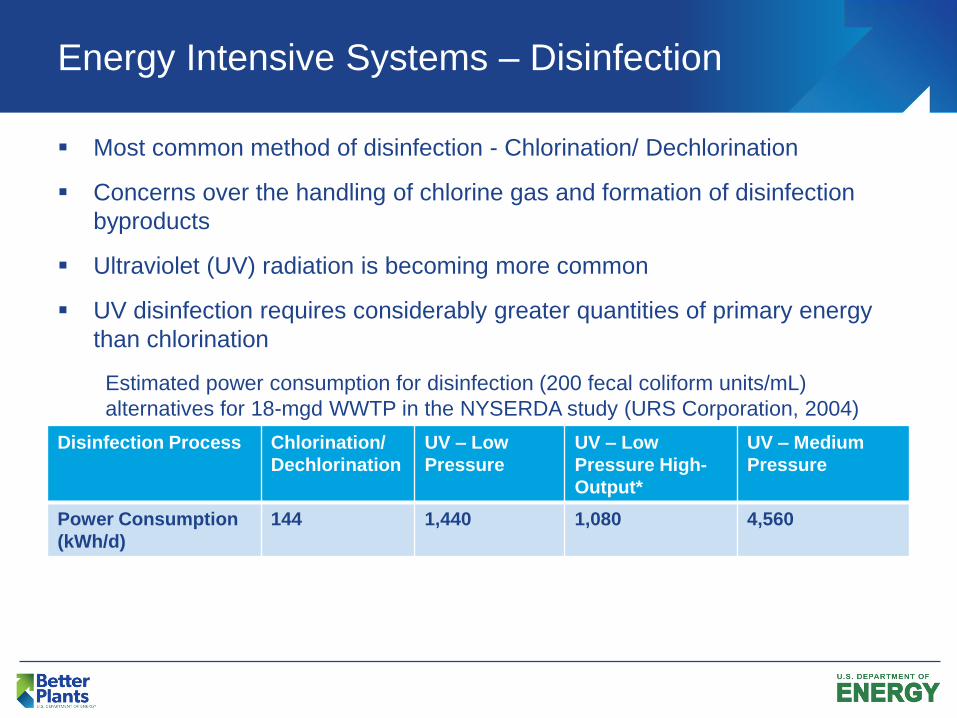
Energy Intensive Systems – Disinfection
Most common method of disinfection - Chlorination/ Dechlorination
Concerns over the handling of chlorine gas and formation of disinfection
byproducts
Ultraviolet (UV) radiation is becoming more common
UV disinfection requires considerably greater quantities of primary energy
than chlorination
Disinfection Process Chlorination/
Dechlorination
UV – Low
Pressure
UV – Low
Pressure High-
Output*
UV – Medium
Pressure
Power Consumption
(kWh/d)
144 1,440 1,080 4,560
Estimated power consumption for disinfection (200 fecal coliform units/mL)
alternatives for 18-mgd WWTP in the NYSERDA study (URS Corporation, 2004)

Energy Intensive Systems – Disinfection
Ways to save energy
Modulate UV system output to
the level required for
disinfection (dose-pacing
control) and system turndown
(number of operating lamps and
lamp output)
Properly sizing disinfection
stage pumps and UV lamps
Use electronic ballasts instead
of electromagnetic ballasts.
Electronic ballasts are ~10%
more energy efficient than
electromagnetic ballasts.
LED UV emergingSource: City of Riverside

Case Study NBC Bucklin Point Wastewater Treatment
UV disinfection retrofit study & improvements
Average Flow– 20 million gallons/day
Existing Condition 10 yr old disinfection system
20 yr useful life
Med press lamps
Paced w/ %T, Flow & TSS
Narragansett Bay Commission, Providence, Rl – Low Pressure High Output UV Lamp Study & Improvements
Uses 40 mJ/cm2 dose (200 MPN/100 ml monthly limit)
Elevated Fecal Coliform (FC) at low summer flow
Problem
Algae & floc solids shield FC from UV radiation
High dose with 2 banks didn’t fix problem

Case Study – Bucklin Point (Continued)
Solution
Clean UV Channel monthly if
needed to remove solids
Ensure All 100 Lamps in Bank
are replaced at same time
Upgraded Final Clarifiers as
part of BNR Upgrade
NBC Now Operates System in
full automatic mode
LPHO Retrofit is Breakeven
Option for Future
Impacts: Compliance to Effluent FC
Limits Maintained
Normalized Electric Use
Reduced 48% in 3 years
Potential Future Savings with
LPHO UV Lamps

Case Study – Victor Valley Wastewater Reclamation
Authority Pathway to Energy Neutrality
Average Flow– 12.2 MGD
Existing Condition Activated sludge MLE (Modified
Ludzack-Ettinger) process
Chlorination/Dechlorination
Anaerobic digester
Problem Increasing electrical cost and
demand due to regulatory nitrogen
limitations and trihalomethanes
Need for nutrient removal and UV
disinfection system
Not enough biogas
Solution
[2] WERF: Barriers to Biogas Use for Renewable Energy.
Optimize conventional activated sludge process for Biological Nutrient Removal (BNR)
Replaced gas chlorination disinfection system with Ultraviolet Disinfection (UV)
Update and re‐design the hauled waste and digestion facility to accept high strength waste, to
come from local industries
Installed CHP System (2 – 800kW IC engines)

Case Study - Victor Valley (Continued)
Impacts
Significantly reduced nutrient discharge by implementing low cost alternatives
Optimized UV system operations reduced UV system electrical demand by 50%
Increased biogas
production 300%
Increase revenue
$252,000 from
tipping fees
Able to operate two
800kW IC engines
Heat reclaimed
used for digester
In many cases,
energy efficiency
increased,
operational costs
were reduced and
process stability
improved

Discussion
Content Was anything new?
How useful was the content?
Are any partners considering the emerging technologies?
Next Steps
Survey results – top 4 topics
1) Emerging Technologies for wastewater treatment plants and trends in regulatory requirements
2) Beneficial use of biogas
3) Existing and emerging technologies for potable water treatment plants
4) CHP and interconnection issues
Schedule of webinars for 2016
June
September
December

Better Buildings Summit - 2016
33

Glossary of Common Terms
• Activated Sludge - Sludge that has undergone flocculation forming a bacterial culture typically carried out in tanks.
• Advanced Primary Treatment - The use of special additives to raw wastewater to cause flocculation or clumping to help settling
before the primary treatment.
• Aerobic Wastewater Treatment - Oxygen dependent wastewater treatment requiring the presence of oxygen for aerobic bacterial
breakdown of waste.
• Biosolids - Rich organic material leftover from aerobic wastewater treatment, essentially dewatered sludge that can be re-used.
• BOD - Biological Oxygen Demand - Since oxygen is required in the breakdown or decomposition process of wastewater, its
"demand" or BOD, is a measure of the concentration of organics in the wastewater
• Clarifier - A piece of wastewater treatment equipment used to "clarify" the wastewater, usually some sort of holding tank that
allows settling.
• Combined Sewer Flows - Municipal sewer systems that combine sewer flows with storm drainage.
• Digestion - The breaking down of sludge and other waste biologically by microorganisms.
• DO - Dissolved Oxygen - The amount of oxygen dissolved in the water..
• Effluent - The final output flow of a wastewater treatment plant.
• Influent The untreated wastewater or raw sewage coming into a wastewater treatment plant
• MGD - Million Gallons per Day - 694.4 gallons per minute.
• TDS - Total Dissolved Solids Total Dissolved Solids (TDS) is the combined total of all dissolved solids in wastewater