
Primary care physician time utilization before and...
13
Primary care physician time utilization before and after implementation of an electronic health record: A time-motion study Lisa Pizziferri a , Anne F. Kittler a , Lynn A. Volk a , Melissa M. Honour b , Sameer Gupta a , Samuel Wang a , Tiffany Wang a , Margaret Lippincott a , Qi Li a , David W. Bates a,b,c,d, * a Partners HealthCare System, Inc., Information Systems, USA b Division of General Medicine, Department of Medicine, Brigham and WomenÕs Hospital, Boston, MA 02115, USA c Harvard School of Public Health, USA d Harvard Medical School, USA Received 6 October 2004 Available online 14 December 2004 Abstract Despite benefits associated with the use of electronic health records (EHRs), one major barrier to adoption is the concern that EHRs may take longer for physicians to use than paper-based systems. To address this issue, we performed a time-motion study in five primary care clinics. Twenty physicians were observed and specific activities were timed during a clinic session before and after EHR implementation. Surveys evaluated physiciansÕ perceptions regarding the EHR. Post-implementation, the adjusted mean over- all time spent per patient during clinic sessions decreased by 0.5 min (p = 0.86; 95% confidence interval [ 5.05, 6.04]) from a pre- intervention adjusted average of 27.55 min (SE = 2.1) to a post-intervention adjusted average of 27.05 min (SE = 1.6). A majority of survey respondents believed EHR use results in quality improvement, yet only 29% reported that EHR documentation takes the same amount of time or less compared to the paper-based system. While the EHR did not require more time for physicians during a clinic session, further studies should assess the EHRÕs potential impact on non-clinic time. Ó 2004 Elsevier Inc. All rights reserved. Keywords: Electronic health record; Physician satisfaction; Physician workload; Time-motion study 1. Introduction Primary care is a fundamental component of good healthcare. Substantial evidence suggests that high qual- ity primary care can positively affect health outcomes [1–9]. Primary care providers must deliver acute, chronic, and preventive care. This diversity in care means that these providers face the challenge of inte- grating and managing a tremendous amount of informa- tion and biomedical knowledge. A majority (83–95%) of primary care physicians in the United States use tradi- tional paper records to document and process clinical data [10,11] despite the benefits of electronic medical re- cord (EHR) systems [12–17]. As many now advocate, it is important that primary care providers adopt the use of ambulatory EHRs in or- der to provide the best possible care [12,18–20]. Accord- ing to the National Alliance for Primary Care Informatics, widespread use of EHRs could lead to im- proved quality, safety, and efficiency, along with in- creased ability to conduct education and research [12]. Despite their benefits, many physicians are often hes- itant to begin using EHRs [21–23]. A key reason for this www.elsevier.com/locate/yjbin Journal of Biomedical Informatics 38 (2005) 176–188 1532-0464/$ - see front matter Ó 2004 Elsevier Inc. All rights reserved. doi:10.1016/j.jbi.2004.11.009 * Corresponding author. Fax: +1 617 732 7072. E-mail address: [email protected] (D.W. Bates).
Transcript of Primary care physician time utilization before and...
www.elsevier.com/locate/yjbin
Journal of Biomedical Informatics 38 (2005) 176–188
Primary care physician time utilization before andafter implementation of an electronic health record:
A time-motion study
Lisa Pizziferria, Anne F. Kittlera, Lynn A. Volka, Melissa M. Honourb, Sameer Guptaa,Samuel Wanga, Tiffany Wanga, Margaret Lippincotta, Qi Lia, David W. Batesa,b,c,d,*
a Partners HealthCare System, Inc., Information Systems, USAb Division of General Medicine, Department of Medicine, Brigham and Women�s Hospital, Boston, MA 02115, USA
c Harvard School of Public Health, USAd Harvard Medical School, USA
Received 6 October 2004Available online 14 December 2004
Abstract
Despite benefits associated with the use of electronic health records (EHRs), one major barrier to adoption is the concern thatEHRs may take longer for physicians to use than paper-based systems. To address this issue, we performed a time-motion study infive primary care clinics. Twenty physicians were observed and specific activities were timed during a clinic session before and afterEHR implementation. Surveys evaluated physicians� perceptions regarding the EHR. Post-implementation, the adjusted mean over-all time spent per patient during clinic sessions decreased by 0.5 min (p = 0.86; 95% confidence interval [�5.05, 6.04]) from a pre-intervention adjusted average of 27.55 min (SE = 2.1) to a post-intervention adjusted average of 27.05 min (SE = 1.6). A majority ofsurvey respondents believed EHR use results in quality improvement, yet only 29% reported that EHR documentation takes thesame amount of time or less compared to the paper-based system. While the EHR did not require more time for physicians duringa clinic session, further studies should assess the EHR�s potential impact on non-clinic time.� 2004 Elsevier Inc. All rights reserved.
Keywords: Electronic health record; Physician satisfaction; Physician workload; Time-motion study
1. Introduction
Primary care is a fundamental component of goodhealthcare. Substantial evidence suggests that high qual-ity primary care can positively affect health outcomes[1–9]. Primary care providers must deliver acute,chronic, and preventive care. This diversity in caremeans that these providers face the challenge of inte-grating and managing a tremendous amount of informa-tion and biomedical knowledge. A majority (83–95%) of
1532-0464/$ - see front matter � 2004 Elsevier Inc. All rights reserved.
doi:10.1016/j.jbi.2004.11.009
* Corresponding author. Fax: +1 617 732 7072.E-mail address: [email protected] (D.W. Bates).
primary care physicians in the United States use tradi-tional paper records to document and process clinicaldata [10,11] despite the benefits of electronic medical re-cord (EHR) systems [12–17].
As many now advocate, it is important that primarycare providers adopt the use of ambulatory EHRs in or-der to provide the best possible care [12,18–20]. Accord-ing to the National Alliance for Primary CareInformatics, widespread use of EHRs could lead to im-proved quality, safety, and efficiency, along with in-creased ability to conduct education and research [12].
Despite their benefits, many physicians are often hes-itant to begin using EHRs [21–23]. A key reason for this
L. Pizziferri et al. / Journal of Biomedical Informatics 38 (2005) 176–188 177
is that physicians are concerned that using an EHR willtake longer than paper, both during the conversion andin steady state [21,24–26]. As a result, the speed and easeof use of an EHR is a key determinant of how well it willbe received by physicians.
There are limited data regarding use of clinical infor-mation systems and physician time utilization[24,25,27,28]. There are even fewer studies that quantifythe effect on time of an ambulatory EHR [29], suggest-ing that further research is needed in this area.
Time-motion studies can be used to measure the ef-fect of an EHR on physician time utilization [30]. Atime-motion study can be performed either throughcontinuous observation or work sampling [31], withcontinuous observation being more accurate thanwork sampling [32]. In the continuous observation ap-proach, an observer passively shadows a physicianwhile recording the amount of time spent in each taskperformed by the physician. The comprehensive datacollected in time-motion studies are valuable in evalu-ating information systems� impact on workflow andworkload.
Understanding how EHRs may affect physician timeutilization will be fundamental in promoting their accep-tance by physicians. Since the time required to use anapplication is so crucial to its success, we performedcontinuous observation time-motion studies before andafter the implementation of an electronic health recordin five ambulatory primary care clinics in Boston, withthe specific aim of evaluating the effect of the EHR onphysicians� overall time in clinic sessions. We were alsointerested in analyzing how converting from a paper re-cord to an electronic record affects the time physiciansspend in direct care with patients.
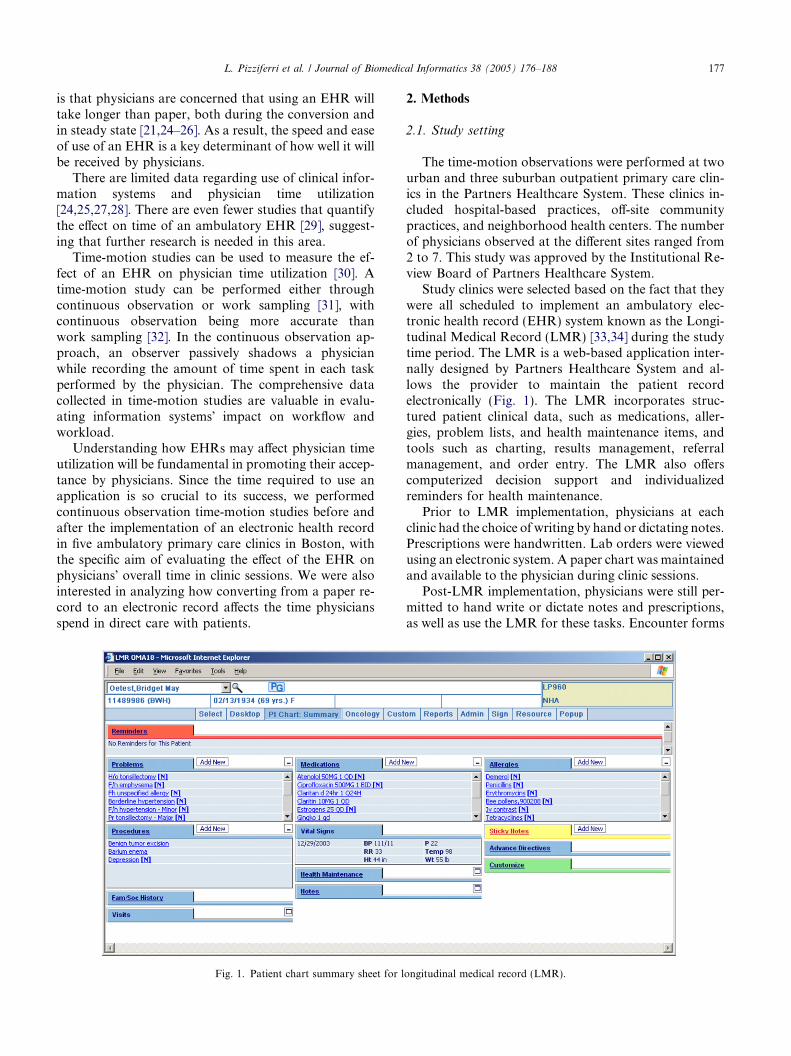
Fig. 1. Patient chart summary sheet for l
2. Methods
2.1. Study setting
The time-motion observations were performed at twourban and three suburban outpatient primary care clin-ics in the Partners Healthcare System. These clinics in-cluded hospital-based practices, off-site communitypractices, and neighborhood health centers. The numberof physicians observed at the different sites ranged from2 to 7. This study was approved by the Institutional Re-view Board of Partners Healthcare System.
Study clinics were selected based on the fact that theywere all scheduled to implement an ambulatory elec-tronic health record (EHR) system known as the Longi-tudinal Medical Record (LMR) [33,34] during the studytime period. The LMR is a web-based application inter-nally designed by Partners Healthcare System and al-lows the provider to maintain the patient recordelectronically (Fig. 1). The LMR incorporates struc-tured patient clinical data, such as medications, aller-gies, problem lists, and health maintenance items, andtools such as charting, results management, referralmanagement, and order entry. The LMR also offerscomputerized decision support and individualizedreminders for health maintenance.
Prior to LMR implementation, physicians at eachclinic had the choice of writing by hand or dictating notes.Prescriptions were handwritten. Lab orders were viewedusing an electronic system. A paper chart was maintainedand available to the physician during clinic sessions.
Post-LMR implementation, physicians were still per-mitted to hand write or dictate notes and prescriptions,as well as use the LMR for these tasks. Encounter forms
ongitudinal medical record (LMR).
178 L. Pizziferri et al. / Journal of Biomedical Informatics 38 (2005) 176–188
and test order requisitions continued to only be avail-able in a paper-based form. Chart pulls could still beperformed.
2.2. Study design
In preparation for LMR implementation, a hardwareevaluation was performed to upgrade any computersthat were below the application�s minimum systemrequirements. A 1-hour personal training session wasoffered for each physician but was not mandatory.
This study design was modeled after a time-motionstudy performed at the Regenstrief Institute for HealthCare [29]. Continuous time-motion observations wereperformed with physicians at the five study clinics bothbefore and after LMR implementation. Post-observa-tions were performed when the clinics were judged tobe in a steady state of routine LMR use. Observers fol-lowed physicians during their entire clinic session anddirectly timed specific physician activities.
Primary care physicians (all general internists) wereinvited to participate. Residents and fellows were not in-vited because of the possibility they would not all bepracticing at the clinic once the LMR was implemented.Physicians were invited to participate via email and wererequested to suggest possible observation dates. Physi-cians who agreed to participate were observed once be-fore and after implementation for a half day (1 session)or a full day (2 sessions) depending on their schedule onthe day of the observation.
Twenty physicians were observed prior to implemen-tation. Sixteen of these physicians were subsequently ob-served post-implementation. Four physicians were lostto follow-up because they left the practice or were onleave. Four additional physicians, who had not partici-pated in a pre-observation, were recruited for a post-ob-servation for a total of 20 physicians.
Observations began just before the first patientappointment, and continued until onsite care was com-pleted for the last scheduled patient of that session orday. The physician or clinic staff was instructed to ex-plain to the patient that the physician was the subjectof the study, and that declining participation would inno way affect patient care. If a patient did not wish toparticipate, or if the physician declined participationdue to the nature of the patient case, the observer didnot enter the examining room or collect data until thephysician completed the visit with the patient. If patientconsent was obtained, the physician introduced the ob-server to the patient. After this point, the observer�s rolewas restricted to passive observation only, involving nointeraction with the patient or the physician. No patientidentifiers were collected during the observation and thedata were identified by a physician number rather thanthe physician name. The key linking physician numberto name was kept in a separate file.
2.3. Task categories
Physician activities were documented using a prede-termined set of tasks, which were arranged into catego-ries useful for data collection and analysis. Each taskneeded to be visually identified when the activity wasbeing started, without explanation of what the physicianwas doing by the physician or patient.
The tasks and categories were adapted from Over-hage�s categorization scheme [29]. Pilot observationswere performed to test the relevance of the activitiesand categories within Partners HealthCare System. Asa result of the pilot, several activities were added (e.g.‘‘Procedures—Examining Patient’’ and ‘‘Personal—[Us-ing a] Palm/Diary’’), deleted or collapsed into anotheractivity (e.g. ‘‘Talking—Patient History’’ was collapsedinto ‘‘Talking—Patient’’).
Individual tasks were categorized into ‘‘Major Cate-gories’’ (Appendix A) which served as main headingsin the data entry tool (Fig. 2). The Major Categoriesemphasized the medium used to accomplish the task(i.e., paper, computer, and phone), facilitating identifi-cation of performed tasks. For example, the Major Cat-egory ‘‘Phone’’ was followed by ‘‘Minor Categories’’(Patient, Dictating Notes, etc.). The combination ofthe Major and Minor Categories comprised the fulldescription of the task. For example, ‘‘Phone—Patient’’denoted that the physician was talking to a patient onthe phone.
Major Categories were also restructured to suit thestudy setting. Post-LMR implementation, physicianscould still perform some tasks using the older paper-based system and some tasks such as test requisitionsand encounter forms (commonly known as a ‘‘super-bill’’) were still only performed using paper forms.Consequently, the Major Categories were differenti-ated by whether the task was computer or paper-based.
For analysis, the individual tasks (the combinationof Major and Minor Categories) were grouped intoDirect Patient Care, Indirect Patient Care—Write,Indirect Patient Care—Read, Indirect Patient Care—Other, Administrative, and Miscellaneous categories.Direct Patient Care included examining the patient,talking to the patient, or talking to a colleague regard-ing patient care. Indirect Patient Care categories in-cluded tasks such as writing or reading notes or labresults, or getting results via the phone (‘‘reviewingdata and recording data in support of an individual pa-tient’’) [29]. The Administrative category was com-prised of reviewing the schedule and talking to acolleague about non-patient matters. The Miscella-neous category consisted of tasks such as eating, walk-ing, and personal conversation. The analysis categoriesand associated Major and Minor Categories are listedin Appendix A.

Fig. 2. Screenshot of time-motion study data entry form. The form lists Major Categories and associated Minor Categories. After selecting ‘‘Now’’to halt current time (the start of an activity), the activity is chosen by clicking radio button. ‘‘Add New Record’’ is selected to save each activity entry.
L. Pizziferri et al. / Journal of Biomedical Informatics 38 (2005) 176–188 179
2.4. Data entry tool
We used a Microsoft Access database installed on Fu-jitsu Lifebook touchscreen computers for data collec-tion. Observers used a stylus to log activities on anAccess form (Fig. 2). The observer could only categorizean activity into one category at any point in time. There-fore, the observer needed to judge the primary activity ofthe physician at each instant. For example, if the physi-cian was writing notes and the patient was talking, the‘‘writing notes’’ category would be primary. However,if at any time the physician stopped writing and only ap-peared to be listening to the patient, ‘‘talking to the pa-tient’’ was selected. In general, fleeting activities, wherethe physician went back and forth between two differenttasks, occurred more often than a physician taking partin two tasks at the same time. The observer could accu-rately capture fleeting activities using the data entry tool.
Observers selected ‘‘Now’’ at the start of each activityto log the time and then selected the activity. If an activitywas mistakenly chosen, the observer could select anotherone to replace the first. The particular activity was notlogged until the observer selected ‘‘Add Record.’’ In thisway, observers had time during the activity to identifythe task performed. The stop time for each activity wasthe start time of the following activity. The date and aunique observation number were also automaticallygenerated and collected by the data entry form. The inter-nal clock of the computer was used for task timing with
second precision. After completion of the observation,the number of patients observed was recorded in theAccess database. Patient-related information was notcollected. All data were backed up to the network andthen transferred to a master Access database.
2.5. Observer training
Observers were seven research assistants (six non-cli-nicians and one physician) that had trained for the time-motion observations by receiving instruction from anexperienced observer and by doing practice observationswith non-study physicians. Prior to performing anyobservations, observers studied the categories and be-came familiar with their definition and placement onthe data entry form. Observers also received trainingon using the Microsoft Access database and form, andon how to operate the computer. The training observa-tions of actual clinic sessions ranged from 4 to 8 h. Dataderived from training observations were not used in thestudy. After and during the training sessions, observershad the opportunity to ask questions of the observedphysician, experienced observers, and the senior investi-gator (DWB). Results of training observations werereviewed to ensure proper data collection.
One observer performed a majority (22/40) of obser-vations (Table 1). Several of the observers performedonly pre-observations (2) or only post-observations (4).With the exception on the physician observer (Observer
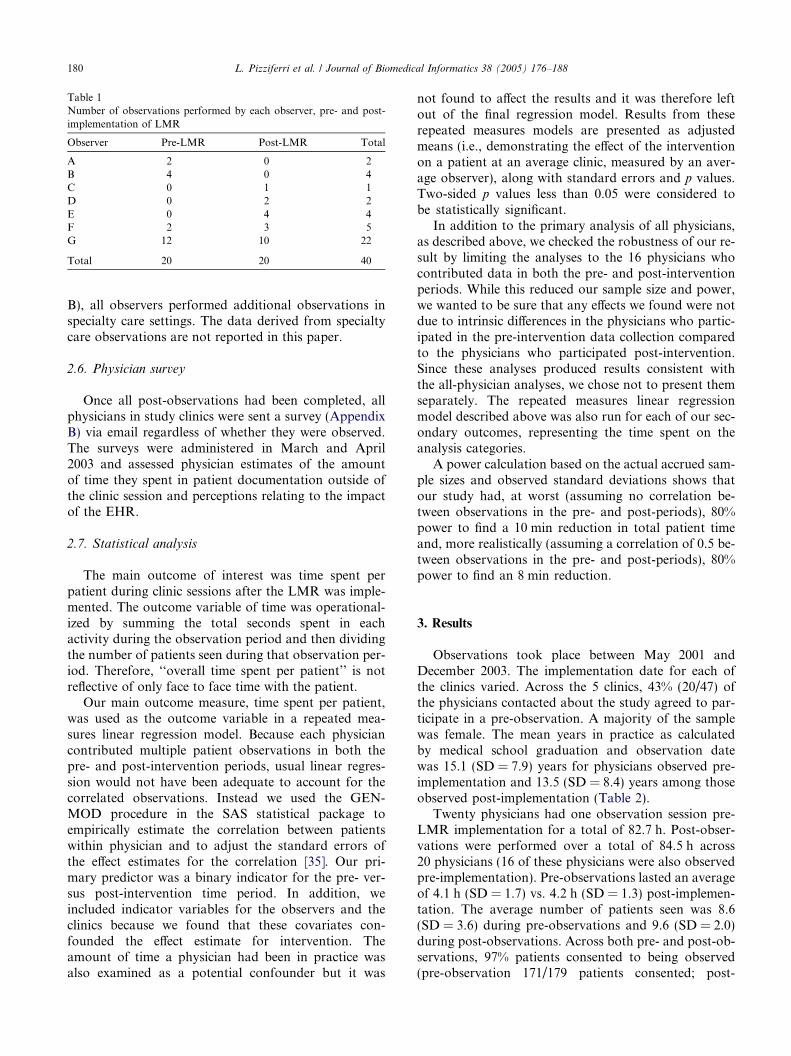
Table 1Number of observations performed by each observer, pre- and post-implementation of LMR
Observer Pre-LMR Post-LMR Total
A 2 0 2B 4 0 4C 0 1 1D 0 2 2E 0 4 4F 2 3 5G 12 10 22
Total 20 20 40
180 L. Pizziferri et al. / Journal of Biomedical Informatics 38 (2005) 176–188
B), all observers performed additional observations inspecialty care settings. The data derived from specialtycare observations are not reported in this paper.
2.6. Physician survey
Once all post-observations had been completed, allphysicians in study clinics were sent a survey (AppendixB) via email regardless of whether they were observed.The surveys were administered in March and April2003 and assessed physician estimates of the amountof time they spent in patient documentation outside ofthe clinic session and perceptions relating to the impactof the EHR.
2.7. Statistical analysis
The main outcome of interest was time spent perpatient during clinic sessions after the LMR was imple-mented. The outcome variable of time was operational-ized by summing the total seconds spent in eachactivity during the observation period and then dividingthe number of patients seen during that observation per-iod. Therefore, ‘‘overall time spent per patient’’ is notreflective of only face to face time with the patient.
Our main outcome measure, time spent per patient,was used as the outcome variable in a repeated mea-sures linear regression model. Because each physiciancontributed multiple patient observations in both thepre- and post-intervention periods, usual linear regres-sion would not have been adequate to account for thecorrelated observations. Instead we used the GEN-MOD procedure in the SAS statistical package toempirically estimate the correlation between patientswithin physician and to adjust the standard errors ofthe effect estimates for the correlation [35]. Our pri-mary predictor was a binary indicator for the pre- ver-sus post-intervention time period. In addition, weincluded indicator variables for the observers and theclinics because we found that these covariates con-founded the effect estimate for intervention. Theamount of time a physician had been in practice wasalso examined as a potential confounder but it was
not found to affect the results and it was therefore leftout of the final regression model. Results from theserepeated measures models are presented as adjustedmeans (i.e., demonstrating the effect of the interventionon a patient at an average clinic, measured by an aver-age observer), along with standard errors and p values.Two-sided p values less than 0.05 were considered tobe statistically significant.
In addition to the primary analysis of all physicians,as described above, we checked the robustness of our re-sult by limiting the analyses to the 16 physicians whocontributed data in both the pre- and post-interventionperiods. While this reduced our sample size and power,we wanted to be sure that any effects we found were notdue to intrinsic differences in the physicians who partic-ipated in the pre-intervention data collection comparedto the physicians who participated post-intervention.Since these analyses produced results consistent withthe all-physician analyses, we chose not to present themseparately. The repeated measures linear regressionmodel described above was also run for each of our sec-ondary outcomes, representing the time spent on theanalysis categories.
A power calculation based on the actual accrued sam-ple sizes and observed standard deviations shows thatour study had, at worst (assuming no correlation be-tween observations in the pre- and post-periods), 80%power to find a 10 min reduction in total patient timeand, more realistically (assuming a correlation of 0.5 be-tween observations in the pre- and post-periods), 80%power to find an 8 min reduction.
3. Results
Observations took place between May 2001 andDecember 2003. The implementation date for each ofthe clinics varied. Across the 5 clinics, 43% (20/47) ofthe physicians contacted about the study agreed to par-ticipate in a pre-observation. A majority of the samplewas female. The mean years in practice as calculatedby medical school graduation and observation datewas 15.1 (SD = 7.9) years for physicians observed pre-implementation and 13.5 (SD = 8.4) years among thoseobserved post-implementation (Table 2).
Twenty physicians had one observation session pre-LMR implementation for a total of 82.7 h. Post-obser-vations were performed over a total of 84.5 h across20 physicians (16 of these physicians were also observedpre-implementation). Pre-observations lasted an averageof 4.1 h (SD = 1.7) vs. 4.2 h (SD = 1.3) post-implemen-tation. The average number of patients seen was 8.6(SD = 3.6) during pre-observations and 9.6 (SD = 2.0)during post-observations. Across both pre- and post-ob-servations, 97% patients consented to being observed(pre-observation 171/179 patients consented; post-
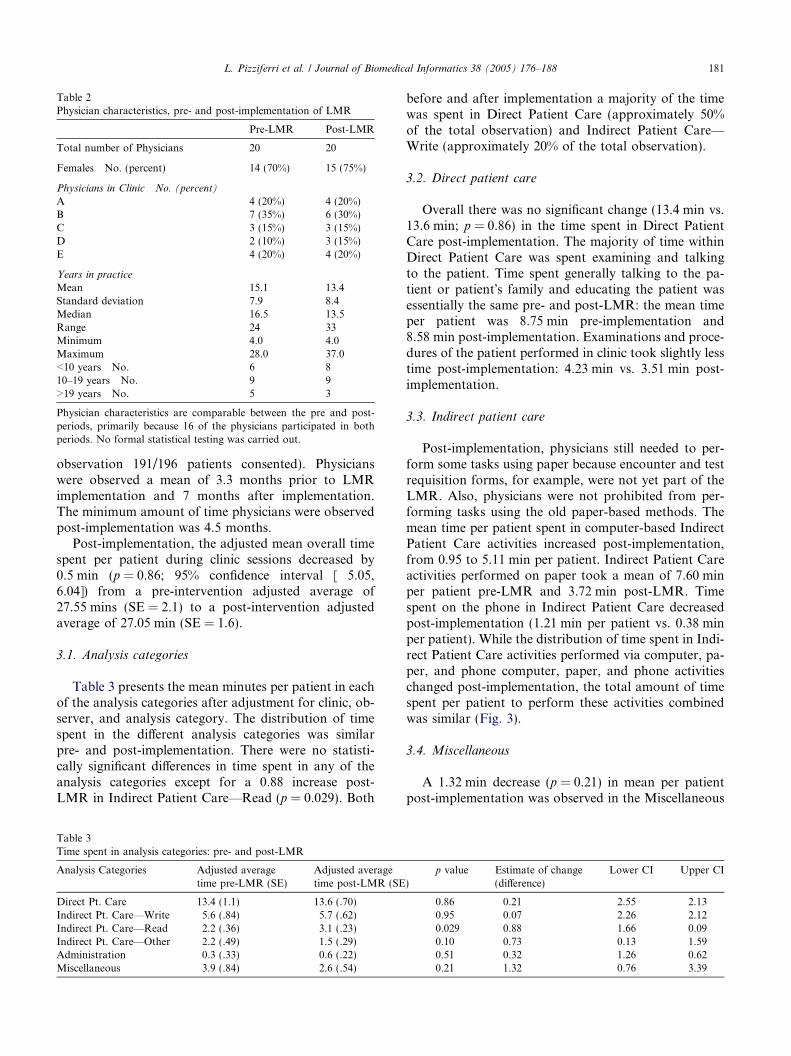
Table 2Physician characteristics, pre- and post-implementation of LMR
Pre-LMR Post-LMR
Total number of Physicians 20 20
Females No. (percent) 14 (70%) 15 (75%)
Physicians in Clinic No. (percent)
A 4 (20%) 4 (20%)B 7 (35%) 6 (30%)C 3 (15%) 3 (15%)D 2 (10%) 3 (15%)E 4 (20%) 4 (20%)
Years in practice
Mean 15.1 13.4Standard deviation 7.9 8.4Median 16.5 13.5Range 24 33Minimum 4.0 4.0Maximum 28.0 37.0<10 years No. 6 810–19 years No. 9 9>19 years No. 5 3
Physician characteristics are comparable between the pre and post-periods, primarily because 16 of the physicians participated in bothperiods. No formal statistical testing was carried out.
L. Pizziferri et al. / Journal of Biomedical Informatics 38 (2005) 176–188 181
observation 191/196 patients consented). Physicianswere observed a mean of 3.3 months prior to LMRimplementation and 7 months after implementation.The minimum amount of time physicians were observedpost-implementation was 4.5 months.
Post-implementation, the adjusted mean overall timespent per patient during clinic sessions decreased by0.5 min (p = 0.86; 95% confidence interval [�5.05,6.04]) from a pre-intervention adjusted average of27.55 mins (SE = 2.1) to a post-intervention adjustedaverage of 27.05 min (SE = 1.6).
3.1. Analysis categories
Table 3 presents the mean minutes per patient in eachof the analysis categories after adjustment for clinic, ob-server, and analysis category. The distribution of timespent in the different analysis categories was similarpre- and post-implementation. There were no statisti-cally significant differences in time spent in any of theanalysis categories except for a 0.88 increase post-LMR in Indirect Patient Care—Read (p = 0.029). Both
Table 3Time spent in analysis categories: pre- and post-LMR
Analysis Categories Adjusted averagetime pre-LMR (SE)
Adjusted averagetime post-LMR (SE
Direct Pt. Care 13.4 (1.1) 13.6 (.70)Indirect Pt. Care—Write 5.6 (.84) 5.7 (.62)Indirect Pt. Care—Read 2.2 (.36) 3.1 (.23)Indirect Pt. Care—Other 2.2 (.49) 1.5 (.29)Administration 0.3 (.33) 0.6 (.22)Miscellaneous 3.9 (.84) 2.6 (.54)
before and after implementation a majority of the timewas spent in Direct Patient Care (approximately 50%of the total observation) and Indirect Patient Care—Write (approximately 20% of the total observation).
3.2. Direct patient care
Overall there was no significant change (13.4 min vs.13.6 min; p = 0.86) in the time spent in Direct PatientCare post-implementation. The majority of time withinDirect Patient Care was spent examining and talkingto the patient. Time spent generally talking to the pa-tient or patient�s family and educating the patient wasessentially the same pre- and post-LMR: the mean timeper patient was 8.75 min pre-implementation and8.58 min post-implementation. Examinations and proce-dures of the patient performed in clinic took slightly lesstime post-implementation: 4.23 min vs. 3.51 min post-implementation.
3.3. Indirect patient care
Post-implementation, physicians still needed to per-form some tasks using paper because encounter and testrequisition forms, for example, were not yet part of theLMR. Also, physicians were not prohibited from per-forming tasks using the old paper-based methods. Themean time per patient spent in computer-based IndirectPatient Care activities increased post-implementation,from 0.95 to 5.11 min per patient. Indirect Patient Careactivities performed on paper took a mean of 7.60 minper patient pre-LMR and 3.72 min post-LMR. Timespent on the phone in Indirect Patient Care decreasedpost-implementation (1.21 min per patient vs. 0.38 minper patient). While the distribution of time spent in Indi-rect Patient Care activities performed via computer, pa-per, and phone computer, paper, and phone activitieschanged post-implementation, the total amount of timespent per patient to perform these activities combinedwas similar (Fig. 3).
3.4. Miscellaneous
A 1.32 min decrease (p = 0.21) in mean per patientpost-implementation was observed in the Miscellaneous
)p value Estimate of change
(difference)Lower CI Upper CI
0.86 �0.21 �2.55 2.130.95 �0.07 �2.26 2.120.029 �0.88 �1.66 �0.090.10 0.73 �0.13 1.590.51 �0.32 �1.26 0.620.21 1.32 �0.76 3.39

Fig. 3. Unadjusted minutes per patient spent during clinic session inIndirect Patient Care activities performed via computer, paper, andphone pre- and post-LMR implementation. Time spent ‘‘waiting’’within Indirect Patient Care was not included with the exception oftime spent waiting for paper or the computer.
182 L. Pizziferri et al. / Journal of Biomedical Informatics 38 (2005) 176–188
analysis category. Two tasks that had the greatest post-implementation decrease were: ‘‘Walking—Inside’’(0.38 min/patient decrease) and ‘‘Personal—Other’’(0.35 min/patient decrease).
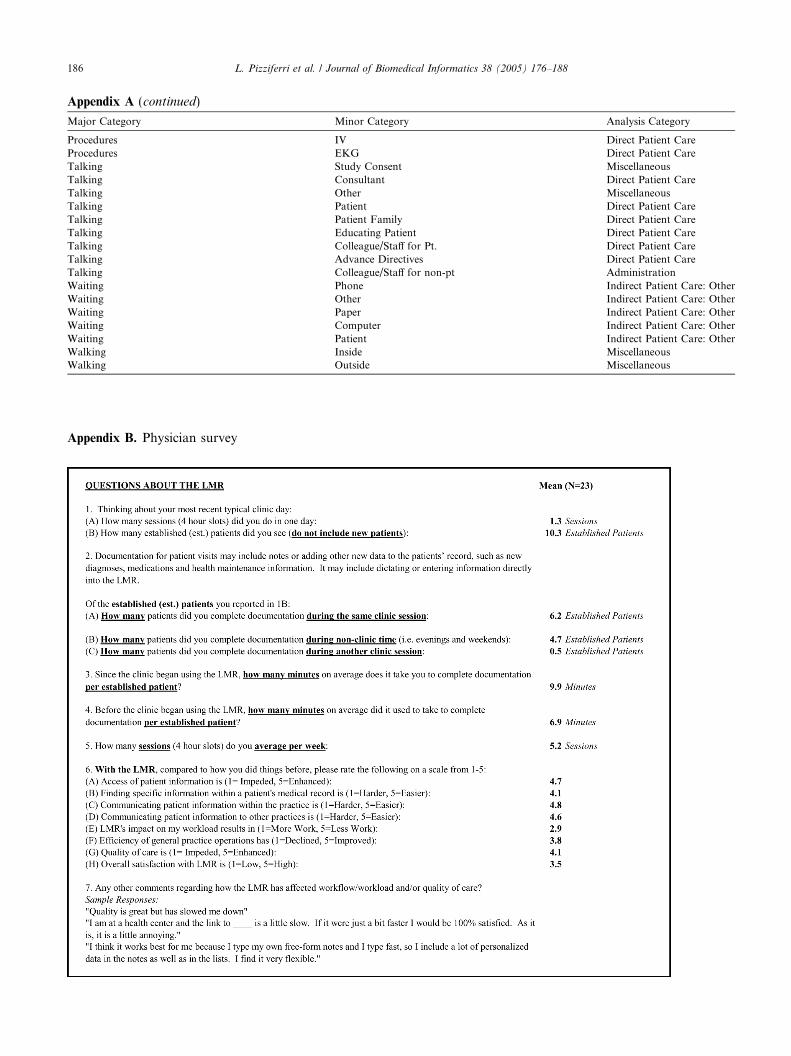
3.5. Survey
There was a 43% (23/54) response rate to the survey.Fourteen of the survey respondents had also been ob-served for the study. Fifteen of the 23 respondents re-ported that documentation was performed outside ofthe clinic session for a mean of 66% of patients (rangedfrom 20 to 100%). Physicians reported a mean of9.9 min/established patient to complete documentationpost-LMR versus 6.9 min pre-LMR. For the 13 physi-cians reporting more time for documentation afterimplementation, the median percent increase as calcu-lated by the reported time to complete documentationbefore and after implementation, was 80% (ranged from43 to 200%). However, seven respondents reported doc-umentation took the same amount of time or less withLMR use.
Respondents also rated the LMR on a scale from 1 to5, with 1 being the worst and 5 being the best (AppendixB). Making comparisons to the paper-based system,physicians assessed the LMR�s impact on communica-tion, access, efficiency, workload, and quality of care.The scores indicated that the physicians believed theLMR resulted in an improvement in many domainsrelating to quality, access, and communication (allmeans were greater than 4.1). The only item rated belowneutral was the LMR�s impact on workload with a meanrating of 2.9. Whether or not the observed post-LMRtime per patient decreased was not associated with theworkload rating using a chi-squared test of proportions(p = 89). The mean overall satisfaction score was 3.5.
4. Discussion
This study evaluated how EHR use affected time uti-lization by physicians. We found that compared to a pa-per-based system, the EHR did not require additionalphysician time during a primary care clinic session.Overall, physicians took slightly less time (0.5 min) perpatient during clinic sessions after the EHR was imple-mented. This difference in time utilization betweenpre-and post-EHR observations was not statistically sig-nificant (p = 0.86).
Time spent in direct patient care activities such astalking to and examining the patient did not change sig-nificantly post-EHR implementation. However, therewas an increase (0.88 min; p = 0.029) post-implementa-tion in the amount of reading performed in support ofpatient care. We did not observe a significant time shiftin physicians� administrative duties during post-imple-mentation clinic sessions. These findings are relevant interms of maintaining the quality of patient care, as wellas physician satisfaction levels, since a majority of phy-sicians are already dissatisfied with the amount of hoursspent on administrative activities compared with patientcare [36].
The observational data also confirmed that the EHRwas being used by physicians. Activities that were oncedone only via paper methods were performed via theEHR after implementation. Time spent dictating alsodecreased. Some tasks, however, continued on paper(such as ordering writing). Whether more paper taskscould have been performed efficiently on the computeris unclear. For example, certain tasks may either bemore quickly performed using paper, or result in a timesavings once transitioned to the EHR. Still, the combi-nation of computer and paper tasks within indirect pa-tient care (reading, writing, and looking for data insupport of patient care) took the same amount of timepre- and post-implementation.
The literature contains conflicting data regarding theworkflow effects of computerizing processes such asprescribing and ordering. Physician fears that EHRusage may slow work processes are not surprising inlight of some of these data. Unsuccessful implementa-tions are well known, from work strikes in the early1990s at a major academic medical center [22,23], tomore recent decisions to pull a computerized physicianorder entry system from a large medical center [26]. Inone study of computerized order entry at our institu-tion, interns were found to use 5% more of their timeordering after the process was computerized [25]. Thisincrease in intern time was counterbalanced by the de-creased time spent by nursing and pharmacy personneland by improvements in quality and efficiency,although these counterbalancing factors are not likelyto be visible to those physicians actually spending moretime ordering. Another study at the Regenstrief

L. Pizziferri et al. / Journal of Biomedical Informatics 38 (2005) 176–188 183
Institute for Health Care examined the effects of com-puterizing inpatient order entry on resource utilization,and found that although patient charges and hospitalcosts were significantly reduced by computerizing,more physician time was required [24]. Qualitativestudies in the outpatient setting also report physicians�perceptions that the computer system is too time-con-suming [37,38].
However, there are also data suggesting that comput-erizing may facilitate time savings. Keshavjee et al. [39]found that physician charting time increased by 50%at 6 months post-EHR but found a return to originallevels by 18 months. In a study from the RegenstriefInstitute for Health Care [29], researchers again exam-ined the time utilization effects of a computerized physi-cian order entry system and concluded that little to noextra physician time was required to use computerizedorder entry. Their findings even suggest that with expe-rience, physicians may be able to save time by using acomputerized system.
Rodriguez et al. [40] also found no difference in over-all time to complete typical physician tasks using anEHR. The average physician completed orders in thesame amount of time as a paper system. Documentationtook longer with the computerized system, but was off-set by a time savings achieved in viewing tasks. Thesefindings parallel our own study findings with respect toobserved ordering time and documentation time as re-ported via the survey.
Perceptions of increased time to perform patient doc-umentation were reported for a majority (71%) of thesurvey respondents. While self-report is not always accu-rate [41], clearly perceptions of increased workload arerelevant to physician satisfaction levels [37,42,43]. Forthe 66% of physicians who reported performing docu-mentation outside of clinic hours, it may be that LMRuse within the clinic resulted in needing additional timefor documentation during non-clinic time. While the in-creased access and flexibility allowing physicians towork outside the clinic can be considered a benefit, itrepresents an infringement on personal time and, suchtime should ideally be included in the physician�s overalltime, though this is hard to study. However, it is clear,that for a third of physicians, the LMR appears to haveimproved their workload.
Consistent with the literature [15,21,44,45], we foundthat EHR users recognized improvements in quality ofcare, access, and communication compared to the pa-per-based system. Also, physicians acknowledged thatthe efficiency of general practice operations had im-proved overall. While the survey ratings indicated thatthe LMR�s impact resulted in slightly more work, overallsatisfaction with the LMRwas reported by 18/23 respon-dents with a rating of 3 or higher. This suggests thatmany physicians found the time expense was a manage-able tradeoff for other LMR benefits.
4.1. Implications
The results suggest that for most physicians, the ben-efits of the LMR can be realized without sacrificing timewith patients or overall clinic time. However, a majorityof the physicians perceived at the time they were sur-veyed that the LMR increased workload. This suggeststhat, at least initially, some physicians require more timefor EHR use that may impact time spent on documenta-tion outside of clinic sessions. Identifying which physi-cians will need more time to use EHRs will help inapplying strategies to improve use and minimize timeburdens. At this stage, further research is required topredict intrinsic and extrinsic factors associated with in-creased time utilization by physicians.
Some patient care tasks that are possible with elec-tronic data could not be easily achieved using paper-based systems. For example, physicians might be ableto use the EHR to easily query panels to identify pa-tients due for health maintenance tests and then sendout patient letters to schedule tests. There is also facili-tated access to clinic information which may result inmore data, presented in support of patient care, for phy-sicians to review. Time in these tasks may increase, notbecause a particular task takes longer but because thereare more features, clinical decision support, and clini-cally important data available that will support betterquality of care. The enhanced or new data and featuresmay explain why the study physician read more post-im-plementation observations.
Yet while patients, institutions, and payers [46] standto benefit from EHRs, some physicians are paying withtime. For example, cost savings as a result of decreaseddictation, chart pulls, or medication ordering may finan-cially benefit the institution and payers but not the phy-sician. Since the time demands on physicians are high, aperception of increased demands, represents a majorstumbling block in EHR implementation. Therefore,good design, implementation support, financial incen-tives to increase use, or pay-for-performance programsare critical strategies to drive EHR usage by physicians.
Financial incentives to providers, proposed by theBridges to Excellence Program [47], the Center forMedicare and Medicaid Services, the Leapfrog Group,and the National Alliance for Primary Care, may helpincrease widespread usage of EHRs. Pay-for-perfor-mance programs, which reward physicians based onquality outcomes, go hand-in-hand with EHRs sinceelectronic systems can practically demonstrate qualitymeasures and physicians� adherence to practicing evi-denced-based medicine.
Further advances in technology and a continuedemphasis on design will likely produce clinical systemsthat are efficient and easy to use. The decrease in the costof hardware and high-speed processors allow for betteroverall speed in clinical systems. The web-based version
184 L. Pizziferri et al. / Journal of Biomedical Informatics 38 (2005) 176–188
of the LMR did not deplete processing resources com-pared to an older visual basic system. Operating systemupgrades have also improved system response times andreliability. Usability engineering has the potential to fur-ther improve EHRs with respect to speed, ease of use,and improved user satisfaction [48–50]. A focus onusability began early in LMR development, evident inthe consistent user interfaces across a wide variety ofscreens. In 2002, an experienced usability engineer withgraphic design skills was hired to contribute to the con-tinued design of the LMR and other clinical systemsimplemented at Partners. Involving actual users in thedesign and modification of the EHR system and con-ducting usability testing are also critical parts of EHRdevelopment.
There are still other significant barriers to EHR imple-mentation and use. The costs of implementation, sup-port, and maintenance, a lack of standards to supportdata exchange, and the challenges in selecting and evalu-ating vendor systems [12] make it difficult for institutionsor smaller practices to adopt EHRs. Financial incentivesfor EHR adoption as well as National infrastructure(federal or industry) as called for by IOM and NAPCIwould address these EHR barriers [12,51].
4.2. Limitations
This study has several limitations. The observationswere performed in clinics associated with one institutionand may not be fully generalizable to other settings. Thephysicians in the study were all general internists andhave different practice patterns than specialists. The sal-ary of physicians in the institution is primarily produc-tivity-based and this may motivate them to see morepatients despite time pressures. Also, since the observedphysicians volunteered to be observed, it is possible thatsome were more or less positive about using the LMR.However, physicians had no experience with the systemwhen they were initially recruited for pre-implementa-tion observations. Another limitation of the study is thatwe did not conduct inter-rater reliability estimates forthe observers.
The LMR system is unique to Partners and thereforemay not represent how other EHRs effect time. The re-sults suggest that a well-designed system does not re-quire more time during an overall clinic session and
the time spent reading, looking for, or writing notes isat least time neutral during clinic sessions. However, fur-ther evaluation is needed to determine the usability prin-ciples or system properties that are characteristic ofefficient EHRs.
The effect of continued experience is not evaluated inthis study. The LMR may affect time differently depend-ing on the level of experience with the system. As the post-observations were performed at least 4.5 months afterinitial implementation, we did not assess the potentialtime it took to learn the system. Overhage et al. [29] foundwhereas initially physicians took 2.2 min longer perpatient, further experience with a physician order entrysystem resulted in a time savings of 3.73 min per patient.
5. Conclusion
This study focused on the physician time barrier toEHR adoption. We conclude that the EHR does notrequire more time than a paper-based system duringa primary care session. This study demonstrates thatthe benefits of using an EHR can be achieved withoutphysicians sacrificing time with patients or other activ-ities during clinic sessions. Physicians recognize thequality improvements achieved by EHRs, indicatingthat small increases in perceived overall workloadmay be an acceptable tradeoff. Further studies shouldevaluate the impact of EHRs on time spent outsideof the clinic session. The development of methods toidentify or predict physicians who are likely to havegreater challenges in integrating EHRs into their work-flow will be important in assisting the transition frompaper-based records.
Acknowledgments
The authors wish to acknowledge Pat Carchidi, AlisonGersten, Michelle McGibbon, and Allison Benoit forassistance in coordinating the study. They also thankTony Yu,MD,MPH, and JohnOrav, PhD, for their sug-gestions and advice during data analyses andKaren Burkfor development of the data collection tool. The authorswould also like to thank and recognize the physicians,patients, and clinic staff who participated in the study.
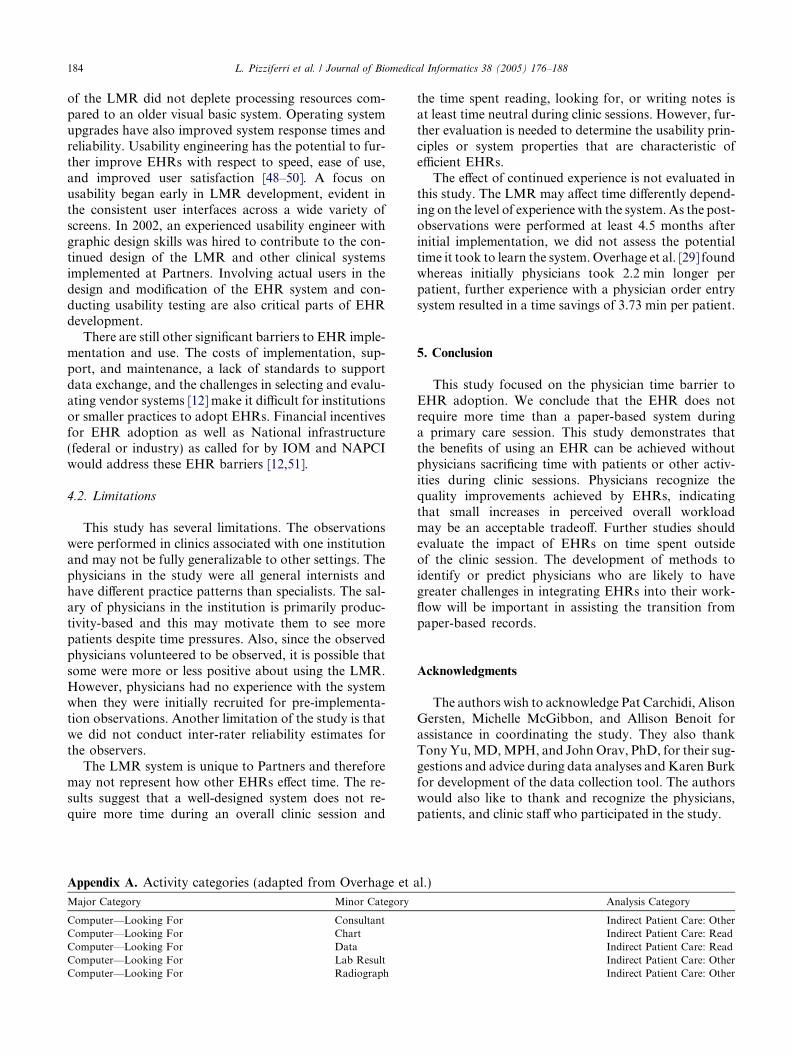
Appendix A. Activity categories (adapted from Overhage et al.)
Major Category
Minor Category Analysis CategoryComputer—Looking For
Consultant Indirect Patient Care: Other Computer—Looking For Chart Indirect Patient Care: Read Computer—Looking For Data Indirect Patient Care: Read Computer—Looking For Lab Result Indirect Patient Care: Other Computer—Looking For Radiograph Indirect Patient Care: Other
L. Pizziferri et al. / Journal of Biomedical Informatics 38 (2005) 176–188 185
Appendix A (continued)
Major Category
Minor Category Analysis CategoryComputer—Looking For
Colleague Indirect Patient Care: Other Computer—Looking For Forms Indirect Patient Care: Other Computer—Looking For Other Miscellaneous Computer—Looking For Patient Indirect Patient Care: Other Computer—Read Reviewing Dictation Indirect Patient Care: Other Computer—Read Chart Indirect Patient Care: Read Computer—Read Data (Labs and Others) Indirect Patient Care: Read Computer—Read Pt. Email Indirect Patient Care: Read Computer—Read Forms Indirect Patient Care: Read Computer—Read Drug Reference Indirect Patient Care: Other Computer—Read Schedule Administration Computer—Read Article Miscellaneous Computer—Read Literature Search Miscellaneous Computer—Read Other Miscellaneous Computer—Writing Note Indirect Patient Care: Write Computer—Writing Orders Indirect Patient Care: Write Computer—Writing Emails Indirect Patient Care: Write Computer—Writing Forms Indirect Patient Care: Write Computer—Writing Other Indirect Patient Care: Write Paper—Looking For Lab Result Indirect Patient Care: Other Paper—Looking For Radiograph Indirect Patient Care: Other Paper—Looking For Patient Indirect Patient Care: Other Paper—Looking For Colleague Indirect Patient Care: Other Paper—Looking For Consultant Indirect Patient Care: Other Paper—Looking For Forms Indirect Patient Care: Other Paper—Looking For Chart Indirect Patient Care: Read Paper—Looking For Other Miscellaneous Paper—Looking For Data Indirect Patient Care: Read Paper—Read Other Miscellaneous Paper—Read Book Miscellaneous Paper—Read Drug Reference Indirect Patient Care: Other Paper—Read Forms Indirect Patient Care: Read Paper—Read Mail Indirect Patient Care: Read Paper—Read Chart Indirect Patient Care: Read Paper—Read Schedule Administration Paper—Read Article Miscellaneous Paper—Read Data (Lab & Others) Indirect Patient Care: Read Paper—Read Review Dictations Indirect Patient Care: Other Paper—Writing Forms Indirect Patient Care: Write Paper—Writing Note Indirect Patient Care: Write Paper—Writing Mail Indirect Patient Care: Write Paper—Writing Other Indirect Patient Care: Write Paper—Writing Orders Indirect Patient Care: Write Personal Other Miscellaneous Personal Palm/Diary Miscellaneous Personal Email Miscellaneous Personal Restroom Miscellaneous Personal Idle Miscellaneous Personal Eating Miscellaneous Phone Patient Direct Patient Care Phone Dictating Notes Indirect Patient Care: Other Phone Getting Results Indirect Patient Care: Other Phone Personal Miscellaneous Phone Other Miscellaneous Phone Scheduling Tests Indirect Patient Care: Other Phone Paging Indirect Patient Care: Other Procedures Phlebotomy Direct Patient Care Procedures Other Direct Patient Care Procedures Pelvic Exam Direct Patient Care Procedures Lab Test Direct Patient Care Procedures Exam Patient Direct Patient Care Procedures Joint Inj/Asp Direct Patient Care(continued on next page)
186 L. Pizziferri et al. / Journal of Biomedical Informatics 38 (2005) 176–188
Appendix A (continued)
Major Category
Minor Category Analysis CategoryProcedures
IV Direct Patient Care Procedures EKG Direct Patient Care Talking Study Consent Miscellaneous Talking Consultant Direct Patient Care Talking Other Miscellaneous Talking Patient Direct Patient Care Talking Patient Family Direct Patient Care Talking Educating Patient Direct Patient Care Talking Colleague/Staff for Pt. Direct Patient Care Talking Advance Directives Direct Patient Care Talking Colleague/Staff for non-pt Administration Waiting Phone Indirect Patient Care: Other Waiting Other Indirect Patient Care: Other Waiting Paper Indirect Patient Care: Other Waiting Computer Indirect Patient Care: Other Waiting Patient Indirect Patient Care: Other Walking Inside Miscellaneous Walking Outside MiscellaneousAppendix B. Physician survey

L. Pizziferri et al. / Journal of Biomedical Informatics 38 (2005) 176–188 187
References
[1] Starfield B. Health care reform: the case for a primary careimperative. Health Care Manage 1994;1:23–34.
[2] Starfield B. Primary care. J Ambulatory Care Manage1993;16:27–37.
[3] Starfield B. Primary care and health. A cross-national compar-ison. JAMA 1991;266:2268–71.
[4] Starfield B. Is primary care essential?. Lancet1994;344(8930):1129–33.
[5] Schultz DV. The importance of primary care providers inintegrated systems. Healthcare Financ Manage 1995;49:58–63.
[6] Brody H. The importance of primary care for theoreticalmedicine: a commentary. Theor Med 1992;13:261–3.
[7] Rajakumar MK. The importance of primary care. J R Coll GenPract 1978;28:91–5.
[8] Molina DF, Pedreno Saura JJ, Tebar Masso FJ. Clinical andepidemiologic study of diabetic ketoacidosis. Importance ofprimary care. Med Clin 1987;88:657–60.
[9] Safran DG, Taira DA, Rogers WH, Kosinski M, Ware JE, TarlovAR. Linking primary care performance to outcomes of care. JFam Pract 1998;47:213–20.
[10] Anderson JD. Increasing the acceptance of clinical informationsystems. MD Comput 1999;16(1):62–5.
[11] Harris Interactive. European physicians especially in Sweden,Netherlands and Denmark, lead U.S. in use of electronic medicalrecords. Health Care News 2002;2(10).
[12] Bates DW, Ebell M, Gotlieb E, Zapp J, Mullins HC. A proposalfor electronic medical records in U.S. primary care. J Am MedInform Assoc 2003;10(1):1–10.
[13] Bates DW, Leape LL, Cullen DJ, Laird N, Petersen LA, TeichJM, et al. Effect of computerized physician order entry and ateam intervention on prevention of serious medication errors.JAMA 1998;280(15):1311–6.
[14] Ornstein SM. Electronic medical records in family practice: thetime is now. J Fam Pract 1997;44(1):45–8.
[15] Wager KA, Lee FW,White AW,Ward DM, Ornstein SM. Impactof an electronic medical record system on community-basedprimary care practices. J Am Board Fam Pract 2000;13(5):338–48.
[16] McDonald CJ, Blevins L, Tierney WM, Martin DK, OverhageJM. The Regenstrief Medical Record System: 20 years� experiencein hospital outpatient clinics and neighborhood health centers.MD Comput 1992;9:206–17.
[17] Balas EA, Austin SM, Mitchell JA, Ewigman BG, Bopp KD,Brown GD. The clinical value of computerized informationservices. A review of 98 randomized clinical trials. Arch FamMed1996;5(5):271–8.
[18] Shortliffe EH. The evolution of electronic medical records. AcadMed 1999;74:414–9.
[19] Balas EA, Weingarten S, Garb CT, Blumenthal D, Boren SA,Brown GD. Improving preventive care by prompting physicians.Arch Intern Med 2000;160:301–8.
[20] The computer-based patient record: an essential technology forhealth care. Washington, DC: National Academy Press; 1991.
[21] Loomis GA, Ries JS, Saywell Jr RM, Thakker NR. If electronicmedical records are so great, why aren�t family physicians usingthem?. J Fam Pract 2002;51(7):636–41.
[22] Massaro TA. Introducing physician order entry at a majoracademic medical center: I. Impact on organizational culture andbehavior. Acad Med 1993;68(1):20–5.
[23] Massaro TA. Introducing physician order entry at a majoracademic medical center: II. Impact on medical education. AcadMed 1993;68(1):25–30.
[24] Tierney WM, Miller ME, Overhage JM, McDonald CJ. Physicianinpatient order writing on microcomputer workstations. Effectson resource utilization. JAMA 1993;269:379–83.
[25] Shu K, Boyle D, Spurr C, Horsky J, Heiman H, O�Connor P,et al. Comparison of time spent writing orders on paper withcomputerized physician order entry. Medinfo 2001;10(Pt:2):2–11.
[26] Langberg M. Challenges to implementing CPOE: a case study of awork in progress at Cedars-Sinai. Mod Phys 2003;7(2):21–2.
[27] Overhage JM, Tierney WM, McDonald CJ, Pickett KE. Com-puter-assisted order entry: impact on intern time use. Clin Res1991;39(3):729A.
[28] Bates DW, Boyle DL, Teich JM. Impact of computerizedphysician order entry on physician time. Proc Annu SympComput Appl Med Care 1994;996.
[29] Overhage JM, Perkins S, Tierney WM, McDonald CJ. Controlledtrial of direct physician order entry: effects on physicians� timeutilization in ambulatory primary care internal medicine practices.J Am Med Inform Assoc 2001;8(4):361–71.
[30] Starren J, Chan S, Tahil F, White T. When seconds are counted:tools for mobile, high-resolution time-motion studies. Proceed-ings/AMIA Annual Symposium 2000;833–7.
[31] Wirth P, Kahn L, Perkoff GT. Comparability of two methods oftime and motion study used in a clinical setting: worksampling and continuous observation. Med Care 1977;15:953–60.
[32] Burke TA, McKee JR, Wilson HC, Donahue RM, BatenhorstAS, Pathak DS. A comparison of time-and-motion and self-reporting methods of work measurement. J Nurs Admin2000;30:118–25.
[33] Li Q, Middleton B. Get EMR to work smarter. Medinfo 2004;2004 CD(1718).
[34] Wald JS, Bates DW, Middleton B. A patient-controlled journalfor an Electronic Medical Record: issues and challenges. Medinfo2004:1166–72.
[35] Davis CS. Statistical methods for the analysis of repeatedmeasurements. Berlin: Springer; 2002.
[36] Kaiser Family Foundation. National Survey of Physicians PartIII: Doctors� Opinions about their Profession. March 2002.Available from http://www.kff.org/kaiserpolls. Last accessed:July 1, 2004.
[37] Folz-Murphy N, Partin M, Williams L, Harris CM, Lauer MS.Physician use of an ambulatory medical record system: matchingform and function. Proceedings/AMIA Annual Symposium1998;260–4.
[38] Travers DA, Downs SM. Comparing user acceptance of acomputer system in two pediatric offices: a qualitative study.Proceedings/AMIA Annual Symposium 2000;853–7.
[39] Keshavjee K, Troyan S, Holbrook AM, VanderMolen D,COMPLETE I. Measuring the success of electronic medicalrecord implementation using electronic and survey data. Proceed-ings/AMIA Annual Symposium 2001;309–13.
[40] Rodriguez NJ, Murillo V, Borges JA, Ortiz J, Sands DZ. Ausability study of physicians interaction with a paper-basedpatient record system and a graphical-based electronic patientrecord system. Proceedings/AMIA Annual Symposium 2002;667–71.
[41] Tierney WM, Overhage JM, McDonald CJ, Wolinsky FD.Medical students� and housestaff�s opinions of computerizedorder writing. Acad Med 1994;69:386–9.
[42] Murff HJ, Kannry J. Physician satisfaction with two order entrysystems. J Am Med Inform Assoc 2001;8(5):499–509.
[43] Lee F, Teich JM, Spurr CD, Bates DW. Implementation ofphysician order entry: user satisfaction and self-reported usagepatterns. J Am Med Inform Assoc 1996;3(1):42–55.
[44] O�Connell RT, Cho C, Shah N, Brown K, Shiffman RN.Take note(s): differential EHR satisfaction with two implemen-tations under one roof. J Am Med Inform Assoc 2004;11(1):43–9.

188 L. Pizziferri et al. / Journal of Biomedical Informatics 38 (2005) 176–188
[45] Gardner RM, Lundsgaarde HP. Evaluation of user acceptance of aclinical expert system. J AmMed Inform Assoc 1994;1(6):428–38.
[46] Siegrist Jr RB, Kane NM. Exploring the relationship betweeninpatient hospital costs and quality of care. Am J Manag Care2003. Spec-9.
[47] Bridges to Excellence. Bridges to Excellence: Rewarding Qualityacross the Healthcare System. 2003. Available from http://www.bridgestoexcellence.com/bte. Last accessed: July 1, 2004.
[48] Cimino JJ, Patel VL, Kushniruk AW. Studying the human–computer-terminology interface. J Am Med Inform Assoc2001;8(2):163–73.
[49] Sittig DF, Kuperman GJ, Fiskio J. Evaluating physician satisfac-tion regarding user interactions with an electronic medical recordsystem. Proceedings/AMIA Annual Symposium 1999;400–4.
[50] Rosenbaum S, Hinderer D, Scarborough P. How usabilityengineering can improve clinical information systems. Paperpresented at Usability Professionals� Association Meeting 1999.Available from http://www.teced.com/PDFs/upa99sr.pdf. Lastaccessed: July 1, 2004.
[51] Institute of Medicine. Crossing the quality chasm: a new healthsystem for the 21st century. Washington, DC: National AcademyPress; 2001.