PRICE VARIATION OF VEGETABLES IN DIFFERENT SEASONS …
271
PRICE VARIATION OF VEGETABLES IN DIFFERENT SEASONS WITH REFERENCE TO ORGANIZED RETAILERS Doctoral Thesis Submitted In partial fulfillment of the requirements for the award of the degree of DOCTOR OF PHILOSOPHY In MANAGEMENT By SHAKIL ANWAR SIDDIQUE Under the guidance of ICFAI UNIVERSITY JHARKHAND RANCHI JULY, 2019 Dr. Birendra Goswami (Research Supervisor) Assistant Professor ICFAI University Jharkhand Ranchi, India Dr. Amar Eron Tigga (Research Co-Supervisor) Professor XISS, Ranchi, Jharkhand, India
Transcript of PRICE VARIATION OF VEGETABLES IN DIFFERENT SEASONS …
PRICE VARIATION OF VEGETABLES IN DIFFERENT
SEASONS WITH REFERENCE TO ORGANIZED
RETAILERS
Doctoral Thesis Submitted
In partial fulfillment of the requirements for the award of the degree of
DOCTOR OF PHILOSOPHY
In
MANAGEMENT
By
SHAKIL ANWAR SIDDIQUE
Under the guidance of
ICFAI UNIVERSITY JHARKHAND
RANCHI
JULY, 2019
Dr. Birendra Goswami
(Research Supervisor)
Assistant Professor
ICFAI University Jharkhand
Ranchi, India
Dr. Amar Eron Tigga
(Research Co-Supervisor)
Professor
XISS, Ranchi,
Jharkhand, India
ii
THESIS COMPLETION CERTIFICATE
This is to certify that the research thesis titled – “Price Variation of
Vegetables in Different Seasons with reference to Organized Retailers”
submitted by Mr. Shakil Anwar Siddique, in Partial fulfillment of the
requirements for the award of the Degree of Doctor of Philosophy in
Management by the ICFAI University Jharkhand is an original work carried
out by him under our joint guidance.
It is certified that the work has not been submitted anywhere else for the
award of any other Degree or Diploma of this or any other University. We
also certify that he complied with the Plagiarism Guidelines of the
University.
Dr. Birendra Goswami Assistant Professor
ICFAI University Jharkhand
Ranchi, India
(Research Supervisor)
Dr. Amar Eron Tigga Professor
Xavier Institute of Social
Service (XISS)
Ranchi, India
(Research Co-Supervisor)

iii
DECLARATION OF AUTHORSHIP
I declare that this thesis entitled “Price Variation of Vegetables in
Different Seasons with reference to Organized Retailers” submitted by
me in fulfillment of the requirements for the award of the degree of Doctor
of Philosophy of the ICFAI University Jharkhand, Ranchi is my own work.
It contains no material previously published or written by another person,
nor material which has been accepted for the award of any other degree or
diploma of the university or other institute of higher learning, except where
due acknowledgment has been made in the text. I further state that I
complied with the plagiarism guidelines of the university, while preparing
the thesis.
(Shakil Anwar Siddique)
UID No. 14JU11300023
Date:
Place:
iv
ACKNOWLEDGEMENT
It is really a matter of pleasure for me to get an opportunity to thank all the
persons who contributed directly or indirectly for the successful completion
of the Theses, ―Price Variation of Vegetables in Different Seasons with
reference to Organized Retailers‖. At first, I would like to thank Dr.
Birendra Goswami, my Ph.D. supervisor and Dr. Amar Eron Tigga, my
Ph.D. Co supervisor. Both of them have been inspiring, challenging and
supportive in equal measure, and I consider myself very privileged to have
worked under their guidance and support.
I am indebted to the Research Board of the ICFAI University Jharkhand
headed by honorable Vice-Chancellor of the University that contributed in
enabling a quality research by way of its suggestions in the various half-
yearly progress reviews and would like to specifically thank our respected
Vice Chancellor (Prof. O R S Rao)for his constant support and
encouragement.
I would like to thank Dr. B. M. Singh, Dr. Rumna Bhatcharraya, Dr. K. K.
Nag, Dr. Hari Haran, Dr. Raj Kumar, Dr. Mridanish Jha, and Dr. Sudipto
Majumdar, Dr. Pallavi Kumari for their constant support. I would also like to
thank all the staff-members of ICFAI University Jharkhand, my colleagues
and my fellow research scholars for their help all throughout the journey of
my Ph.D.
I would also thank to my department colleagues, college colleagues for their
endless support and cooperation throughout the journey of my PhD.
v
Special thanks to Prof. Dr. Vanshi Dhar for his kind effort and cooperation.
My deepest gratitude to God Almighty for his grace and blessings in
completing my Ph.D. Program.
Last but not the least I am particularly grateful to all my relatives, I would
like to thank My Mom and Dad, my Wife, my Sons (Tamjid & Tanzeel), my
Brother, Sister-in-law, My niece and nephew (Tasneem & Tahmeed) who
had scarified and contributed a lot throughout my Ph.D. journey. I would
not have been able to do this without their constant encouragement and
support.
(Shakil Anwar Siddique)
UID No. 14JU11300023
Date:
Place:

vi
EXECUTIVE SUMMARY
After China the second largest in population with various socio economical
groups of peoples is India. Similar to dialects, their food habits also vary
with every kilometer. The vegetables are basic piece of the day by day diet
in India. From the most sections of the population, the vegetables are in
great demand throughout the year. As the vegetables constitute of major
source of minerals and vitamins it was found that globally there are around
2.7 million annually deaths happen because of low consumption of
vegetables, Sachdeva et al, (2013). The vegetables are perishable products
under the natural conditions.
The changing socio-economic scenario of Indian consumers and also
change in processing and pattern of trade, the commercial value of
vegetables has risen substantially.
In India the average monthly expenditure per capita on vegetables was
Rs.87.33 (rural) and Rs. 112.44 (urban) which has increased manifold in
present time [NSSO Survey 2009 -10]. Their financial significance has
additionally expanded and high work force in the generation of most
vegetable creation likewise makes them significantly from the business
edge. Sharma, (1991). Increment in regional distribution under plant crops -
proposed as a measure for horticultural broadening, expanded business and
pay. Malik (1998)
In light of these problems, this research hopes to assess the economic
situation for vegetables from farmers to organized sector. This topic itself
becomes very important as stable price helps both the consumers and farmer.
This also helps in economic growth and development of a region/country.
vii
The findings of the study may help to provide a better path in terms of
quality and price of green vegetables.
In light of these problems, this study seeks to assess the market environment
for vegetables in the organized retail sector. It will examine various aspects
of vegetable marketing such as market infrastructure, marketing practices,
marketing costs etc. in the wholesale markets in the selected area. The study
will further attempt to identify the prevailing value chain and the variation of
price of the vegetables from the Farmer → The Mahajans → The Agent →
The Wholesaler → The Retailer → The Consumer in terms of costs, prices
and their shares in the selected markets.
Prices of vegetables are governed by the law of supply and demand. When
the supply of any vegetable exceeds the demand for that product, prices tend
to be lower than average.
If we talk about the perishable product it very sensitive regarding the price
and that due to following reasons:
1. Very short shelf- life
2. Local production system
3. Import and export are very limited
4. These perishable products i.e. vegetables consumed locally
5. Very low influences are there by the distant consumers
6. Consumers also prefer the local products due to its freshness and quality
7. These products are sensitive to production due to environmental and
climate factor.
8. Other factors are also important in price influence.
The farmers are the only reason why an organized retail are in vegetables
business and providing fresh vegetables to their end users, so satisfying the

viii
farmers will ultimately make retail business like Reliance Fresh, Big Bazaar,
Vegfresh more profitable in terms of Perishable food products. There is a
need to feature the significance of a farmer‘s administration in worth
arrangement. An atmosphere that accentuates graciousness, ability and a
workplace that advances solid working relationship and strengthening. The
goal of this Research is to get help from farmer's input for not just recognize
issue zones with respect to the development of vegetables yet in addition
give the most ideal cost to their work. This examination will likewise show
to farmers that we give it a second thought and are proactive in searching for
approaches to improve the administration.
The present research was gone through different phrases which are
following:
STAGE -1: Visit to the different area of Ranchi city like Brambe, Mandar,
Chanho, Bero and Pithoria know about the total presence of farmers. The
second side was known since it is regarding the organized retail stores in
Ranchi which are in limited numbers.
STAGE 2: The next stage was to interact with the farmers and take their
feedback on the questionnaire regarding the production of vegetables, kind
of land they use for the cultivation, the total area of cultivation of different
vegetables, the seasons variety of vegetables, the cost of production of these
vegetables, the post harvest losses if any, who fixes the prices of these
vegetables, major constraints regarding the marketing and production of
these vegetables.
On the second hand of the stage-2, the organized retailer were interviewed
regarding the processing of these vegetables, purchasing and selling of these
vegetables, cost of transportation, packaging, merchandising, reprocessing,

ix
or any other cost. Other than the cost they are also interviewed regarding the
storage facilities and availability of distributors/intermediaries in this
business.
STAGE-3: Analysis was done on the basis of the questionnaire filled up and
the suggestions made by the respondents.
Further analyzing the researcher found that this research named ―Price
Variation of Vegetables in Different Seasons With Reference To Organized
Retailers‖ was really the worthwhile to understand the pricing variation of
vegetables in different seasons from farmers to organized retail chain and
from organized retail chain to the end user.
But the line organizational functional systems are there having three
strategic points which are:
a. Producer/Farmers
b. Marketer/Intermediaries
c. End consumer
After interacting with the farmers and retailers, the researcher came into the
conclusion that producer/farmers are not realizing their perfect profiting
condition and they compile to hand over their production to the vested
interested marketing group who has the key capacity to mechanize the
pricing system or we can say that this marketer group has the ultimate power
in deciding the pricing system of the various products (vegetables). So it is
very much a middle man dependant system. On the other hand, the
consumers are compelled to buy different vegetables products as per their
market price. But as per the present economic system, there are certain hope
arises with the action of the government. The Government is now planning
to support this system with exchange commodity with forward system,
x
scientific support as well as developing chain cold stores not only for potato
or onion but for all vegetables. We hope that after 2025, the scenario will be
changed with the price mechanism management of these products and a fair
pricing formula with these products.
The essential focal point of this research paper is to know about the variation
of price of vegetables in different seasons along with difficulties and issues
of supply chain of vegetables. And furthermore to discover the variation in
vegetables price, which emerge because of the nearness of various middle
people and appropriation levels. In this research the extensive literature
review is the base and the idea got from both the essential and auxiliary
sources. The exertion is relied upon to give an understanding of the issues
and would endeavor to recommend remedial measures for cost advancement
and effectiveness in the production network of vegetables from the producer
(farmers) to the consumer. The essential issue lies with a supply chain that
climbs the costs of these vegetables. Farmers are not getting imperative
acknowledgment of cost proportionate with their endeavors because of
absence of storerooms, poor market data and unorganized supply chain.
There are different vegetables models and literature that exists which
support that there is a variation in price of the vegetables from farmers to
buyer through the presence of different intermediaries.
This research also states that the farmer does not get the actual value of their
vegetables because of the existence of the intermediaries know as Mahajans.
These people negotiate the price from the farmers and buy the vegetables in
bulk and then sell those vegetables as per their pricing system, since there is
a storage problem and a chance of waste dump the farmers sell their

xi
vegetables as the intermediaries said price, due to which they are unable to
charge as per their need and requirement.
On the other hand the farmers does have a proper marketing channel through
which they can communicate with their customers like retailers, many of
farmers produce the vegetables and come to sell in the market but not able to
sell directly in a single day of operation due to which they have to take back
the balance vegetable along with them which result more cost in terms of
transportation or damage of the vegetables, so every farmers want to sell
their vegetables in the same day of operation whether in good price or at
average price. Thus, with this an intermediary takes an advantage and
maximizes their margin instead of giving the value price to the farmers.
Due to the existence of these channel end-users have to pay more for these
vegetables in every season whether it is pre-monsoon, monsoon or post-
monsoon.
To overcome with this problem, it is revealed from the study that many of
the farmers who do not want to invest so much of cost in production they
simply give their some portion of land into contract farming and lease, the
rest they keep for themselves and cultivate the limited amount of the
vegetables which are later on sold to the specific Mandi and from there the
farmers can earn more as compared to other.
There is a major price variation in price of some selected vegetables. There
is a maximum variation regarding Tomato, Brinjal, Beans and Bottle Gourd.
The farmers do not get appropriate value for their produce vegetables. Due
to lack of storage they can‘t be able to hold back these vegetables with them
for an extensive stretch of time after the cultivation because perishability in
nature, so they have to sell within a particular period of time at the
xii
intermediary‘s price. The result the farmer does not get proper value and
intermediaries like mahajans and other intermediaries earn more than the
farmers. These intermediaries also play a vital role in fixitation of the
vegetables price and sell in the market in accordance to their convenience.
There is a variation in price and quantity of different vegetables i.e.
Cauliflower, Cabbage, Beans, Bottle Gourd, Brinjal and Tomato at different
seasons regarding the average productivity, average production cost, average
packaging cost and average transportation cost. The average productivity,
the average production cost, the average packaging cost and the average
transportation cost were found the highest for all the concerned vegetables
during the post monsoon season which is at par with the monsoon season.
The average productivity is significantly higher during the monsoon and
post monsoon seasons than pre monsoon season. There is also a Percentage
of Price variation between two seasons regarding total cost of production,
selling price from the farmers to the retailers, selling price from retailers to
consumers for major concerned vegetables i.e. Cauliflower, Cabbage, Beans,
Bottle Gourd, Tomato and Brinjal.
xiii
Table of Contents
PART 1
THESIS COMPLETION CERTIFICATE ii
DECLARATION OF AUTHORSHIP iii
ACKNOWLEDGEMENT iv
EXECUTIVE SUMMARY vi
TABLE OF CONTENTS xiii
LIST OF FIGURES xvii
LIST OF TABLES xx
PART 2
Chapter No. Description of the Chapters Page No.
Chapter 1 Introduction
1.1 Overview 2
1.2 Description of the Study 12
1.3 History of Concerned Vegetables 26
1.4 Organization Profile 50
1.5 Business Models of Vegetables Retailers 58
1.6 Price Variation of Vegetables 75
1.7 Motivation for the Study 83
1.8 Scope of the Study 83
Chapter 2 Literature Review
2.1 Price Mechanism & Marketing of Vegetables 86
2.2 Supply Chain Management & Small Holder
Farmers
91
2.3 Supply Chain Management of Vegetables 94

xiv
2.4 Micro-Farming Situations and Bio-Physical
Factors Related to Vegetable Production
102
2.5 Production Problems, their Causes and Constraints 108
2.6 Association of Socio-Economic Variables with
Knowledge, Attitude Adoption of Improved
Technologies
116
2.7 Adoption Behavior of Farmers with respect to
Vegetable Production Technologies
119
2.8 Characteristic of Agricultural Products like Milk 121
2.9 Research Gap 122
Chapter 3 Research Methods and Techniques
3.1 Overview 124
3.2 Statement of the Problem 125
3.3 Objective of the Study 127
3.4 Pilot Study 128
3.5 Hypothesis Formulation 133
3.6 Research Design 135
3.7 Sampling Plan 136
Chapter 4 Data Analysis and Interpretation
4.1 Overview 140
4.2 The Cost of Different Agricultural Inputs For
Selected Vegetables
142
4.3 Price Variation of Vegetables from Vegetables
Growers with respect to Organized Retail Stores
149
4.3.1 Price Variation of Vegetables across the Seasons 149
4.3.2 Price Variation of Vegetables in Particular 163

xv
Seasons
4.3.3 Price Variation of all Vegetables in Different
Seasons
166
4.4 Anova for Average Productivity, Average Cost of
Production, Average Cost of Transportation and
Average Cost of Packaging of different
Vegetables i.e. Cauliflower, Cabbage, Beans,
Bottle Gourd, Brinjal and Tomato at different
seasons (Pre Monsoon, Monsoon and Post
Monsoon)
168
Chapter 5 Results, Discussion and Conclusion
Major Findings 196
Observations on the basis of Research Survey 197
Suggestions on the basis of Research Survey 198
Conclusion 199
Scope of Future Research 200
Research Contribution 200
Limitations 201
References 202
Webliography 224
Annexure I
A Survey Questionnaire for the Organized Retail Stores 226
B Survey Questionnaire for the Farmers 228
Annexure II
A Data Collected During the Research Survey 231
B Scale of Finance for Total Cost of Cultivation 232

xvi
C Previous 12 Years National Horticulture Board Report
regarding the Price of Farmers and Organized
Retailers
233
Annexure III
Research Paper Presented & Published 245

xvii
PART 3
LIST OF FIGURES
Figure No. Description of the Figures Page No.
Figure 1.1 Variety of Brinjal 40
Figure 1.2 Organizational structure of Reliance Fresh/Smart 54
Figure 1.3 Food Retail Chain of Reliance Fresh/Smart 54
Figure 1.4 Farm to Fork Model 55
Figure 1.5 Logistics of Traditional Retail Model 60
Figure 1.6 Various sources through which the Marketing of
Vegetables is done
65
Figure 1.7 Different Marketing Channel of Vegetables 66
Figure 1.8 Hub and Spoke Model 68
Figure 1.9 Value Chain Model 71
Figure 1.10 Supply Chain Operation at Ranchi from Farmers To
Retailers
72
Figure 1.11 Supply Chain in Vegetables Industries 73
Figure 1.12 Supply Chain of Vegetables 73
Figure 1.13 Distribution of Vegetables in Ranchi Market 74
Figure 1.14 Reasons why Vegetables Price keeps Fluctuating 78
Figure 1.15 Factors that affect the Price of the Vegetables in
Ranchi Local Mandi
81
Figure 3.1 Price Variation of different Vegetables 132
Figure 4.1 Vegetables Seeds Cost at Different Seasons for
Selected Vegetables
142
Figure 4.2 Cost of Labor in Different Seasons for Selected
Vegetables
143

xviii
Figure 4.3 Cost of Fertilizer in Different Seasons for Selected
Vegetables
144
Figure 4.4 Cost of Irrigation in Different Seasons for Selected
Vegetables
145
Figure 4.5 Cost of Insecticide in Different Seasons for Selected
Vegetables
146
Figure 4.6 Season Variability of Selected Vegetables 147
Figure 4.7 Average Distribution of Land During Cultivation
for Selected Vegetables In Different Seasons
148
Figure 4.8 Price Variations of Cauliflower across the Seasons 149
Figure 4.9 Percentage of Price Variation of Cauliflower with
respect to Total Cost of Cultivation, Selling Price of
the Farmers and Selling Price of the Organized
Retailers between two Different Seasons
151
Figure 4.10 Price Variations of Cabbage across the Seasons 152
Figure 4.11 Percentage of Price Variation of Cabbage with
respect to Total Cost of Cultivation, Selling Price of
the Farmers and Selling Price of the Organized
Retailers between two Different Seasons
153
Figure 4.12 Price Variations of Beans across the Seasons 155
Figure 4.13 Percentage of Price Variation of Beans with respect
to Total Cost of Cultivation, Selling Price of the
Farmers and Selling Price of the Organized
Retailers between two Different Seasons
156
Figure 4.14 Price Variations of Bottle Gourd across the Seasons 157
Figure 4.15 Percentage of Price Variation of Bottle Gourd with 158

xix
respect to Total Cost of Cultivation, Selling Price of
the Farmers and Selling Price of the Organized
Retailers between two Different Seasons
Figure 4.16 Price Variations of Tomato across the Seasons 159
Figure 4.17 Percentage of Price Variation of Tomato with
respect to Total Cost of Cultivation, Selling Price of
the Farmers and Selling Price of the Organized
Retailers between two Different Seasons
160
Figure 4.18 Price Variations of Brinjal across the Seasons 161
Figure 4.19 Percentage of Price Variation of Brinjal with respect
to Total Cost of Cultivation, Selling Price of the
Farmers and Selling Price of the Organized
Retailers between two Different Seasons
162
Figure 4.20 Price Variations of Different Vegetables in Pre-
Monsoon
163
Figure 4.21 Price Variations of Different Vegetables in
Monsoon
164
Figure 4.22 Price Variations of Different Vegetables in Post-
Monsoon
165
Figure 4.23 Price Variations of Different Vegetables in
Different Seasons
167

xx
PART 4
LIST OF TABLES
Table No. Description of the Table Page No.
Table 1.1 Demographic Features of the Jharkhand State (2015) 13
Table 1.2 Monthly Temperature and Monthly Rainfall during
2016
14
Table 1.3 Profile of Brambe 19
Table 1.4 Profile of Chatwal 20
Table 1.5 Profile of Mandar 21
Table 1.6 Profile of Murma 23
Table 1.7 Profile of Thakurgoan 24
Table 1.8 Profile of Boreya 25
Table 1.9 Nutritional Value of Cauliflower 29
Table 1.10 The Cultivars Use of Cauliflower 30
Table 1.11 Nutritional Value of Cabbage 34
Table 1.12 The Cultivars Use of Cabbage 35
Table 1.13 The Variety of Tomato 39
Table 1.14 Nutritional Value of Brinjal 41
Table 1.15 Nutritional Value of Bottle Gourd 45
Table 1.16 Nutritional Value of Beans 49
Table 3.1 The Price Variation of Selected Vegetables 131
Table 3.2 Sampling Frame 137
Table 3.3 Revised Sample 138
Table 4.1 Total Cost Incurred by the Farmers, Farmer Selling
Price, Consumer Price, Price Variation of Cauliflower
Across the Seasons
149

xxi
Table 4.2 Total Cost Incurred by the Farmers, Farmer Selling
Price, Consumer Price, Price Variation of Cabbage
Across the Seasons
152
Table 4.3 Total Cost Incurred by the Farmers, Farmer Selling
Price, Consumer Price, Price Variation of Beans
Across the Seasons
155
Table 4.4 Total Cost Incurred by the Farmers, Farmer Selling
Price, Consumer Price, Price Variation of Bottle
Gourd Across the Seasons
157
Table 4.5 Total Cost Incurred by the Farmers, Farmer Selling
Price, Consumer Price, Price Variation of Tomato at
Different Seasons
159
Table 4.6 Total Cost Incurred by the Farmers, Farmer Selling
Price, Consumer Price, Price Variation of Brinjal at
Different Seasons
161
Table 4.7 Price Variations of Different Vegetables in Pre-
Monsoon
163
Table 4.8 Price Variations of Different Vegetables in Monsoon 164
Table 4.9 Price Variations of Different Vegetables in Post-
Monsoon
165
Table 4.10 Total Cost Incurred by the Farmers, Farmer Selling
Price, Consumer Price, Price Variation of all
Vegetables at Different Seasons
166
Table 4.11 Descriptive Statistics for Average Productivity of
Cauliflower in Tons in Different Seasons
168
Table 4.12 Anova for Average Productivity of Cauliflower in 168
xxii
Tons in Different Seasons
Table 4.13 Descriptive Statistics for Average Productivity of
Cabbage in Tons in Different Seasons
169
Table 4.14 Anova for Average Productivity of Cabbage in Tons
in Different Seasons
169
Table 4.15 Descriptive Statistics for Average Productivity of
Beans in Tons in Different Seasons
171
Table 4.16 Anova for Average Productivity of Beans in Tons in
Different Seasons
171
Table 4.17 Descriptive Statistics for Average Productivity of
Bottle Gourd in Tons in Different Seasons
172
Table 4.18 Anova for Average Productivity of Bottle Gourd in
Tons in Different Seasons
172
Table 4.19 Descriptive Statistics for Average Productivity of
Tomato in Tons in Different Seasons
173
Table 4.20 Anova for Average Productivity of Tomato in Tons in
Different Seasons
173
Table 4.21 Descriptive Statistics for Average Productivity of
Brinjal in Tons in Different Seasons
174
Table 4.22 Anova for Average Productivity of Brinjal in Tons in
Different Seasons
174
Table 4.23 Descriptive Statistics for Average Production Cost of
Cauliflower in Tons in Different Seasons
175
Table 4.24 Anova for Average Production Cost of Cauliflower in
Tons in Different Seasons
175
Table 4.25 Descriptive Statistics for Average Production Cost of 176
xxiii
Cabbage in Tons in Different Seasons
Table 4.26 Anova for Average Production Cost of Cabbage in
Tons in Different Seasons
177
Table 4.27 Descriptive Statistics for Average Production Cost of
Beans in Tons in Different Seasons
177
Table 4.28 Anova for Average Production Cost of Beans in Tons
in Different Seasons
178
Table 4.29 Descriptive Statistics for Average Production Cost of
Bottle Gourd in Tons in Different Seasons
179
Table 4.30 Anova for Average Production Cost of Bottle Gourd
in Tons in Different Seasons
179
Table 4.31 Descriptive Statistics for Average Production Cost of
Tomato in Tons in Different Seasons
180
Table 4.32 Anova for Average Production Cost of Tomato in
Tons in Different Seasons
180
Table 4.33 Descriptive Statistics for Average Production Cost of
Brinjal in Tons in Different Seasons
181
Table 4.34 Anova for Average Production Cost of Brinjal in
Tons in Different Seasons
181
Table 4.35 Descriptive Statistics for Average Transportation
Cost of Cauliflower in Tons in Different Seasons
182
Table 4.36 Anova for Average Transportation Cost of
Cauliflower in Tons in Different Seasons
183
Table 4.37 Descriptive Statistics for Average Transportation
Cost of Cabbage in Tons in Different Seasons
184
Table 4.38 Anova for Average Transportation Cost of Cabbage 184

xxiv
in Tons in Different Seasons
Table 4.39 Descriptive Statistics for Average Transportation
Cost of Beans in Tons in Different Seasons
185
Table 4.40 Anova for Average Transportation Cost of Beans in
Tons in Different Seasons
185
Table 4.41 Descriptive Statistics for Average Transportation
Cost of Bottle Gourd in Tons in Different Seasons
186
Table 4.42 Anova for Average Transportation Cost of Bottle
Gourd in Tons in Different Seasons
186
Table 4.43 Descriptive Statistics for Average Transportation
Cost of Tomato in Tons in Different Seasons
187
Table 4.44 Anova for Average Transportation Cost of Tomato in
Tons in Different Seasons
187
Table 4.45 Descriptive Statistics for Average Transportation
Cost of Brinjal in Tons in Different Seasons
188
Table 4.46 Anova for Average Transportation Cost of Brinjal in
Tons in Different Seasons
188
Table 4.47 Descriptive Statistics for Average Packaging Cost of
Beans in Tons in Different Seasons
189
Table 4.48 Anova for Average Packaging Cost of Beans in Tons
in Different Seasons
190
Table 4.49 Descriptive Statistics for Average Packaging Cost of
Bottle Gourd in Tons in Different Seasons
191
Table 4.50 Anova for Average Packaging Cost of Bottle Gourd
in Tons in Different Seasons
191
Table 4.51 Descriptive Statistics for Average Packaging Cost of 192

xxv
Tomato in Tons in Different Seasons
Table 4.52 Anova for Average Packaging Cost of Tomato in
Tons in Different Seasons
192
Table 4.53 Descriptive Statistics for Average Packaging Cost of
Brinjal in Tons in Different Seasons
193
Table 4.54 Anova for Average Packaging Cost of Brinjal in Tons
in Different Seasons
193

CHAPTER 1
INTRODUCTION
2
INTRODUCTION
The chapter Introduction deals with the detailed information that has considered for the
study and research work. The chapter introduction is divided into various segments which
are:
1.1 Overview
1.2 Description of the study
1.3 History of Concerned Vegetables
1.4 Organization Profile
1.5 Business Models of Vegetables Retailers
1.6 Price Variation of Vegetables
1.7 Motivation for the Study
1.8 Scope of the Study.
1.1 Overview
India is a big country by population and by geographical area. There are many religions,
caste and creed and living with their natural food habit across India. Due to living
differentiation the food habits are also different, especially vegetable food products. The
demand of the vegetables varies from one region to another. Generally, vegetables that
are in demand by the local population are grown locally or in its adjoining area. These
vegetables come under the perishable product category under the natural conditions.
The efficiency of marketing for vegetables in India has been of significant concern in the
recent years. It is very poor capability in the advertising channels and inadequate
showcasing foundation are acknowledged to be the reason for high and fluctuating
customer costs, yet in addition excessively less of the end users rupee achieving the
farmers. (Kaul 1997, Ashturker and Deole 1985).
Indian farmers normally depend completely on middlemen especially when we talk about
the vegetable market. The purchaser and the farmers frequently receive a poor
arrangement and the go between control the market, however don't include much worth.
There is additionally gigantic wastage, decay in quality just as the successive befuddle

3
among interest and supply both involving and after some time (Subbanarasiah 1991,
Singh M. et.al. 1985).
Vegetables consistently contain a fundamental piece of diet in India and from most areas
of the majority they are in great in demand round the year. The estimated business of
vegetables to the extent quick use, getting ready similarly as trade has risen altogether
recently. Their money related importance has in like manner extended and high work
influence in the formation of most vegetables age furthermore makes them huge from the
business point too, Sharma (1991). Increment in region allotment under plant yields has
frequently been recommended as a measure for farming broadening, expanded work and
salary , Malik, (1998).
In light of these issues, this study tries find out the variation of price of the vegetables in
different seasons with reference to organized retail. The investigation will further
endeavor to distinguish the common worth chain from The Farmer → The mahajans →
The Agent → The Wholesaler → Retailer → Consumer costs and their offers in the
markets. Costs of vegetables are administered by the law of free market activity. At the
point when the supply of any vegetable surpasses the interest for that item, costs will in
general be lower than normal. Similarly, when the demand exceeds the supply, prices
tend to rise. Often small changes in quantities offered for disposal on the National
Markets have a magnified effect on prices. The year-round availability of processed
vegetables (frozen, canned and, to a lesser extent, dehydrated) may reduce demand for
the fresh product, particularly when prices are inflated. The availability of other products,
which can be used as substitutes for a particular vegetable, may also play a role. Thus,
when potatoes are very expensive, there is a greater consumption of sweet potatoes, rice
and maize products. Various vegetable marrows or squash may substitute for pumpkins.
The demand for a specific vegetable is also affected by changes in consumer preferences
and eating patterns, and by change of the season. Serving of mixed greens harvests are
progressively famous during the hotter summer months, while those vegetables utilized
for cooking and for soups are more sought after during the cooler, winter period. Changes
in expectations for everyday comforts, and expanding urbanization of the populace,
influence the sort of sustenance that families devour. At the point when costs have been

4
anomalous high for a few while, numerous farmers who don't ordinarily develop the
specific harvest endeavor to benefit from these costs by developing the yield. This
prompts over-supply of the item, with resultant low costs. After times of low costs, a few
cultivators suspend generation, bringing about a drop in supply and more expensive rates.
It is typically just the steady maker who makes a money related accomplishment of
vegetable cultivating over the long haul. The overall atmosphere in the creation regions is
the significant reason for variances in the occasional supply of vegetables, and along
these lines of costs. Ice delicate yields are typically just delivered in summer in many
territories of the nation. The supply of vegetables intolerant of cold temperatures
increases in summer, and lower prices prevail for these crops. In winter, and particularly
in spring, creation of such warm-season harvests is confined to a couple of ice free
territories. Makers in such zones may in this manner anticipate more expensive rates for
their items. The contrary pattern happens with warmth touchy harvests, which require
cooler conditions for best yields and quality. In such cases, costs will in general be lower
in winter and spring and higher in the mid year to-harvest time period Another
complicating factor is that, while the climate at a particular time of year may favor crop
growth, it may also favor disease development or pest incidence. This may make
creation of a particular vegetable progressively troublesome, or all the more expensive,
with the additional contribution of fundamental control measures. Misfortunes from bugs
and ailments can influence the supply circumstance, and costs at that season will ascend
with deficiencies. Aside from occasional patterns, the powers of nature can have an
exceptionally checked impact on provisions and costs acknowledged for vegetables. For
instance, floods, hail, tempests or illness may cause an unseasonal lack of a specific yield,
and costs can rise drastically. Substantial downpours may postpone gathering tasks. This
could result in a sharp ascent in crisp produce costs, trailed by a droop when abundance
supplies achieve the market with synchronous gathering of the postponed harvests.
Regardless of the considerable number of elements which are equipped for influencing
business sector costs, there are particular regular value patterns. This reality can be
utilized to advantage by any planned producer, gave that the ecological conditions at his
creation unit take into consideration the generation of a particular harvest when

5
progressively good costs are likely. In general, production of good yields of quality
vegetables will be economic, even with relatively depressed prices. In India perishable
product like vegetables are very price sensitive basically due to following reasons:
1. Very short shelf life
2. Local production system
3. Import and export are very limited
4. More over these types of product are consumed locally
5. Very low influences are there by the distant consumers
6. Consumers also prefer the local products due to its freshness and quality
7. These products are sensitive to production due to environmental and climate factor.
8. Other factors are also important in price influence.
Although Perishable Products include localized production and consumption, there is a
limited scope of export. Even then there is an increasing trend of transporting to various
possible distant places due to the availability of more logistics and supply chain facilities
but still at certain limited geographical locations. Agricultural products are generally
considered as perishable apart from milk and fruits which have more shelf life than
vegetables. In general, most of the perishable products are dependent on local market
and nearby market within the periphery of 100 to 200 kilo meters for its consumption.
This is due to the fact that these products are not generally considered for keeping it in
cold storages because forward trading on the entire agricultural products are not possible.
These are some of the important factors and considerations responsible for high level
variation in prices of major green vegetables which impacts not only the economy but
also the producers and consumers to a large impact. Thus understanding the price
variation of major vegetables is an important to develop suitable strategies which will not
only help the various stakeholders involved but also for the economy of our country.
One of the important agricultural products is Green Vegetable which is also one of the
most important food items for day to day life of an individual or a family. This is also one
of the most frequently purchased and consumed products for all. And this is one of the
most important sources of nutrients (vitamins, minerals etc.) for people across their living
standard. Globally, 2.7 million (4.9%) deaths annually happen because of low

6
consumption of fruits and vegetables, which also a matter of concern (Sachdeva etal,
2013). Thus, one of the major challenges to a government is to provide the vegetables of
the right quality and an affordable price.
Considering the increase in health issue and requirement of people diet for the growth of
an individual or a nation at large is making the availability of green vegetables more
important.
Thus, the government should focus on the price of the vegetables because it is the day to
day necessity to an individual or families. The Govt. gives a lot of importance to control
or manage the price of vegetables but the output is always questionable. The end user
who purchases these from various retail markets finds difficult to understand its price
variation.
Also, the Govt. has developed policies and framework for controlling the vegetables price
but then also not they are unable to understand the real dynamic of its price variation.
Therefore it become very important to study and recognize the elements which influence
the cost of green vegetables and also suggest some measures to have better control on the
mechanism so that our nation can get good green vegetables at its best price.
98% of vegetable Retail marketing is limited to unorganized sector, its effects the
consumer price stability.
Due to perishable nature of products, over production and short production cause extreme
price fluctuations are there and its effects consumer price of vegetables.
Vegetable market in the organized sector is nearly absent or its presence is very
negligible, its increase the ultimate price of vegetable for the consumer.
In India Perishable Product are very sensitive to the price due to its very short shelf life
and local productive system, import and export are very limited due to which high pricing
on neighborhood and may demerged the farmer interest in the country. More over these
types of product are consumed locally by the local consumers and very low influences are
there by the outside consumers, these local consumer are also have the preferences over
the local products due to its freshness and quality .These products are featured sensitive
to production due to environmental factor which is depend on monsoon and other factors.
7
Agricultural products are generally considered as perishable apart from milk and fruits
which have more shelf life than vegetables and raw eatables. In general consideration
every perishable product depends on the local market and nearby market within the
periphery of 100 to 200 kilo meters, as these products are also not very much considered
for cold storage because forward trading on the entire agricultural product are not
applicable. In this regard only a few category of product are considered as the cold
storage system for the future use.
This is a typical situation regarding the price of vegetables where they have to be sold
after the first phase of production. On the other hand, we can say that these types of
product are also sensitive to nature peril from its first to the last stage of the agricultural
operation unless and until the product are not sold through the local market and not may
be exported to the nearby market. Considerable influences are there in the price front
over the product.
Vegetables typically constitute an essential part of the daily diet of human beings and
they are in great demand round the year from all sections of the population. The
commercial value of vegetables in terms of direct consumption, processing as well as
trade has risen substantially in recent years. Their economic importance has also
increased and high labor intensity in the production of most vegetables production also
makes them important from the employment angle as well. Increase in area allocation
under horticultural crops has often been suggested as a measure for agricultural
diversification, increased employment and income.
The farming marketing arrangement of perishables in the nation plays an unmistakable
and prevailing job by righteousness of the idea of perishability that warrants due
significance to vegetables. The segment of Indian agriculture is compelled by low
profitability, surprising expense of generation, immense post-reap misfortunes, wasteful
inventory network and low market insight. In India the vegetable generation has
contacted another stature as of late, setting it as the second biggest producer of vegetables
on the planet, next just to China. The improving financial and the developing populace
status in the India have expanded vegetables utilization, both crosswise over areas and
salary gatherings. Their interest is relied upon to become further. (www.rierc.org)

8
The high post-harvest misfortunes, incorporating those in advertising and transportation
result in lower per-capita accessibility of concerned vegetables. Local markets for
vegetables are thin and trading in distant markets is non-remunerative due to higher
transportation costs. The prices of vegetables fluctuate frequently and often fall
drastically during harvesting, hampering efforts of growers. In perspective on this, there
has been a worry with respect to the effectiveness of promoting of vegetables and
improving producer share in consumer rupee. India stands the second rank largest
producer of vegetables, what's more, represents more or less 15% of the world's
generation of vegetables. (Sreekumar, 2012)
This study was done to know about the Price Variation of Major Concerned Vegetables
in Different Seasons with Reference to Organized Retailers in Ranchi. So for the study
various retail outlets are sampled like Reliance Fresh, Big Bazaar and from the farmer
side the different area of Ranchi are taken like Kanke, Itki, Brambe, Chatwal,
Thakurgoan, Choria, Murma and Mandar.
The study is aimed on marketing of green vegetables and its price mechanism in the
market has been undertaken in Ranchi to examine marketing efficiency and pricing
mechanism. Marketing of perishable commodities is very important both in terms of
price realization to the farmer - producer and prices within the reach of consumers. The
marketing efficiency reflects the share of consumer rupee by the farmer (producer) to a
greater extent possible, especially in the case of agricultural commodities which are
perishable in their nature. The price escalation both at the producer level and consumer
level is a common phenomenon as it depends upon the number of players involved in the
marketing of the produce to make it available to the consumers in the most appropriate
way. (www.rierc.org)
In marketing of vegetables the market efficiency in the case of producer-Retailer-
consumer is 90% followed by the producer-wholesaler-Retailer-consumer and in the
channel Producer-middleman-wholesaler-consumer 75%. The information indicates that
more intermediaries in supply chain systems. The study reveals the Price spread of
various selected perishable crops and ways to integrate the price level between producers
and consumers for marketing efficiency pattern of each commodity and possibilities for

9
the increasing the marketing efficiency of the selected commodities. The price spread of
vegetables with respect to various marketing channels has indicated that the producers‘
share has an inverse relationship with the number of intermediaries. The net price
received by the producers is relatively higher in the channels in which the produce is
directly sold to the consumers or retailers.
(www.rierc.org)
Agriculture and allied sector shares 17.32% and gva is around of 23.82 lakh crore.
According to cia fackbook sector wise Indian GDP composition in 2014 are as follows:
agriculture (17.9%), industry (24.2%) and services (57.9%). Total production of
agriculture sector is $366.92 billion.
India has made significant progress on the map of the vegetable world with a total annual
production of over 93.04 million ton, 88.60 million ton and 90 million ton during the year
2011-12, 2013-14 and 2015-16 respectively. In India overall productivity of vegetable is
14.40 ton per hectare.
According to Alina Petre, MS, RD (CA) on November 26, 2017, An average Indian
consumes 434 gm. of cereals and 120 gm. of vegetables per day. But each adult requires
300gm. of vegetables per day for balance diet. The actual per capita consumption of
vegetable is far below the requirement. Vegetables have noteworthy significance in
giving nutrients and minerals in the eating regimen, other than protein and vitality. They
assume critical job in beating the basic issue like healthful weakness, brought about by
the iron and folic corrosive inadequacies. Vegetables assume a key job in killing the acids
created during absorption of proteins and greasy nourishments and giving significant
roughages, which advances assimilation and help in avoiding obstruction.
As we know that vegetables are short duration crops and one can earn more money in
short span of time from the small piece of land by implementing new advanced
technologies and overcoming the constraints in vegetable production. Ultimately, we may
reach in surplus of vegetable production and it will contribution in GDP, which shows the
developmental contribution of farming sector in the rural economy of the country.
It is very much came into the observation that producer are not realizing their perfect
profiting condition and they compel to hand over their production to the interested middle

10
men and marketing group who has the key capacity to mechanize the pricing system. We
can also say that this intermediaries and marketer group has the ultimate power in deicing
the various pricing system of the products. So it is very much a middle man dependant
system in the green vegetables. On the other hand the consumers are compelled to buy
different vegetables products as per their market price. They do not have the ultimate
power in the pricing decision making system of green vegetables, because the
competitive system are the control of the market so more over an uncompetitive prices
are revealed with these types of products and it is against the consumer interest.
But as per the present economic system, there are certain hope arises with the action of
the government. The Government is now planning to support this system with exchange
commodity with forward system, scientific support as well as developing chain cold
stores not only for potato or onion but for all vegetables.
In the world, India ranks the second largest position in vegetable production. The average
production in India is, however, very low. India and China contribute 11.50 percent and
46.10 percent production of total vegetables in the world respectively. Brinjal, tomato,
cabbage, cauliflower, and lady‘s finger are the major vegetable crops in India on the basis
of their production share.
The major production share of the vegetables in India of Brinjal, Tomato, Cabbage,
cauliflower, lady‘s finger, and peas are 9.4%, 8.4%, 6.4%, 5.5%, 3.8%, 2.3% and rest is
other which is 64.2% respectively. [Source: The Hindu, Survey of Indian Agriculture
2018].
Vegetables are significant for human eating regimen, particularly for nutrients and
minerals. However, the per capita consumption of fruits and vegetables in Jharkhand is
only 211 gm/day against a minimum requirement of 400gm/day (FAO/WHO 2003; BBS
2013), which manifests a poor dietary status of the people in the country. Presently, the
vegetable produces around 10923 metric tons of vegetables per year, respectively (BBS
2013). However, due to seasonal glut and absence of proper Supply Chain Management
systems, bulk quantity of harvested produce gets wasted every year. Recently, it is
reported that postharvest loss of fruits and vegetables in Jharkhand ranged from 23.6% to
43.5%, which accounts for an annual loss of thousands of crore. Hence attention should
11
be given to the reduction of enormous postharvest losses of vegetables in Jharkhand. The
changing demand in domestic and international markets for vegetables creates both
challenges and opportunities. Therefore, efficient Supply Chain Management systems are
of paramount importance to reduce postharvest loss and the risk and uncertainty in timely
delivery of quality and safe produce at reasonable prices to the consumers.
Appropriate marketing channels and the market actors are important in timely delivery of
vegetables from the producers to the consumers. But there is no proper systematic
channel in the markets for which price of vegetables fluctuates. Different markets have
different prices for the same vegetables. Price also differs significantly at different times
on in the same day in the same market. For example in the evening price is differed from
the morning price in the same market. There are no fixed price determination factors in
vegetable markets. Variation in supply and demand is prime cause of price variation.
Although ultimate price is determined through the bargaining between buyers and sellers.
If demand is high and supply is low obviously the price will go up and vice-versa. It is
also true for seasonal variation. But our main concern is how effective Supply Chain
Management can reduce the fluctuation of price of vegetables and ensure the reasonable
price for the producers of vegetables.
13 Different marketing channels have been identified by several authors. One of the most
common channels is Growers - Mahajans – Retailers - Consumers. The price of
vegetables is apparently higher at the retailers‘ level. Most of the surveys show that the
prices of vegetables are increased at the retailer‘s level. The intermediaries are very often
blamed to take the lion‘s share of profit.
In Ranchi, the consumption of vegetables has been increasing rapidly in the recent years,
as the economy grows and consumers diversify their diets. This pattern is probably going
to proceed later on. Besides, local agrarian markets have experienced modernization
(however not unreasonably critical) because of quick urbanization, agro industrialization,
ascent of grocery stores and exchange advancement and acquirement framework is
slowly moving from customary discount markets toward vertically organized supply
chains. At present, Jharkhand agricultural marketing system is often accused in the

12
popular press of being inefficient. In the case of vegetables, mahajans, vendors and
wholesaler have been found to be critical players in the market.
Inefficient Supply Chain Management frameworks lessen request from buyers and
cooperation by Farmers, who face noteworthy difficulties in taking advantage of lucky
breaks to take an interest in developing markets for vegetables. Showcasing imperatives
incorporate both surprising expenses and hazard. High promoting expenses frequently
originate from poor transportation systems, absence of market data and now and again
from absence of intensity in the market. Generation of vegetables can be truly vulnerable
to bug flare-ups, and deterioration after gather is a significant issue because of
exceptionally transient nature of generally vegetables. These factors in turn can lead to
highly unstable prices. If these constraints can be removed, farmers will earn more by
specializing in crops for which they have a comparative advantage. Presently, the crying
need is the generation of reliable up-to-date data on the actual costs and returns of the
market intermediaries. The outputs of the report will fill up the information gap and
indeed, contribute greatly to find out the most efficient pricing mechanism and marketing
options in order to formulate a meaningful national policy to improve the fragile pricing
system and supply chain management systems of vegetables in Ranchi, Jharkhand.
1.2 Description of the Study
1.2.1 Overview
Knowledge about the area, its people, the demography, practices of cultivation and socio-
economic characteristics are of the prime importance in the process of analysis of
production problems of major vegetables. Without taking these factors into consideration,
it would be difficult to suggest appropriate measures.
In view of the importance regarding the knowledge about the study area, information was
gathered through secondary sources, mostly through the records of District Agriculture
Officer and District Horticulture Officer Ranchi, concerned blocks and villages. The
information collected pertains to the block as a whole, but some references have been
made with regard to the selected villages.

13
1.2.2 General Information on Jharkhand
The study for the research was conducted in Ranchi the capital of Jharkhand.
Total geographical area of Jharkhand is 74,766 Km2 which is totally a level area. It is
situated between 21.58, North to 25.18, North and 83.22, East to 87.57 East. It has an all
out populace of around 27 million. Out of this about 21 million people reside in rural
areas and six million reside in urban areas. Just around 33% of the all out topographical
territory is cultivable and 35 percent is secured by backwoods. The all out number of
areas in Jharkhand is 22. The state has 35 sub-divisions and 212 Community
Development Blocks in which 115 Blocks are Scheduled Tribes Development Block.
Jharkhand state is an ancestral commanded territory having a populace thickness of 338
individuals/Km2 with male-female proportion as 1000:955.The statistic highlights of
Jharkhand state have been exhibited in table1.1
Table 1.1 Demographic features of Jharkhand state (2015)
SN Particular Demographic count
1. Population 26.9 million
2. Rural population 21.2 million
3. Urban population 5.7 million
4. No. of districts 24
5. No. of sub-divisions 35
6. No. of blocks 212
7. No. of Panchayats 3744
8. Density of population 338/Km2
9. Male-female ratio 1000: 941
Source: Internet, Jharkhand village profile (2015)
1.2.3 Climate and rainfall
The climate is subtropical. The table reveals that the mercury over around 29.56 0
C during the summer months and 20.11 0 C
during the winter months. The month of May
was generally the hottest, while January was the coldest month. From the below table the
total rainfall was concentrated during the month of monsoon i.e. from June to September.

14
There is an uneven seasonal distribution of rainfall during the year, thereby limiting the
cultivation of vegetables in general. The data on temperature and rainfall recorded in the
year 2016 are presented in the table 5.2 and most prominent wind directions.
Table 1.2 Monthly temperature and monthly rainfall during 2016.
Month Temperature (
0C)
Rainfall (mm) Maximum Minimum
January 13.0 24.4 16.2
February 11.7 26.7 12.5
March 17.1 34.7 16.2
April 22.3 37.7 19.2
May 24.7 38.2 40.4
June 25.6 36.1 210.5
July 25.1 28.9 421.1
August 24.9 29.7 352.3
September 24.0 29.7 269.9
October 19.4 28.7 58.3
November 14.6 27.5 9.8
December 13.6 27.6 3.6
Total ----- ------ 1420 mm
Source: Green data book Government of India & India Metrological Department.
1.2.4 Land and soil
Jharkhand state is wealthy in various minerals however agribusiness, the pillar of
the neighborhood individuals is undeveloped. Farming is for the most part drilled under
rainfed conditions. Place where there is the district is undulating and there is
transcendence of uplands.
Land is privately arranged into "Uplands" and "Swamp" as per nature and circumstance
of the land. Uplands are additionally characterized into Uplands I, Uplands II and
Uplands III. The upper most bit of the upland is named as Uplands I, which are

15
moderately less ripe and no yield is developed. Land arranged beneath the Uplands I is
named as Uplands II and lower most part of the upland is named as Uplands III. Uplands
II is minimal more ripe than Uplands I however less ripe than Uplands III. Soils in
uplands are poor in accessible supplements, sand to sandy-topsoil finished and acidic in
nature.
Swamps are called as "Don" by the neighborhood individuals. Swamps are additionally
arranged into Low grounds I, Low terrains II and Low grounds III. Fertility statuses of
these lands are somewhat directly related to the altitude. The low lands are comparatively
heavier and richer in plant nutrients due to leaching with poor drainage facility.
Upland soils of the locale are acidic in nature and pH differs from 4.3 to 6.5. Uplands are
sandy to sandy-topsoil in surface where as swamps are sandy earth soil to mud soil.
1.2.5 Cropping pattern
Rice is the chief harvest of the state. Other than rice, other significant yields are
finger millet, maize and gundli. Wheat is trimmed in restricted degree in the region where
there is water system office. Aside from coarse oats, heartbeats, for example, pigeon pea,
lentil, kulthi, green gram, dark gram, and gram are developed. Linseed and sarguja are
the principle oilseed crops where as linseed is developed as paira cropping. Vegetables
are also cultivated extensively in Jharkhand i.e. cauliflower, cabbage, tomato, lady‘s
finger, brinjal, capsicum, radish, carrot, spinach, coriander, cucurbits, onion, potato,
garlic, ginger, etc. These vegetables are grown round the year especially in Rabi season.
The cropping intensity of the locale is exceptionally low for example 115 percent. Paddy-
wheat, paddy-beats, paddy-wheat + mustard, paddy-vegetables is the normal harvest
pivot rehearses. Paddy + jowar, paddy + pigeon pea, paddy + kudrum and pigeon pea +
maize are commonly developed as blended harvests.
1.2.6 General Information about the District under study
Ranchi, the capital city of Jharkhand state is located on southern part of the Chota Nagpur
plateau which forms the eastern edge of the Deccan plateau system. The study was
conducted in purposively selected Ranchi district which is bounded in the North by the

16
district of Hazaribagh, in the East by the district of Purulia (West Bengal), in the West by
the district of Palamu, Lohardaga and Gumla and in the South by West Singhbhum
district. The plateau of Ranchi extends over an area of 7701 sq. km. which is full of
forests, rivers and rivulets, hills, hillocks, waterfalls and streams. The district is spread
over 18.73 lakh acres.
Ranchi is situated between 20.210 N to 24.39
0 N and 83.22
0 E to 86.54
0 E altitude of 720
meter above mean sea level. The normal rain fall in Ranchi is 1250 mm. The climate is
cool, pleasant and quite healthy. The district receives rainfall almost throughout the year,
but the concentration is during Monsoon months from June to September. The annual
average rainfall of the district as a whole is about 1480 mm. During the month of
monsoon i.e. (June-September), the rainfall is and aberrant and the district receives nearly
85 percent of the annual rainfall. The district consists of 21 community development
blocks in all and 319 village panchayats with a total number of 2145 villages with
336629 households and seven towns. The district has a population of 27, 83,577 i.e. rural
population 18.06 lakh and urban population 9.77 lakh (2001 Census). the tribal
population and 5.3% are for the scheduled caste. The Literacy is about 65.69%. Of the
rural population 57.16% is Tribal
Ranchi is a standout amongst the most urbanized regions of Jharkhand state. Somewhat
more than 30 percent of its populace lives in urban zones while in the state all in all
around 22 percent (22.24 percent to be careful) lives in urban regions. In spite of being so
urbanized a large number of its squares (14 out of 20 hinders) in the areas have 100
percent country populace. It demonstrates prevalence of agrarian populace in these
squares and nonappearance of chances offered by urban focuses. (Ranchi locale 2001
statistics)
Ranchi district is one of the oldest districts of Bihar and is the capital city of the Indian
state of Jharkhand Ranchi was the centre of the Jharkhand movement for a separate state
for the tribal regions of South Bihar.
The absolute geological zone of the region is 7, 59,250 hectares. Net zone appeared
276091 hectors. Zone under twofold yield is 6%. The woodland spread is about 18% of
17
the complete land region. Mono trimming is the pillar because of deficient improvement
of the water system. Presently, obviously, it is set to pursue an alternate pattern gradually.
Out of complete operational possessions of 2, 44,073 in the region, 72% are claimed by
little and peripheral Farmers bookkeeping 24% of the absolute geological region. Forty
eight percent of the little and negligible Farmers have a place to innate network. The
normal size of holding of little and peripheral Farmers is 0.62 ha.
Horticulture in the Ranchi locale is described by mono trimming, the fundamental yield
being paddy. The vegetable is developed broadly in some square (AES-I) of locale.
Fundamental vegetable are Cauliflower, Cabbage, Tomato, Beans, Brinjal, Capsicum,
vegetables, Chilly Un-occasional vegetables are additionally developed on enormous
scale in the District. The state Jharkhand is endowed with a favorable condition regarding
the cultivation of various types of concerned vegetables. The vegetables produce
including off seasons vegetables from state are being preferred in the neighboring states
for their quality and the time of availability.
The main producing regions are Ranchi, Lohardaga, Dumka, Godda, Jamtara, saraikela
etc. The maximum production of vegetables occurs in the central and Eastern region of
Jharkhand. Major vegetables are Cauliflowers, Beans, Brinjal, and Tomato etc. In terms
of cauliflower Jharkhand is the sixth major producing state in the country.
1.2.7 General information about the various blocks of the Ranchi
1.2.7.1 Kanke
Overview
Kanke is a Census Town city in region of Ranchi, Jharkhand. The Kanke Census Town
has populace of 17,560 of which 9,166 are guys while 8,394 are females according to
report discharged by Census India 2011.
Populace of Children with age of 0-6 is 1862 which is 10.60 % of all out populace of
Kanke (CT). In Kanke Census Town, Female Sex Ratio is of 916 against state normal of
948. In addition Child Sex Ratio in Kanke is around 924 contrasted with Jharkhand state
normal of 948. Education rate of Kanke city is 88.14 % higher than state normal of 66.41
%. In Kanke, Male education is around 91.58 % while female proficiency rate is 84.39 %.

18
Kanke Census Town has all out organization more than 2,995 houses to which it supplies
essential civilities like water and sewerage. It is additionally approve to manufacture
streets inside Kanke Census Town breaking points and force assesses on properties going
under its locale. Right now our site doesn't have data on schools and clinic situated inside
Kanke.
Kanke Work Profile
Out of the absolute populace, 4,649 were occupied with work or business movement. Of
this 3,490 were guys while 1,159 were females. In enumeration overview, specialist is
characterized as individual who works together, occupation, administration, and
cultivator and work movement. Of complete 4649 working populace, 79.57 % were
occupied with Main Work while 20.43 % of absolute laborers were occupied with
Marginal Work.
1.2.7.2 Brambe
Overview
Brambe is a huge village situated in Mandar Block of Ranchi region, Jharkhand with all
out 749 families living. The Brambe town has populace of 4230 of which 2134 are folks
while 2096 are females as indicated by Population Census 2011. In Brambe town people
of children with age 0-6 is 489 which makes up 11.56 % of the supreme masses of the
town. Typical Sex Ratio of Brambe town is 982 which is higher than Jharkhand state
ordinary of 948. The Sex Ratio for the Brambe according to enumeration is 956, higher
than Jharkhand normal of 948. Brambe village has higher proficiency rate contrasted with
Jharkhand. In 2011, proficiency rate of Brambe village was 73.94 % contrasted with
66.41 % of Jharkhand. In Brambe Male education remains at 81.00 % while female
proficiency rate was 66.77 %. (India census , 2011)
As indicated by the constitution of India and the Panchyati Raaj Act, Brambe town is
administrated by Sarpanch (Head of Village) who is picked illustrative of the town. Our
site, don't have information about schools and crisis center in Brambe town. (India census
, 2011)

19
Brambe Work Profile
In the Brambe village out of the all out populace, 1668 were occupied with work
exercises. 85.97 % of laborers portray their work as Main Work (Employment or Earning
over 6 Months) while 14.03 % were engaged with Marginal action giving business to
under a half year. Of 1668 specialists occupied with Main Work, 581 were cultivators
(proprietor or co-proprietor) while 505 were Agricultural workers. (India census , 2011)
Table 1.3 The profile of Brambe
Particulars Total Male Female
Total No. of Houses 749 NA NA
Population 4230 2134 2096
Child (0-6yrs) 489 250 239
Schedule cast 24 12 12
Schedule tribe 2836 1377 1459
Literacy 73.94% 81.00% 66.77%
Total workers 1668 994 674
Main worker 1434 1434 NA
Marginal worker 234 158 76
Source: Population Census 2011.
1.2.7.3 Chatwal
Overview
Chatwal is an enormous village situated in Mandar Block of Ranchi locale, Jharkhand
with absolute 398 families living. The Chatwal town has people of 2163 of which 1115
are folks while 1048 are females as indicated by Population Census 2011. In Chatwal
town masses of children with age 0-6 is 377 which make up 17.43 % of complete people
of town. Ordinary Sex Ratio of Chatwal town is 940 which are lower than Jharkhand
state typical of 948. The Sex Ratio for the Chatwal according to enumeration is 866,
lower than Jharkhand normal of 948. Chatwal village has a lower proficiency rate
contrasted with Jharkhand. In 2011, education rate of Chatwal village was 53.19 %

20
contrasted with 66.41 % of Jharkhand. In Chatwal Male proficiency remains at 61.12 %
while female education rate was 44.90 %. (India census , 2011)
As indicated by the constitution of India and the Panchyati Raaj Act, Chatwal town is
administrated by Sarpanch (Head of Village) who is picked illustrative of town. Our site,
don't have information about schools and crisis facility in Chatwal town. (India census ,
2011)
Chatwal work profile
In Chatwal village out of the all out populace, 1105 were occupied with work exercises.
34.03 % of laborers depict their work as a Main Work (Employment or Earning over 6
Months) while 65.97 % were associated with Marginal action giving business to under a
half year. Of 1105 specialists occupied with Main Work, 227 were cultivators (owner or
co-owner) while 94 were Agricultural workers. (India census , 2011)
Table 1.4 The profile of Chatwal
Particulars Total Male Female
Total no. of Houses 398 NA NA
Population 2163 1115 1048
Child (0-6yrs) 377 202 175
Schedule cast 86 51 35
Schedule tribe 1045 509 536
Literacy 53.19% 61.12% 44.90%
Total workers 1105 577 528
Main worker 376 376
Marginal worker 729 370 359
Source: Population Census 2011.
1.2.7.4 Mandar
Overview
Mandar is an enormous village situated in Mandar Block of Ranchi area, Jharkhand with
absolute 770 families dwelling. The Mandar town has a people of 4027 of which 2031 are

21
folks while 1996 are females as indicated by Population Census 2011. In Mandar town,
the masses of adolescent‘s age 0-6 are 594 which make up 14.75 % of the hard and fast
people of the town. Typical Sex Ratio of Mandar town is 983 which is higher than the
Jharkhand state ordinary of 948. Child Sex Ratio for the Mandar as indicated by
assessment is 892, lower than Jharkhand normal of 948. Mandar village has higher
education rate contrasted with Jharkhand. In 2011, proficiency rate of Mandar village was
78.62 % contrasted with 66.41 % of Jharkhand. In Mandar Male education remains at
84.92 % while female proficiency rate was 72.32 %. (India census , 2011)
As indicated by the constitution of India and the Panchyati Raaj Act, Mandar town is
administrated by Sarpanch (Head of Village) who is picked illustrative of the town. Our
site, don't have information about schools and medicinal facility in Mandar town. (India
census , 2011)
Mandar work profile
In Mandar village out of the all out populace, 1213 were occupied with work exercises.
54.66 % of laborers portray their work as a Main Work i.e. Employment or Earning over
6 Months) while 45.34 % were engaged with Marginal movement giving business to
under a half year. Of 1213 specialists occupied with a Main Work, 166 were cultivators
(owner or co-owner) while 29 were Agricultural workers. (India census , 2011)
Table 1.5 The profile of Mandar
Particulars Total Male Female
Total no. of Houses 770 NA NA
Population 4027 2031 1996
Child (0-6yrs) 594 314 280
Schedule cast 9 3 6
Schedule tribe 1611 782 829
Literacy 78.62% 84.92% 72.32%
Total workers 1213 864 349
Main worker 663 NA NA
Marginal worker 550 387 163
Source: Population Census 2011.

22
1.2.7.5 Murma
Overview
Murma is an enormous village situated in Mandar Block of Ranchi area, Jharkhand with
complete 462 families dwelling. The Murma village has a people of 2670 of which 1364
are folks while 1306 are females indicated by Population Census 2011. In Murma village
masses of kids with age 0-6 is 383 which make up 14.34 % of complete populace of
village. Normal Sex Ratio of Murma village is 957 which is higher than Jharkhand state
normal of 948. Average Sex Ratio for the Murma according to evaluation is 896, lower
than Jharkhand normal of 948. Murma village has higher education rate contrasted with
Jharkhand. In 2011, education rate of Murma village was 70.18 % contrasted with 66.41
% of Jharkhand. In Murma Male proficiency remains at 77.80 %, on the other hand
female education rate was 62.31 %.(India census , 2011)
As indicated by the constitution of India and the Panchyati Raaj Act, Mandar town is
administrated by Sarpanch (Head of Village) who is picked illustrative of the town. Our
site, don't have information about schools and medicinal facility in Murma village. (India
census , 2011)
Murma Work Profile
In Murma village out of the all out populace, 968 were occupied with work exercises.
60.12 % of specialists depict their work as a Main Work (Employment or Earning over 6
Months) while 39.88 % were engaged with Marginal movement giving job to under a
half year. Of 968 specialists occupied with a Main Work, 423 were cultivators (owner or
co-owner) while 37 were Agricultural workers. (India census , 2011)

23
Table 1.6 The profile of Murma
Particulars Total Male Female
Total no. of Houses 462 NA NA
Population 2670 1364 1306
Child (0-6yrs) 383 202 181
Schedule cast 22 13 9
Schedule tribe 1389 694 695
Literacy 70.18% 77.80% 62.31%
Total workers 968 707 261
Main worker 582 NA NA
Marginal worker 386 193 193
Source: Population Census 2011.
1.2.7.6 Itki Thakurgoan
Overview
Itki Thakurgoan is an enormous village situated in Itki Block of Ranchi region, Jharkhand
with absolute 2285 families living. The Itki Thakurgoan town has a mass of 12174 of
which 6141 are folks while 6033 are females as per Population Census 2011.
In Itki Thakurgoan town masses of youths with age 0-6 is 1668 which makes up 13.70 %
of the total people of the town. Typical Sex Ratio of Itki Thakurgoan town is 982 which
is higher than the Jharkhand state ordinary of 948. Adolescent Sex Ratio for the Itki
Thakurgoan according to registration is 955, higher than Jharkhand normal of 948. Itki
Thakurgoan town has higher proficiency rate contrasted with Jharkhand. In 2011,
education rate of Itki Thakurgoan village was 82.93 % contrasted with 66.41 % of
Jharkhand. In Itki Thakurgoan Male education remains at 88.12 % while female
proficiency rate was 77.67 %. (India census , 2011)
As per the constitution of India and the Panchyati Raaj Act, Itki Thakurgoan town is
administrated by Sarpanch (Head of Village) who is picked illustrative of the town. Our
site, don't have information about schools and center in Itki Thakurgoan town. (India
census , 2011)

24
Itki Thakurgoan work profile
In Itki Thakurgoan village out of the all out populace, 3748 were occupied with work
exercises. 69.85 % of specialists depict their work as a Main Work (Employment or
Earning over 6 Months) while 30.15 % were engaged in Marginal action giving business
to under a half year. Of 3748 specialists occupied with a Main Work, 590 were
cultivators (owner or co-owner) while 262 were Agricultural workers. (India census ,
2011)
Table 1.7 The profile of Itki, Thakurgoan
Particulars Total Male Female
Total no. of Houses 2285 NA NA
Population 12174 6141 6033
Child (0-6yrs) 1668 853 815
Schedule cast 176 89 87
Schedule tribe 2607 1250 1357
Literacy 82.92% 88.12% 77.67%
Total workers 3748 2745 1003
Main worker 2618 NA NA
Marginal worker 1130 710 420
Source: Population Census 2011.
1.2.7.7 Boreya
Overview
Boreya is a medium size village situated in Itki Block of Ranchi region, Jharkhand with
all out 153 families living. The Boreya town has a populace of 877 of which 445 are folks
while 432 are females as per the Population Census 2011. In Boreya town the mass of
youth with age 0-6 is 117 which make up 13.34 % of the all out populace of town.
Normal Sex Ratio of Boreya town is 971 which is higher than the Jharkhand state normal
of 948. Adolescent Sex Ratio for the Boreya according to enumeration is 857, lower than
Jharkhand normal of 948. Boreya village has higher education rate contrasted with
Jharkhand. In 2011, proficiency rate of Boreya village was 75.00 % contrasted with 66.41
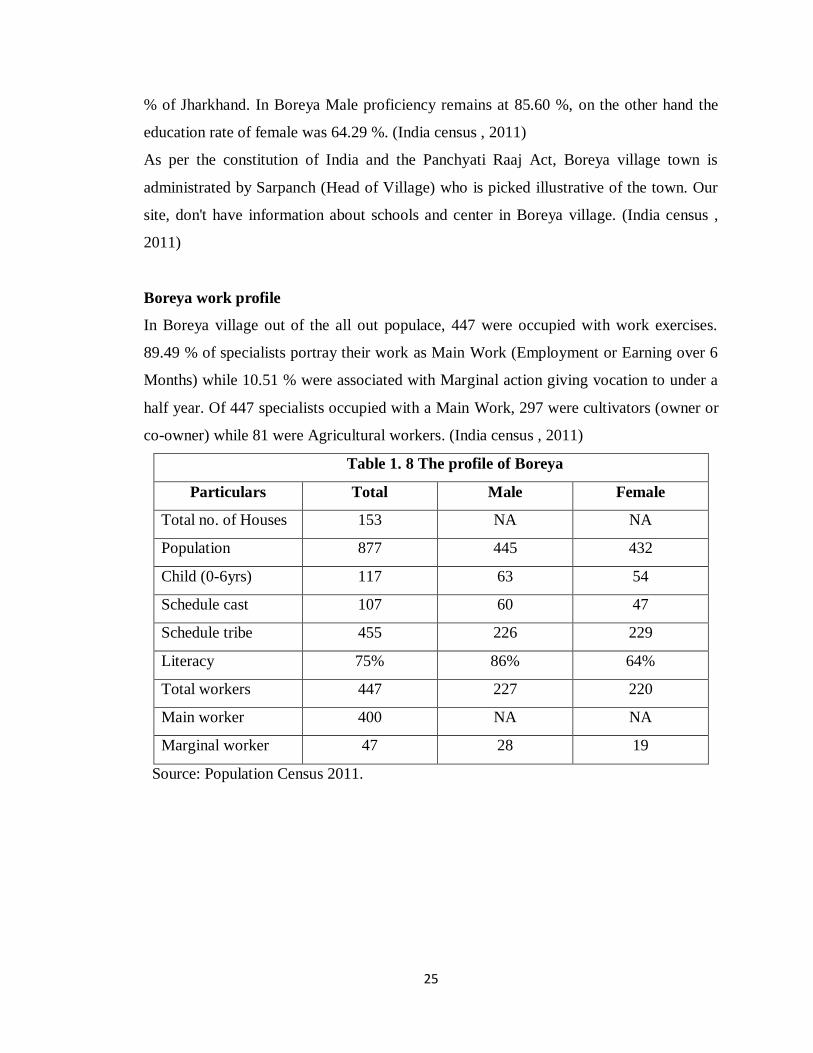
25
% of Jharkhand. In Boreya Male proficiency remains at 85.60 %, on the other hand the
education rate of female was 64.29 %. (India census , 2011)
As per the constitution of India and the Panchyati Raaj Act, Boreya village town is
administrated by Sarpanch (Head of Village) who is picked illustrative of the town. Our
site, don't have information about schools and center in Boreya village. (India census ,
2011)
Boreya work profile
In Boreya village out of the all out populace, 447 were occupied with work exercises.
89.49 % of specialists portray their work as Main Work (Employment or Earning over 6
Months) while 10.51 % were associated with Marginal action giving vocation to under a
half year. Of 447 specialists occupied with a Main Work, 297 were cultivators (owner or
co-owner) while 81 were Agricultural workers. (India census , 2011)
Table 1. 8 The profile of Boreya
Particulars Total Male Female
Total no. of Houses 153 NA NA
Population 877 445 432
Child (0-6yrs) 117 63 54
Schedule cast 107 60 47
Schedule tribe 455 226 229
Literacy 75% 86% 64%
Total workers 447 227 220
Main worker 400 NA NA
Marginal worker 47 28 19
Source: Population Census 2011.

26
1.3 History of Vegetables
Overview
Vegetables assume an imperative job for the presence of individuals and furthermore a
very impacting job in the economy. In spite of the fact that new organic product,
vegetable and staple retail have been considered as an incredibly low-edge business, the
market potential has pulled in Indian business houses and corporate, driving the attacks
through different models like single-plan, multi-gathering or joined urban-provincial
models (Jacob, 2010)
The vegetables are very rich in vitamins and minerals, have almost no fat and are very
rich in fiber which makes it very healthy to eat. The most common theory is that the West
cabbage is domesticated in Europe some 3,000 years ago from its wild predecessors that
had thick leaves that retained water which allowed them to survive in colder places with
less water. In the East, cabbage is used since the 4,000 BC and was cultivated in North
China. Mesopotamia also knew about cabbages while the ancient Egyptians didn't
cultivate cabbages until the times of the Ptolemaic dynasty. By the time of the early
Rome, cabbage became common food in the Egypt along with other vegetables.
Theophrastus (371 – 287BC), which is considered ―father of botany‖, mentions cabbage
in his texts, so we know that Greeks knew about them at least as early as 4th century BC.
In Rome, cabbage was viewed as an extravagance and many viewed it as superior to
every single other vegetable. They likewise utilized it for therapeutic reason as alleviation
from gout, cerebral pains and the manifestations of noxious mushroom ingestion. Some
even informed the utilization concerning cabbage-eater's pee, where newborn children
may be washed. With the exception of sustenance, Ancient Egyptians and Romans ate
bigger measures of cabbage before the evening of drinking which enabled them to drink
more. During the season of Charlemagne (Charles the Great, eighth century), cabbages
were coordinated to be developed in the "Capitulare de villis", a content that gave
standards and guidelines on the most proficient method to deal with the grounds and laws
in the nation.
The first round-headed cabbages showed up in fourteenth century England, and they
turned out to be increasingly more prominent as cooking all through Europe. From
27
Europe, developed variations of cabbage spread to Asia and Americas. It was brought to
India by colonizing dealers from Portugal somewhere close to a fourteenth and
seventeenth century, and it was obscure in Japan until the eighteenth century. The
principal cabbage in America was brought by a French voyager Jacques Cartier on his
third voyage 1541 – 1542. Cabbage ended up important on long sea ventures since it has
high measures of nutrient C which anticipate scurvy. Ship specialists (like for example
specialist on Captain Cook's ship that cruised in 1769) utilized sauerkraut (cabbage saved
in brackish water) to treat injuries of mariners and avoid gangrene. Cauliflower – The
most established record of Cauliflower go back to the sixth century B.C. Pliny expounded
on cauliflower in the second century. In the twelfth century three assortments were
depicted. Recorded as a hard copy of Arab Botanist Ibn Al-Awwan and Ibn Al-Baitar, in
the twelfth and thirteenth century when its starting points were said to be Cyprus.
Francois Pierre La Varenne utilized Chouxfleurs in Lecuisinier Francosis. They were
acquainted with France from Genoa in the sixteenth century and are included in Olivier
De Serres Theater farming (1600) as cauli-fiori as the Ittalians call it. (Jacob, 2010)
1.3.1 Cauliflower
1.3.1.1 Etymology and Scientific Classification of Cauliflower
Cauliflower is a vegetable that has a place with the Cabbage family, which is moreover
the Brassicaceae family of Cruciferae. Its legitimate name is Brassica oleracea var.
bortytis. The plants in this family all offer a regular component: their four-petaled blooms
look like to a Greek cross and are oftentimes suggested as crucifers or cruciferous
vegetables.
Its coherent name begins from the old style Latin word for Wild Cabbage (Quattrocchi,
349).The name cauliflower starts from the Latin words caulis, which means ―stalk, and
floris, which means ―flower. As proposed by its name, cauliflower is extremely a
sprout. The editable bit of the plant is the head of juvenile, fragile bloom stems and buds.
(https://academics.hamilton.edu/foodforthought/Our_Research_files/cabbage_cauliflower
_kale.pdf)

28
1.3.1.2 Botanical Description
Cauliflower is a biennial and ice tolerant vegetable with diminished heads of an
adolescent or rashly finished bloom contracted into a lone head. Its heads are ordinarily
white anyway can in like manner be yellow or purple. Cauliflower is furthermore an out
raising plant. Cauliflower and broccoli will cross with various groupings inside the
gigantic B. oleracea species, which join all cabbages (beside Chinese cabbage), Brussels
spouts, kale, collards, and kohlrabi, similarly likewise with each other (Ashworth, 52).
Besides, cauliflower must experience vernalization to bloom. In specific regions where
winter temperature does not plunge under 28F, brassicas can be planted in the fall, and
seed is assembled the going with summer. Most cauliflower is self-opposing. To give a
nice seed set and of securing much inherited arranged assortment, in any event, six plants
are ought to be used for seed saving (Ashworth, 53).
(https://academics.hamilton.edu/foodforthought/Our_Research_files/cabbage_cauliflower
_kale.pdf)
1.3.1.3 Nutritional Chart
The serving size on the upper left corner uncovers to you the measure of the
sustenance you need to eat to get the proportion of enhancements found in the blueprint.
The Daily Value rate (DV %) addresses the proportion of enhancements in the step by
step serving size (in grams). Supplement thickness is the extent of enhancement content
(in grams) to the total imperativeness content (in kilocalories or joules). The
enhancement examinations grasped by the U.S. Sustenance and Drug Administration's
―Reference Values for Nutrition Labeling checks.
(https://academics.hamilton.edu/foodforthought/Our_Research_files/cabbage_cauliflower
_kale.pdf)

29
Table 1.9 Cauliflower Nutritional Value
Cauliflower, boiled
1.0 cup
124.00 grams
28.52 calories
Nutrient
Amount
DV (%)
Nutrient
Density
World’s healthiest food
rating
Vitamin C 54.93 mg 91.5 57.8 Excellent
Vitamin K 11.17 mcg 14.0 8.8 Excellent
Folate 54.56 mcg 13.6 8.6 Excellent
Dietary Fiber 3.35 mg 13.4 8.5 Excellent
Vitamin B6 0.21 mg 10.5 6.6 Very good
Omega 3 fatty acid 0.21 gm 8.8 5.5 Very good
Tryptophan 0.03 gm 9.4 5.9 Very good
Manganese 0.17 mg 8.5 5.4 Very good
Vitamin B5 0.63 mg 6.3 4.0 Very good
Potassium 176.08 mg 5.0 3.2 Good
Protein 2.28 mg 4.6 2.9 Good
Source: http://whfoods.org/genpage.php,tname=foodspice&dbid=13#summary
1.3.1.4 Nutritional Profile and Health Benefits Highlight
One cup of foamed cauliflower is a splendid wellspring of supplement C (91.5%
of the DV), folate (13.6% of the DV), and dietary fiber (13.4% of the DV). That
proportionate proportion of cauliflower furthermore fills in as a by and large incredible
wellspring of supplement B5, supplement B6, manganese, and omega - 3 unsaturated
fats.
Utilization of cauliflower is known to diminish the danger of various diseases, for
example, lung, colon, chest, ovarian and bladder dangerous development. Late research
from the University of Hawaii reveals that crucifers like cauliflower similarly give
noteworthy cardiovascular points of interest. Investigators have exhibited that a
phytonutrient called indole-3-carbinol found in cruciferous vegetables, even in the
unobtrusive union of 100 micromoles per liter, can cut down liver cell's release of the

30
cholesterol transporter ApolipoproteinB-100 (ApoB-100) by 56%. ApoB-100 is the basic
transporter of LDL cholesterol to No's, and irregular states have been associated with
plaque advancement in the veins. Right when liver cells were treated with I-3-C, an
expert found not simply apoB-100 release was cut by the greater part, yet in addition the
union of lipids (fats) was diminished altogether.
(https://academics.hamilton.edu/foodforthought/Our_Research_files/cabbage_cauliflower
_kale.pdf)
1.3.1.5 Climate and Soil Requirements
Cauliflower can be abundantly conveyed from April to December in the maritime
Northeast. This plant likes smooth summer climates (around 80-90F). Soil with rich
humus is critical in light of the fact that cauliflower will in general have powerless root
frameworks.
Since cauliflower will create the best quality heads just with nonstop quick development,
perfect soil conditions ought to be prepared. Along these lines, one-quarter to a half cup
of complete characteristic compost is relied upon to put into the earth and rapidly
underneath the plant if the soil is light enough to permit extraordinary root improvement.
A soil with pH somewhere in the range of 6.5 and 7.5 is significant for best improvement.
(https://academics.hamilton.edu/foodforthought/Our_Research_files/cabbage_cauliflower
_kale.pdf)
1.3.1.6 Variety of Cauliflower
Table 1.10 The cultivars use of cauliflower
Cauliflower Types Cauliflower Varieties
Early Cauliflower
a)Snow Crown
About 50-60 days from planting to harvest. It may
show some pinking when maturing in the hotter parts
of summer. Its hybrid vigor and rapid growth
produce large, fully-domed curds with a mild and
sweet flavor.

31
b) Snow Peak
About 50 days from planting to harvest. Snow
Peak‘s dense white curds have a crisp, mild taste that
attracts people back for more. It is best grown when
planted in the Spring for an early Summer harvest.
Autumn Cauliflower
a) Ravella
About 65-85 days from planting to harvest. The
heavy snow white hears are easily grown. It wraps its
head almost perfectly under good growing condition
and performs well during cold weather. Best sowing
dates from March to June.
b) Alverda About 80-100 days from planting to harvest. The
medium-sized plants product a wonderful bright
lime-green curd, particularly when planted to mature
in cool weather. Pick before the head loosens up for
the best eating quality.
c) Fremont
About 75-85 days from planting to harvest. Fremont
is the most popular choice for commercial growers in
Northern areas. The 2-2.5 pound heads can endure
well both Summer and Fall harvest periods.
d)White Rock
About 80-100 days from planting to harvest. It is a
very popular, smaller headed variety. It has
extremely well-
wrapped curds, which offer good frost and rain
protection for late harvest
e)Arbon
About 120-140 days from planning to harvest. It
produces
32
heavy yields of large, tender, sweet curds late
October or
November from a June sowing. It is also well-
wrapped as White Rock.
Source: http://discworld.imaginary.com/lpc/links/cabbage/info/cauliflower.html
1.3.2 Cabbage
1.3.2.1 Etymology and Scientific Classification of Cabbage
The logical course of action of cabbage is the accompanying: Kingdom: Planate;
Division: Magnoliophyta; Class: Magnoliopsida; Order: Brassicales; Family:
Brassicaceae; Genus: Brassica; and Species: olearacea collection capitata. As needs be,
the sensible name of cabbage is Brassica oleracea var. capitata. It is an agreeable plant of
the Family Brassicaceae (or Cruciferae). Its coherent name begins from brassica, ae, the
Latin old-style name for cabbage. (Quattrochi, 349) The English name cabbage gets from
the French word ―cabochel (head). (http://www.biodatabase.de/Cabbage). Various
arrangements of comparative plant creature gatherings are broccoli, cauliflower, collard
greens, kohlrabi, Brussels develops, Chinese kale, broccolini, and broccoflower.
(https://academics.hamilton.edu/foodforthought/Our_Research_files/cabbage_cauliflower
_kale.pdf)
1.3.2.2 Botanical Description
Cabbage is herbaceous blooming plant with leaves encircling a preservationist head
chrematistics. Around 400 sorts of cabbage have been recorded into five social affairs:
The chief get-together consolidates the unmistakable round, smooth-leafed cabbages with
the shades of white, green or red, and wrinkled-leafed combinations, for instance, Savoy.
The ensuing social event includes the pointed cabbages like European spring and Chinese
cabbages. The third assembling contains the cabbages with surprisingly enormous,
developing stems like Brussels develops. The fourth assembling incorporates the
cabbages with green wavy sorts, for instance, kale and collard greens. Cabbage species in
this social occasion are normally used as animal‘s sustenance or upgrade of dishes for the

33
presentation. Finally, the last assembling consolidates gushing cabbages, like cauliflower
and broccoli (Kiple and Ornelas, 290).
(https://academics.hamilton.edu/foodforthought/Our_Research_files/cabbage_cauliflower
_kale.pdf)
Similarly, Cabbages are out imitating plants. Cabbages just produce suitable seeds
through creepy crawly and hand fertilization. Most cabbages are self-contrary, implying
that the dust is reasonable, however, can't develop in a blossom on a similar plant. Since
the bugs must convey dust starting with one plant then onto the next rather than simply
conveying starting with one blossom then onto the next in a similar vegetables, the more
in a gathering of vegetables the better the fertilization and seed generation (Ashworth, 50-
51).(https://academics.hamilton.edu/foodforthought/Our_Research_files/cabbage_cauliflo
wer_kale.pdf)
1.3.2.3 Nutritional Chart
The serving size on the upper left corner uncovers to you the measure of the
sustenance you need to eat to get the proportion of enhancements found in the outline.
The Daily Value rate (DV %) addresses the proportion of enhancements in the step by
step serving size (in grams). Supplement thickness is the extent of enhancement content
(in grams) to the total essentialness content (in kilocalories or joules). The enhancement
assessments grasped by the U.S. Sustenance and Drug Administration's ―Reference
Values for Nutrition Labeling rules.
(https://academics.hamilton.edu/foodforthought/Our_Research_files/cabbage_cauliflower
_kale.pdf)

34
Table 1.11 Cabbage Nutritional Value
Cabbage, boiled
1.0 cup
150.00 grams
33.00 calories
Nutrient
Amount
DV (%)
Nutrient
Density
World’s
healthiest
food rating
Vitamin C 30.15 mg 50.3 27.4 Excellent
Vitamin K 73.35 mg 91.7 50.0 Excellent
Folate 30.00 mcg 7.5 4.1 Very good
Dietary Fiber 3.45 gm 13.8 7.5 Very good
Vitamin B6 0.17 mg 8.5 4.6 Very good
Omega 3 fatty
acid
0.17 gm 7.1 3.9 Very good
Tryptophan 0.01 gm 3.1 1.7 Good
Manganese 0.18 mg 9.0 4.9 Very good
Potassium 145.50 mg 4.2 2.3 Good
Source: http://whfoods.org/genpage.php,tname=foodspice&dbid=13#summary
1.3.2.4 Health Benefit
Right when cabbage is cut, nibbled or handled, a sulfur-containing compound called
sinigrin is conveyed into contact with the synthetic myrosinase, realizing the landing of
glucose and the breakdown of things, including the exceedingly responsive compound,
isothiocyanates. Isothiocyanates joins sulfora phane and indole-3-carbinol which are
extraordinary inducers of the liver's Phase II impetuses and thusly detoxify cancer-
causing agents.
Moreover, ongoing examination led by the Institute for Food Research in the U.K. found
one of these blends, allyl isothicyanate, moreover obstructs mitosis (cell division) and
enlivens apoptosis (changed cell destruction) in human tumor cells. Plus, sulforaphane
may likewise furnish uncommon assurance to those with colon malignant growth helpless
qualities.
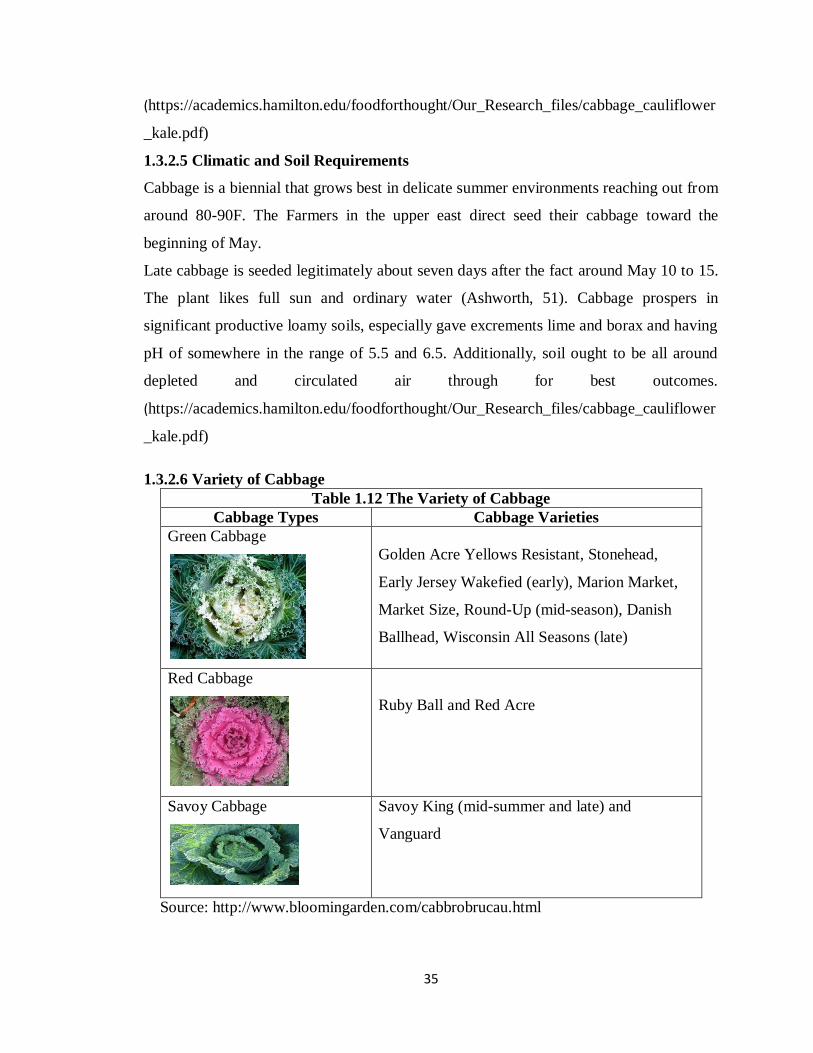
35
(https://academics.hamilton.edu/foodforthought/Our_Research_files/cabbage_cauliflower
_kale.pdf)
1.3.2.5 Climatic and Soil Requirements
Cabbage is a biennial that grows best in delicate summer environments reaching out from
around 80-90F. The Farmers in the upper east direct seed their cabbage toward the
beginning of May.
Late cabbage is seeded legitimately about seven days after the fact around May 10 to 15.
The plant likes full sun and ordinary water (Ashworth, 51). Cabbage prospers in
significant productive loamy soils, especially gave excrements lime and borax and having
pH of somewhere in the range of 5.5 and 6.5. Additionally, soil ought to be all around
depleted and circulated air through for best outcomes.
(https://academics.hamilton.edu/foodforthought/Our_Research_files/cabbage_cauliflower
_kale.pdf)
1.3.2.6 Variety of Cabbage
Table 1.12 The Variety of Cabbage
Cabbage Types Cabbage Varieties
Green Cabbage
Golden Acre Yellows Resistant, Stonehead,
Early Jersey Wakefied (early), Marion Market,
Market Size, Round-Up (mid-season), Danish
Ballhead, Wisconsin All Seasons (late)
Red Cabbage
Ruby Ball and Red Acre
Savoy Cabbage
Savoy King (mid-summer and late) and
Vanguard
Source: http://www.bloomingarden.com/cabbrobrucau.html
36
1.3.3 Tomato
1.3.3.1 Introduction
The developed tomato, Solanum lycopersicum, is becoming worldwide for its organic
products. Tomatoes are local to South America, however were brought to Europe at some
point during the 1500s, where they before long ended up famous and were sent out the
world over (Eu-Sol: Tomato history).For quite a while tomatoes were known by the name
Lycopersicon esculentum, yet late work by researchers has demonstrated that they are
actually part of the sort Solanum - as Linnaeus perceived when he previously depicted the
species. Today, researchers and plant reproducers all utilization the name Solanum
lycopersicum for the developed tomato.
The tomato is a herbaceous plant with exceedingly isolated leaves that have long, thin
hairs with a particular aroma (brought about by organs on the hair tips). The blooms are
splendid yellow and have a jug formed stamen cone in the middle. The natural product is
generally splendid red, yet can be a wide range of hues - there are numerous assortments
of the tomato. Initially, the tomato was from the western waterfront deserts of South
America, however today develops everywhere throughout the world.
Rambling or sub-erect fleeting herb, generally developed for its eatable organic product.
It is known as an infrequent break from development. All pieces of the plant shrouded in
long viscid hairs. Leaves pinnatisect, separated to the midrib. Blossoms in sidelong
raceme-like heads on long peduncles, yellow. Natural product - the notable tomato -
brilliant red when ready.
1.3.3.2 Botanical Description
The herb grouping of the tomato has a captivating history, first being placed in the family
Solanum, close by the potato and being recognized as Solanum Lycopersicon. Be that as
it may, this assignment was changed to Lycopersicon esculentum, Lycopersicon being
gotten from the Greek word meaning "wolf peach," and esculentum just importance
consumable. In spite of the fact that there are comparative plant qualities among potato
and tomato plants, bloom concealing (yellow for tomato and generally white or violet for
37
potato) and particularly the shape and method for the opening of residue bearing
structures are the qualities that separate the two plants. (www.growtomatoes.com)
Division: Anthophyta
Class: Dicotyledons
Family: Solanaceae
Sort: Lycopersicon esculentum Mill – tomato
Lycopersicon pimpinellfolium (L.) Mill – currant tomato
Lycopersicon esculentum var. cerasiforme – cherry tomato(www.growtomatoes.com)
1.3.3.3 Benefits
Leaf: Used in Surinam for treating nascent sickness spots, in a blend with castor
oil. In a glue connected to filaria worm swellings on an excruciating crotch. Natural
product: In Surinam, eaten to give customary defecations. Contains nutrients A, B, C and
D.
1.3.3.4 Types of Tomato
There are various sorts and assortments of tomato plants. Pick tomato plants as per your
needs and inclinations, yet in addition don't hesitate to analyze a tad. Customary tomato
types that can be found at home and little gardens are given in the going with once-over:
Beefsteak tomatoes or meat tomatoes – These are enormous varieties with certain
natural items weighing 500g or altogether more. By far most of the combinations are pink
or red, as often as possible with verbalized ribbing.
(www.madaboutberries.com/tomatoes/tomato-types-and-varieties.html)
Ordinary beefsteak tomato – The arrangements incorporate Brandywine, Beefmaster,
Beefsteak, Big Beef, Cherokee Purple, Mortgage Lifter, Bucking Bronco, Pink Beefsteak
and various others. (www.madaboutberries.com/tomatoes/tomato-types-and-
varieties.html)
Cherry tomatoes – These are close to nothing and balanced tomatoes grown in size from
a cherry up to the size of a golf ball. Cherry tomatoes are round to somewhat oval fit as a
fiddle and for the most part red in shading, however yellow, green and dark assortments

38
likewise exist. The more extended cherry tomatoes share a couple of traits with plum
tomatoes and are normally known as grape tomatoes.
Most notable cherry tomato arrangements are Super Sweet 100, Yellow Pear, Italian Ice,
Bloody Butcher, Black Pearl, Sun Gold, Honeybunch Cherry, Cherries Jubilee, Green
Envy, Napa Grape, etc.(www.madaboutberries.com/tomatoes/tomato-types-and-
varieties.html )
Grape tomatoes:
These are shaped equivalently to the oval plum tomatoes, anyway having the little size
and sweetness of cherry tomatoes. Grape tomatoes produce close to nothing and normally
elliptical organic products - like basic grapes.
Plum tomatoes:
These are a kind of tomato raised for sauce and squeezing purposes. They are normally
oval or tube shaped fit as a fiddle, with altogether less seed compartments than standard
round tomatoes and have a for the most part higher strong substance, making them
progressively appropriate for preparing.
Campari tomatoes:
These will be tomatoes noted for their heavenliness, low sharpness, high sugar level and
nonattendance of coarseness. Campari tomatoes are dull red and greater than a cherry
tomato, yet more diminutive and rounder than a plum tomato. They are routinely sold on
vines. Campari type tomatoes incorporate various assortments, for example,
'Enchantment Mountain', 'Cornell M'.
Porch tomatoes:
These are half and halves amazing for compartments and little gardens. They bear
heavenly tomatoes on strong, moderate plants that grow only 2 - 2.5 feet tall. Plants,
generally, needn't bother with assistance, yet the heaviness of the regular items can be
absurdly significant for the plant, especially when exhibited to the breeze. During the 7-8
gathering period, the single little plant can make 50 or fundamentally more tomatoes.
Dim, purple, yellow, etc. Tomatoes is staggering improvement plants that yield heavenly
tomatoes sensible for every usage, comparatively as typical tomatoes. Regardless, such
collections are for the most part utilized for dinners and dishes like servings of mixed

39
greens and mixed drinks. (www.madaboutberries.com/tomatoes/tomato-types-and-
varieties.html )
Table 1.13 Variety of Tomato
Image
Common
Name
Color
Maturity
Date
Generic
Type
Shape
Size
Beefsteak
Red 96 days Heirloom
Large
Beefsteak
Cherry
Bambelo
Orange 55–68
Hybrid
Small
Oval
Plum tomato Red 70–80
Heirloom
Medium/
Large
Standard
Campari
Red 69–80 Hybrid
Small
Cocktail
Azoychka Yellow 68–78
Heirloom
Large
Beefsteak
Source: http://www.bloomingarden.com
1.3.4 Brinjal
1.3.4.1 Introduction and scientific classification
Daunay (2008) has secured eggplant reproducing broadly. As indicated by his
aggregation, there are reports that S. incannum, a wild sort of S. melongena is found in
Southern India. S. incannum isolated persistently, in South East Asia into an immovably
related creature assortment, the wild S. melongena which is still found creating in
trademark conditions in enormous domains from Southern and Eastern India to Southern
China, Philippines and Indonesia and this has been depicted by past botanists as S.
cumingii. (Brinjal (Eggplant): Origin, Breeding Methods and Varieties | India)
Solanum melangena has a place with family solanaceae. Plant type is polymorphous,
erect developing. grow a tallness of 0.5 - 1.5m, tap root framework, basic leaves with
praise type or elliptical organized on the other hand, blossoms conceived separately. An
organic product is berry. It outlines a cup-like structure at the base.
Corolla is five-lobed gamopetalous with edges of folds incurved. There are five stamens
that are free and implanted at the throat of the corolla. Anthers are cone-shaped, free and

40
with apical dehiscence. The ovary is hypogynous, bicarpellary, syncarpous and with basal
placentation. Heterostyly is a run of the mill component. Four sorts of blooms have been
accounted for relying on the length of style. (Brinjal (Eggplant): Origin, Breeding
Methods and Varieties | India)
1.3.4.2 Types
1. Long styled with large ovary
2. Medium styled with medium size ovary
3. Pseudo-styled with rudimentary ovary and
4. True short styled with very rudimentary ovary
1.3.4.3 Varieties of Brinjal:
A couple of promising cultivars of brinjal, viz., Pusa Purple Long, Pusa Purple Cluster,
Pusa Kranti, Pusa Purple Round, PH 4, Pant Samrat, Pant Rituraj, KT 4, Punjab Barsati,
Azad Kranti, K 202-9, Arka Navneet (Hybrid), T 3, Jamuni Gola, Pant Brinjal Hybrid 1,
Pusa Anmol (crossbreed), Arka Kusumakar, H7, Hisar Shyamal (H 8), H 16, Pusa Hybrid
5, Pusa Hybrid 6, NDB 25, Sel 4, DBSR 31, KS 224, DBR 8, DBSR 44, NDBH 6, ABH
2, BB 26, PLR 1, BB 7, BWR 12, Arka Nidhi, Swarna Mani, Punjab Sadabahar, Utkal
Tarini, etc., have been perceived/released. (Brinjal (Eggplant): Origin, Breeding
Methods and Varieties | India)
Figure 1.1 Varieties of Brinjals

41
1.3.4.4 Nutrition Chart
The serving size on the upper left corner uncovers to you the measure of the
sustenance you need to eat to get the proportion of enhancements found in the diagram.
The Daily Value rate (DV %) addresses the proportion of enhancements in the step by
step serving size (in grams). Supplement thickness is the extent of enhancement content
(in grams) to the hard and fast essentialness content (in kilocalories or joules). The
enhancement assessments grasped by the U.S. Sustenance and Drug Administration's
―Reference Values for Nutrition Labeling benchmarks.
(https://academics.hamilton.edu/foodforthought/Our_Research_files/cabbage_cauliflower
_kale.pdf)
Table 1.14 The nutrient value of Brinjal
One cup of cooked eggplant, weighing around 99.00 grams (g), Calories: 35
Nutrient Amount DV(%)
Protein 0.82gm 2%
Carbohydrate 8.64 g 3%
Foliate 14 mcg 3%
Fat 0.23 g 0%
Dietary fiber 2.5 g 10%
Potassium 188 mg 3%
Calcium 6 mg 1%
Sodium 1 mg 10%
Vitamin B6 85 mcg 4%
Vitamin K 2.9 mcg 4%
Source: Nutrient data for this listing was provided by USDA SR-21.
1.3.5 Bottle Gourd
1.3.5.1 Introduction
As indicated by De Candolle (1882), bottle gourd has been found in wild structure in
South Africa and India. In any case, Cutler and Whitaker (1961) are of the view that
likely it is indigenous to tropical Africa based on inconstancy in seeds and organic
42
products. This species seems to have been tamed freely in Asia, Africa, and The New
World.
It is not known whether domestication occurred in Africa followed by dispersal to the
Americas and Asia or the wild forms dispersed followed by independent domestication in
the Americas, Africa and Asia. Was dispersal carried out by humans or by ocean
currents? Bottlegourds can float on the oceans for many months without losing seed
viability, hence the latter alternative is possible.
Bottle gourd (Lagenaria siceraria 2n = 2x = 22) one of the important cucurbits, both as a
rainy season and summer season vegetable. Bottle Gourd is also known as white-
flowered gourd. It is one of the most important vegetables of ancient China. Because of
hard rind of mature fruits, it is, known as gourd.
The evolution of the bottle gourd is not well understood. Two principal variants are
recognized as subspecies, i.e. subsp. siceraria of Africa and the Americas and subsp.
asiatica. It is not known if the progenitor of the bottle gourd was a wild form of the
species or one of the other extant species.
1.3.5.2 Botanical Description
Bottle gourd is monoecious, yearly vine with delicate pubescence. The leaves are
cordate-praise to reniform – applaud, 15-30 cm over, not lobed. The blossoms are white,
singular, ostentatious and open around evening time. The blossom has five petals.
The staminate blooms are on long pedicels surpassing the foliage. The pistillate blossoms
are single with short peduncle and furry ovary. Ovary has three placentae with various
ovules.
The organic products are variable fit as a fiddle. Fit as a fiddle, they are tube shaped,
oval, egg formed, club molded, round and so forth. The organic products at development
are hard-shelled, smooth surfaced, green to whitish-green or tan in shading, and
differently striped or mottled.There are three stamens, two as compound and one as
single. Since flowers open at night, selfing/crossing must be done earliest in the morning.
If possible, during evening/night also, it could be done. There are three stamens, two as

43
compound and one as single. Since flowers open at night, selfing/crossing must be done
earliest in the morning. If possible, during evening/night also, it could be done.
1.3.5.3 Varieties of Bottle gourd
Pusa Summer Prolific Long:
This was developed at IARI through selection from local germplasm. It is particularly
suitable for growing as a summer crop, although it can be grown in rainy season also.
Fruits are 40-50 cm and girth is of 20-25 cm and it has been released by IARI, New
Delhi.
Pusa Summer Prolific Round:
This was developed through selection in local germplasm at IARI and has been released
by the same institution. It has vigorous growth, round fruits of 15-18 cm girth. It is
prolific bearer and heavy yielder.
Pusa Meghdoot:
This is an F1 hybrid cultivar between Pusa Summer Prolific Long and Sel-2, developed
and released by IARI, New Delhi in 1971. Fruits are long, light green and attractive. It is
relatively early and suitable for cultivation in spring-summer season.
It has shown considerable yield heterosis over Pusa Summer Prolific Long. No more in
cultivation. Pusa Manjari. This is a round fruited F1 hybrid cultivar developed and
released at IARI in 1971 from a cross of Pusa Summer Prolific Round and Sel-11. It has
given 48% higher early yield and 106% total yield over Pusa Summer Prolific Round.
Not commercially cultivated now.
Pusa Naveen:
This is a new variety developed and released by IARI. More than 75 collections were
purified and evaluated under the renewed programme which was taken-up in 1984-85.
Sel-48 was released as Pusa Naveen by IARI variety release committee. It is high
yielding (300 q/ha), and takes around 60 days for first reaping. Organic products are
consummately tube shaped and straight with no criminal neck or bend. Normal organic
product weight is 850 g.

44
Punjab Komal:
It is an early maturing, medium sized, oblong fruited variety developed and released by
PAU, Ludhiana. Marketable fruits are available in about 70 days in the wake of planting.
The natural products are light green with pubescence. There are 10-12 natural products
for each vine. The natural products are delicate and borne on medium long, meager
pedicels on fourth or fifth hub onwards. It is tolerant to cucumber mosaic infection. The
yield potential is 400 q/ha.
Arka Bahar:
This was developed and released by IIHR, Bangalore. This is a selection in local cultivars
of Karnataka. Natural products are straight, without law breaker neck, medium in size,
each weighing around 1 kg. The skin is light green. The tissue is sparkling, delicate. The
yield potential is about 400 q/ha in 120 days.
Kalyanpur Long Green:
This variety was developed at vegetable research station, Kalyanpur of CS Azad
University of Agriculture and Technology, Kanpur. The vines are vigorous and long.
Fruits are long with tapering and somewhat pointed blossom end. The yield potential is
300 q/ha in 120 days.
Pant Sankar Lauki 1:
A hybrid of PBOG 22 and PBOG 40 developed by GBPUAT, Pantnagar was released by
CVRC in 1999. Fruits are 35 cm long. Yield is about 400 q/ha.
Pant Sankar Lauki 2:
A long fruited hybrid developed at Pantnagar.
A few bottle gord hybrids from private seed companies in India are Warad, Shashi, Satya,
etc. These are about 30-40 cm long, weighing 800-900 g at marketable stage.
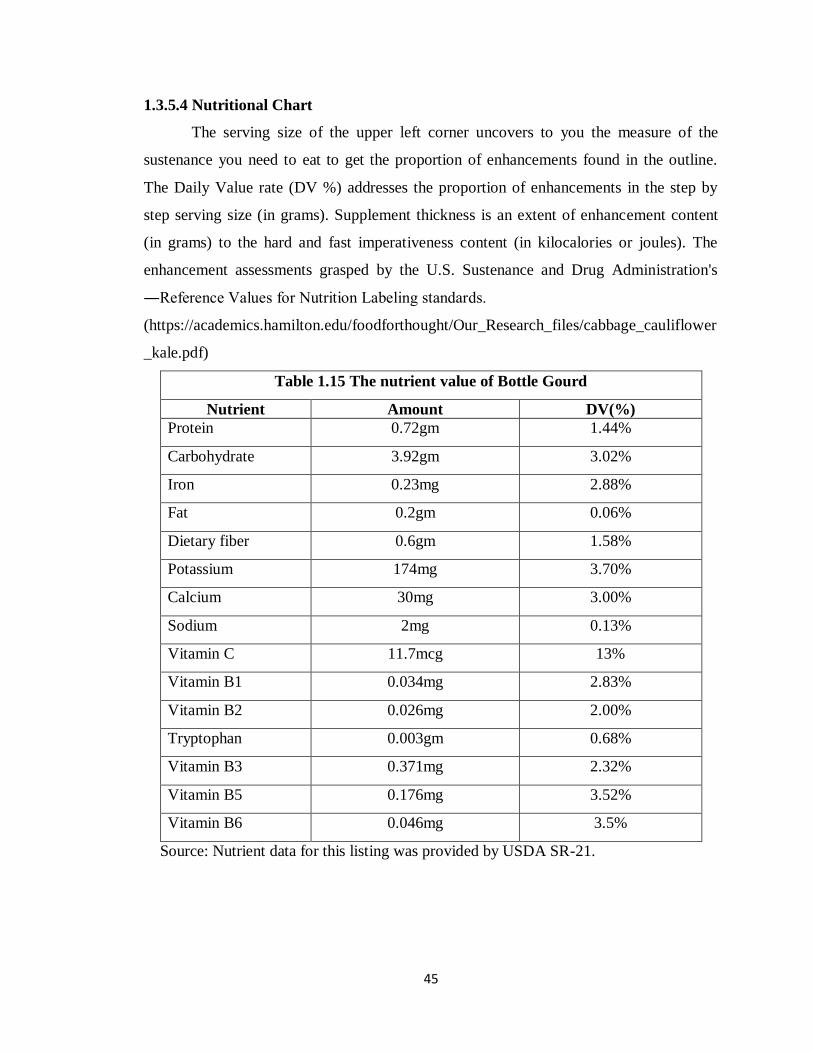
45
1.3.5.4 Nutritional Chart
The serving size of the upper left corner uncovers to you the measure of the
sustenance you need to eat to get the proportion of enhancements found in the outline.
The Daily Value rate (DV %) addresses the proportion of enhancements in the step by
step serving size (in grams). Supplement thickness is an extent of enhancement content
(in grams) to the hard and fast imperativeness content (in kilocalories or joules). The
enhancement assessments grasped by the U.S. Sustenance and Drug Administration's
―Reference Values for Nutrition Labeling standards.
(https://academics.hamilton.edu/foodforthought/Our_Research_files/cabbage_cauliflower
_kale.pdf)
Table 1.15 The nutrient value of Bottle Gourd
Nutrient Amount DV(%)
Protein 0.72gm 1.44%
Carbohydrate 3.92gm 3.02%
Iron 0.23mg 2.88%
Fat 0.2gm 0.06%
Dietary fiber 0.6gm 1.58%
Potassium 174mg 3.70%
Calcium 30mg 3.00%
Sodium 2mg 0.13%
Vitamin C 11.7mcg 13%
Vitamin B1 0.034mg 2.83%
Vitamin B2 0.026mg 2.00%
Tryptophan 0.003gm 0.68%
Vitamin B3 0.371mg 2.32%
Vitamin B5 0.176mg 3.52%
Vitamin B6 0.046mg 3.5%
Source: Nutrient data for this listing was provided by USDA SR-21.

46
1.3.6 Beans
1.3.6.1 Introduction
Phaseolus vulgaris, otherwise called the normal bean and green bean among different
names, is a herbaceous yearly plant developed worldwide for its eatable dry seeds or
unripe natural product (both usually called beans). The regular bean is an exceedingly
factor animal categories that have a long history of development.
The definite inception of the word bean is obscure, however, it is reminiscent of a couple
of sources. Germanic bauno, Old Saxon bona, the Dutch shelter, or the Norwegian bonne
are altogether identified with the contemporary English word 'bean.' Beans are found in
various genera under the Leguminosae family. The most noticeably developed of these
are the genera Phaseolus, Vigna, Vicia, and Glycine (Tobias 70). Inside the variety
Phaseolus are the species tepary bean (Latin name acutifolius), sprinter bean (coccineus),
lima bean (lunatus, alleged for its sickle shape), and normal or pinto bean (vulgaris). The
word Phaseolus originates from the Greek phaselua, "which alludes to a kayak like
pontoon reminiscent of a bean case" (Albala 7). Vigna species incorporate the moth bean
(aconitifolia), azuki bean (angularis), urad bean (mungo), mung bean (radiata), rice bean
(umbellatta), and cowpea (unguiculata) under which name both dark peered toward pea
and yard long bean fall. The Vicia variety just contains the expansive or fava bean (faba).
The Glycine variety contains just the soybean (max).
(https://academics.hamilton.edu/foodforthought/Our_Research_files/beans_peas.pdf)
1.3.6.2 Nutritional History
"Pretty much every spot on earth has its own one of a kind neighborhood animal type and
about each culture has depended upon beans" (Albala 1).
Beans and bean things are diet staples far and wide (Tobias 70). Since everlastingly, the
advancement and protection of vegetables around the world have as often as possible
suggested the complexity among life and passing. Beans are among the most
straightforward plants to create and are seen as a dumbfounding wellspring of protein
(Albala 1). In addition, Legumes have certainly gone about as an essential wellspring of
sustenance assurance against times of starvation, as they are considered for all intents and

47
purposes indestructible if appropriately all around dried and put away (Albala 1).
(https://academics.hamilton.edu/foodforthought/Our_Research_files/beans_peas.pdf)
Vegetables have regularly been related to destitution from the beginning of time. In
societies where a part of the mass can acquire protein from the creature sources, for the
laborers beans are viewed as sustenance fit; the "poor man's meat" (Albala 2). Having
beans is a shabby method for keeping up significant wholesome prerequisites, but at the
same time is going to have a negative shame related to the lower segment of people;
those that couldn't bear the cost of meat needed to rely upon beans.
(https://academics.hamilton.edu/foodforthought/Our_Research_files/beans_peas.pdf)
In India the Retail Industry is the largest among every one of the enterprises, representing
more than 10 percent of the GDP of the nations and around eight percent of the business.
In India the Retail Industry has approached as a standout amongst the most powerful and
quick paced businesses with a various players entering into the market.
Every one of them have not yet tasted achievement as a result of the overwhelming
starting speculations that are required to make back the initial investment with different
organizations.
Since this study also concentrates on Organized Retail Stores, so for this various
organized retail outlet are selected like Reliance Fresh, Big Bazaar.
The India Retail Industry is the largest among all the industries, accounting for over 10
per cent of the country‘s GDP and around 8 per cent of the employment. The Retail
Industry in India has come forth as one of the most dynamic and fast paced industries
with several players entering the market.
But all of them have not yet tasted success because of the heavy initial investments that
are required to break even with other companies and compete with them. The India Retail
Industry is gradually inching its way towards becoming the next boom industry. The total
concept and idea of shopping has undergone an attention drawing change in terms of
format and consumer buying behavior, ushering in a revolution in shopping in India.
(Samson, 2014)

48
The retail business is the fastest growing business in the world. The significant portions
in Indian retail are sustenance, apparel, buyer durables and so forth. Acquirement and
promoting of vegetables are all the more testing due to its perishability, regularity,
utilization example and cumbersomeness. Indian consumers demand fresh vegetables.
Agricultural sector in Jharkhand is being characterized by a large number of small and
marginal farmers having tiny plots of land for the production of these green vegetables.
In Ranchi there are various channels that sell these vegetables as well as do marketing of
these vegetables. The marketing of these perishable vegetables requires utmost attention
rather than the cereals and other cash crops. The marketing agencies like VegFed and
Sannat product Ltd. do marketing of these vegetables in Ranchi. VegFed as a marketing
agency was established in 1993 in Ranchi with its headquarter in Ranchi and take part in
all types of procurement and marketing functions.
This study makes an attempt to examine at what price the farmers grow and sell these
selected vegetables to these channels and what kind of supply chain method they whereas
in the second phase of the research, the study makes an attempt to know about how the
organized retail procure these vegetables from the farmer or intermediaries and by what
methodology they set the price of these vegetables and sell to the end users.
Apni Mandi or basic vegetables collection centers are the center for the organized retail
in the market place of various villages like Brambe, Mandar, Chanho, Bero and Pithoria
collects the vegetables from the farmers at the best possible prices. All the mandis have
been sorting, grading, packaging and transportation facilities. The vehicles are basically
mini trucks used for carrying the fresh vegetables from the collection to the organized
retail stores. This method is widely used by the Vegfresh, as it acts as a medium of
procurement and marketing of these vegetables in Ranchi. Sometime the organized retail
stores consult the major vegetables wholesaler and vendor who supply these fresh
vegetables as per the size and demand to them. There are around ten major wholesalers,
eighteen to twenty vendors and three to five major exporters of vegetables in Ranchi.

49
1.3.6.3 Nutritional Chart
The serving size of the upper left corner unveiled to you the measure of the
sustenance you need to eat to get the proportion of enhancements found in the chart. The
Daily Value rate (DV %) addresses the proportion of enhancements in the step by step
serving size (in grams). Supplement thickness is an extension of enhanced content (in
grams) to the outright essentialness content (in kilocalories or joules). The enhancement
examinations had gotten from the U.S. Sustenance and Drug Administration's
―Reference Values for Nutrition Labeling measures.
(https://academics.hamilton.edu/foodforthought/Our_Research_files/cabbage_cauliflower
_kale.pdf)
Table 1.16 The nutrient value of Beans
Nutrient Amount DV (%)
Protein 7.7g 15%
Carbohydrate 7.5g 3%
Iron 1.5mg 3%
Fat 0.9g 1%
Manganese 38.6mg 10%
Potassium 344mg 10%
Calcium 31.3mg 3%
Sodium 11.0mg 8%
Vitamin C 71.2mg 119%
Foliate 109mcg 27%
Vitamin B6 0.2mg 8%
Source: Nutrient data for this listing was provided by USDA SR-21

50
1.4 Organizational Profile
1.4.1 OVERVIEW OF RETAIL INDUSTRY:
The clearance of merchandise or products in little amounts legitimately to buyers is
known as retailing. A "retailer" purchases merchandise or items in huge amounts from
the makers or suppliers, either legitimately or through a distributor and after that offers
littler amounts to the end client.
Retail is India‘s largest industry, accounting for over 10 percent of the country‘s GDP
and around eight percent of employment. Retail in India is at the crossroads. It has
emerged as one of the most dynamic and fast paced industries with several players
entering the market. For making a business successful, it requires heavy initial
investments to meet the break even and to achieve the goals, but many players have not
tasted success to date. However, the future is promising; the market is growing,
government policies are becoming more favorable and emerging technologies are
facilitating operations.
Just 5-7 % of Indian retail is sorted out. Retailers of various brands in India can work
through an establishment or a money and-convey discount model. Retailing in India has
progressively crept its approach to turning into the following blast industry. The entire
idea of shopping has adjusted as far as arrangement and buyer purchasing conduct,
introducing an upset in shopping. Current retail has entered India as found in meandering
strip shopping centers, multi-storied malls and huge buildings offer shopping, fervor, and
sustenance all under one housetop. The Indian retailing region is at an accentuation point
where the improvement of dealing with retail and advancement in the usage by Indians
will receive a higher development direction.
(https://shodhganga.inflibnet.ac.in/bitstream/10603/9375/15/15_chapter%204.pdf)
The Indian populace is seeing a critical change in its socioeconomic. A huge youthful
working mass with middle age of 24 years, family units located in urban territories,
alongside expanding working-ladies populace and developing open doors in the
administrations segment will be the key development drivers of the composed retail
segment.
(https://www.slideshare.net/vagoel84/vishal-customer-relationship-management-new-1)
51
1.4.2 RELIANCE FRESH
Reliance Retail Limited (RRL) was incorporated in March, 17, 1998. has developed into
an association that obliges a large number of clients, a huge number of Farmers and
sellers. The company made fast advancement towards structure and coordinating whole
worth chain beginning from the Farmers to the end purchasers. The number of locations
of Reliance Fresh Store is operating with 700+ stores in 93 cities. The company has
added new configurations to its range in the most recent year. The organization works,
arrangements, for example, Reliance Fresh (neighborhood store), Reliance Mart (all
under one rooftop grocery store) and Reliance Super (smaller than normal shop), which
offer a scope of items for everyday family unit utilization.
It additionally has claim to fame positions, for example, Reliance Digital (shopper
durables and data innovation), Reliance Trends (attire and adornments), Reliance
Wellness (wellbeing, health and excellence), iStore (Apple items), Reliance Footprint
(footwear), Reliance Jewels (gems), Reliance Time Out (books, music and excitement),
Reliance AutoZone (car items and administrations) and Reliance Living (home-product,
furniture, measured kitchens, goods). RRL has fashioned key associations with world-
class organizations, for example, Marks and Spencer (clothing and embellishments),
Office Depot (office stationery), Pearle Europe (optical items) and Hamleys (toys).
It has an immediate commitment with more than, a million clients following a
dependability program 'Dependence One' which was offered from the primary day of its
task. During the year, it kept on reinforcing its agricultural business and dairy worth
chain to help its quickly growing store impression. By sourcing legitimately at the
Farmer's doorstep, it guarantees reasonable and convenient installments to the Farmers,
decrease in decay through its best in class store network and coordinations system and
brilliant produce to its clients.
The organization is additionally dedicated to cultivating associations with accomplices
that will make new roads of significant worth improvement for its clients. Reliance is a
subsidiary of Reliance Industries Limited entered food and grocery business in 2006.
52
Currently, it operates Reliance Fresh, Reliance Select, Reliance Value, Reliance Super,
and Reliance Mart.
The Reliance Fresh, Reliance Select, and Reliance Value are conveniently-located
supermarkets offering wide range of food and grocery, bakery products, kitchen utensils
and personal care products.
The Reliance Super offers fresh products, processed foods, FMCG, apparels, accessories,
beverages, confectioneries and wellness products etc.
Reliance Mart is a hypermarket and carries over more 30,000 products of family need.
Today, there are 1691 Reliance Fresh, Reliance Value and Reliance Select Stores spread
over 6,000 sq ft area.
With a central target Reliance Fresh stores appeared:
To give clients top notch family unit items at moderate rates.
At a similar time, the organization goes all out to protect the enthusiasm of the
farmers and manufacturers.
The farmers get a wide opportunity to sell their items directly to the merchandise,
and that too at the best cost.
(https://www.indiaretailing.com/uploads/Market_Research_pdf/13-Reliance_Fresh-
Amity.pdf)
Accordingly, it is a success win circumstance for all, the merchandise, farmers and
customers.
Dependence Fresh is the comfort store group which structures, some portion of the
business of retail, Reliance Industries of India which is going by Mr. Mukesh Ambani.
Dependence has made a speculation of 250 billion over the most recent 4 years in their
retail division. The organization as of now has 886 Reliance Fresh outlets the nation over
and 9 in Ranchi. These stores sell new foods grown from the ground, staples, goods, crisp
juice, bars and dairy items.
The organized retail outlets do not stock the vegetables for a long period, but they make a
frequent purchase from the farmers because of its perishability in nature. This is very not
the same as what the firm had initially arranged. On October 2006 when the primary
Reliance Fresh store opened in Hyderabad, not exclusively did the organization state the
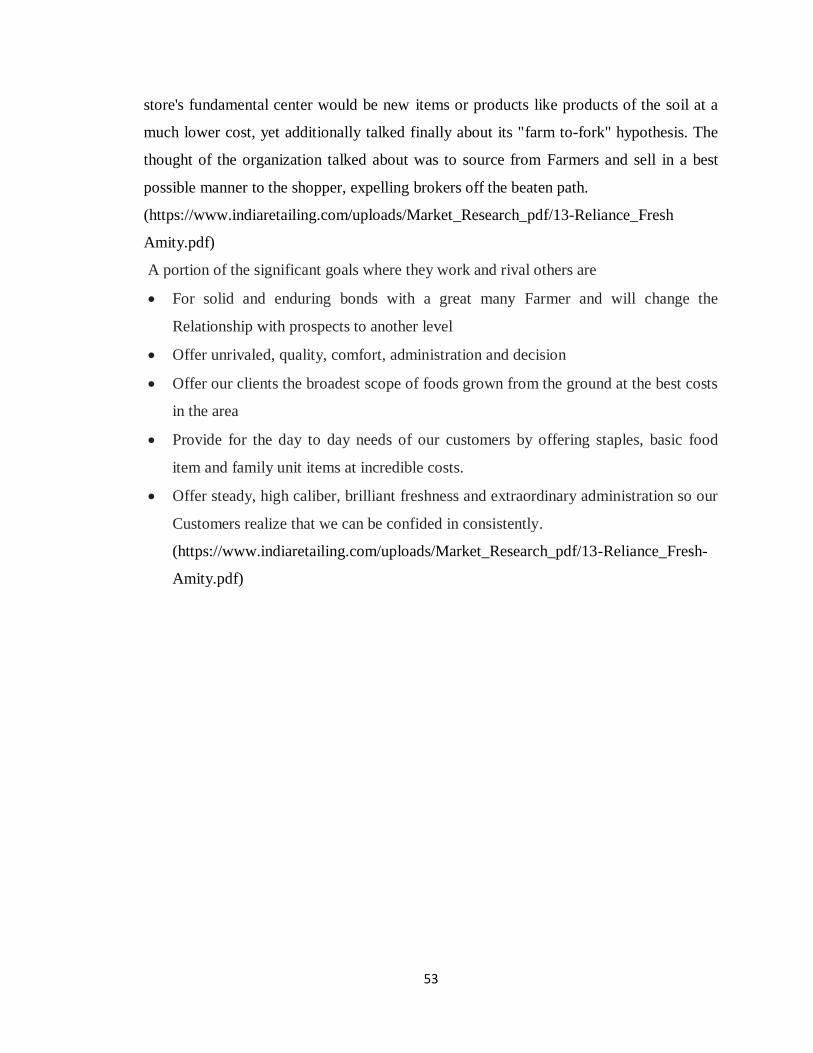
53
store's fundamental center would be new items or products like products of the soil at a
much lower cost, yet additionally talked finally about its "farm to-fork" hypothesis. The
thought of the organization talked about was to source from Farmers and sell in a best
possible manner to the shopper, expelling brokers off the beaten path.
(https://www.indiaretailing.com/uploads/Market_Research_pdf/13-Reliance_Fresh
Amity.pdf)
A portion of the significant goals where they work and rival others are
For solid and enduring bonds with a great many Farmer and will change the
Relationship with prospects to another level
Offer unrivaled, quality, comfort, administration and decision
Offer our clients the broadest scope of foods grown from the ground at the best costs
in the area
Provide for the day to day needs of our customers by offering staples, basic food
item and family unit items at incredible costs.
Offer steady, high caliber, brilliant freshness and extraordinary administration so our
Customers realize that we can be confided in consistently.
(https://www.indiaretailing.com/uploads/Market_Research_pdf/13-Reliance_Fresh-
Amity.pdf)
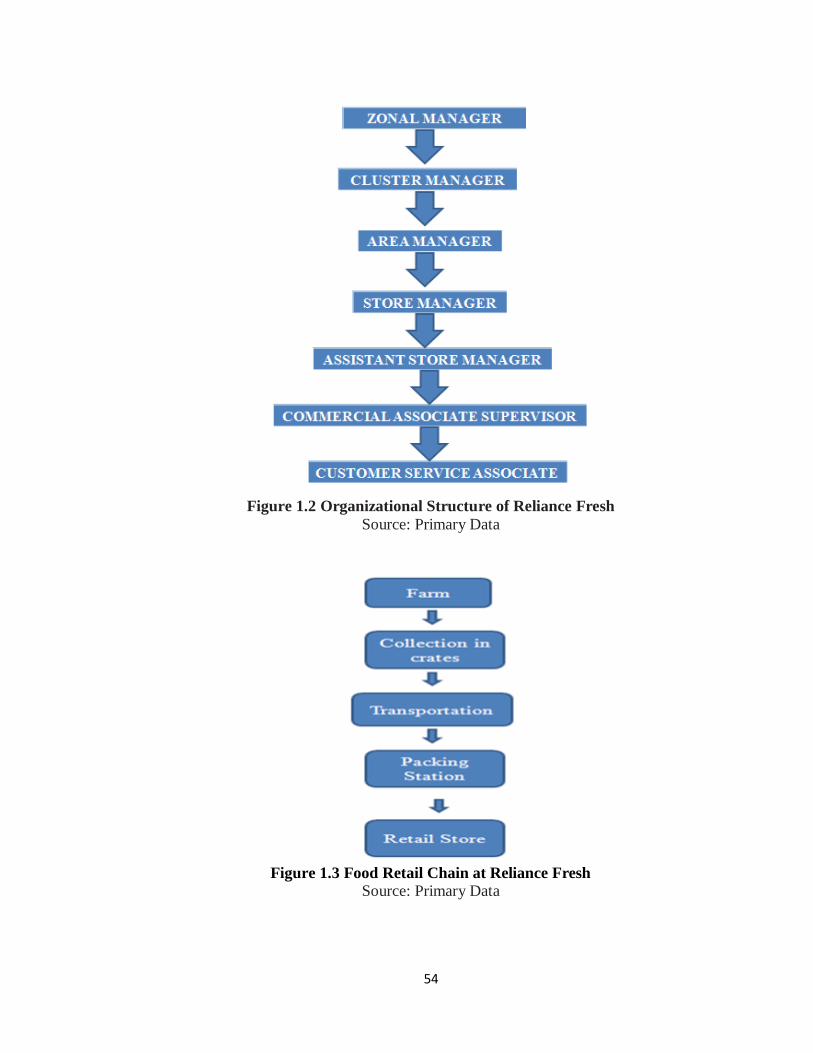
54
Figure 1.2 Organizational Structure of Reliance Fresh
Source: Primary Data
Figure 1.3 Food Retail Chain at Reliance Fresh
Source: Primary Data

55
Figure 1.4 Farm-to-Fork Model
Source: Organized Retail
Reliance Fresh/Smart Stores in Ranchi
There are nine outlets of Reliance Fresh in Ranchi in almost all the major areas. The
following are the locations of the Reliance Fresh Stores.
1. SPG Mart, Bahu Bazaar, Ranchi
2. Trikuta Hill
3. Rathod Towers, Circular Road, Ranchi
4. Vyas Enclave
5. L N Complex
6. M R Tower, Kutchery Road, Ranchi
7. Eyelex Hinoo
8. Prasad Motors, Ratu Road, Ranchi
9. Booty More, Ranchi

56
In Ranchi, Reliance Smart get a turnover around 50,000 every day, each store, though
contrasted with others urban communities it is appallingly low. The primary focus of the
store is to give great quality items at lower cost and endeavor consistently for client
service and their fulfillment. As indicated by one of the Reliance Fresh Store's chief, they
were fulfilling around 75% of client desires.
(https://www.indiaretailing.com/uploads/Market_Research_pdf/13-Reliance_Fresh-
Amity.pdf)
The typical business hours for the Reliance Fresh store, Hinoo extends from 6.30 AM
toward the beginning of the day till 10.30 PM during the evening. There are approx 20
CSA's for examples Clients Service Associates who help the clients in their buy choice
and make them feel calm. CSA‘s typically taken a shot at two movements. First move is
from 6.30 AM to 3.00 PM and second one is from 1.30 PM to 10.30 PM.
Notwithstanding the above mentioned, there are 2 store administrators for each move and
One Store chief is completely in charge of significant choices relating to the store.
The Reliance Fresh Store, Hinoo is arranged in a spot where there is a greater amount of
settlements. Significant populace living there is of Service class, for example
representative of MECON Ltd, SAIL Ltd. This Reliance Fresh Store has situated itself as
an accommodation store situated in white collar class neighborhoods. It takes into
account needs of its purchaser base by giving brilliant items in classifications of (a)
Staples (b) Fruits and Vegetables (c) FMCG (d) Kitchenware (e) array of focused costs.
Especially in Fruits and Vegetables class, as the name "Dependence Fresh" proposes the
organization stresses on the property 'New'. Along these lines, so as to offer its shopper
base quality items at focused costs, Reliance Fresh focus on its obtainment and
coordination activities.
(https://www.indiaretailing.com/uploads/Market_Research_pdf/13-Reliance_Fresh-
Amity.pdf)

57
1.4.3 BIG BAZAAR
The Future Group, which was prior known as PRIL (Pantaloon Retail India Limited)
started as a pant producer in the mid 1980s. The Future Group is separated into six
verticals – Future Retail, Future Capital, Future Brands, Future Space, Future Media, and
Future Logistics. The Future Group began activities in the mid 1987's by joining the
organization as Men's Wear Private Limited. The organization proceeded to make ready-
made pants under the "Pantaloons" brand name. It turned out with an open No. in 1991.
The primary select men's store called "Pantaloon Shoppe" was initiated in 1992.
Pantaloons went for a franchised course to extend the quantity of retail outlets and by
1995, it had achieved an essential number of 70. The principal Department store called
Pantaloons was opened in Kolkata in 1997 with a speculation of Rs 0.7 million.
The store was a triumph and recorded incomes of Rs 100 million inside the principal year
of activities. In 1999, the organization's name was changed to Pantaloon Retail (India)
Limited (PRIL). The achievement of Pantaloons Department stores urged PRIL to think
of other retailing configurations, for example, 'Enormous Bazaar ' to retail eases general
promoting, and 'Nourishment Bazaar' to retail sustenance items. Starting at 2010, the
Future Group has 15 million sq. ft. Of retail space and has diverse retail arranges in35
urban areas and 60 rustic areas the nation over. These stores pull in around 220 million
clients every year (Future Group, 2011)
Enormous Bazaar is a chain of hypermarkets in India, with in excess of 100 stores in the
task. It is a backup of Future Group Venture Ltd's, and pursues the plan of action of
United States-based Wal-Mart. Offices offered by Big Bazaar web based shopping: Big
Bazaar has an official site, FutureBazaar.com, which is a standout amongst the most
loved destinations among individuals of India for internet shopping. Future Bazaar is an
online business adventure of Future Group, which sells a variety of items, for example,
design, which incorporates stock for people, versatile frill, portable handsets and
hardware like home theaters, camcorders, computerized camera, LCD TVs, kitchen
machines and some more.

58
Limits: "Hfte ka sabse sasta" commotion was presented by the Big Bazaar, wherein extra
and unique limits were offered on Wednesday consistently, to draw in the potential
purchasers into their store.
Security check: At each exit of Big Bazaar, they use alert frameworks or Electronic
Article Surveillance framework, which distinguishes the items that has appended labels
or not.
i. Big Bazaar is a chain of hypermarket in India, which takes into account each family's
needs and necessities.
ii. Big Bazaar has discharged the entryways for the design world, general product like
games merchandise, cutlery, porcelain, utensils, and home decorations and so on,
best case scenario affordable costs.
iii. Big Bazaar gathering offers in excess of 100 stores everywhere throughout the nation
with an amalgamation of Indian bazaars' vibe and contact with an accommodation
and decision of the advanced retail offices
iv. The overall nation chain, Big Bazaar, is framed by CEO of Future Group, Mr.
Kishore Biyani. Their fundamental fascination related to sensible costs is their
Unique Selling Price.
v. Big Bazaar has turned into a huge hit with lower working class and white collar class
individuals as a noteworthy customer base.
vi. Reflect the look and feel of Indian bazaars at their advanced outlets(Future Group,
2011)
1.5 Business Models of Vegetable Retailers
1.5.1 Overview
In India the retail area is still in its early stage. The arrangements and globalization of
financial progression had lighted the nation's economy for faster development with the
help of these retail businesses. The concurrent demonstration of advancement of the
Indian economy and globalization set off a quickened modern development over the
range of all the market areas in India. The mechanical development in Indian and
changed efficient arrangement pulled in worldwide players to India in each modern

59
segment (Saxena and Sahay, 2000). The overall retail industry isn't a special case since it
has seen headway into sorted out exchanging. Sorted out retailing alludes to promoting
exercises undertaken by authorized retailers, that is, the individuals who are enrolled for
deals charge, annual duty for whose business is corporate, who execute the executives
methods overseen by experts as a firm or restricted organization or helpful. Conventional
retailing alludes to the individuals who work in chaotic markets. The composed retailing
had been started in a wide manner by the corporate, household and worldwide.
In India retail area is at the midpoint today. A move among sorted out and the chaotic
retail area is obvious, particularly in the vegetable retailing zone. This move is a call for
the trade of commercialization towards dealing with retailing. The penetration of dealt
with retail in the field of vegetable retailing will go up against irate check from standard
retailers with their present strong conventional balance. This block from the ordinary
vegetable retail can't be disregarded. The most critical thing to note is that the standard
retail association supports a greater mass and gives direct occupations. So it is amazingly
far-fetched that organization or anyone can restrain these foundation stones of Indian
economy. The activities of government and its course of action are basic in supporting,
improving, and making standard vegetable retailers.
(https://documents.mx/documents/fv-retail.html)
The Vegetables, natural products, and basic food item assume an essential job for the
presence of individuals and furthermore a very impacting job in the economy. In spite of
the fact that new natural product, vegetable, and basic food item retail has been
considered as an incredibly low-edge business, the market potential has pulled in Indian
business houses and corporate, driving the assaults through different models like single-
gathering, multi-position or joined urban-nation models (Sen Gupta, 2008). (Jacob, 2010)
To attract the overall pioneers in vegetable retailing, the organization licenses, remote
direct enthusiasm for genuine cash and-keep up a sort game plan to the song of 100
percent. The joint undertakings of private Indian associations with overall players are
allowed to work in India. Regardless, the nearby associations have a controlling stake in
the vegetable and essential sustenance thing retail. By and by, dealt with retailers are
tying down the metropolitan urban areas and urban markets. Sooner rather than later, the

60
corporate retailers will focus on the markets of the country, which have been revealed
and have undiscovered potential. The retailers are un-composed little businesspeople,
Kirana (mother and pop) stores administered by families or individuals. There are two
courses of action of their designs—stores and non stores. Store arrangements join stores
with never-ending and semi-unchanging structure, circumventing 50 square feet or more
in size, corner stores, and paper and cigarette shops. Non-stores setup covers road sellers,
asphalt merchants, truck merchants, versatile merchants (head conveying), and merchants
at day by day or week after week Farmers markets. (https://documents.mx/documents/fv-
retail.html)
An exploratory examination has been completed to comprehend customary and
composed the vegetable retailing and it‘s calculated the process. In the city of Ranchi the
region of the concentrate was restricted to the vegetable retailing.
Figure 1.5 Traditional Model of Logistics
Source: Paulrajan Rajkumar 2010

61
1.5.2 Vegetable Retail Scenario
Standard Indian retailers speak to 12 million retail outlets all over India and more than 40
percent of them sell vegetable and staple (IBEF, 2008). Indian sustenance retail contains
staple products including grains, pulses, and vegetables. The Indian sustenance retail
business, especially vegetable retailing is seeing a quick advancement in India's created
retail divisions. (https://documents.mx/documents/fv-retail.html)
The ordinary retailing of vegetables isn't particularly dealt with; entireties to 97% of the
full-scale showcase (Ernst and Young, 2006), is incredibly confined and significantly
partitioned with the gigantic number of center individuals. The center individuals
between the customers and Farmers are standard retailers with different outlet structures
mother and pop shops, non-enduring shops in the market, blacktop traders, roadside
shippers, and push truck vegetable sellers, rebate merchants, commission pros, and
salesmen. (https://documents.mx/documents/fv-retail.html)
The Farmers themselves sell their things direct to the end buyers in adjacent markets,
controlled and unregulated ' farmer markets', or they offer to delegates – masters and
dealt with retailers. The business focus is typically in proximity to the farmland and
customers getting to the market live in and around the area. Farmers selling vegetables
authentically to the customer signify, especially little part by Volume.
A farmer offers greater part of their produces to operators and salespeople. The
specialists purchase little amounts of produces from Farmers and move it to wholesalers
honestly or through another administrator. The barkers are people who go into an
acquiring contract with Farmers for the whole or the deficient measure of the items and
offer the item to a pro or a wholesaler. Salesmen also move the vegetables to wholesalers
clearly or through another administrator. A wholesaler of vegetables offers to retailers—
both traditional and dealt with retailers, and to the customers, who buy in gigantic sums.
Truck traders, a kind of traditional retailer, buy vegetables from wholesalers or made
retailers, offer to customers in compact trucks and pass on to customers at the customer's
doorsteps. (https://documents.mx/documents/fv-retail.html)
62
1.5.3 Food Mileage
When selling the vegetables, the vegetables need to pick up the speed from farmers to
retailers so that consumers can receive at specific times, if it won‘t happen then the
chances of loss will be maximized. The sustenance mileage of vegetables causes a great
impact on the vegetable on account of its transient nature. The term 'Sustenance Miles' or
' Food Kilometers' implies the detachment the sustenance goes from the zone where it is
created or took care of to the region where it is eaten up, or so to speak, the separation
nourishment makes a trip from farm to plate. Sustenance miles don't allude to the
information, material, exertion, proficiency or the vitality of the harvest yield. Sustenance
miles are a method for endeavoring to quantify how far nourishment has made a trip to
achieve buyer. ―That incorporates the adventure from ranch to processor, at that point
from the processor to the retailer lastly from the retailer to the customer. Studies gauge
that handled sustenance in the United States goes more than 2080 kilometers (1300
miles), and new produce goes more than 2400 kilometers (1500 miles), before being
devoured (Holly Hill, 2008). In the UK, 20 percent of nourishment (by weight) moves in
excess of 200 kilometers‖ (Garnett, 2003). (https://documents.mx/documents/fv-
retail.html).
The sustenance mileage impact is recognized by players in the vegetable stock system,
from Farmers to customers. "Sustenance Mileage" is a pointer that evaluates the impact
on the monetary, social and characteristic structure and it relates the quality sustenance
advantage, sustenance wastage, and move. 'Sustenance miles' is a factor to understand the
inefficiency of the sustenance stock system. In a judicious or business perspective, every
sustenance mile is excessive. The transportation cost is truly propositional to sustenance
miles. Every mile choice in the vehicle is added to the cost of the items and the customer
pays for it. The more the vegetables travel in miles, the less new they become. This infers
customers to pay for vegetables, which have less starting solid advantages.
(https://documents.mx/documents/fv-retail.html).
On the other hand, to hold freshness, molding is required while moving. Molded vehicle
again adds cost of the merchandise. At the point when the nourishment ventures less; the
cash is again reinvested closer to the homestead land network and increasingly money

63
related commitment is given to neighborhood economy. "Plant dollar near and dear and
watch network develops" (The Food Routes Network, 2008). Neighborhood Farmers who
sell directly to shoppers get a bigger portion of the benefit from their sustenance. The
local family farmers spend their money with local merchants and build a stronger local
economy. The social impact of higher mileage food is the food that comes in from
abroad. The different food safety standard is more vulnerable to unsafe food. Vegetables
with less mileage are fresh, preserve the original taste, retain initial ingredients and more
palatable. Less food miles create more sense of closeness and trust. Ecologically, 'food
mileage' is a convenient indicator of sustainability and sustainable development; wherein
less food miles indicate more sustainability. Reducing food miles is reduction of
emissions. Shorter distance travel leads to reduced usage of fossil fuels and thus,
conservation. Minimum food, travel signifies minimum pollution, environmental
degradation and global warming.
(https://documents.mx/documents/fv-retail.html).
Vegetables went in various courses log various mileages. The impacts of the
'Nourishment Mileage' on the players the vegetable natural pecking order can be
followed. The nourishment mileage has been communicated in kilometers; "least"
mileage is the most brief separation gone by a vegetable and "market" mileage is the
normal mileage of a similar vegetable. The base mileage separation is contributed by
extremely little amount, which is under 0.5%of the everyday exchange volume.
(https://documents.mx/documents/fv-retail.html).
The nourishment mileage esteems are from the client's goal in Ranchi. The sustenance
mileage determined for the vegetables directed through sorted out retailing depends on
the composed retailer's outlets in Ranchi.
The nourishment mileage is the Weighted Average Source Distance (WASD) (Pirog and
Benjamin, 2003). The equation for the WASD is:
WASD = { (Vegetable weight in Kg)x (Distance travelled in Km) }
(Vegetable weight in Kg)
Business pioneers have embraced sustenance miles as a model for understanding,
proficiency in a nourishment production network. The Biologists consider sustenance

64
miles as pointers of maintainability and various sections of individuals and various
organizations see nourishment miles in an unexpected way. There is a need felt to ponder
the nourishment mileage for vegetables in India with current foundation and economic
situation. As the time taken between any two was not watched, the speed at which
vegetable achieves its goal has not been examined. (https://documents.mx/documents/fv-
retail.html).
1.5.4 Marketing of Vegetables
In the marketing of vegetables, which is perishable in nature, supply chain plays a
important role. In today‘s scenario marketing of vegetables is challenging because of its,
nature, perishability, seasonality, bulkiness, and consumption habits of the Indian people.
The poor condition of farmers should approach toward contract farming, farmer,
producer organization, etc. To reduce the middleman in supply chain and gain maximum
profit.
The major vegetables, which are marketed, are Cauliflower, Cabbage, Beans, Tomato,
Ladyfinger, etc.
The marketing of these vegetables is not well organized. The major channels which play
an important role in the vegetable marketing in Ranchi are:
Sannat Product Ltd.
Pandra Mandi
Mother Diary Fruits & Vegetables Ltd.
Daily Market Mandi
Reliance Smart etc.
There are various small or medium channels which also do marketing of these major
vegetables in an unorganized way. In Ranchi there are four to five major haats who deal
with these vegetables and sometime the farmer it come to these bazaars or haats for the
trading without the help of any middleman or intermediaries to gain maximum margin.
Beside the major channel there are the some mahajans who also play a significant role in
the marketing of these major vegetables, they use to fix the price of the vegetables as per
the last day market scenario.

65
Figure 1.6 Various Sources through Which the Marketing of Vegetables Done
Source: Primary Data
In the present situation showcasing of vegetables is testing a direct result of its
perishability, regularity, cumbersomeness, and utilization propensities for the Indian
purchasers
Marketing of agricultural yields is very unpredictable and hazardous because of the short-
lived nature of the produce, intermittent age, and unwieldiness. The scope of expenses
from creator to the customer, which is a consequence of intrigue and supply of trades
between various center individuals at different levels in the advancing system, is
additionally remarkable for natural products. In addition, the showcasing plans at various
stages additionally assume a significant job in value levels at different stages viz. from
homestead entryway to a definitive client. These highlights make the showcasing
arrangement of organic products to vary from other agrarian items, especially in giving
time, structure and the space utilities. The market foundation is better created for the
nourishment grains, leafy foods markets are not unreasonably very much created and
markets are clogged and unhygienic.

66
Figure 1.7 Different Marketing Channels of Vegetables
Various Marketing Channels
• Farmers-mahajans-wholesaler-retailer-consumer.
• Farmers - mahajans -retailer-consumer.
• Farmers- mahajans -consumer.
• Farmers-consumer.
India is Becoming an Important Market in the Global Vegetable Trade
The capable Agriculture Solutions offers a full administration consultancy along with
production network. The solutions company covers the complete range of nourishment
and farming part and sub-areas with the foods grown from the ground exchange India as
the principle center.(A, Rasi M & Sheoran, 2015)
Able Agriculture Solutions give inventive homestead to market store network
arrangements in retail and discount fragments of crisp, solidified, new cut and dried out
Fruits &Vegetables its customers are built up organizations, farming new businesses and
abroad organizations who wish to enhance or go into the Indian new product exchange or
set up retail chains for transient produce. The organization likewise gives sourcing and
promoting help, both for wares and apparatus/gear, to sorted out retail, nourishment
handling organizations and people notwithstanding being a specialized warning and
venture consultancy for bigger foundation tasks like discount produce markets,

67
sustenance parks and cold chain activities being attempted under aegis of the Indian
Government offices like NHB, MOFPI, NHM, NABARD and so on. Capable Agriculture
Solutions in additionally engaged with venture arranging, acquainting new items with the
market and is likewise associated with connecting little towns who produce crisp produce
to empower at that point to supply huge guaranteed markets, especially sorted out
retailers. This assistance Farmers increment their pay by removing the center man,
improving profitability, decreasing the expenses of generation other than it deliver higher
quality foods grown from the ground because of less/improved dealing with over the
inventory network. (A, 2015)
1.5.5 Hub and Spoke Model
At present, organized retailers including prominent players like Spencer's Retail,
More (Trinethra Super Retail Ltd.) and Food Bazaar (Pantaloon Retail India Ltd.) is
adopting 'Hub and Spoke' business model of retail vegetable marketing. Figure 1.8
illustrates the Hub and Spoke business model of retail vegetable marketing. Fewer
players are involved in this model compare to the traditional retailing model. Farmers,
organized retailers, wholesalers and customers form this chain. Buying centers, hub and
stores (retail outlets) are operational units of the organized retailers. Small farmers and
contract farmers who executed a trade contract with the organized retailers are the
primary source of supply of vegetables to the organized retailers. The buying center
makes the vegetable purchases directly from the farmers and transport to the hubs. A hub
is served by one or more buying center and a buying center serves one or more hubs. Hub
infrequently buys small Vol. of vegetables from the local wholesale market to balance
demand supply gap. Hub in turn distributes vegetables to stores attached to it. A store is
served by only one hub. The store sells vegetable in retail quantity to the customers.
(https://documents.mx/documents/fv-retail.html).

68
Figure 1.8 Hub and Spoke Model.
Source: Halder & Pati 2011
The center point deals with the supply of vegetables to the retail outlets. It has supply
inclusion to all the stores of a particular topographical zone. A center is served by at least
one combination focuses and a solidification focus serves at least one center point. A
store is served by just a single center point. The store sells vegetable in retail amount to
the clients and is the last period of conveyance of Value Chain Model plan of action. The
hub disposes off the shelf life-expiring vegetables and do not sell to cart vendors. The
Value chain business model differs from hub and spoke business model in dependency on
the wholesale market and supply link between hubs. The center point in the Value Chain
Model arranged off the time span of usability lapsed vegetables, yet center points in an
HSM auction to the truck merchants. Stackable plastic cartons, beds and folded
fiberboard boxes are utilized in dealing with vegetables. The stacking and emptying are

69
finished with self-loader stage trolleys and pressure driven stackers. On entry the
vegetables are cleaned and washed at the center point. Starter arranging and evaluating
are then done on the solidification focus without bundling. The weight arranging and the
size arranging is done at the center point itself. The wrapping machine and the film
pressing machines are then utilized in the centers. Each center point has stockroom and
space is accessible for temperature-controlled capacity. Usage of data innovation and
propelled the executives, systems are in advancement.
(https://documents.mx/documents/fv-retail.html).
Vegetables travel in four stages, specifically Farmers to sort out retailers‘ purchasing
focuses, purchasing focus to centers, from the center to the retail locations and the retail
outlet to the client. The farmers transport theses vegetables from cultivating area to the
purchasing point. The vehicle of vegetables in the second period of purchasing focuses to
center is organized by purchasing focus. Method of vehicle is unconditioned trucks. New
vegetables are moving into the third stage from center point to the stores and time span of
usability lapsing vegetables are coming back from stores to center point. The time frame
of realistic usability lapsed vegetables offers to truck seller. Clients purchase and get
vegetables from the sorted out retail locations. The stores offer home conveyance for a
shorter inclusion zone and high estimation of buying.
(https://documents.mx/documents/fv-retail.html).
Vegetables are handled in stackable plastic crates and corrugated fiberboard boxes. The
stacking and emptying are done physically. On entry vegetables are then cleaned and
washed at the center. The arranging and evaluating is done at the center point without
bundling. The space accessible for temperature-controlled capacity is less, however
warehousing is utilized for it. Data innovation and propelled the board procedures are
conveyed halfway. Network among center point and corporate office is built up.
(https://documents.mx/documents/fv-retail.html).
70
1.5.6 Value Chain Model
Currently, organized retailer Reliance Fresh (Reliance Retail Ltd) follows a Value Chain
business model (VCM). Organized retailers who adopt VCM procure the produces
directly from farmers and sell to customers by avoiding intermediaries. This model is
based on its core growth strategy of backward integration and progressing towards
building an entire value chain starting from the farmers to the end consumers. Very fewer
players are involved in this model compared to the traditional retail model or organized
retailer's hub and spoke model.
Farmers, composed retailers, and customers are the players who structure this value
chain. In this preparation, farmers, composed retailer's operational units, association
centers, focus point (scattering centers) and retail outlet stores, and players are customer.
Fewer farmers, contract farmers, and lease Farmers are the basic wellspring of supply of
vegetables to the sorted out retailers. Contract farmers and lease farmers are farmers who
execute a trade agreement with the organized retailers for sale of vegetables. Figure 1.9
speaks to the Value Chain Model strategy of vegetable retailing. Vegetables move from
ranch territories to customers in four phase‘s farmers to blend centers, association centers
to focus guide, focus point to retail outlets (stores) and stores to customers. Free Farmers
supply their produces to the mix centers; contract Farmers and lease farmers produces are
gotten by hardening centers. One hardening center supplies vegetables to various focus
focuses, depend upon the thing. Focus focuses get quick movement from the
understanding of developing zones.
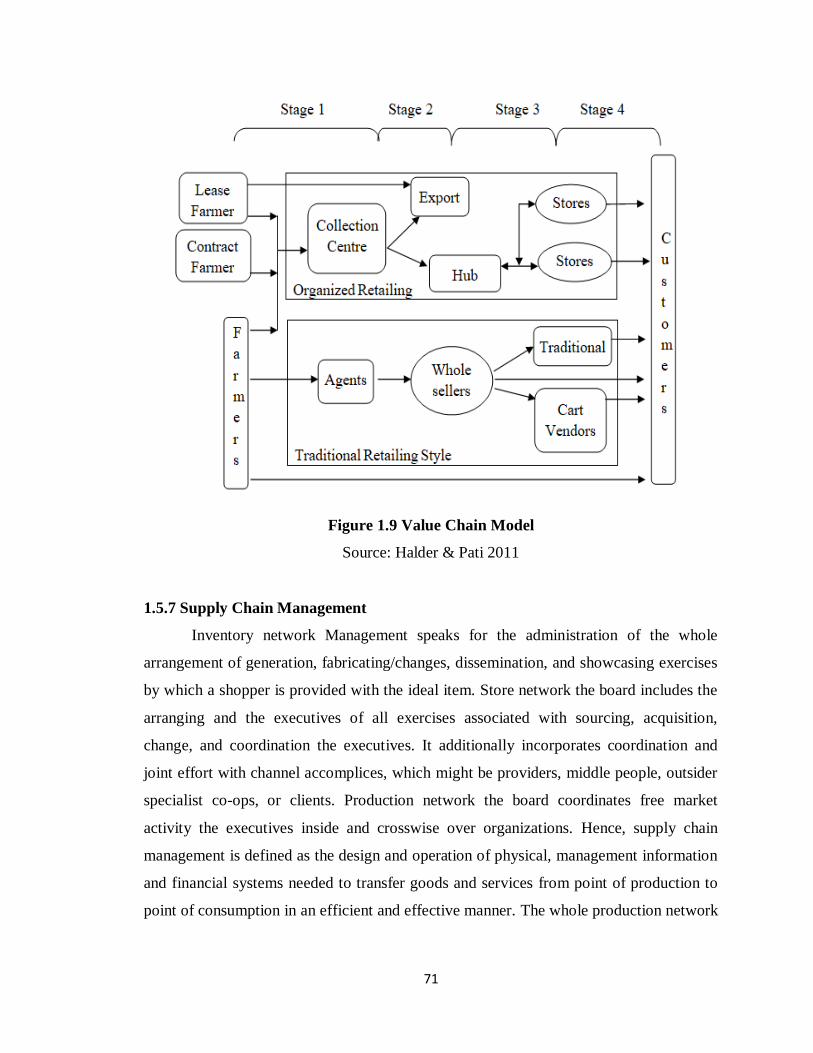
71
Figure 1.9 Value Chain Model
Source: Halder & Pati 2011
1.5.7 Supply Chain Management
Inventory network Management speaks for the administration of the whole
arrangement of generation, fabricating/changes, dissemination, and showcasing exercises
by which a shopper is provided with the ideal item. Store network the board includes the
arranging and the executives of all exercises associated with sourcing, acquisition,
change, and coordination the executives. It additionally incorporates coordination and
joint effort with channel accomplices, which might be providers, middle people, outsider
specialist co-ops, or clients. Production network the board coordinates free market
activity the executives inside and crosswise over organizations. Hence, supply chain
management is defined as the design and operation of physical, management information
and financial systems needed to transfer goods and services from point of production to
point of consumption in an efficient and effective manner. The whole production network

72
the boarding procedure is a worth chain where bottlenecks, esteem, including variables
and obligation elements are distinguished and tended to, in this manner empowering the
retail association to have a proficient inventory network. The supply is the piece of retail
activities that guarantees that the correct item is in the perfect spot, at the opportune time
and at the correct expense. The store network point of view can enable the retailers to
distinguish unrivaled providers and merchants and help them to improve profitability,
which at last cuts down clients‘ costs.
1.5.7.1 Supply Chain Operation at Ranchi Market
In Ranchi market, there is an existence of Apni Mandi through which the different
retailers as well as the intermediaries collect the vegetables. The different operational
activities are performed in these mandi with which they collect the vegetables. The below
figure 8.6 shows the supply chain operational activity of vegetables.
Figure 1.10 Supply Chain Operations at Ranchi Market from Farmer to Retailers
(Source: Project work of Birsa Agriculture University)
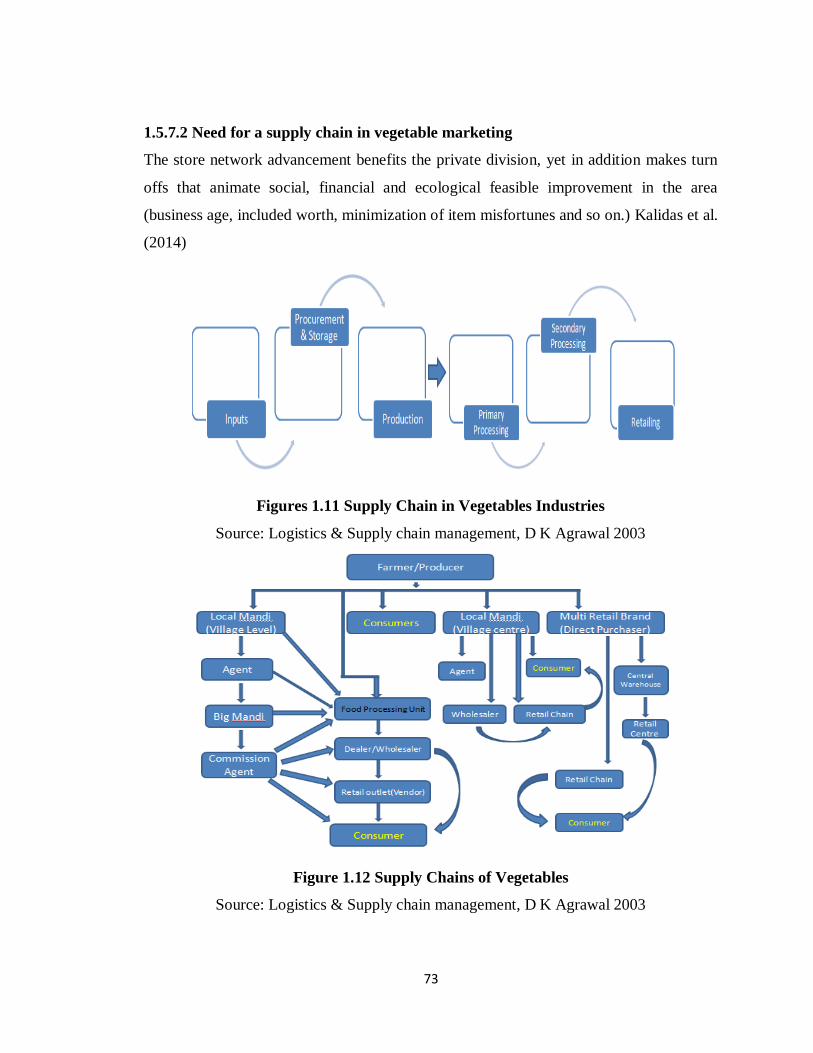
73
1.5.7.2 Need for a supply chain in vegetable marketing
The store network advancement benefits the private division, yet in addition makes turn
offs that animate social, financial and ecological feasible improvement in the area
(business age, included worth, minimization of item misfortunes and so on.) Kalidas et al.
(2014)
Figures 1.11 Supply Chain in Vegetables Industries
Source: Logistics & Supply chain management, D K Agrawal 2003
Figure 1.12 Supply Chains of Vegetables
Source: Logistics & Supply chain management, D K Agrawal 2003

74
Figure 1.13 Distribution of Vegetables in Ranchi market
75
1.6 Price Variation of Vegetables
1.6.1 Overview
Costs of vegetables are administered by the law of free market activity. At the point when
the supply of any vegetable surpasses the interest for that item, costs will in general be
lower than normal.
Similarly, when the demand exceeds the supply, prices tend to rise. Often small changes
in quantities offered for disposal on the National Markets have a magnified effect on
prices.
The year-round availability of processed vegetables (frozen, canned and, to a lesser
extent, dehydrated) may reduce demand for the fresh product, particularly when prices
are inflated. The availability of other products, which can be used as substitutes for a
particular vegetable, may also play a role.
The interest for a particular vegetable is likewise influenced by changes in shopper
inclinations and eating designs, and by the difference in the season. A Plate of mixed
greens yields is progressively well known during the hotter summer months, while those
vegetables utilized for cooking and for soups are more sought after during the cooler,
winter period. Changes in expectations for everyday comforts, and expanding
urbanization of the populace, influence the sort of sustenance that families devour.
At the point when the costs have been unusually high for a few whiles, numerous
Farmers who don't regularly develop the specific yield endeavor to benefit from these
costs by developing the harvest.
This prompts over-supply of the ware, with resultant low costs. After times of low costs,
a few cultivators suspend generation, bringing about a drop in supply and more expensive
rates.
It is typically just the reliable maker who makes a budgetary achievement of vegetable
cultivating over the long haul.
The overarching atmosphere in the creation territories is the significant reason for
vacillations in the occasional supply of vegetables, and consequently of costs. Ice touchy
harvests are generally just created in summer in many regions of the nation. The supply
of vegetables bigoted of cold temperature increments in summer, and lower costs win for

76
these yields. In winter, and particularly in spring, generation of such warm-season yields
is confined to a couple of ice free regions. Makers in such regions may subsequently
anticipate more expensive rates for their items.
Another complicating factor is that, while the climate at a particular time of year may
favor crop growth, it may also favor disease development or pest incidence. This may
make the production of a specific vegetable more difficult, or more costly, with the added
input of necessary control measures. Losses from pests and diseases can affect the supply
situation, and prices at that time of the year rose with shortages.
At the demand level, the price of fresh fruit and vegetables is also influenced by many
factors: variety, size, packaging, brand, organoleptic quality or the maturity of the
product (ready to eat, etc.), demand for specific growing practices such as organic or fair
trade, promotion activities, etc.
All these elements are influencing the price. Furthermore, logistical constraints or the
place of purchase (supermarket, hard-discount, and grocery store) also exert an influence
on the final price.
Finally, one should not forget the overall economic situation and purchasing power, the
demand for competing products, changes in consumer demands and so on.
Starting at the production level climate contingencies, like frost, heat, rain, drought, etc.
affects the production in terms of volume. As in terms of quality and availability. There
may be also production contingencies due to plagues or pests. The price of fresh produce
is also influenced by the time of the purchase, as products outside or at the beginning/end
of the season might be more expensive than in the middle of it. Market elements such as
differences in supply between regions and/or countries, shortages, abundant supplies or
temporary delays and the interdependencies among product categories all influence the
final price.

77
1.6.2 Major Factors Which Causes As A Trigger Factor In Price Sensitivity
Mechanism Of Green Vegetables
At the time of a field survey from the observation and interaction with the farmers and
retailers the researcher found the various trigger factors in the price sensitivity
mechanism of green vegetables which affects the price of these vegetables. Some of the
major factors are listed below.
1. Environment
2. Lack of scientific production approach of the farmer
3. Lack of storage and inventory system
4. Mismanagement of Supply Chain Management
5. Miss accessibility of the market demand and supply in region wise condition
6. Technical and skilled manpower‘s are not available in every region
7. Vegetables are not treated as a cash crop by the farmers
8. Particular forwarding or auction market is not available in every region
9. Transparency in the middle man operating system is not there
10. Hoarding is also ram pared with different political or power group supports
11. The export orientation of the green vegetables is lacking
12. Infrastructural supportive systems are also not there with the production of green
vegetables
13. Green gas production are high with the captive production system
14. Cross Jenom and cross breeding scientific research are not so much conducted in this
research
15. Lack of subsidy support
16. Lack of administrative supporting mechanism from the government.
1.6.3 Reasons Why Vegetable Prices Keep Increasing
The continuous rising prices of vegetables have been a serious concern in Indian. If you
think that it is only onions whose price is increasing, you are highly mistaken. The price
of major vegetables like cauliflower, cabbage and tomato are increasing with time. The
average middle class families think twice before buying the vegetables because of its
high prices.

78
Why the monetary values of vegetables are increasing at a continuous pace in India? It is
not ascribable to a poor crop or a bad monsoon. Plus the country‘s backbone is
agriculture. On that point are several components involved in the mounting costs of these
products.
Figure 1.14 Reasons why there is a Price Variation in Vegetables Prices
Increase in the demand for protein-enriched green vegetables
The lesser-realized Bennett's law gives a significant clarification at rising sustenance
costs. As per this law, when pay rises or individuals become wealthier, they change their
dietary propensities, moving their preferences from basic dull plant-ruled weight control
plans to assortment of nourishment things, including a scope of vegetables, natural
Reasons why
vegetable prices keep increasing
Increased cost of
transportation
Hoarding
Increase in the demand for
protein-enriched food
and green vegetables
Supply chain missmanage
ment
Many mediators
Less production
of vegetables
Less space for
cultivation
Global inflation
Increased cost of
production
Improper management
and distribution

79
product, protein rich sustenance and dairy items. Notwithstanding, the supply of these
vegetables and heartbeats isn't sufficient in contrast with their interest. Subsequently, the
value rises.
Global inflation
Specialists state that ascent in basic nourishment things in India is basically a direct result
of the expanding item costs abroad, increment in fuel costs and manures, which thusly
influence the neighborhood produce by expanding info costs.
Less space for cultivation
With an expansion the populace, there is additionally an increment in the interest for
vegetables and heartbeats. Increment in populace has likewise prompted expanded
urbanization. Assembling, vitality and administration enterprises are on the whole going
after land, water and HR. With less accessibility of land, the costs for rural land are
rising, prompting expanded expenses of horticulture produce.
Less production of vegetables
Regardless of high discount vegetables costs as of late, Farmers of India are not
extremely enthused about taking up development of vegetables because of high
vacillations underway and costs. There is no viable government value bolster component.
Farmers are excited about money crops development like cotton and maize as a result of
better returns and lower hazard. This was distributed in an examination ponder by the
National Council of Applied Economic Research. In a similar report, it was likewise
referenced that creation of heartbeats has recorded under 1% yearly development during
the most recent 40 years, which is not exactly 50% of the development rate in Indian
populace. Accordingly, per capita creation and accessibility of heartbeats has seen sharp
decrease in India. This perpetually prompts an ascent in the cost of heartbeats.
Improper management and distribution
A significant inquiry that emerges is whether the horticultural produce has been put away
and conveyed ideally or not? There is dependably a hole in the nourishment part with
respect to this. At whatever point, a report on environmental change is distributed or an
expectation of a flood or dry spell, there are occasions of event of supply stuns. Due to
the foolishness, the costs go up fundamentally. Intentional waste of sustenance because of

80
insufficient stockpiling and conveyance decreases supply, accordingly expanding the
cost.
Hoarding
The idea of keeping the load of sustenance items like onions, potatoes, rice, beats and so
on notwithstanding when the season is finished and exchanging at more expensive rates
when there is request is known as accumulating. In India, accumulating of fundamental
products is extremely normal and merchandise is sold at twofold the costs for expanded
benefits.
Increased cost of transportation
With increment in fuel costs, the transportation charges additionally increment,
prompting an ascent in costs everything being equal, and vegetables and heartbeats are no
special case.
Increased cost of production
One noteworthy reason for increment in the costs of vegetables is the ascent in the costs
of the crude materials required in the generation beginning from seeds, to manures,
pesticides, and work costs. Thus, the expense of the final result likewise increments.
Many mediators
In India's exchanging network, the finished result achieves the customer in the wake of
going through different mediators or brokers. Every go between attempts to get benefits
by expanding the first expense and the end cost turns out to be extremely higher than the
real cost. In this way, it is normal in India that we, as customers, pay a high cost and in
the meantime the Farmers don't get a meriting cost for a similar nourishment item.
Supply chain mismanagement
There has been bungled in the inventory network of vegetables from the Farmers to the
purchasers. As indicated by reports, the distinction among discount and retail costs is
anyplace somewhere in the range of 40% and 60% and this edge is more inside urban
communities where there are the discount markets. A portion of the major No's identified
with store network botch in India are absence of rustic framework, insufficient and poorly
prepared mandi, absence of appropriate taking care of and no immediate advertising by
"farmers to consumers."

81
Figure 1.15 Factors that affect the Price of the Vegetables in Ranchi Local
Mandi
By the field survey the researcher came to know about the variations of the price
with context to selected vegetables exist on the basis of:
1. Average production of the selected vegetables
a. Selling price of the selected vegetables from the farmers end
b. Selling price of the selected vegetables from the retailers end
2. Existence of various distribution channel which effect the vegetables price
a. Farmers – Consumer
b. Farmers – Intermediaries – Consumers
c. Farmers – Intermediaries (1) – Intermediaries (2) – Consumers
1.6.5 Measures for Improving Inventory Network and It's Practicable
Deliya et al. have suggested the accompanying measures: There must be auxiliary
changes at various levels - farmers, delegates and customer. The administration, private,
open private association, cooperatives, innovation suppliers, and even the media can
assume a critical job. A foundation like streets, transport, data and correspondence
Factors that rises the price
and affect local vegetables
market
Intervention Distribution transportation cost
In-season stock of
Inventory
Unawarness of farmers
Processing Cost

82
innovation and cold stockpiling are fundamental prerequisites for better outcomes in the
Supply chain. (A, Rasi M & Sheoran , 2015)
Demand estimating is one of the significant necessities for improving Supply Chain
Effectiveness. Because of poor gauging, there is an irregularity among free market
activity. In certain months vegetables are either not culled from the ranch because of
the absence of interest. In some reason, produce isn't accessible and an outcome, the
costs are boosting up. (A, Rasi M & Sheoran , 2015)
The Department of Horticulture goes about as the facilitator for the formation of
framework offices for the showcasing of foods grown from the ground in the state.
The Department of Agricultural Marketing is encouraging the advertising of
farming/green makers in the state. The Department of Agricultural Marketing as of
late settled Raithra Santhe wherein the cultivators/ farmers can carry their foods
grown from the ground to the market and sell them straightforwardly to the
producers. The Department of Agricultural Marketing is additionally dealing with
informed Fruits and Vegetables in the state through APMCS. (A, Rasi M & Sheoran
, 2015)
Vertical coordination of farmers through cooperatives, contract cultivating, and
retail chains would encourage better conveyance of yield, decrease market dangers,
give a better framework, pull in increasingly open premium, procure better
augmentation benefits, and make mindfulness with respect to the predominant and
new innovations(A, Rasi M & Sheoran , 2015)
Logistics are redone to another significant prompt necessity to make calculated
viable. This lessens the expense, encourages the support of the nature of the product
and satisfies the prerequisites of focused clients. (A, Rasi M & Sheoran , 2015)
The State Government is giving subventions of Rs.1/ - per KWH of power, devoured
by chilly stockpiles in the agriculture division. Further, the National Horticulture
Board is giving a back-finished endowment of i25% (limit of iRs.50 lakhs whichever
is less) for the development/modernization of cold stockpiling units. Cold stockpiles
are named Agro Food Processing Industry for giving motivations and concessions
accessible to Agro Food Industry. (A, Rasi M & Sheoran , 2015)

83
The Information framework for better coordination among various partners from
farmers is the need of great importance. The web and versatile correspondence can
likewise be utilized to empower data and money related exchange between the
partners. (A, Rasi M & Sheoran , 2015)
The Public-private association is another vital arrangement. Store network like
washing, waxing, evaluating, arranging, pressing, pre-cooling, taking care of offices,
protection, money, transportation, and handling offices would increase the value of
production network capacities. (A, Rasi M & Sheoran , 2015)
The primary goal of setting up Food and Technology Parks it to advance agro and
handling enterprises in the group in zones where there is transcendent creation of
processable agribusiness and Horticulture Products. These parks will likewise give
the required infrastructural and basic offices which are fundamental for the
sustenance of the ventures. Quality confirmation research facilities, Warehousing
including cold stockpiles, regular gushing treatment plants, and so on. (A, Rasi M &
Sheoran , 2015)
1.7 Motivation for the Research
My motivation of the research is to get knowledge and put a contribution to the
farmers‘ side so that the farmers can get the best value for their vegetables
production along with the best end user price.
1.8 Scope of the Research
It is understood that the number of organized retailers in various sectors is going to
increase because of ease in shopping, better ambience, better assortment and great
experiences. This study of price variation has good scope to understand the following
areas for future strategic decisions by different stakeholders:
The research tries to explore the price variation of vegetables in Ranchi district with
reference to organized retail stores.
The identification of various important factors which have an impact on variation
regarding the price of the vegetables in different seasons.

84
This research also helps to understand the various cost components in farming and
possibility to reduce the farmers cost burden.
The research also tries to identify, evaluate and understand the overall dynamics of
price variation from farmers to consumers.

85
CHAPTER 2
LITERATURE REVIEW
86
LITERATURE REVIEW
The present chapter is devoted to review of relevant literature pertaining to the objectives
of the study. For this an attempt has been made to review the available related literature
under the following headings:
2.1 Price mechanism and marketing of vegetables
2.2 Supply chain management and small holder farmers
2.3 Supply chain management of vegetables
2.4 Micro-farming situations and bio-physical factors related to vegetable
production
24.1 Land and soil
2.4.2 Pest and disease
2.4.3 Water resource
2.5 Production problems, their causes and constraints
2.5.1 Bio-physical constraint
2.5.2 Production problem
2.5.3 Post-harvest scenario
2.5.4 Socio-economic constraint
2.6 Association of socio-economic variables with knowledge, attitude and adoption
of improved technologies
2.7 Adoption behavior of farmers with respect to vegetable production technologies
2.8 Characteristics on other agricultural products like milk
2.1 Price Mechanism and Marketing of Vegetables
Efforts to develop the agricultural sector in developing countries are now taking place
against the background of major structural change in the world agricultural industry. In
many developed countries, agricultural production is changing from an industry
dominated by family-based, small-scale farms or firms to one of larger firms that are
more tightly aligned across the production and distribution value chain. In addition, the
trend of market-orientated reforms, following multilateral trade liberalization and
87
especially structural adjustment programmes in developing countries, has led to the
increased integration of world markets. As per the observation of research conducted by
Collaborations among companies are common in the business world but rarely observed
among government organizations for agricultural development.
Mighell and Jones (1963) explain that the term includes all the ways of
harmonizing the vertical stages of production and marketing. The market-price system,
vertical integration, contracting, and cooperation singly or in combination are some of the
alternative means of coordination.‖ Within this succinct definition is the notion that
vertical coordination encompasses a continuum of possibilities, from open market spot
transactions at the one end, through to full vertical integration at the other and including
strategic alliances, joint ventures, contracting, etc.
Boehlje, M. & Doering, O. (2000) concludes that the new conditions have
affected the atmosphere in distribution channels encouraging more cooperative
relationships.
Ganesh Iyer and J. Miguel Villas-Boas (2003) say that the bargaining power of
retailers by concluding that an increase in the relative power of the retailer in the channel
reduces double marginalization and promotes channel coordination. Balagtas and Holt‘s
discussion has contributed to understand market information systems and the functioning
of market-based mechanisms for agricultural risk management, including futures,
options, and insurance. Though the progress over the decades have been a remarkable
journey, Gulati explains the demand for stronger vertical coordination in the food system
as a means of satisfying increasingly diverse consumer preferences are changing the
landscape facing food supply chain participants. The consolidation trend in the marketing
sector seems inexorable, implying that noncompetitive behavior and its effects will
remain high on the research agenda.
88
Michael G. Jacobides (2005) found that gains from intra firm specialization set
off a process of intra organizational partitioning, which simplifies coordination along
parts of the value chain.
Alam, G. and Verma, D, (2007), Reaching the end of the period of 11thfive Years
Plan (2007-2012), the support and available infrastructural facilities are in the process of
expansion and very soon the 12th
Five Years Plan (2012-2017) will come up and
expecting some positive support to agriculture to work on the road map of the agricultural
growth.
Giancarlo Moschini, Luisa Menapace and Daniel Pick (2008), discusses that the
economics of geographical indications (GIs) is assessed within a vertical product
differentiation framework that is consistent with the competitive structure of agriculture.
Mangala, K.P. and Chengappa, P.G, (2008), say that strategic interaction between
public and private actors is increasingly recognized as an important determinant of
agricultural market performance in Africa and elsewhere.
Shawn Cole and Barrett Kirwan (2009) represent the attempt at exploring the
individual, temporal, and regional determinants of participation in agricultural risk
management.
To improve small producer‘s livelihoods Rakesh Singh and H.P Singh (2009) has
developed many models. The fresh food retail chains are investing from farm to fork to
buy fruits and vegetables directly from farmers and sell them to retail buyers. However,
fresh food retail chains are largely found working with only large farmers and exclude
small farmers for various reasons.
M S Jairath and Gaurav Jairath (2009) indicate that on an average on each rupee
invested by the public sector, private sector. The analysis indicates that there is a very

89
strong complementarily between private and public investment. The study suggests that
in order to give further fillip to investment in agricultural marketing infrastructure.
Kathryn A. Onken and John C. Bernard (2010) views that with the demand in
local labeling programs such as the National Buy Fresh Buy local promotion appearing in
increasing numbers, consumers will be seeing many messages about local and fresh
produced vegetables. The study has also highlighted the needed effective measures to
reduce marketing losses at various stages.
Naresh Singla et al. (2011) says that to improve small producer‘s livelihoods,
linking primary producers with global and national markets through fresh food retail
chains is seen as one of the emerging agricultural marketing practices in India.
Research conducted by Douglas E. Hughes et al. (2012) contributes that
propositions linking the levers to market-based capabilities are offered to shape new
research opportunities in the domain of the marketing and sales interface.
Nicholas Roberts and Varun Grover (2012) talks that Customer agility captures
the extent to which a firm is able to sense and respond quickly to customer-based
opportunities for innovation and competitive action.
A, Rasi M & Sheoran , (2015), For Sustainable agribusiness improvement an
effective promoting framework is basic which influences the maker's pay as well as
shapes the buyer's welfare. Market productivity does not depend just on homestead
generation cost and yields in any case, on the system, wherein an item reaches to a
shopper from the ranch entryway. The elements affecting the market effectiveness
incorporate their transient nature, quality, cost and area like Ranchi and its adjoining area
assembly markets are situated near farm-gates where vegetables are brought by farmers.
Various intermediaries participate as buyers in these markets.
90
In vegetable markets, agents/mahajans perform work on commission by charging on sales
revenue from farmers. They do not provide lodging, boarding, transport, and telephone
facilities. Sometime these people purchase the whole from the farmers with least value
and sells as per their price. They also fix the price for the vegetables as per the last day
market operation. So an efficient marketing system has to be adopted where the farmers
get directly in touch with the buyers.
S.H. Baba et al. (2015) have suggested that the coverage of technology mission
should be expanded to other niche areas of vegetable cultivation.
A, Rasi M & Sheoran , (2015), Generally the price is paid by the different
marketing agencies regarding the packing, transportation, storage and processing, but in
the city like Ranchi the intermediaries or mahajans cut down the price of these variables
from the farmers end and lower down their margin, an efficient marketing channel has to
be developed through which the farmers can sustain with any losses. An efficient
marketing system can reduce the post-harvest losses, enhances the farmers‘ realization,
reduce the consumer price, promote grading and food safety practices, induce demand-
driven production, enable higher value addition, and facilitate export.
Demand for stronger vertical coordination in the food system is discussed by (Uma
Shankar Singh,Uma Sankar Mishra) as a mean of satisfying increasingly diverse
consumer preferences are changing the landscape facing food supply chain participants.
Contracting and other forms of vertical coordination are important parts of the
supply chains for many agricultural products. Ramesh Chand has a great contribution
academically to provide the solution for a varied range of problems in agriculture sector,
and throws light on the future of agriculture and expectation to the industry till 2020.
Berck and Perloff found the gap that retail chain procure only a limited proportion
of the grower‘s crop without any firm commitment and, more so, on a day-to-day basis. It

91
has made no genuine provision for any agriculture-input or other services and does not
have any formal contract arrangements with the farmers. The produce not accepted by the
RC has to be disposed off by the farmers elsewhere.
Barnett, Mahul, Cramer, G. L. & Jensen, C. W reviewed the research on market
structure and performance, vertical coordination arrangements, and institutions for
producer collective action has brought a good insight about contributions to empirical
modeling of agricultural price determination, and marketing margins are also evaluated,
as are innovations in research on spatial market relationships and the role of storage.
William G. Tomek and Robert J. Myers has provided the empirical price analysis,
research and concluded that it will face new data challenges in an environment where
fewer and fewer transactions are being conducted in open markets, but this creates
research opportunities as we seek answers to how different vertical coordination forms
coexist and interact with one another. Paying close attention to the time-series properties
of commodity market variables will continue to be important, irrespective of whether a
structural or nonstructural modeling approach is being used.
Study conducted by M.S. Jairath to know the extent of investment made in
promotion of marketing infrastructure in the country and find out whether private
investment induces public investment or vice versa.
2.2 Supply Chain Management and Small Holder Farmers
Though the importance of supply chain management has been well established, it is very
important to see what literatures have to say about its role for the small holders
specifically. It is very important to see how small holder survives with their limited
abilities. This section reviews some of the literatures based on supply chain management
and small holder farmers.

92
Singgih and Woods (2002) made a case study research on two banana supply
chains (BSC), one in Indonesia (BSC1) and one in Australia (BSC2). BSC1 sources
bananas from small farmers for distribution through traditional markets in Jakarta.
Brithal et al. (2005) explored how smallholders can benefit from the emerging
opportunities from silent demand-driven changes in high-value agriculture in India. They
examined the institutional mechanisms adopted by different firms to integrate small
producers of milk, broilers and vegetables in supply chain and their effects on producers‘
transaction costs and farm profitability. They found that the innovative institutional
arrangements in the form of contract farming have considerably reduced transaction costs
and improved market efficiency to benefit the smallholders. They do not find any bias
against smallholders in contract farming. Also, the study does not find that the relevant
firms have exploited their monopolistic position by paying lower prices to farmers. On
the contrary, contract producers were found enjoying benefits of assured procurement of
their produce and higher prices.
Martin and Jagadish (2006) presented the results of a study on the marketing of
smallholder produce originating in the Highlands provinces and destined for a range of
markets, including the coastal cities. They have used a defensible supply chain
framework to evaluate a range of marketing numbers and to evaluate the performance of
the marketing system.
They found that the marketing system was remarkably vibrant. It was characterized by
entrepreneurial behavior by the private sector, where businesses along the chain compete
and innovate in order to expand their operations and meet the needs of the customers in
their varied market segments. However, they are constrained in their endeavors by poor
infrastructure, which raises their costs of doing business.
They concluded that the use of a Supply Chain Framework can yield a very robust and
insightful understanding of the performance of the agricultural marketing system in
developing economies.
93
Kledal and Sulitand (2007) analyzed to what extent Chinese small lholders are
included and benefited from converting their land to organic vegetable production
supplying chains. They have investigated two case areas-Shanghai metropolis where
organic vegetable production goes solely for domestic consumption and the rural area
around Tai‘an city in the province of Shandong where the organic vegetable production is
destined for export only. In the Shanghai metropolis small holders are not included at all
in the organic vegetable production due to better off - farm employment. In the Shandong
case village cooperatives act as a contractor between an organic processing industry and
smallholders/households. The small holders/households are receiving a higher pay than
an unskilled labour would get in the industry.
Faure et al. (2007) analyzed the consequences of different coordination
mechanisms on inclusion or exclusion of small farmers in the northern region of Costa
Rica. They found that market coordination could be an efficient way to integrate farmers
in supply chains in the case of low technical specifications and of existence of adequate
selling mechanisms. Hybrid coordinate on is the main mechanism and facilitates the
inclusion of small farmers, depending on the farmers‘ organizations capacities to
negotiate adequate rules. In some situations hybrid coordination with captive
relationships could occur but leads to a more or less rapid exclusion process.
Kalaitzis (2007) reports that supply chains for fresh fruit and vegetables are going
through considerable re-shaping phase worldwide. There are many researchers who have
highlighted that the smaller holders have the ability to produce what is demanded by the
globalised market. It is very important that this re-shaping phase considers the
importance of small holders and recognize them as important constituents of an efficient
supply chain.
Milczarek-Andrzejewska et al. (2008) in their paper analyzed the impact of
supply chain modernization on dairy farmers in Poland. It is shown that joining the
modern marketing channel positively affects farmers‘ incomes. The decision to enter the
94
modern channel is crucially dependent on access to funds and facilitated by having larger
cow herds.
BSC2 includes farmers supplying to both major and independent retailers in Sydney
through a wholesale agency with some farmer ownership. In both chains, most
transactions between farmers and their buyers were completed through a fixed price
mechanism with little bargaining effort from the farmers. Because of their relative
isolation, farmers relied on the buyers to offer them fair prices that reflect market
movements in the city. Farmers in BSC1 based their trust on traditional value systems
and the competition to secure a supply in the villages. In BSC2, farmers‘ trust in their
agent developed over time in their relationships and by making comparisons between the
prices farmers received for their bananas and the market information they have.
2.3 Supply Chain Management of Vegetables
Gupta and Ram (1981) conducted a study on price spread behavior of vegetables
in Delhi and found that producers receive only 37.6 percent of consumer‗s price for all
vegetables and the intermediaries shared 10.7 percent for wholesaler, 24.3percent for
retailer and 2.6 per cent for commission agent. This indicated high profit margin of the
intermediaries and a wide price spread.
Scott & Westbrook (1991) ―supply chain is used to refer to the chain linking each
element of the process from, raw materials through to the end customer‖
Novak & Simco (1991) ―The supply chain management covers the flow of goods
from supplier through manufacturer and distributor to the end-user‖
Towil, Naim, and Wikner (1992) ―The supply chain is a system, the constituent
parts of which include material suppliers, production facilities, distribution services,
95
customers linked together via the feed forward flow of materials and the feedback flow
information‖.
Cooper & Ellram (1993) ―SCM is an integrative philosophy to manage the total
flow of distribution channel from the supplier to ultimate user‖.
Lee & Corey (1995) stated that SCM consists of the integration activities taking
place among a network of facilities that procure raw material, transform them into
intermediate goods and then final products, & deliver products to customers through a
distribution system.
Ganeshan and Harrison (1995) ―A supply chain is a network of facilities and
distribution options that performs the functions of procurement of materials,
transformation of these materials, intermediate and finished products, and the distribution
of these finished products customers.‖
Ganeshan and Harrison (1995) has defined SCM as a network of facilities and
distribution options that performs the functions of procurement of materials,
transformation of these materials into intermediate and finished products, and the
distribution of these finished products to customers.
Lee & Corey (1995) ―The integration activities taking place among a network of
facilities that procure Raw material, transform them into intermediate goods and then
final products, & deliver Products to customers through a distribution system‖
Richard Lamming (1996) has given a general review on lean supply chain in
which Lean supply has been characterized as ―beyond partnership‖. Lean supply is the
system of purchasing and supply chain management required to underpin lean
production. .

96
Christopher (1998) defined the supply chain as the network of organizations that
are involved, through upstream and downstream linkages, in the different processes and
activities that produce value in the form of products and services in the hands of the
ultimate customer.
Christopher (1998) ―The supply chain is the network of organizations that are
involved, through upstream and downstream linkages, in the different processes and
activities that produce value in the form of products and services in the hands of the
ultimate customer‖.
Handfield & Nichols (1999) ―A supply chain encompasses all activities associated
with the flow and transformation of goods from the raw material stage, through to the end
user, as well as the associated information flows‖.
Croom et al. (2000) analyze 84 studies on SCM in terms of level of analysis and
research methodologies, but the time period for their data collection is ambiguous. Their
study represents an early attempt to categorize the SCM literature.
Bailey (2001) stated that agricultural supply chains are both demand and supply
driven. While demand and supply forecast are equally important in the agricultural
supply chain, the ability of supply chain members to control supply is limited. As a result
of factors specific to agricultural supply chains it is impossible for these supply chains to
be purely customer driven. Seasonal patterns of production and other factors such as
weather and diseases are beyond the ability of either a company or chain members to
control. Agricultural supply chains can be considered as production adjusted customer
driven systems.
Mentzer.et.al.(2001), SCM is the "strategic and systematic coordination of the
traditional business functions and the tactics across these business functions within a

97
particular firm and across businesses within a supply chain, for the purposes of improving
the long-term performance of the individual companies and the supply chain as a whole".
Chopra and Meindl (2001) ―A supply chain consists of all stages involved,
directly or indirectly, in fulfilling a customer request‖.
Mentzer et al. (2001) ―The systemic, strategic coordination of the traditional
business functions and the tactics across these business functions within a particular
company and across businesses within the supply chain, for the purposes of improving
the long-term performance of the individual companies and the supply chain as a whole.‖
Vaart and Pieter (2003) drawn conclusions on the need for an inter-disciplinary
approach, combining the technical and relational aspects from the respective fields of
system dynamics and collaboration in order to deliver superior order replenishment
performance.
Carter and Ellram (2003) surveyed the articles published in the Journal of Supply
Chain Management for the total period of 35 years since its launching i.e. for 1965 to
1999. Their objective was to offer a greater understanding of the evolution of purchasing
and supply research over the first 35 years of the Journal of Supply Chain‘s existence,
and to provide guidance and prescriptions for future supply management research.
Nagarajan and Sosic (2004) reviewed literature dealing with buyer vendor
coordination models that have used quantity discount as coordination mechanism under
deterministic environment and classified the various models.
Verma & Singh (2004) estimated post-harvest losses in fresh vegetables at farm
level and found that losses are mainly caused by inadequate means of harvesting.

98
Kader (2005) also found Lack of information as one of the socioeconomic factor
causing post-harvest losses.
Gunasekaran and Ngai (2005) indicated that E-Business, product, and service-
quality, all have a significant direct effect on customer behavioral intentions to purchase
again.
Balakrishnan and Cheng (2005) reviewed and update the methodology based on
spreadsheet that provided enhanced solutions in complex environments with multiple
products and bottleneck situations.
Gajanana et al. (2006) found Pest and diseases at the field level, pressing and
crushing of fruits at the market level and injury to fruits due to pressing at the retail level
as the major causal factor of loss due to improper handling and storage.
P. K. Suri and Sushil (2006) observed that collaborations among companies are
common in the business world but rarely observed among government organizations for
agricultural development.
Vander Vorst et al. (2007) have distinguished two main types of agriculture food
systems:
Agriculture, food chains for fresh agricultural products (such as fresh vegetables,
flowers, and fruits). In general, these chains may comprise growers, auctioneers,
wholesalers, importers and exporters, retailers and specialty shops and their input
and service suppliers. The main processes are the handling, conditioned storing,
packing, transportation and especially trading of these goods.
Agriculture, food chains for processed food products (such as portioned meats,
snacks, juices, desserts, canned food products). In these chains, agricultural products
are used as raw materials for producing consumer products with higher added value.
Participants in both types of chains, e.g. farmers, traders, processors, retailers, etc,

99
understand that original good quality products can be subject to quality decay
because of an inadequate action of another participant.
Viswanadham, (2007) Lack of information regarding demand was considered as a
major reason of waste.
Ozcan (2007) listed lack of training and experience of workers as one of the
reasons for post-harvest losses.
Rehman et al. (2007) found that losses, mainly occurred during picking of the
crop. Author found harvesting at improper stage and improper care at harvest, post-
harvest problems as the primary factor responsible for post-harvest losses in the tomato
crop.
Ozcan (2007) listed Early or late harvest, Unsuitable method of harvest for
specific product, and Use of improper tools and machines by the farmers in harvesting
their farm fresh produce as the reasons for the marketing losses.
Jain (2007) discussed rough handling of produce as the main reason for post-
harvest losses. There are several inefficiencies in storage and poor handling process
which are the operational cause of waste in the supply chain, Murthy et al., (2009);
Prigojin et al. (2004).
Singh et al. (2008) identified faulty method of harvesting as the factor responsible
for losses.
Ben-Daya et al. (2008) explored the topic in a particular context, i.e. the industrial
district (ID) that constitutes a specific production model where complex SC networks can
be identified. SC cooperation may take on several forms in IDs and may produce several
benefits (e. g. Upgrading quality and reducing costs).

100
Singh et al. (2009) Traditional supply chain in India for perishable fresh produce
is very long and fragmented where they collect a sizeable share from the price paid by the
customers for the produce.
Murthy, D. S. Gajanana, T. M., Sudha, M., & Dakshinamoorthy, V. (2009). "The
supply chain concept consists of actively managed channels of procurement and
distribution. It is the group of firms that add value along product flow from original raw
materials to final customer‖.
Adeoye et al. (2009) also found such reasons as the causes of economic losses to
tomato. Author also found that careless handling of fresh produces causes bruising,
thereby resulting in splitting and skin breaks in the fresh produce. Rough handling causes
damage during off-loading of the produces resulting in high percentage of losses in the
fruits and vegetables.
Robert J. (2010) observed demand for stronger vertical coordination in the food
system is discussed as a mean of satisfying increasingly diverse consumer preferences
are changing the landscape facing food supply chain participants.
Babalola et al. (2010) found in his study that most of the farmers around 82.95 %
were illiterate which could be a contributory factor to high losses in production of tomato
because they cannot appreciate and use most post-harvest technology available and only
farmers with post primary education can appreciate and use it.
Babalola et al. (2010) analyzed the determinants of post-harvest losses among
tomato producers in Imeko -Afon local government area of Ogun state and revealed
through regression analysis that the age of fruits at harvest and the number of baskets
harvested as the major determinants of post-harvest losses because harvesting more than
the actual demand at a wrong time may causes loss and wastage.

101
Buyukbay et al. (2011) also attributed lack of demand information as one of the
main reason for waste.
Mena et al. (2011) The shortage of vegetables occurs when there is no
information regarding demand and retailer orders more than the real demand.
Sharma & Singh (2011) also found in his study on Economic analysis of post-
harvest losses in vegetable in Uttarakhand that the losses at grower level results from lack
of farmer‘s knowledge about the post-harvest management. They also have the very less
knowledge about the appropriate maturity of fresh produce and proper time of harvesting
which results in losses.
Sharma & Singh (2011) also found harvesting at inappropriate maturity, results in
erratic ripening and poor quality as one of the most important causes of Post-harvest
losses.
Buyukbay et al. (2011) determined 5-12.97% and 18.44 % of losses due to early
and late harvest in tomato and fresh bean production in Tokat province of Turkey.
Veena et al. (2011) Over 25 percent of fruits and vegetable production is spoiled
due to improper handling and storage. Farmers do not take proper care of fresh produce.
They handle, grade and pack these produce in a poor manner which subjected fresh
produce too extreme of temperatures, atmospheric modification or contamination and
attack by parasites/diseases.
Vipul Chandra Tolani and Huzefa Hussain (2013) conducted a study and found
that Vegetables and fruits play a vital role for the existence of people and also a very
influencing role in the economy of India. The traditional retailing of vegetables are not
much organized, about 97% of the total market are extremely localized and highly

102
fragmented with a large number of intermediaries. The long transport process from the
growers to the final consumer occurs the wastage of 10-12% of total in addition to the
transportation cost. This increases the cost of fruit and vegetable for the final customer
also hampers the quality.
Indian middle and upper middle class population are growing very rapidly and there is
also increasing in number of young working couples, resulted in an increase in demand
for semi-processed food, fast foods, packed foods, ready-to-eat foods. Changing tastes
and preference towards consumption of basic food items, which is driven by longer
working hours, increase in double income families, more exposure to advertising, for
comfort and convenience etc. Especially people living in cities are becoming more
health and hygiene conscious. In place of conventional wet markets, they prefer to buy
vegetables, fruits and other agri-products from the super markets and modern retail
stores, and this leads to the entry of more and more corporate into the agriculture food
marketing.
Shukla & Jharkharia, (2013) with the timely information of the market demand
farmers also need to plan and take care of the planting and harvesting activities as lack of
proper planning and management practices is one of the reasons for losses in fresh
produce supply chain.
Shukla & Jharkharia, (2013) Majority of the farmers are small land holder and
share croppers and they have very little knowledge regarding the technology, demand in
the market, and financial incentives
2.4 Micro farming situations and bio-physical factors related to vegetable
production
2.4.1 Land and soil
Mohsin et al. (1984) In general, the soil of Jharkhand is red and acidic (pH 5.5 to
5.9) in uplands, yellowish and slightly acidic in medium lands (pH 6.5 to 7.3), and
grey and alkaline in the lowlands, water holding capacity of upland soil is poor.

103
Singh et al. (1996) reported that during the diagnosis phase of project on TAR
through IVLP, Agro-ecosystem diagnosis was done using the Participatory Rural
Appraisal (PRA) tools. Through this analysis poor productivity and profitability in
rainy season cauliflower was prioritized as the most important problem, out of seven
identified production problems in vegetable crops. The criteria of problem
prioritization included the extent of yield loss, intensity of occurrence, and
importance of enterprise and distribution of the problem. Browning of curds and
hollowness in stem, mainly due to deficiency of boron and molybdenum was
identified as the major bio-physical cause as decided in the farmer-scientist interface
meeting. Continuous cropping of cauliflower on the same land caused depletion of
boron and molybdenum which led to curd rot and hollowness in the stem and thereby
lowering the productivity tremendously.
Ray Chaudhuri (2005) reported that the problem of acidity needs to be managed
by liming and discouraging shifting cultivation and deforestation in the North-east
India. The nitrogen and phosphorus deficiency can be managed with the judicious and
efficient combination of the organic and inorganic inputs on the basis of the soil test
results. The use of lime, FYM, bio fertilizers along with inorganic fertilizers proved
to be beneficial in managing these soils.
2.4.2 Pests and diseases
Chauhan et al. (1979) observed maximum disease incidence (58.3 per cent) in
experimental plots of Ranchi Agricultural College, Kanke, followed by Samlong and
Pithoria villages. Least incidence of disease was recorded in Bero followed by Chutia
in Ranchi district.
Chauhan et al (1979) and Singh et al (1988). Ajay et al (2006) observed that key
pest responsible for deterioration of quality and quantity in brinjal was shoot and fruit
borer, Leucinodes orbonalis Guen (Pyralidae: Lepidoptera ).

104
According to Jha et al. (2000) the disease collar rot of lady‘s finger was reported
as major disease of lady‘s finger (Singh et al 1987-88) and caused 20-30 per cent loss
every year in most of the lady‘s finger growing areas of the country.
Jha et al. (2000) found that the collar rot of lady‘s finger caused by
Macrophomina phaseolina (Tassi) Goid (Rhizoctonia bataticola (Toub.) Briton.
Jones) is a major disease and cause 20-30% plant loss every year. This disease is
widely prevalent in the plateau region which causes considerable loss (12.7 to 50.3
%). Similar findings have also been revealed by
Kalita and Dhawan (2001-02) observed lowest whitefly population/plant,
incidence of single and combined infection of yellow vein mosaic virus (YVMV) and
leaf curl virus (LCV) were found on early sown crop (May) at closer row-to-row
spacing (30 cm) and highest on late sown crop (August) at wider spacing (75 cm).
Date of sowing (1st week of June) and row-to-row spacing (45cm) of lady‘s finger
can be adjusted to escape or reduce the disease incidence to get maximum yield.
Chechani and Gupta (2003) identified the major sucking insect pests of vegetables
which were whitefly, aphid, jassids and thrips. All these sucking insects besides
damaging the crops directly sometimes become responsible for transmission of the
viral, fungal, mycoplasmal and bacterial diseases in plants.
Deepak et al. (2017) reported that many insect pests and diseases associated with
the tomato crop in Ranchi District which caused severe losses to the crop yield, i.e.
alternaria leaf spot, damping off of seedlings, phytophthora fruit rot, bacterial wilt,
soft rot, viral leaf curl, Helicoverpa armigera, Spadoptra lutera, semi looper,
serpentine leaf minor and root knot nematode.

105
2.4.3 Water Resources
Gadgil D.R. (1954) in the title of ‗The Industrial Evolution of India in Recent
Times‘ studied the economic effects of irrigation and concluded that the total direct
and indirect effects of irrigation projects were very favorable to the farmers. With
irrigation, farmers received higher levels of income and they were able to make
additional investment on cattle, farm implements and on commercial crops like
sugarcane and cotton. Further, it generated additional employment opportunities as
well.
Planning Commission (1964) in the study on ‗Criteria for Appraising the
Feasibilities of Irrigation Projects‘ during 1958 to 1961 observed that canal irrigation
had helped in promoting greater utilization of land, enlarging the average size of the
farm generating demand for additional farm labour, shifting to new and better
varieties of crops, increasing additional production investment in farm business and
widening the scope for increasing the revenue.
Jaiswal (1965) reported that lack of farming resource and irrigation facilities were
the most important factors attributed by the field extension workers and farmers for
non adoption of improved agricultural practices.
Moorthi T.V. and Mellor W.J. (1972) after a study on ‗Cropping Pattern Yields
and Income under Different Sources of Irrigation with Special Reference to IADP,
Aligarh District, Uttar Pradesh, concluded that farmers with private tube-wells had
better control over the water supply in terms of timely availability in adequate
quantity. This resulted in higher cropping intensity, yield, higher crop income and
cultivation of high yielding crops in such farms. This was attributed to the flexibility
factors in quantity and timing available in those farms.
Shukla V.P. (1973) in his paper on ‗Well Irrigation – Its Costs and Benefits in
Jabalpur District in Madhya Pradesh‘ examined how far irrigation from wells either
106
through electricity or diesel pumps was profitable in Jabalpur district in Madhya
Pradesh, especially in the context of advanced technology.
Behra and Sahoo (1975) found that the reason for non applicability of the
demonstrated practices were lack of irrigation, lack of finance and unsuitability of
land.
Vyas V.S. and Mathai G. (1978) in their paper on ‗Farm and Non-farm
Employment in Rural Areas: erspective for Economic Planning‘ confirmed the direct
relationship between irrigation and use of other inputs like fertilizers and chemicals.
They also concluded that it resulted in increased labour use.
Suryawanshi S.D. and Kapase P.M. (1985) have analyzed in their research paper
on ‗Impact of Chod Irrigation Project on Employment of female Agricultural Labour‘
that agricultural labour and farm cultivation as the main areas of economic activities
for rural women. The National Sample Survey has shown that the percentage
contribution of women in agriculture is higher than men, where most of the key
operations at farm are done by them.
Navalawala B.N. (1995) stated in the article on ‗Water logging - Problems and
Solutions‘ that drainage is a measure to remove excess water from the soil or from the
soil surface. It is known that canal irrigation upon overuse often leads to rise of water
table and drainage is essential but even today adequate attentions is not being paid to
this while designing and planning of canal irrigation projects. Owing to this neglect,
many irrigation projects in the arid and semi-arid areas have created serious problems
of water logging and of salinity and alkalinity.
Rasis Ahmad (1998) in his article on ‗Water for Irrigation-An Overview‘ pointed
out that for raising productivity of agriculture one has to shift from traditional to
modernized and scientific system of farming for which regular supply of water for

107
irrigation is necessary. In India position is quite different as 2/3 farmers are small and
marginal farmers and most of them continuing traditional system of farming. 2/3
cultivable area is dependent on scanty rainfall and any change in the timing of
monsoon either before time or delayed and excess or less rainfall may cause extensive
damage to crops.
Roy L.B. et al. (1999) described in the title on ‗Farmers‘ Participation and the
hare irrigated project‘ that generally most farmers do not irrigate during night time
because of the fear from mosquitoes, snake bites, hyenas and other wild animals.
Sometimes as it is expected everywhere, some conflicts arise during irrigation period.
Some farmers used to illegally divert the water from the canal for continuous
irrigation. Then the other farmers will report this matter to the local water
committees. If a person is found guilty of such things, he will be charged up to 50
birrs as per the ‗local water law‘. All the farmers will pay revenue to the Government.
Nirmala et al. (2002) reported that the inadequacies of irrigation water at the time
of application of bio fertilizers and inability to plan in advance were the major
constraints in adoption of bio fertilizers. The other constraints like lack of
enforcement upon the technology, inability to remember the quantity and delayed
land preparation were reported by 34.16, 40.00 and 30.00 per cent of the respondents
respectively.
Narendra Kumar I. and Chandrasekar Rao G. (2007) have analyzed in the title on
‗Impact of Irrigation on Employment‘ on the basis of micro study that irrigation
reduces the risk and uncertainty inherent in the rain fed cropping. Irrigation has a
stabilizing impact on agriculture and generates farm employment through higher
levels of cropping intensity adoption of new agricultural strategy, growth of high
yielding crops and multiple cropping. Their study pertains to Kurnool district of
Andra Pradesh with the objective of Impact of Canal and Bore Wells irrigation
sources on the farm output and generation of employment relating to the crops like

108
paddy and cotton. They conclude that there is no significant difference between canal
and bore well irrigation within the human labour and bullock labour. The important
suggestions as follows: i) The main canals up to farm lands are to be lined cement can
be avoid leakage of water ii) Ground water potentiality will be increased by different
methods like check dams, watersheds and percolation tanks and iii) Micro irrigation
is encouraged at every village level, so that the previous water is to be saved.
Somashekaraiah N.T. and Mahendra Kumar S. (2008) in their article, an attempt
has been made to assess the impact of tube well irrigation on resource use efficiency
in agriculture with special reference to paddy cultivation in the study area.
2.5 Production problems, their causes and constraints
Anderson R.L. (1968) in their research article on ‗A Simulation Programme to Establish
Optimum Crop Pattern in Irrigated Farms Raised on Pre-Season Estimation of Water
Supply‘ has developed a simulation model to make the most efficient use of the predicted
water supply throughout the season for higher net returns. The Model determined the
optimum cropping pattern for each farm based on the individual farm water supply, crops
grown, minimum and maximum acreage of each crop and water requirement of each
crop.
Bandenhop M.P. and Cashdoller P.P. (1974) in the article on ‗Land Water Use
Potentials, Thungabhadara Irrigation Project‘ determined the most profit-mix-able crop
that could be grown on the soils in the Thungabhadra Irrigation project under the
alternative sets of land and water use regulations that might be adopted by project
officials. Linear programming techniques were used to ascertain the most profitable crop
combinations under twelve situations for each of the four selected representative farms.
A study conducted by the Evaluation Division of the State Planning Board
(1975) in a title on ‗Minor Irrigation in Kerala: An Evaluation Study‘ revealed that the
109
minor irrigation beneficiaries have very little awareness about the efficiency of water use.
The farmers were found to be under the notion that the more water they use, the better
would be the crop. It was noted that the cultivators seemed to ignore the use of irrigation
water for alternative crops either through ignorance or negligence. Left to themselves
they tended to grow only rice although its water requirement was much higher than that
of other crops.
William K. Easter and Lee R. Martin, (1977) viewed in the title on ‗Water
Resource Problems in Developing Countries‘ that the location of the villages from the
main canal happened to be the main factor influencing the cropped area and in turn the
cropping intensity.
Harrington et al (1990) Even when researchers are convinced that productivity, at
constant input levels, is declining over time, considerable further work may be needed to
pinpoint the reason behind this decline. Hypothesis may include (but need not be
restricted to) increasing scarcity of macro and micro nutrients; build up of pests and
diseases, build up of problem weeds, deterioration in soil physical or chemical structure
(including gradual salinization); reduced soil moisture holding capacity, soil loss through
erosion, etc.
2.5.1 Bio-physical constraints
Soil
Conceptually, the identification and quantification of constraints to higher yield may be
explained in several ways. One useful approach is to divide the problems into the ―what‖
or the physical constraints limiting yield and the ―why‖ or the socio-economic factors
responsible for maximum input uses. The bio-physical constraints include soil, water,
seed varieties, pest and diseases etc. With the proper choice of inputs and practices it
would be possible to increase the yield in farmer fields. The review of the literature
reveals the role of physical, biological and socio-economic constraints in attaining lower
yields.

110
Kotur et al. (1976) reported that the cauliflower crop suffers due to boron
deficiency (dead heart rot and hollow stem) in acidic soil of the plateau region of Bihar
especially during the rainy season. Application of boron significantly overcomes this
problem and improves yield.
Ghosh et al. (1994) reported that the boron requirement is high for the growth and
development of cole crops and its deficiency has been identified as a major problem
particularly in cauliflower growing areas of Jharkhand, causing heavy losses due to
browning of curds and hollowness of stem symptoms.
Singh et al. (1995) conducted field studies at Varanasi (U.P.) to find out the effect
of nitrogen and spacing on yield and quality attributes of brinjal. Results revealed that
application of 100 kg nitrogen per hectare produced the highest number of fruits and
yield of brinjal, while fruit weight, total soluble solids and ascorbic contents were highest
at 150 kg nitrogen per hectare. Minimum values of these characters were recorded in no
nitrogen plots. Plant transplanted at wider spacing (60 cm X 90 cm) resulted in the
highest number of fruits, fruit weight as well as ascorbic content. However, the yield was
highest at closer plant spacing (60 cm X 60 cm).
Prasad et al. (1997) reported the response of tomato to soil and foliar application
of boron in acidic red loam soil of Ranchi. They found that significant response of crop to
boron application. Among the methods tested foliar application of borax @ 2.5 Kg. /ha
gave the highest yield with net additional income.
G. K. Sujayanand et al. (2015) reported that the intercrops viz. brinjal, french
bean and marigold were responsible for reducing the shoot damage to the extent of 34.32
to 45.86 per cent as compared to sole crop of lady‘s finger which were comparable to
lady‘s finger treated with Carbofuran 3G suppressing 42.20 per cent shoot infestation.
Similarly these intercrops reduced the fruit damage to the extent of 28.10 to 37.50 per
111
cent over the untreated sole crop of lady‘s finger that remained comparable to that of okra
plants treated with Ethoprophos 10 G which lowers the fruit infestation up to28.92 per
cent.
Sangita Mehta, Birendra Prasad, Das, A. K. (2016) reported that lady‘s finger is
moderately tolerant to salinity. Soil salinity is a major a biotic stress that limits crop. Salt
injury affects germination and early seedling growth. The germination and vigor can be
improved by pre-sowing treatments with recommended chemicals and growth regulators.
2.5.2 Production problems
Singh, D.P. (1990) found the problems in horticulture development in tribal areas
of Bihar, i.e. non availability of genuine planting materials and quality seeds, lack of
technical knowhow, lack of coordination among teaching, research and extension
institutions, lack of availability of quality farm inputs, capital constraints, lack of
irrigation, lack of marketing facilities and lack of processing industries and cold storage
facilities.
Jain (1991) reported that bottleneck in the development of dry land horticultural
crops are limited availability of genuine planting materials, attack of pests and diseases
(particularly in vegetable crops), unavailability of agro-chemicals for plant protection,
stray cattle grazing, lack of initial care and management, lack of knowledge, zeal and
enthusiasm with the extension workers, lack of marketing, storage and processing
facilities.
2.5.3 Post-harvest scenario
Singh and Singh (1992) has been stated that the different fruits and vegetables
absorbs vibration and collapsed with each-other during road transportation, handling,
loading and unloading which caused mechanical damage.

112
Singh and Singh (1992) The transportation of perishables agricultural
commodities with the help of road transported vehicles hamper the quality of
commodities and basically caused the significant textural damages (higher in the case of
perishable commodities) due to the irregular and unsmooth roads..
Egharevba, (1995) Different fruits and vegetables treated as an important source
of vitamins, minerals and fiber due to the several nutritional benefits the consumption of
fruits and vegetables increased which also improve the commercialization of fruits and
vegetables.
Kantor et al. (1997) In the case of developed countries the range of losses was
observed 10-50%.
Lee et al., (2000), Different types of citrus fruits contains different amount of
vitamin C and minerals, which can be lost in high temperature storage.
Bachmann et al. (2000) Fruits and vegetables require good packaging, which can
prevent the physical and chemical damage.
Verma et al. (2004) reported that both the quantitative and qualitative losses of
extremely variable magnitudes occur at all stages in the post-harvest system from
harvesting, through handling, storage and marketing to final delivering to the consumer.
It is evident from the losses that the overall losses varied up to 20 per cent in vegetables,
viz., tomato, cabbage, cauliflower, and chilli. The maximum losses were observed at the
retailer level for tomato, cabbage and cauliflower whereas for chilli it was at wholesale
level. The more moisture content of tomato was responsible for maximum loss at storage
followed by cauliflower and cabbage. The losses caused by sorting and storage
operations were more in comparison to losses at transportation of produce.

113
Kader, (2005) Researchers have noticed that 20% fruits and vegetables wastage
estimated as a consumer and food service losses.
Anonymous, (2006) Due to unavailability of suitable harvesting equipment,
storage structure for storing the fruits and vegetables, hygienic packaging and appropriate
transportation facilities caused the major deterioration in fruits and vegetables.
Kishor et al (2006) revealed that inadequate storage and transportation facilities
coupled with bad weather conditions positively and significantly influenced the post-
harvest losses at the farm level. The establishment of small sized cold storage units in the
production centers would help in reducing the storage losses in vegetables. In this
direction the zero energy cool chamber technology was being found to beneficial
particularly for small and marginal farmers.
Sudheer et al. (2007) In the case of developing country like India, the postharvest
losses noticed close to 50% of the total fruits and vegetables production which badly
affects the availability of fruits and vegetables to the consumers.
Gupta et al. (2000) Postharvest losses depends upon the various significant factors
after harvesting till consumption that is why estimation of exact losses value is difficult
which required statistical methods for found out the accurate figure of postharvest losses,
first statistical survey based on successive sample technique was conducted in Uttar
Pradesh, India with the help of Indian Agricultural Statistics Research Institute. The
sampling design used in the survey was based on successive sampling technique.
Ilic et al. (2009) Reduction in the quality, storage duration and shelf life can be
minimized with the help of adequate storage, transportation and environment conditions.
Kitinoja et al. (2011). In Rwanda, Ghana, Benin and India, recent studies have
generated similar findings, with losses ranging from 30% to 80%.
114
Hodges et al. (2011) With the help of modern techniques and approaches,
developed countries have minimize the Post harvest losses up to some extent but due to
less mechanized methods, developing countries are still facing a big challenge.
Buzby and Hyman, (2012) Deterioration in the weight, volume considered under
the quantitative and losses of nutrient value, color, texture defined as the qualitative
losses.
Sharma et al (2013) The microbial effect plays a vital role in spoilage of fruits and
vegetables due to some extensive heat or cold resistance micro-organism the processed or
canned product also can be damage.
Bhosale, (2013) After China, India is the world largest producer of total fruits and
vegetables in the entire world but due to unavailability of appropriate cold storage,
refrigerated transportation facilities, the fruits and vegetables of Rs. 13300 crores spoiled
every year.
Wasala et al. (2014) Practices of postharvest technologies can reduce the
quantitative and qualitative losses of fresh fruits and vegetables and also maintained the
product quality up to final consumption. Attaining the hygienic agricultural produce
should be focused on the varieties of higher postharvest longevity.
Yumbya et al. (2014) Shelf life of any product also enhanced with the help of
modified atmospheric packaging by controlling the oxygen‘s and carbon-dioxide levels
within the packaged products.

115
2.5.4 Socio-economic constraints
Singh (1968) reported that there was no significant variation in the extent of
adoption of high yielding varieties due to difference in socioeconomic status of farmers.
Basran and Capener (1968) found that lack of money was perceived by non-
adopters as an important barrier for not making use of chemical fertilizers and other
social and psychological variables were also equally important.
Padheria (1973) reported that important factors responsible for resistance for
improved farm practices were irregular rainfall, lack of irrigation facilities, lack of
finance, high cost of inputs, lack of knowledge about important farm practices, lack of
technical help and guidance, lack of timely supply of inputs in different quantity and non-
availability of timely labor.
Behra and Sahoo (1975) reported that the main reasons for non adoption or partial
adoption of recommended package of practices were lack 30 of finance, lack of irrigation,
unsuitability of land, non availability of inputs in time and lack of technical know-how.
Kassar and Patil (1978) observed that the rural poor did not get the credit facility
in an efficient manner. Large population of the rural India had not been able to grab the
advantages offered by the credit institutions. The study revealed that only 40 per cent of
the total rural credit needs were disbursed through recognized institutions. The rest 60 per
cent depends on unrecognized and unscrupulous moneylenders. The plight of tribal‘s in
remote areas was observed to be pitiable due to lack of credit facilities.
Bhagat et al. (1985) emphasized the need of irrigation facilities and credit for
adoption of new technology by the tribal farmers. He put forth that possession of land
itself may not lead to adoption of new technology.

116
Bhople et al. (2002) reported that the important constraints faced by the vegetable
growers in adoption of bio-fertilizers were: scanty supply of bio-fertilizers and lack of
knowledge about quantity and method of use of sticking agents during seed inoculation.
Dudhate et al. (2003) reported socio-economic factors as the major constraints in
adoption of brinjal production technology. This was followed by technical and
institutional factors with little variation in merit assigned by farmers.
2.6 Association of socio-economic variables with knowledge, attitude and adoption
of improved technologies
In order to appreciate the difficulties involved in agriculture and especially in
horticultural development, it is essential to study the socioeconomic profile of farmers.
According to Jodha (1980) the features of resource poor and small farmers, who
practice mixed-farm operations have to be understood, together with their risk-
management strategies, which are required to cope with the adverse market and agro-
ecological environment.
Age
Patel and Modalia (1974) observed that young farmers were keen to adopt new
practices.
Modalia and Rajwadi (1976) reported that among the various age groups, the
average adoption percentage was maximum (77.35) among farmers up to 40 years of age.
For the remaining age groups 41 to 45 years, 46 to 60 years and above 60 years, the
average adoption was 60.57, 60 and 59.37 percent respectively.
Shrivastava et al. (2002) in Gujarat found that age was positively and significantly
related with adoption level of chilli growers.

117
Krishnamurthy et al. (2006) reported that middle-aged of people are more
enthusiastic, having risk bearing capacity, eager to learn and they are innovative in
nature. The findings are in line with the results of Hanumanaikir et al (2006).
Bodake H. D. et al. (2007) found non-significant relationship with awareness and
adoption levels of bio fertilizers in respect of age. Borude (1998) also reported non-
significant relationship between ages of the respondents.
Education
Rao and Raheja (1959) found that in general farmers having higher level of
education had adopted more improved practices. They further found that farmers having
middle school education had adopted more than those of high school education.
Saha (1973) reported that education affected adoption of agricultural innovations.
It was found that the adoption of innovations increased with the increase in education
level of farmers.
Patel and Modalia (1974) found that education was also positively correlated to
adoption.
Size of holding
Sahay (1960) found large farmers were pioneers in the introduction of improved
farm practices.
Rai (1965) also found that size of holding was positively related to the adoption
of improved practices.
Joon and Singh (1969) observed that all of the factors under study, the size of
holding was found to be positively and significantly associated with the adoption of high
yielding varieties.

118
Bhogle (1971) found that 47 per cent of adopters mentioned bigger land holding
as a reason for higher adoption.
Saha (1973) revealed that there was positive association between size of holding
and adoption of agricultural innovations.
Patel and Modalia (1974) reported that size of the holding and adoption was
positively and significantly correlated.
Singh and Choubey (1975) concluded that a strong positive correlation existed
between the operational farm size and adoption of high yielding varieties of wheat.
Modalia and Rajwadi (1976) reported that with the increase in size of holding,
there was positive increase in adoption.
Deogare (1997) using linear programming technique suggested that there was
under utilization of resources (land and man power) under existing cropping pattern and,
therefore, recommended technology and adequate finance-based farm planning was
necessary for the best utilization of the existing farm resources available with farmers. A
liberal credit policy was also essential for increasing the income and employment on farm
in the rural areas. By adopting the recommended level of technology, the income can be
substantially increased.
Attitude
Bhople et al. (2002) reported that majority of the farmers (83.33%) were found to
be neutral in their feeling about bio fertilizers. Nearly one-fourth of the farmers (24.67%)
were found to be favorably disposed towards bio fertilizers. Only 12% farmers were
observed to be unfavorable in their reaction about bio fertilizers. The farmers in general
were thus neutral in their feelings towards bio fertilizers. It might be due to lack of

119
detailed knowledge about bio fertilizers. The persuasion through regular guidance,
training and demonstrations seem to be essential.
2.7 Adoption behavior of farmers with respect to recommended technologies for
production of major vegetables
Rai (1965) pointed out that less preference of laborers, difficulty in procuring seed,
and high cost of seeds and failure of crops were the reason for non applicability.
Choudhary et al. (1999) made an attempt to ascertain the extent of adoption of
fertilizers between contact and non-contact farmers in Ranchi, West Champaran and
Patna districts representing the three different agro climatic regions of the state. The
findings revealed that contact farmers were far ahead in making use of plant nutrients (N,
P, K) in comparison to noncontact farmers. The study suggested the need to utilize the
contact farmers as change agents for transforming the state agriculture scenario.
Shrivastava et al. (2002) reported about the knowledge and extent of adoption of
S-49 chilli variety by the farmers of Kheda District in Gujarat. Constraints experienced
by the chilli growers in adoption of recommended S-49 chilli cultivation technology were
high price of chemical fertilizers, insecticides and pesticides, incidence of pests and
diseases, lack of technical guidance from VLW, adverse climate, and lack of knowledge
about technology. Poor economic conditions of the farmers, non-availability of plant
protection appliances, unavailability of sufficient timely credit and labor at the time of
picking, non-availability of seed of S-49 chilli variety in time, improper market facilities
and non-availability of fertilizers and pesticides locally.
Jahagirdhar A.K. and Sundaraswamy B. (2002) stated that lack of knowledge as
the main reason for non-adoption of practices like seed rate, spacing, application of FYM,
application of chemical fertilizers as basal dose and top dressing, nursery management
practices like type of seed bed and application of FYM and chemical fertilizers and plant
protection measures.
120
Meena and Babel (2003) reported that friends, neighbors, local leaders and
progressive farmers were frequently used among personal local sources of information by
the cabbage growers and among cosmopolites, VLWs and AAOs were mostly used by
both categories of farmers (peripheral and distant). Radio and farm literature were
frequently used 35 among impersonal cosmopolite sources of information and among
commercial agencies, seed merchant was most impressive on both categories of farmers.
Significant difference in utilization of source of information by both the categories of
farmers was also there.
Thygarajan and Prabhu (2005) reported that Tamil Nadu has increased the area
and production under tomato, but it did not reflect significantly on farmer‘s income level
and standard of life. Tomato cultivation is influenced by a number of factors and
constraints. The findings on the constraints experienced by the tomato growers were wide
price fluctuations, lack of adequate knowledge about modern technology, lack of
knowledge to identify pests and diseases, high cost of labor, inadequate water supply, non
availability of water supply, exploitation by middlemen by charging heavy rate of
commission, lack of adequate market facilities, and lack of storage facilities at village
level.
Malay K. Bhowmick et al. (2014) stated that lack of knowledge as the main
reason for non-adoption of practices like seed rate, spacing, application of FYM,
application of chemical fertilizers as basal dose and top dressing, nursery management
practices like type of seed bed and application of FYM and chemical fertilizers and plant
protection measures.

121
2.8 Characteristic of other agricultural products like milk
Mandeep Singh and Joshi.A.S. (2008) reported the economic analysis of dairy
farming has been reported for marginal and small farmers in Punjab for the year 2003-04.
It has been found that a majority of the farm households are not able to meet their
requirements from their income from crops. Further dairy farming has emerged as a
major allied enterprise for supplementing the income of marginal and small farmers in
Punjab. Income from off-farm sources has been identified another important factor
contributing significantly to the disposable income of these farm households. The study
has suggested to further exploit the potential of off-farm sources towards meeting the
domestic expenditure. Also, the technical efficiency of crops and dairy farming should be
improved to provide more income to farmers.
Islam. S., Goswami. A. and Mazumdar. D. (2008) have analyzed Tehatta-II block
of Nadia district in West Bengal. There were 17 blocks in the Nadia district of which
Tehatta-II block was selected purposely. The block consisted of 7 gram panchayats and 2
gram panchayats namely Palsunda-I and Barnia were selected randomly. Fifty dairy
farmers were selected from each gram panchayats based on judgment sampling. The
study area was more or less homogenous with respect to animal husbandry practices,
socio-cultural conditions, facilities for service and critical inputs. Most of the dairy
farmers in the study areas were unorganized in milk production. Relevant information
from the individual milk producers (dairy farmers) has been collected through personal
interrogation method with the help of a structured interview schedule prepared for the
study. The study revealed that crossbred cows were more economical and gave higher
yield than the indigenous cows and the inclusion of a few crossbred cows can increase
the income of a dairy entrepreneur and provide gainful and round the year employment.
Family labor work was carried out in the mill pocket areas of eight districts of
Marathwada region. About 59 percent of the dairy farmers belong to general (unreserved)
category, 25 percent were backward class and only 8 percent each of SC and ST. The
landless dairymen equally contributed with dairymen having (large) land; 13 landless
dairymen reported comparable lactation yield as the number of milch animals increased,

122
the herd lactation performance decreased. The animals maintained by joint family were
not properly cared for while they were cared for properly by singly family.
Dhanabalan. M. (2009) opined that dairy has an important role in improving the
overall economic conditions of rural India. To maintain the ecological balance, there is
need for sustainable and balanced development of agriculture and allied sectors. From
our first plan onwards, planners have given priority to allied sector for the economic
development of the rural sector. Dairy farming is described as a small industry which
provides gainful employment opportunities. It comprises of about six per cent of the
national income.
2.9 Research Gap
1. Local level management of the Vegetables foods Product and its storage is still
not there.
2. Farmers are yet not very aware of the storage system of the perishable product.
3. Local level wastage is extremely high, so prices are unstable and it is depend as a
seasonal and it is dependent on the season.
4. The vegetables are still not considered as a profitable farming, although the
scenario is changing very fast.
5. In Jharkhand the price of vegetables are unstable prices despite of good
production of different vegetables

123
CHAPTER 3
RESEARCH METHODOLOGY

124
RESEARCH METHODS AND TECHNIQUES
3.1 Overview
Research methodology is a systematic way to solve a problem. Essentially, the
procedures by which researchers go through in their work of describing, explaining and
predicting phenomena are called research methodology. It is also defined as the study of
methods by which knowledge is gained.
As indicated by Goddard and Melville (2004), responding to unanswered inquiries or
investigating which as of now not exist is an exploration. The Advanced Learner's
Dictionary of ebb and flow English sets out the significance of research as a cautious
examination or request, particularly through quest for new realities in any part of
information.
Redmen & Mory (2009), define research as a systematized effort to gain new knowledge.
Research strategy is the blend of the different strategies, plans and calculations utilized in
research. Every one of the strategies utilized by an analyst during an examination study
are alluded as research techniques. They are basically arranged, logical and esteem
nonpartisan. They incorporate hypothetical strategies, test thinks about, numerical plans,
factual methodologies, and so forth. Research techniques help us to gather tests,
information and after that discover an answer of the issue. Specifically, logical research
techniques call for clarifications dependent on gathered certainties, estimations and
perceptions and not on thinking alone. They acknowledge just those clarifications which
can be confirmed by examinations.
Determination and reception of a proper and orderly methodological methodology is
most significant for any logical examination as it includes the sharpness, knowledge,
exactness, unwavering quality, legitimacy and extraction to the exploration discoveries.
The strategies embraced for the examination ought to be clear, pretested and best fit. In
the present examination, every conceivable exertion was made to choose out such
methods keeping in view the objectivity and nature and degree of the investigation.
The present examination was taken up in Ranchi regions of Jharkhand. In perspective on
most noteworthy Volume of creation of the chose vegetables in this locale and because of
huge scale promoting action occurring in connection to these vegetables in Ranchi region

125
and in its bordering regions as they are enriched with moderately most noteworthy
territories under particular vegetable. The Vegetables included in the present study were
Cauliflower, Tomato, Cabbage, Brinjal, Bottle gourd, Tomato and Beans. The
investigation depends on both optional and essential information. The optional
information relating to the territory and generation of vegetables, and so forth were
gathered from different distributed and the unpublished records of the Birsa Agriculture
University, Government of Jharkhand. The essential data in regards to trimming
framework and promoting of chosen vegetables was gathered from the Farmers drawn
from territories like Thakurgoan, Choria, Chatwal, Boreya, Murma, Kanke of the locale
of Ranchi utilizing the multistage stratified arbitrary inspecting procedure.
In the past part the survey of writing identified with the issue was introduced. This part
manages the examination strategies and methods utilized in the present research. For
accommodation of the introduction of research strategies and methods embraced, the
present part has been isolated into the accompanying areas:
3.1 Overview
3.2 Statement of Problem
3.3 Objective of the Study
3.4 Pilot Study
3.5 Hypothesis
3.6 Research Design
3.7 Sampling Procedure
3.8 Data Collection & Statistical Analysis
3.2 Statement of Problem
In order to understand the price variation of vegetables it is necessary to know the
different factors that influence the price of vegetables. It is identified that the various
types of retailers that deals with vegetables in Ranchi market also play a vital role in
price variation. This study also focuses on the process of procurement or supply chain
mechanism of green vegetables by different retailers and its costs.

126
Since these products are perishable in nature, over production and short production cause
extreme price fluctuations are there and its effects consumer price of vegetables.
There is no minimum support price like policy from the government; farmers are affected
heavily due to any unfavorable and unpredicted situation. This also affects the consumer
price.
98% of vegetable Retail marketing is limited to unorganized sector, its effects the
consumer price stability. The Co-operative marketing policy is not present in this area, it
ultimately unstable the consumer price. Cooperative farming is not present in this area; it
increases the production price and affects the consumer price. The Adjoining territory of
Ranchi considered highest vegetable producing area of Jharkhand but still cold storage
facility is very negligible. It affects the price for the end consumer. Logistic &
Transportation facility are not so much advanced, which also affects the consumer price.
Vegetable processing industries are absent in these areas, it ultimately increase the price.
Banking and micro financing facilities are not up to the mark, it‘s ultimately effect the
consumer price. The Agricultural Insurance facility is not very much aware or applies by
the farmer, due to crop loss in natural calamity, ultimately increases the consumer price.
Direct selling to the consumer is nearly absent, middlemen are involved in the selling
process, and it‘s also increase the price for the consumer. Trained labour force is not
available in this area, it‘s ultimately effects the production of vegetables and increase the
consumer price. Composite farming is also not in practice, it‘s ultimately increase the
consumer price. Organic farming is not available or very negligible, it ultimately not
attracting quality and health conscious consumer to buy the crops at high prices.
Local level management of vegetables product and its storage is still not there.
Farmers are yet not very aware of the storage system of the vegetables product and also
the advanced techniques of cultivation.
Local level wastage is extremely high:, so prices are unstable and it is depend as a
seasonal. The vegetables are still not considered as a profitable farming:, although the
scenario is changing very fast. In Jharkhand most unstable prices are there despite of
good production of different vegetables.

127
Direct selling to the consumer is nearly absent, middlemen are involved in the selling
process, and it‘s also increase the price for the consumer. Trained labour force is not
available in this area, it‘s ultimately effects the production of vegetables and increase the
consumer price. Composite farming is also not in practice, it‘s ultimately increase the
consumer price. Organic farming is not available or very negligible, it ultimately not
attracting quality and health conscious consumer to buy the crops at high prices.
3.3 Objective of the Study
Research Objectives have advanced from research issue explanations, look into holes and
have been created for this exploration, after an inside and out investigation of the area
and survey of writing. In conclusion of the examination targets, due thought has been
taken to basically look the cost and the actual price variation of green vegetables.
The research study was taken up in Ranchi districts of Jharkhand. In view of highest
volume of production of the selected vegetables in this district and due to large scale
marketing activity taking place in relation to these vegetables in Ranchi district and in its
adjoining areas as they are endowed with relatively highest areas under respective
vegetable. The Vegetables included for the present study were Cauliflower, Tomato,
Cabbage, Brinjal, and Local Beans. For the study there are various objectives which are
needed to be analyzed for the final result so the research objectives have been developed
accordingly are as follows:
1. To identify the extent of price variation of concern vegetables across different
seasons with respect to farmers and organized retailers
2. To understand the major reasons or components of such price variation of concern
vegetables
3. To understand the price gaps between farmers selling price and organized retailers
selling price.

128
3.4 Pilot Study
In the period of pilot study the researcher want know about the variation in price of
vegetables and the existence of various intermediaries.
3.4.1 Purpose of the pilot Study
A small group of farmer‘s i.e. 30 farmers were considered for the pilot study. The
research work was conducted to know about the existence of price variation form farmers
to consumer through organized retailers in different area of Ranchi area and its adjoining
area. The survey was conducted in order to evaluate and know about the production cost
and the profit margin of farmers and the price in which the organized retailers like
Reliance and Big Bazaar are selling, So that actual price came into the picture and finally
how much price the retailer pays to the farmer and then with what price they sell to the
end users.
3.4.2 Methodology of the pilot study
The study is based on both secondary and primary data. The secondary data were
collected from various published and unpublished records of the Birsa Agriculture
University, Government of Jharkhand., Krishi Bhawan Kanke, Information Technology
of Birsa Agriculture University. The primary information regarding the cropping system
was collected from the farmers from the areas like Mandar, Thakurgoan, Chatwal,
Choria, Itki, Kanke, Murma of the district of Ranchi using the multistage simple random
sampling technique.
3.4.3 Data Collection Process
The research data were collected by interviewing the farmers and retailers personally by
the investigator with the help of the standardized interview schedule. Apart from
observation and some selected Participatory Rural Appraisal (PRA) tools and techniques
were also employed during data collection.
To collect the data simple random sampling method is used from the farmers of Ranchi
and its adjoining areas and organized retailers from Ranchi. Since the survey is confined

129
to those farmers who four acres of land or more than that for their cultivations. Thus, the
number of respondent is very limited in the area. Thus, small farmers were not considered
since they do not cultivate so much or do not have the relationship with the retailers, they
only produce and sell to the villages.
STAGE 1: Visit to the different area of Ranchi city like Brambe, Mandar, Chanho, Bero
and Pithoria know about the total presence of farmers. Then the researcher took 30
farmers data as a sample size for the farmer side. The second side was known since it is
regarding the organized retail stores in Ranchi which are in limited numbers.
STAGE 2: The next stage was to interact with the farmers and take their valuable
feedback on the questionnaire regarding the production of vegetables, which kind of land
they use for the cultivation, the total area of cultivation of different vegetables, the
seasons variety of vegetables, the cost of production of these vegetables, the post harvest
losses if any, who fixes the prices of these vegetables, major constraints regarding the
marketing and production of these vegetables.
On the second hand of the stage-2, the organized retailer were interviewed regarding the
processing of these vegetables, purchasing and selling of these vegetables, cost of
transportation, packaging, merchandising, reprocessing, or any other cost. Other than the
cost they are also interviewed regarding the storage facilities and availability of
distributors/intermediaries in this business.
STAGE 3: Analysis for the pilot study was done on the basis of the questionnaire and the
suggestions made by the farmers and retailers.
On further analyzing the researcher found that this research named ―Price Variation of
Vegetables in Different Seasons with Reference to Organized Retailers‖ was really the
worthwhile to understand the pricing mechanism from farmers to organized retail chain
and from organized retail chain to the end user.
The data were collected by interviewing the respondents personally by the investigator
with the help of the standardized interview schedule. Apart from observation and some
selected Participatory Rural Appraisal (PRA) tools and techniques were also employed
during data collection.
130
Primary and Secondary data was carried out for the research.
Primary data:
Data was collected directly from farmers and retailers through a survey (Questionnaire)
i.e. designed for this research along with a personal interview wherever possible from
both farmers‘ ends and organized retailer ends.
Secondary Data: Data was collected from the following sources;
1. Birsa Agriculture University Government of Jharkhand
2. Krishi Bhawan, Kanke
3. Information Technology of Birsa Agriculture University.
4. News papers
5. Magazines
6. Journals using services like( SCM and Articles on Vegetables)
7. Internet sites ( Google, Proquest and Abscohost services)
8. Books (Library, SCM books section etc.)
3.4.3.1 Administering the Questionnaire
For the primary survey the respondents were contacted and the structured questionnaires
were given to the farmers or at various points with both individual and group discussion.
At the retail end the questionnaire was put up to the retail store manager, merchandising
manager and warehouse manager.
3.4.3.2 Sampling
A simple random sampling method was used. In using this method each element in the
population has a known and equal probability of being the sample actually selected. The
selection of the sample is free from personal bias because the investigator does not
exercise any discretion or preference in the choice of items. For the farmers the self –
completed individual questionnaire method was selected where the questionnaire was
personally handed 139 and collected after completion. This method helped the
respondents to clarify the doubts with the researcher.

131
The respondents were randomly selected and asked to fill the questionnaire on request.
The respondent who gave willingness to participate typically gave better response. The
respondent who did not fill the form correctly and completely their forms were rejected.
The researcher took all the care that no respondent were repeated. (Sample size -139
respondents), only those respondents (farmers) we considered who have four acres of
land for the cultivation, small farmers were not considered since they do not cultivate so
much or do not have the relationship with the retailers, they only produce and sell to the
villages.
3.4.3.3 Sample Locations
Sample locations are different area of Ranchi city like Brambe, Mandar, Chanho, Bero
and Pithoria, since these areas have those farmers who have around four acres of land and
cultivate the selected vegetables throughout the year.
3.4.4 Result and Discussion
Table 3.1 The price variation of selected vegetables
Vegetables
Cost from the farmers Side
Farmers
Selling
Price
in
Rs./Kg
Consumer
Price in
Rs./Kg
Price
variation
of
vegetables
in Rs./Kg Pro
duct
ion c
ost
in R
s./K
g
Tra
nsp
ort
atio
n
cost
in R
s./K
g
Pac
kag
ing c
ost
in R
s./K
g
Tota
l C
ost
in
Rs.
/Kg
Cauliflower 12.87 3.12 0 16.00 18.00 30.00 12.00
Cabbage 10.62 3.12 0 13.75 16.00 23.00 7.00
Beans 8.62 3.12 0.27 12.02 18.00 62.00 44.00
Bottle
gourd 9.87 3.12 1.00 14.00 16.50 45.00 28.50
Tomato 15.05 3.12 2.50 20.67 25.00 80.00 55.00
Brinjal 9.37 3.12 0.15 12.65 15.00 55.00 40.00
Source: Primary Data
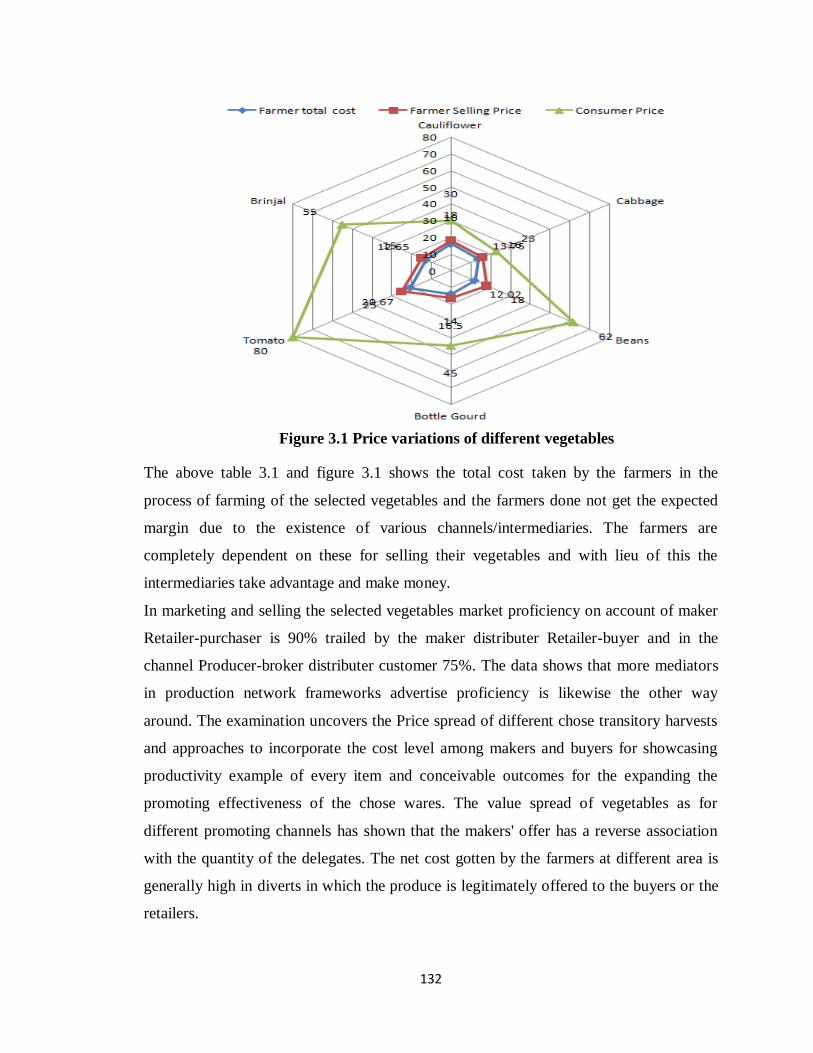
132
Figure 3.1 Price variations of different vegetables
The above table 3.1 and figure 3.1 shows the total cost taken by the farmers in the
process of farming of the selected vegetables and the farmers done not get the expected
margin due to the existence of various channels/intermediaries. The farmers are
completely dependent on these for selling their vegetables and with lieu of this the
intermediaries take advantage and make money.
In marketing and selling the selected vegetables market proficiency on account of maker
Retailer-purchaser is 90% trailed by the maker distributer Retailer-buyer and in the
channel Producer-broker distributer customer 75%. The data shows that more mediators
in production network frameworks advertise proficiency is likewise the other way
around. The examination uncovers the Price spread of different chose transitory harvests
and approaches to incorporate the cost level among makers and buyers for showcasing
productivity example of every item and conceivable outcomes for the expanding the
promoting effectiveness of the chose wares. The value spread of vegetables as for
different promoting channels has shown that the makers' offer has a reverse association
with the quantity of the delegates. The net cost gotten by the farmers at different area is
generally high in diverts in which the produce is legitimately offered to the buyers or the
retailers.
133
Conclusions of Pilot Study
Marketing of vegetables is a complex phenomenon because of their transient nature,
regularity and massiveness. It is additionally intensified by the way that Farmers have
little regions under their development and little attractive amount. The generation and
post-reap misfortunes are higher and in that capacity vegetables require a created
promoting framework for their snappy transfer. It has additionally been seen that as the
quantity of mediators' builds, the maker's offer in buyer's value diminishes. The net cost
received by the creators is higher in the process where they sell the produce honestly to
the purchasers or retailers. The producers have been found to get higher incomparable net
returns in tomato, trailed by Cauliflower, cabbage, brinjal, and neighborhood bean in all
of the channels.
3.5 Hypotheses
In order to achieve the desired result, a hypotheses have been formulated, which will be
tested and conclusions will be drawn on the basis of the test results. The hypotheses are
mentioned below:
H1: There is a variation in average productivity of vegetables at different seasons.
H1a: There is a variation in average productivity of Cauliflower at different seasons.
H1b: There is a variation in average productivity of Cabbage at different seasons.
H1c: There is a variation in average productivity of Beans at different seasons.
H1d: There is a variation in average productivity of Bottle Gourd at different seasons.
H1e: There is a variation in average productivity of Tomato at different seasons.
H1f: There is a variation in average productivity of Brinjal at different seasons.
H2: There is a variation in average production cost of vegetables at different
seasons.
H2a: There is a variation in average production cost of Cauliflower at different seasons.
H2b: There is a variation in average production cost of Cabbage at different seasons.
H2c: There is a variation in average production cost of Beans at different seasons.
H2d: There is a variation in average production cost of Bottle Gourd at different seasons.
H2e: There is a variation in average production cost of Tomato at different seasons.

134
H2f: There is a variation in average production cost of Brinjal at different seasons.
H3: There is a variation in average transportation cost of vegetables at different
seasons.
H3a: There is a variation in average transportation cost of Cauliflower at different seasons.
H3b: There is a variation in average transportation cost of Cabbage at different seasons.
H3c: There is a variation in average transportation cost of Beans at different seasons.
H3d: There is a variation in average transportation cost of Bottle Gourd at different
seasons.
H3e: There is a variation in average transportation cost of Tomato at different seasons.
H3f: There is a variation in average transportation cost of Brinjal at different seasons.
H4: There is a variation in average packaging cost of vegetables at different seasons.
H4a: There is a variation in average packaging cost of Cauliflower at different seasons.
H4b: There is a variation in average packaging cost of Cabbage at different seasons.
H4c: There is a variation in average packaging cost of Beans at different seasons.
H4d: There is a variation in average packaging cost of Bottle Gourd at different seasons.

135
3.6 Research Design
Identification of the Research
Problem through Literature Survey
Identifying the topic for Research
Developing the Objectives & Scope of
the Research
Developing Hypotheses
Designing Methodology
Conducting Pilot Study
Standardizing Questionnaire for Final Research
Extended literature Survey for preparing the Questionnaire. Two
sets of Questionnaire were prepared
Conducting Final Study
Tabulating, Editing and Analyzing Data
Existing Literature have been studied
to identify the research problem.
Finalisation of the thesis
Scope:
The study considers the consumers‘
price variations of major vegetables
such as Cauliflower, Brinjal, Cabbage
etc at Ranchi and its adjoining areas.
The study attempts to understand the
dynamics of organized sectors
(Reliance Fresh and Big Bazaar). It also
attempts to understand the supply chain
management of the whole process.
Objectives:
1. To identify the extent of price
variation of concern vegetables
across different seasons with
respect to farmers and organized
retailers
2. To understand the major reasons or
components of such price variation
of concern vegetables
3. To understand the price gaps
between farmers selling price and
organized retailers selling price.
Hypotheses: Hypotheses are developed in such a
way through which the researcher can
get the exact variation of price of
vegetables and price gap thus the
hypotheses were identified and tested
with Analysis of Variance with One
Way Anova.

136
3.7 Sampling Procedure
The total population were not confined because there are not much farmers who have
more than four acres of land for the cultivation, thus comparing to the population size a
small group is extracted from the population, that group is called as Sample and each
member of a sample are called as participants.
The process of extracting a group of members of a population to make a sample is called
as Sampling. Generally, sampling is done because the size of the population is quite big
and it becomes a tough job to study a population size.
Since the study was targeted to study the price variation of the major vegetables as well
as the production problems of major vegetables, two categories of respondents are taken
care i.e. respondents belonging to farming and the organized retailer like Reliance Fresh
and Big Bazaar constituted the sample. Selection of major vegetables was done with
regard to the area, production and productivity of selected vegetables which were grown
in the state vis-à-vis the district and block. A random list was prepared for the vegetable
growers from each block. Thus, the whole sample constituted of 139 respondents form
the vegetables grower and the two from organized retailer. The sample size is 139
because the farmers having four acres of land and more than that are considered as my
sample.
For the study precision rate of 5% and Confidence level of 95% was considered. For
sample:
z2.p.q.N
n = _____________________________
e2. (N - 1) + z
2.p.q
Where,
Sample size is n, population size is N, Z is standard variate at given confidence level , e is
error and p is sample proportion
A simple random sampling technique was used. In using this technique each group in the
mass has a known and comparable probability of being the model truly picked. The
assurance of the model is free from the individual tendency in light of the fact that the
agent does not practice any prudence or inclination in the selection of things. For the

137
Farmers oneself – finished individual poll technique was chosen where the survey was by
and by given 139 and gathered after fulfillment. This technique helped the respondents to
explain the questions with the analyst.
The respondents were self-assertively picked and mentioned to fill the overview on
requesting. The respondent who offered the enthusiasm to take an intrigue routinely gave
a superior response. The respondent who did not fill the structure adequately and
absolutely their structures were rejected. The master took all the thought that no
respondent were reiterated. (Test measure - 139 respondents), only those respondents
(farmers) we considered who have four acres of land for the cultivation, small farmers
were not considered since they do not cultivate so much or do not have the relationship
with the retailers, they only produce and sell to the villages.
Table 3.2 Sampling Frame
Source: Primary Data

138
Table 3.3 Revised Sample Size
Source: Primary Data
.
139
CHAPTER 4
DATA ANALYSIS & INTERPRETATION
140
DATA ANALYSIS & INTERPRETATION
The current chapter deals with the various analysis through which it can be shown that
there is a variation in price of vegetables in different seasons from framers to consumers
through the existence of different intermediaries. The chapter includes the following
headings:
4.1 Overview
4.2 The Cost of Different Agricultural Inputs for the Selected Vegetables
4.3 Price Variation of Vegetables from Vegetables Grower with respect to
Organized Retail Stores
4.3.1 Price Variations of Concerned Vegetables across the Seasons
4.3.2 Price Variations of Concerned Vegetables in Particular Season
4.3.3 Price Variations of all Concerned Vegetables in Different Seasons
4.4 Anova for Average Productivity, Cost of Production, Cost of Transportation
and Cost of Packaging of Concerned Vegetables i.e. Cauliflower, Cabbage,
Beans, Bottle Gourd and Tomato at Different Seasons (Pre Monsoon, Monsoon
and Post Monsoon).
4.5 Major Factors which cause as a Trigger Factor in Price Sensitivity Mechanism
of concerned Vegetables
4.6 Efficient marketing system of vegetables
4.7 Different measures for improving supply chain and its effectiveness
4.1 Overview
After collection of all the data from the source, the data were systematically arranged and
tabulated for analysis and interpretation in a spread sheet. Since the price form the farmer
and retailer was found as a price gap and variations because there are fixed price from
both the side so, in order to test the significant differences between the seasons for
Average productivity, cost of production, cost of transportation and cost of packaging of
different vegetables i.e. Cauliflower, Cabbage, Beans, Bottle Gourd and Tomato at
different Seasons (Pre Monsoon, Monsoon and Post Monsoon), Analysis of Variance
with one way Anova was considered.
141
The study is conducted in the adjoining area of Ranchi city where the cultivation of the
selected vegetables is major cultivation and the vegetable grower produces around 10-15
tons in every season. The major area/block that has taken into consideration is
Thakurgoan, Choria, Chatwal, Boreya, Murma, and Kanke. Along with it the major giant
retailers like Big Bazaar and Reliance Fresh of Ranchi city is also taken into
consideration to know and find out the actual variation of these vegetables. There are
various factors in term of production and marketing that influence the price of these
vegetables. After the detailed study on my field data collection I had discussed the cost
regarding the seeds, labor, fertilizers, insecticide, irrigation, and season variability of
different vegetables at different seasons
On an average in all the cases in summer season maximum price load is bear by the
farmer during the production as compared to other seasons. There is major variation in
price of vegetables because of the following factors:
Existence of various intermediaries
Low literacy rate of farmers
Least government support regarding the processing and storage of vegetables.
Intervention Distribution transportation cost
In-season stock of Inventory
Unawareness of farmers
Processing Cost
Increased cost of transportation
Hoarding & Proper irrigation facilities
Increase in the demand for protein-enriched food and green vegetables
Supply chain mismanagement
Many mediators
Less production of vegetables
Less space for cultivation
Global inflation
Increased cost of production
Improper management and distribution

142
4.2 The cost of different agricultural inputs for the selected vegetables
There are various agricultural inputs which directly affect the price of the vegetables.
Figure 4.1 Vegetables seeds cost
The interpretation of the above figure 4.1 states the average cost of seeds in different
climatic condition or farming seasons (i.e. Pre Monsoon, Monsoon and Post
Monsoon).which was recorded at the time of the survey (data collection). The average
cost of seeds for cauliflower was Rs. 400, Rs. 360 and Rs. 380 in Post Monsoon, Pre
Monsoon and Monsoon. Similarly, The seed cost of Brinjal is Rs. 200, Rs. 190 and Rs.
195 in Post Monsoon, Pre Monsoon and Monsoon. The cost of seed for cabbage is Rs.
250, Rs. 225 and Rs. 228 in Post Monsoon, Pre Monsoon and Monsoon. The cost of seed
for Bottle Gourd is Rs. 30, Rs. 15 and Rs 22 in Post Monsoon, Pre Monsoon and
Monsoon. The seed cost of Beans is Rs. 10, Rs. 7 and Rs. 9 in Post Monsoon, Pre
Monsoon and Monsoon. The seed cost of Tomato is Rs. 30, Rs. 25 and Rs. 27 in Post
Monsoon, Pre Monsoon and Monsoon.
The interpretation form the above graph shows that the maximum average seed cost in all
the seasons i.e. Post Monsoon, Pre Monsoon and Monsoon are cauliflower and minimum
is for the beans and for the tomato respectively.

143
Figure 4.2 Cost of Labor
Presence or availability of the labor in different seasons is very important. This is an
important factor in the farming sector. The above graph 4.2 shows the cost of labor in
different seasons i.e. Post Monsoon, Pre Monsoon and Monsoon. The graph shows that
the cost of labor in Post Monsoon the labor charger around Rs. 42000, in Pre Monsoon
and Monsoon Rs. 40000. This shows the availability of labor in Post Monsoon is less due
to which the price rises and similarly in other seasons like Pre Monsoon and Monsoon the
availability is more due to which the price or cost gets lower down.
The cost of labor increases which directly effect in the price of the vegetables which
result in the hike in price of the vegetables form the farmer‘s side.
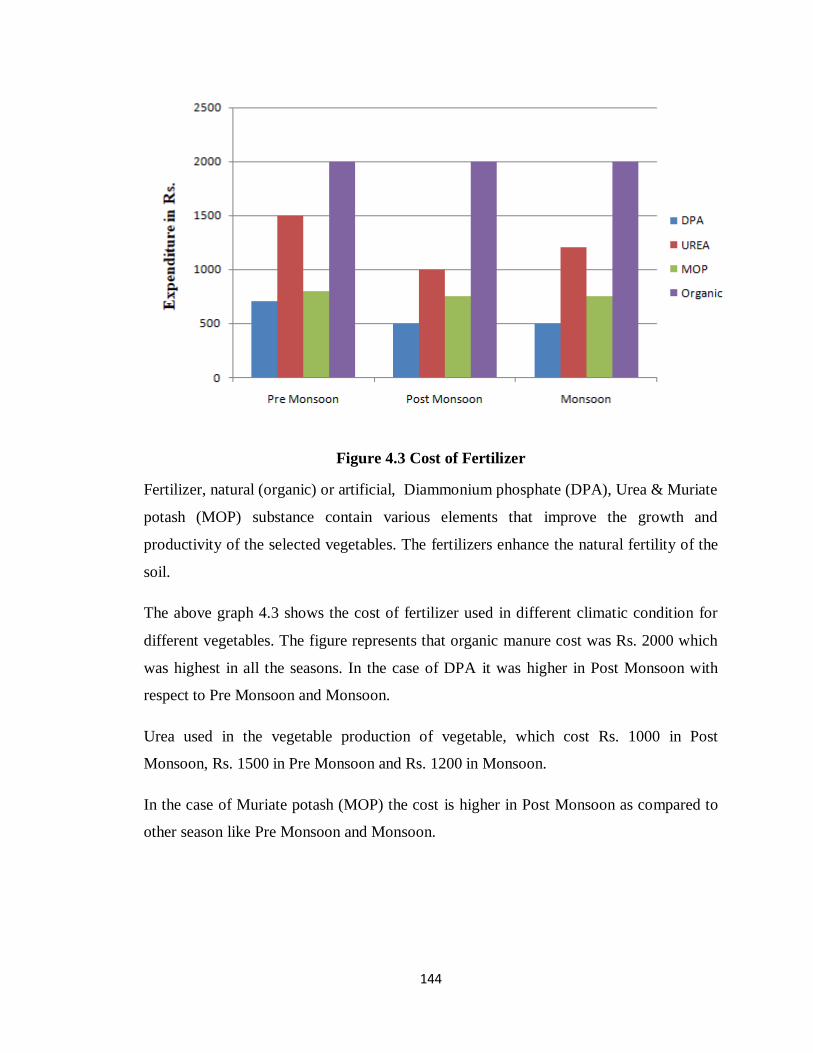
144
Figure 4.3 Cost of Fertilizer
Fertilizer, natural (organic) or artificial, Diammonium phosphate (DPA), Urea & Muriate
potash (MOP) substance contain various elements that improve the growth and
productivity of the selected vegetables. The fertilizers enhance the natural fertility of the
soil.
The above graph 4.3 shows the cost of fertilizer used in different climatic condition for
different vegetables. The figure represents that organic manure cost was Rs. 2000 which
was highest in all the seasons. In the case of DPA it was higher in Post Monsoon with
respect to Pre Monsoon and Monsoon.
Urea used in the vegetable production of vegetable, which cost Rs. 1000 in Post
Monsoon, Rs. 1500 in Pre Monsoon and Rs. 1200 in Monsoon.
In the case of Muriate potash (MOP) the cost is higher in Post Monsoon as compared to
other season like Pre Monsoon and Monsoon.
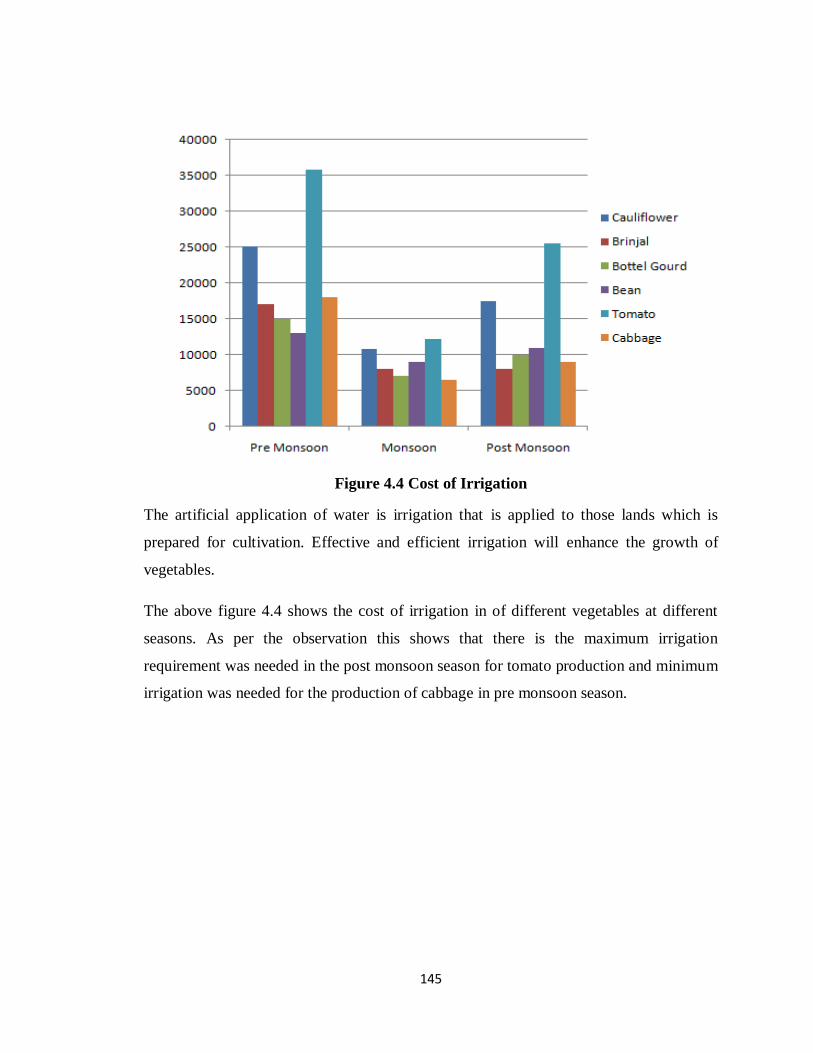
145
Figure 4.4 Cost of Irrigation
The artificial application of water is irrigation that is applied to those lands which is
prepared for cultivation. Effective and efficient irrigation will enhance the growth of
vegetables.
The above figure 4.4 shows the cost of irrigation in of different vegetables at different
seasons. As per the observation this shows that there is the maximum irrigation
requirement was needed in the post monsoon season for tomato production and minimum
irrigation was needed for the production of cabbage in pre monsoon season.

146
Figure 4.5 Cost of insecticide
Insecticides are the substance needed to kill insects. They include ovicides and larvicides
used against eggs and larva respectively. Insecticides are widely used in agricultural,
farming and gardening process. During the survey two different insecticides are observed
which are used during the cultivation process those are Powder and Liquid.
The above figure 4.5 represents the cost of insecticides used in different climatic
condition i.e. Pre Monsoon, Monsoon and Post Monsoon. The requirement of liquid
insecticide is very much higher in Pre Monsoon and Monsoon. Similarly the requirement
of power from insecticides is higher in Post Monsoon respectively.
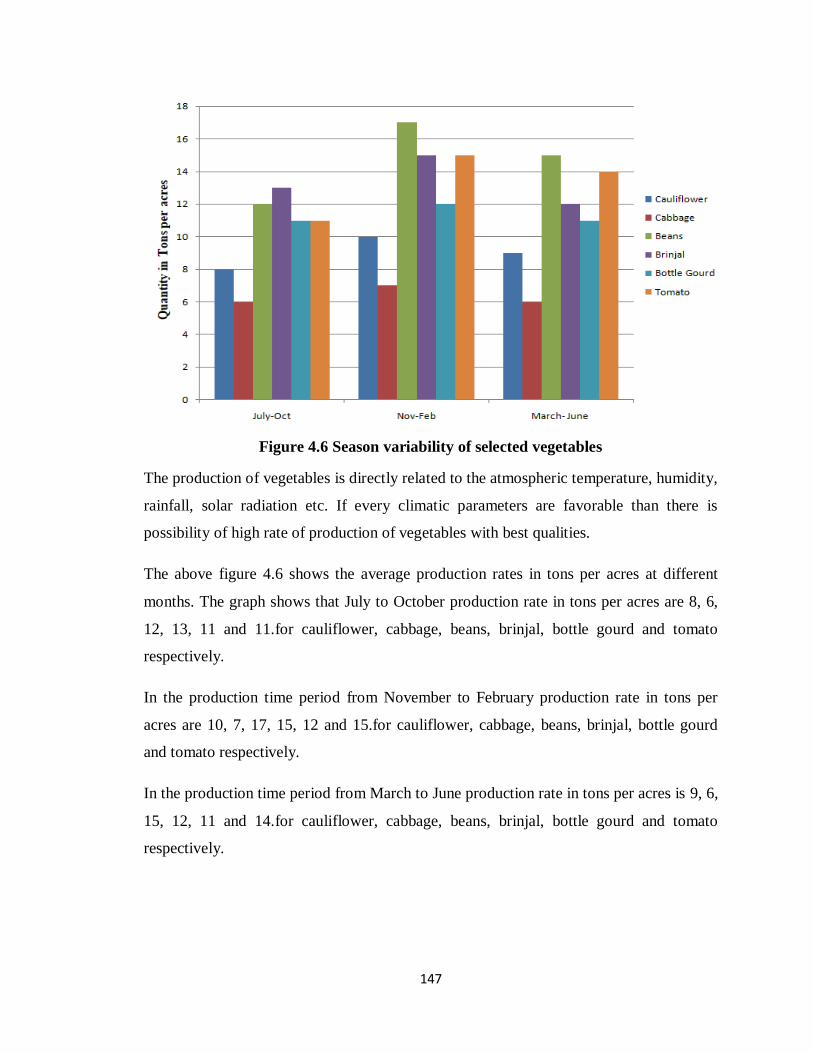
147
Figure 4.6 Season variability of selected vegetables
The production of vegetables is directly related to the atmospheric temperature, humidity,
rainfall, solar radiation etc. If every climatic parameters are favorable than there is
possibility of high rate of production of vegetables with best qualities.
The above figure 4.6 shows the average production rates in tons per acres at different
months. The graph shows that July to October production rate in tons per acres are 8, 6,
12, 13, 11 and 11.for cauliflower, cabbage, beans, brinjal, bottle gourd and tomato
respectively.
In the production time period from November to February production rate in tons per
acres are 10, 7, 17, 15, 12 and 15.for cauliflower, cabbage, beans, brinjal, bottle gourd
and tomato respectively.
In the production time period from March to June production rate in tons per acres is 9, 6,
15, 12, 11 and 14.for cauliflower, cabbage, beans, brinjal, bottle gourd and tomato
respectively.

148
Pre Monsoon Monsoon Post Monsoon
Figure 4.7 Average distribution of land during cultivation in different seasons
The distribution of land plays a wide role in lowering down the posiblity of risk through
which the loss can take place. Every farmer divides their land as per the requirement and
seasons. At every season they categorize the land in such a way so that they can earn
maximum. In Pre Monsoon the farmers give 33% of their land in forward trading, 7% to
the lessee and keeps 60% with them for the cultivation.
Similarly, in Monsoon seasons the farmers give 67% of their land for forward trading,
5% to the lessee and keeps 28% with them for the cultivation. During Post Monsoon the
farmers give 50% of their land in forward trading, 21% to the lessee and keeps 29% with
them for the cultivation.
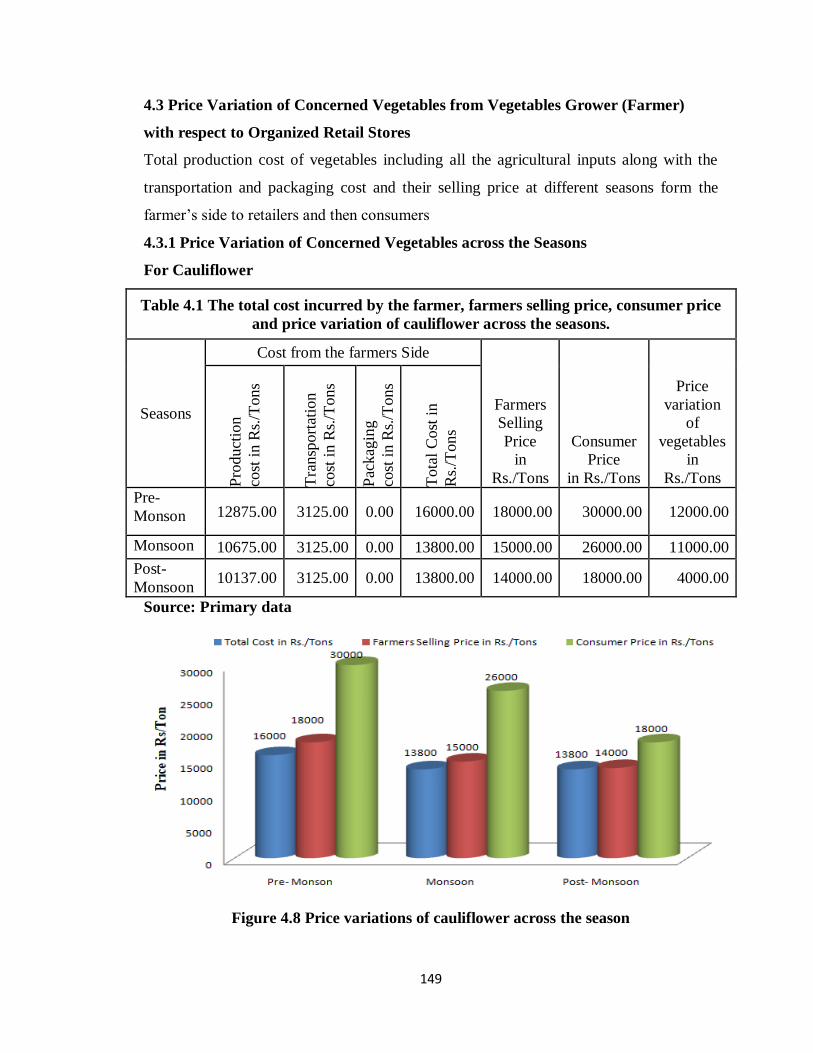
149
4.3 Price Variation of Concerned Vegetables from Vegetables Grower (Farmer)
with respect to Organized Retail Stores
Total production cost of vegetables including all the agricultural inputs along with the
transportation and packaging cost and their selling price at different seasons form the
farmer‘s side to retailers and then consumers
4.3.1 Price Variation of Concerned Vegetables across the Seasons
For Cauliflower
Table 4.1 The total cost incurred by the farmer, farmers selling price, consumer price
and price variation of cauliflower across the seasons.
Seasons
Cost from the farmers Side
Farmers
Selling
Price
in
Rs./Tons
Consumer
Price
in Rs./Tons
Price
variation
of
vegetables
in
Rs./Tons Pro
duct
ion
cost
in R
s./T
ons
Tra
nsp
ort
atio
n
cost
in R
s./T
ons
Pac
kag
ing
cost
in R
s./T
ons
Tota
l C
ost
in
Rs.
/Tons
Pre-
Monson 12875.00 3125.00 0.00 16000.00 18000.00 30000.00 12000.00
Monsoon 10675.00 3125.00 0.00 13800.00 15000.00 26000.00 11000.00
Post-
Monsoon 10137.00 3125.00 0.00 13800.00 14000.00 18000.00 4000.00
Source: Primary data
Figure 4.8 Price variations of cauliflower across the season

150
Interpretation – The table 4.1 and the figure 4.8 shows that the price variations of
cauliflower across the seasons. In pre-monsoon the production cost is high as compared
to the other seasons whereas, in monsoon and post-monsoon the cost of production is
near about the same and the farmers also not getting a satisfactory value for their
vegetables but there is a maximum difference in price to the consumer end. Cauliflower
along with Cabbage is the only vegetable that has no packaging cost and transportation.
Farmers get maximum profit while selling the cauliflower in pre-monsoon rather that the
other seasons.
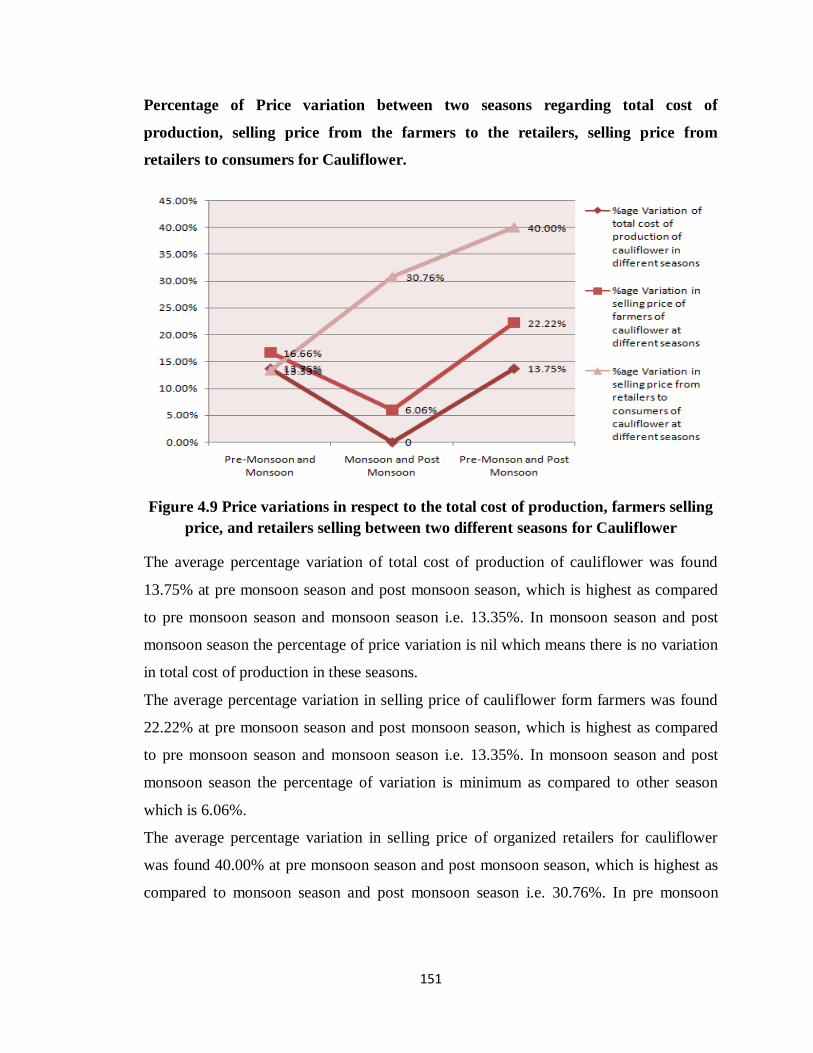
151
Percentage of Price variation between two seasons regarding total cost of
production, selling price from the farmers to the retailers, selling price from
retailers to consumers for Cauliflower.
Figure 4.9 Price variations in respect to the total cost of production, farmers selling
price, and retailers selling between two different seasons for Cauliflower
The average percentage variation of total cost of production of cauliflower was found
13.75% at pre monsoon season and post monsoon season, which is highest as compared
to pre monsoon season and monsoon season i.e. 13.35%. In monsoon season and post
monsoon season the percentage of price variation is nil which means there is no variation
in total cost of production in these seasons.
The average percentage variation in selling price of cauliflower form farmers was found
22.22% at pre monsoon season and post monsoon season, which is highest as compared
to pre monsoon season and monsoon season i.e. 13.35%. In monsoon season and post
monsoon season the percentage of variation is minimum as compared to other season
which is 6.06%.
The average percentage variation in selling price of organized retailers for cauliflower
was found 40.00% at pre monsoon season and post monsoon season, which is highest as
compared to monsoon season and post monsoon season i.e. 30.76%. In pre monsoon
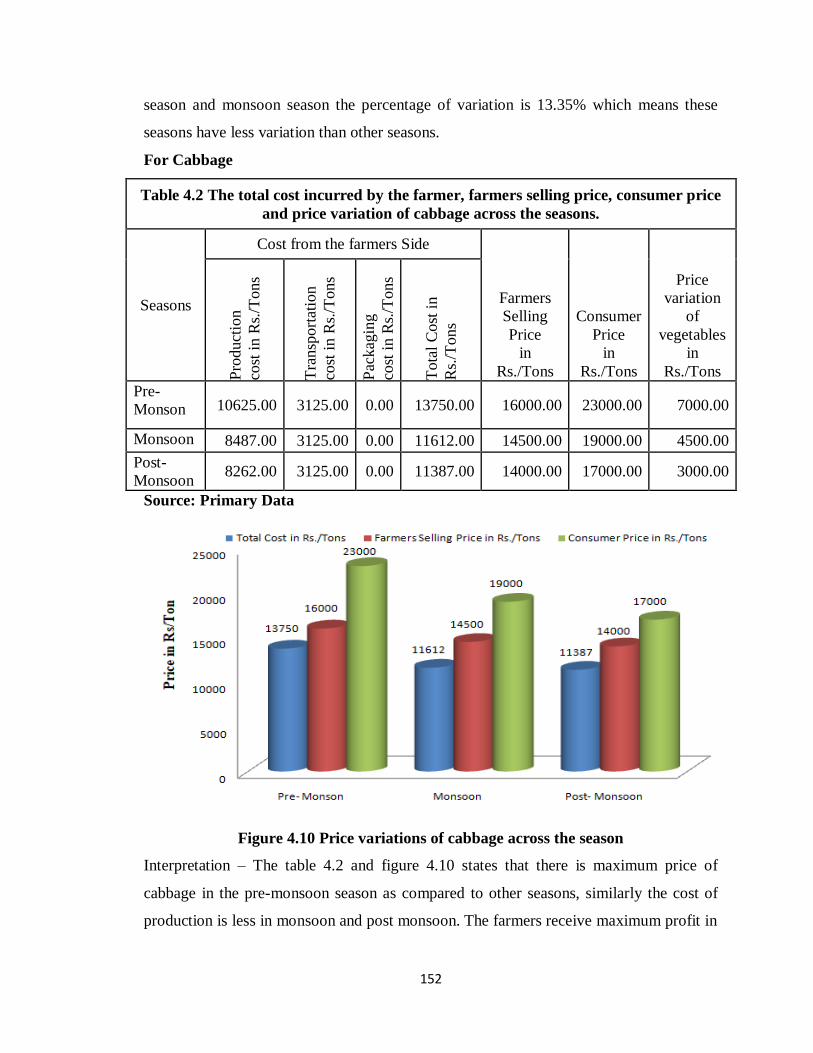
152
season and monsoon season the percentage of variation is 13.35% which means these
seasons have less variation than other seasons.
For Cabbage
Table 4.2 The total cost incurred by the farmer, farmers selling price, consumer price
and price variation of cabbage across the seasons.
Seasons
Cost from the farmers Side
Farmers
Selling
Price
in
Rs./Tons
Consumer
Price
in
Rs./Tons
Price
variation
of
vegetables
in
Rs./Tons Pro
duct
ion
cost
in R
s./T
ons
Tra
nsp
ort
atio
n
cost
in R
s./T
ons
Pac
kag
ing
cost
in R
s./T
ons
Tota
l C
ost
in
Rs.
/Tons
Pre-
Monson 10625.00 3125.00 0.00 13750.00 16000.00 23000.00 7000.00
Monsoon 8487.00 3125.00 0.00 11612.00 14500.00 19000.00 4500.00
Post-
Monsoon 8262.00 3125.00 0.00 11387.00 14000.00 17000.00 3000.00
Source: Primary Data
Figure 4.10 Price variations of cabbage across the season
Interpretation – The table 4.2 and figure 4.10 states that there is maximum price of
cabbage in the pre-monsoon season as compared to other seasons, similarly the cost of
production is less in monsoon and post monsoon. The farmers receive maximum profit in
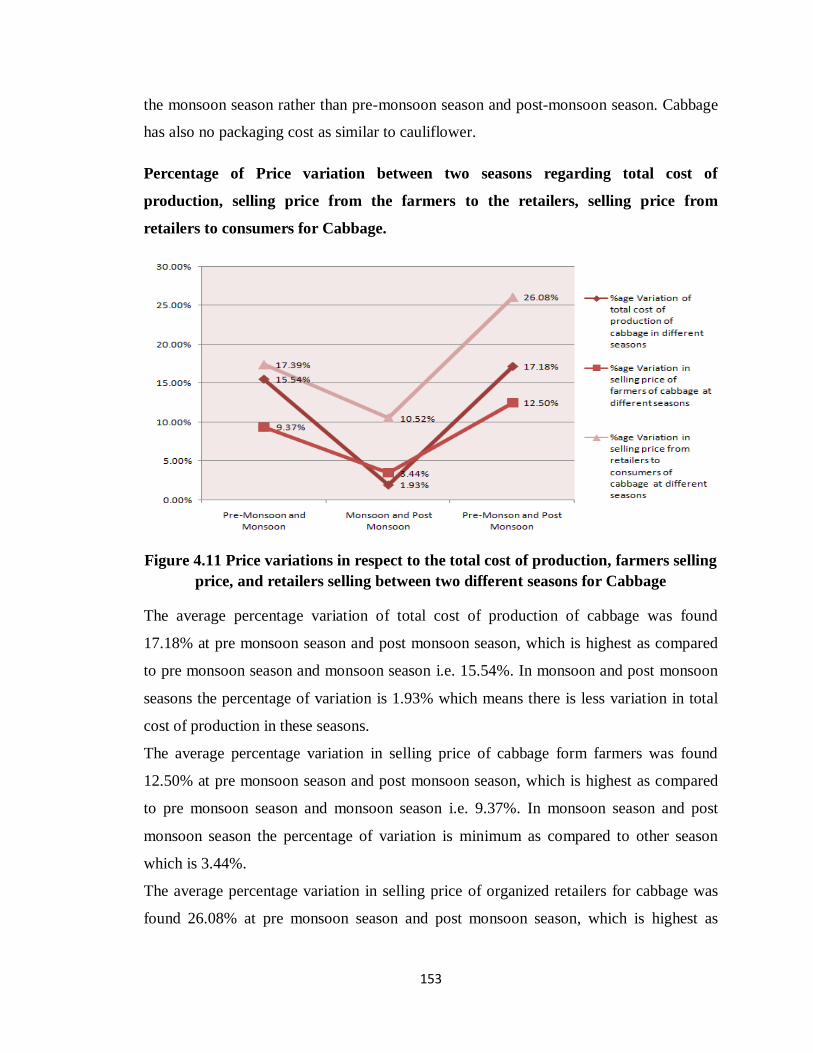
153
the monsoon season rather than pre-monsoon season and post-monsoon season. Cabbage
has also no packaging cost as similar to cauliflower.
Percentage of Price variation between two seasons regarding total cost of
production, selling price from the farmers to the retailers, selling price from
retailers to consumers for Cabbage.
Figure 4.11 Price variations in respect to the total cost of production, farmers selling
price, and retailers selling between two different seasons for Cabbage
The average percentage variation of total cost of production of cabbage was found
17.18% at pre monsoon season and post monsoon season, which is highest as compared
to pre monsoon season and monsoon season i.e. 15.54%. In monsoon and post monsoon
seasons the percentage of variation is 1.93% which means there is less variation in total
cost of production in these seasons.
The average percentage variation in selling price of cabbage form farmers was found
12.50% at pre monsoon season and post monsoon season, which is highest as compared
to pre monsoon season and monsoon season i.e. 9.37%. In monsoon season and post
monsoon season the percentage of variation is minimum as compared to other season
which is 3.44%.
The average percentage variation in selling price of organized retailers for cabbage was
found 26.08% at pre monsoon season and post monsoon season, which is highest as

154
compared to pre monsoon season and monsoon season i.e. 17.39%. In monsoon season
and post monsoon season the percentage of variation is 10.52% which means these
seasons have less variation than other seasons.
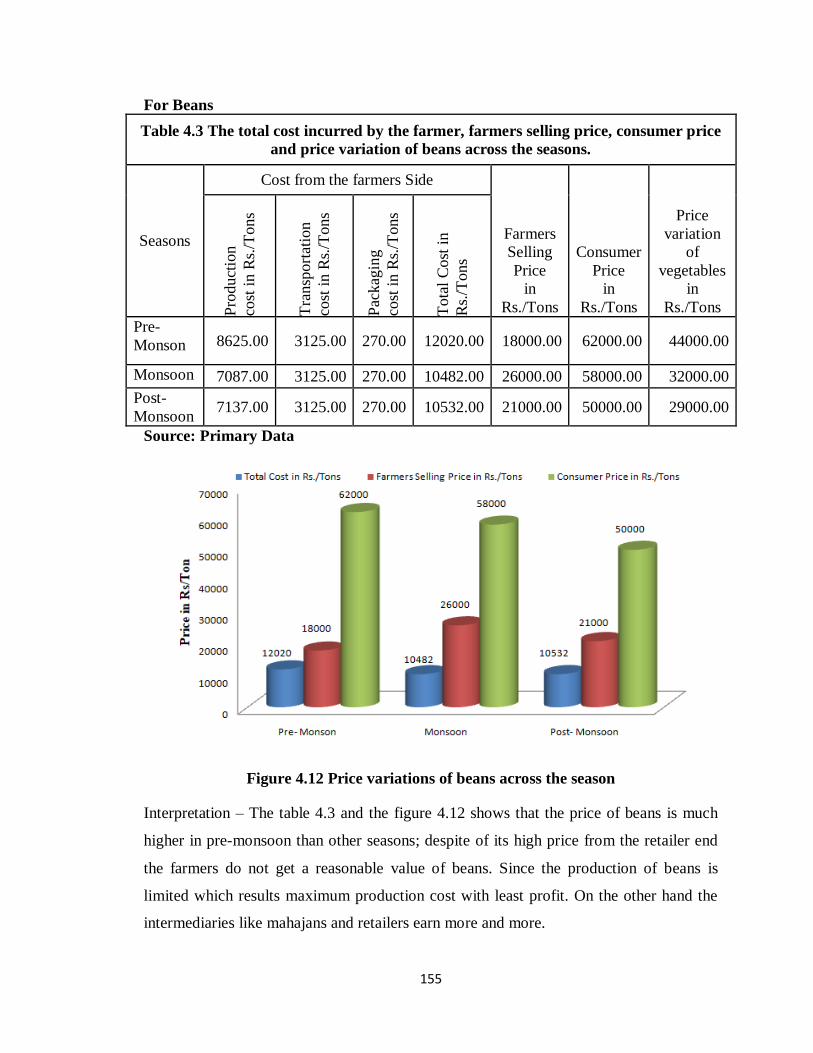
155
For Beans
Table 4.3 The total cost incurred by the farmer, farmers selling price, consumer price
and price variation of beans across the seasons.
Seasons
Cost from the farmers Side
Farmers
Selling
Price
in
Rs./Tons
Consumer
Price
in
Rs./Tons
Price
variation
of
vegetables
in
Rs./Tons Pro
duct
ion
cost
in R
s./T
ons
Tra
nsp
ort
atio
n
cost
in R
s./T
ons
Pac
kag
ing
cost
in R
s./T
ons
Tota
l C
ost
in
Rs.
/Tons
Pre-
Monson 8625.00 3125.00 270.00 12020.00 18000.00 62000.00 44000.00
Monsoon 7087.00 3125.00 270.00 10482.00 26000.00 58000.00 32000.00
Post-
Monsoon 7137.00 3125.00 270.00 10532.00 21000.00 50000.00 29000.00
Source: Primary Data
Figure 4.12 Price variations of beans across the season
Interpretation – The table 4.3 and the figure 4.12 shows that the price of beans is much
higher in pre-monsoon than other seasons; despite of its high price from the retailer end
the farmers do not get a reasonable value of beans. Since the production of beans is
limited which results maximum production cost with least profit. On the other hand the
intermediaries like mahajans and retailers earn more and more.
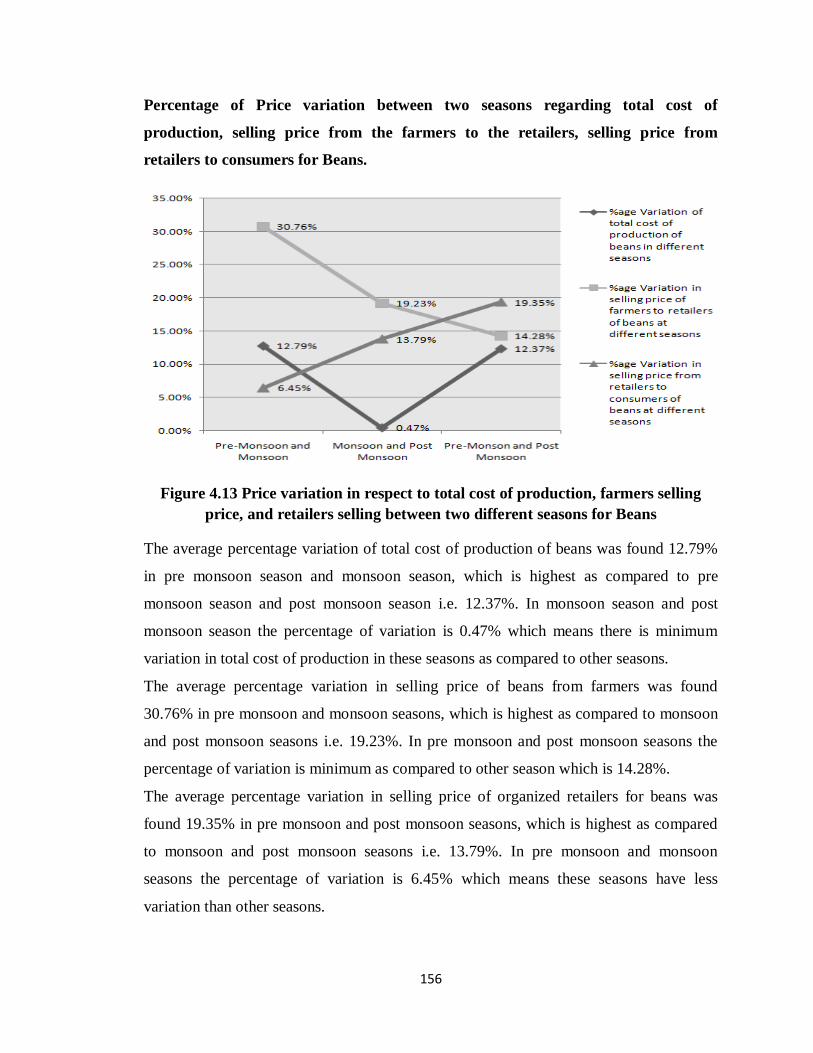
156
Percentage of Price variation between two seasons regarding total cost of
production, selling price from the farmers to the retailers, selling price from
retailers to consumers for Beans.
Figure 4.13 Price variation in respect to total cost of production, farmers selling
price, and retailers selling between two different seasons for Beans
The average percentage variation of total cost of production of beans was found 12.79%
in pre monsoon season and monsoon season, which is highest as compared to pre
monsoon season and post monsoon season i.e. 12.37%. In monsoon season and post
monsoon season the percentage of variation is 0.47% which means there is minimum
variation in total cost of production in these seasons as compared to other seasons.
The average percentage variation in selling price of beans from farmers was found
30.76% in pre monsoon and monsoon seasons, which is highest as compared to monsoon
and post monsoon seasons i.e. 19.23%. In pre monsoon and post monsoon seasons the
percentage of variation is minimum as compared to other season which is 14.28%.
The average percentage variation in selling price of organized retailers for beans was
found 19.35% in pre monsoon and post monsoon seasons, which is highest as compared
to monsoon and post monsoon seasons i.e. 13.79%. In pre monsoon and monsoon
seasons the percentage of variation is 6.45% which means these seasons have less
variation than other seasons.

157
For Bottle Gourd
Table 4. 4 The total cost incurred by the farmer, farmers selling price, consumer price
and price variation of bottle gourd across the seasons.
Seasons
Cost from the farmers Side
Farmers
Selling
Price
in
Rs./Tons
Consumer
Price
in
Rs./Tons
Price
variation
of
vegetables
in
Rs./Tons Pro
duct
ion
cost
in
Rs.
/Tons
Tra
nsp
ort
atio
n
cost
in
Rs.
/Tons
Pac
kag
ing
cost
in
Rs.
/Tons
Tota
l C
ost
in
Rs.
/Tons
Pre-
Monson 9875.00 3125.00 1000.00 14000.00 16500.00 45000.00 28500.00
Monsoon 7962.00 3125.00 1000.00 16000.00 16000.00 40000.00 24000.00
Post-
Monsoon 7462.00 3125.00 1000.00 16000.00 16000.00 34000.00 18000.00
Source: Primary Data
Figure 4.14 Price variations of bottle gourd across the season
Interpretation – The table 4.4 and figure 4.14 states that the price of Bottle gourd is
higher in pre-monsoon. Same case also exist in this vegetable i.e. the farmers not able to
earn more as profit since there is packaging cost where every bottle gourd is packed
individually in a plastic bag so that the damage cannot occur, sometime every individual
bottle gourd is packed and then packed in a number for the easy transportation. This
cause increase in cost from the farmer‘s side.

158
Percentage of Price variation between two seasons regarding total cost of
production, selling price from the farmers to the retailers, selling price from
retailers to consumers for Bottle Gourd.
Figure 4.15 Price variation in respect to the total cost of production, farmers selling
price, and retailers selling between two different seasons for Bottle Gourd
The average percentage variation of total cost of production of Bottle gourd was found
same at pre monsoon and monsoon seasons, and pre monsoon and post monsoon seasons
i.e. 3.03%. In monsoon season and post monsoon season the percentage of variation is nil
which, means there is no variation in total cost of production in these seasons.
The average percentage variation in selling price of Bottle Gourd from farmers was found
12.50% in pre monsoon and post monsoon seasons, which is highest as compared to pre
monsoon season and monsoon season i.e. 11.11%. In monsoon and post monsoon seasons
the percentage of variation is minimum is nil which means there is no variation in
farmers selling price to retailers i.e. 0.00%.
The average percentage variation in selling price of organized retailers for Bottle Gourd
was found 24.40% in pre monsoon and post monsoon seasons, which is highest as
compared to monsoon and post monsoon seasons i.e. 15.00%. In pre monsoon and
monsoon seasons the percentage of variation is 12.50% which, means these seasons have
less variation than other seasons.

159
For Tomato
Table 4.5 The total cost incurred by the farmer, farmers selling price, consumer price
and price variation of tomato across the seasons.
Seasons
Cost from the farmers Side
Farmers
Selling
Price
in
Rs./Tons
Consumer
Price
in
Rs./Tons
Price
variation
of
vegetables
in
Rs./Tons Pro
duct
ion
cost
in R
s./T
ons
Tra
nsp
ort
atio
n
cost
in R
s./T
ons
Pac
kag
ing
cost
in R
s./T
ons
Tota
l C
ost
in
Rs.
/Tons
Pre-
Monson 15050.00 3125.00 2500.00 20675.00 25000.00 80000.00 55000.00
Monsoon 11512.00 3125.00 2500.00 17137.00 27000.00 69000.00 42000.00
Post-
Monsoon 12562.00 3125.00 2500.00 18187.00 30000.00 65000.00 35000.00
Source: Primary Data
Figure 4.16 Price variations of Tomato across the season
Interpretation – The table 4.5 and figure 4.16 states that the price of tomato is high in pre-
monsoon than other seasons. Due to its high market price the farmers not get reasonable
value for their produce because the packaging cost is extremely high sine the packaging
of tomato is carried out in a plastic carat which has high price and it has to be beared by
the farmers only which lower down the value of farmers margin.

160
Percentage of Price variation between two seasons regarding total cost of
production, selling price from the farmers to the retailers, selling price from
retailers to consumers for Tomato.
Figure 4.17 Price variation in respect to the total cost of production, farmers selling
price, and retailers selling between two different seasons for Tomato
The average percentage variation of total cost of production of Tomato found 17.11% in
pre monsoon and monsoon seasons, which is highest as compared to pre monsoon and
post monsoon seasons i.e. 12.03%. In monsoon and post monsoon seasons the percentage
of variation is 5.79%, which means there is less variation in total cost of production in
these seasons as compared to other.
The average percentage variation in selling price of Tomato form farmers was found
16.60% in pre monsoon and post monsoon seasons, which is highest as compared to
monsoon and post monsoon seasons i.e. 10.00%. In pre monsoon and monsoon seasons
the percentage of variation is minimum as compared to other season which is 7.40%.
The average percentage variation in selling price of organized retailers for Tomato was
found 18.75% in pre monsoon and post monsoon seasons, which is highest as compared
to Pre monsoon and monsoon seasons i.e. 13.75%. In monsoon and post monsoon
seasons the percentage of variation is 5.79% which means these seasons have less
variation than other seasons.

161
For Brinjal
Table 4.6 The total cost incurred by the farmer, farmers selling price, consumer price
and price variation of brinjal across the seasons.
Seasons
Cost from the farmers Side
Farmers
Selling
Price
in
Rs./Tons
Consumer
Price
in
Rs./Tons
Price
variation
of
vegetables
in
Rs./Tons Pro
duct
ion
cost
in R
s./T
ons
Tra
nsp
ort
atio
n
cost
in R
s./T
ons
Pac
kag
ing
cost
in R
s./T
ons
Tota
l C
ost
in
Rs.
/Tons
Pre-
Monson 9375.00 3125.00 150.00 12650.00 15000.00 55000.00 40000.00
Monsoon 7837.00 3125.00 150.00 11112.00 12000.00 46000.00 34000.00
Post-
Monsoon 7662.00 3125.00 150.00 10937.00 12000.00 36000.00 24000.00
Source: Primary Data
Figure 4.18 Price variations of Brinjal across the season
Interpretation – The table 4.6 and figure 4.18 states that the like all vegetables the price of
brinjal is also high in pre-monsoon than other seasons, despite of its price hike the
farmers does not get the value of their production. The cost of packaging is less as
compared to Beans, Bottle Gourd and Tomato.

162
Percentage of Price variation between two seasons regarding total cost of
production, selling price from the farmers to the retailers, selling price from
retailers to consumers for Brinjal.
Figure 4.19 Price variation in respect to the total cost of production, farmers selling
price, and retailers selling between two different seasons for Brinjal
The average percentage variation of total cost of production of Brinjal was found 13.54%
at pre monsoon and post monsoon seasons, which is highest as compared to pre monsoon
and monsoon seasons i.e. 12.15%. In monsoon and post monsoon seasons the percentage
of variation is less as compared to other season i.e.1.57%.
The average percentage variation in selling price of Brinjal form farmers was found same
at pre monsoon and post monsoon seasons, and pre monsoon and monsoon season i.e.
20.00%. In monsoon and post monsoon seasons the percentage of variation is nil as
compared to other season.
The average percentage variation in selling price of organized retailers for Brinjal was
found 34.54% in pre monsoon and post monsoon seasons, which is highest as compared
to monsoon and post monsoon seasons i.e. 21.73%. In pre monsoon and monsoon
seasons the percentage of variation is 16.36% which means these seasons have less
variation than other seasons.

163
4.3.2 Price variation of vegetables in a particular season
For Pre-Monsoon
Table 4.7 Price variation of vegetables in Pre-Monsoon P
re-M
on
soon
Cauliflower Cabbage Beans Bottle
Gourd Tomato Brinjal
Farmers total
cost Rs./Tons 16000 13750 12020 14000 20675 12650
Farmers selling
price Rs./Tons 18000 16000 18000 16500 25000 15000
Consumer price
Rs./Tons 30000 23000 62000 45000 80000 55000
Price Variation
in Rs./Tons 12000 7000 44000 28500 55000 40000
Source: Primary Data
Figure 4.20 Price Variations of Vegetables in Pre-Monsoon Season
Interpretation –The table 4.7 and figure 4.20 states that in pre-monsoon the price of
tomato is much higher than other vegetables. The major cultivation of vegetables in
Ranchi and its adjoining areas is of cauliflower and cabbage which contribute fewer
margins at the farmer‘s side but the consumer side tomato is maximum and then beans
followed by the other vegetables. Since the cultivation of cauliflower and cabbage is high
but the farmers does not get satisfied value for their vegetables.

164
For Monsoon
Table 4.8 Price Variation of Vegetables in Monsoon
Mon
soon
Cauliflower Cabbage Beans Bottle
Gourd Tomato Brinjal
Farmers
total cost 13800 11612 10482 16000 17137 11112
Farmers
selling
price
15000 14500 26000 16000 27000 12000
Consumer
price 26000 19000 58000 40000 69000 46000
Price
Variation
in
Rs./Tons
11000 4500 32000 24000 42000 34000
Source: Primary Data
Figure 4.21 Price Variations of Vegetables in Monsoon
Interpretation – The table 4.8 and figure 4.21 states that in Monsoon season the price
variation is minimum of cabbage but maximum of tomato, brinjal and beans. The
mediators play a significant role in price fixation of the vegetables.

165
For Post-Monsoon
Table 4.9 Price Variation of Vegetables in Post-Monsoon
Post
-Mon
soon
Cauliflower Cabbage Beans Bottle
Gourd Tomato Brinjal
Farmers
total cost 13800 11387 10532 16000 18187 10937
Farmers
selling
price
14000 14000 21000 16000 30000 12000
Consumer
price 18000 17000 50000 34000 65000 36000
Price
Variation
in
Rs./Tons
4000 3000 29000 18000 35000 24000
Source: Primary Data
Figure 4.22 Price Variations of Vegetables in Post-Monsoon
Interpretation – The table 4.9 and figure 4.22 states that in Monsoon season the price
variation is minimum of cabbage but maximum of tomato, brinjal and beans. The
mediators play a significant role in price fixation of the vegetables.

166
4.3.3 Price variation of all concerned vegetables in different seasons
For all Concerned Vegetables (Cauliflower, Cabbage, Beans, Bottle Gourd, Tomato
and Brinjal)
Table 4.10 The total cost incurred by the farmer, farmers selling price, consumer price
and price variation of concerned vegetables at different seasons.
Veg
etab
les
Sea
sons
Cost from the farmers Side
Farmers
Selling
Price in
Rs./Tons
Consumer
Price in
Rs./Tons
Price
variation
of
vegetables
in
Rs./Tons Pro
duct
ion
cost
in
Rs.
/Tons
Tra
nsp
ort
atio
n
cost
in
Rs.
/Tons
Pac
kag
ing c
ost
in R
s./T
ons
Tota
l C
ost
in
Rs.
/Tons
Cau
lifl
ow
er Pre-
Monson 12875 3125 0 16000 18000 30000 12000
Monsoon 10675 3125 0 13800 15000 26000 11000
Post-
Monsoon 10137 3125 0 13800 14000 18000 4000
Cab
bag
e Pre-
Monson 10625.00 3125.00 0.00 13750 16000 23000 7000.00
Monsoon 8487.00 3125.00 0.00 11612.00 14500.00 19000 4500.00
Post-
Monsoon 8262.00 3125.00 0.00 11387 14000 17000 3000.00
Bea
ns
Pre-
Monson 8625 3125 270 12020 18000 62000 44000
Monsoon 7087 3125 270 10482 26000 58000 32000
Post-
Monsoon 7137 3125 270 10532 21000 50000 29000
Bott
le g
ourd
Pre-
Monson 9875 3125 1000 14000 16500 45000 28500
Monsoon 7962 3125 1000 16000 16000 40000 24000
Post-
Monsoon 7462 3125 1000 16000 16000 34000 18000
Tom
ato
Pre-
Monson 15050 3125 2500 20675 25000 80000 55000
Monsoon 11512 3125 2500 17137 27000 69000 42000
Post-
Monsoon 12562 3125 2500 18187 30000 65000 35000
Bri
nja
l
Pre-
Monson 9375 3125 150 12650 15000 55000 40000
Monsoon 7837 3125 150 11112 12000 46000 34000
Post-
Monsoon 7662 3125 150 10937 12000 36000 24000
Source: Primary Data

167
Figure 4.23 Price Variations of Vegetables in Different Season
Interpretation – The table 4.10 and figure 4.23 states that there is a variation in price of
selected vegetables. There is a maximum variation regarding tomato, brinjal, beans and
bottle gourd. The farmers does not get appropriate vale for their produce vegetables. Due
to lack of storage they can‘t be able to hold back these vegetables with them for a long
period of time after the cultivation because of its perishability in nature, so they have to
sell within a particular period of time at the intermediary‘s price. The result the farmer
does not get proper value and intermediaries like mahajans earn more than the farmers.
These intermediaries also play an important role in fixing the price of the selected
vegetables and sell in the market or to the retailers as their convenient.

168
4.4 Anova was carried out to find the price variation in Average productivity,
Average Production Cost, Average Transportation Cost and Average Packaging
Cost of vegetables in different seasons (Pre Monsoon, Monsoon and Post
Monsoon).
Test for Hypothesis H1 - There is a variation in the average productivity
vegetables in different seasons.
H1a: There is a variation in the average productivity of Cauliflower in different
seasons.
Descriptive Statistics
Table 4.11 Average productivity of Cauliflower in tons in different
seasons (Pre Monsoon, Monsoon and Post Monsoon)
Seasons Mean
(in Tons)
Std. Deviation
Pre-Monsoon 0.28 0.1527
Monsoon 0.52 0.2738
Post-Monsoon 0.60 0.3785
ANOVA
Table 4.12 Average productivity of Cauliflower in tons in different seasons
(Pre Monsoon, Monsoon and Post Monsoon)
Between the seasons
Within seasons
Sum of
Squares
df Mean
Square
F Sig.
1.387
5.800
2
137
0.693
0.081
8.607 0.000

169
Interpretation
The above two table states about the descriptive statistics and analysis of
variance. From the table it can be understood in Pre-Monsoon (M = 0.280, S.D =
0.1527), Monsoon (M = 0.52, S.D = 0.2738) and in Post-Monsoon (M = 0.60, S.D
= 0.3785).
The analysis of variance table depicts, the value of F = 8.607 and the sig. value is
0.000, for the average productivity of Cauliflower in tons in different seasons.
The analysis of variance states that the average productivity of Cauliflower was
found the highest during the post-monsoon season, which is at par with the
monsoon season. The average productivity during the monsoon and post monsoon
seasons was significantly higher than a pre monsoon season.
For Cauliflower, it has been inferred that the total production is showing an
increment of 15.38% from monsoon to post-monsoon and on the other hand the
same is showing a reduction of 46.15% from monsoon to pre-monsoon.
Hence, the alternative hypothesis has been accepted, which states that, there is a
variation in the average productivity of cauliflower in different seasons.
H1b: There is a variation in the average productivity of Cabbage in different
seasons.
Descriptive Statistics
Table 4.13Average productivity of Cabbage in tons in different seasons
(Pre Monsoon, Monsoon and Post Monsoon)
Seasons Mean
in Tons
Std. Deviation
Pre-Monsoon 0.56 0.3937
Monsoon 0.88 0.4272
Post-Monsoon 0.96 0.4153

170
ANOVA
Table 4.14 Average productivity of Cabbage in tons in different seasons
(Pre Monsoon, Monsoon and Post Monsoon)
Between the seasons
Within seasons
Sum of
Squares
df Mean
Square
F Sig.
2.240
12.240
2
137
1.120
0.170
6.588 0.002
Interpretation
The above two table states about the descriptive statistics and analysis of
variance. From the table it can be understood in Pre-Monsoon (M = 0.56, S.D =
0.3937), Monsoon (M = 0.88, S.D = 0.4272) and in Post-Monsoon (M = 0.96, S.D
= 0.4153).
The analysis of variance table depicts, the value of F = 6.588 and the sig. value is
0.002, for the average productivity of Cabbage in tons in different seasons.
The analysis of variance states that the average productivity of Cabbage was
found the highest during the post-monsoon season, which is at par with the
monsoon season. The average productivity during the monsoon and post-monsoon
seasons was significantly higher than the pre-monsoon season.
For Cabbage, it has been inferred that the total production is showing an
increment of 36.36% from monsoon to post-monsoon and on the other hand the
same is showing a reduction of 09.09% from monsoon to pre-monsoon.
Hence, the alternative hypothesis has been accepted, which states that, there is a
variation in the average productivity of cauliflower in different seasons.

171
H1c: There is a variation in the average productivity of Beans in different
seasons.
Descriptive Statistics
Table 4.15 Average productivity of Beans in tons in different seasons (Pre
Monsoon, Monsoon and Post Monsoon)
Seasons Mean
(in Tons)
Std. Deviation
Pre-Monsoon 0.04 0.0178
Monsoon 0.20 0.0957
Post-Monsoon 0.24 0.1118
ANOVA
Table 4.16 Average productivity of Beans in tons in different seasons (Pre
Monsoon, Monsoon and Post Monsoon)
Between seasons
Within seasons
Sum of
Squares
df Mean
Square
F Sig.
0.560
0.528
2
137
0.280
0.007
38.211 0.000
Interpretation
The above two table states about the descriptive statistics and analysis of
variance. From the table it can be understood in Pre-Monsoon (M = 0.04, S.D = 0.
0.0178), Monsoon (M = 0.20, S.D = 0.0957) and in Post-Monsoon (M = 0.24, S.D
= 0.1118).
The analysis of variance table depicts, the value of F = 38.221 and the sig. value
is 0.000, for the average productivity of Beans in tons in different seasons.
The analysis of variance states that the average productivity of Beans was found
the highest during the post-monsoon season, which is at par with the monsoon
season. The average productivity during the monsoon and post-monsoon seasons
was significantly higher than pre-monsoon season.
For Beans, it has been inferred that the total production is showing an increment
of 20.00% from monsoon to post-monsoon and on the other hand the same is
showing a reduction of 80.00% from monsoon to pre-monsoon.

172
Hence, the alternative hypothesis has been accepted, which states that, there is a
variation in the average productivity of Beans in different seasons.
H1d: There is a variation in the average productivity of Bottle Gourd at
different seasons.
Descriptive Statistics
Table 4.17 Average productivity of Bottle Gourd in tons in different
seasons (Pre- Monsoon, Monsoon and Post-Monsoon)
Seasons Mean
(in Tons)
Std. Deviation
Pre-Monsoon 0.64 0.2783
Monsoon 1.20 0.5715
Post-Monsoon 1.40 0.9101
ANOVA
Table 4.18 Average productivity of Bottle Gourd in tons in different
seasons (Pre-Monsoon, Monsoon and Post-Monsoon)
Between seasons
Within seasons
Sum of
Squares
df Mean
Square
F Sig.
7.760
29.580
2
137
3.880
0.411
9.444 0.000
Interpretation
The above two table states about the descriptive statistics and analysis of
variance. From the table it can be understood in Pre-Monsoon (M = 0.64, S.D =
0.2783), Monsoon (M = 1.20, S.D = 0.5715) and in Post-Monsoon (M = 1.40, S.D
= 0.9101).
The analysis of variance table depicts, the value of F = 9.444 and the sig. value is
0.000, for the average productivity of Bottle Gourd in tons in different seasons.
The analysis of variance states that the average productivity of Bottle Gourd was
found the highest during the post-monsoon season, which is at par with the
monsoon season. The average productivity during the monsoon and the post-
monsoon seasons was significantly higher than pre-monsoon season.

173
For Bottle Gourd, it has been inferred that the total production is showing an
increment of 16.66% from monsoon to post-monsoon and on the other hand the
same is showing a reduction of 46.66% from monsoon to pre-monsoon.
Hence, the alternative hypothesis has been accepted, which states that, there is a
variation in the average productivity of Bottle Gourd in different seasons.
H1e: There is a variation in the average productivity of Tomato at different
seasons.
Descriptive Statistics
Table 4.19 Average productivity of Tomato in tons in different seasons
(Pre Monsoon, Monsoon and Post Monsoon)
Seasons Mean
(in Tons)
Std. Deviation
Pre-Monsoon 0.88 0.4113
Monsoon 1.60 0.7984
Post-Monsoon 2.00 0.9464
ANOVA
Table 4.20 Average productivity of Tomato in tons in different seasons
(Pre Monsoon, Monsoon and Post Monsoon)
Between seasons
Within seasons
Sum of
Squares
df Mean
Square
F Sig.
16.107
40.860
2
137
8.053
0.568
14.191 0.000
Interpretation
The above two table states about the descriptive statistics and analysis of
variance. From the table it can be understood in Pre-Monsoon (M = 0.88, S.D =
0.4113), Monsoon (M = 1.60, S.D = 0.7948) and in Post-Monsoon (M = 2.00, S.D
= 0.9464).
The analysis of variance table depicts, the value of F = 14.191 and the sig. value
is 0.000, for the average productivity of Bottle Gourd in tons in different seasons.

174
The analysis of variance states that the average productivity of Tomato was found
the highest during the post-monsoon season, which is at par with the monsoon
season. The average productivity during the monsoon and post -monsoon seasons
was significantly higher than pre-monsoon season.
For Tomato, it has been inferred that the total production is showing an increment
of 25.00% from monsoon to post-monsoon and on the other hand the same is
showing a reduction of 45.00% from monsoon to pre-monsoon.
Hence, the alternative hypothesis has been accepted, which states that, there is a
variation in the average productivity of Tomato in different seasons.
H1f: There is a variation in the average productivity of Brinjal at different
seasons.
Descriptive Statistics
Table 4.21Average productivity of Brinjal in tons in different seasons (Pre
Monsoon, Monsoon and Post Monsoon)
Seasons Mean
(in Tons)
Std. Deviation
Pre-Monsoon 1.0 0.4453
Monsoon 2.0 0.6075
Post-Monsoon 3.0 1.1438
ANOVA
Table 4.22 Average productivity of Brinjal in tons in different seasons (Pre
Monsoon, Monsoon and Post Monsoon)
Between seasons
Within seasons
Sum of
Squares
df Mean
Square
F Sig.
50.000
45.020
2
137
25.000
0.625
39.982 0.000
Interpretation
The above two table states about the descriptive statistics and analysis of
variance. From the table it can be understood in Pre-Monsoon (M = 1.0, S.D =

175
0.4453), Monsoon (M = 2.0, S.D = 0.6075) and in Post-Monsoon (M = 3.0, S.D =
1.1438).
The analysis of variance table depicts, the value of F = 39.982 and the sig. value
is 0.000, for the average productivity of Brinjal in tons in different seasons.
The analysis of variance states that the average productivity of Brinjal was found
the highest during the post-monsoon season, which is at par with the monsoon
season. The average productivity during the monsoon and post-monsoon seasons
was significantly higher than the pre-monsoon season.
For Brinjal, it has been inferred that the total production is showing an increment
of 50.00% from monsoon to post-monsoon and on the other hand the same is
showing a reduction of 50% from monsoon to pre-monsoon.
Hence, the alternative hypothesis has been accepted, which states that, there is a
variation in the average productivity of Brinjal in different seasons.
Test for Hypothesis H2: There is a variation in the average production cost of
vegetables at different seasons.
H2a: There is a variation in the average production cost of Cauliflower at
different seasons.
Descriptive Statistics
Table 4.23 Average production cost of Cauliflower in tons in different seasons
(Pre Monsoon, Monsoon and Post Monsoon)
Seasons Mean
(in Tons)
Std. Deviation
Pre-Monsoon 3605.00 1966.68
Monsoon 5269.78 2775.14
Post-Monsoon 6405.00 4041.48
ANOVA
Table 4.24 Average production cost of Cauliflower in tons in different seasons
(Pre Monsoon, Monsoon and Post Monsoon)
Between seasons
Within seasons
Sum of
Squares
df Mean Square F Sig.
99168509.44
669670320.91
2
137
49584254.72
9300976.67
5.331 0.007

176
Interpretation
The above two table states about the descriptive statistics and analysis of variance.
From the table it can be understood in Pre-Monsoon (M = 3605.00, S.D = 1966.68),
Monsoon (M = 5269.78, S.D = 2775.14) and in Post-Monsoon (M = 6405.00, S.D =
4041.48).
The analysis of variance table depicts, the value of F = 5.331 and the sig. value is
0.007, for the average cost of production of Cauliflower in tons in different seasons.
The analysis of variance states that the average cost of production of Cauliflower
was found the highest during the post-monsoon season, which is at par with the
monsoon season. The average cost of production during the monsoon and post-
monsoon seasons was significantly higher than the pre-monsoon season.
For Cauliflower, it has been inferred that the total production cost is showing an
increment of 31.59% from monsoon to post-monsoon and on the other hand the same
is showing a reduction of 21.54% form monsoon to pre-monsoon.
Hence, the alternative hypothesis has been accepted, which states that, there is a
variation in the average production cost of Cauliflower in different seasons.
H2b: There is a variation in the average production cost of Cabbage at
different seasons.
Descriptive Statistics
Table 4.25 Average production cost of Cabbage in tons in different seasons (Pre
Monsoon, Monsoon and Post Monsoon)
Seasons Mean
(in Tons)
Std. Deviation
Pre-Monsoon 5950.00 4183.06
Monsoon 7468.56 3625.64
Post-Monsoon 7931.52 3431.46

177
ANOVA
Table 4.26 Average production cost of Cabbage in tons in different seasons (Pre
Monsoon, Monsoon and Post Monsoon)
Between seasons
Within seasons
Sum of
Squares
df Mean Square F Sig.
53723149.54
1018039951.38
2
137
26861574.77
14139443.76
6.588 0.002
Interpretation
The above two table states about the descriptive statistics and analysis of variance.
From the table it can be understood in Pre-Monsoon (M = 5950.00, S.D = 4183.06),
Monsoon (M = 7468.56, S.D = 3625.64) and in Post-Monsoon (M = 7931.52, S.D =
3431.46).
The analysis of variance table depicts, the value of F = 6.588 and the sig. value is 0.002,
for the average cost of production of Cabbage in tons in different seasons.
The analysis of variance states that
For Cabbage, it has been inferred that the total production cost is showing an increment
of 20.33% from monsoon to post-monsoon and on the other hand the same is showing a
reduction of 6.20% form monsoon to pre-monsoon.
Hence, the alternative hypothesis has been accepted, which states that, there is a
variation in the average production cost of Cabbage in different seasons.
H2c: There is a variation in the average production cost of Beans at different
seasons.
Descriptive Statistics
Table 4.27 Average production cost of Beans in tons in different seasons (Pre
Monsoon, Monsoon and Post Monsoon)
Seasons Mean
(in Tons)
Std. Deviation
Pre-Monsoon 345.00 153.48
Monsoon 1417.40 678.52
Post-Monsoon 1712.92 797.96
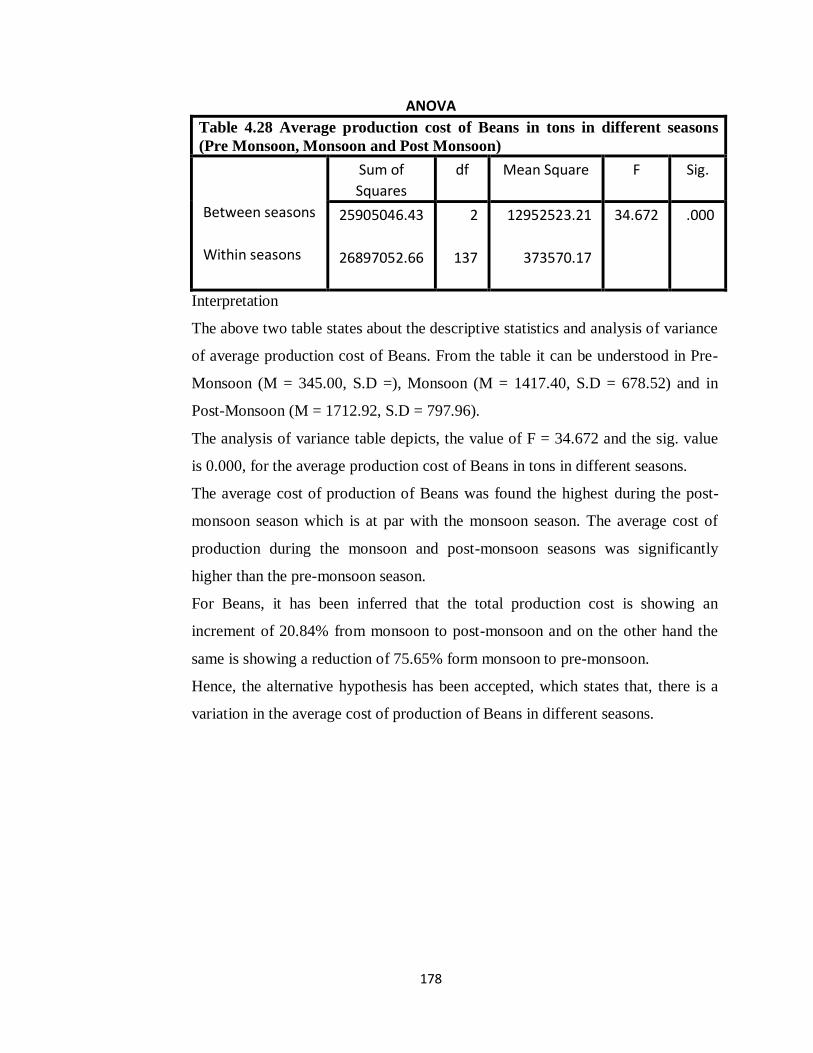
178
ANOVA
Table 4.28 Average production cost of Beans in tons in different seasons
(Pre Monsoon, Monsoon and Post Monsoon)
Between seasons
Within seasons
Sum of
Squares
df Mean Square F Sig.
25905046.43
26897052.66
2
137
12952523.21
373570.17
34.672 .000
Interpretation
The above two table states about the descriptive statistics and analysis of variance
of average production cost of Beans. From the table it can be understood in Pre-
Monsoon (M = 345.00, S.D =), Monsoon (M = 1417.40, S.D = 678.52) and in
Post-Monsoon (M = 1712.92, S.D = 797.96).
The analysis of variance table depicts, the value of F = 34.672 and the sig. value
is 0.000, for the average production cost of Beans in tons in different seasons.
The average cost of production of Beans was found the highest during the post-
monsoon season which is at par with the monsoon season. The average cost of
production during the monsoon and post-monsoon seasons was significantly
higher than the pre-monsoon season.
For Beans, it has been inferred that the total production cost is showing an
increment of 20.84% from monsoon to post-monsoon and on the other hand the
same is showing a reduction of 75.65% form monsoon to pre-monsoon.
Hence, the alternative hypothesis has been accepted, which states that, there is a
variation in the average cost of production of Beans in different seasons.

179
H2d: There is a variation in the average production cost of Bottle Gourd at
different seasons.
Descriptive Statistics
Table 4.29 Average production cost of Bottle Gourd in tons in different seasons
(Pre Monsoon, Monsoon and Post Monsoon)
Seasons Mean
(in Tons)
Std. Deviation
Pre-Monsoon 6320.00 2749.08
Monsoon 9552.61 4550.34
Post-Monsoon 10446.80 6971.37
ANOVA
Table 4.30 Average production cost of Bottle Gourd in tons in different
seasons (Pre Monsoon, Monsoon and Post Monsoon)
Between seasons
Within seasons
Sum of
Squares
df Mean Square F Sig.
235665412.24
1785261694.65
2
137
117832706.12
24795301.31
4.752 0.012
Interpretation
The above two table states about the descriptive statistics and analysis of variance of
average production cost of Bottle Gourd. From the table it can be understood in Pre-
Monsoon (M = 6320.00, S.D = 2749.08), Monsoon (M = 9552.61, S.D = 4550.34)
and in Post-Monsoon (M = 10446.80, S.D = 6971.37).
The analysis of variance table depicts, the value of F = 4.752 and the sig. value is
0.012, for the average production cost of Bottle Gourd in tons in different seasons.
The average production cost of Bottle Gourd was found the highest during the post-
monsoon season which is at par with the monsoon season. The average production
cost during the monsoon and post-monsoon seasons was significantly higher than the
pre-monsoon season.

180
For Bottle Gourd, it has been inferred that the total production cost is showing an
increment of 9.30% from monsoon to post-monsoon and on the other hand the same
is showing a reduction of 33.84% form monsoon to pre-monsoon.
Hence, the alternative hypothesis has been accepted, which states that, there is a
variation in the average production cost of Bottle Gourd in different seasons.
H2e: There is a variation in the average production cost of Tomato at different
seasons.
Descriptive Statistics
Table 4.31 Average production cost of Tomato in tons in different seasons
(Pre Monsoon, Monsoon and Post Monsoon)
Seasons Mean
(in Tons)
Std. Deviation
Pre-Monsoon 13244.00 6190.04
Monsoon 18419.20 9191.59
Post-Monsoon 25123.28 11890.21
ANOVA
Table 4.32 Average production cost of Tomato in tons in different seasons (Pre
Monsoon, Monsoon and Post Monsoon)
Between seasons
Within seasons
Sum of
Squares
df Mean Square F Sig.
1773705641.70
6340304449.44
2
137
886852820.85
88059784.02
10.071 0.000
Interpretation
The above two table states about the descriptive statistics and analysis of variance of
average production cost of Tomato. From the table it can be understood in Pre-
Monsoon (M = 13244.00, S.D = 6190.04), Monsoon (M = 18419.20, S.D = 9191.59)
and in Post-Monsoon (M = 25123.28, S.D = 11890.21).
The analysis of variance table depicts, the value of F = 10.071 and the sig. value is
0.000, for the average production cost of Tomato in tons in different seasons.

181
The average production cost of tomato was found the highest during the post-
monsoon season which is at par with the monsoon season. The average production
cost during the monsoon and post-monsoon seasons was significantly higher than the
pre-monsoon season.
For Tomato, it has been inferred that the total production cost is showing an increment
of 36.39% from monsoon to post-monsoon and on the other hand the same is showing
a reduction of 28.09% form monsoon to pre-monsoon.
Hence, the alternative hypothesis has been accepted, which states that, there is a
variation in the production cost of Tomato in different seasons.
H2f: There is a variation in the average production cost of Brinjal at different
seasons.
Descriptive Statistics
Table 4.33 Average production cost of Brinjal in tons in different seasons
(Pre Monsoon, Monsoon and Post Monsoon)
Seasons Mean
(in Tons)
Std. Deviation
Pre-Monsoon 9375.00 4175.12
Monsoon 15673.97 4761.69
Post-Monsoon 22986.00 8763.97
ANOVA
Table 4.34 Average production cost of Brinjal in tons in different seasons (Pre
Monsoon, Monsoon and Post Monsoon)
Between seasons
Within seasons
Sum of
Squares
df Mean Square F Sig.
2320017621.87
2805905838.98
2
137
1160008810.93
38970914.43
29.766 0.000
Interpretation
The above two table states about the descriptive statistics and analysis of variance of
average production cost of Brinjal. From the table it can be understood in Pre-

182
Monsoon (M = 9375.00, S.D = 4175.12), Monsoon (M = 15673.97, S.D = 4761.69)
and in Post-Monsoon (M = 22986.00, S.D = 8763.97).
The analysis of variance table depicts, the value of F = 29.766 and the sig. value is
0.000, for the average production cost of Brinjal in tons in different seasons.
The average production cost of Brinjal was found the highest during the post-monsoon
season, which is at par with the monsoon season. The average production cost during
the monsoon and post-monsoon seasons was significantly higher than the pre-
monsoon season.
For Brinjal, it has been inferred that the total production cost is showing an increment
of 46.66% from monsoon to post-monsoon and on the other hand the same is showing
a reduction of 40.18% form monsoon to pre-monsoon.
Hence, the alternative hypothesis has been accepted, which states that, there is a
variation in the average production cost of Brinjal in different seasons.
Test for Hypothesis H3: There is a variation in the average transportation cost of
vegetables at different seasons.
H3a: There is a variation in the average transportation cost of Cauliflower at
different seasons.
Descriptive Statistics
Table 4.35 Average transportation cost of Cauliflower in tons in different
seasons (Pre Monsoon, Monsoon and Post Monsoon)
Seasons Mean
(in Tons)
Std. Deviation
Pre-Monsoon 875.00 477.35
Monsoon 1625.00 855.81
Post-Monsoon 1875.00 1183.10

183
ANOVA
Table 4.36 Average transportation cost of Cauliflower in tons in different
seasons (Pre Monsoon, Monsoon and Post Monsoon)
Between seasons
Within seasons
Sum of
Squares
df Mean Square F Sig.
13541666.66
56640625.00
2
137
6770833.33
786675.34
8.607 0.000
Interpretation
The above two table states about the descriptive statistics and analysis of variance of
average transportation cost of Cauliflower. From the table it can be understood in Pre-
Monsoon (M = 875.00, S.D = 477.35), Monsoon (M = 1625.00, S.D = 855.81) and in
Post-Monsoon (M = 1875.00, S.D = 1183.10).
The analysis of variance table depicts, the value of F = 8.607 and the sig. value is
0.000, for the average transportation cost of Cauliflower in tons in different seasons.
The average transportation cost of Cauliflower was found the highest during the post-
monsoon season which is at par with the monsoon season. The average transportation
cost during the monsoon and post-monsoon seasons was significantly higher than the
pre-monsoon season.
For Cauliflower, it has been inferred that the total transportation cost is showing an
increment of 46.15% from monsoon to post-monsoon and on the other hand the same
is showing a reduction of 15.38% form monsoon to pre-monsoon.
Hence, the alternative hypothesis has been accepted, which states that, there is a
variation in the average transportation cost of Cauliflower in different seasons.

184
H3b: There is a variation in the average transportation cost of Cabbage at
different seasons.
Descriptive Statistics
Table 4.37 Average transportation cost of Cabbage in tons in different
seasons (Pre Monsoon, Monsoon and Post Monsoon)
Seasons Mean
(in Tons)
Std. Deviation
Pre-Monsoon 1750.00 1230.31
Monsoon 2750.00 1335.00
Post-Monsoon 3000.00 1297.90
ANOVA
Table 4.38 Average transportation cost of Cabbage in tons in different seasons
(Pre Monsoon, Monsoon and Post Monsoon)
Between seasons
Within seasons
Sum of
Squares
df Mean Square F Sig.
21875000.00
119531250.00
2
137
10937500.00
1660156.250
6.588 0.002
Interpretation
The above two table states about the descriptive statistics and analysis of variance
average transportation cost of Cabbage. From the table it can be understood in Pre-
Monsoon (M = 1750.00, S.D = 1230.31), Monsoon (M = 2750.00, S.D = 1335.00) and
in Post-Monsoon (M = 3000.00, S.D = 1297.90).
The analysis of variance table depicts, the value of F = 6.588 and the sig. value is
0.002, for the average transportation cost of Cabbage in tons in different seasons.
The average transportation cost of Cabbage was found the highest during the post-
monsoon season which is at par with the monsoon season. The average transportation
cost during the monsoon and post-monsoon seasons was significantly higher than the
pre-monsoon season.
For Cabbage, it has been inferred that the total transportation cost is showing an
increment of 9.09% from monsoon to post-monsoon and on the other hand the same is
showing a reduction of 36.36% form monsoon to pre-monsoon.
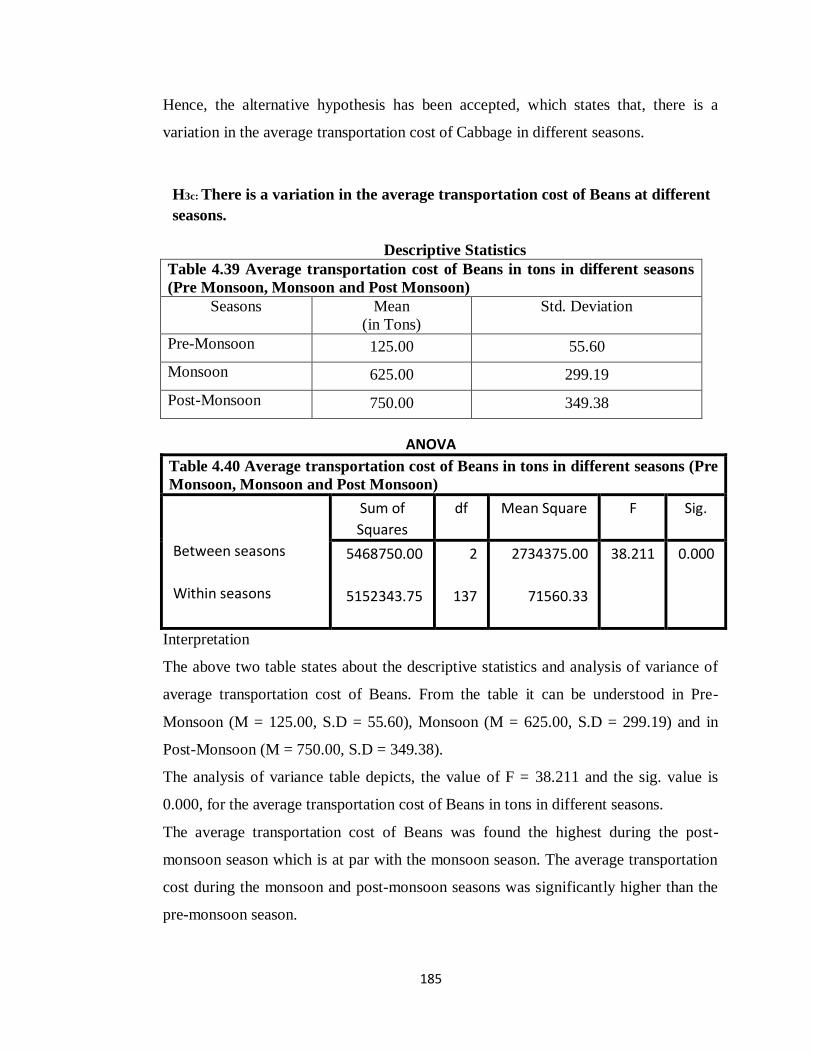
185
Hence, the alternative hypothesis has been accepted, which states that, there is a
variation in the average transportation cost of Cabbage in different seasons.
H3c: There is a variation in the average transportation cost of Beans at different
seasons.
Descriptive Statistics
Table 4.39 Average transportation cost of Beans in tons in different seasons
(Pre Monsoon, Monsoon and Post Monsoon)
Seasons Mean
(in Tons)
Std. Deviation
Pre-Monsoon 125.00 55.60
Monsoon 625.00 299.19
Post-Monsoon 750.00 349.38
ANOVA
Table 4.40 Average transportation cost of Beans in tons in different seasons (Pre
Monsoon, Monsoon and Post Monsoon)
Between seasons
Within seasons
Sum of
Squares
df Mean Square F Sig.
5468750.00
5152343.75
2
137
2734375.00
71560.33
38.211 0.000
Interpretation
The above two table states about the descriptive statistics and analysis of variance of
average transportation cost of Beans. From the table it can be understood in Pre-
Monsoon (M = 125.00, S.D = 55.60), Monsoon (M = 625.00, S.D = 299.19) and in
Post-Monsoon (M = 750.00, S.D = 349.38).
The analysis of variance table depicts, the value of F = 38.211 and the sig. value is
0.000, for the average transportation cost of Beans in tons in different seasons.
The average transportation cost of Beans was found the highest during the post-
monsoon season which is at par with the monsoon season. The average transportation
cost during the monsoon and post-monsoon seasons was significantly higher than the
pre-monsoon season.
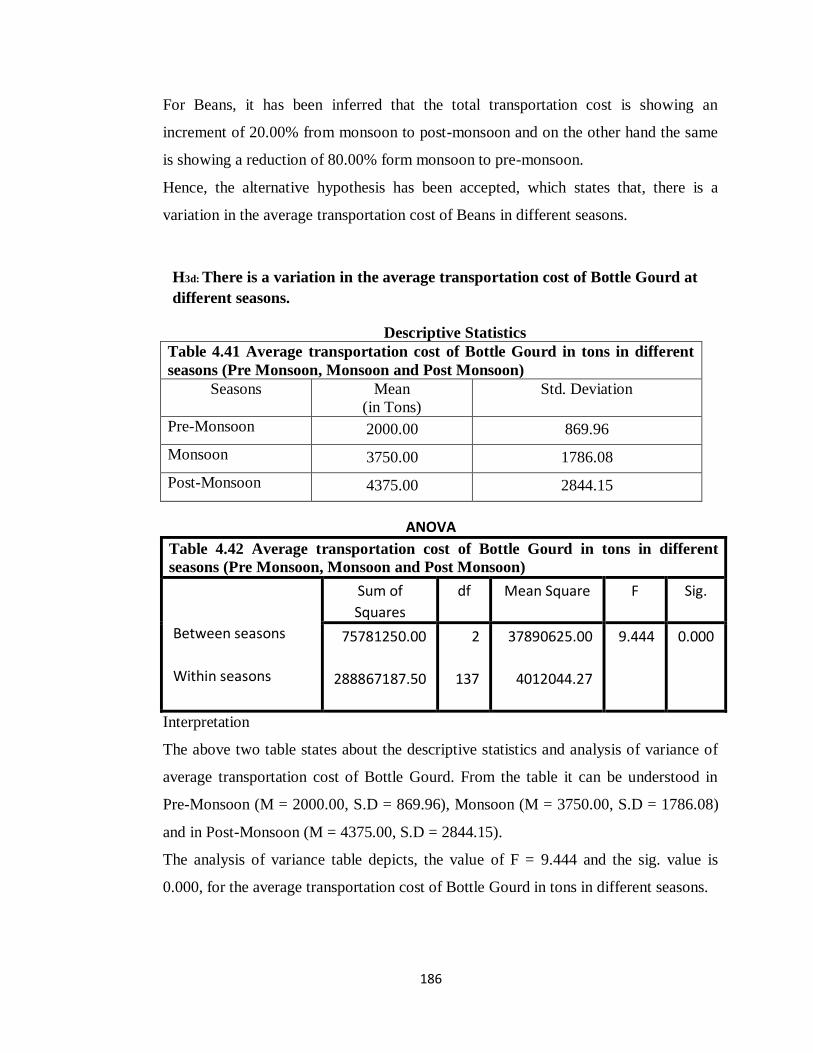
186
For Beans, it has been inferred that the total transportation cost is showing an
increment of 20.00% from monsoon to post-monsoon and on the other hand the same
is showing a reduction of 80.00% form monsoon to pre-monsoon.
Hence, the alternative hypothesis has been accepted, which states that, there is a
variation in the average transportation cost of Beans in different seasons.
H3d: There is a variation in the average transportation cost of Bottle Gourd at
different seasons.
Descriptive Statistics
Table 4.41 Average transportation cost of Bottle Gourd in tons in different
seasons (Pre Monsoon, Monsoon and Post Monsoon)
Seasons Mean
(in Tons)
Std. Deviation
Pre-Monsoon 2000.00 869.96
Monsoon 3750.00 1786.08
Post-Monsoon 4375.00 2844.15
ANOVA
Table 4.42 Average transportation cost of Bottle Gourd in tons in different
seasons (Pre Monsoon, Monsoon and Post Monsoon)
Between seasons
Within seasons
Sum of
Squares
df Mean Square F Sig.
75781250.00
288867187.50
2
137
37890625.00
4012044.27
9.444 0.000
Interpretation
The above two table states about the descriptive statistics and analysis of variance of
average transportation cost of Bottle Gourd. From the table it can be understood in
Pre-Monsoon (M = 2000.00, S.D = 869.96), Monsoon (M = 3750.00, S.D = 1786.08)
and in Post-Monsoon (M = 4375.00, S.D = 2844.15).
The analysis of variance table depicts, the value of F = 9.444 and the sig. value is
0.000, for the average transportation cost of Bottle Gourd in tons in different seasons.

187
The average transportation cost of Bottle Gourd was found the highest during the post-
monsoon season which is at par with the monsoon season. The average transportation
cost during the monsoon and post-monsoon seasons was significantly higher than the
pre-monsoon season.
For Bottle Gourd, it has been inferred that the total transportation cost is showing an
increment of 16.66% from monsoon to post-monsoon and on the other hand the same
is showing a reduction of 87.50% form monsoon to pre-monsoon.
Hence, the alternative hypothesis has been accepted, which states that, there is a
variation in the average transportation cost of Bottle Gourd in different seasons.
H3e: There is a variation in the average transportation cost of Tomato at
different seasons.
Descriptive Statistics
Table 4.43 Average transportation cost of Tomato in tons in different seasons
(Pre Monsoon, Monsoon and Post Monsoon)
Seasons Mean
(in Tons)
Std. Deviation
Pre-Monsoon 2750.00 1285.30
Monsoon 5000.00 2495.11
Post-Monsoon 6250.00 2957.76
ANOVA
Table 4.44 Average transportation cost of Tomato in tons in different seasons
(Pre Monsoon, Monsoon and Post Monsoon)
Between seasons
Within seasons
Sum of
Squares
df Mean Square F Sig.
157291666.66
399023437.50
2
137
78645833.33
5541992.18
14.191 0.000
Interpretation
The above two table states about the descriptive statistics and analysis of variance of
average transportation cost of Tomato. From the table it can be understood in Pre-
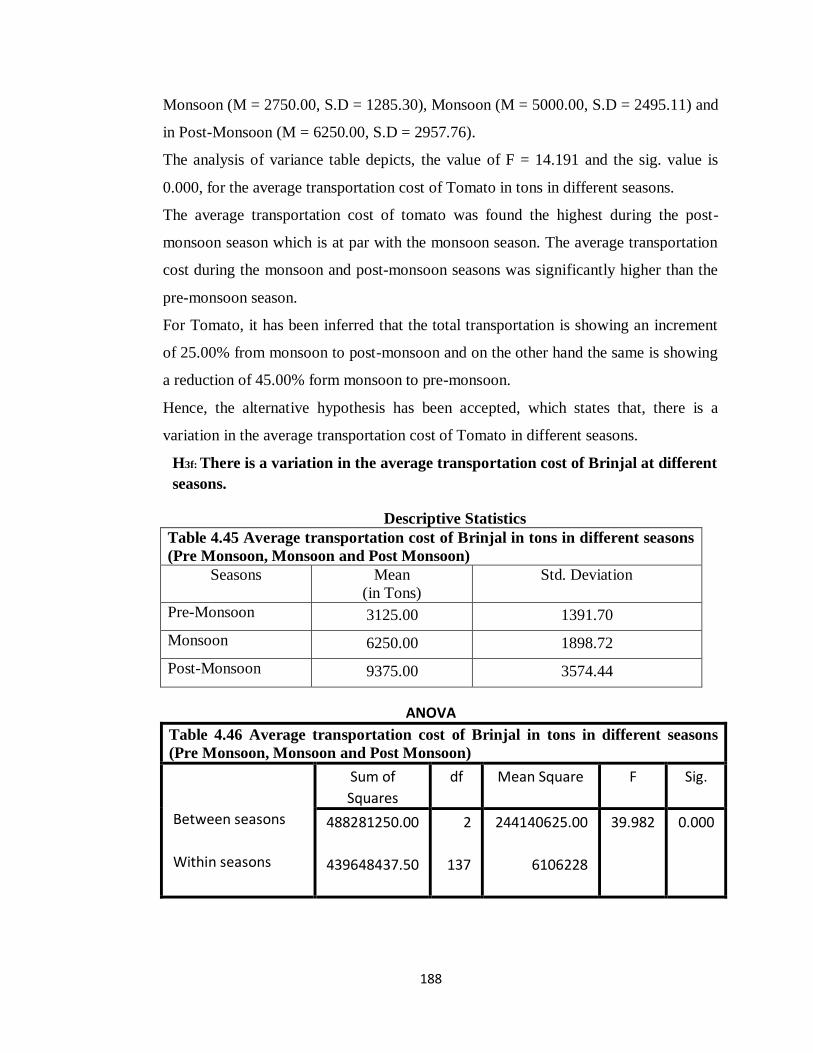
188
Monsoon (M = 2750.00, S.D = 1285.30), Monsoon (M = 5000.00, S.D = 2495.11) and
in Post-Monsoon (M = 6250.00, S.D = 2957.76).
The analysis of variance table depicts, the value of F = 14.191 and the sig. value is
0.000, for the average transportation cost of Tomato in tons in different seasons.
The average transportation cost of tomato was found the highest during the post-
monsoon season which is at par with the monsoon season. The average transportation
cost during the monsoon and post-monsoon seasons was significantly higher than the
pre-monsoon season.
For Tomato, it has been inferred that the total transportation is showing an increment
of 25.00% from monsoon to post-monsoon and on the other hand the same is showing
a reduction of 45.00% form monsoon to pre-monsoon.
Hence, the alternative hypothesis has been accepted, which states that, there is a
variation in the average transportation cost of Tomato in different seasons.
H3f: There is a variation in the average transportation cost of Brinjal at different
seasons.
Descriptive Statistics
Table 4.45 Average transportation cost of Brinjal in tons in different seasons
(Pre Monsoon, Monsoon and Post Monsoon)
Seasons Mean
(in Tons)
Std. Deviation
Pre-Monsoon 3125.00 1391.70
Monsoon 6250.00 1898.72
Post-Monsoon 9375.00 3574.44
ANOVA
Table 4.46 Average transportation cost of Brinjal in tons in different seasons
(Pre Monsoon, Monsoon and Post Monsoon)
Between seasons
Within seasons
Sum of
Squares
df Mean Square F Sig.
488281250.00
439648437.50
2
137
244140625.00
6106228
39.982 0.000

189
Interpretation
The above two table states about the descriptive statistics and analysis of variance of
average transportation cost of Brinjal. From the table it can be understood in Pre-
Monsoon (M = 3125.00, S.D = 1391.70), Monsoon (M = 6250.00, S.D = 1898.72) and
in Post-Monsoon (M = 9375.00, S.D = 3574.44).
The analysis of variance table depicts, the value of F = 39.982 and the sig. value is
0.000, for the average transportation cost of Brinjal in tons in different seasons.
The average transportation cost of Brinjal was found the highest during the post-
monsoon season which is at par with the monsoon season. The average transportation
cost during the monsoon and post-monsoon seasons was significantly higher than the
pre-monsoon season.
For Brinjal, it has been inferred that the total transportation cost is showing an
increment of 50.00% from monsoon to post-monsoon and on the other hand the same
is showing a reduction of 50.00% form monsoon to pre-monsoon.
Hence, the alternative hypothesis has been accepted, which states that, there is a
variation in the average transportation cost of Brinjal in different seasons.
Test for Hypothesis H4: There is a variation in the average packaging cost of
vegetables at different seasons.
H4a: There is a variation in the average packaging cost of Beans at different
seasons.
Descriptive Statistics
Table 4.47 Average packaging cost of Beans in tons in different seasons (Pre
Monsoon, Monsoon and Post Monsoon)
Seasons Mean
(in Tons)
Std. Deviation
Pre-Monsoon 10.80 4.80
Monsoon 54.00 25.85
Post-Monsoon 64.80 30.18

190
ANOVA
Table 4.48 Average packaging cost of Beans in tons in different seasons (Pre
Monsoon, Monsoon and Post Monsoon)
Between seasons
Within seasons
Sum of
Squares
df Mean
Square
F Sig.
40824.00
38462.04
2
137
20412.00
534.195
38.211 0.000
Interpretation
The above two table states about the descriptive statistics and analysis of variance of
average packaging cost of Beans. From the table it can be understood in Pre-Monsoon
(M = 10.80, S.D = 4.80), Monsoon (M = 54.00, S.D = 25.85) and in Post-Monsoon (M
= 64.80, S.D = 30.18).
The analysis of variance table depicts, the value of F = 38.211 and the sig. value is
0.000, for the average packaging cost of Beans in tons in different seasons.
The average packaging cost of Beans was found the highest during the post-monsoon
season which is at par with the monsoon season. The average packaging cost during
the monsoon and post-monsoon seasons was significantly higher than the pre-
monsoon season.
For Beans, it has been inferred that the total packaging cost is showing an increment
of 20.00% from monsoon to post-monsoon and on the other hand the same is showing
a reduction of 80.00% form monsoon to pre-monsoon.
Hence, the alternative hypothesis has been accepted, which states that, there is a
variation in the average packaging cost of Beans in different seasons.
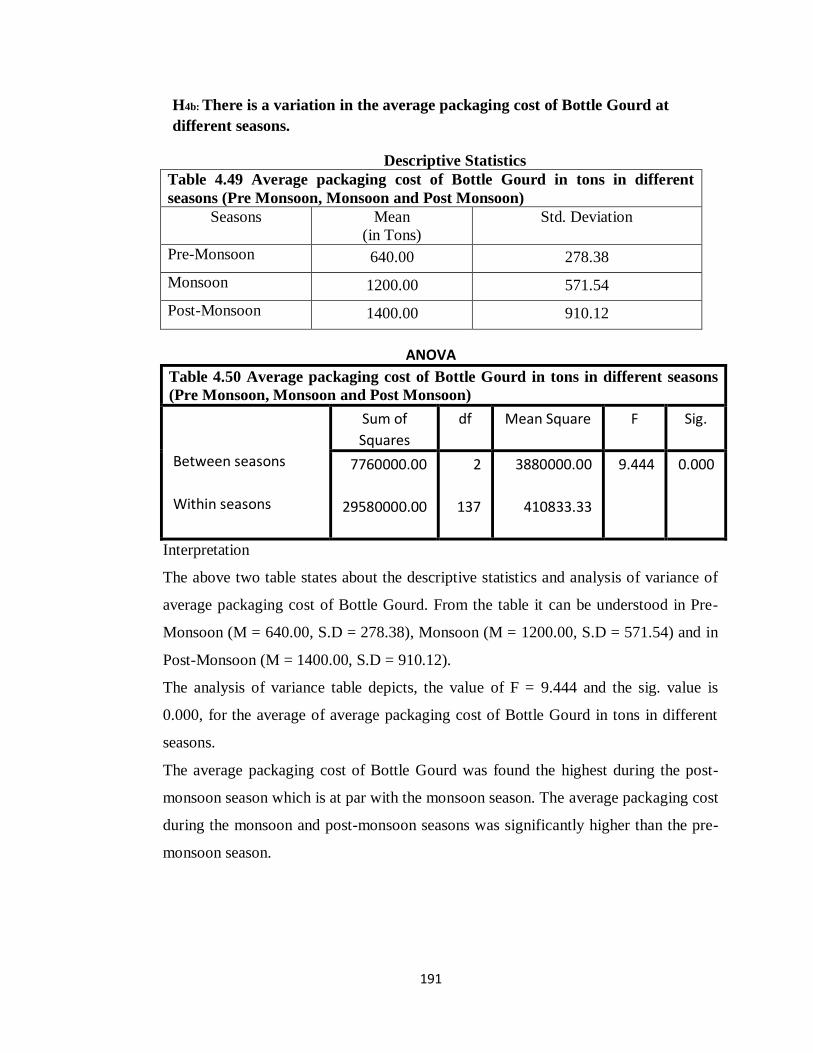
191
H4b: There is a variation in the average packaging cost of Bottle Gourd at
different seasons.
Descriptive Statistics
Table 4.49 Average packaging cost of Bottle Gourd in tons in different
seasons (Pre Monsoon, Monsoon and Post Monsoon)
Seasons Mean
(in Tons)
Std. Deviation
Pre-Monsoon 640.00 278.38
Monsoon 1200.00 571.54
Post-Monsoon 1400.00 910.12
ANOVA
Table 4.50 Average packaging cost of Bottle Gourd in tons in different seasons
(Pre Monsoon, Monsoon and Post Monsoon)
Between seasons
Within seasons
Sum of
Squares
df Mean Square F Sig.
7760000.00
29580000.00
2
137
3880000.00
410833.33
9.444 0.000
Interpretation
The above two table states about the descriptive statistics and analysis of variance of
average packaging cost of Bottle Gourd. From the table it can be understood in Pre-
Monsoon (M = 640.00, S.D = 278.38), Monsoon (M = 1200.00, S.D = 571.54) and in
Post-Monsoon (M = 1400.00, S.D = 910.12).
The analysis of variance table depicts, the value of F = 9.444 and the sig. value is
0.000, for the average of average packaging cost of Bottle Gourd in tons in different
seasons.
The average packaging cost of Bottle Gourd was found the highest during the post-
monsoon season which is at par with the monsoon season. The average packaging cost
during the monsoon and post-monsoon seasons was significantly higher than the pre-
monsoon season.

192
For Bottle Gourd, it has been inferred that the total packaging cost is showing an
increment of 16.66% from monsoon to post-monsoon and on the other hand the same
is showing a reduction of 46.66% form monsoon to pre-monsoon.
Hence, the alternative hypothesis has been accepted, which states that, there is a
variation in the average packaging cost of Bottle Gourd in different seasons.
H4c: There is a variation in the average packaging cost of Tomato at different
seasons.
Descriptive Statistics
Table 4.51 Average packaging cost of Tomato in tons in different seasons
(Pre Monsoon, Monsoon and Post Monsoon)
Seasons Mean
(in Tons)
Std. Deviation
Pre-Monsoon 2200.00 1028.24
Monsoon 4000.00 1996.08
Post-Monsoon 5000.00 2366.21
ANOVA
Table 4.52 Average packaging cost of Tomato in tons in different seasons (Pre
Monsoon, Monsoon and Post Monsoon)
Between seasons
Within seasons
Sum of
Squares
df Mean Square F Sig.
100666666.66
255375000.00
2
137
50333333.33
3546875.00
14.191 0.000
Interpretation
The above two table states about the descriptive statistics and analysis of variance of
average packaging cost of Tomato. From the table it can be understood in Pre-
Monsoon (M = 2200.00, S.D = 1028.24), Monsoon (M = 4000.00, S.D = 1996.08) and
in Post-Monsoon (M = 5000.00, S.D = 2366.21).
The analysis of variance table depicts, the value of F = 14.191 and the sig. value is
0.000, for the average of average packaging cost of Tomato in tons in different
seasons.

193
The average packaging cost of tomato was found the highest during the post-monsoon
season which is at par with the monsoon season. The average packaging cost during
the monsoon and post-monsoon seasons was significantly higher than the pre-
monsoon season.
For Tomato, it has been inferred that the total packaging cost is showing an increment
of 25.00% from monsoon to post-monsoon and on the other hand the same is showing
a reduction of 45.00% form monsoon to pre-monsoon.
Hence, the alternative hypothesis has been accepted, which states that, there is a
variation in the average packaging cost of Tomato in different seasons.
H4d: There is a variation in the average packaging cost of Brinjal at different
seasons.
Descriptive Statistics
Table 4.53 Average packaging cost of Brinjal in tons in different seasons (Pre
Monsoon, Monsoon and Post Monsoon)
Seasons Mean
(in Tons)
Std. Deviation
Pre-Monsoon 150.00 66.80
Monsoon 300.00 91.13
Post-Monsoon 451.80 176.97
ANOVA
Table 4.54 Average packaging cost of Brinjal in tons in different seasons (Pre
Monsoon, Monsoon and Post Monsoon)
Between seasons
Within seasons
Sum of
Squares
df Mean
Square
F Sig.
1138554.00
1058094.00
2
137
569277.00
14695.75
38.738 0.000
Interpretation
The above two table states about the descriptive statistics and analysis of variance of
average packaging cost of Brinjal. From the table it can be understood in Pre-

194
Monsoon (M = 150.00, S.D = 66.80), Monsoon (M = 300.00, S.D = 91.13) and in
Post-Monsoon (M = 451.80, S.D = 176.97).
The analysis of variance table depicts, the value of F = 38.738 and the sig. value is
0.000, for the average of average packaging cost of Brinjal in tons in different seasons.
The average packaging cost of Brinjal was found the highest during the post-monsoon
season which is at par with the monsoon season. The average packaging cost during
the monsoon and post-monsoon seasons was significantly higher than the pre-
monsoon season.
For Brinjal, it has been inferred that the total packaging cost is showing an increment
of 50.60% from monsoon to post-monsoon and on the other hand the same is showing
a reduction of 50.00% form monsoon to pre-monsoon.
Hence, the alternative hypothesis has been accepted, which states that, there is a
variation in the average packaging cost of Brinjal in different seasons.

195
CHAPTER 5
RESULT, DISCUSSION & CONCLUSION

196
MAJOR FINDINGS
Based on the analysis various major findings are made which are listed below.
1. There is variation in production, production cost, transportation cost and packaging
cost among the seasons.
2. The average productivity, average production cost, average transportation cost and
average packaging cost were found the highest for all the vegetables during the post
monsoon season which is at par with the monsoon season
3. The average productivity during the monsoon and post monsoon seasons was
significantly higher than pre-monsoon season.
4. Production of cauliflower, cabbage and tomato is the highest where as the
productivity of brinjal, beans and bottle gourd is found majority of the total area that
is taken into consideration.
5. There is a percentage of variation regarding the total cost of production, selling price
of the farmers and selling price of the organized retailers in two different seasons of
a concerned vegetables.
6. It has been inferred that the total production is showing an increment of 46.16% for
Cauliflower, 36.36% for Cabbage, 20.00% for Beans, 16.66% for Bottle Gourd,
25.00% for Tomato and 50.00% for Brinjal from monsoon to post-monsoon and on
the other hand the same is showing a reduction of 15.38% for Cauliflower, 9.09% for
Cabbage, 80.00% for Beans, 46.66% for Bottle Gourd, 45.00% for Tomato and
50.00% for Brinjal from monsoon to pre-monsoon.
7. It has been inferred that the total production cost is showing an increment of 31.59%
for Cauliflower, 20.33% for Cabbage, 20.84% for Beans, 09.30% for Bottle Gourd,
36.39% for Tomato and 46.66% for Brinjal from monsoon to post-monsoon and on
the other hand the same is showing a reduction of 21.54% for Cauliflower, 06.20%
for Cabbage, 75.65% for Beans, 33.84% for Bottle Gourd, 28.09% for Tomato and
40.18% for Brinjal from monsoon to pre-monsoon.
8. It has been inferred that the total transportation cost is showing an increment of
46.15% for Cauliflower, 09.09% for Cabbage, 20.00% for Beans, 16.66% for Bottle
Gourd, 25.00% for Tomato and 50.00% for Brinjal from monsoon to post-monsoon

197
and on the other hand the same is showing a reduction of 15.38% for Cauliflower,
36.36% for Cabbage, 80.00% for Beans, 87.5% for Bottle Gourd, 45.00% for
Tomato and 50.00% for Brinjal from monsoon to pre-monsoon.
9. It has been inferred that the total packaging cost is showing an increment of 20.00%
for Beans, 16.66% for Bottle Gourd, 25.00% for Tomato and 50.60% for Brinjal
from monsoon to post-monsoon and on the other hand the same is showing a
reduction of 80.00% for Beans, 46.66% for Bottle Gourd, 45.00% for Tomato and
50.00% for Brinjal from monsoon to pre-monsoon.
OBSERVATION ON THE BASIS OF RESEARCH SURVEY
Based on the research survey various major observation was observed during the time
period which are listed below.
1. Major source of irrigation is tube well due to which the price of the vegetables rises.
2. Maximum vegetables are available in winter season.
3. Cabbage, tomato and cauliflower are the highly demanded vegetables in the Ranchi
area.
4. Post harvest losses of cabbage and cauliflower are highest @13% among the six
selected vegetables.
5. Vegetables grower avails a profit of Rs. 0.90 at the major vegetables cultivated at the
adjoining area of Ranchi.
6. Vegetables grower avail least profit of at the cauliflower and cabbage.
7. Loss percentages of vegetables at retail store are around 11.2%.
8. Absence of central processing center(CPC)
9. Non-availability of storage facilities for short term storage.
10. The intermediaries are the constraint regarding the variation of the price of the
vegetables.
11. Falling water levels and lack of irrigation facilities make the farmers in problems
12. Lack of market knowledge and marketing skills among the farmers
13. Expensive credit and Controlled prices
14. Poor infrastructure
15. Many intermediaries who increase cost, but do not add much value
198
SUGESSTIONS ON THE BASIS OF RESEARCH SURVEY
From the present study following suggestion is made for the development of this sector
since it contributes a lot to the Indian economy.
1. Farmers may avoid the pre-harvest contractors and local traders since the farmers
realized the least price
2. To prevent the post harvest loss there is a need for training in post harvest handling
of the vegetables to the farmers and intermediaries
3. The government should train the farmer and provide some scientific production
approach.
4. The marketing board should increase the storage system and inventory system.
5. The Jharkhand state agriculture marketing board hires some technical and skilled
manpower at every region.
6. The Jharkhand state agriculture marketing board should focus on the export
orientation of green vegetables.
7. Education facilities may be provided on priority basis in order to broaden their
outward horizon.
8. Farmers must have the knowledge of market information, for taking better sales
decision.
9. Development of infrastructure, including roads and efficient transport facilities and
strengthening of the cooperative marketing institutions for the vegetables may help
in improving the efficiency of vegetable marketing in the state.
199
CONCLUSION
Marketing of vegetables is a complex phenomenon due to their perishable nature,
seasonality and bulkiness. It is further compounded by the fact, that farmers have small
areas under their cultivation and small marketable quantity. The production and post-
harvest losses are higher and as such vegetables require a developed marketing system
for their quick disposal. It has also been observed that as the number of intermediaries‘
increases, the producer‘s share in consumer price decreases. The net price received by the
producers is higher in the channel where they sell the produce directly to the consumers
or retailers. The producers have been found to receive higher absolute net returns in
tomato, followed by Cauliflower, cabbage, brinjal, and local bean in all the channels.
There is a major price gap in price of some selected vegetables. There is a maximum
price gap regarding tomato, brinjal, beans and bottle gourd. The farmers do not get
appropriate value for their produce vegetables. Due to lack of storage they can‘t be able
to hold back these vegetables with them for a long period of time after the cultivation
because of its perishability in nature, so they have to sell within a particular period of
time at the intermediary‘s price. The result the farmer does not get proper value and
intermediaries like mahajans earn more than the farmers. These intermediaries also play a
vital role in fixing the price of the vegetables and sell in the market or to the retailers as
their convenient.
There is a variation in price and quantity of different vegetables i.e. Cauliflower,
Cabbage, Beans, Bottle Gourd, Brinjal and Tomato at different seasons regarding the
average productivity, average production cost, average transportation cost and average
packaging cost. The average productivity, average production cost, average transportation
cost and average packaging cost were found the highest for all the vegetables during the
post monsoon season which is at par with the monsoon season. The average productivity
during the monsoon and post monsoon seasons was significantly higher than pre
monsoon season. There is a percentage of variation in total cost of production, selling
price of farmers and selling price of the organized retailers in two different seasons.
200
SCOPE OF FUTURE RESEARCH
Considering the country India, still a more agrarian society, it has lot of future scope
to contribute to the development and growth of our country from Rural to Urban
society. The following future study can be done:
The research was mainly confined to Ranchi district, so this study can be explored in
other locations or different states of the country.
During the research it was found that the large quantity of vegetables is sold through
unorganized retails. Therefore a separate study can be done on the price variation of
vegetables with respect to unorganized retails.
The survey can be conducted by increasing sample size of all categories in other
regions of the state and country where most of the farmers and retailers can be
entertained.
The research framework, which has been used in the research, can be used for
research in other countries or states with similar socio-economic conditions.
RESEARCH CONTRIBUTION
In this study six vegetables are considered to find out the price variation from farmers to
consumer through different intermediaries like middle men, wholesaler, and organized
retailers, especially the organized retailers. In this context it is important to examine the
actual cost of production, total land for cultivation, the various agricultural inputs and the
selling price of the vegetables from the farmers end and on the other side numbers of
intermediaries that exist in the process of supply chain and marketing of vegetables
through which the retails get in touch for procuring of these vegetables.
Also, it was said the farmers get a less price for their vegetables as compared to the haats
and mandi. The various areas were considered so that the actual value of the product can
be identified and the price variation of the concerned vegetables can be identified in
different seasons.

201
LIMITATIONS
Limitations of this research are as follows:
The research study is limited to those respondents related only to selected vegetables
and the farmers who owe around four acres of land. The other types of vegetables
and farmers are not being studied in this research work.
The study is limited to only Ranchi and its adjoining area like Brambe, Murma, and
Thakurgoan only. The other parts of Ranchi are not being studied.
The awareness about proper cultivation, marketing and supply chain of vegetables
was not there among the farmers.
Only organized retail is considered instead of complete unorganized retail and major
haats or bazaar.
The study limited to data collection over a period from December 2016 to January
2018
The responses from the respondents can be biased and as a result some findings can
be incorrect.

202
References
1. Adeoye, IB, Odeleye, OMO, Babalola, SO and Afolayan, SO (2009). ―Economic
Analysis Of Tomato Losses In Ibadan Metropolis‖, Oyo State, Nigeria. African
Journal of Basic & Appl. Science, Vol. 1, pp. 87-92. .
2. Ajayi, M. and Nawalieji, (2010) ―Production and Marketing of Vegetable‖, Indian
Journal of Agricultural Marketing, Vol. 15, No. 3, pp. 34-38.
3. Ajit Bhalla, Chinyamata Chipeta, Haile Taye and Mjedo Mkandawire, (2005)
―Globalization And Sustainable Human Development: Progress And Challenges
For Malawi‖, United Nations Conference On Trade And Development United
Nations Development Programme, pp 33.
4. Alam, G. and Verma, (2014) ―Changes in Traditional Agriculture Ecosystem in
Rawain Valley of Uttarakhand State in India‖, Ecology and Environmental
Sciences, Vol. 2, No. 4, pp.90-93.
5. Albala, Ken. (2007) Beans: A History. New York: Berg, pp.3.
6. Allen, G. R, (1972) ―An Appraisal of Contract Farming‖. Journal of Agricultural
Economics, Vol. 23, No. 2, pp. 89-98.
7. Vijay Kumar, (2015), "An Analytical Study Of WTO On The Indian Agriculture
Sector", Ph.D Thesis, Lucknow University, page no. 15-18.
8. Anderson R.L. (1968), ―A Simulation Programme to Establish Optimum Crop
Pattern in Irrigated Farms Raised on Pre-Season Estimation of Water Supply‖,
American Journal of Agricultural Economics, Vol. 50, No. 5, pp.15. .
9. Anil Kumar, Dr. G.S. Kushwaha,Food (2014) ―Supply Chain Management
Sustainability: A Review‖, Research Journal Of Science And It Management,
Vol. 03, no. 10, pp. 30-40.
10. Ankita Suvasmita, (2016 ) ―Marketing Analysis Of Vegetables In Khorda District
Under Octmp‖, Orissa University of Agriculture and Technology, Bhubaneswar, ,
pp. 4-15.
11. Anu Rahal, Mahima , Amit Kumar Verma, Amit Kumar , Ruchi
Tiwari , Sanjay Kapoor , Sandip Chakraborty andKuldeep Dhama(2014),
“Phytonutrients and Nutraceuticals in Vegetables and Their Mult i-
203
dimensional Medicinal and Health Benefits for Humans and Their
Companion Animals: A Review‖ Journal of Biological Science, Vol. 1,
pp. 1-19
12. Anonymous, (2006). Postharvest Management of Fruit and Vegetables in the
Asia-Pacific Region. Asian Productivity Organization, Japan. ISBN: 92-833-
7051-1. .
13. Ashworth, Suzanne. (2002) Seed to Seed: Seed Saving and Growing Techniques
for Vegetable Gardeners. New York: Seed Savers Exchange Inc. pp. 14.
14. Babalola, D. A., T., O. B., Oyekanmi, M. O., & O, M. Y. (2010). ―Determinants
Of Post Harvest Losses In Tomato Production: A Case Study Of Imeko – Afon
Local Government Area Of Ogun State‖, Acta SATECH-Journal of Life and
Physical Sciences, Vol. 3, No.1
15. A, Rasi M & Sheoran (2015), Scope of Supply Chain Management In Fruit And
Vegetables, Journal Of Food Processing & Technology, Vol. 6, Issue. 3, pp.1-7
16. Babalola, D. A., T., O. B., Oyekanmi, M. O., & O, M. Y. (2010). ―Determinants
Of Post Harvest Losses In Tomato Production: A Case Study Of Imeko – Afon
Local Government Area Of Ogun State‖, Acta Satech-Journal Of Life And
Physical Sciences, Vol. 7, No.3
17. Babalola, D. A., T., O. B., Oyekanmi, M. O., & O, M. Y. (2010). ―Determinants
of Post Harvest Losses In Tomato Production: A Case Study Of Imeko – Afon
Local Government Area Of Ogun State‖. Acta SATECH-Journal of Life and
Physical Sciences, Vol. 3, No.1
18. Bachmann, J. and Earles, R. (2000). ―Postharvest Handling Of Fruits And
Vegetables. Appropriate Technology Transfer for Rural Areas‖. NCAT
Agriculture Specialists. pp. 1-19. .
19. Bailey, W. C. (2001) ―Applying SCOR in a Vertical Industry Food and
Agriculture.‖ World Supply Chain Council Annual Meeting. Chair in
Agribusiness, Palmerston North, New Zeland. .

204
20. Balakrishnan J., and Cheng, C. H., (2005) ―The Theory Of Constraints And The
Make-Or-Buy Decision: An Update And Review‖, The Journal of Supply Chain
Management, Vol. 41, No. 1, pp. 40-47.
21. Bandenhop M.P. and Cashdoller P.P. (1974) ―Land Water Use Potentials,
Thungabhadara Irrigation Project‖, Karnataka, University of Agricultural Science,
Technical Series No.4, pp.1-38.
22. Basran, G. and Copener, S.S., (1968) ―Factors Related To The Acceptance Of
New Ideas And Techniques In Farming‖, Indian Journal of Extension Education,
Vol. 4, No. 1&2, pp. 29.
23. Basu, Priya, Improving Acess To Finance For India's Rural Poor, The World
Bank Washington, D.C., 1966.
24. Behra, C.S. and Sahoo, M.S., (1975) ―Impact National Demonstration on
Adoption of Agricultural Practices‖, Indian Journal of Extension Education, Vol.
11, No. 1&2, pp. 32-35.
25. Behra, C.S. and Sahoo, M.S., (1975) ―Impact of National Demonstration on
Adoption of Agricultural Practices‖, Indian Journal of Extension Education, Vol.
11 No. 1&2, pp. 32-35.
26. Ben-Daya M.,Hariga M. and Khursheed S. N., (2008) ―Economic Production
Quantity Model With A Shifting Production Rate‖ International Transactions in
Operational Research, Vol. 15, No. 1, pp 87-101.
27. Bhogle, S.K., (1971) ―Factors Affecting Adoption Of New Farm Practices‖,
Kurukshetra, Vol. 19, No. 11, pp. 8-9.
28. Bhople, R.S. and Borker, R.D., (2002) ―Bio Fertilizers Farmers Attitude And
Adoption‖, Agricultural Extension Review, pp. 18-21.
29. Bhople, R.S. and Borker, R.D., (2002) ―Bio Fertilizers Farmers Attitude And
Adoption‖, Agricultural Extension Review, pp. 36-41.
30. Bhosale, J. (2013). Emerson Climate Technologies India, A Business Of The Us-
Based Manufacturing And Technology Company Emerson. ET Bureau,
28thNovember, 02:53 PM, IST.

205
31. Bodake, H.D., Gaikwad, S.P. and Shirke, V.S, (2007) ―Study Of Constraints
Faced By The Farmers In Adoption Of Biofertilizers‖ Asian Journal of Extension
Education, Vol. 27, pp. 61-63.
32. Boehlje, M.& Doering, O., (2000) ―Farm Policy In An Industrialized
Agriculture‖. Journal of Agribusiness, Vol.18, No. 1, pp. 53-60.
33. Bonnen, J.T. & Schweikhardt, D.B., (1998) ―The Future Of Us Agricultural
Policy: Reflections On The Disappearance Of The Farm Problem‖. Review of
Agricultural Economics, Vol. 20, No. 1 , pp. 2-36.
34. Borude, H.P., ―Fertilization, Utilization Pattern Of Sugarcane Growers‖ M. Sc.
(Agriculture), Thesis (Unpublished), Dr. P.D.K.V., Akola. 1998.
35. Brithal, P. S., Joshi, P. K., & Gulati, A. (2005) ―Vertical Coordination In High –
Value Food Commodities: Implications For Small Holders‖. MTID Discussion
Paper No. 85, Washington DC, USA: International Food Policy Research Institute
(IFPRI).
36. Buyukbay, E. O., Uzunoz, M. and Bal, H. S. G., (2011) ―Post-Harvest Losses In
Tomato And Fresh Bean Production In Tokai Province Of Turkey‖ .Scientific
Research and Essays. Vol. 6, No. 7, pp. 1656-1666.
37. Buzby, J. C. and Hyman, J. (2012). ―Total and Per Capita Value Of Food Loss In
The United States‖. Food Policy, Vol. 37, No. 5, pp. 561-570.
38. C Gasche, M C E Lomer, I Cavill, and G Weiss, (2004), ― Iron Anaemia And
Inflammatory Bowel Diseases‖ Bmj Publishing Group, Volume 53, issue 8, pp.
1190-1197.
39. Chechani, V.K. and Dr. Gupta, H.C.L. (2003) ―Major Pests Of Vegetables And
Their Management‖, Intensive Agriculture, Vol. 1, pp. 9-12.
40. Chopra S. and Meindl's (2001) Book, Supply Chain Management: Strategy,
Planning, and Operation, Prentice Hall of India.
41. Choudhary A.K. and Singh Madan, (1999) ―Fertilizer Adoption Behaviour of
Contact and Non contact Farmers.‖ Journal of Research (B.A.U.), Vol. 11, No. 1,
pp. 59-61.
206
42. Christopher M. (1998), Logistics & Supply Chain Management: Strategies for
Reducing Costs and Improving Services, Pitman Publishing, and London.
43. Cooper M. C. and L. M. Ellram. , (1993) ―Characteristics of Supply Chain
Management and the Implications for Purchasing and Logistics Strategy,
"International Journal of Logistics Management, Vol. 4, No. 2, pp. 13-24.
44. Cramer, G. L. & Jensen, C. W. (1988), "Agricultural Economics and
Agribusiness", Fourth Edition. John Wiley and Sons, Inc.
45. Croom S., Romano P, and Giannakis M., (2000) ―Supply Chain Management: an
Analytical Framework for Critical Literature Review, "European Journal of
Purchasing and Supply Management, Vol. 6, No. 1, pp. 67-83.
46. Dr. Dhanabalan. M. (2009), ―Productive Efficiency of Milk Production In Tamil
Nadu‖, Indian Journal of Marketing, Volume 39, No. 12, pp-21.
47. Deepak et al , (2017)―A Study To Differentiate The Nitrogen Fixing And
Microcystin Producing Cyanobacteria By Tlc Profiling.‖ International Journal Of
Scientific Research, Vol. 6, No. 6 , pp. 1-2.
48. Deepak Kumar Gautam and GC Yadav, (2017) ―Gene Action For Growth, Yield
And Quality Traits In Bottle Gourd [Lagenaria Siceraria (Mol.) Standl]‖, Journal
of Pharmacognosy and Phytochemistry, Vol. 6, No. 4, pp. 84-88.
49. Douglas E. Hughes, Avinash M Alshe, Joel Le Bon, (2012) ―The Marketing–
Sales Interface at the Interface: Creating Market-Based Capabilities through
Organizational Synergy‖, Journal of Personal Selling & Sales Management, Vol.
32, No. 1, pp. 57–72.
50. Dudhate, D.G. and Wangikar, S.D., (2003) ―Constraints Faced By Farmers In
Adoption Of Brinjal Production Technology‖, Agricultural Extension Review, pp.
30-31.
51. Egharevaba, R.K.A. (1995). ―Physiology Of Fruits And Vegetables‖. Journal of
Tropical Postharvest, Vol. 2, pp. 51-73. .
52. Ernst & Young. The Great Indian Retail Story, Ernst & Young's report, April,
2006.

207
53. Faure, G., Maitre d‘Hotel, E., Le Coq, J. F., Saenz, F, (2007) ―Can supply chain‘s
Coordination Mechanisms Include Small Holders? Insight From An Empirical
Work in Costa Rica‖, Paper Presented at the 106th Seminar of the EAAE. Pro-
poor Development in .
54. Food Routes Network., (2007) ―Plant Your Dollars Close To Home And Watch
Your Community Grows‖. Retrieved June 4, 2007, from
http://www.foodroutes.org/whycare3.jsp, 2008.
55. Frank, S. D. & D. R. Henderson. (1992) ―Transaction Costs as Determinants of
Vertical Coordination in the US Food Industries‖, American Journal of
Agricultural Economics, Vol. 74, pp. 941-950.
56. G. K. Sujayanand, R. K. Sharma, K. Shankarganesh, Supradip Saha and R. S.
Tomar, (2015) ―Crop Diversification For Sustainable Insect Pest Management In
Eggplant (Solanales: Solanaceae)‖, Florida Entomologist, Vol. 98, No. 1, pp. 305-
314.
57. Gadgil D.R. (1954), ―The Industrial Evolution of India in Recent Times‖,
Calcutta: Oxford University Press, pp. 128-133.
58. Ganesh Iyer, J. Miguel Villas-Boas, (2003) ―A Bargaining Theory of Distribution
Channels‖. Journal of Marketing Research, Vol. 40, No. 1, pp. 80-100.
59. Ganeshan, R, and Harrison Terry P., (1995) ―An. Introduction to Supply Chain
Management,‖ Department of. Management Sciences and Information Systems.
60. Ganeshan, R, and Harrison Terry P., (1995) ―An. Introduction to Supply Chain
Management,‖ Department of. Management Sciences and Information Systems.
61. Ganpat Lal Yadav,(2014), ―Effect of Nitrogen and Bio-organics on Growth, Yield
and Quality of okra [Abelmoschus esculentus(L.) Moench]‖, PhD. Thesis, Sri
Karan Narendra Agriculture University, Jobner.
62. Garnett, Tara. Wise Moves, (2003): Exploring the relationship between food,
transport and CO2. London: Transport 2000 Trust.
63. Ghosh G.K. and Sarkar A.K. (1994) ―Availability Of Sulfur And Some Micro
Nutrients In Acidic Sedentary Soils Of Chotanagpur Region‖. Journal of Indian
Social Science, Vol. 42, pp. 464.

208
64. Giancarlo Moschini, Luisa Menapace and Daniel Pick, (2008) ―Geographical
Indications and the Competitive Provision of Quality in Agricultural Markets‖,
American Journal of Agricultural Economics, Vol. 90, No. 3, pp. 794–812.
65. Gunasekarana, A., Ngai E. W. T., (2005) ―Build-to-Order Supply Chain
Management: Literature Review and Framework for Development‖ Journal of
Operations Management, Vol. 23, No. 5, pp. 423-451.
66. Gupta, A. K., & Ram, G. S. (1981) ―Price Spread Behavior Of Vegetables In
Delhi‖, Agriculture Situation in India, Vol. 36 , No. 7, pp.557-559.
67. Gupta, H.C., Singh, J. and Kathuria, O.P. (2000). ―Methodological Investigation
on Postharvest Losses‖, Journal of Indian Society Agriculture Statistics, Vol. 53,
No. 2, pp. 161-171.
68. Halder, P., and Pati, S., (2011) ―A Need for Paradigm Shift to Improve Supply
Chain Management of Fruits and Vegetables in India‖, Asian Journal Agriculture
Rural Development, Vol. 1, No. 1 , pp. 1-20.
69. Handfield R. B. and Nichols E. L., (1999) ―Introduction to Supply Chain
Management‖, Prentice-Hall, New Jersey, pp. 1-83.
70. Hazarika, T.K. and Phookan, B.D. (2005) ―Performance of Tomato Cultivars For
Poly House Cultivation During Spring Summer In Asam‖, Indian Journal of
Horticulture, Vol. 62, No. 3, pp. 268-271.
71. Hill, Holly, ―Food Miles: Background and Marketing‖. Retrieved September 19,
2008, from http://www.attra.ncat.org/attra-pub/PDF/foodmiles.pdf.
72. Hodges, R.J., Buzby, J.C. and Bennett, B. (2011). ―Postharvest Losses And Waste
In Developed And Less Developed Countries: Opportunities To Improve
Resource Use‖. Journal of Agricultural Science, Vol. 149, pp. 37-45. .
73. Ilic, Z., Fallik, E. and Dardic, M. (2009). Harvest, Sorting, Packaging and Storage
of Vegetables. Agriculturae Conspectus Scientificus, Vol. 77, No. 1, pp. 1-4.
74. Indian Brand and Equity Foundation (IBEF),Retrieved October 1, 2008 from
www.ibef.org.

209
75. Islam. S., Goswami. A. and Mazumdar. D. (2008),―Comparative Profitability of
Cross Breed and Indigenous Cattle in West Bengal‖ Indian Res. J. Ext. Edu, Vol.
8, No.1, pp- 28-30.
76. Jahagirdhar A.K. and Sundaraswamy B. (2002), ―Adoption Of Recommended
Practices Of Tomato Cultivation‖, Agricultural Extension Review, May-June,
Vol. 14, No. 3, pp. 12-16.
77. Jacob, Paulrajan Rajkumar & Fatima(2010). Business Models of Vegetables
Retailers in India. Great Lakes Herald, 4 (1), 36-41
78. Jain, N. (2007). International Conference on Agribusiness and Food Industry in
Developing Countries : Opportunities and Challenges. Retrieved February 19,
2013, from IIM Lucknow: http://www.iiml.ac.in/events/Program.html.
79. Jain, S. K. & De Filipps, R. A.,(1991) Medicinal Plants of India. 1–2. ‐ Reference
publication, Inc. Michigan, pp. 849 .
80. Jaiswal, N.K. (1965) ―A Study Of Factors Associated With Low Level Of
Improved Practices‖, Ph.D. Thesis, Division of Agricultural Extension, IARI,
New Delhi.
81. Jemal Haidar, (2010) ―Prevalence of Anaemia, Deficiencies of Iron and Folic Acid
and Their Determinants in Ethiopian Women‖ Journal of Health, Population and
Nutrition, Vol. 28, issue 4, pp. 359-368.
82. Jha, A.K. and Dubey, S.C. (2000) ―Occurrence Of Collar Rot Of Okra
(Abelmoschus esculentus) In The Plateau Region of Bihar‖, Journal of Research
(BAU), Vol. 12, No. 1, pp. 67-72.
83. Jha, A.K., Dubey, S.C. and Jha, D.K. (2000) ―Evaluation of Different Leaf
Extracts And Oil Cakes Against Macrophomina Phaseolina Causing Collar Rot
Of Okra‖, Journal of Research (BAU), Vol. 12, No. 2, pp. 225-228.
84. Johann Kirsten & Kurt Sartorius, (2002) ―Linking Agribusiness And Small-Scale
Farmers In Developing Countries: is There A New Role For Contract Farming?‖,
Development Southern Africa, Vol. 19, No. 4, pp.1-26.

210
85. Jones, C.S., Holt, J.E. and Schoorl, D. (1991). ―A Model To Predict Damage To
Horticultural Produce During Transport‖. Journal of Agriculture Engineering
Research, Vol. 50, pp. 259-72. .
86. Joon, S. and Singh, K.N., (1969) ―High Yielding Varieties Acceptance By
Farmers‖, Kurukshetra, Vol. 18, No. 3, pp.26.
87. K.P. Mangala and P.G. Chengappa, (2008) ―A Novel Agribusiness Model For
Backward Linkages With Farmers: A Case Of Food Retail Chain‖, Agricultural
Economics Research Review, Vol. 21, No. 8, pp. 1-8.
88. Kader, A.A. and Rolle, R.S. (2004). The Role of Postharvest Management in
Assuring the Quality and Safety Horticultural Crops. Food and Agriculture
Organization. Agricultural Services Bulletin, pp. 152: 52. .
89. Kajale, S. S. (2008) Government Intervention in Horticulture Development – The
Case of Maharashtra, Indian Journal of Agriculture Economy, No. 3, pp. 322-331.
, Ed. pp. 322-331.
90. Kalaitzis, P., Van Dijk, G. & Baourakis, G. Euro-Mediterranean Supply Chain
Developments And Trends In Trade Structures, In The Fresh Fruit And Vegetable
Sector. Paper presented at the Mediterranean Conference of Agro-Food Social
Scientists. 103rd EAA.
91. Kalidas K, Jiji S, Sureka M, (2014) ―Supply Chain Management in Vegetables‖,
Paripex. Indian Journal of Research Vol. 3, pp. 315-316.
92. Kalita, M.K. and Dhawan, P. (2006) ―Management of Yellow Vein Mosaic And
Leaf Curl Disease Of Okra By Adjusting Date Of Sowing And Row To Row
Spacing‖, Indian Journal of Agricultural Science, Vol. 76 No. 12, pp. 762-765.
93. Kanaujia, S.P. and Narayan, R., (2003) ―Bio Fertilizers For Sustainable Vegetable
Production‖, Intensive Agriculture, pp. 15-19.
94. Kandiwa, V. (1999) ―Economic Performance Of Smallholder Farmers Using
Alternative Vertical Coordination Mechanisms For Horticultural Crops‖, MS
thesis, Department of Agricultural Economics. Cornell: Cornell University.
95. Kantor, L.S., Lipton, K., Manchester, A., and Oliveira, V. (1997). Estimating and
addressing America‘s food losses. Food Review, Vol. 20, pp. 3-11.

211
96. Kathryn A. Onken, (2010)―willingness to pay for locally grown, organic and
natural foods: implications for producers and state-sponsored agricultural
marketing programs‖, PhD Thesis, University of Delaware, pp. 14-20.
97. Kathryn A. Onken, John C. Bernard, (2011) ―Comparing Willingness to Pay for
Organic, Natural, Locally Grown, and State Marketing Program Promoted Foods
in the Mid-Atlantic Region‖. Agricultural and Resource Economics Review, Vol.
40, No.1, pp. 33–47 .
98. Kiple, Kenneth F. and Kriemhild Conee Omelas. (2000) The Cambridge World
History of Food. Cambridge, UK: Cambridge University Press. pp. 23.
99. Kishor Kumar, D. Basavaraja, H. and Mahajanshetti, S.B. (2006) ―An Economic
Analysis of Post Harvest Losses in Vegetables in Karnataka‖, Indian Journal of
Agricultural Economics, Vol. 61, No. 1, pp. 134-146.
100. Kitinoja, L., Saran, S., Roy, S.K. and Kaderc, A.A. (2011). ―Post Harvest
Technology For Developing Countries: Challenges And Opportunities In
Research, Outreach And Advocacy‖. Journal of Food Science and Agriculture,
Vol. 91, pp. 597–603. .
101. Kledal, P. R. & Sulitang, T, (2007) ―The Organization Of Organic Vegetable
Supply Chains In China: Flexible Property Rights And Different Regimes Of
Small Holder Inclusion‖, EAAE Pro-poor Development In Low Income
Countries: Food,-54-Agriculture Trade.
102. Kotur S.L. and Kumar S. (1976) ―Effect of Molybdenum On Cauliflower.‖ South
Indian Horticulture, Vol. 24, No. 4, pp. 145.
103. Krishnamurthy, A.T., Sanathkumar, V.B. and Basvaraju, (2007) ―A Study On
Awareness Of Soil And Water Testing And Adoption Level Of Dry Land, pp. 2.
104. Kumar, M.P, (2012) ―A Study On Problems Of Marketing Vegetables In
Farmers Market‖. International Journal Rural Development Management Studies
Vol. 6. No. 1, pp. 241-251.
105. Lee Hau L., and Corey Billington, (1995) ―The Evolution of Supply-Chain-
Management Models and Practice at Hewlett-Packard. Interfaces‖, Vol. 25, pp.
42-63.

212
106. Lee Hau L., and Corey Billington, (1995) ―The Evolution of Supply-Chain-
Management Models and Practice at Hewlett-Packard. Interfaces‖, Vol. 25, pp.
42-63.
107. Lee, S.K. and Kader, A. A. (2000). ―Pre Harvest And Postharvest Factors
Influencing Vitamin C Content Of Horticultural Crops‖. Postharvest Biology and
Technology, Vol. 20, pp. 207–220.
108. Lowder, A. C. (2018), Social Protection And Agriculture: Introduction to the
Special No., Global Food Security,. Vol. 1, pp. 65-68.
109. M Raja Krishna Murthy, GP Reddy, KH Rao, (2012) ―Estimating Market
Efficiency & Price Mechanism In Retailing Of Fresh Vegetables In Andhra
Pradesh‖. Radix International Journal Of Research In Marketing, Vol. 1, No. 11,
pp. 1-2.
110. M. Lalitha. V. Kasthuri Thilagam, N. Balakrishnan and Mostafa Mansour,
(2010) ―Effect of Plastic Mulch On Soil Properties And Crop Growth – A
Review‖, Agriculture Review, Agricultural Research Communication Centre,
Vol. 31, No. 2, pp. 145 – 149.
111. M.S. Jairath, (2008) ―Trends in Private and Public Investments in Agricultural
Marketing Infrastructure in India‖, Agricultural Economics Research Review,
Vol. 21, pp. 371-376.
112. Malay K. Bhowmick, Madhab C. Dhara, Sudhanshu Singh, Manzoor H. Dar,
Uma S. Singh, (2014) ―Improved Management Options for Submergence-
Tolerant Rice Genotype in Flood-Prone Rainfed Lowlands of West Bengal‖,
American Journal of Plant Sciences
113. Mandeep Singh and Joshi. A.S. (2008), ―Economic Analysis of Crop Production
and Dairy Farming on Marginal and Small Farms in Punjab‖ Agricultural
Economics Research Review, Vol. 21, No.2, pp-30.
114. Martin, S. & Jagadish, A. (2006) ―Agricultural Marketing And Agribusiness
Supply Chain No.s in Developing Economies: The Case Of Fresh Produce in
Papua New Guinea.‖ Paper Presented at the New Zealand Agricultural and
Resource Economics Society Confere.
213
115. Meena, K.C. and Dr. Babel, K.S., (2003) ―Information Source Used By The
Cabbage Growers‖, Agricultural Extension Review, pp. 15-19.
116. Mena, C., Adenso-Diaz, B., & Yurt, O. (2011). ―The Causes Of Food Waste In
The Supplier-Retailer Interface: Evidences from the UK and Spain. Resources,
Conservation and Recycling‖, Vol. 55, No. 6, pp. 648-658. .
117. Mentzer J. T. , DeWitt V, Keebler K. S., Min S., Nix N. W. and Smith. C. D,
(2001) ―Defining Supply Chain Management, ―Journal of Business Logistics,
Vol. 22, No.2.
118. Mentzer J. T. , DeWitt V, Keebler K. S., Min S., Nix N. W. and Smith. C. D,
(2001) ―Defining Supply Chain Management, ―Journal of Business Logistics,
Vol. 22, No.2 .
119. Michael Boehlje, Steven L Hofing, R Christopher Schroeder, (1999) ―Value
Chains In The Agricultural Industries―, Department of Agricultural Economics
Purdue University, Agriculture Education & Consulting, LLC, pp. 5-22.
120. Michael G. Jacobides, ―Industry Change Through Vertical Dis-integration: How
And Why Markets Emerged‖, Academy of Management Journal, Vol.3, pp.79-
86.
121. Milczarek-Andrzejewska, D, Malak-Rawlikowska, A., Falkowski, J., & Wilkin,
J. (2008) ―Supply Chain Restructuring And Its Impact On Famers‘ Income- The
Evidence From The Dairy Sector In Poland‖. Paper Presented at the 12th EAAE
Congress
122. Ministry of Commerce And Industry, Department Of Commerce Government Of
India, http://commerce.gov.in/InnerContent.aspx?Id=83.
123. Modalia, V.K. and Jajwadi, R.B., (1976) ―Adoption of Agricultural Innovations
–A study‖, Kurukshetra, Vol. 24, No. 10, pp.14-15.
124. Moorthi T.V. and Mellor W.J. (1972), ―Cropping Pattern Yields and Income
under Different Sources of Irrigation with Special Reference to IADP, Aligarh
District, Uttar Pradesh‖, Indian Journal of Agricultural Economics, Vol. 27, No.
4, pp.117-125.
214
125. Murthy, D. S., Gajanana, T. M., Sudha, M., & Dakshinamoorthy, V. (2009).
―Marketing and Post harvest Losses In Fruits: Its Implications on Availability
and Economy‖. Indian Journal of Agricultural economics, Vol. 64, No. 2, pp.
259-275. .
126. N. G. Tzortzakis, (2009) ―Effect of Pre-sowing Treatment On Seed Germination
And Seedling Vigour In Endive And Chicory‖, Horticulture Science, (Prague),
Vol. 36, No. 3, pp. 117–125.
127. Nagarajan M. and So i G., (2004) ―Stable Far Sighted Coalitions in Competitive
Markets‖ Management Science, Vol. 53, No. 1, pp. 29-45.
128. Nanak Kakwani, Hyun Hwa Son, (2017), ―Social Welfare Foundations And
Development‖, Measurement and Policy Applications, pp. 77-109
129. Narendra Kumar I. and Chandrasekar Rao G. (2007),―Impact of Irrigation on
Employment‖, Southern Economist, Vol.46, No.7, pp.13-14.
130. Naresh Singla, Sukhpal Singh, Paramjeet Kaur Dhindsa, (2011) ―Fresh Food
Supermarkets in the Indian Punjab: Organisation and Impacts‖, Journal Of
Physics And Science, Vol.21, No. 1 , pp. 91-108.
131. Navalawala B.N. (1995), ―Waterlogging – Problems and Solutions‖, Yojana,
Vol. 39, No.11, pp.39. .
132. Nicholas Minot and Ruth Vargas Hill, (2007) ―Developing And Connecting
Markets For Poor Farmers‖, International Food Policy Research Institute, Vision
2020, pp. 1-4.
133. Nicholas Roberts and Varun Grover, (2012) ―Absorptive Capacity and
Information Systems Research: Review, Synthesis, and Directions for Future
Research‖, Society for Information Management, Vol. 36, No. 2, pp. 625-648.
134. Nirmala, L.,Ranganathan, G. and Ashokan, M. (2002) ―Constraints of bio
fertilizers adoption‖, Agricultural Extension Review, p. 30-31.
135. Novack R. A. and Simco S. W., (1991) ―The Industrial Procurement Process: A
Supply Chain Perspective", Journal of Business Logistics, Vol. 12, No. 1, pp.
145-67.

215
136. Ozcan, M. (2007). Affects on Quality and Durability of Harvest and Post-
Harvest Practices in Horticultural Products. Retrieved September 18, 2013, from
http://www.carsambaziraatodasi.com/ab1_1.asp.
137. Ozcan, M. (2007). Affects on Quality and Durability of Harvest and Post-
Harvest Practices in Horticultural Products. Retrieved September 18, 2013, from
http://www.carsambaziraatodasi.com/ab1_1.asp,.
138. P. K. Suri and Sushil , (2006) ―E-Governance through Strategic alliances - A
case of agricultural marketing information system in India‖, IIMB Management
Review 18, No. 4, pp. 389-401.
139. P. K. Suri and Sushil, (2006) ―E-Governance Through Strategic Alliances - A
Case Of Agricultural Marketing Information System in India‖, IIMB
Management Review, Vol. 18, No. 4, pp. 389-401 .
140. Padheria, (1973) ―Farmer Resistance To Technological Change In Dholka Taluk
A Of Gujarat State‖, PhD. Thesis, Gujarat Agricultural University.
141. Parit, R.N. Bhosale, S.S. and Dr. Patil, H.K., (2005) ―Resource Use Efficiency
And Profitability Of Tomato Crop In North Konkan Coastal Zone Of
Maharashtra‖, Rural India, pp. 232-234.
142. Patel, Y.A.S. and Modalia, V.K., (1974) ―Adoption Of Improved Farm Practices
In Village Bajpura‖, Kurukshetra, Vol. 21, No. 23, pp. 14.
143. Patel, Y.A.S. and Modalia, V.K., (1974) ―Adoption Of Improved Farm Practices
In Village Bajpura‖, Kurukshetra, Vol. 21, No. 23, pp. 17.
144. Patel, Y.A.S. and Modalia, V.K., (1974) ―Adoption Of Improved Farm Practices
In Village Bajpura‖, Kurukshetra, Vol. 21, No. 23, pp. 26.
145. Paulrajan Rajkumar and Fatima Jacob, (2010) ―Business Models of Vegetable
Retailers in India‖, Great Lakes Herald, Vol. 4, No. 1, pp. 31.
146. Pepijn Schreinemachers, E. B. (2018), Tapping The Economic And Nutritional
Power Of Vegetables, Global Food Security, . Vol.16, pp. 36-45.
147. Pirog, Rich and Benjamin, Andrew. (2003), ―Checking The Food Odometer‖,
Comparing Food Miles For Local Versus Conventional Produce Sales To Iowa
Institutions, Lowa State University.
216
148. Planning Commission, (1964), ―Criteria for Appraising the Feasibilities of
Irrigation Projects‖, Government of India, New Delhi, pp.7.
149. Praduman kumar and Mruthyunjaya, (1995) ―Demand For Fruits And Vegetables
In India‖, Agriculture Economics Research Review, Vol. 8. No. 2 , pp.7-17.
150. Prasad K.K., Choudhary B.M., and Kumar Amarendra, (1997) ―Response of
Tomato To Boron Application in Chhotanagpur Region‖. Journal of Research
(B.A.U.), Vol. 9, No. 2, pp. 145-147.
151. Radha Krishnan, Nigam. S. and Shantanu Kumar (2008), ―Contribution of
Livestock in Indian Scenario‖, Agricultural Situation in India, Vol. 66, No.1,
April, pp. 25-28.
152. Rai, H.N., (1965) ―Diffusion Of Information And Farmers Response In Relation
To Improved Farm Practices‖, Indian Journal of Extension Education, Vol. 1,
No. 2, pp. 23-25.
153. Rao, C.S.S. and Raheja, P.C., (1959) ―Evaluation Of Extension Methods And
Changing The Attitude Towards Improved Farm Practices‖, Indian Journal of
Agronomy, Vol. 3, No. 3, pp. 194.
154. Rasis Ahmad (1998), ―Water for Irrigation-An Overview‖, Edited By Farooq
Khan, Water Resource Management Thrust and Challenges, Anmol Publications
Pvt. Ltd., New Delhi, pp. 195.
155. Raveesh kumar gangwar, (2012) ―Pest Succession And Management Of Shoot
And Fruit Borer,Leucinodes Orbonalis Guenee Of Brinjal‖, Ph.D. Thesis, Sardar
Vallabhbhai Patel University Of Agriculture & Technology, Meerut, Vol. 1,
pp.33-42 .
156. Ray Chaudhuri Mausumi , (2005) ―Nutrients Management Of Acid Soils Of The
North-East India‖, Indian Farming , Vol. 1, pp. -22-25.
157. Rehman, M. u., Khan, N., & Jan, I. (2007). ―Post Harvest Losses In Tomato
Crop (A Case of Peshawar Valley)‖. Sarhad Journal of Agriculture, pp. 1279-
1284.
158. Robert J., (2010)―A Century Of Research On Agricultural Markets‖, American
Journal Agriculture of Economics, Vol. 92, No. 2, pp. 376-402.

217
159. Rodrigues Neto Angéloco L, Arces de Souza GC, Almeida Romão E, Garcia
Chiarello P,(2018,) “Alkaline Diet and Metabolic Acidosis: Practical Approaches
to the Nutritional Management of Chronic Kidney Disease‖ Journal of Renal
Nutrition, Vol. 28, Issue 3, pp. 215-220.
160. Ronald lester Mighell and Lawrence arthur Jones, (1963) ―Vertical Coordination
in Agriculture‖, Farm Economics Division, Economic Research Service, U.S.
Department of Agriculture, Vol. 1, No. 19, pp. 45-77.
161. Roy L.B., Rheenen W.V., Abraham T. and Habte A. (1999), ―Farmers
Participation And The Hare Irrigation Project‖, Integrated Development for
Water Supply and Sanitation, 25thWEDC Conference, Addis Ababa, Ethiopia,
pp. 252.
162. S.H. Baba, M.H. Wani, S.A. Wani and Shahid Yousuf, (2010) ―Marketed
Surplus And Price Spread Of Vegetables In Kashmir Valley‖, Agricultural
Economics Research Review , Vol. 23, pp. 115-127.
163. S.H. Baba, S.A. Mir, Aijaz A. Khan, N.H. Bazaz and Muzaffer Manzoor, (2015)
―Rural Infrastructure And Agricultural Growth Linkages In Jammu and
Kashmir‖, Economics Affairs, Vol. 60, No.1, pp.143-150.
164. Saha, N.K. (1973), ―Adoption Problem Of Small Farmers‖ Kurukshetra, Vol. 20,
pp.10-11.
165. Samson, (2014), Online International Interdisciplinary Research Journal, vol. 4,
pp. 375-882
166. Saha, N.K., (1973) ―Adoption Problem Of Small Farmers‖, Kurukshetra, Vol.
20, pp. 20-21.
167. Sahay, R.R., ―Role Of Size Of Farm, Farm Income And Farming Efficiency In
The Adoption Of Improved Agricultural Techniques‖, M. Sc. Thesis
(unpublished), Bihar Agricultural College, Sabour, Bhagalpur, 1960.
168. Sandeep Sachdeva, Tilak R Sachdev, Ruchi Sachdeva, ―Increasing Fruit And
Vegetable Consumption: Challenges and Opportunities‖, Indian s, Vol. 38, No.
38, pp. 192-197.
218
169. Sangita Mehta, Birendra Prasad, Das, A. K., (2016) ―Pre-sowing Seed
Treatments With Different Chemicals And Growth Regulator On Seed
Germination And Growth Of Passion Fruit.‖, Advance Research Journal of Crop
Improvement, Vol.7, No. 2, pp.201-206.
170. Sanjai Bhagat James A. Brickley Ronald C.Lease, (1985) ―Incentive Effects Of
Stock Purchase Plans‖, Journal of Financial Economics, Vol. 14, No. 2, pp. 195-
215.
171. Sandeep Sachdeva, Tilak R Sachdev, Ruchi Sachdeva, (2013) ―Increasing Fruit
And Vegetable Consumption: Challenges and Opportunities‖, Indian Journal for
Community Medicine, Volume 38, Issue 38, pp. 192-197
172. Saxena, K.B.C., & Sahay, B.S. (2000) ―Managing It For World Class
Manufacturing: The Indian Scenario‖, International Journal of Information
Management, Vol. 20, pp. 29-57.
173. Scott C. and Westbrook R., (1991) ―New Strategic Tools for Supply Chain
Management, "International Journal of Physical Distribution & Logistics
Management, Vol. 21, No. 1, pp 23-33.
174. Seema Rawat, (2015) ―Food Spoilage: Microorganisms and their prevention‖,
Asian Journal of Plant Science and Research, Pelagia Research Library, Vol. 5,
No. 4, pp.47-56.
175. Sekara, A. Cebula, S., (2008) Cultivated eggplants – ―origin, breeding objectives
and genetic resources‖, A Review, Food and Agriculture organization of the
united nation.
176. Sengupta, Anirban., (2008) ―Emergence of modern Indian retail: an historical
perspective‖. International Journal of Retail & Distribution Management, Vol.
36, No. 9, pp. 89-700.
177. Sharma, G., & Singh, S. (2011). ―Economic Analysis of Post-harvest Losses in
Marketing of Vegetables in Uttarakhand‖. Agricultural Economics Research
Review, Vol. 24, pp. 309-315.

219
178. Sharma, G., & Singh, S. (2011). ―Economic Analysis of Post-harvest Losses in
Marketing of Vegetables in Uttarakhand‖. Agricultural Economics Research
Review, Vol. 24, pp. 309-315.
179. Sharma, N., Garcha, S. and Singh, S. (2013). Potential of Lactococcus Lactis
Subspecies Lactis Mtcc 3041 As A Bio Preservative. Journal of Microbiology,
Biotechnology and Food Sciences, Vol. 3, No. 2, pp. 168-171.
180. Shawn Cole, Barrett Kirwan, (2009) ―Between the Corporation and the
Household: Commodity Prices, Risk Management, and Agricultural Production
in the United States‖, American Journal of Agricultural Economics, Vol. 91, No.
5, pp. 1243–1249.
181. Shrivastava, K.K., Trivedi, M.S. and Lakhera M.L., (2002) ―Knowledge and
adoption behavior of chilli growers‖, Agricultural Extension Review, Vol. 14,
No. 4, pp. 22-25.
182. Shrivastava, K.K., Trivedi, M.S. and Lakhera M.L., (2002) ―Knowledge and
Adoption Behavior Of Chilli Growers‖, Agricultural Extension Review, Vol. 14,
No. 4, pp. 22-25.
183. Shukla V.P. (1973), ―Well Irrigation – Its Costs and Benefits in Jabalpur District
in Madhya Pradesh‖, Indian Journal of Agricultural Economics, Vol. 28, No. 4,
pp.235. .
184. Shukla, M., & Jharkharia, S. (2013). ―Agri-fresh produce supply chain
management: a state-of-the-art literature review‖. International Journal of
Operations & Production Management, Vol. 33, No. 2, pp.114-158. .
185. Shukla, M., & Jharkharia, S. (2013). ―Agri-Fresh Produce Supply Chain
Management: A State Of The Art Literature Review‖. International Journal of
Operations & Production Management, Vol. 33, No. 2, pp.114-158.
186. Siddique, S. A. (2018). Green Vegetables force Mechanism in Ranchi Market.
IOSR Journal of Business and Management , 20, No. 6, pp. 58-63.
187. Singgih, S., & Woods, E. (2002) ―Banana Supply Chains In Indonesia And
Australia: Surviving Isolation From End Markets‖. International Farm
Management Congress, Australia.

220
188. Singh R.K., Choudhary B.M. and Singh, R. P. Ratan, (1996) ―Overcoming
Lower Productivity And Profitability In Rainy Season Cauliflower Through
Farmers Participatory Approach‖, Recent trends in Horticultural Research, 2001,
Horticultural Society.
189. Singh, A. and Singh, Y. (1992). ―Effect Of Vibration During Transportation On
The Quality Of Tomatoes‖. Journal of Agriculture Machinery, Asia, Africa and
Latin America, Vol. 23, pp. 57-62.
190. Singh, A. and Singh, Y. (1992). ―Effect Of Vibration During Transportation On
The Quality Of Tomatoes‖. Journal of Agriculture Mechinary, Asia, Africa and
Latin America, Vol. 23, pp. 70-72.
191. Singh, A.K. Singh, A. Kumari and Chandra, P., ―Cultivation Of Tomato In
Green House‖, Intensive Agriculture, pp. 14-16.
192. Singh, A.N., ―A Study Of Farmers Response Towards High Yielding Varieties‖,
M. Sc. Thesis, Bihar Agricultural College, Sabour, Bhagalpur, 1968.
193. Singh, D.P. and Singh, H.P. (1987) ―Horticultural Development in Chotanagpur
plateau-A strategy‖, Chotanagpur Horticulture, Vol. 4, No. 2&3, pp.13.
194. Singh, D.P. and Singh, H.P., (1987) ―Horticultural development in Chotanagpur
plateau-A strategy‖, Chotanagpur Horticulture, Vol. 4, No. 2&3, pp.34.
195. Singh, D.P., (1990) ―Horticultural Development in Tribal areas of Bihar:
Challenge Ahead‖, Chotanagpur Horticulture, Vol. 7, No. 4.
196. Singh, K.N. and Choubey, C.L., (1975) ―Operational Farm Size And Differential
Adoption Of High Yielding Varieties Technology‖, Indian Journal of Extension
Education, Vol. 10, No. 1&2, pp.42.
197. Singh, S. P., Sikka, B. K., & Singh, A. (2009). Supply Chain Management and
Indian Fresh Produce Supply Chain: Opportunities and Challenges.
198. Singh, S.K. Singh, S.D. Singh, M.P. and Chauhan, J., (2004) ―Role Of Micro
Farming In Poverty Alleviation‖, Agricultural Extension Review, pp. 27-30.
199. Singh, T. S. (2017), An Analysis on Problems of Vegetables Marketing in
Farmers‘ Market of Jharkhand - A Case Study in Ranchi District, MPRA, PUSA
Bihar, . Vol. 1, pp. 1-16.

221
200. Socio-Economic Research, Planning Commission, Government of India, (2013),
Estimation Loss of Horticulture Produce due to Non-Availability of Post Harvest
& Food Processing Facilities in Bihar & UP, ASET, New Delhi, pp. 3-10.
201. Somashekaraiah N.T. and Mahendra Kumar S. (2008),―Tube Well Irrigation on
Resource Use Efficiency in Agriculture‖, Vol. 47, No.12, Southern Economist,
pp. 9-13.
202. State Planning Board, (1975) Minor Irrigation in Kerala: An Evaluation Study,
Government of Kerala, Trivandrum, pp. 44-45.
203. Special issue of Pratiyogita Darpan ―INDIAN ECONOMY‖- 2015.
204. Sudheer, K.P. and Indira, V. (2007). Post Harvest Technology Of Horticultural,
pp. 01-05.
205. Surabhi Mittal, (2007) Indian Council For Research On International Economic
Relations, ―Can Horticulture Be A Success Story For India?‖ ICRIER, New
Delhi, pp. 22-33.
206. Suryawanshi S.D. and Kapase P.M. (1985), ―Impact of Chod Irrigation Project
on Employment of Female Agricultural Labour‖, Indian Journal of Agricultural
Economics, Vol. 11, No. 3, pp. 240-244.
207. Tara Shankar and K.M. Singh, (2016) ―An Analysis of Marketed Surplus and
Price Spread of Cauliflower in S. Chotanagpur (Jharkhand) for Sustainable
financial inclusion of Tribal Farmers‖, Munich Personal RePEc Archive
(MPRA), Vol. 1, pp. 1-10.
208. Thomas Reardon ,Christopher B. Barrett, ―Agroindustrialization, Globalization,
and International Development: An Overview of No‘s, Patterns, and
Determinants―, Agricultural Economics, The Journal of the International
Association And Agriculture Economy.
209. Thyagarajan S., and Prabhu R., (2005) ―Recommended Technologies Adopted
By Tomato Growers‖, Agricultural Extension Review,March-April, Vol. 17, No.
2, pp. 27-30.

222
210. Towill D. R., N. M. Naim and J. Wikner. (1992) ―Industrial Dynamics
Simulation Models in the Design of Supply Chains‖, International Journal of
Physical Distribution and Logistics Management, Vol. 22, No. 5, pp. 3-13.
211. Uma Shankar singh & Uma sankar mishra, (2013) ―Vegetables Supply Chain: A
Conceptual Study‖, Food Science & Quality Management, Vol.15, pp.32.
212. Uma Shankar Singh, Uma Sankar Mishra, (2013) ―Vegetable Supply Chain: A
Conceptual Study‖, Food Science and Quality Management, Vol. 15, pp. 30-32.
213. Vaart T. V. And Pieter D., (2003) ―Buyer-Focused Operations As A Supply
Chain Strategy", International Journal of Production and operation Management,
Vol. 26, No. 1, pp8-23.
214. Vander Vorst, J. G. A. J., Tromp, S. O., and Vander Zee, D. J., (2009)
―Simulation Modeling For Food Supply Chain Redesigns; Integrated Decision
Making On Product Quality, Sustainability And Logistics‖, International Journal
of Production Research, Vol. 7, pp.24.
215. Veena, Babu, K. N., & Venkatesha, H. R. (2011). ―Supply Chain: A
Differentiator in Marketing Fresh Produce‖. The IUP Journal of Supply Chain
Management, Vol. 8, No.1, pp. 23-36.
216. Verma, A. Kumar Sanjeev and Singh, K.P., (2004) ―PRA Approach For Loss
Assessment Of Vegetable: No‘s‖, Agricultural Extension Review, pp. 21-24.
217. Vipul Chandra Tolani and Huzefa Hussain, (2013) ―Strategic Change in Model
of Fruit and Vegetables Supply Chain‖, Global Journal of Management and
Business Studies. Vol. 3, No. 9, pp. 965-970.
218. Viswanadham, N. (2007). Can India Be The Food Basket For The World?,
WorkingPaperseries,IBS,Hyderabad.Retrievedfrom,http://www.cccindia.co/core
centre/Database/Docs/DocFiles/Can_India_be.pdf .
219. Vulavala jyoshna, (2003), ―Optimum Production Pattern For Farmers In Chittoor
District, Andhra Pradesh‖, PhD. Thesis, Acharya N.G. Ranga Agricultural
University.
223
220. Vyas V.S. and Mathai G. (1978), ―Farm and Non-Farm Employment in Rural
Areas: Perspective for Economic Planning‖, Economic and Political Weekly,
Vol. 28, No. 6 & 7, pp.85.
221. Wasala, C. B., Dissanayake, C. A. K., Dharmasena, D. A. N., Gunawardane, C.
R., and Dissanayake, T. M. R. (2014). ―Postharvest Losses, Current No‘s and
Demands For Postharvest Technologies For Loss Management In The Main
Banana Supply Chains in Sri Lanka.
222. William G. Tomek and Robert J. Myers, (1993) ―Empirical Analysis of
Agricultural Commodity Prices: A Viewpoint‖, Review of Agricultural
Economics , Vol. 15, No. 1, pp. 181-202 .
223. William K. Easter and Lee R. Martin (1977), ―Water Resource Problems in
Developing Countries‖, Bulletin Number 3, University of Minnesota, pp. 1-107.
224. Young, L. M., & Hobbs, J. E. (2002) ―Vertical Linkages In Agri-Food Supply
Chains: Changing Roles For Producers, Commodity Groups, and Government
Policy‖. Review of Agricultural Economics, Vol. 24, No. 2, pp. 428-441.
225. Yumbya, P., Ambuko, J., Shibairo, S., and Owino, W. (2014). ―Effect of
Modified Atmosphere Packaging (MAP) on the Shelf Life And Postharvest
Quality Of Purple Passion Fruit (Passiflora Edulis Sims)‖. Journal of Post-
Harvest Technology, Vol. 2, No. 1, pp. 24-26.
226. Waghmare P.R. and Hedgier D.N. (2007), ―Econometric Analysis Of Integrated
Dairy Development Programme In Parbhani District‖, Agricultural Situation in
India, Vol. 64, No.3, pp. 97-101.

224
WEBLIOGRAPHY
1. http://www.urbanext.uiuc.edu/veggies/cauliflower1.html
2. http://www.cauliflowerfestival.com/cauliflower-history.html
3. http://www.urbanext.uiuc.edu/veggies/cauliflower1.html
4. http://www.history.org/history/CWLand/resrch3.cfm
5. http://www.urbanext.uiuc.edu/veggies/cauliflower1.html
6. http://www.cauliflowerfestival.com/cauliflower-history.html
7. http://www.urbanext.uiuc.edu/veggies/cauliflower1.html
8. http://www.history.org/history/CWLand/resrch3.cfm
9. http://discworld.imaginary.com/lpc/links/cabbage/cabbage.html
10. http://cuke.hort.nesu.edu/cucurit/webner/vegcult/cauliflower.html
11. http://www.whfoods.com/genpage.php?tname=foodspice&bid=13
12. User point & click http://flickr.com/photos/hate_clothes/581079748/
13. User polar 905 http://flickr.com/photos/polar905/179735424/
14. User oh candy http://flickr.com/photos/sayonara/44813578/
15. User steve. wilson http://flickr.com/photos/steve-wilson/823568320/
16. User dey http://flickr.com/photos/dey/95133323/
17. User flickrichhttp://flickr.com/photos/richardthomas78/251685311/
18. User Andy2Boyzhttp://flickr.com/photos/andy2boyz/508412811/
19. User flickrichhttp://flickr.com/photos/richardthomas78/486305014/
20. User oldboneshttp://flickr.com/photos/gembone/2271326136/
21. User Ian Fullerhttp://flickr.com/photos/ianfuller/205402306/
22. Userpizzodisevohttp://flickr.com/photos/globetrotter1937/2182404943/
23. User In Praise of sardineshttp://flickr.com/photos/83096974@N00/475025885/
24. User nephttp://flickr.com/photos/nep/2783599/
25. User ksbuehlerhttp://flickr.com/photos/buehlerphoto/2241524705/
26. User IwateBuddyhttp://flickr.com/photos/brucewood/1437492113/
27. User ateotohttp://flickr.com/photos/ateoto/218097901/
28. User cava cavienhttp://flickr.com/photos/cava_cava/276127828/
29. User wistinehttp://flickr.com/photos/wistine/739410127/

225
30. https://en.wikipedia.org/wiki/Phaseolus_vulgaris
31. https://relianceretail.com/reliance-fresh.html
32. https://relianceretail.com/
33. www.reliancefresh.co.in/
34. https://en.wikipedia.org/wiki/Reliance_Fresh
35. https://www.bigbazaar.com/
36. https://en.wikipedia.org/wiki/Big_Bazaar
37. www.futureretail.in/businesses/big-bazaar.html
38. www.futuregroup.in/pdf/bb_ranchi_birthday2.pdf
39. www.futuregroup.in/
40. Amla Cluster Production & Processing Sansthan, c.ted india.org
41. Small Farmers‟ Agribusiness Consortium (SFAC), http://sfacindia.com
42. Fruit & Vegetable Processing Cluster, Pune ,http://www.punebds.com
43. Global Green contract farming, http://www.globalgreengroup.com
44. http://www.rierc.org/marketing/paper34.pdf
45. https://en.wikipedia.org/wiki/Betawad
46. https://www.census2011.co.in/data/village/
47. https://academics.hamilton.edu/foodforthought/Our_Research_files/cabbage_cauliflower
_kale.pdf
48. www.growtomatoes.com
49. www.madaboutberries.com/tomatoes/tomato-types-and-varieties.html
50. https://academics.hamilton.edu/foodforthought/Our_Research_files/beans_peas.pdf
51. https://www.slideshare.net/vagoel84/vishal-customer-relationship-management-new-1
52. https://www.indiaretailing.com/uploads/Market_Research_pdf/13-Reliance_Fresh-
Amity.pdf
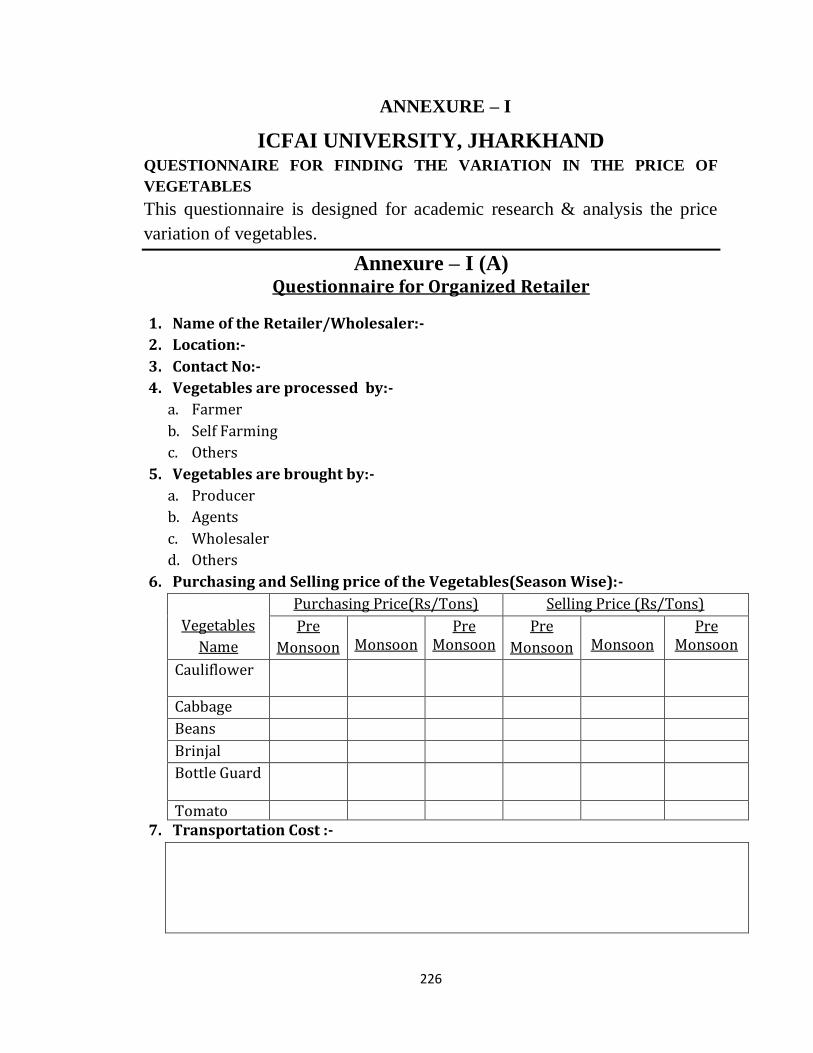
226
ANNEXURE – I
ICFAI UNIVERSITY, JHARKHAND QUESTIONNAIRE FOR FINDING THE VARIATION IN THE PRICE OF
VEGETABLES
This questionnaire is designed for academic research & analysis the price
variation of vegetables.
Annexure – I (A) Questionnaire for Organized Retailer
1. Name of the Retailer/Wholesaler:-
2. Location:-
3. Contact No:-
4. Vegetables are processed by:-
a. Farmer
b. Self Farming
c. Others
5. Vegetables are brought by:-
a. Producer
b. Agents
c. Wholesaler
d. Others
6. Purchasing and Selling price of the Vegetables(Season Wise):-
Vegetables
Name
Purchasing Price(Rs/Tons) Selling Price (Rs/Tons)
Pre
Monsoon
Monsoon
Pre Monsoon
Pre
Monsoon
Monsoon
Pre Monsoon
Cauliflower
Cabbage
Beans
Brinjal
Bottle Guard
Tomato 7. Transportation Cost :-

227
8. Packaging Cost:-
9. Merchandising Cost:-
10. Reprocessing Cost:-
11. Any other Cost:-
12. Type of Storage Facilities used:-
13. Number of Distributors/Intermediaries:-

228
ANNEXURE – I (B)
Questionnaire for Vegetable Farmer
1. Vegetables Growers/Farmer Name:- 2. Address:- 3. Age:- 4. Type of Land:-
Land Type Pre Monsoon Monsoon Pre Monoson
Owner Lease Forward Trading
5. Name of the vegetables grown(Area and Season wise):-
SN
Vegetables Name
Area(acres)
Seasons Pre Monsoon Monsoon Pre Monsoon
1. Cauliflower 2. Cabbage 3. Beans 4. Brinjal 5. Bottle
Guard
6. Tomato
6. Cost of Production of Cauliflower, Cabbage, Beans, Brinjal, Bottle Guard,
Tomato.
S.N
Particulars
Rs/acres
Cauliflower
Cabbage
Beans
Brinjal Bottle Guard
Tomato
Qty Amt Qty Amt Qty Amt Qty Amt Qty Amt Qty Amt 1. Seed 2. Labor 3. Fertilizer 4. Insecticide 5. Irrigation 6. Ploughing 7. Cost of
production
8. Growth regulator

229
7. Season variability of vegetables w.r.t production in tons:-
SN Vegetables Name July-Oct Nov-Feb March- June
1. Cauliflower 2. Cabbage 3. Beans 4. Brinjal 5. Bottle Guard 6. Tomato 8. Cost of Transportation and marketing for selling in the market:-
Market Type Cost of Transportation Cost of Marketing
Wholesale Market
Particulars Amount Particulars Amount
1. 2. 3. 4. 5.
1. 2. 3. 4. 5.
Retail Market
Particulars Amount Particulars Amount
1. 2. 3. 4. 5.
1. 2. 3. 4. 5.
9. Post harvest losses:-
10. Quantity demanded by an Organized Retail Outlets which may affect the
Selling Price of the grower:-

230
11. Satisfaction Level of the Retailers/Wholesaler:-
a. High b. Moderate c. Dissatisfied
12. Generally vegetables are sold to:-
a. Mahajans b. Agents c. Wholesaler d. Retailers e. Others
13. Who fixes the price of vegetables:-
a. Self decision b. Intermediaries c. others
14. What are the factors do you considered before fixing the price of a
vegetables:-
a. Size of the vegetables
b. Quality of vegetables
c. Seasons
d. Any others
15. What are the major constraints regarding the production of vegetables:-
a. High labor cost
b. High fertilizer cost
c. High seed cost
d. Irrigation problems
e. High ploughing cost
f. Any other please specify
16. What are the major constraints regarding the marketing of vegetables:-
a. Lack of cold storage
b. Improper transaction
c. Political bandi
d. Involvement of middlemen
e. Transportation problems
17. Suggestion in improving the vegetables production:-
i.
ii.
iii.
iv.
v.
18. Suggestion in improving the vegetables marketing:-
a.
b.
c.
d.
e.
19. Any other suggestion if Any:-

231
ANNEXURE – II (A)

232
ANNEXURE – II (B)
SCALE OF FINANCE FOR THE TOTAL COST OF CULTIVATION
OF CONCERNED VEGETABLES

233
ANNEXURE – II (C)
PREVIOUS 12 YEARS NATIONAL HOTICULTURE BOARD (NHB) REPORT
REGARDING THE PRICES OF FARMERS AND RETAILERS

234

235

236

237

238

239

240

241

242
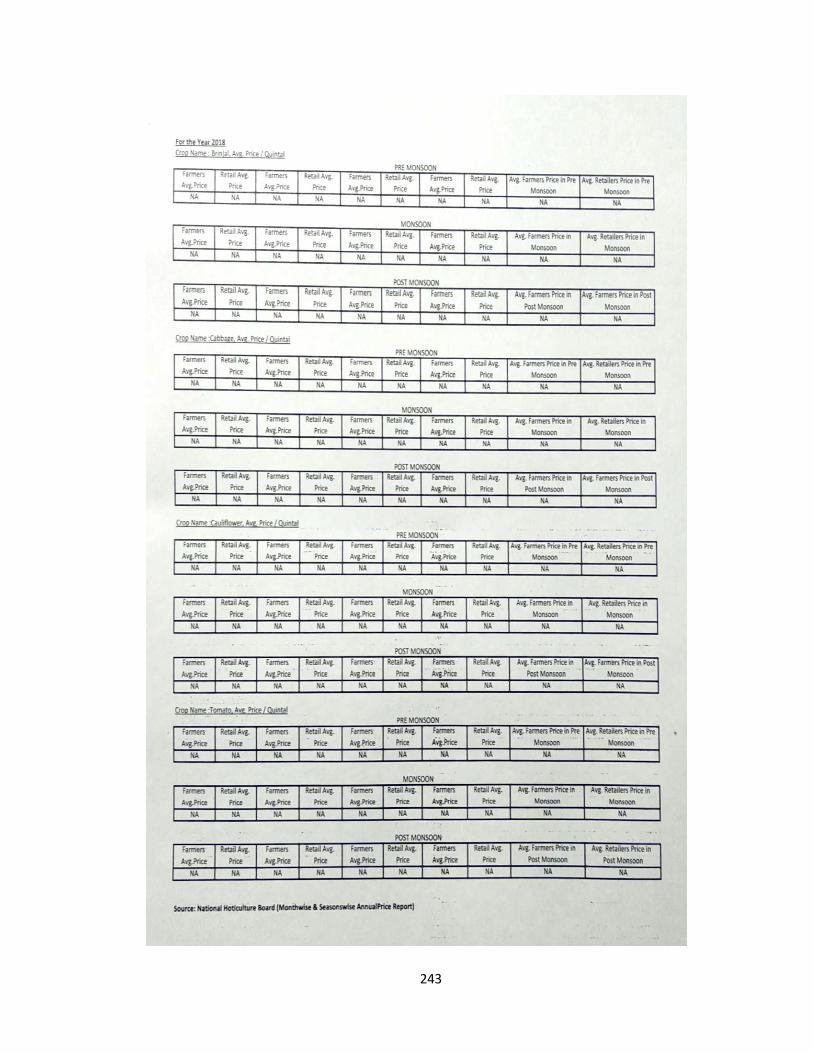
243
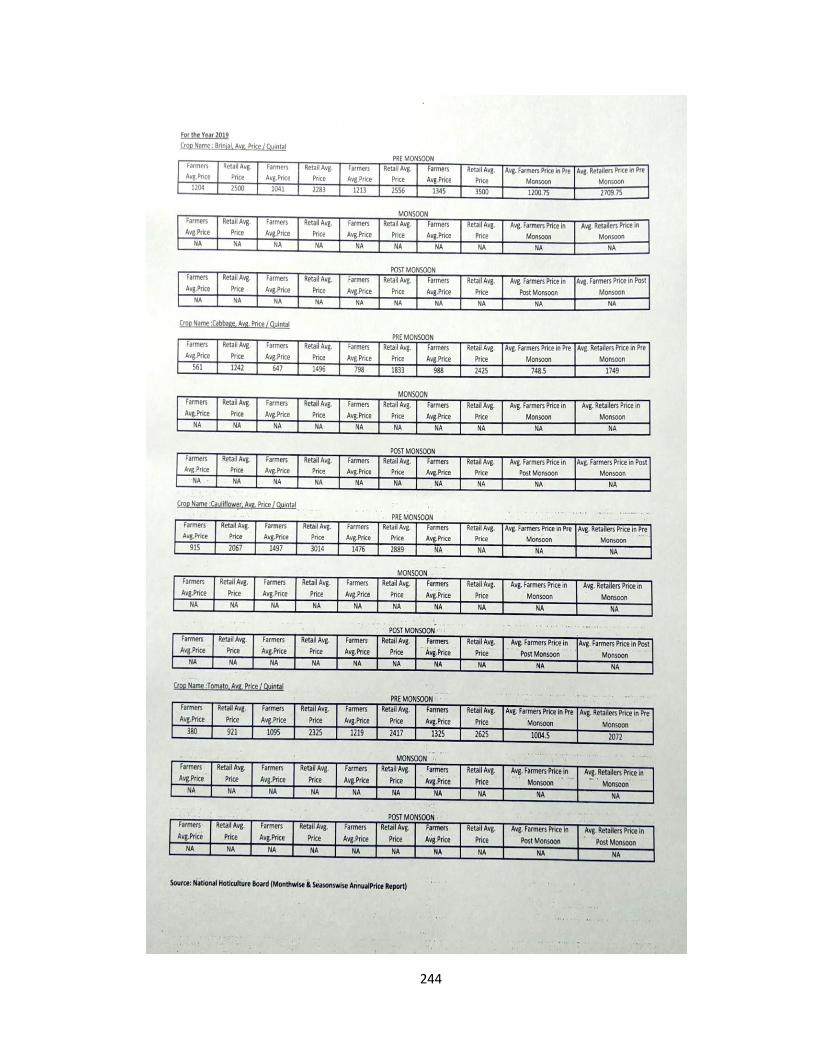
244

245
ANNEXURE – III
RESEARCH PAPER PUBLISHED
Research Publication (UGC Approved Journals)
1. Shakil Anwar Siddique, Gautam Rudra, Dr. Amar. Eron Tigga, Dr. Birendra Goswami,
(2017), ―Supply Chain of Vegetables in Ranchi, Jharkhand‖, International Research
Journal of Management Science & Technology (IRJMST), Vol. 8, No. 8, pp. 417-422
2. Shakil Anwar Siddique, Gautam Rudra, Dr. Birendra Goswami, (2018), ―Green
Vegetables Price Mechanism in Ranchi Market‖, International Organization of Scientific
Research (IOSR) Journal of Business and Management, Vol.20, No. 6, Ver. 1, pp. 58-63
3. Gautam Rudra, Shakil Anwar Siddique, Dr. Rumna Bhatcharraya, (2017), ―Influence of
Visual Merchandising on Consumer behavior in Apparel with Reference to Pantaloons,
Ranchi‖, International Research Journal of Management Sociology & Humanities
(IRJMSH), Vol.8, No.8, pp. 80-85
4. Gautam Rudra, Shakil Anwar Siddique, Dr. Rumna Bhatcharraya, (2018), ―A Review on
New Research Methodology Adopted In the Field Of Retail Management‖, International
Organization of Scientific Research (IOSR) Journal of Business and Management,
Vol.20, No.6, Ver. 1, pp. 1-4
5. Shakil Anwar Siddique, Nidhi Arya (2019), ―A Study on Web Marketing and Its Impact
On Different Segment of People at Ranchi‖, International Journal of Recent Scientific
Research, Vol. 10, No. 07(C), pp. 33524-33527
Research Paper / Abstract Presented / Attended
1. Shakil Anwar Siddique, (2015), National Conference on People Management: Emerging
Trends in the Current Millennium, The ICFAI University, Jharkhand.
2. Shakil Anwar Siddique, (2017), ―New Trend in Marketing Research‖, National Doctoral
Conference on Recent Trends in Management, The ICFAI University, Jharkhand.
3. Shakil Anwar Siddique, (2017), ― Perspective on Business Policies, Strategy and
Performance‖, Association for Research in Social Science, Commerce and Management
(ARISCOM) National Conference on Contemporary Issue in Social Science, Commerce
and Management, Institute of Management Studies, Ranchi University, Ranchi.
246
4. Shakil Anwar Siddique, (2018), ―Green vegetables price mechanism in market‖, National
Conference on Management in 21st Century: A Paradigm Shift, ICFAI Business School,
Kolkata.
5. Shakil Anwar Siddique, (2019), ―A Study on Financial Inclusion: Perspective from
Cauliflower Producer in Ranchi Area‖, National Conference on Environmental Ethics &
Sustainable Development, Sarla Birla University, Ranchi.