Price Measures for SemiconductorDevices · Price Measures for SemiconductorDevices Ana Aizcorbe*...
32
Price Measures for SemiconductorDevices Ana Aizcorbe* Board of Governors of the Federal Reserve System 20th & C Streets, NW Washington, DC 20551 (202)452-3152 [email protected] January 2001 Revised January 2002 ABSTRACT This note provides quality-adjusted price indexes and nominal shipments data for highly disaggregate classes of selected semiconductor devices. These data may be used to construct indexes under different assumptions from those in currently available indexes. Because the construction of these building blocks require some assumptions, the indexes are compared with similar price measures constructed by Bruce Grimm (1998) and by the Bureau of Labor Statistics. *The views presented here are solely those of the author and do not necessarily reflect the views of the staff or members of the Board of Governors of the Federal Reserve System. These indexes were constructed as part of a larger IT project spearheaded by Carol Corrado at the Federal Reserve Board. Special thanks to Carol Corrado and to Bruce Grimm, and Mike Holdway for many useful discussions. Helpful comments were also provided by Doug Andrey (SIA),Ellen Dulberger (IBM), Ken Flamm, Fred Merkle (BLS), Charlie Gilbert, and James Seay (Dataquest, Inc.). Research assistance was ably provided by Meredith Krug, Mike St.Clair, and Matt Wilson.
Transcript of Price Measures for SemiconductorDevices · Price Measures for SemiconductorDevices Ana Aizcorbe*...
Price Measures for SemiconductorDevices
Ana Aizcorbe* Board of Governors of the Federal Reserve System
20th& C Streets, NW Washington, DC 20551
(202)452-3152 [email protected]
January 2001
Revised January 2002
ABSTRACT
This note provides quality-adjusted price indexes and nominal shipments data for highly disaggregate classes of selected semiconductor devices. These data may be used to construct indexes under different assumptions from those in currently available indexes. Because the construction of these building blocks require some assumptions, the indexes are compared with similar price measures constructed by Bruce Grimm (1998) and by the Bureau of Labor Statistics.
*The views presented here are solely those of the author and do not necessarily reflect the views of the staff or members of the Board of Governors of the Federal Reserve System. These indexes were constructed as part of a larger IT project spearheaded by Carol Corrado at the Federal Reserve Board. Special thanks to Carol Corrado and to Bruce Grimm, and Mike Holdway for many useful discussions. Helpful comments were also provided by Doug Andrey (SIA),Ellen Dulberger (IBM), Ken Flamm, Fred Merkle (BLS), Charlie Gilbert, and James Seay (Dataquest, Inc.). Research assistance was ably provided by Meredith Krug, Mike St.Clair, and Matt Wilson.

INTRODUCTION
This paper provides highly disaggregate measures of constant-quality price change
and nominal shipments for selected semiconductor devices that may be used to construct
more aggregate measures of price change under a variety of assumptions and methods.
An appendix details the data sources and construction of the measures and gives
tabulations of the measures. Below, the new measures are aggregated to a level that
allows comparisons with existing measures published by statistical agencies. These
comparisons are made to highlight the numerical importance of differing assumptions and
data sources.
Building on work by Bruce Grimm (1998), quality-adjusted measures for chips in
the MOS memories and microprocessor segments are constructed for the period 1992-
1999. For the remaining segments, indexes are constructed for as many devices as the
existing data allow. All these sub-indexes are chained, matched-model indexes that use
either the Fisher or geometric means formula, depending on the available data. The
“Matched-model” technique generates a quality-adjusted price index, while the Fisher
index formula ensures that the appropriate weights are used to aggregate over goods.
Absent revenue data with which to form the Fisher weights, chained geometric means are
calculated instead. For the most part, the data are high-frequency data on prices and
quantities of chips at a very disaggregate level.
Turning to the top line, the most aggregate index considered here is a price
deflator for semiconductors as a whole-most of the products in the old SIC3674.’ Table
1compares growth rates for annual averages of this aggregate-labeled ‘‘new’’2to the
comparable BEA and BLS measures. Both the new and BEA indexes use chained-Fisher
weights, but aggregate over different subindexes; while the new index aggregates over
mostly chained-Fisher subindexes, BEA aggregates over the Laspeyres subindexes
1 Table A1 in the appendix details the individual semiconductor devices covered by this index. 2 Strictly speaking, the annual averages discussed in the text are not properly constructed indexes. As shown in Diewert (2000), annual averages do not weight the high-frequency observations properly. As such, the annual averages in the text should be viewed as a descriptive statistic for the properly-constructed high-frequency indexes in the appendix.
2

constructed by the BLS. Comparing the two indexes shows the effect that these
differences in the underlying subindexes have on the top line: The new index falls 1.5-20
percentage points faster than the BEA index in 1997 and again in 1998. Similarly, both
the BEA and PPI measures aggregate over the same subindexes, but use different
aggregation formulas; the BEA uses a chained Fisher formula while the BLS uses a fixed-
weight laspeyres. Comparing those two measures shows the effect that different
aggregation formulas have on the top line: the BEA index falls 15-30 percent faster than
the PPI.
Comparisons at finer levels of disaggregation are discussed below and organized
into three coarse market segments: MOS memory chips (like DRAM), MOS logic and
microcomponents (including microprocessors like the Pentium m), and everything else
(other integrated circuits, opto-electronics, and discrete devices). Of the three segments,
the MOS logic and microcomponents segment is the largest in global markets and makes
up nearly one-half of the world’s production; each of the other two segments make up
about one-quarter of world shipments.
MOS MEMORY CHIPS MOS memory chips are devices intended to store data and are used in a variety of
applications, ranging from the personal computer (PC) to digital alarm clocks. In 1999,
these devices made up 2.5 percent of the dollar value of all chips produced in the world
and 20 percent of the value of chips produced in the US. This segment of semiconductor
markets continues to show rapid rates of product innovation and technological change.
Indexes for five types of MOS memory devices were constructed for the period
1992 to 1999. Table 2 compares the resulting indexes to those constructed by Bruce
Grimm (1998). Both indexes tell the same story for MOS memories as a whole: both
show small changes for prices in each year between 1993 to 1995 followed by sharp
declines in prices in 1996. Measures for some of the underlying segments are also very
similar: DRAM, EEPROM, EPROM.
3
These similarities in the numerical estimates stem from similarities in the methods
used and the underlying data. Both the Grimm and new indexes for these devices are
matched-model chained Fisher indexes applied to highly detailed data. Both are indexes
for the world market-they both use worldwide nominal shipments data to form the
aggregation weights. Both use data from the same source, but the frequencies are
different: data used here are quarterly while the data used by Grimm are annual.
Estimates for the remaining devices differ somewhat, owing to differences in the
level of aggregation in the underlying raw data. The Grimm indexes for Flash and SRAM
memory are superior to those used here in that they are constructed using (discontinued)
data that has a finer level of product detail. For SRAM, table 2 shows the two indexes
constructed by Grimm-ne for “fast” SRAM and one for “slow” SRAM. Though the
differences are nontrivial, the nominal weights for Flash and SRAM are still sufficiently
small that the effect on the top line is small.
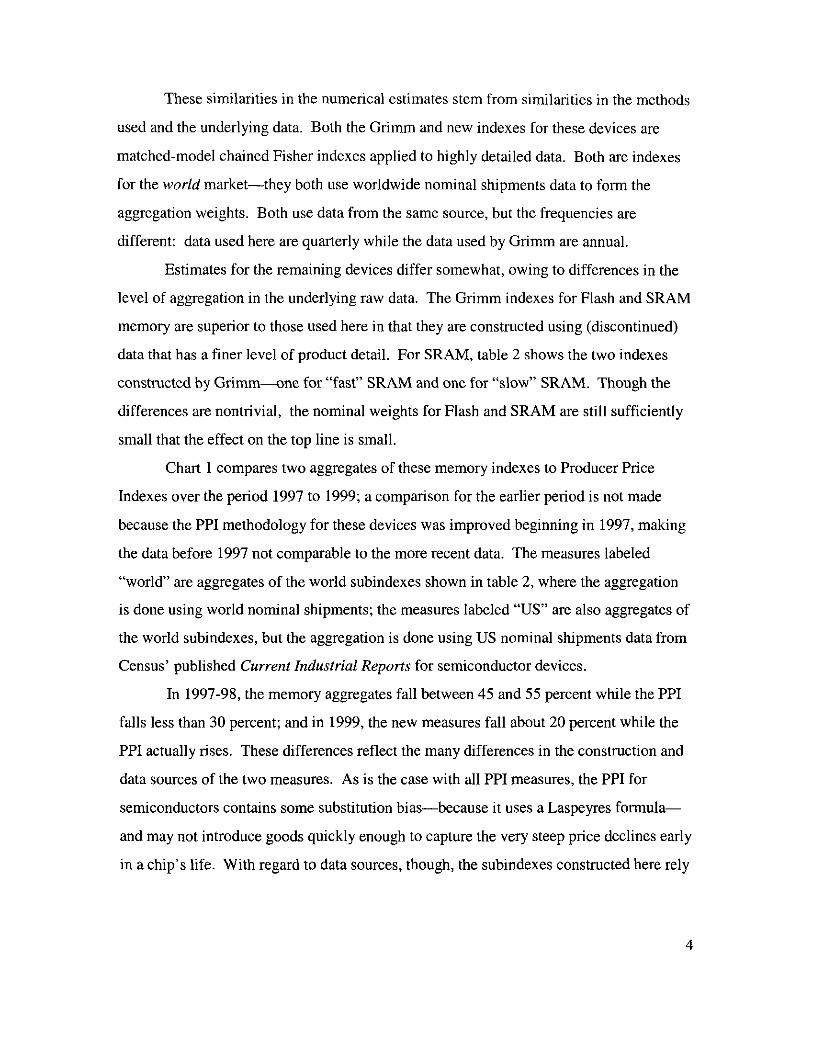
Chart 1 compares two aggregates of these memory indexes to Producer Price
Indexes over the period 1997 to 1999; a comparison for the earlier period is not made
because the PPI methodology for these devices was improved beginning in 1997, making
the data before 1997 not comparable to the more recent data. The measures labeled
“world’ are aggregates of the world subindexes shown in table 2, where the aggregation
is done using world nominal shipments; the measures labeled “US” are also aggregates of
the world subindexes, but the aggregation is done using US nominal shipments data from
Census’ published Current Industrial Reports for semiconductor devices.
In 1997-98, the memory aggregates fall between 45 and 55 percent while the PPI
falls less than 30 percent; and in 1999, the new measures fall about 20 percent while the
PPI actually rises. These differences reflect the many differences in the construction and
data sources of the two measures. As is the case with all PPI measures, the PPI for
semiconductors contains some substitution bias-because it uses a Laspeyres formula-
and may not introduce goods quickly enough to capture the very steep price declines early
in a chip’s life. With regard to data sources, though, the subindexes constructed here rely
4
on worldwide shipments for weights and those shipments may not adequately reflect the
composition of US production.
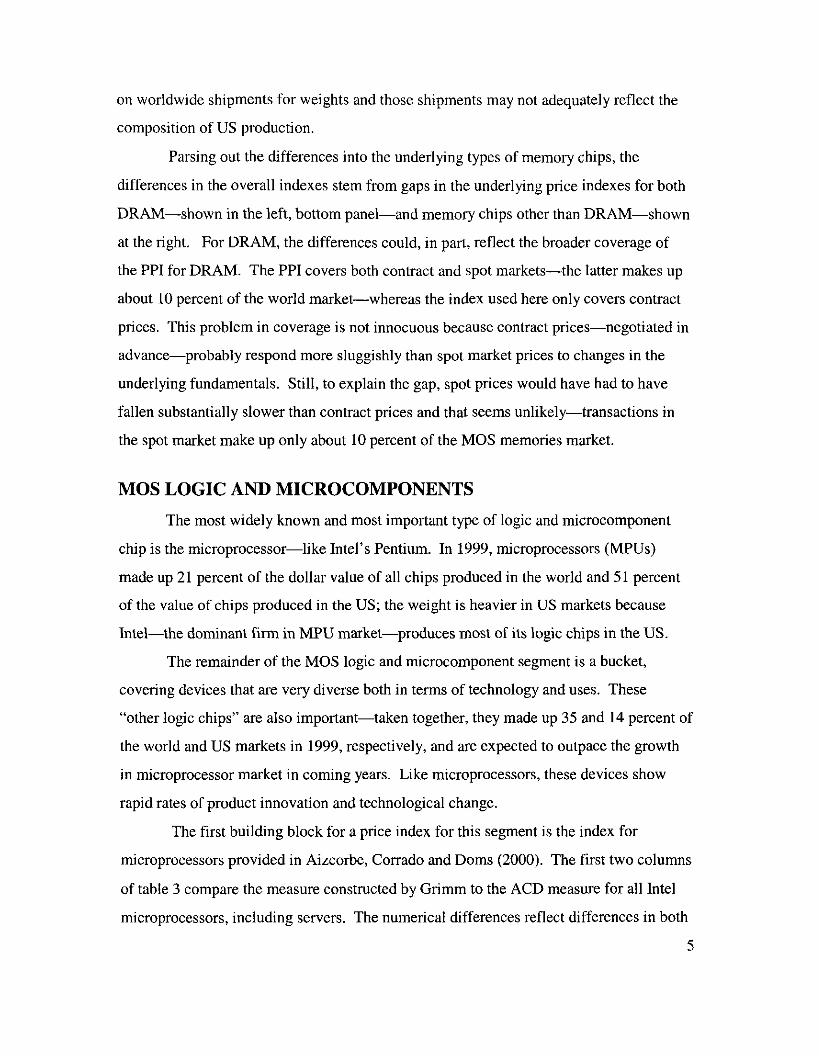
Parsing out the differences into the underlying types of memory chips, the
differences in the overall indexes stem from gaps in the underlying price indexes for both
DRAM-shown in the left, bottom panel-and memory chips other than DRAM-shown
at the right. For DRAM, the differences could, in part, reflect the broader coverage of
the PPI for DRAM. The PPI covers both contract and spot markets-the latter makes up
about 10 percent of the world market-whereas the index used here only covers contract
prices. This problem in coverage is not innocuous because contract prices-negotiated in
advance-probably respond more sluggishly than spot market prices to changes in the
underlying fundamentals. Still, to explain the gap, spot prices would have had to have
fallen substantially slower than contract prices and that seems unlikely-transactions in
the spot market make up only about 10 percent of the MOS memories market.
MOS LOGIC AND MICROCOMPONENTS The most widely known and most important type of logic and microcomponent
chip is the microprocessor-like Intel’s Pentium. In 1999, microprocessors (MPUs)
made up 21 percent of the dollar value of all chips produced in the world and 51 percent
of the value of chips produced in the US; the weight is heavier in US markets because
Intel-the dominant firm in MPU market-produces most of its logic chips in the US.
The remainder of the MOS logic and microcomponent segment is a bucket,
covering devices that are very diverse both in terms of technology and uses. These
“other logic chips” are also important-taken together, they made up 35 and 14 percent of
the world and US markets in 1999, respectively, and are expected to outpace the growth
in microprocessor market in coming years. Like microprocessors, these devices show
rapid rates of product innovation and technological change.
The first building block for a price index for this segment is the index for
microprocessors provided in Aizcorbe, Corrado and Doms (2000). The first two columns
of table 3 compare the measure constructed by Grimm to the ACD measure for all Intel
microprocessors, including servers. The numerical differences reflect differences in both
5
method and coverage: The Grimm measure is partially based on hedonic techniques and
covers all non-embedded chips-those produced by both Intel and its rivals-while the
ACD measure is a chained Fisher that only covers Intel’s chips-about 90 percent of the
dollar value of worldwide sales over this period. Despite the narrower coverage of the
ACD measure, one could argue that it is preferable because the quality of data on Intel is
superior to that of other firms. Importantly, disaggregate shipments data with which to
compute weights are not available for Intel’s rivals.
Though these non-embedded chips-typically used in personal computers-have
historically dominated the MPU segment, embedded chips are growing rapidly and are
expected to continue to increase in importance in the future. While non-embedded chips
are fairly standardized and tend to be used in computers, embedded chips tend to be
highly diverse and are used in a wide array of applications. As shown in column 3 of
table 3 , this small, but growing, segment matters: price change for embedded MPUs is
substantially slower than that of Intel’s chips. And, as shown in column 4, a Fisher of the
two types of chips falls perceptively slower than the ACD measure of Intel’s prices.
To obtain an index for this MOS micro and logic segment as a whole, the two
MPU measures were combined with seven other indexes that were constructed for
devices that, taken together, make up about 2/3 of the non-MPU portion of the segment:
microcontrollers, digital signal processors, general purpose logic, gate arrays, standard
cell chips, and field programmable logic. As detailed in the appendix, the data for these
devices were scarce and required some assumptions to fill in the gaps: in some cases,
because nominal shipments data were not available, the best one could do is to construct
geometric means. In other cases, data to construct Fisher indexes were available but only
for some of the years. Care was taken to ensure that the assumptions made to fill in the
gaps would err on the side of understating price declines in the aggregate indexes.
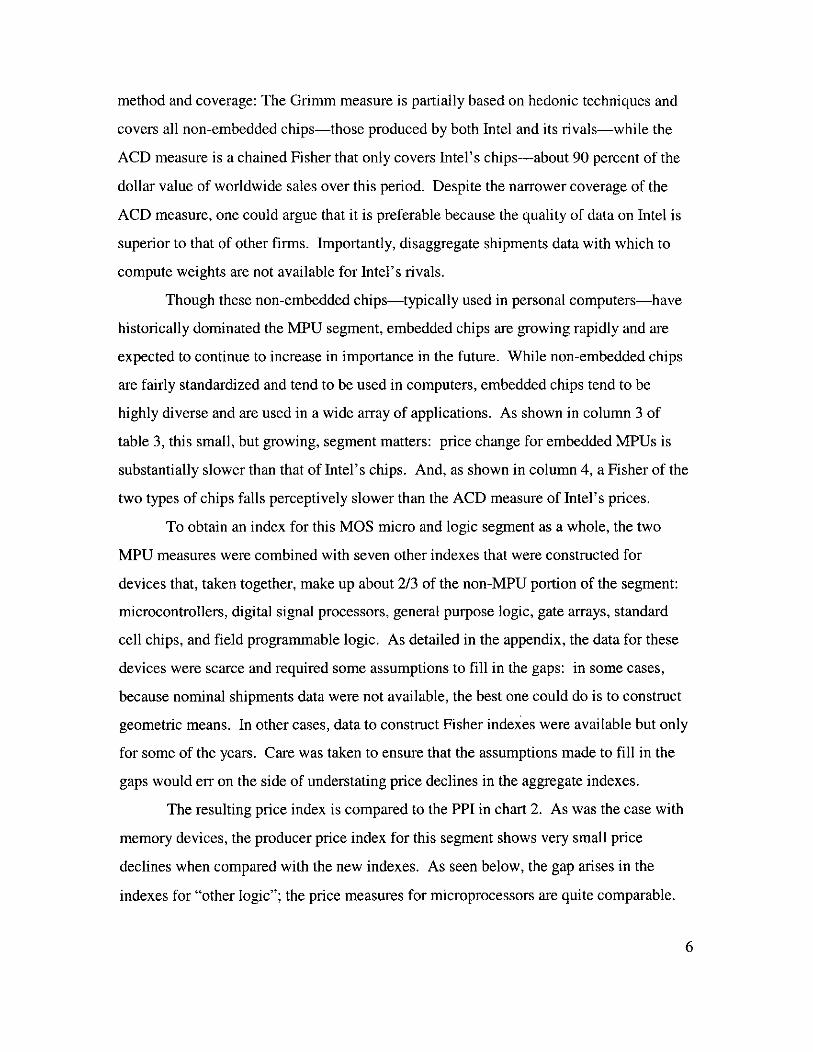
The resulting price index is compared to the PPI in chart 2. As was the case with
memory devices, the producer price index for this segment shows very small price
declines when compared with the new indexes. As seen below, the gap arises in the
indexes for “other logic”; the price measures for microprocessors are quite comparable.
6
OTHER DEVICES
Indexes were also constructed for devices outside of MOS memory and logic. In
1999, these devices, taken together, made up 18 and 15 percent of the world and US
markets, in nominal terms. Most of these devices are old, established electronic
equipment-like transistors-that are not undergoing a lot of technical change. One
exception is analog ch ips4h ips that are heavily used in the production of
communications equipment.
The indexes for these devices are chained Fisher indexes that were constructed
using the relatively aggregated average sales price and unit data from Semiconductor
Industries Association (SIA). There are two things to note about the measured price
change for these devices. As shown in chart 3, measured price change for “other
integrated circuits rarely fall more than 15 percent-slow price declines when compared
with those of other devices. Second, the new price index shows, on balance, slower price
declines than either the xxxxxx corresponding PPI.
Although it is hard to tell without higher-quality data, it is probably the case that
both the new and PPI indexes have limitations that will tend to understate price declines
for these devices. For the new indexes constructed using the SIA data, it is probably safe
to say that the data are not sufficiently disaggregated to adequately control for quality
changes. Because raw prices typically rise as quality improves, if one doesn’t adequately
control for quality improvements the price declines in an index will be damped by
quality-related price increases. That is, prices probably fall faster than these new indexes
show.
In contrast, although the quality of devices are very precisely determined and
tracked in the PPI, the use of Laspeyres weights in that index will, all else held equal,
yield price declines that are understated. Aggregate prices probably fall faster than these
indexes as well.
7

SUMMARY This paper provides highly disaggregate measures for semiconductor devices. As
is well known, differences in the assumptions used to form aggregate indexes will have a
non-trivial impact on the numerical values of the resulting measures. As shown above,
this is also true for semiconductor chips. The availability of these data should facilitate
the construction of alternative price indexes by other researchers.
8

APPENDIX
1. CONSTRUCTION OF PRICE INDEXES
Most of the price indexes used to measure price change for semiconductor devices
are matched-model, chain-type Fisher indexes of aggregate price change. In a few cases
where quantity data were not available, however, it was necessary to construct geometric
means.
Matched-Model chained Fisher Indexes
For two adjacent periods, if all goods sold at time t were also sold at time t-I, then
a Fisher Index number (ft,t.~) that measures aggregate price change from t-1 to t is given
by:
where the w’s are nominal weights
and the notation Ern refers to summations taken over the matched models-the goods
“alive” in both periods. To calculate a matched-model Fisher in the presence of births or
deaths, one only includes prices in the index for goods that were alive in both periods. In
general, one might be concerned that ignoring new and exiting goods might impart biases
on the price index. However, if one has access to high frequency data that measures
prices and quantities for technologically distinct products, then the bias from ignoring
product turnover is minimized and hedonic techniques provide little or no advantage over
the matched model techniq~es.~This is because the weight on the unobserved price
decline is likely very small in the first month or quarter of introduction.
3 Griliches, Triplett and others have noted that ifone has the ideal data set, hedonic techniques do not provide an advantage over matched-model price index techniques. This same point was made in Aizcorbe, Corrado, and Doms (2000) and Silver and Heravi (2000).
9

While the index formula in (1) measures price change over two adjacent periods
(i,e., t and t-l), price change over longer periods of time are measured by multiplying
(chaining) these indexes together. Formally, to measure price change from some base
period o to time t, the Fisher indexes for all the adjacent periods from o to t are multiplied
together:
(2) P * d = n,=,,P%,S
This method was used to calculate a price index for all semiconductor products
and for three classes of semiconductor chips that make up integrated circuits: memory
chips, logic chips, and other integrated circuits.
Matched Model Geometric Means
The formula for a geometric mean of price change from period t-1 to t is given by:
(1') P't.1.t = n m P m , t 1 Pm,t-1)
where the notation n, refers to products taken over goods that existed in both periods
(goods denoted by m). This index of price change over two adjacent periods are chained
to obtain price change over longer periods of time:
2. DATAFOR PRICE SUBINDEXES
Highly detailed data were obtained to construct matched model indexes for most
devices classified in the semiconductor industry (SIC 3674). In table A l , the individual
product classes itemized in the 1998 Current Industrial Reporrs (CJR) are listed along
with information on whether data were available for the product class, and, if so, on the
data source. Descriptions for each of these devices are available on the Semiconductor
Industries Association web page at www.semichips.org.
10
The CIR hierarchy was used as a backbone to facilitate the construction of indexes
that use US shipments. Data were available for most product classes: the exceptions were
small and were mostly devices outside of “Integrated Circuits”-the type of
semiconductors typically measured in previous studies.
The collection of devices in integrated circuits may be thought of in three different
classes: MOS memory, MOS logic and microcomponents, and other integrated circuits.
In all cases, the data used to construct the sub-indexes were data for the world market-
data for US production are not available at the needed level of detail. Because
semiconductor markets are highly global, it is probably safe to assume that prices for
individual chips do not vary by country. However, to the extent that the distribution of
production in the US differs from that in the world as a whole, these price indexes may
not provide a precise representation of prices for the US market.
We discuss the data sources and the resulting price measure for each of these in
turn.
2A. MOS MEMORY
As may be seen in table A1 data for the MOS memory indexes (lines 8-24) were
obtained from Dataquest, Inc. Dataquest is an international organization that is one of
the premier sources of data for high technology goods. Dataquest monitors unit
shipments and prices charged by selected companies-making up over 90 percent of the
market--at monthly or quarterly frequencies. These data on quarterly prices and
quantities are proprietary and reported for 212 distinct devices produced between 1992
and 1999 and are essentially chip-level data.4 One potential drawback of the data is that
they cover only contracted transactions, and do not capture spot market transactions.
Tables A2 and A3 contain quarterly price indexes and world shipments for five types of
MOS memory chips: DRAM, SRAM, EEPROM, EPROM, and Flash&ROM. The
devices differ by read-write capabilities and the technology used for their production.
4 The index constructed by Bruce Grimm was based on very similar data from DQ and used matched-model techniques. The main difference is that the Grimm data were annual while those used here are quarterly. Surprisingly, the frequency of the data does not appear to make much of a difference.
11
2B. MOS LOGICAND MICROCOMPONENTS
Microprocessors
The construction of a price index for microprocessors (MF’Us-shown in lines 25-
27 in table Al ) required data from several sources. A chained-Fisher price index for non-
embedded microprocessors was obtained from ACD (2000). That index-shown in the
first column of table A4-is based on data obtained from MicroDesignResources (MDR).
The MDR data provide prices and quantities for 43 technologically distinct
microprocessors produced by Intel-the dominant firm in the non-embedded market
throughout the 1990s. Intel’s chips are produced mostly in the US and represented about
80% of the total value of microprocessors produced in the world in 1999.
Columns 2 and 3 provide the nominal value of shipments of Intel’s MPUs-as
estimated by MDR-and of embedded chips4stimated by multiplying the SIA WSTS
nominal value of all MPUs with the SIA Microprocessor Report’s estimate for the share
of these shipments made up of embedded MPUs.
The data for the embedded microprocessors price index-obtained from DQ-are
annual price data that begin in 1996. Because neither nominal shipments nor unit data
were available at a sufficient level of detail, geometric means were constructed.
The two price indexes were then combined using nominal world shipments data
for embedded and non-embedded microprocessors from Semiconductor Industries
Association (SIA) to yield the overall MPU index on table 3 of the text.
Other Microcomponents
Although the microcomponent segment is one of the most dynamic in
semiconductor markets, the segment has been largely neglected by statistical agencies and
data vendors; these chips are all lumped together with other logic chips as “Other Logic”
in the CIRs (line 28), and highly disaggregate data from private vendors is relatively
scant. Because the price declines associated with individual chips in this product class
are reportedly comparable to those associated with MOS memory and MPU chips, it is
12
very important to use disaggregate data to identify the individual price contours for each
chip.
The top panel of table A5 gives information on the sources and construction of
indexes for these devices-the corresponding indexes are given in the bottom panel. The
source data, and, hence, the indexes are all annual frequencies.
To construct price measures for both types of microcontrollers (MCUs and DSPs),
annual data for the period 1996-99 were obtained from DQ and were used to calculate
chained Fisher indexes. A measure for Microperipherals (MF'Rs) could not be
constructed owing to lack of data (even SIA does not publish data for these devices).
MOS Logic
The scarcity of data for devices in the MOS Logic category does not allow
construction of chained Fisher indexes using highly detailed data-the preferred method.
Instead, price change for these devices was measured using matched-model geometric
means, indexes that can control for quality change if the data are sufficiently disaggregate
but do not use the proper (Fisher) weights.
For two types of MOS logic-general purpose logic and gate arrays-Dataquest
publishes disaggregate price data that were used to construct geometric means for the
period 1990-1999. For field programmable and standard cell logic devices, the DQ data
was discontinued in 1994 and 1995, respectively, and SIA data are not available. The
indexes and corresponding worldwide nominal shipments are given in table A6.
Filling in the Gaps for Comparisons
For most devices, when gaps arose, the only available data were the relatively-
aggregate SIA data. These monthly-frequency data are slightly more aggregated over
products; rather than reporting chip-level data, SIA reports average sales prices and
shipments for chips grouped by common attributes. Because these data likely do not hold
quality constant, and yield Fisher indexes that likely understate price declines, an
alternative measure was constructed: a Fisher index of MOS memories. MPU and MCUs
13

(denoted MMM). The advice of industry analysts about the relative pace of technical
change for these devices guided both the construction of the MMM index and the choice
of which index to use to measure price change for logic devices-SIA vs. MMM.
Price change for embedded MPUs from 1992-95 was measured using the ACD
Fisher index for Intel’s MPUs and that of MCUs and DSPs was measured using Fisher
indexes based on the SIA data-on the latter, the price change as measured in the SIA
data appear reasonable. Price change for the remaining devices-xcept “other special
purpose logic”-was measured using the MMM index. Because data were simply not
available, the category for “Other Special Purpose Logic” was simply excluded; this
amounts to assuming that overall price change for devices in this category can be
represented by an index of price change for all the other devices in the Micro/Other logic
category.
2c. OTHERDEVICES
Price change for the remaining devices was measured using chained Fisher
indexes that were constructed using the relatively-aggregate average sales price and unit
data from Semiconductor Industries Association (SIA). All told, we use observations
for 84 such aggregates from the SIA data to form price indexes for most of the other
devices listed in table 1. The monthly indexes are given in table A7.
3. NOMINALWEIGHTS FOR AGGREGATION Aggregating from the sub-indexes discussed above to more aggregate indexes
requires nominal shipments data. The very disaggregate shipments data are only
available for world markets-not US-and are given alongside the price indexes in the
appendix tables. Normally, the source for the nominal shipments is the same as the
source for the price data. At higher levels of aggregation, SIA data on the dollar value of
world shipments are available. The shipments data for the nine coarse classes of
integrated circuits and three classes of other semiconductors are given in table A8.
14

Data on nominal US shipments are available from the Current Zndustrial Reports
published by the Census Bureau. There are two potential problems in using these data.
First, the global nature of the production process for semiconductor chips makes the
value-added for these devices difficult to track. So, for example, the initial assembly of a
chip might begin in a US fabrication facility (fab). After the chip is produced, it might be
sent to Asia, where the labor-intensive testing and packaging occurs. The measurement
problem is that it is not clear exactly what is meant by “US shipments” of these devices-
does it include the value-added in Asia? The assumption necessary to use these data for
weights is that the index is forfinished chips and that the reported shipments data include
all of the value of the chip. The second problem is that the published data cannot be used
without some imputations and judgment calls because the data are often suppressed to
avoid violating firms’ confidentiality. The public data are available in computer-readable
form from the Census Bureau web page at:htt~:l/www.census.eov/cir/www/ma36a.html.
15
REFERENCES
Aizcorbe, A.M. (1999) “Data Sources and Methods for the I36740 Benchmark Deflator”, memorandum. .
Aizcorbe, A.M., C. Corrado and M. Doms (2000) “ConstructingPrice and Quantity Indexes for High Technology Goods”, paper presented at the NBER Summer Institute 2000, session on Price, Output and Productivity Measurement. Cambridge, MA, July 31.
Alterman, W. (1997) “A Comparison of the Export and Producer Price Indexes for Semiconductors”,presented in the Workshop on Price Index Measurement at the NBER Summer Institute.
Bemdt, E.R. and 2. Griliches (1993) “Measurement of DRAM Prices: Technology and Market Structure’’in M.F. Foss, M.E.Manser, and A.H.Young, eds., Price Measurements and Their Uses, National Bureau of Economic Research.
Cole, Rosanne, Y.C. Chen, J. A. Barquin-Stolleman,E. Dulberger, N. Helvacian, J. Hodge,(1986) “Quality-AdjustedPrice Indexes for Computer Processors and Selected Peripheral Equipment, Survey of Current Business 66(January):41-50.
Diewert, W.E. (2000) “Notes on Producing an Annual SuperlativeIndex Using Monthly Price Data,” Discussion Paper No. 00-08, University of British Columbia.
Dulberger, E. R. (1989) “The Application of a Hedonic Model to a Quality-Adjusted Price Index for Computer Processors,” in D.W. Jorgenson and R. Landau, eds., Technology and Capital Formation, Cambridge,Mass: MlT Press, Pp. 37-75.
Dulberger, E.R., (1993) “Sources of Price Decline in Computer Processors: Selected Electronic Components” in M.F. Foss, M.E.Manser, and A.H.Young, eds., Price Measurements and Their Uses,National Bureau of Economic Research.
Flamm, K (1993) “Measurement of DRAM Prices: Technology and Market Structure” in M.F. Foss, M. E. Manser, and A.H.Young, eds. Price Measurements and Their Uses, Cambridge,Mass.: National Bureau of Economic Research.
Flamm, K (1996) “Mismanaged Trade? Strategic Policy and the Semiconductor Industry,” Washington, DC: Brookings Institution.
Flamm, K (1997) “More for Less: The Economic Zinpact of Semiconductors:, SemiconductorIndustries Association.
Grimm, B.T. (1998) “Price Indexes for Selected Semiconductors, 1974-96,” Survey of Current Business 78(February):8-24.
16

Holdway, M. (1997) “An Alternative Methodology: Valuing Quality Change foI Microprocessors in the PPI”, mimeo, Bureau of Labor Statistics.
Holdway, M. (1998) “Measuring Price Change for Semiconductors in the Producer Price Index,” mimeo, Bureau of Labor Statistics.
Silver, M and S. Heravi (2001) “Scanner Data and the Measurement of Inflation”, Economic Journal, June.
Triplett, J. E. (1986) “The Economic Interpretation of Hedonic Methods,” Survey of Current Business 66(January):36-40
17
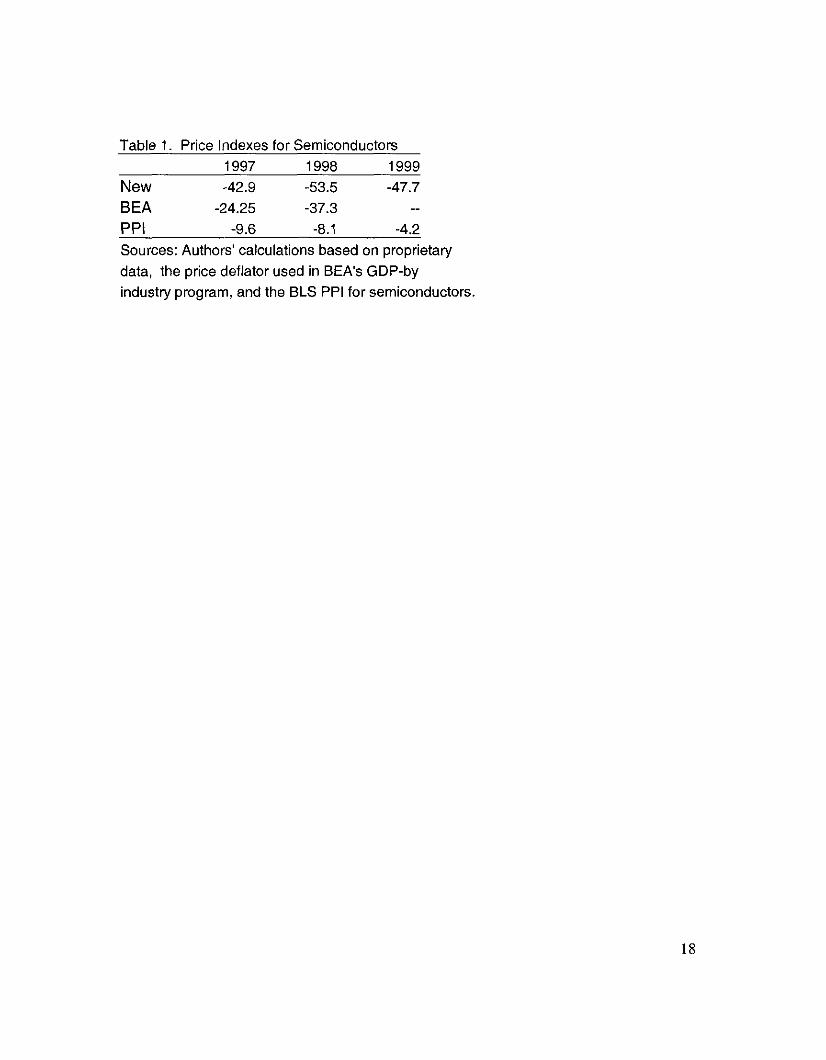
Table 1. Price Indexes for Semiconductors 1997 1998 1999
New -42.9 -53.5 -47.7 BEA -24.25 -37.3 _ _ PPI -9.6 -8.1 -4.2 Sources: Authors' calculations based on proprietary data, the price deflator used in BEAs GDP-by industry program, and the BLS PPI for semiconductors.
18

Table 2. Price Indexes for MOS Memory Chips (percent change)
1992 1993 1994 1995 1996 1997 1998 1999 MOS Memory
New Grimm
DRAM New Grimm
EEPROM New Grimrn
EPROM New Grimm
Flash and ROM New Grimm
SRAM New
._ -2.1 3.0 -6.1 -41.6 -49.7 -53.9 -17.5 -22.4 -6.4 0.3 -7.6 -46.0
-29.8 1.6 2.1 -1.5 -57.2 -64.0 -65.1 -15.7 -29.5 -1.5 2.2 -2.6 -59.4
-19.8 -8.8 -20.9 -17.2 2.3 -44.1 39.3 -62.4 -18.7 -8.2 -19.7 -16.2 -4.2
-12.3 -12.9 0.8 -1 6.9 -1.4 -33.1 -28.6 -19.1 -11.2 -12.1 0.7 -1 6.9 3.4
-11.o -19.2 -6.2 -20.0 -12.2 -9.1 -63.6 -17.3 -16.8 -12.3 -28.3 -39.9 -32.0
-17.4 -9.1 10.0 -10.1 -33.1 -35.3 -35.0 -11.7 Grimm (-29.4, -9.1) (-3362.7) (-6.3,-2.0) (-36.0,lg.O)(-13.3,-15.5)
Sources: Authors' calculations based on proprietaty data and Grirnrn(1998). Note: Figures are percent changes for annual averages.

Table 3. Price Indexes for Microprocessors
Non-Embedded Grirnrn ACD Embedded Total
1993 -30.0 1994 -37.1 -31.6 1995 -65.9 -58.6 1996 -60.0 -60.8 1997 -53.2 -39.6 -52.1 1998 -67.3 -8.9 -63.8 1999 -61.7 15.3 -57.4 Source: Grirnrn (1998), Aizcorbe, Corrado and Dorns (2000)
20

1 2 3 4 5 6 7 8 9
10 11 12 13 14 15 16 17 18 19 20 21 22 23 24 25 26 27 28 29 30 31 32 33 34 35 36 37 38 39 40 41 42 43 44 45 46 47 48 49 50 51 52 53 54 55 56 57
Table AI. Data sources and coveraae
Product Description
IC gallium arsendide Memory Logic and other.
Bipolar memory (SRAM)... xSRAM
Bipolar transistors Transistor-transistor logic (TTL).
DATA SOURCE DO MDR SIA Nodata
Emitter coupled logic (ECL)
MOS memory
MOS logic
other
analog
hybrid
IC Transistors
xECL,xTTL DRAM DRAM DRAM DRAM DRAM SRAM SRAM SRAM SRAM SRAM EEPROMS EEPROMS EEPROMS EPROMS~~
EPROMS EPROMS
Not over 80K. Over 80k but not over 300k. Over 300k but not over 3MB. Over 3MB but not over 15MB Over 15MB.... Not over 40K. Over 40K but not over 80K.. Over 80K but not over 300K. Over 300K but not over 3MB Over 3MB..... Not over 80K. Over 80K but not over 900K Over 900K.... Not over 80K. Over 80K but not over 900K. Over 900K....
Other nonvolati nec MPUs having an internal data bus of 8 bits or less MPUs having an internal data bus of 16 bits. MPUShaving an internal data bus of 32 bits or more Other (microcontroilen. ASICs, P u s . etc.) ..... Complementary BiMOS (BiCMOS)...... Other complementary BiMOS(BiCM0S). including logic Other digital silicon ICs.. Radio frequency..... Other, analog Other, including mixed signal (analogldigital). logic . Other, includingmixed signal (analogidigital). other.. Radio frequency Other... Other..... _ _ _ Sgna [ ess inan 1 wan a ssipaleon) Power (1 wall or qrearer owsipat8on)
Diodes and rectitiers... le .5amps gt.5amps Zener diodes Selenium rectifiers.... Microwave diodes
Llght-emitllng diodes Solar cells... Discrete, infrared and laser..... Alpha or numeric displays. Photodiodes, including infrared detectors. Optical coupled isolators, including sensors and emilten Other light sensitive and light-emitting devices
Thyristors Hall etfect devices.. All other semiconductor devices Semiconductor parts: Chips and waif For integrated circuits ( ICS) ...~ ~
Chips and waff For discrete semiconductors...... All other semiconductor parts
Note: Data sources are denoted as follows: Dataquest, Inc. (DO), MicroDesign Resource5 Association (SIA), Aizcorbe. Corrado and Doms (ACD).

Table A2. Price Indexes for MOS Memory Devices DRAM SRAM EEPROM EPROM Flash & ROM
90q4 1.ooooo 1.ooooo 1.ooooo 1.ooooo 1.ooooo 91q l 0.90454 1.27977 0.86309 1.07021 0.87747 9192 0.86970 0.99324 0.78711 1.01097 0.83481 9193 0.79076 0.97790 0.72742 0.95661 0.80459 91q4 0.71292 0.89898 0.67095 0.88462 0.77312 92ql 0.64331 0.86549 0.65562 0.93481 0.83244 92q2 0.57623 0.85774 0.62700 0.86130 0.76592 92q3 0.54328 0.84742 0.59484 0.83307 0.69829 92q4 0.53672 0.85848 0.56807 0.80986 0.63116 93ql 0.56565 0.78027 0.59331 0.73551 0.61024 93q2 0.57869 0.76316 0.56853 0.74051 0.59702 93q3 0.58410 0.77220 0.54057 0.75440 0.58679 93q4 0.60846 0.80001 0.52708 0.76529 0.57241 94ql 0.62013 0.85038 0.45824 0.77880 0.59667 94q2 0.59909 0.87190 0.44917 0.76896 0.56673 94q3 0.58617 0.85180 0.43635 0.74136 0.53953 94q4 0.58072 0.85169 0.42008 0.73090 0.51649 95ql 0.58635 0.74758 0.381 11 0.63772 0.47000 95q2 0.59570 0.75498 0.36968 0.62689 0.45572 95q3 0.60288 0.78507 0.35811 0.61476 0.42816 95q4 0.56550 0.79341 0.35098 0.62897 0.42177 96ql 0.43951 0.72044 0.42567 0.65056 0.46379 96q2 0.24080 0.55032 0.39267 0.63334 0.39910 96q3 0.17278 0.41731 0.35435 0.63150 0.35861 96q4 0.15308 0.37232 0.32064 0.55828 0.33679 97ql 0.11921 0.35484 0.22782 0.44260 0.40209 97q2 0.10318 0.33767 0.21402 0.41942 0.35328 97q3 0.07707 0.32408 0.20204 0.39700 0.33680 97q4 0.06261 0.31658 0.19095 0.39601 0.32478 98ql 0.04397 0.28819 0.30672 0.30934 0.15173 98q2 0.03173 0.22368 0.29444 0.29751 0.13563 98q3 0.02438 0.18676 0.28388 0.29001 0.1 1628 98q4 0.02635 0.16806 0.27750 0.28411 0.1 1256 99ql 0.02944 0.20599 0.11600 0.29738 0.09795 99q2 0.02397 0.19648 0.1 1200 0.25040 0.09492 99q3 0.02274 0.18663 0.10762 0.21741 0.11193 99q4 0.03040 0.17606 0.10121 0.19038 0.12230
Source: Author's calculations based on proprietary data from DATAQUEST, Inc.

Table A3. Worldwide Nominal Shipments of MOS Memory Devices (thousands of dollars)
DRAM SRAM EPROM OTHER 91q 1 1644725 596927 378601 328027 91q 2 1617883 604197 372471 379817 91q 3 1672352 643032 336399 459999 91q 4 1669989 644864 349036 534781 92q 1 1949566 696622 292843 451364 92q 2 2016150 714642 326468 482509 92q 3 2199226 741738 316658 578184 92q 4 2358005 737713 311754 661911 93q 1 2587181 727060 304839 648092 93q 2 3033703 837952 337744 779764 93q 3 3567432 882950 353135 979120 93q 4 3952027 847395 353882 1074591 94q 1 4431633 822165 373448 925429 94q 2 5362752 882633 382392 879980 94q 3 6276922 990620 323870 987375 94q 4 7345981 1058872 308470 1097784 95q 1 8014834 1224892 334643 1072318 95q 2 9544862 1518808 380673 1141456 95q 3 10805591 1555278 343454 1409723 95q 4 12467465 1773845 326366 1543702 96q 1 9968980 1506514 324589 1314932 96q 2 5945874 1301360 335052 1180001 96q 3 4570186 1009045 234884 1247309 96q 4 4647148 928150 208452 1295735 97q 1 4672817 793342 190516 1183455 97q 2 5197474 893831 190802 1255868 97q 3 5504164 1063065 182233 1237759 97q 4 4423668 I092245 176747 1277109 98q 1 3592660 1105640 153955 1118726 98q 2 2850987 957372 136223 1096883 98q 3 3250753 894800 109652 1062461 98q 4 4316359 936678 122178 1287674 99q 1 4676241 1063097 119165 1178048 99q 2 4292581 1078161 120612 1378512 994 3 4914244 1163833 117718 1681730 99q 4 6830781 1357074 129138 2185195
Source: Author's calculations based on SIA's WSTS survey.

Table A4. Price Index and Nominal ShiDments for Microprocessors (thousands of dollars)
Intel Price Index
Worldwide Nominals Total Embedded
93ql 93q2 93q3 93q4 94ql 94q2 94q3 94q4 95ql 95q2 95q3 95q4 96ql 96q2 96q3 96q4 97ql 97q2 97q3 97q4 98ql 98q2 98q3 98q4 99ql 99q2 99q3 99q4
1.oooo 0.9620 0.9080 0.8100 0.7670 0.6900 0.5810 0.4860 0.3790 0.2940 0.2250 0.1750 0.1290 0.0986 0.0806 0.0765 0.0657 0.0512 0.0387 0.0302 0.0213 0.0156 0.01 17 0.0098 0.0079 0.0061 0.0047 0.0038
2,067,163 2,116,777 2,176,177 2,229,569 2,591,130 2,667,331 2,715,836 3,021,189 3,619,841 3,528,236 3,412,064 3,718,451 4,011,002 3,881,352 4,608,572 6,029,070 6,299,936 5,680,634 5,535,553 5,950,806 5,280,009 5,449,305 6,552,289 7,494,042 6,777,190 5,902,013 6,805,851 7,706,351
116,629 125,791 153,216 153,696 173,502 196,543 191,454 200,507 255,592 349,375 373,525 359,540 416,669 462,456 379,410 507,696 473,183 437,011 502,201 598,598 397,315 441,612 528,012 635,748 465,266 572,748 586,976 713,982
Sources: Index: Aizcorbe, Corrado and Doms (20OO)--col(l),table 12 Worldwide nominals: obtained from SIAs WSTS survey Embedded: Author's calculation based on data from SIA (Shares from SIAs MicroprocessorReport applied to WSTS revenues for MPUs)

Table A5. Price Indexes Used for MOS Logic and Microcomponents
MOS MICRO MPU
Non-embedded Embedded
MCU DSP
MPR MOS LOGIC
GENERAL PURPOSE LOGIC (GPL) GATE ARRAY (GA) STANDARD CELL (STDCELL) FIELD PROGRAMMABLELOGIC (FPL) OTH SPECIAL PURPOSE LOGIC
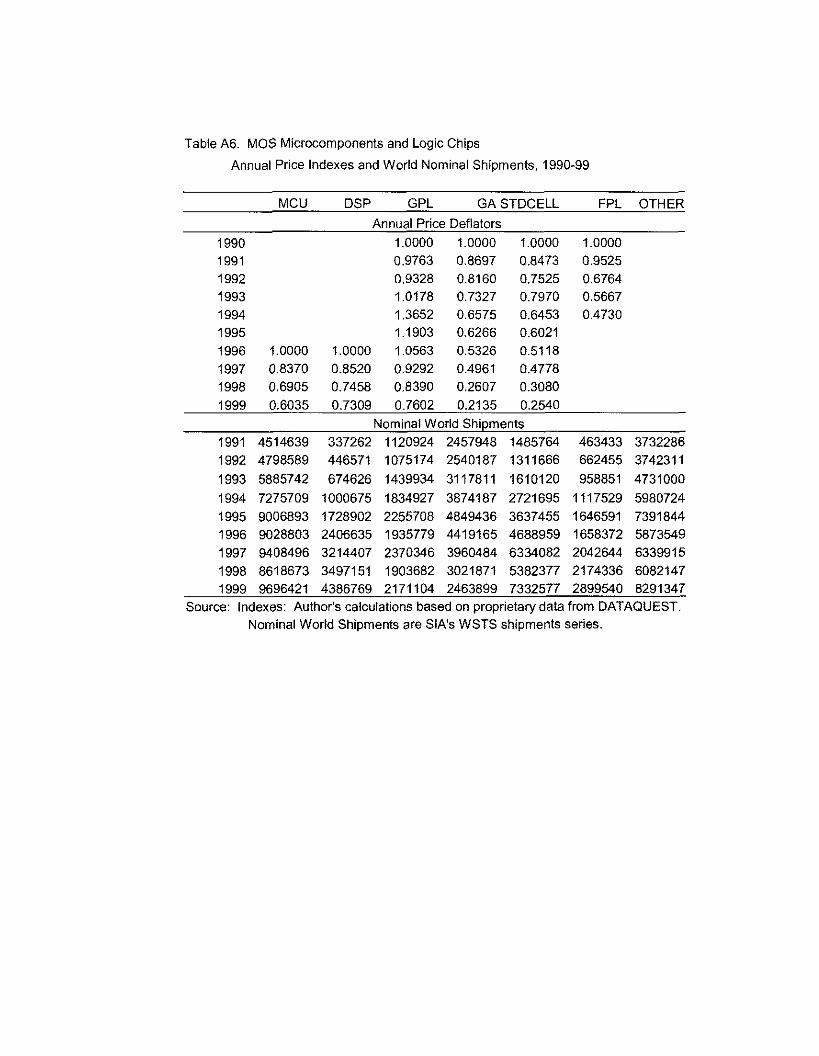
Table A6. MOS Microcomponents and Logic Chips
Annual Price Indexes and World Nominal Shipments, 1990-99
MCU DSP GPL GA STDCELL Annual Price Deflators
1990 1.0000 1.0000 1.0000 1991 0.9763 0.8697 0.8473 1992 0.9328 0.8160 0.7525 1993 1.0178 0.7327 0.7970 1994 1.3652 0.6575 0.6453 1995 1.1903 0.6266 0.6021 1996 1.0000 1.0000 1.0563 0.5326 0.5118 1997 0.8370 0.8520 0.9292 0.4961 0.4778 1998 0.6905 0.7458 0.8390 0.2607 0.3080 1999 0.6035 0.7309 0.7602 0.2135 0.2540
Nominal World Shipments 1991 4514639 337262 1120924 2457948 1485764 1992 4798589 446571 1075174 2540187 1311666 1993 5885742 674626 1439934 3117811 1610120
FPL OTHER
1.0000 0.9525 0.6764 0.5667 0.4730
463433 3732286 662455 3742311 958851 4731000
1994 7275709 1000675 1834927 3874187 2721695 1117529 5980724 1995 9006893 1728902 2255708 4849436 3637455 1646591 7391844 1996 9028803 2406635 1935779 4419165 4688959 1658372 5873549 1997 9408496 3214407 2370346 3960484 6334082 2042644 6339915 1998 8618673 3497151 1903682 3021871 5382377 2174336 6082147 1999 9696421 4386769 2171104 2463899 7332577 2899540 8291347
Source: Indexes: Author's calculations based on proprietary data from DATAQUEST. Nominal World Shipments are SIAs WSTS shipments series.

Title A7 Price Indexes for Other Integrated Circuits and Discrete Devices Other IntegratedCircuits Discrete Devices
Bipolar Analog Small Trans. Power Trans Diodes/Recs Opto-LEDs Thyristors _ _ _ _ _ _ _ .___------..___ _ _ _ _ _ _ _ _ _ _ _ _ Jan 92 1.ooooo 1.ooooo 1.ooooo 1.ooooo 1.ooooo 1.ooooo 1.ooooo Feb 92 1.05495 0.97337 1.00853 1.01468 0.88675 0.97885 0.71093 Mar 92 0.97011 0.99034 0.98080 0.99351 0.89003 0.93849 0.63799 Apr May Jun
92 92 92
0.99034 0.94738 0.98724
0.92281 0.96455 0.97442 0.96109 0.98170 0.95826 1.00244 1.01712 0.97248
0.86476 0.86933 0.87900
0.98140 0.95221 0.96279
0.65624 0.64750 0.62889
Jul 92 1.04713 0.99165 1.00401 0.95376 0.88855 1.00377 0.66767 Aug SepOct
92 92 92
1.00737 1.13236 1.03261
1.01341 1.01554 0.94191 1.07617 1.07834 0.97668 1.08119 1.04872 0.95331
0.89225 0.94887 0.95203
1.00764 1.07188 1.07839
0.68618 0.66760 0.67659
Nov 92 1.00281 1.03626 0.99203 0.93361 0.88486 1.06279 0.66832 Dec 92 0.95200 1.07268 1.01032 0.94684 0.87654 1.01656 0.62504 Jan 93 1.001 96 1.08199 0.99896 0.9291 1 0.87266 1.03665 0.63686 Feb 93 0.95908 1.02670 1.00489 0.92286 0.87273 1.03516 0.66564 Mar 93 0.98323 1.08869 1.04187 0.94882 0.87427 1.05946 0.68187 Apr MayJun
93 93 93
1.06346 1.08126 1.10058
1.09890 1.04561 0.97455 1.05239 1.08575 0.94566 1.11894 1.09670 0.97143
0.90870 0.89887 0.90513
1.03747 0.98605 1.00220
0.65933 0.67587 0.64459
Jul 93 1,11570 1.07953 1.03525 0.96936 0.87903 0.98558 0.68067 93 1.15082 1.08572 1.06708 0.97797 0.89629 1.03859 0.68171
SepOct
93 93
1.14975 1.20928
1.09359 1.09016 0.99392 1.12002 1.05604 0.98704
0,91278 0.92518
1.03226 1.00503
0.78162 0.68317
Nov 93 1.19269 1.07007 1.01 185 0.96048 0.90378 1.01311 0.70260 Dec 93 1.14395 1.08931 1.04021 0.97262 0.90274 0.97192 0.59634 Jan 94 1.16727 1.10255 1.00815 0.97383 0.88755 0.98728 0.65786 Feb 94 1.17341 1.10717 1.01749 1.02181 0.90451 1.00372 0.73800 Mar 94 1.08670 1.15051 1.05084 0.97819 0,91394 1.05145 0.64902 APr 94 1.14634 1.16008 1.02209 0.96256 0.91977 1.01689 0.65725 MayJun
94 94
1.09138 1.14728
1.13585 1.04698 0.96086 1.14875 1.07136 0.98016
0.85272 0.91 182
1,01955 1.04370
0.63319 0.64008
Jul 94 1.12434 1.18426 1.07926 1.01426 0.921 01 1.03499 0.73663 Aug SepOct
94 94 94
1.10781 1.09729 1.14349
1.16237 1.081 74 1.00259 1.21899 1.11989 1.02066 1.22298 1.08319 1.04455
0.90974 0.94267 0.93518
1.01526 1.00515 1.00539
0.72678 0.81400 0.71057
Nov 94 1.13206 1.20106 1.07846 1.00934 0.93438 1.00505 0.69059 Dec 94 1.11060 1.21605 1.07958 0.98166 0.93758 0.99969 0.62384 Jan 95 0.99807 1.21540 1.09602 1.00078 1.02593 1.01336 0.65958 Feb 95 1.07518 1.17977 1.06825 1.00892 1.02893 1.01760 0.65816 Mar 95 1.01758 1.24654 1.12111 1.05591 1.06207 1.05977 0.63426 APr 95 1.05958 1.29439 1.16011 1.10662 1.10321 1.11100 0.67607 MayJun
95 95
1.13071 1.25339
1.26904 1.15837 1.05029 1.28165 1.1 1337 1.08396
1.06105 1.08361
1.10675 1.07499
0.66805 0.70975
Jul 95 1.11126 1.28452 1.07550 1.02299 1.08434 1.08279 0.63614 95 1.12525 1.20299 0.99819 0.98593 0.98355 1.03065 0.59631
Sep 95 1.14202 1.22664 0.99519 0.95519 0.99782 1.05297 0.58785 Oct 95 1.03539 1.26685 1.04218 0.96366 0.99244 0.97894 0.57269 Nov 95 1.01146 1.23645 1.03195 0.93959 0.97001 0.99598 0.61216 Dec 95 1.08294 1.24044 1.05238 0.92503 1.05278 0.97586 0.44491
_ _ _ _ -.__ _ _ _ _ _ _ _ _ _ _ _ ___.

Title A7 Price Indexes for Other lntearated Circuits and Discrete Devices (cont.) Other Integrated Circuits Discrete Devices
Bipolar Analog Small Trans. Power Trans DiodeslRecs Opto-LEDs Thyristors -_ _ _ _ _ _ _ _____._ _ _ _ _ _ _ _ _ _ _ _ --__ _ _ _ _ _ _ _ _ _ _ _ _ _ _ _ _ _ - _ _ _ _ _ _ _ _ ~ _ _ _ _ _ _ _ _ _
Jan 96 0.92372 1.26784 1.01557 0.93990 0.93559 0.99087 0.58017 Feb 96 1.01897 1.23321 1.03528 0.88994 0.95650 0.99165 0.62619 Mar 96 1.02567 1.29686 1.06934 0.88972 0.93791 0.98635 0.48753 APr 96 0.99790 1.33185 1.02589 0.85596 0.91671 1.00918 0.48833 May 96 1.05356 1.25596 1.00226 0.88585 0.87621 0.99158 0.63399 Jun 96 0.96129 1.32733 1.03812 0.87886 0.88568 0.97448 0.46909 Jut 96 0.98798 1.29759 1.01227 0.88846 0.85729 0.94712 0.58040 Aug 96 0.92718 1.24390 0.98745 0.83338 0.83093 0.90964 0.64368 Sep 96 0.88931 1.28224 0.99075 0.82317 0.83704 0.93048 0.46779 Oct 96 0.71720 1.31573 0,99910 0.80900 0.80860 0.88929 0.65669 Nov 96 0.80846 1.23608 1.03701 0.78492 0.84810 0.90053 0.60771 Dec 96 0.96109 1.24722 0.94567 0.78605 0.79244 0.86241 0.45676 Jan 97 0.71999 1.29130 0.92195 0.78073 0.74724 0.85316 0.53956 Feb 97 0.72426 1.20840 0.88380 0.75417 0.73893 0.76539 0.97728 Mar 97 0.67966 1.20698 0.85928 0.73139 0.73678 0.77764 0.56056 APr 97 0.71670 1.25093 0.81390 0.71 171 0.72276 0.73679 0.57301 May 97 0.71847 1.20110 0.82122 0.72308 0.74128 0.74420 0.85632 Jun 97 0.80476 1.20065 0.85531 0.71 142 0.75975 0.76310 0.57251 Jul 97 0.74080 1.16867 0.83380 0.70101 0.74188 0.77635 0.68601 A 4 97 0.74455 1.12185 0.80894 0.70512 0.71782 0.75225 0.62733 Sep 97 0.77712 1.17722 0.79351 0.71555 0.73321 0.77882 0.54098 Oct 97 0.73624 1.20861 0.82487 0.70521 0.70099 0.71816 0.79346 Nov 97 0.75697 1.13519 0.78406 0.67865 0.67382 0.70559 0.59996 Dec 97 0.76948 1.15847 0.76501 0.67327 0.68982 0.71788 0.59387 Jan 98 0.77535 1.17388 0.74255 0.66019 0.66311 0.71190 0.73338 Feb 98 0.73028 1.08456 0.76628 0.65476 0.65949 0.71026 0.67817 Mar 98 0.67727 1.13571 0.75323 0.63788 0.70365 0.71768 0.60164 APr 98 0.70003 1.17066 0.73064 0.65459 0.62092 0.69165 0.61521 May 98 0.69938 1.Of3686 0.69968 0.66578 0.63287 0.68806 0.52972 Jun 98 0.69229 1.08759 0.67465 0.65335 0.63547 0.69063 0.48334 Jul 98 0.76640 1.09790 0.66165 0.67974 0.60889 0.69545 0.59139 Aug 98 0.73081 1.03350 0.64891 0.62314 0.59910 0.65485 0.50921 SeP 98 0.62886 1.08079 0.68699 0.62269 0.63232 0.67430 0.55737 Oct 98 0.771 14 1.11689 0.71430 0.66405 0.67223 0.75574 0.59186 Nov 98 0.741 69 1.05008 0.69919 0.60870 0.65861 0.73599 0.55969 Dec 98 0.68570 1.11526 0.73028 0.62315 0.67674 0.72620 0.47665 Jan 99 0.77701 1.08515 0.75480 0.63655 0.67055 0.72561 0.47713 Feb 99 0.70499 1.03405 0.74058 0.67567 0.66292 0.70960 0.47736 Mar 99 0.72604 1.05485 0.69943 0.67503 0.64119 0.69985 0.41321 APr 99 0.90258 1.04774 0.68240 0.64172 0.62115 0.67383 0.44424 May 99 0.89238 1.04852 0.67943 0.65616 0.58613 0.63565 0.46097 Jun 99 0.97066 1.07268 0.64899 0.64973 0.61070 0.66828 0.38455 Jul 99 1.04170 1.05872 0.64865 0.63555 0.58357 0.62987 0.41292 Aug 99 1.12788 1.05045 0.67668 0.63911 0.59451 0.64753 0.41517 Sep 99 1.13965 1.09584 0.69349 0.66492 0.63512 0.68114 0.38511 Oct 99 1.03753 1.08823 0.71106 0.65595 0.62076 0.67006 0.40564 Nov 99 0.88370 1.06893 0.71103 0.63206 0.61081 0.69550 0.37701 Dec 99 0.96389 1.10499 0.69220 0.65661 0.63553 0.74744 0.38226
Source: Author's calculations based on proprietaly data from Semiconductors Industries Association

Table A8. WSTS Worldwide Nominal Shipments for Semiconductor Devices (thousands of dollars) MOS Memories MOS MicrolLogic
Bipolar DRAM MEMxDRAM MPU LogicxMPU Analog Sm. Trans. Power Trans DiodeslRecs LEDs Thyristors 92 q 1 780779 1949566 1440829 1117277 4105243 2005724 426469 625752 593510 559222 134319 92 q 2 780485 2016150 1523619 1083794 4321540 2149636 443986 644688 585216 552514 131375 92 q 3 787745 2199226 1636580 1363164 4690261 2303512 470768 687591 616694 614189 134728 92 q 4 798440 2358005 1711378 1896024 4665148 2269815 442097 671788 589219 571453 126720 93 q 1 766626 2587181 1679991 2067163 4782507 2312645 439668 685548 608409 573435 130520 93 q 2 795672 3033703 1955460 2116777 5575626 2726191 505931 761328 670427 662255 146561 93 q 3 813916 3567432 2215205 2176177 6036707 2840058 527645 797427 713364 724894 155746 93 q 4 773638 3952027 2275868 2229569 5944653 2794125 506704 771241 692238 693534 154394 94 q 1 703483 4431633 2379946 2591130 6054821 2974677 520084 797412 708899 712699 163651 94 q 2 727218 5362752 2432209 2667331 6916078 3403248 598422 921351 797282 804671 173698 94 q 3 653139 6276922 2602900 2715836 7465219 3546455 651324 968684 833980 852549 184291 94 q 4 689825 7345981 2752424 3021189 7917529 3660789 662735 1017461 874646 868468 185139 95 q 1 636728 8014834 2928091 3619841 8497652 3811916 737967 1151696 957542 965644 191847 95 q 2 765009 9544862 3369315 3528236 9966339 4392447 926551 1346619 1086498 1153978 219169 95 q 3 712382 10805591 3654945 3412064 10055203 4309055 867781 1359169 1079498 1146573 210629 95 q 4 659759 12467465 4015142 3718451 10379169 4132935 776720 1324084 1031256 1077366 185278 96 q 1 542706 9968980 3424623 4011002 10097856 41 12303 731743 1321475 1025579 1058177 192251 96 q 2 469282 5945874 3074815 3881352 10101117 4250916 701681 1306113 982626 1053034 185895 96 q 3 452324 4570186 2758689 4608572 10346549 4218746 729284 1201378 931940 1029084 177261 96 q 4 461348 4647148 2713640 6029070 10877773 4461840 722162 1107102 934769 1006455 182371 97 q 1 414936 4672817 2455578 6299936 10874076 4388187 670669 1168838 926476 1013475 202598 97 q 2 424059 5 197474 2658291 5680634 11412864 4863964 704042 1285973 1000611 1104135 225347 97 q 3 388650 5504164 2808223 5535553 11759069 5174105 716575 1331019 1023760 1227580 225941 97 q 4 366374 4423668 2850718 5950806 11301285 5362683 665647 1297789 999219 1160739 251770 98 q 1 338456 3592660 2457640 5280009 10536125 4940026 607527 1181246 962494 1161185 258525 98 q 2 281161 2850987 2190478 5449305 9962080 4763431 596320 1133941 895458 1136880 215718 98 q 3 230900 3250753 2066913 6552289 10059798 4576185 578923 1111481 847380 1127614 194452 98 q 4 249195 4316359 2346530 7494042 10564448 4793313 591530 1190296 903968 1193764 174846 99 q 1 209483 4676241 2360310 6777190 10024142 4767060 620115 1210163 890228 1236013 157814 99 a 2 244098 4292581 2577285 5902013 10606395 5125587 632800 1261647 952438 1308651 163600 99 q 3 289179 4914244 2963281 6805851 11772374 5710442 705609 1403431 1026177 1544362 162583 99 q 4 247540 6830781 3671407 7706351 12995978 6478612 Source, Author's calculations based on SIAs WSTS shipments series.
794085 1528925 1146004 1688768 178029

15
Chart 1. Price Indexes for MOS Memory Chips (Percent change, annual rate)
MOS Memories u PPI
WORLD
25
20
15
10
5
0
-5
-10
-15
-20
-25
-30
-35
4
-45
-50
-55
-60
.65
25
20
15
lo
5
0
-5
-10
-15
-20
-25
-30
-35
-40
-45
-50
-ss
-60
-65
m us
I997 I998
DRAM 0PPI= W O R D 25
r 20
10
5
n
-5
-10
-I5
-20
-25
-3c
.33
4
-45
-5c
-5:
-6C
I -6: I997 1998 I9W
1999
Other MOS Memory Chips 0PPI
WORLD
1 1991 1998 1999
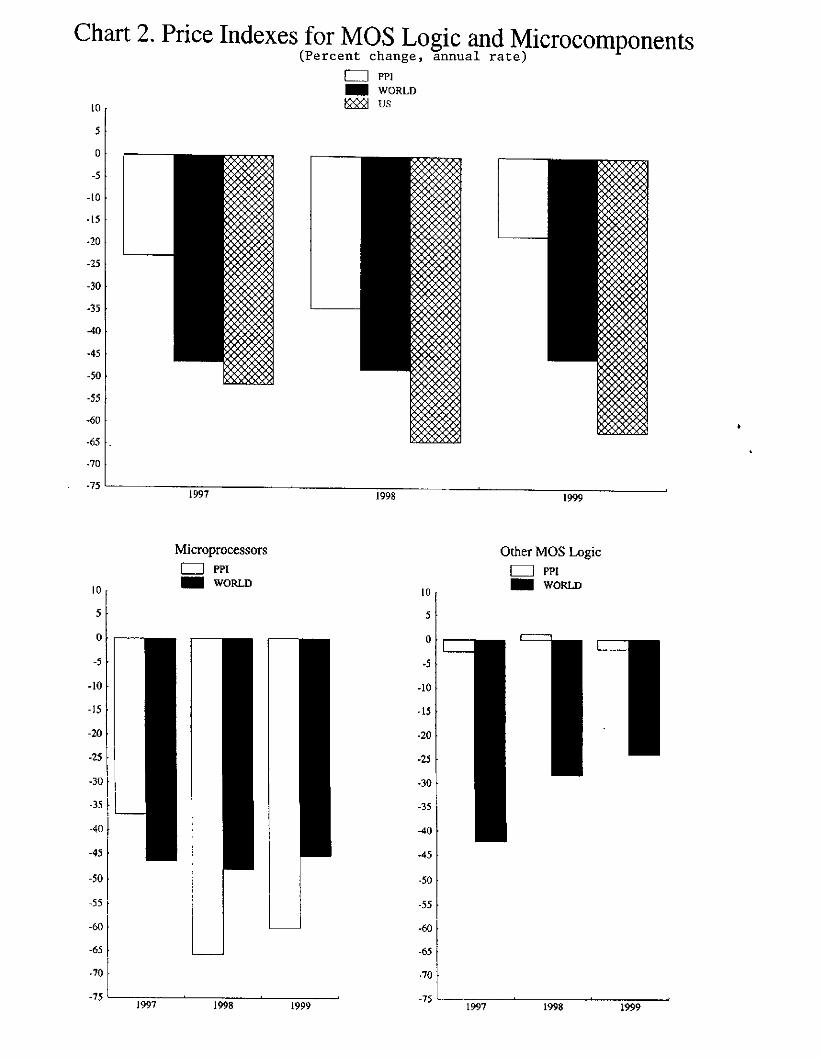
Chart 2. Price Indexes for MOS Logic and Microcomponents(Percent change, annual rate)
0PPI WORLD
10, m us
0
-5
-10 .
- I 5
-20
-25
-30
-35
-40
-45
-so -55
-60
-65
-70
--75
i n
5
0
-5
-10
-15
-m
-25
-30
-3s
-40
-45
-50
-55
-60
-65
-70
-75
Microprocessors 0PPIN WORLD
10
5
0
-5
-10
-15
-20
-2s
.30
-35
-40
-45II -50
-55
-60
-65
.70
-75 1997 1998 1999
I
1999
Other MOS h g i c 0PPI
WORLD
Ic
1997 1998 1999

Chart 3. Price Indexes for Other Integrated Circuits (Percent change, annual rate)
I t
5
0
-5
-10
-15
-20 1997 1998 1999