Price and Income Elasticity of Indian Exports — The Role ... · PDF file6 petroleum as a...
16
WP/15/161 IMF Working Papers describe research in progress by the author(s) and are published to elicit comments and to encourage debate. The views expressed in IMF Working Papers are those of the author(s) and do not necessarily represent the views of the IMF, its Executive Board, or IMF management. Price and Income Elasticity of Indian Exports — The Role of Supply-Side Bottlenecks by Mehdi Raissi and Volodymyr Tulin
Transcript of Price and Income Elasticity of Indian Exports — The Role ... · PDF file6 petroleum as a...

WP/15/161
IMF Working Papers describe research in progress by the author(s) and are published to elicit comments and to encourage debate. The views expressed in IMF Working Papers are those of the author(s) and do not necessarily represent the views of the IMF, its Executive Board, or IMF management.
Price and Income Elasticity of Indian Exports —The Role of Supply-Side Bottlenecks
by Mehdi Raissi and Volodymyr Tulin

© 2015 International Monetary Fund WP/15/161
IMF Working Paper
Asia and Pacific Department
Price and Income Elasticity of Indian Exports—The Role of Supply-Side Bottlenecks
Prepared by Mehdi Raissi and Volodymyr Tulin1
Authorized for distribution by Paul Cashin
July 2015
Abstract
This paper estimates the short-term and long-run price and income elasticity of Indian exports, and investigates the role of supply-side bottlenecks in shaping India’s export demand relationship. We use disaggregated export volume data for 45 Indian industries over the period 1990-2013, as well as industry-specific international relative prices, for estimation. Our results indicate that Indian exports are sensitive to international relative-price competitiveness, world demand, and energy shortages. In addition, binding supply-side constraints (notably energy shortages) dampen price responsiveness in the short-term.
JEL Classification Numbers: F14, C23, O14, O24
Keywords: India, export demand, manufacturing, income and price elasticity, energy shortages
Authors’ E-Mail Addresses: [email protected]; [email protected]
1 We are grateful to Rahul Anand, Maximiliano Appendino, Patrick Blagrave, Paul Cashin, Carlos Goncalves, Muneesh Kapur, Rakesh Mohan, Markus Rodlauer, and our colleagues in the Asia and Pacific Department (APD) for helpful comments and discussions. We benefited from the feedback received from seminar participants at the Indian Council for Research on International Economic Relations (April 2015) and APD Discussion Forum (June 2015).
IMF Working Papers describe research in progress by the author(s) and are published to elicit comments and to encourage debate. The views expressed in IMF Working Papers are those of the author(s) and do not necessarily represent the views of the IMF, its Executive Board, or IMF management.

3
Contents Page
I. Introduction ..........................................................................................................................4
II. Background ..........................................................................................................................5
III. The Estimation Methodology ..............................................................................................7
IV. Data ......................................................................................................................................9
V. Results .................................................................................................................................10
VI. Conclusions and Policy Implications.................................................................................13
Figures 1. India’s Merchandise Exports: 1990-2014 ............................................................................4 2. Evolution of India’s Market Share .......................................................................................5 3. Product Space of India’s Merchandise Exports, 2012 .........................................................5 4. India’s Merchandise Export Volume ...................................................................................6 5. Trading Partners’ GDP Growth and Real Exchange Rate ...................................................6 6. All India: Peak and Energy Deficit, Utilities .......................................................................6 7. Electricity Power: Demand and Supply ...............................................................................7 8. India: Mining and Electricity Production ............................................................................7 9. Merchandise Exports and Electricity Generation ................................................................7 10. Non-oil Imports of India’s Trading Partners .....................................................................13 Tables 1. Pooled Mean Group Estimates of the Long-run and Short-Run Export Elasticities ........11 2. Pooled Mean Group Estimates of the Long-run and Short-Run Export Elasticities, the
Role of Supply-Side Constraints ......................................................................................12 References ................................................................................................................................15
4
I. INTRODUCTION
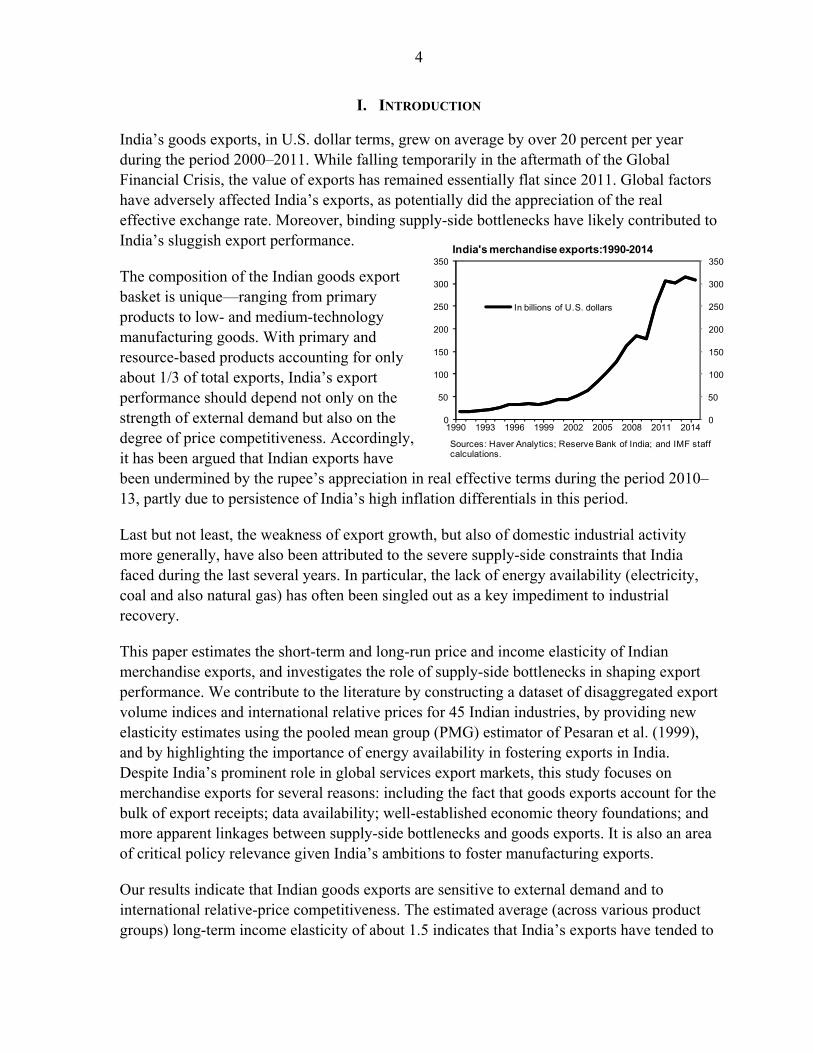
India’s goods exports, in U.S. dollar terms, grew on average by over 20 percent per year during the period 2000–2011. While falling temporarily in the aftermath of the Global Financial Crisis, the value of exports has remained essentially flat since 2011. Global factors have adversely affected India’s exports, as potentially did the appreciation of the real effective exchange rate. Moreover, binding supply-side bottlenecks have likely contributed to India’s sluggish export performance.
The composition of the Indian goods export basket is unique—ranging from primary products to low- and medium-technology manufacturing goods. With primary and resource-based products accounting for only about 1/3 of total exports, India’s export performance should depend not only on the strength of external demand but also on the degree of price competitiveness. Accordingly, it has been argued that Indian exports have been undermined by the rupee’s appreciation in real effective terms during the period 2010–13, partly due to persistence of India’s high inflation differentials in this period.
Last but not least, the weakness of export growth, but also of domestic industrial activity more generally, have also been attributed to the severe supply-side constraints that India faced during the last several years. In particular, the lack of energy availability (electricity, coal and also natural gas) has often been singled out as a key impediment to industrial recovery.
This paper estimates the short-term and long-run price and income elasticity of Indian merchandise exports, and investigates the role of supply-side bottlenecks in shaping export performance. We contribute to the literature by constructing a dataset of disaggregated export volume indices and international relative prices for 45 Indian industries, by providing new elasticity estimates using the pooled mean group (PMG) estimator of Pesaran et al. (1999), and by highlighting the importance of energy availability in fostering exports in India. Despite India’s prominent role in global services export markets, this study focuses on merchandise exports for several reasons: including the fact that goods exports account for the bulk of export receipts; data availability; well-established economic theory foundations; and more apparent linkages between supply-side bottlenecks and goods exports. It is also an area of critical policy relevance given India’s ambitions to foster manufacturing exports.
Our results indicate that Indian goods exports are sensitive to external demand and to international relative-price competitiveness. The estimated average (across various product groups) long-term income elasticity of about 1.5 indicates that India’s exports have tended to
0
50
100
150
200
250
300
350
0
50
100
150
200
250
300
350
1990 1993 1996 1999 2002 2005 2008 2011 2014
In billions of U.S. dollars
India's merchandise exports:1990-2014
Sources: Haver Analytics; Reserve Bank of India; and IMF staff calculations.

5
outpace growth of global demand. The average international relative price elasticity of about 0.9 is near unity, although manufacturing sector exports are estimated to be more price elastic, with an average coefficient of about 1.1. Manufacturing exports are also found to be sensitive to global demand developments in the short-term. Our results suggest that the prospects of a sluggish global economic recovery will pose challenges for India to achieve a significant export growth acceleration in the coming years. Finally, binding supply-side constraints (notably energy shortages) dampen the price responsiveness in the short-term.
The rest of the paper is organized as follows. Section II examines the evolution of Indian exports over the last two decades, while Sections III and IV describe the methodology and data used to estimate the export demand equations. Section V presents the empirical results. Section VI concludes and outlines key policy implications.
II. BACKGROUND
India’s exports, both as a share of GDP and as a percent of world exports, have been increasing strongly since the early 1990s. The pick-up in India’s world market share in non-oil exports have been particularly pronounced since the early 2000s—more than doubling from about ¾ of a percent to about 1¾ percent by 2011. Even more striking has been the surge in India’s market share in services exports, in which India now retains close to 4 percent of global services trade and about ⅓ of India’s total exports.
In the absence of natural resource abundance, India’s export basket has evolved to be relatively diverse. Manufacturing and chemical exports, which account for about ⅔ of total exports, are concentrated in the low- and medium-tech industries. The emergence of refined
Evolution of India's Market Share
Sources: World Economic Outlook, and IMF staff calculations.
0.0
0.5
1.0
1.5
2.0
0
1
2
3
4
1990 1993 1996 1999 2002 2005 2008 2011 2014
Exports of services
Exports of non-oil goods (right scale)
(In percent of world trade)
Product Space of India's Merchandise Exports, 2012
Source: The Atlas of Economic Complexity..
6
petroleum as a major export group underscores the capital intensity focus of industrial production in India (Anand and others, 2015). Nonetheless, key traditional sectors, such as cereal and tea production, have managed to retain their weight.
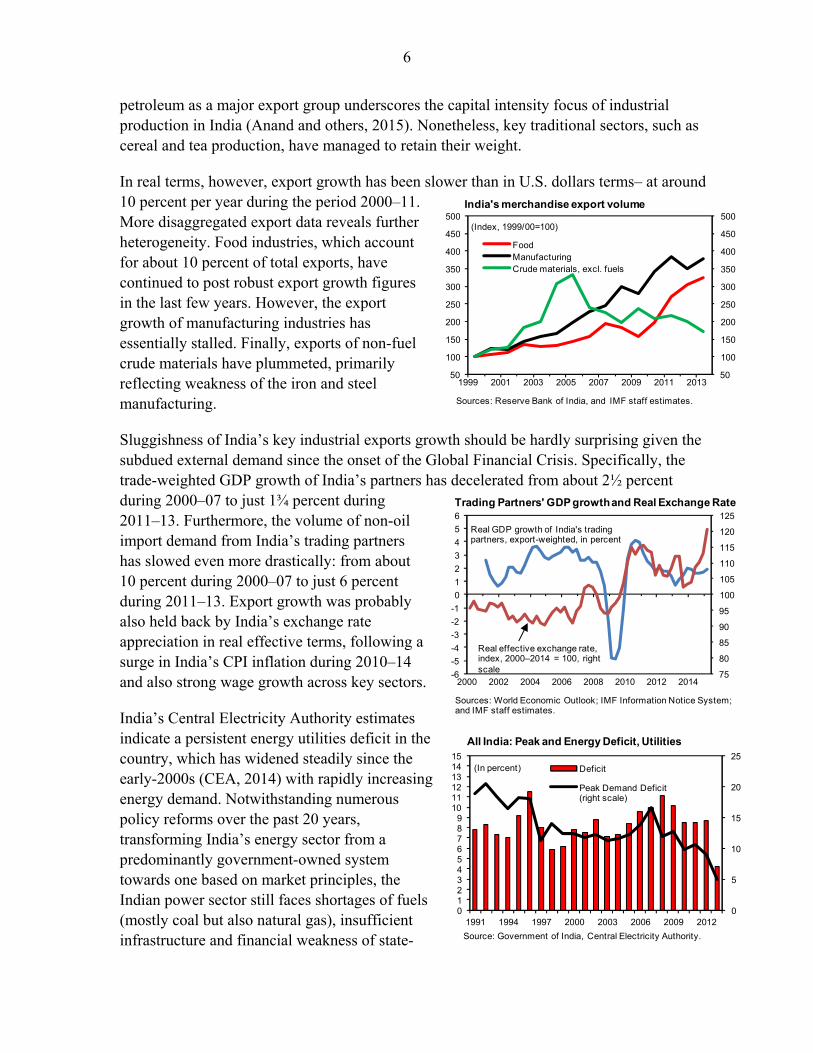
In real terms, however, export growth has been slower than in U.S. dollars terms– at around 10 percent per year during the period 2000–11. More disaggregated export data reveals further heterogeneity. Food industries, which account for about 10 percent of total exports, have continued to post robust export growth figures in the last few years. However, the export growth of manufacturing industries has essentially stalled. Finally, exports of non-fuel crude materials have plummeted, primarily reflecting weakness of the iron and steel manufacturing.
Sluggishness of India’s key industrial exports growth should be hardly surprising given the subdued external demand since the onset of the Global Financial Crisis. Specifically, the trade-weighted GDP growth of India’s partners has decelerated from about 2½ percent during 2000–07 to just 1¾ percent during 2011–13. Furthermore, the volume of non-oil import demand from India’s trading partners has slowed even more drastically: from about 10 percent during 2000–07 to just 6 percent during 2011–13. Export growth was probably also held back by India’s exchange rate appreciation in real effective terms, following a surge in India’s CPI inflation during 2010–14 and also strong wage growth across key sectors.
India’s Central Electricity Authority estimates indicate a persistent energy utilities deficit in the country, which has widened steadily since the early-2000s (CEA, 2014) with rapidly increasing energy demand. Notwithstanding numerous policy reforms over the past 20 years, transforming India’s energy sector from a predominantly government-owned system towards one based on market principles, the Indian power sector still faces shortages of fuels (mostly coal but also natural gas), insufficient infrastructure and financial weakness of state-
50
100
150
200
250
300
350
400
450
500
50
100
150
200
250
300
350
400
450
500
1999 2001 2003 2005 2007 2009 2011 2013
FoodManufacturingCrude materials, excl. fuels
(Index, 1999/00=100)
India's merchandise export volume
Sources: Reserve Bank of India, and IMF staff estimates.
75
80
85
90
95
100
105
110
115
120
125
-6
-5
-4
-3
-2
-1
0
1
2
3
4
5
6
2000 2002 2004 2006 2008 2010 2012 2014
Real GDP growth of India's trading partners, export-weighted, in percent
Real effective exchange rate, index, 2000–2014 = 100, right scale
Trading Partners' GDP growth and Real Exchange Rate
Sources: World Economic Outlook; IMF Information Notice System; and IMF staff estimates.
All India: Peak and Energy Deficit, Utilities
Source: Government of India, Central Electricity Authority.
0
5
10
15
20
25
0123456789
101112131415
1991 1994 1997 2000 2003 2006 2009 2012
Deficit
Peak Demand Deficit (right scale)
(In percent)
7
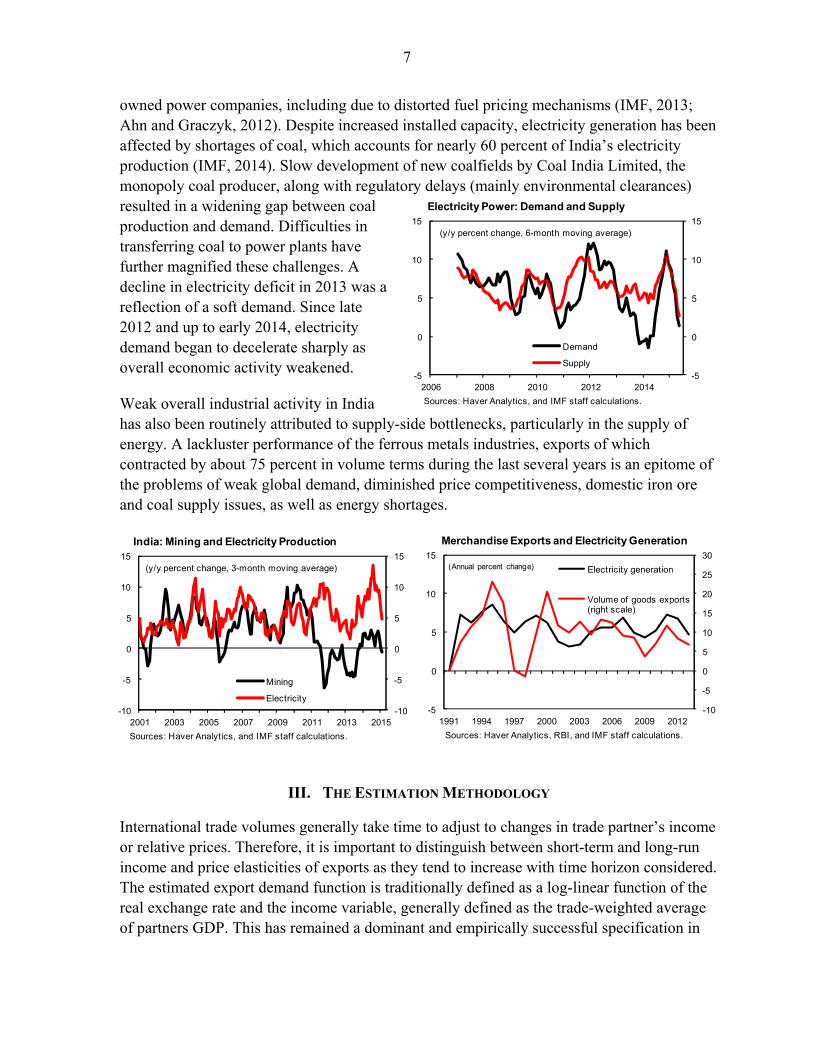
owned power companies, including due to distorted fuel pricing mechanisms (IMF, 2013; Ahn and Graczyk, 2012). Despite increased installed capacity, electricity generation has been affected by shortages of coal, which accounts for nearly 60 percent of India’s electricity production (IMF, 2014). Slow development of new coalfields by Coal India Limited, the monopoly coal producer, along with regulatory delays (mainly environmental clearances) resulted in a widening gap between coal production and demand. Difficulties in transferring coal to power plants have further magnified these challenges. A decline in electricity deficit in 2013 was a reflection of a soft demand. Since late 2012 and up to early 2014, electricity demand began to decelerate sharply as overall economic activity weakened.
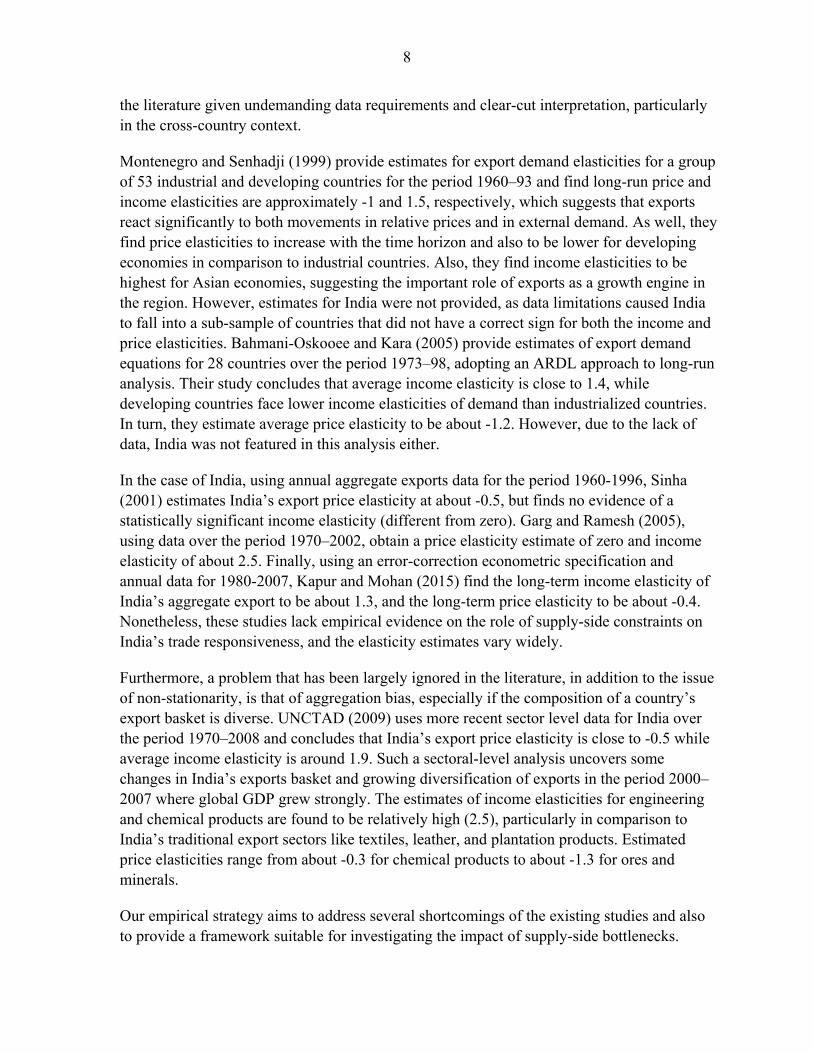
Weak overall industrial activity in India has also been routinely attributed to supply-side bottlenecks, particularly in the supply of energy. A lackluster performance of the ferrous metals industries, exports of which contracted by about 75 percent in volume terms during the last several years is an epitome of the problems of weak global demand, diminished price competitiveness, domestic iron ore and coal supply issues, as well as energy shortages.
III. THE ESTIMATION METHODOLOGY
International trade volumes generally take time to adjust to changes in trade partner’s income or relative prices. Therefore, it is important to distinguish between short-term and long-run income and price elasticities of exports as they tend to increase with time horizon considered. The estimated export demand function is traditionally defined as a log-linear function of the real exchange rate and the income variable, generally defined as the trade-weighted average of partners GDP. This has remained a dominant and empirically successful specification in
Merchandise Exports and Electricity Generation
Sources: Haver Analytics, RBI, and IMF staff calculations.
-10
-5
0
5
10
15
20
25
30
-5
0
5
10
15
1991 1994 1997 2000 2003 2006 2009 2012
Electricity generation
Volume of goods exports (right scale)
(Annual percent change)
India: Mining and Electricity Production
Sources: Haver Analytics, and IMF staff calculations.
-10
-5
0
5
10
15
-10
-5
0
5
10
15
2001 2003 2005 2007 2009 2011 2013 2015
Mining
Electricity
(y/y percent change, 3-month moving average)
Electricity Power: Demand and Supply
Sources: Haver Analytics, and IMF staff calculations.
-5
0
5
10
15
-5
0
5
10
15
2006 2008 2010 2012 2014
Demand
Supply
(y/y percent change, 6-month moving average)
8
the literature given undemanding data requirements and clear-cut interpretation, particularly in the cross-country context.
Montenegro and Senhadji (1999) provide estimates for export demand elasticities for a group of 53 industrial and developing countries for the period 1960–93 and find long-run price and income elasticities are approximately -1 and 1.5, respectively, which suggests that exports react significantly to both movements in relative prices and in external demand. As well, they find price elasticities to increase with the time horizon and also to be lower for developing economies in comparison to industrial countries. Also, they find income elasticities to be highest for Asian economies, suggesting the important role of exports as a growth engine in the region. However, estimates for India were not provided, as data limitations caused India to fall into a sub-sample of countries that did not have a correct sign for both the income and price elasticities. Bahmani-Oskooee and Kara (2005) provide estimates of export demand equations for 28 countries over the period 1973–98, adopting an ARDL approach to long-run analysis. Their study concludes that average income elasticity is close to 1.4, while developing countries face lower income elasticities of demand than industrialized countries. In turn, they estimate average price elasticity to be about -1.2. However, due to the lack of data, India was not featured in this analysis either.
In the case of India, using annual aggregate exports data for the period 1960-1996, Sinha (2001) estimates India’s export price elasticity at about -0.5, but finds no evidence of a statistically significant income elasticity (different from zero). Garg and Ramesh (2005), using data over the period 1970–2002, obtain a price elasticity estimate of zero and income elasticity of about 2.5. Finally, using an error-correction econometric specification and annual data for 1980-2007, Kapur and Mohan (2015) find the long-term income elasticity of India’s aggregate export to be about 1.3, and the long-term price elasticity to be about -0.4. Nonetheless, these studies lack empirical evidence on the role of supply-side constraints on India’s trade responsiveness, and the elasticity estimates vary widely.
Furthermore, a problem that has been largely ignored in the literature, in addition to the issue of non-stationarity, is that of aggregation bias, especially if the composition of a country’s export basket is diverse. UNCTAD (2009) uses more recent sector level data for India over the period 1970–2008 and concludes that India’s export price elasticity is close to -0.5 while average income elasticity is around 1.9. Such a sectoral-level analysis uncovers some changes in India’s exports basket and growing diversification of exports in the period 2000–2007 where global GDP grew strongly. The estimates of income elasticities for engineering and chemical products are found to be relatively high (2.5), particularly in comparison to India’s traditional export sectors like textiles, leather, and plantation products. Estimated price elasticities range from about -0.3 for chemical products to about -1.3 for ores and minerals.
Our empirical strategy aims to address several shortcomings of the existing studies and also to provide a framework suitable for investigating the impact of supply-side bottlenecks.

9
Specifically, we estimate average disaggregated price and income elasticities of demand for India’s exports using a heterogeneous panel data technique that is robust to bidirectional feedback effects, dynamics, and that fact that different industries may respond differently to identical changes in international relative prices and global growth.
We estimate the short-run and long-run income and price elasticity of export demand using the Panel ARDL approach, where the long-run effects are calculated from OLS estimates of the short-run coefficients in the following equation:
∆ ∑ ′ (1)
where is the logarithm of export volume by industry at time , , ∗ , g d ', is the logarithm of product-specific international relative price, and ∗ is a proxy for
world demand for product . The variable g d is a function of sector-specific energy deficit, d , possibly interacted with relative prices. The vector of long-run coefficients is given by:
∑ (2)
In a series of papers, Pesaran and Smith (1995), Pesaran (1997), and Pesaran and Shin (1999) show that the traditional ARDL approach can be used for long-run analysis, and that the ARDL methodology is valid regardless of whether the regressors are exogenous or endogenous, and irrespective of whether the underlying variables are I(0) or I(1).2 These features of the ARDL approach are appealing as reverse causality could be very important in our empirical application. Our panel ARDL specification also allows for a significant degree of cross-industry heterogeneity and accounts for the fact that the impact of international relative prices and world demand on export performance could vary across industries (that is, short-run slope coefficients differ). The long-run coefficients in equation (2), however, are estimated by the pooled mean group estimator where the individual long-run coefficients are restricted to be the same across countries, namely: .
IV. DATA
The merchandise export data spans 45 industries over the period 1990–2013 (at 2-digit SITC Rev.3 classification covering over 90 percent of Indian goods exports). India’s trade partners include 49 countries, as destinations for over 90 percent of India’s exports.
The industry-level export volume indices are from the Reserve Bank of India (RBI). India’s trade partners’ import demand series for products of each of the 45 industries are constructed
2 Recent theoretical advances in dynamic heterogeneous panels include Pesaran (2006) and Chudik, Mohaddes, Pesaran, and Raissi (2013 and 2015).
10
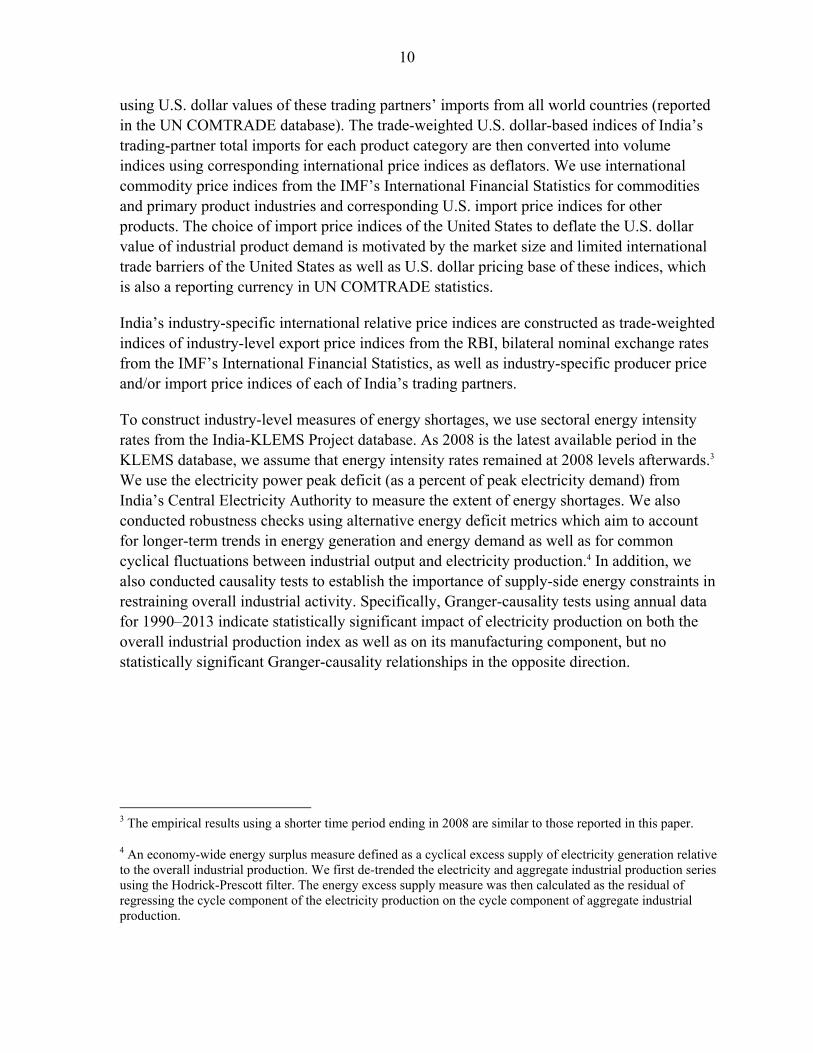
using U.S. dollar values of these trading partners’ imports from all world countries (reported in the UN COMTRADE database). The trade-weighted U.S. dollar-based indices of India’s trading-partner total imports for each product category are then converted into volume indices using corresponding international price indices as deflators. We use international commodity price indices from the IMF’s International Financial Statistics for commodities and primary product industries and corresponding U.S. import price indices for other products. The choice of import price indices of the United States to deflate the U.S. dollar value of industrial product demand is motivated by the market size and limited international trade barriers of the United States as well as U.S. dollar pricing base of these indices, which is also a reporting currency in UN COMTRADE statistics.
India’s industry-specific international relative price indices are constructed as trade-weighted indices of industry-level export price indices from the RBI, bilateral nominal exchange rates from the IMF’s International Financial Statistics, as well as industry-specific producer price and/or import price indices of each of India’s trading partners.
To construct industry-level measures of energy shortages, we use sectoral energy intensity rates from the India-KLEMS Project database. As 2008 is the latest available period in the KLEMS database, we assume that energy intensity rates remained at 2008 levels afterwards.3 We use the electricity power peak deficit (as a percent of peak electricity demand) from India’s Central Electricity Authority to measure the extent of energy shortages. We also conducted robustness checks using alternative energy deficit metrics which aim to account for longer-term trends in energy generation and energy demand as well as for common cyclical fluctuations between industrial output and electricity production.4 In addition, we also conducted causality tests to establish the importance of supply-side energy constraints in restraining overall industrial activity. Specifically, Granger-causality tests using annual data for 1990–2013 indicate statistically significant impact of electricity production on both the overall industrial production index as well as on its manufacturing component, but no statistically significant Granger-causality relationships in the opposite direction.
3 The empirical results using a shorter time period ending in 2008 are similar to those reported in this paper.
4 An economy-wide energy surplus measure defined as a cyclical excess supply of electricity generation relative to the overall industrial production. We first de-trended the electricity and aggregate industrial production series using the Hodrick-Prescott filter. The energy excess supply measure was then calculated as the residual of regressing the cycle component of the electricity production on the cycle component of aggregate industrial production.

11
V. RESULTS
Our results indicate that while Indian exports are sensitive to international relative-price competitiveness and external demand, binding supply-side constraints (notably energy shortages) dampen price responsiveness in the short-term.
Columns (1)–(2) of Table 1 summarize the baseline findings from estimation of equation (1), dropping the term g d , for all 45 industries and 23 manufacturing sector industries, respectively. The results indicate that, in the long- run, a one-percent increase in India’s international relative export prices could reduce export volume growth by about 0.9 percent for all industries and by about 1.1 for the manufacturing sector. The long-run coefficient on global demand is estimated to be slightly above 1.5 and is statistically significant, which suggests that India’s exports are sensitive to changes in external demand. Moreover, short term coefficients on relative prices have the expected signs, are lower than the long-run estimates, and are statistically significant. Notably, export performance is affected by short-term fluctuations in international relative prices, with an estimated average elasticity of about -0.5. Furthermore, the short-term income elasticity for manufacturing industries exports is statistically significant and positive (about 0.2). At the same time, we find non-manufacturing exports, reported in column (3), to be slightly more demand elastic in the long-run, but significantly less price-elastic in comparison to manufacturing exports.
The negative sign of the average short-run income elasticity of the non-manufacturing exports appears surprising at a first glance. However, when we restrict the sample to narrower sectors, we only find a negative elasticity for the minerals and crude materials as
Dependent variable: India's sector-specific export volume
Specification:
Long-run coefficients
Global demand volume 1/ 1.55 *** 1.52 *** 1.60 ***(0.03) (0.05) (0.04)
Relative price 2/ -0.86 *** -1.14 *** -0.64 ***(0.12) (0.14) (0.17)
Short-run coefficients
Error-correction term -0.17 *** -0.14 *** -0.20 ***(0.03) (0.03) (0.05)
∆ Global demand volume -0.05 0.23 *** -0.31 ***(0.07) (0.09) (0.07)
∆ Relative price -0.45 *** -0.52 *** -0.39 ***(0.08) (0.09) (0.13)
NxT 1012 483 529
Source: IMF staff estimates.Note: Standard errors are reported in parenthesis. ***, **, * denote significance at 1, 5, and 10 percent, respectively.1/ Product-specific world imports, volume index.2/ India's trade-weighted product-specific export price (in partner's currency) relative to partners' product price, index.
Increase signifies appreciation.3/ Includes food, crude materials, minerals and chemicals.
Table 1. Pooled Mean Group Estimates of the Long-run and Short-run Export Elasticities, 1991-2013
All industries Manufacturing Non-manufacturing 3/(1) (2) (3)

12
well as chemical products, but not for the food industries. The negative sign, therefore, may be simply a reflection of India’s net commodity importer status. The rise in external demand generally implies greater export demand for India’s goods but also greater income and demand domestically. Given India’s relatively scarce natural resources, in the short-run the production of intermediate industrial goods and commodities for industrial use becomes reoriented towards domestic demand and away from exports.
To capture the effects of supply-side constraints on merchandise export performance in the short-term, we construct an indicator of supply bottlenecks pertaining to the availability of energy, and interact it with the change in international relative prices, namely the variable g d d ∗ min 0, ∆ in equation (1) among the short-term coefficients. This is motivated by the fact that energy shortages could result in less competitive costs of production and lower India’s exports. Table 2 contrasts the results of the baseline regressions above with an augmented specification that contains an interaction term involving the product of changes in international relative prices (in the case of decline in international relative prices) and the proxy for sector-specific energy shortages. To uncover the long-term implications of energy availability on exports, we also include the sectoral energy deficit variable in the long-term relationship.
Dependent variable: India's sector-specific export volume
Specification:
Long-run coefficients
Global demand volume 2/ 1.34 *** 1.29 *** 1.48 ***(0.05) (0.07) (0.06)
Relative price 3/ -0.99 *** -1.11 *** -0.84 ***(0.11) (0.16) (0.16)
Energy deficit 4/ -0.005 *** -0.008 *** -0.002 ***(0.001) (0.002) (0.001)
Short-run coefficients
Error-correction term -0.19 *** -0.17 *** -0.22 ***(0.03) (0.03) (0.05)
∆ Global demand volume -0.03 0.28 *** -0.33 ***(0.07) (0.08) (0.08)
∆ Relative price -0.57 *** -0.65 *** -0.47 ***(0.09) (0.10) (0.16)
Energy deficit * min[0, ∆relative price] 0.004 * 0.004 ** 0.003(0.002) (0.002) (0.004)
NxT 1012 483 529
Source: IMF staff estimates.Note: Standard errors are reported in parenthesis. ***, **, * denote significance at 1, 5, and 10 percent, respectively.1/ Includes food, crude materials, minerals and chemicals.2/ Product-specific world imports, volume index.3/ India's trade-weighted product-specific export price (in partner's currency) relative to partners' product price, index.
Increase signifies appreciation.4/ Energy deficit is defined as peak energy demand deficit, weighted by sector-specific energy intensity. One unit
corresponds to a sector with energy share in gross output of one percent and a situation of one percent economy-wide peak demand energy deficit.
Table 2. Pooled Mean Group Estimates of the Long-run and Short-run Export Elasticities, 1991-2013The Role of Supply-Side Constraints
(1) (2) (3)All industries Manufacturing Non-manufacturing 1/

13
The results suggest that energy shortages, during real depreciation episodes (fall in relative export prices), may reduce the responsiveness of Indian exports to an otherwise expansionary shift in relative prices. However, energy shortages appear not to matter when relative price changes are unfavorable.5 The economic significance of the estimated coefficient is likely to be non-trivial. Specifically, for an industry with an energy share of about 4 percent in the gross value of its output (which is about the average share in manufacturing), and in the of presence of a 10 percent peak demand energy deficit, the expansionary impact of a one percent relative price depreciation on export growth would be reduced from about 0.6 percent to just 0.4 percent in the short-run. Finally, the negative long-run link between energy deficit and exports is apparent across all sectors. The results suggest that for a sector with an energy share of about 4 percent of the gross output value, a decline in the economy-wide peak demand energy deficit from 10 to 5 percent would imply about a 0.1 percent increase in exports.
VI. CONCLUSIONS AND POLICY IMPLICATIONS
Our results underscore the importance of a competitively-valued real exchange rate for facilitating Indian exports, as well as further structural reforms to ease supply-side bottlenecks in the country. In the face of external shocks, international relative price flexibility, with the exchange rate as a shock absorber, can help increase India’s exports in the short run. In addition, continued progress on alleviating supply-side bottlenecks, in the energy sector in particular, would help enhance the effectiveness of exchange rate flexibility in lessening the impact of adverse external shocks as well as in boosting exports in the long-term. While several policy actions have been taken recently, further steps in relaxing long-standing supply bottlenecks, such as addressing structural challenges in the power sector and natural resource allocation (in particular allowing further private sector participation in coal mining, including for commercial purposes) and market-based pricing are critical to boosting investment and potential growth (IMF, 2015).
Sluggish global economic growth prospects, particularly in industrialized economies, present a challenge for India in achieving significant export growth acceleration in the coming years. For example, the IMF’s World Economic Outlook projects that the volume growth of non-oil import demand in India’s major trading partners will average about 6½ percent during the next five years, significantly below the near
5 The inclusion of an additional interaction term between energy deficit and a positive change in relative prices does not yield a statistically significant coefficient across all specifications.
-15
-10
-5
0
5
10
15
20
-15
-10
-5
0
5
10
15
20
1991 1994 1997 2000 2003 2006 2009 2012 2015 2018 2021
(Annual percent change) WEO forecast
Average growth:2001-2008: 10%2015-2020: 6.5%
1991-2013 average
Non-Oil Imports of India's Trading Partners
Sources: World Economic Outlook; and IMF staff estimates.

14
10 percent growth rate recorded during 2001–08. Using the average estimated income elasticity of 1.5, in the absence of further measures to enhance competiveness, India’s merchandize export growth will likely remain below 10 percent per annum. In this regard, the recently-released Foreign Trade Policy blueprint sets out an ambitous target of doubling India’s exports over the next five years. Given the above argument, achieving such a significant export acceleration would need to be underpinned by measures to reduce barriers to trade, enhance trade facilitation, reduce the cost of doing business (including through enhancing infrastructure investment), and improving the business environment. Further diversification of India’s export basket and export destinations, and sustaining its external competitiveness, would also help.
Finally, in the context of the weak growth outlook in industrialized countries, our results have implications for the efficacy of an export-led growth model in India, which has been a traditional development path for many emerging market countries during the past few decades. Consolidating the recent gains in inflation reduction and keeping in check financial stability risks, including those related to foreign exchange and capital flows, will be key to ensuring competitiveness in the long term.

15
REFERENCES
Ahn, S.-J., and D. Graczyk, 2012, “Understanding Energy Challenges in India. Policies, Players, and Issues,” International Energy Agency.
Anand R., K. Kochhar, and S. Mishra, 2015, “Make in India: What Exports can Drive the
Next Wave of Growth?” IMF Working Paper No. 15/119. Bahmani-Oskooee, M. and O. Kara, 2005, “Income and Price Elasticities of Trade: Some
New Estimates’, The International Trade Journal, Vol. 19(2), pp.165–78. Chudik, A., K. Mohaddes, M. H. Pesaran, and M. Raissi, 2013, “Debt, Inflation and Growth:
Robust Estimation of Long-Run Effects in Dynamic Panel Data Models,” CESifo Working Paper No. 4508.
Chudik, A., K. Mohaddes, M. H. Pesaran, and M. Raissi (2015). Long-Run Effects in Large
Heterogeneous Panel Data Models with Cross-Sectionally Correlated Errors. Dallas Fed Working Paper No. 223.
Garg, D. and S. Ramesh, 2005, “Income and Exchange Rate Elasticity of Imports and
Exports,” Macroeconomics Working Paper Series, Indian Institute of Management, Lucknow.
Central Electricity Authority, 2013, “Growth of Electricity Sector in India from 1947-2013,”
Government of India, Central Electricity Authority, Ministry of Power, New Delhi. International Monetary Fund, 2013, India: 2013 Article IV Consultation, IMF Country
Report 13/37 (Washington: International Monetary Fund). International Monetary Fund, 2014, India: 2014 Article IV Consultation, IMF Country
Report 14/57 (Washington: International Monetary Fund). International Monetary Fund, 2015, India: 2015 Article IV Consultation, IMF Country
Report 15/61 (Washington: International Monetary Fund). Kapur M. and R. Mohan, 2014, “India’s Recent Macroeconomic Performance: An
Assessment and Way Forward” IMF Working Paper 14/68 (Washington: International Monetary Fund).
Montenegro, C. and A. Senhadji, 1999, “Time Series Analysis of Export Demand Equations-
A Cross-Country Analysis” IMF Staff Papers, Vol. 46.

16
Pesaran, M. H., 2006, “Estimation and Inference in Large Heterogeneous Panels with a Multifactor Error Structure,” Econometrica 74(4), pp. 967- 1012.
Pesaran, M. H., Y. Shin, and R. P. Smith, 1999, “Pooled Mean Group Estimation of Dynamic
Heterogeneous Panels,” Journal of the American Statistical Association 94(446), pp. 621-634.
Pesaran, M. H. and R. Smith, 1995, “Estimating Long-run Relationships from Dynamic
Heterogeneous Panels,” Journal of Econometrics 68(1), pp. 79-113. Sinha D., 2001, “A Note on Trade Elasticities in Asian Countries,” The International Trade
Journal, Vol. 15:2, pp. 221-237 United Nations Conference on Trade and Development (UNCTAD), 2009, “Impact of Global
Slowdown on India’s Exports and Employment”, Report Prepared under UNCTAD- Govt. of India- DFID Project ‘Strategies and Preparedness for Trade and Globalization in India’.