Agung Wibowo : Kearifan Lokal . 61 KEARIFAN LOJ(AL PETANI ...
PRICE, ADVERTISEMENT AND QUALITY OF SERVICES TOWARD
PURCHASING DECISION OF SIMPATI CARD WITH PRODUCTS AS
MODERATING VARIABLE Indra Budaya1), Yossi Elfina2), Syamsurizal Tan3) Ade Octavia4) and Muazza5)
1) 2) Management Department, STIE Sakti Alam Kerinci, Sungai Penuh, Kerinci, Indonesia 3) 4) 5) Postgraduate Program, Universitas Jambi, Indonesia
1) E-mail: [email protected] 2) E-mail: [email protected]
Abstract In Kerinci, Jambi majority or more dominant people use sympathy card because the network of
sympathy card is wider and better. As other brands less, so people prefered to use the sympathy card to be more
effective and efficient in communication costs by choosing the program provided. The purpose of this research is
to know: 1) To know the influence of price, advertisement, and service quality partially to decision of purchasing
Simpati card at STIE-Sakti Alam Kerinci, 2) To know price, advertisement, and service quality simultaneously
to decision of Simpati card purchase in STIE-Sakti Alam Kerinci, 3) To know the price, advertisement, and
quality of service with product as moderating variable to decision of purchasing Simpati card at STIE-Sakti
Alam Kerinci. Population in this research were students at STIE-Sakti Alam Kerinci. The sample for this
research is 40 respondents with sampling technique is accidental sampling. The data analysis tools used are
Likert scale, regression analysis, t-test and f-test. The results of research showed that price does not have a
significant and positive effect on purchasing decisions. Advertisement have a significant and positive impact on
purchasing decisions. Quality of service has significant and positive impact on purchasing decisions. Prices have
a significant and negative effect on product purchasing decisions. Advertisement have a significant and positive
impact on product purchasing decisions. Service quality has no significant and positive impact on product
purchasing decisions.
Keywords: Price, Advertising, Quality of Service, Product, Purchasing Decision.
I. INTRODUCTION
In the development of telecommunication industry in Indonesia, technology has a very
vital role. This is because the development of telecommunications always follow the existing
technology. Whenever emerging a new technology, it will soon be applied in
telecommunication services. It will continue to be repeated and has always been an
opportunity for telecommunication industry activists in Indonesia.
For example, cellular service providers in Indonesia can be said to be very diverse.
These providers have a similarity, which is equally as an activist in the telecommunications
industry in Indonesia. Although many telecommunication service providers, every new
emerging technology, they will race to apply it to the services provided. As a result, the
existing telecommunication industry will always provide convenience to all its users.
In influencing purchasing decisions, we can not be separated from the marketing mix.
The marketing mix consists of 4P for goods that are price, promotion, product, place and
additional 3P for service that are person, process, physical proof. Price is one marketing mix
that is often used by companies in persuading consumers to use their products. According to
Kotler and Keller (2007: 84), price policy is crucial in marketing a product, because price is
the only element of the marketing mix that provides income for an organization or company.
In general advertising helps explain a product, while for the company itself advertising is a
very important marketer tool for the company. Meanwhile, the quality of service expected by
the consumers is adequate facilities, good service, comfort, security, tranquility and
satisfactory results so that the management must think about the quality of service.
Indra Budaya,et.al., Int. J.Eco.Res, 2018, V9 i5, 73 – 87 ISSN:2229-6158
IJER – September – October 2018 available online @ www.ijeronline.com
73
As the world's number six mobile operator in terms of subscribers, Telkomsel is the
market leader in the telecommunications industry in Indonesia. In Kerinci, Jambi majority or
more dominant use of sympathy card because network of sympathy card is wider and better.
As for other brands less, so people prefer to use the sympathy card to be more effective and
efficient in the cost of communication by selecting the program disedikan.
The research of Sri Wahyuni and Jonianto Pardamean (2016) proves that advertising
variable has positive and insignificant effect, while on the variable of price and quality of
service have positive and significant influence to decision of Simpati Card purchasing at
Institute Perbanas. Differences with research conducted by Setyo Ferry Wibowo (2012),
proved that television advertising and price variables have a positive and significant influence
on the decision of purchasing Lux Soap (survey on Mega Bekasi Hypermall visitors).
Referring to the background described above the purpose of this study is To determine
the effect of price, advertising and service quality partially and simultaneously to the decision
of the purchase of sympathy card (Case study of STIE-SAK students Using Simpati Card),
and To know the influence of price, advertisement and service quality with product as
moderating variable to decision of purchase of sympathy card (Case study of STIE-SAK
student Using Simpati Card).
.
II. LITERATURE REVIEW
2.1 Purchasing Decision
For marketers this stage purchase decision is a very important stage to understand
because it will relate to the success of a marketing program. In particular, marketers must
identify who made the buying decision, the types of purchasing decisions, and the steps in the
purchasing process. (Kotler, 2005: 220)
The consumers’ purchasing decision is an integration process that combines
knowledge to evaluate two or more alternative behaviors, and chooses one of them (Nugroho,
2008: 415).
Indicators of consumer purchasing decisions by Kotler and Keller (2009: 188), consist
of:
1) Brand Decision. Consumers are more likely to choose an alternative that seems to
have an influence in a particular group of choices in consideration, consumers who
think about the probability of wrong purchasing decisions, are more likely to choose a
well-known brand.
2) Dealer Choice (Seller). Consumers who are at this level he needs information to know
about producers, wholesalers, and diluents of a product in order to be customized to
his liking.
3) Number of Purchases (Quantities). Consumers will consider the decision about how
many products will be purchased in accordance with the wishes and needs of
consumers.
4) Decision time. Consumers will consider the time to make a purchase decision. whether
the time will be in accordance with his desire to make a purchase of a product or
service.
5) Decision of payment method. Consumers should consider and make decisions about
the method or manner of payment of purchased products, whether by cash or credit.
Indra Budaya,et.al., Int. J.Eco.Res, 2018, V9 i5, 73 – 87 ISSN:2229-6158
IJER – September – October 2018 available online @ www.ijeronline.com
74
2.2 Product
The product according to Kotler (2012: 41) is everything that can be offered to the
market to get attention, bought, used or consumed that can satisfy the desires or needs.
Conceptually the product is a subjective understanding of the producer of something that can
be offered as an attempt to achieve organizational goals through the fulfillment of consumer
needs and activities, in accordance with the competence and capacity of the organization and
the purchasing power of the market. In addition, the product can also be defined as the
consumer perceptions described by the producer through the production.
According to Abubakar (2005), product indicators consist of:
a. Product Quality is the ability of a product to perform its functions include reliability,
ease of operation and repair, and other valuable attributes.
b. Product Design is the process of creating products according to the needs of
consumers.
c. Brand of Product is a name, symbol, mark or combination as the identity of a product
to differentiate with other products.
d. Product Performance is size obtained after using a product / basic operating
characteristics of a product.
2.3 Price
Price is one of the most important attributes evaluated by consumers, and managers
need to be fully aware of the role of prices in the formation of consumer attitudes (Mowen &
Minor, 2002: 318). From a marketing point of view, according to Fandy Tjiptono (2008: 151)
"Price is a monetary unit or other measure including other goods and services that can be
exchanged in order to obtain ownership or use of a good or service".
According to Kotler and Armstrong (2008: 278), there are 4 (four) indicators that
characterize the price are:
a. Affordability of the price is the actual price of a product written and set by the
company is expected to have understanding and attention to the customer.
b. Conformity of price with product quality is price conformity which given by quality of
product which is provided.
c. Price competitiveness is the price that is given can compete with the price of other
products.
d. Suitability of prices and benefits are the price offered in accordance with the benefits
felt by consumers.
2.4 Advertisement
According to Kotler (2005: 277) states that: "Advertising is any form of non-personal
presentation and promotion of ideas, goods, or services by certain sponsors to be paid". While
based on study by Stanton in Bilson Simamora (2003: 305) states that: "Advertising consists
of all activities involved in presentation to the audience in a nonpersonal manner, with clear
sponsors and financed by a message about the product or organization.
Advertisement indicators by Kotler (2009: 162):
a. Goals (mission). Setting advertising goals that refer to previous decisions about the
target market, target market determination, market positioning, and promotion mix.
b. Message conveyed. A message must get attention, attract, arouse desire, and produce
action.
c. Media used. The effect of advertisement notifications on target audience awareness
depends on the reach, frequency and impact of advertising.
Indra Budaya,et.al., Int. J.Eco.Res, 2018, V9 i5, 73 – 87 ISSN:2229-6158
IJER – September – October 2018 available online @ www.ijeronline.com
75
2.5 Quality of Service
According Tjiptono and Chandra (2012: 74) quality can be interpreted as a defect-free
product. In other words, products that conform to standards. According to J. Paul Peter and
Jerry C. Oleson (2000: 142) defines service is the behavior of the seller to the buyer by giving
satisfaction to the consumer, so that consumers feel valued and get the goods or services in
accordance with his wishes.
According to Tjiptono and Chandra (2012: 74) indicators of service quality are:
1) Reliability includes the extent to which the information provided to the client is
appropriate and accountable.
2) Responsiveness is the responsiveness of the provider or service provider in response to
client complaints.
3) Assurance is the ability to generate confidence between one another.
4) Empathy is the attention given to the customer.
5) Physical evidence constitutes the physical means and facilities contained within.
III. RESEARCH METHODOLOGY
3.1 Population and Samples The population in this research were students in STIE-SAK using Simpati.Card in
taking into account the time and cost of the samples in this study was taken with the
accidential sampling technique, where the sampling technique based on coincidence that
anyone who by chance met researchers at STIE-SAK, for the research sample in the set is 40
samples.
3.2 Operational Concept
The operational definition of research variables is as follows:
1) Purchasing Decision (Y).
According to Engel, Blackwell, and Miniar in Suryani (2008: 5) understanding of
consumer behavior involves an understanding of the actions consumers take directly in
obtaining, consuming and consuming products and services, including the decision processes
that precede and follow those actions.
Indicators of consumer purchasing decisions by Kotler and Keller (2009: 188), consist
of:
a) Brand Decision
b) Dealer Choice (Seller)
c) Number of Purchases (Quantities)
d) Decision time
e) Decision of payment method
f) Products (M)
According to Kotler in Hendra Teguh (1997: 53) that the product has a broad sense
that everything that is offered, owned, used or consumed so as to satisfy the wants and needs
including the physical, service, people, place, organization and ideas. According to Abubakar
(2005) product indicators consist of:
a) Product quality,
b) Product design,
c) Brand product
d) Product performance
Indra Budaya,et.al., Int. J.Eco.Res, 2018, V9 i5, 73 – 87 ISSN:2229-6158
IJER – September – October 2018 available online @ www.ijeronline.com
76
2) Price (X1)
The price set by the company is appropriate and in accordance with consumer
purchasing power then the selection of a particular product will be dropped on the product
(Griffin and Ebert, 2007: 281). According to Kotler and Armstrong (2008: 278) there are 4
(four) indicators that characterize the price are:
a) Affordability,
b) Price conformity with product quality
c) Price competitiveness,
d) Conformity of price with benefit,
3) Advertisement (X2)
In general, advertising helps explain a product, while for the company itself
advertising is a very important marketing tool for the company. Indicators of Advertisement
by Kotler (2009: 162):
a. Goals (Mission)
b. Message Conveyed
c. Media Used
4) Quality of Service (X3)
Quality of service is a service that is expected and in feel the consumer who aims to
attract consumers to buy products or services on offer. According to Tjiptono and Chandra
(2012: 74) that the indicators of service quality are as follows :
a) Reliability
b) Responsiveness
c) Assurance
d) Empathy
e) Physical evidence
3.2 Data Collection and Analysis Data collection techniques used field research. A direct study to STIE-SAK. used to
obtain primary data, as for the methods undertaken are: a. Interview, b. Questionaires, c.
Observation. Library Research : collecting and studying books and literature related to this
research to support the problem solving.
The method of data analysis used is descriptive qualitative method, is a form of
analysis with not the form of numbers, but the form of analysis in reasoning derived from the
results of relevant literature and quantitative descriptive method, Is an analysis in the form of
numbers. In this case the statistical analysis is used. The analysis data done as below :
1) Multi-Level Regression Analysis. Regression calculation technique is done by using
model developed by Baron and Kenny in Ghozali (2011) that is technique of
regression analysis (Hierarchical Regression Analysis). At level one and level two,
using multiple linear regression because there are more than one independent variable
(X1, X2 and X3 and M), the equation is as follows:
Y = β0 + β1X1 + β2X2 + β2X3 ε ........................................ ........................ (Model 1)
Y = β0 + β1X1 + β2X2 + β2X3 + β3M + ε ........................ .................. ....... (Model 2)
Y = β0 + β1X1 + β2X2 + β2X3 + β3M + β4X1M +β5X2M + β6X3M + ε ..... (Model 3)
2) Partial Testing (t-Test) is a statistical test used to see how far the influence of
independent variables to the dependent variable statistically.
3) Simultaneous Testing (Test-f). F test is part of statistical test used to prove the
influence of independent variable to dependent variable simultaneously.
Indra Budaya,et.al., Int. J.Eco.Res, 2018, V9 i5, 73 – 87 ISSN:2229-6158
IJER – September – October 2018 available online @ www.ijeronline.com
77
IV. RESEARCH FINDING AND DISCUSSION
4.1 Characteristics of Respondents
The respondents in this research are STIE Sakti Alam Kerinci students who use
sympathy card. The following are characteristics of respondents by gender.
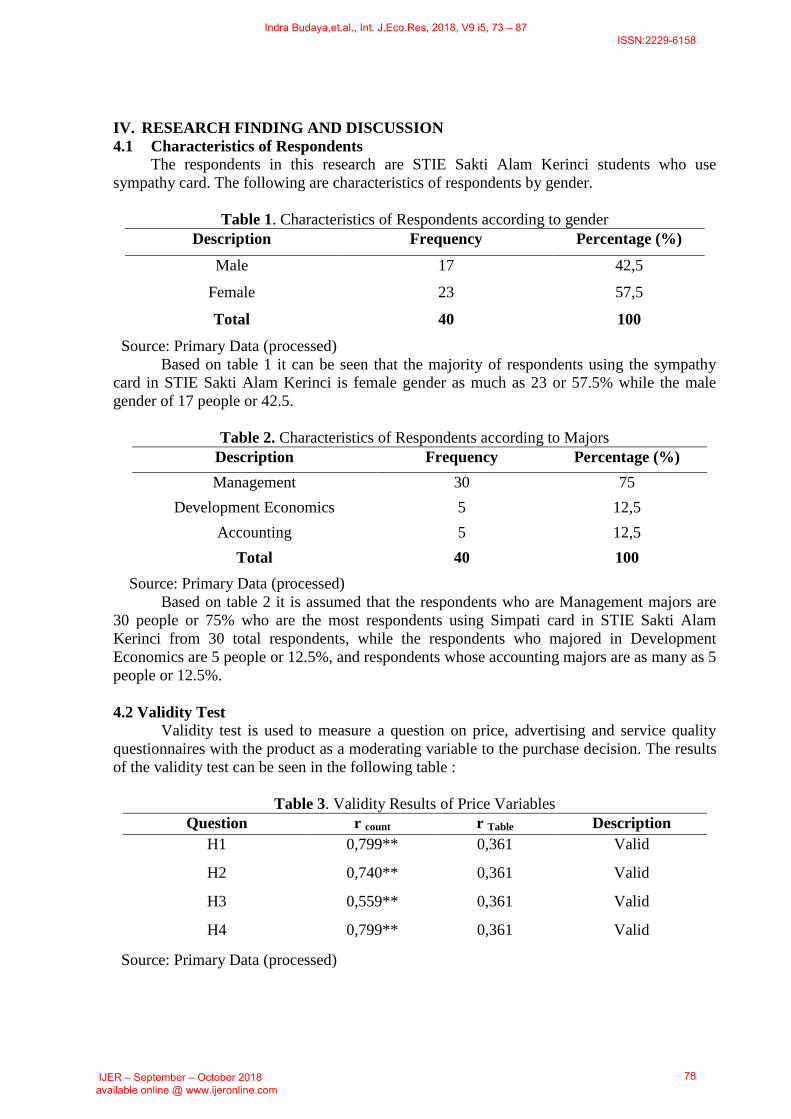
Table 1. Characteristics of Respondents according to gender
Description Frequency Percentage (%)
Male 17 42,5
Female 23 57,5
Total 40 100
Source: Primary Data (processed)
Based on table 1 it can be seen that the majority of respondents using the sympathy
card in STIE Sakti Alam Kerinci is female gender as much as 23 or 57.5% while the male
gender of 17 people or 42.5.
Table 2. Characteristics of Respondents according to Majors
Description Frequency Percentage (%)
Management 30 75
Development Economics 5 12,5
Accounting 5 12,5
Total 40 100
Source: Primary Data (processed)
Based on table 2 it is assumed that the respondents who are Management majors are
30 people or 75% who are the most respondents using Simpati card in STIE Sakti Alam
Kerinci from 30 total respondents, while the respondents who majored in Development
Economics are 5 people or 12.5%, and respondents whose accounting majors are as many as 5
people or 12.5%.
4.2 Validity Test
Validity test is used to measure a question on price, advertising and service quality
questionnaires with the product as a moderating variable to the purchase decision. The results
of the validity test can be seen in the following table :
Table 3. Validity Results of Price Variables
Question r count r Table Description
H1 0,799** 0,361 Valid
H2 0,740** 0,361 Valid
H3 0,559** 0,361 Valid
H4 0,799** 0,361 Valid
Source: Primary Data (processed)
Indra Budaya,et.al., Int. J.Eco.Res, 2018, V9 i5, 73 – 87 ISSN:2229-6158
IJER – September – October 2018 available online @ www.ijeronline.com
78
From table 3 it can be explained that based on calculation of SPSS Statistics 22.00
comparison of value rcount> rtable. So it can be concluded that the question items of the Price
variable declared valid.
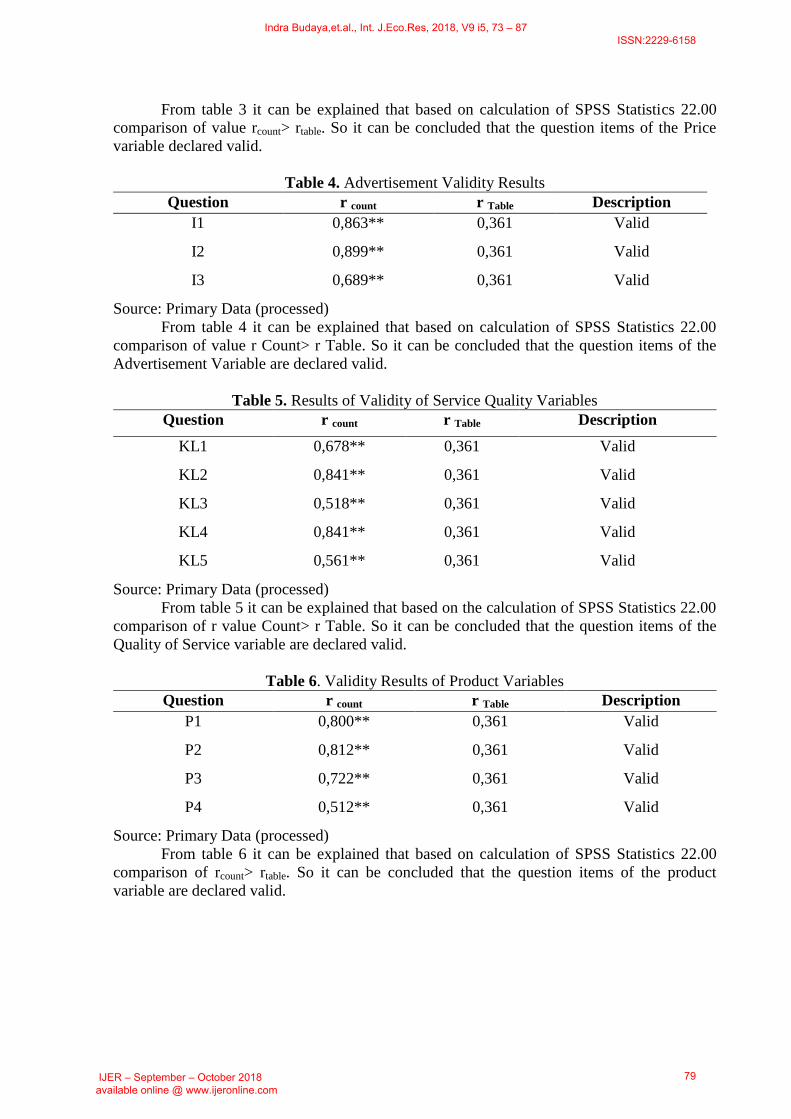
Table 4. Advertisement Validity Results
Question r count r Table Description
I1 0,863** 0,361 Valid
I2 0,899** 0,361 Valid
I3 0,689** 0,361 Valid
Source: Primary Data (processed)
From table 4 it can be explained that based on calculation of SPSS Statistics 22.00
comparison of value r Count> r Table. So it can be concluded that the question items of the
Advertisement Variable are declared valid.
Table 5. Results of Validity of Service Quality Variables
Question r count r Table Description
KL1 0,678** 0,361 Valid
KL2 0,841** 0,361 Valid
KL3 0,518** 0,361 Valid
KL4 0,841** 0,361 Valid
KL5 0,561** 0,361 Valid
Source: Primary Data (processed)
From table 5 it can be explained that based on the calculation of SPSS Statistics 22.00
comparison of r value Count> r Table. So it can be concluded that the question items of the
Quality of Service variable are declared valid.
Table 6. Validity Results of Product Variables
Question r count r Table Description
P1 0,800** 0,361 Valid
P2 0,812** 0,361 Valid
P3 0,722** 0,361 Valid
P4 0,512** 0,361 Valid
Source: Primary Data (processed)
From table 6 it can be explained that based on calculation of SPSS Statistics 22.00
comparison of rcount> rtable. So it can be concluded that the question items of the product
variable are declared valid.
Indra Budaya,et.al., Int. J.Eco.Res, 2018, V9 i5, 73 – 87 ISSN:2229-6158
IJER – September – October 2018 available online @ www.ijeronline.com
79
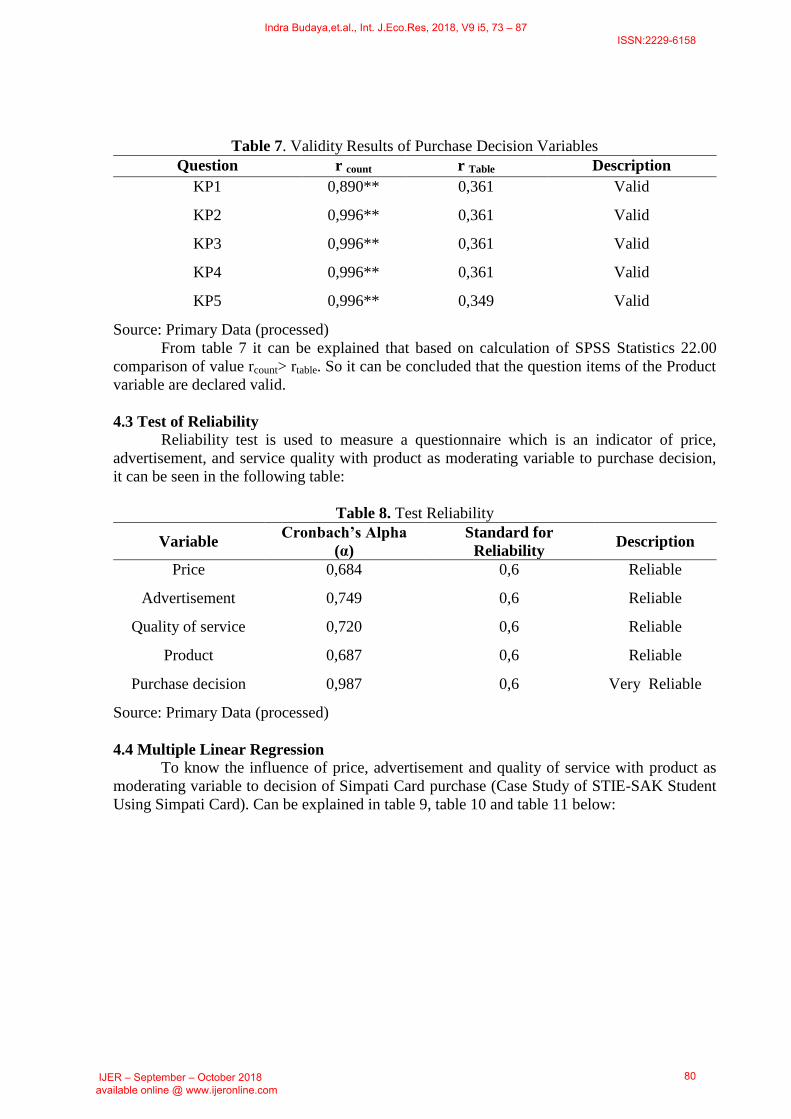
Table 7. Validity Results of Purchase Decision Variables
Question r count r Table Description
KP1 0,890** 0,361 Valid
KP2 0,996** 0,361 Valid
KP3 0,996** 0,361 Valid
KP4 0,996** 0,361 Valid
KP5 0,996** 0,349 Valid
Source: Primary Data (processed)
From table 7 it can be explained that based on calculation of SPSS Statistics 22.00
comparison of value rcount> rtable. So it can be concluded that the question items of the Product
variable are declared valid.
4.3 Test of Reliability
Reliability test is used to measure a questionnaire which is an indicator of price,
advertisement, and service quality with product as moderating variable to purchase decision,
it can be seen in the following table:
Table 8. Test Reliability
Variable Cronbach’s Alpha
(α)
Standard for
Reliability Description
Price 0,684 0,6 Reliable
Advertisement 0,749 0,6 Reliable
Quality of service 0,720 0,6 Reliable
Product 0,687 0,6 Reliable
Purchase decision 0,987 0,6 Very Reliable
Source: Primary Data (processed)
4.4 Multiple Linear Regression
To know the influence of price, advertisement and quality of service with product as
moderating variable to decision of Simpati Card purchase (Case Study of STIE-SAK Student
Using Simpati Card). Can be explained in table 9, table 10 and table 11 below:
Indra Budaya,et.al., Int. J.Eco.Res, 2018, V9 i5, 73 – 87 ISSN:2229-6158
IJER – September – October 2018 available online @ www.ijeronline.com
80
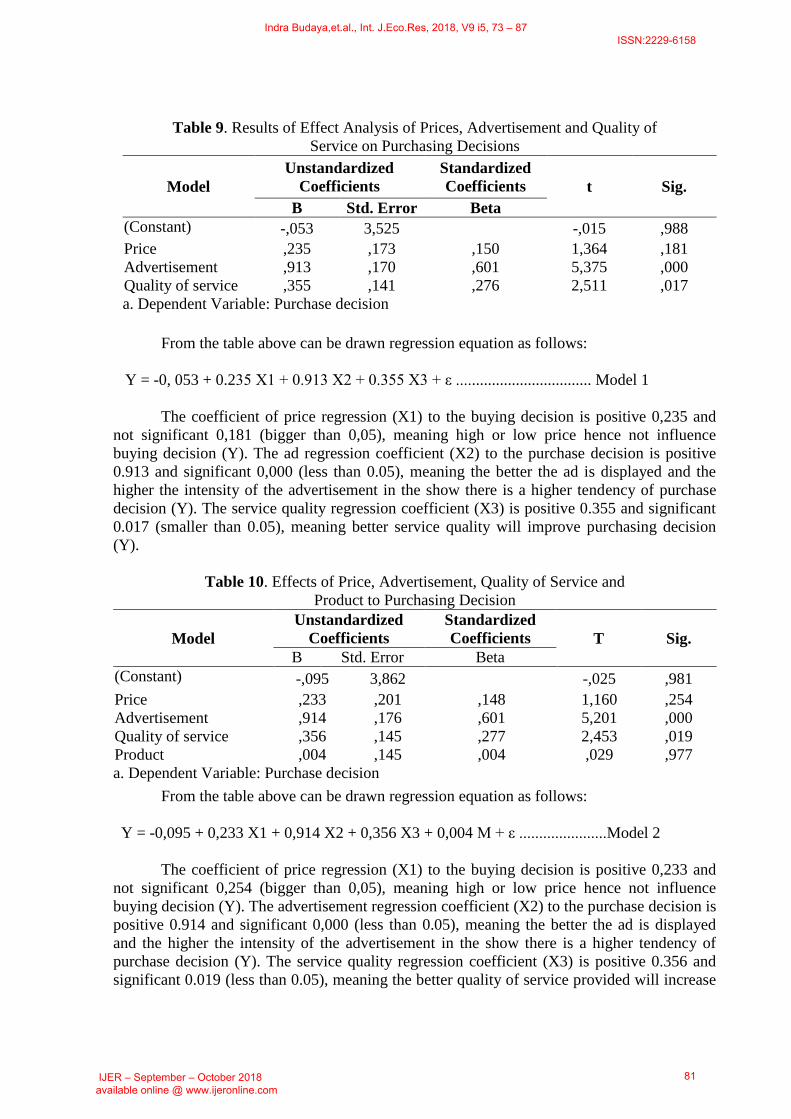
Table 9. Results of Effect Analysis of Prices, Advertisement and Quality of
Service on Purchasing Decisions
Model
Unstandardized
Coefficients
Standardized
Coefficients t Sig.
B Std. Error Beta
1 (Constant) -,053 3,525 -,015 ,988
Price ,235 ,173 ,150 1,364 ,181
Advertisement ,913 ,170 ,601 5,375 ,000
Quality of service ,355 ,141 ,276 2,511 ,017
a. Dependent Variable: Purchase decision
From the table above can be drawn regression equation as follows:
Y = -0, 053 + 0.235 X1 + 0.913 X2 + 0.355 X3 + ε .................................. Model 1
The coefficient of price regression (X1) to the buying decision is positive 0,235 and
not significant 0,181 (bigger than 0,05), meaning high or low price hence not influence
buying decision (Y). The ad regression coefficient (X2) to the purchase decision is positive
0.913 and significant 0,000 (less than 0.05), meaning the better the ad is displayed and the
higher the intensity of the advertisement in the show there is a higher tendency of purchase
decision (Y). The service quality regression coefficient (X3) is positive 0.355 and significant
0.017 (smaller than 0.05), meaning better service quality will improve purchasing decision
(Y).
Table 10. Effects of Price, Advertisement, Quality of Service and
Product to Purchasing Decision
Model
Unstandardized
Coefficients
Standardized
Coefficients T Sig.
B Std. Error Beta
1 (Constant) -,095 3,862 -,025 ,981
Price ,233 ,201 ,148 1,160 ,254
Advertisement ,914 ,176 ,601 5,201 ,000
Quality of service ,356 ,145 ,277 2,453 ,019
Product ,004 ,145 ,004 ,029 ,977
a. Dependent Variable: Purchase decision
From the table above can be drawn regression equation as follows:
Y = -0,095 + 0,233 X1 + 0,914 X2 + 0,356 X3 + 0,004 M + ε ......................Model 2
The coefficient of price regression (X1) to the buying decision is positive 0,233 and
not significant 0,254 (bigger than 0,05), meaning high or low price hence not influence
buying decision (Y). The advertisement regression coefficient (X2) to the purchase decision is
positive 0.914 and significant 0,000 (less than 0.05), meaning the better the ad is displayed
and the higher the intensity of the advertisement in the show there is a higher tendency of
purchase decision (Y). The service quality regression coefficient (X3) is positive 0.356 and
significant 0.019 (less than 0.05), meaning the better quality of service provided will increase
Indra Budaya,et.al., Int. J.Eco.Res, 2018, V9 i5, 73 – 87 ISSN:2229-6158
IJER – September – October 2018 available online @ www.ijeronline.com
81
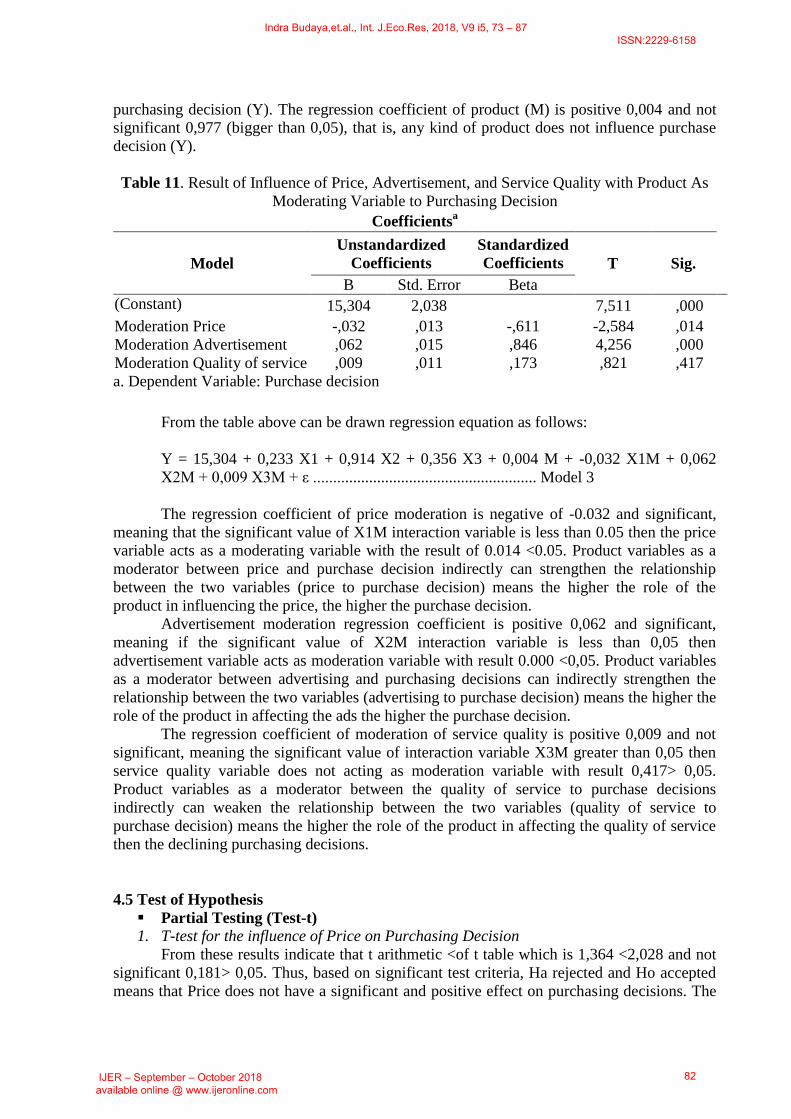
purchasing decision (Y). The regression coefficient of product (M) is positive 0,004 and not
significant 0,977 (bigger than 0,05), that is, any kind of product does not influence purchase
decision (Y).
Table 11. Result of Influence of Price, Advertisement, and Service Quality with Product As
Moderating Variable to Purchasing Decision
Coefficientsa
Model
Unstandardized
Coefficients
Standardized
Coefficients T Sig.
B Std. Error Beta
1 (Constant) 15,304 2,038 7,511 ,000
Moderation Price -,032 ,013 -,611 -2,584 ,014
Moderation Advertisement ,062 ,015 ,846 4,256 ,000
Moderation Quality of service ,009 ,011 ,173 ,821 ,417
a. Dependent Variable: Purchase decision
From the table above can be drawn regression equation as follows:
Y = 15,304 + 0,233 X1 + 0,914 X2 + 0,356 X3 + 0,004 M + -0,032 X1M + 0,062
X2M + 0,009 X3M + ε ........................................................ Model 3
The regression coefficient of price moderation is negative of -0.032 and significant,
meaning that the significant value of X1M interaction variable is less than 0.05 then the price
variable acts as a moderating variable with the result of 0.014 <0.05. Product variables as a
moderator between price and purchase decision indirectly can strengthen the relationship
between the two variables (price to purchase decision) means the higher the role of the
product in influencing the price, the higher the purchase decision.
Advertisement moderation regression coefficient is positive 0,062 and significant,
meaning if the significant value of X2M interaction variable is less than 0,05 then
advertisement variable acts as moderation variable with result 0.000 <0,05. Product variables
as a moderator between advertising and purchasing decisions can indirectly strengthen the
relationship between the two variables (advertising to purchase decision) means the higher the
role of the product in affecting the ads the higher the purchase decision.
The regression coefficient of moderation of service quality is positive 0,009 and not
significant, meaning the significant value of interaction variable X3M greater than 0,05 then
service quality variable does not acting as moderation variable with result 0,417> 0,05.
Product variables as a moderator between the quality of service to purchase decisions
indirectly can weaken the relationship between the two variables (quality of service to
purchase decision) means the higher the role of the product in affecting the quality of service
then the declining purchasing decisions.
4.5 Test of Hypothesis
Partial Testing (Test-t)
1. T-test for the influence of Price on Purchasing Decision
From these results indicate that t arithmetic <of t table which is 1,364 <2,028 and not
significant 0,181> 0,05. Thus, based on significant test criteria, Ha rejected and Ho accepted
means that Price does not have a significant and positive effect on purchasing decisions. The
Indra Budaya,et.al., Int. J.Eco.Res, 2018, V9 i5, 73 – 87 ISSN:2229-6158
IJER – September – October 2018 available online @ www.ijeronline.com
82
first hypothesis (H1) is rejected. Based on research conducted by Jilly Journal Vol.1 No.4
December 2013, entitled "Promotion, distribution, price influence on purchasing decisions",
the results of the study showed that there is no significant influence between price on
purchasing decisions and research results I support from research conducted by Jilly, BM.
2. T-test for the influence of Advertising on Purchasing Decision.
From these results indicate that t arithmetic> of t table where 5,375> 2.028 and
significant 0.000 <0.05. Thus, based on significant test criteria, Ha accepted and Ho rejected
means that advertising has a significant and positive effect on purchasing decisions. The
second hypothesis (H2) is acceptable.
3. T-test for the effect of the Service quality on Purchasing Decision
From these results indicate that t arithmetic> of t table which is 2.511> 2.028 and
significant 0.017 <0.05. Thus, based on significant test criteria, Ha accepted and Ho rejected
means that the quality of service has a significant and positive impact on purchasing
decisions. The third hypothesis (H3) is acceptable.
4. Test t for Price influence on Purchase Decision through product.
From these results indicate that tarithmetic > of ttable -2.584> 2.030 and significant
0.014<0.05. Thus, based on significant test criteria, Ha accepted and Ho rejected means that
Price has a significant and negative effect on purchasing decisions through the product. The
fourth hypothesis (H4) is acceptable.
5. T-test for advertising influence on Purchasing Decision through product.
From these results indicate that tcount> of ttable which is 4,256> 2,030 and significant
0,000 <0,05. Thus, based on significant test criteria, Ha accepted and Ho rejected means that
advertising has a significant and positive effect on purchasing decisions through the product.
The fifth hypothesis (H5) is acceptable.
6. T-test for the effect of service quality on Purchasing Decision
From these results indicate that t arithmetic <of t table which is 0.821 <2.030 and
significant 0.417> 0.05. Thus, based on significant test criteria, Ha rejected and Ho accepted
means that the quality of service does not have a significant and positive impact on
purchasing decisions through the product. the sixth hypothesis (H6) is rejected.
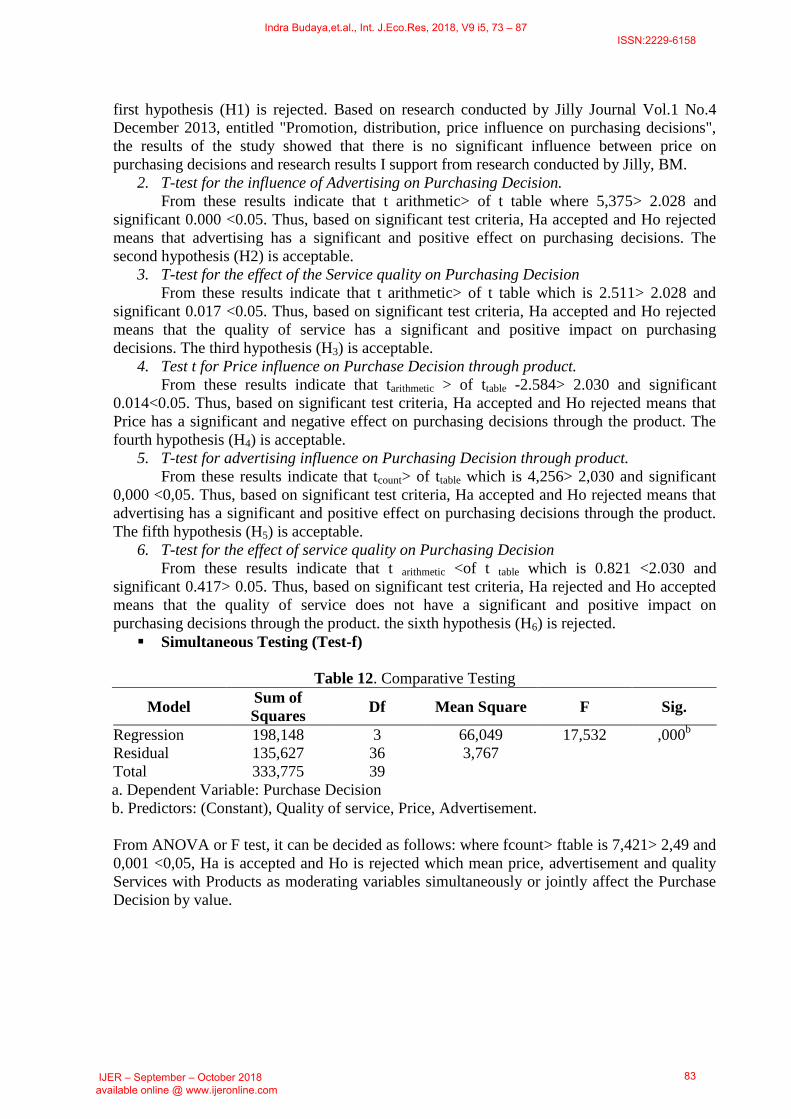
Simultaneous Testing (Test-f)
Table 12. Comparative Testing
Model Sum of
Squares Df Mean Square F Sig.
1 Regression 198,148 3 66,049 17,532 ,000b
Residual 135,627 36 3,767
Total 333,775 39
a. Dependent Variable: Purchase Decision
b. Predictors: (Constant), Quality of service, Price, Advertisement.
From ANOVA or F test, it can be decided as follows: where fcount> ftable is 7,421> 2,49 and
0,001 <0,05, Ha is accepted and Ho is rejected which mean price, advertisement and quality
Services with Products as moderating variables simultaneously or jointly affect the Purchase
Decision by value.
Indra Budaya,et.al., Int. J.Eco.Res, 2018, V9 i5, 73 – 87 ISSN:2229-6158
IJER – September – October 2018 available online @ www.ijeronline.com
83
V. SUMMARY AND SUGGESTION
5.1 Summary
Based on the description and analysis of the previous chapters then drawn conclusions
as follows:
1. There is no significant and positive influence between Price on Decision of Simpati
Card Purchase (case study on STIE-SAK student using sympathy card) which can be
proved by t arithmetic <from t table that is 1,364 <2,028.
2. There is a significant and positive influence between the Ads on the Decision of
Simpati Card Purchase (case study on STIE-SAK students using sympathy card)
which can be proven by t count> from t table that is 5,375> 2,028.
3. There is a significant and positive influence between Service Quality on Decision of
Simpati Card Purchase (case study on STIE-SAK students using sympathy card)
which can be proven by t count> from t table that is 2,511> 2,028.
4. There is a significant and negative influence between Price and Product as Moderating
Variables on Simpati Card Purchase Decision (case study on STIE-SAK students
using sympathy card) which can be proven by t count <of t table ie -2.584 <2.030.
5. There is a significant and positive influence between Advertising and Product as
Moderating Variables on Decision of Simpati Card Purchase (case study on STIE-
SAK student using sympathy card) which can be proven by t count> from t table that
is 4,256> 2,030.
6. There is an insignificant and positive influence between Quality of Service and
Product as Moderating Variables on Simpati Card Purchase Decision (case study on
STIE-SAK students using sympathy card) which can be proven by t count <from t
table that is 0,821 <2,030.
7. There is a significant influence between Price, Advertising and Quality of Service on
Simpati Card Purchasing Decision (case study on STIE-SAK students using sympathy
card). From ANOVA test or F test where ft> ftable is 17,532> 2,49 and 0,000 <0,05,
the Price, Ads and Quality of Service have simultaneous or mutual effect on Purchase
Decision.
8. There is a significant influence between Price, Advertising and Quality of Service with
Products as Moderating Variables on Decision of Simpati Card Purchase (case study
on STIE-SAK students using sympathy card). From ANOVA test or F test where
fcount> ftable is 7,421> 2,49 and 0,000 <0,05, Price, Advertisement and Quality of
Service with Product as moderating variable simultaneously or jointly influence to
Purchase Decision with value.
9. From linear proof of multiple regression the product is precisely described as a
moderating variable in the relationship of price and purchase decision, as well as
advertising and purchasing decisions. This is very important for Telkomsel's
management in determining whether Telkomsel will provide advertisements that can
convince consumers, or improve products for the occurrence of purchasing decisions.
Indra Budaya,et.al., Int. J.Eco.Res, 2018, V9 i5, 73 – 87 ISSN:2229-6158
IJER – September – October 2018 available online @ www.ijeronline.com
84
5.2 Suggestions
Based on the above conclusions, it can be suggested as follows:
1. It is expected that Telkomsel provider pay more attention on advertisement variable
because of the results of research, advertising variables are variables that have the
highest influence on consumer satisfaction.
2. It is expected that Telkomsel's management can provide advertisements that convince
consumers, and improve its products so that it can make purchasing decisions on the
sympathy card.
3. For Telkomsel to further pay attention to other variables in order to improve
purchasing decisions.
4. For the next researcher is suggested to develop the result of this research by involving
other variables relevant so that the results of further research more accurate.
BIBLIOGRAPHY
Abubakar, R. 2005. Pengaruh Pelaksanaan Bauran Pemasaran terhadap Proses Pembelian
Keputusan Pembelian pada Jamu di Banda Aceh, USU e-Journal’s, Vol.6 No.3, Medan.
Erni, Tisnawati Sule dan Kurniawan, Saefullah. 2008. Pengantar Manajemen. Penerbit
Kencana, Jakarta.
Garpersz, Vincent. 2002. Rencana Pedoman Penyusunan Rencana Bisnis. Gramedia Pustaka
Utama.
Ghozali, Imam. 2011. Aplikasi Analisis Multivariate dengan Program IMB. SPSS 19 (Edisi
kelima). Semarang: Universitas Diponegoro.
Gitosudarmo, Indriyo. 2000 . Manajemen Pemasaran. Yogyakarta: Penerbit BPFE
Griffin, Ricky W dan Ebert, Ronald J. 2007. Bisnis. Edisi ke-8, jilid 1. Penerbit Erlangga,
Jakarta.
Hardiansyah. 2011. Kualitas Pelayanan Publik .Penerbit Gava Media.
Hasibuan, Malayu S.P. 2011. Manajemen : Dasar, Pengertian dan Masalah. Penerbit PT.
Bumi Aksara, Jakarta
Indriyo Gitosudarmo. 2000. Manajemen Pemasaran. Yogyakarta: BPFE.
Jefkins, Frank. 1997. Periklanan. Jakarta: Erlangga.
Kotler, Philip. 2001. Manajemen Pemasaran, Analisis Perencanaan, Implementasi dan
Pengendalian. Jakarta: Prenhalindo.
________________. 2002. Marketing Management: The Milineum Edition, Jilid I, Jakarta:
Prenhalindo.
________________. Manajemen Pemasaran Perspektif Asia: Buku 2. Yogyakarta. Andi
Indra Budaya,et.al., Int. J.Eco.Res, 2018, V9 i5, 73 – 87 ISSN:2229-6158
IJER – September – October 2018 available online @ www.ijeronline.com
85
________________. 2005. Prinsip-Prinsip Pemasaran Jilid I. Jakarta : Erlangga.
________________. 2012. Manajemen Pemasaran . Cetakan Ketiga. PT. Indeks. Jakarta.
Kotler, Philip dan Armstrong, Gary. 2008. Prinsip-Prinsip Pemasaran .Jilid 1 Edisi 12,
Jakarta: Erlangga.
_____________________________. 2011. 10th Editiion. “Marketing an Introduction”.
Indonesia: Pearson.
Kotler, Philip dan Lane Keller. 2009. Manajemen Pemasaran.Edisi 13.Jilid 1. Jakarta:
Erlangga.
Lu Shu,Jane dan Chang, Kai-Ming. 2008. Purchase Of Clothing and It’s Linkage to Family
Communication and Life Style Among Young Adults. Jurnal of Fashion Marketing and
Management (online). Vol.12 No.2, 2008 pp. 147-163. (http:// www.emeraldinsinght.com).
Mandey, J.B. 2013. Jurnal EMBA Vol.1 No.4 Desember 2013, Hal.95-104 “Promosi,
Distribusi, Harga Pengaruhnya Terhadap Keputusan Pembelian Rokok Surya Promild”.
Universitas Sam Ratulangi Manado.
Morrisan. 2010. Periklanan. Predana Media Group.
Mowen, Jhon C, dan Minor Michael. 2002. Perilaku Konsumen. (Terjemahan, Edisi ke-5
jilid 1). Jakarta: PT Penerbit Erlangga.
Nugroho, J Setiadi, SE,MM .2008. Perilaku Konsumen: Konsep dan Implikasi untuk Strategi
dan Penelitian Pemasaran. Jakarta: Kencana.
Oktaria , nanda. 2013. Analisis Pengaruh Kualitas Pelayanan Terhadap Kepuasan Pasien
Pada Rumah Sakit Umum Daerah Muara Labuh. Universitas Putra Indonesia “YPTK”
Padang.
Peter, J.Paul dan Oleson, Jerry C. 2000. Consumer Behavior: Perilaku Konsumen dan
Strategi Pemasran. Jilid 2 Edisi 4. Erlangga.
Prasetijo, Tistiyanti dan Ilhalauw, jhon JOI. 2006. Perilaku Konsumen. Andi Publisher.
Saladin, Djaslim. 2002. Manajemen Pemasaran: Analisis Pelaksanaan dan Pengendalian.
Bandung: Linda Karya.
Saladin, Djaslim. 2003. Unsur-Unsur Inti Pemasaran dan Manajemen Pemasaran. Penerbit
Mandar Maju.
Samad, Abdul dan Wibowo,Imam. 2016. Jurnal Manajemen Bisnis Krinadwipayana Vol.4
N0.3 September 2016 “ Pengaruh Produk dan Citra Merek Terhadap Keputusan Pembelian
Sepatu Olah Raga Merek Specs di Kota Bekasi”. Kampus UNKRIS, Jatiwaringin Jakarta
Timur.
Indra Budaya,et.al., Int. J.Eco.Res, 2018, V9 i5, 73 – 87 ISSN:2229-6158
IJER – September – October 2018 available online @ www.ijeronline.com
86
Schiffman, Leon G dan Leslie Lazar Kanuk. 2004. Consumen Behavior. 8th Ed. Prentice
Halll
Sedarmayanti., dan Syarifudin Hidayat. 2011. Metodologi Penelitian. Bandung: Mandiri
Maju.
Setiadi, Nugroho J. 2013. Perilaku Konsumen:Edisi revisi. Jakarata: Kencana.
Simamora, Bilson . 2003. Membongkar Kotak Hitam Konsumen. Gramedia Pustaka Utama.
_______________. 2008. Panduan Riset Perilaku Konsumen. Cetakan ketiga. Jakarta:
Gramedia Pustaka Utama.
_______________. 2011. Memenangkan Pasar dengan Pemasaran efektif dan profitabel.
Jakarta: PT.Gramedia Pustaka Utama.
Siswanto, S.B. 2013. Pengantar Manajemen. Bumi Aksara, Jakarta.
Sugiyono . 2008. Metode Penelitian Kuantitatif, Kualitatif dan R&D .Bandung: Penerbit
Alfaberta.
Sukotjo, Hendri dan A.Radix, Sumanto. 2010. Jurnal Mitra Ekonomi dan Manajemen Bisnis,
Vol.1 No.2, Oktober 2010,216-228 “Analisa Marketing Mix-7P (Product, Price, Promotion,
Place, Prticipant, Process, dan Physical Evidence) Terhadap Keputusan Pembelian Produk
Klinik Kecantikan Teta di Surabaya”. Universitas 17 Agustus 1945, Surabaya.
Suryani, Tatik. 2008. Perilaku Konsumen: Implikasi pada Strategi Pemasaran. Yogyakarta:
Graha Ilmu.
Sutabri, Tata. 2005. Sistem Informasi Manajemen. Edisi 1. Yogyakarta: ANDI.
Tangkilisan, Hessel Nogi S. 2005. Manajemen Publik. Jakarta: Grasindo.
Tjiptono, Fandy. 2008. Strategi Pemasaran. Edisi ketiga. Yogyakarta: ANDI.
Tjiptono, Fandy dan Chandra, Gregorius. 2012. Pemasaran Strategik. Edisi 3. Yogyakarta:
Penerbit Andi.
Tjiptono, Fandy . 2014. Pemasaran Jasa, Prinsip, Penerapan Dan Penelitian. Yogyakarta:
Andi Publisher.
Wahyuni, Sri dan Pardamean, Jonianto. 2016. Jurnal Studi Manajemen dan Bisnis Vol.3
No.1 Tahun 2016”Pengaruh Iklan dan Kualitas LayananTerhadap Keputusan Pembelian
Kartu simpati di Institute Perbanas”. Institute Perbanas Jakarta.
Wibowo, S.F. 2012. Jurnal Riset Manajemen Sains Indonesia (JRMSI)Vol.3 No.1 2012
“Pengaruh Iklan Televisi dan Harga Terhadap Keputusan Pembelian Sabun Lux (survey
pada pengunjung mega bekasi hypermall)”. Fakultas Ekonomi Universitas Negeri Jakarta.
Widyantama, Rendra. 2007. Pengantar Periklanan.Pustaka Book Publisher.
Yamit, Zulian. 2005. Manajemen Kualitas Produk dan Jasa. Edisi Pertama, Cetakan ke-4.
Yogyakarta: Penerbit Ekonisia.
Indra Budaya,et.al., Int. J.Eco.Res, 2018, V9 i5, 73 – 87 ISSN:2229-6158
IJER – September – October 2018 available online @ www.ijeronline.com
87