Prezentare - Cost Saving Through Technology
20
Seeking the Silver Bullet: Cost Savings Through Technology Logistics Technology Forum Eye for Transport April 21, 2009
-
Upload
otilia-ciaglic -
Category
Documents
-
view
216 -
download
1
description
prezentare
Transcript of Prezentare - Cost Saving Through Technology
Seeking the Silver Bullet:Cost Savings Through Technology
Logistics Technology ForumEye for TransportApril 21, 2009

Economic pressures on companies are greater than in decades. The demand for cost savings, both internally and externally is driving logistics decisions. Can technology provide a silver bullet for driving costs out of the supply chain?
•Penske Logistics Overview
•Freight Data Analysis – Case Study
•Network Convergence – Case Study
Agenda
Copyright © 2009 Penske. All rights Reserved.
Page 1
•Network Convergence – Case Study
•Dynamic Routing – Case Study
•Summary
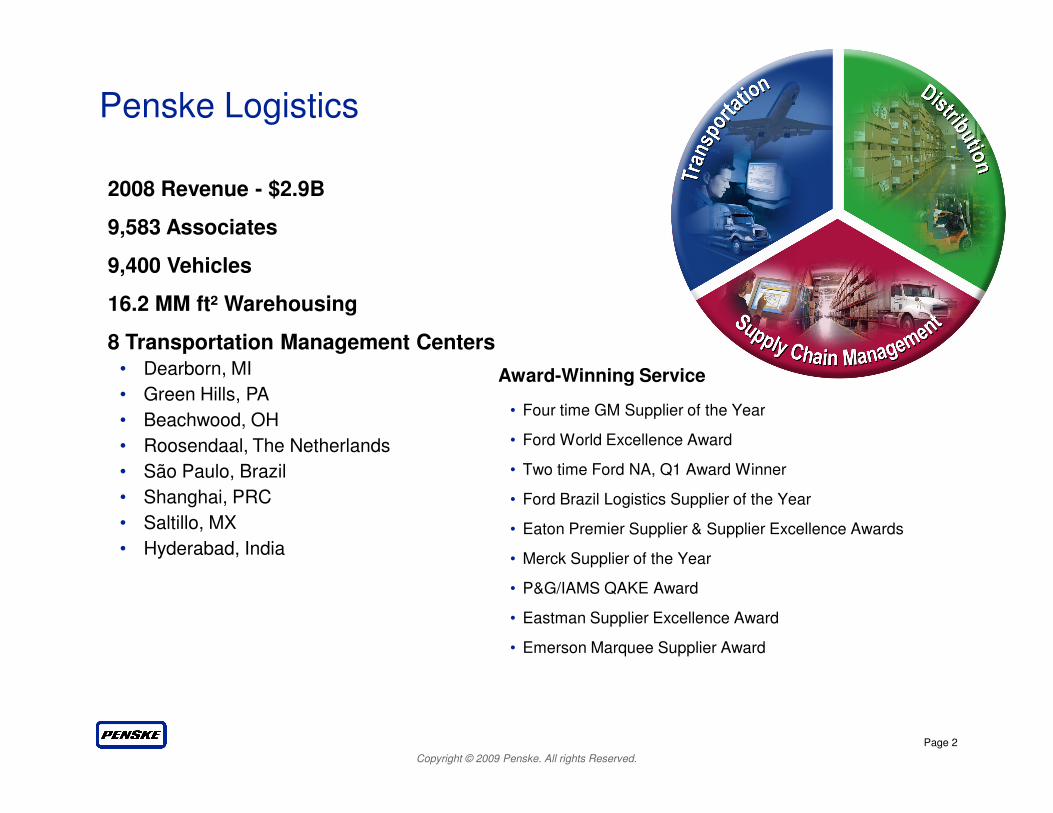
Penske Logistics
2008 Revenue - $2.9B
9,583 Associates
9,400 Vehicles
16.2 MM ft² Warehousing
8 Transportation Management Centers• Dearborn, MI
• Green Hills, PAAward-Winning Service
• Four time GM Supplier of the Year
Copyright © 2009 Penske. All rights Reserved.
Page 2
• Beachwood, OH
• Roosendaal, The Netherlands
• São Paulo, Brazil
• Shanghai, PRC
• Saltillo, MX
• Hyderabad, India
• Four time GM Supplier of the Year
• Ford World Excellence Award
• Two time Ford NA, Q1 Award Winner
• Ford Brazil Logistics Supplier of the Year
• Eaton Premier Supplier & Supplier Excellence Awards
• Merck Supplier of the Year
• P&G/IAMS QAKE Award
• Eastman Supplier Excellence Award
• Emerson Marquee Supplier Award
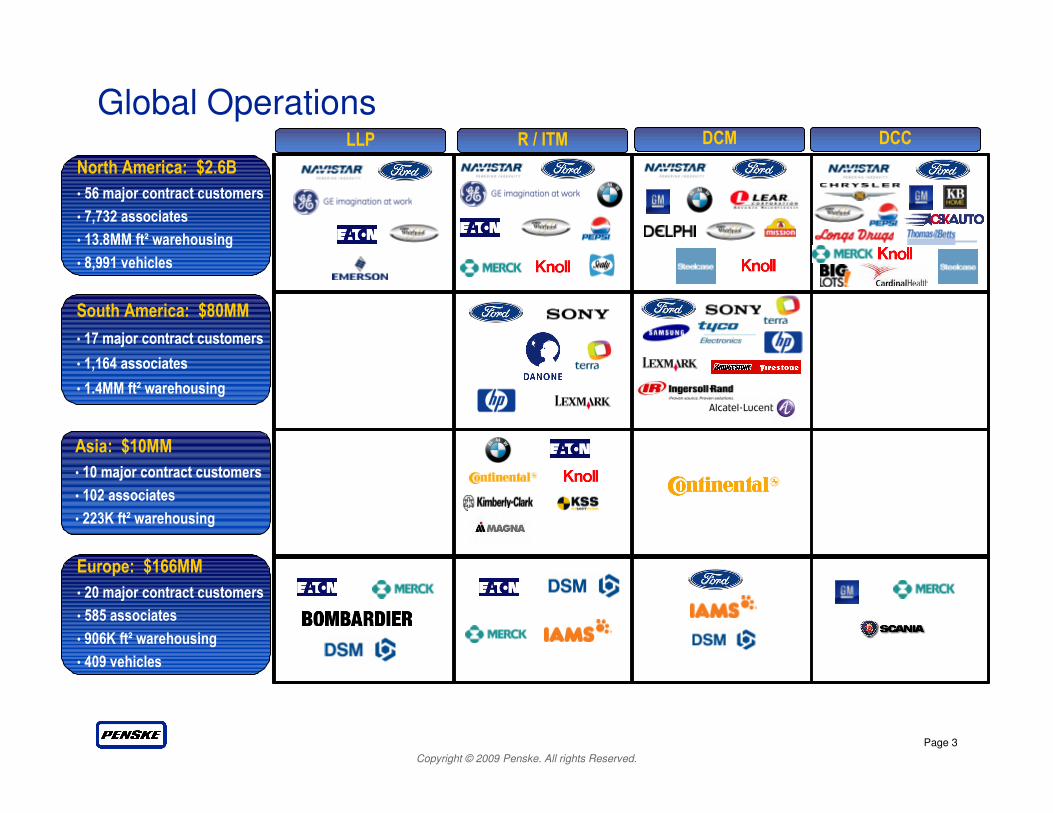
Global Operations
North America: $2.6B
• 56 major contract customers
• 7,732 associates
• 13.8MM ft² warehousing
• 8,991 vehicles
South America: $80MM
• 17 major contract customers
• 1,164 associates
• 1.4MM ft² warehousing
LLP R / ITM DCM DCC
Copyright © 2009 Penske. All rights Reserved.
Page 3
Europe: $166MM
• 20 major contract customers
• 585 associates
• 906K ft² warehousing
• 409 vehicles
Asia: $10MM
• 10 major contract customers
• 102 associates
• 223K ft² warehousing
Freight Data Analysis
Case Study
Freight Data Analysis – Case Study
Client Profile:
• Global diversified manufacturer
• Penske engaged at division level
• Division operated on a site-centric basis
• Task – 10% freight spend reduction
• Modes:
Copyright © 2009 Penske. All rights Reserved.
Page 5
• Modes:
–TL
–LTL
–Small Package
–Air
Freight Data Analysis – Case Study
Penske Approach
• Analysis of past year’s freight data allowed us to identify a number of possible projects –
• Improved transportation efficiency and coordination
• Tighter integration with supplier and customers
• Coordinated decision-making across sites
• Site visits, discussions with stakeholders, and conference calls enabled
Copyright © 2009 Penske. All rights Reserved.
Page 6
• Site visits, discussions with stakeholders, and conference calls enabled validation of savings potential, prioritization of projects, and coordination between various sites
Tools Used
• Data analysis, contract analysis, rate shop, change management, process mapping
Results
• 12 – 16% identified annual savings, net, transportation spend
Network Convergence
Case Study
Network Convergence – Case Study
Client Profile
• North American-based automotive manufacturer
• Penske engaged at Corporate level
• Four divisions:
–Powertrain
–Stamping
Copyright © 2009 Penske. All rights Reserved.
Page 8
–Stamping
–Production
–Service & Replacement Parts (S&RP)
• Record-setting cost-reduction task

Network Convergence – Case Study
Production:
–Crossdocks: 4
–Production Suppliers: 1,883
Network Statistics
• 2 different 3PLs working cooperatively to create Network Synergies
• Primary focus cost reduction & inventory reduction
Copyright © 2009 Penske. All rights Reserved.
Page 9
–Production Suppliers in crossdock network: 1,442
S & RP:
–Packagers / PDCs: 40
–S&RP Suppliers: 1,454
–Network Convergence Suppliers: 586
–Network Convergence OD Pairs: 1,197
Crossdock
Packager / PDC
Production Unique
Integrated Common S&RP
Common S&RP Not Integrated
S&RP Unique
SDS Common
SDS Non Common
Network Convergence – Case Study
Penske Approach
• Analysis of the two independent networks allowed us to identify multiple synergies for leverage –
– Common suppliers
– Crossdocks and other infrastructure
– Backhaul opportunities
• Some process changes were requires, as well as a high degree of
Copyright © 2009 Penske. All rights Reserved.
Page 10
• Some process changes were requires, as well as a high degree of collaboration between the two 3PLs
Tools Used
• Data analysis, contract analysis, rate shop, change management, process mapping, route design, trailer cube mapping
Results
• Over $3M annual savings, net, in transportation spend
Dynamic Routing
Case Study

Dynamic Routing – Case Study
Client Profile
• North America based manufacturer of refrigerated food products
• Explosive expansion across North America, U.S. in particular
• Retail outlets –
–Supermarkets
–Distributors
Copyright © 2009 Penske. All rights Reserved.
Page 12
–Distributors
–Big Box retailers
• Dedicated truck fleet, and dedicated routing system proving costly
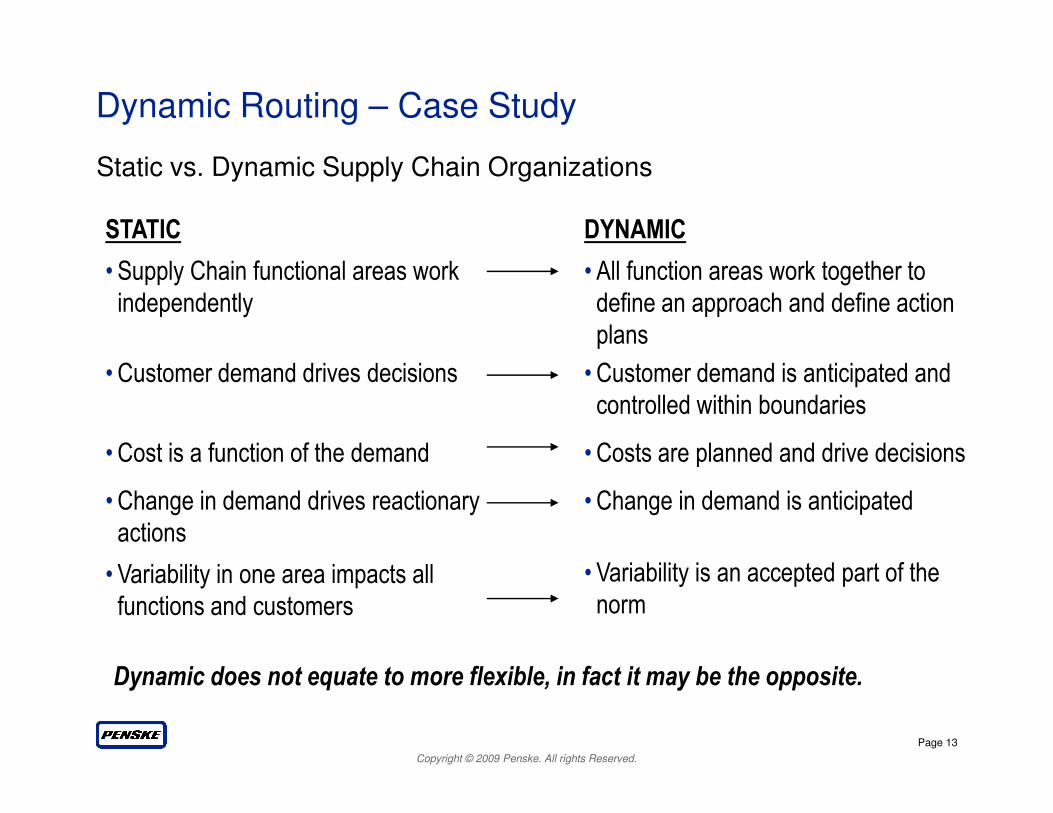
STATIC
• Supply Chain functional areas work
independently
DYNAMIC
• All function areas work together to
define an approach and define action
plans
Static vs. Dynamic Supply Chain Organizations
• Customer demand drives decisions • Customer demand is anticipated and
controlled within boundaries
Dynamic Routing – Case Study
Copyright © 2009 Penske. All rights Reserved.
Page 13
Dynamic does not equate to more flexible, in fact it may be the opposite.
controlled within boundaries
• Cost is a function of the demand • Costs are planned and drive decisions
• Change in demand drives reactionary
actions
• Variability in one area impacts all
functions and customers
• Change in demand is anticipated
• Variability is an accepted part of the
norm
Limitations:
• A routing tool can only route given its defined constraints
• The routing is a snapshot for the period of time being routed - it does not consider driver availability across a time period, conduct driver scheduling, etc
• The tool routes only the data given, human errors in entering order demand cannot be caught by the system (GIGO)
Dynamic Routing – Case Study
Copyright © 2009 Penske. All rights Reserved.
Page 14
• The routing tool will plan pickup and delivery at the earliest time available, and does not balance the volume being picked up or received
• The tool does not plan the labor schedule at the supplier or delivery point

Dynamic Routing – Case Study
Points to be routed in vRA How the routes appear after routing
Copyright © 2009 Penske. All rights Reserved.
Page 15
How the routes look with actual roadways
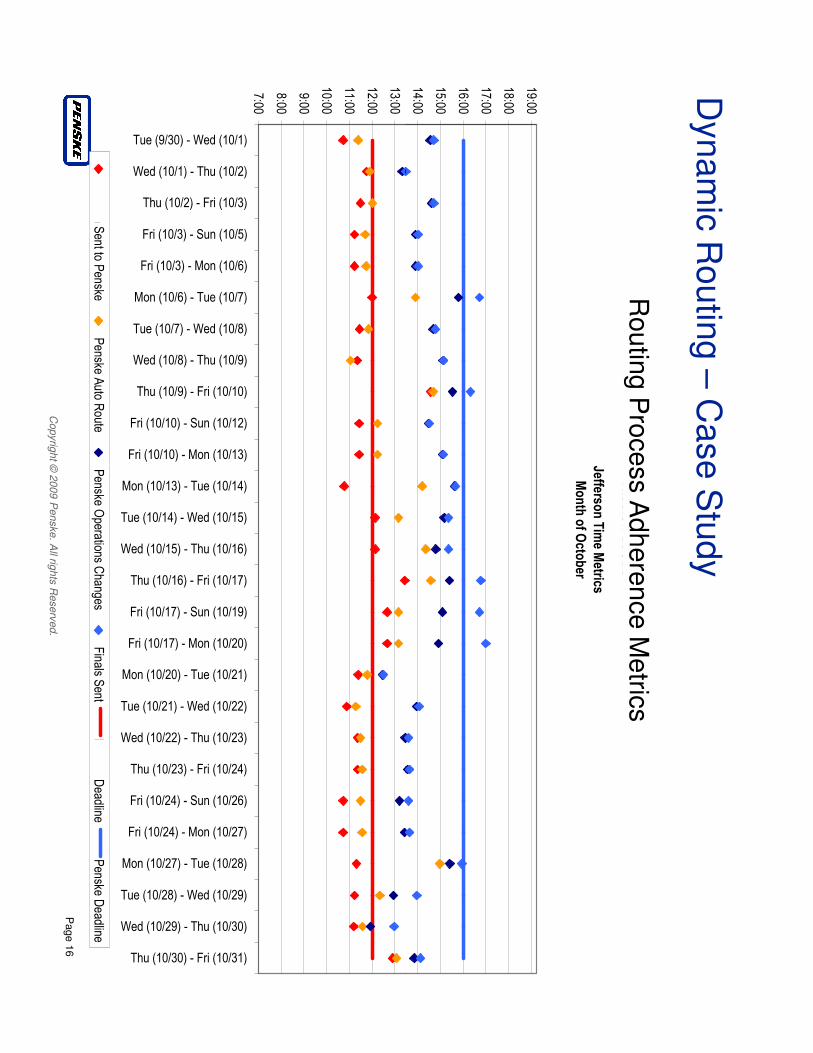
MISSION FOODS
Jefferson Time M
etrics
Month of October
14:00
15:00
16:00
17:00
18:00
19:00
Ro
utin
g P
roce
ss A
dh
ere
nce
Me
trics
Dyn
am
ic R
ou
ting
–C
ase
Stu
dy
Copyrig
ht ©
2009 P
enske. A
ll rights
Reserv
ed.
Page 1
6
7:00
8:00
9:00
10:00
11:00
12:00
13:00
Tue (9/30) - Wed (10/1)
Wed (10/1) - Thu (10/2)
Thu (10/2) - Fri (10/3)
Fri (10/3) - Sun (10/5)
Fri (10/3) - Mon (10/6)
Mon (10/6) - Tue (10/7)
Tue (10/7) - Wed (10/8)
Wed (10/8) - Thu (10/9)
Thu (10/9) - Fri (10/10)
Fri (10/10) - Sun (10/12)
Fri (10/10) - Mon (10/13)
Mon (10/13) - Tue (10/14)
Tue (10/14) - Wed (10/15)
Wed (10/15) - Thu (10/16)
Thu (10/16) - Fri (10/17)
Fri (10/17) - Sun (10/19)
Fri (10/17) - Mon (10/20)
Mon (10/20) - Tue (10/21)
Tue (10/21) - Wed (10/22)
Wed (10/22) - Thu (10/23)
Thu (10/23) - Fri (10/24)
Fri (10/24) - Sun (10/26)
Fri (10/24) - Mon (10/27)
Mon (10/27) - Tue (10/28)
Tue (10/28) - Wed (10/29)
Wed (10/29) - Thu (10/30)
Thu (10/30) - Fri (10/31)
Mission S
ent to Penske
Penske A
uto Route
Penske O
perations Changes
Finals S
entMission D
eadlinePenske D
eadline
Dynamic Routing – Case Study
Penske Approach
• Analysis of the order patterns and demand profiles confirmed the opportunity for a more efficient routing solution
• This included a better selection process for dedicated vs. common carrier
• The joint project team worked together to create a new order process flow, from order input through production processes, to enable dynamic routing
• Rollout was implemented on a site by site basis
Copyright © 2009 Penske. All rights Reserved.
Page 17
• Rollout was implemented on a site by site basis
• Implementation timelines have shrunk as the team becomes more efficient
Tools Used
• Data analysis, mode selection, rate shop, change management, process mapping, route design, trailer cube mapping, visual route assist
Results
• 3-8% savings in transportation spend, net, by location

SummarySummary

Cost Savings Through Technology
•3 different clients, 3 different problems, 3 different sets of tools deployed, 3 different solutions: no silver bullet
•Technology alone is not the answer
Copyright © 2009 Penske. All rights Reserved.
Page 19
answer
•Satisfactory results require good tools, good processes, and good people to use them
•Your company is as good as your people, and your chosen partners