Diabetic Nephropathy Recent advances in management of Diabetic Nephropathy.
Upload
nguyentramCategory
view
217download
1
Prevention And Treatment of Diabetic Nephropathy
MOH Clinical Practice Guidelines 3/2006
Dr Stephen Chew Tec Huan


Prevention
• Tight glucose control reduces the development of diabetic nephropathy

Progression Of Complications In Type 1 Diabetics With Intensive And Conventional Treatment
(DCCT) - Primary Prevention
Complications Conventional Therapy
Intensive Therapy
Risk Reduction
Rate/100 patient-year % (95% CI)
Urinary Alb (mg/24hr)
>40 3.4 2.2 34 (2-56)
>300 0.3 0.2 44 (-124-86)
Clinical Nephropathy at 5 years
9.8 3.1 69 (24-87)
The Diabetes Control And Complications Trial Research Group, NEJM 1993
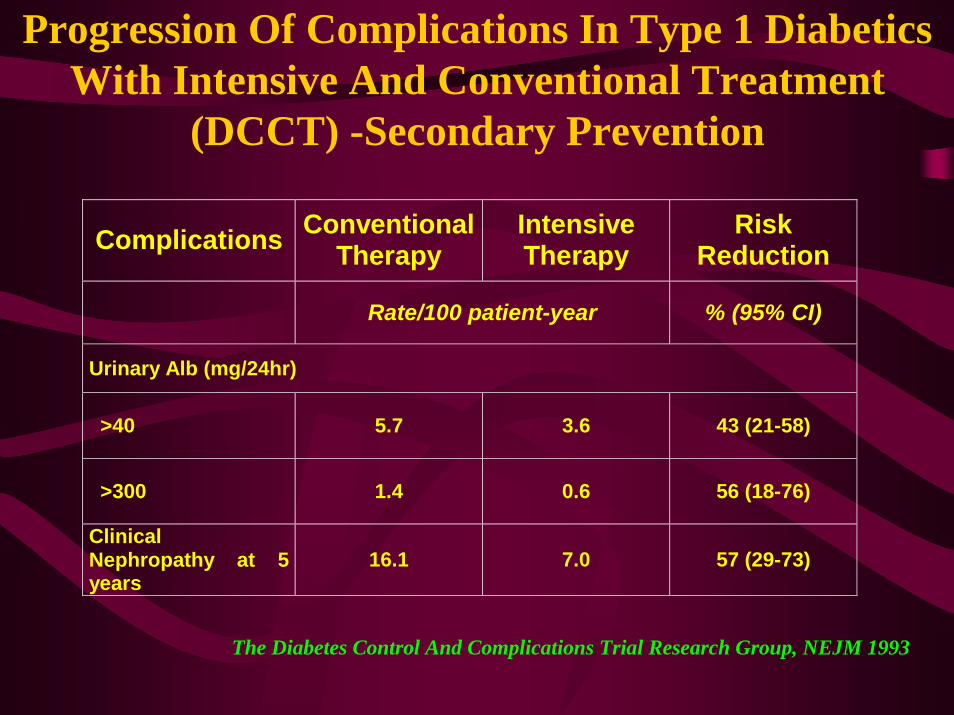
Progression Of Complications In Type 1 Diabetics With Intensive And Conventional Treatment
(DCCT) -Secondary Prevention
Complications Conventional Therapy
Intensive Therapy
Risk Reduction
Rate/100 patient-year % (95% CI)
Urinary Alb (mg/24hr)
>40 5.7 3.6 43 (21-58)
>300 1.4 0.6 56 (18-76)
Clinical Nephropathy at 5 years
16.1 7.0 57 (29-73)
The Diabetes Control And Complications Trial Research Group, NEJM 1993

UKPDS• Prospective randomized trial in type II
diabetics• Selected newly diagnosed Type II DM with
little or no prexisting renal complications• Compared the effect of intensive therapy and
conventional therapy on development of complications.

UKPDS• Patients on the intensive therapy arm were
treated with a sulphonylurea, or if needed insulin was added, to keep fasting blood glucose <7mmo/l
• Conventional therapy was started with diet, and a sulphonylurea added to keep fasting blood glucose <15mmol/l.
• Patients followed up 10 years
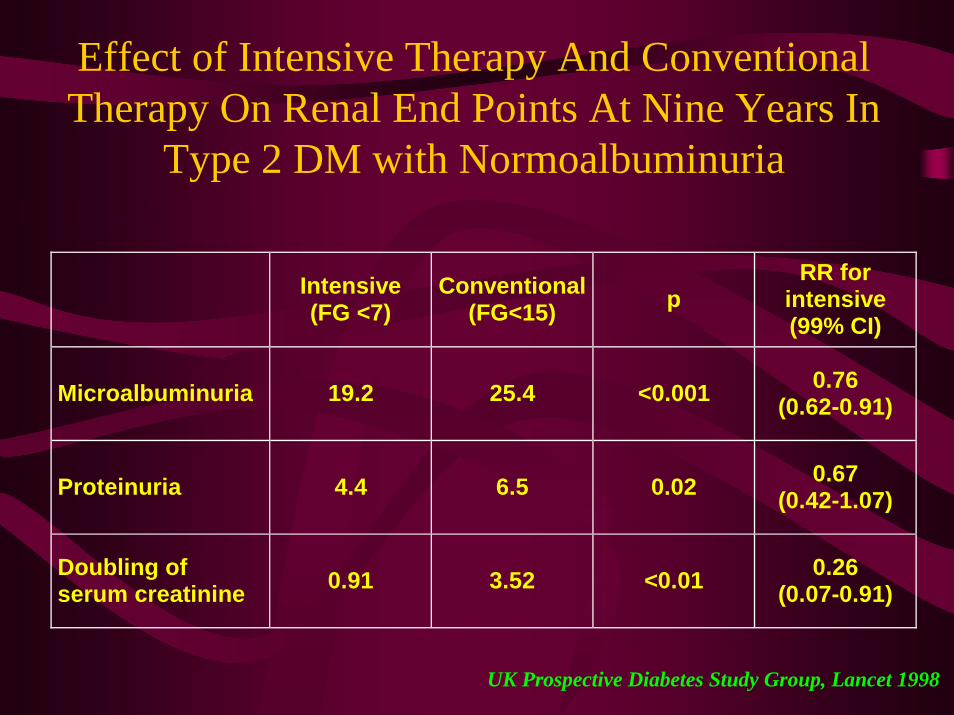
Effect of Intensive Therapy And Conventional Therapy On Renal End Points At Nine Years In
Type 2 DM with Normoalbuminuria
Intensive (FG <7)
Conventional (FG<15) p
RR for intensive (99% CI)
Microalbuminuria 19.2 25.4 <0.001 0.76 (0.62-0.91)
Proteinuria 4.4 6.5 0.02 0.67 (0.42-1.07)
Doubling of serum creatinine 0.91 3.52 <0.01 0.26
(0.07-0.91)
UK Prospective Diabetes Study Group, Lancet 1998
Prevention
• Blood pressure control reduces the development of microvascular disease in diabetics

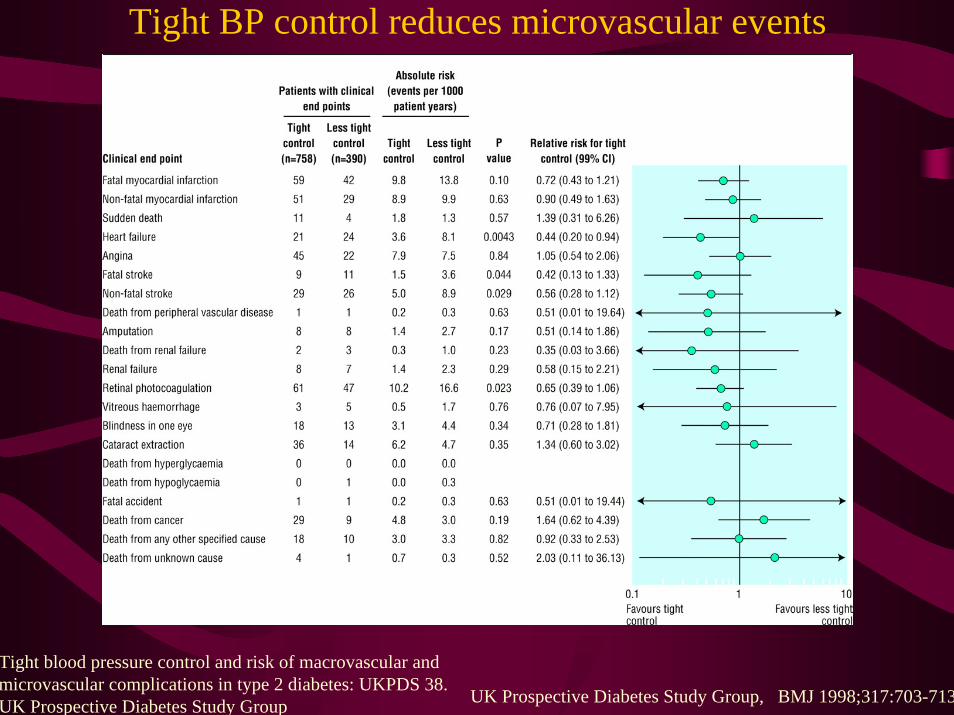
Tight BP control reduces microvascular events
Tight : 144/82 mm Hg achievedLess: 154/72 mmHg achieved
Tight blood pressure control and risk of macrovascular and microvascular complications in type 2 diabetes: UKPDS 38. UK Prospective Diabetes Study Group UK Prospective Diabetes Study Group, BMJ 1998;317:703-713
Tight BP control reduces microvascular events
Tight blood pressure control and risk of macrovascular and microvascular complications in type 2 diabetes: UKPDS 38. UK Prospective Diabetes Study Group UK Prospective Diabetes Study Group, BMJ 1998;317:703-713

Tight Blood Pressure Control Confers CV Benefits in Diabetic Patients
-50
-40
-30
-20
-10
0
Tight glucose control(FPG < 107 mg/dL)
Tight BP control(150/85 mmHg)
StrokeAny DMendpoint DM death
Microvascularcomplications
*
** *
Red
uctio
n in
Ris
k (%
)
DM=diabetes mellitusFPG=fasting plasma glucose*P<0.05.
The benefits of lowering BP in the UKPDS were greater than those achieved through glycemic control
UKPDS 35. BMJ. 2000;321:405-412; UKPDS 38. BMJ. 1998;317:703-713.

Screening
• Screening for albuminuria should begin 5 years after the diagnosis of type 1 diabetes
• It should be done immediately after the diagnosis of type 2 diabetes.
• Screening for albuminuria should be done annually

ABNORMAL ALBUMIN EXCRETION
Timed(ug/min)
24 hour(mg/day)
Alb/Cr(mg/gm)
Normal <20 <30 <30
Microalbuminuria 20-200 30-300 30-300
Macroalbuminuria >200 >300 >300
Microalbuminuria needs to be persistent over 6 months
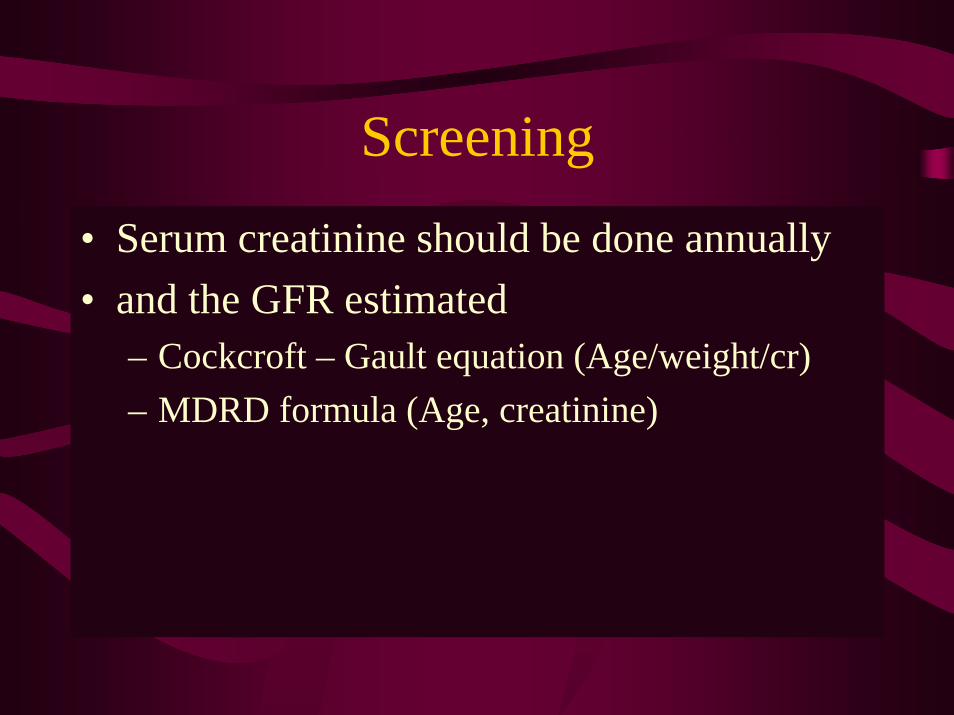
Screening
• Serum creatinine should be done annually• and the GFR estimated
– Cockcroft – Gault equation (Age/weight/cr)– MDRD formula (Age, creatinine)

Renal insufficiency in the absence of albuminuria and retinopathy among adults with type 2 diabetes mellitus
• 3rd NHNES; > 40 yrs, T2 DM; Survey• 13% of type 2 DM with CRI (MDRD)
– DR 28%– Microalbuminuria 45%– Macroalbuminuria 19%
• 30% of CRI with neither DR nor albuminuria
Kramer HJ et al; JAMA 2003; 289; 3273-77

Detection of Microalbuminuria
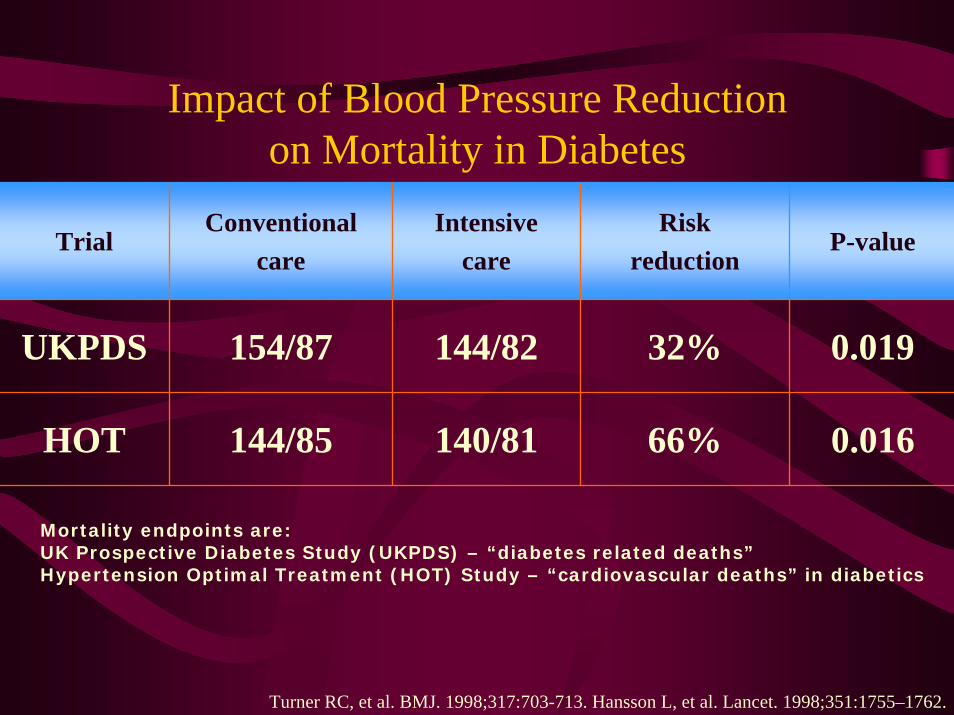
Impact of Blood Pressure Reduction on Mortality in Diabetes
TrialConventional
careIntensive
careRisk
reductionP-value
UKPDS 154/87 144/82 32%
66%
0.019
HOT 144/85 140/81 0.016
Mortality endpoints are:UK Prospective Diabetes Study (UKPDS) – “diabetes related deaths”Hypertension Optimal Treatment (HOT) Study – “cardiovascular deaths” in diabetics
Turner RC, et al. BMJ. 1998;317:703-713. Hansson L, et al. Lancet. 1998;351:1755–1762.

Drug choices in the non-albuminurichypertensive diabetic patient
• Blood pressure control reduces cardiovascular events
• Initial drug choices include– Angotensin converting enzyme inhibitors– Angiotensin receptor blockers– Beta blockers– Diuretics– Calcium channel blockers
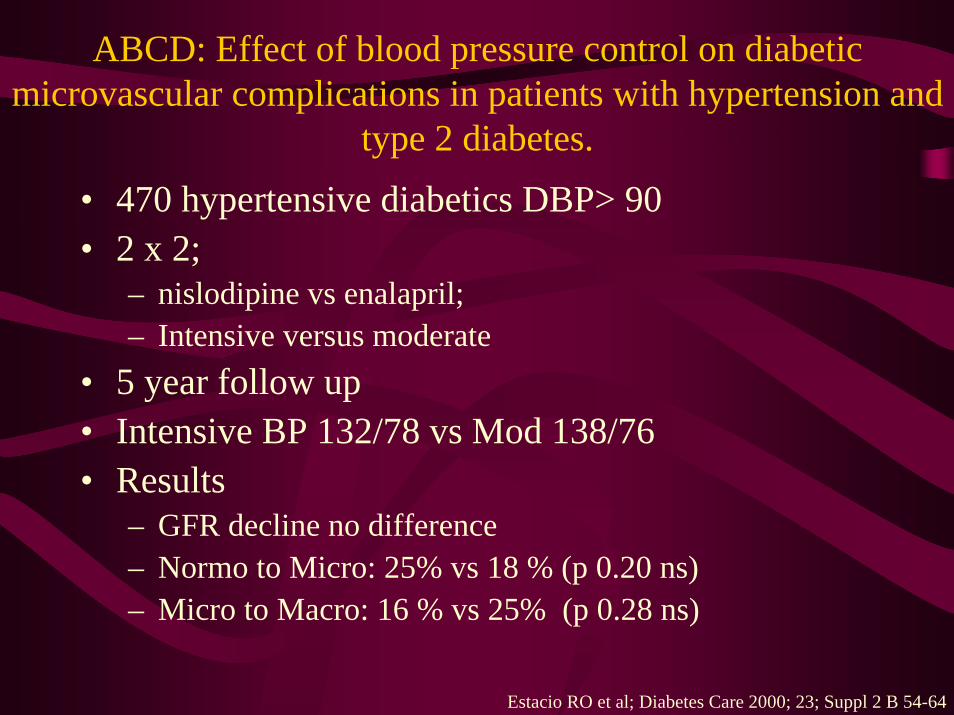
ABCD: Effect of blood pressure control on diabetic microvascular complications in patients with hypertension and
type 2 diabetes.• 470 hypertensive diabetics DBP> 90• 2 x 2;
– nislodipine vs enalapril; – Intensive versus moderate
• 5 year follow up• Intensive BP 132/78 vs Mod 138/76• Results
– GFR decline no difference– Normo to Micro: 25% vs 18 % (p 0.20 ns)– Micro to Macro: 16 % vs 25% (p 0.28 ns)
Estacio RO et al; Diabetes Care 2000; 23; Suppl 2 B 54-64

Blood Pressure Target
• The blood pressure target in all diabetics should be less than 130/80
• Diabetics with proteinuria in excess of 1 gram should attempt to achieve values of less than 125/75 mm Hg

MAP (mmHg)
95
125
105
45
GFR (ml/min/1.73m2)
1250
250
Albuminuria (ug/min)
COURSE OF GFR, ALBUMINURIA, MEAN ARTERIAL BLOOD PRESSURE IN 9 IDDM PATIENTS TREATED WITH ANTIHYPERTENSIVES
years90
Parving HH et al; Am J Kidney Dis. 1993 Jul;22(1):188-95
Slide SourceHypertensionOnline
www.hypertensiononline.org
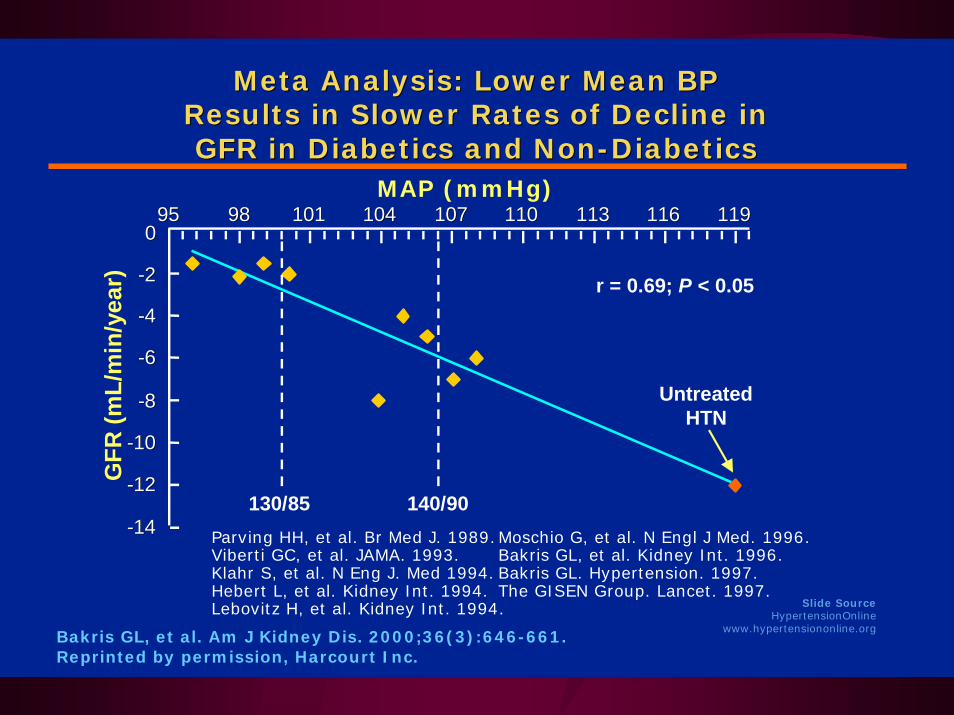
Meta Analysis: Lower Mean BP Meta Analysis: Lower Mean BP Results in Slower Rates of Decline in Results in Slower Rates of Decline in GFR in Diabetics and NonGFR in Diabetics and Non--DiabeticsDiabetics
9595 9898 101101 104104 107107 110110 113113 116116 119119
r = 0.69; P < 0.05
MAP (mmHg)
GFR
(mL/
min
/yea
r)
130/85 140/90
UntreatedHTN
00
--22
--44
--66
--88
--1010
--1212
--1414 Parving HH, et al. Br Med J. 1989.Moschio G, et al. N Engl J Med. 1996.Viberti GC, et al. JAMA. 1993. Bakris GL, et al. Kidney Int. 1996.Klahr S, et al. N Eng J. Med 1994. Bakris GL. Hypertension. 1997.Hebert L, et al. Kidney Int. 1994. The GISEN Group. Lancet. 1997.Lebovitz H, et al. Kidney Int. 1994.
Bakris GL, et al. Am J Kidney Dis. 2000;36(3):646-661.Reprinted by permission, Harcourt Inc.
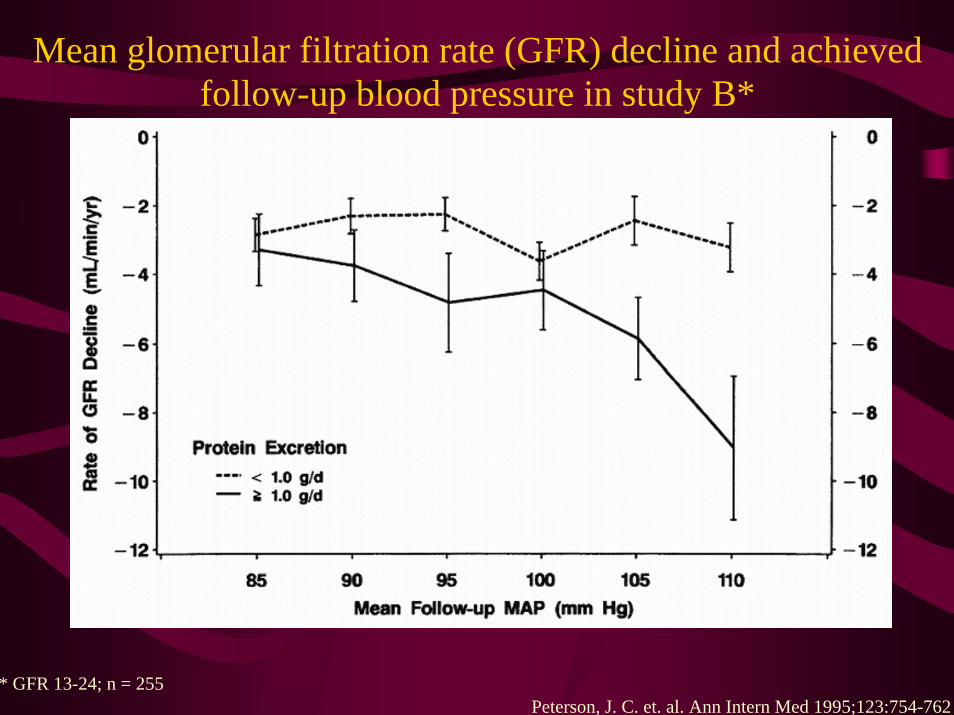
Mean glomerular filtration rate (GFR) decline and achieved follow-up blood pressure in study B*
Peterson, J. C. et. al. Ann Intern Med 1995;123:754-762* GFR 13-24; n = 255

Mean glomerular filtration rate (GFR) decline and achieved follow-up blood pressure in study A*
Peterson, J. C. et. al. Ann Intern Med 1995;123:754-762* GFR 22-55ml/min; n = 585

Combination Therapy Needed to Achieve Target SBP Goals
Number of BP Medications
Trial/SBP Achieved
1 2 3 4
UKPDS (144 mm Hg)
RENAAL(141 mm Hg)
ALLHAT (138 mm Hg)
IDNT (138 mm Hg)
HOT (138 mm Hg)
INVEST (133 mm Hg)
ABCD (132 mm Hg)
MDRD (132 mm Hg)
AASK (128 mm Hg)
Bakris GL et al. Am J Kidney Dis. 2000;36:646-661.

Drug choices in early nephropathy
• The initial therapy of choice should include and ACE inhibitor or an ARB

Drug Choices in Type 1 diabetics with overt nephropathy
• In the presence of overt nephropathy in type 1 diabetes, there is evidence that an ACE inhbitor can retard the progression of otherwise progressive renal disease

ACE-I Is More Renoprotective Than Conventional Therapy in Type 1 Diabetes
% with doubling of
baseline creatinine
100
75
50
25
0
0 1 2 3 4
Baseline creatinine >1.5 mg/dL & overt proteinuria
Captopriln=207
Placebon=202
P<.001
Years of follow-up
Placebo BP achieved 129-136/80-84;Captopril BP achieved 128/134/77-82
50%
Lewis EJ, et al. N Engl J Med. 1993;329(20):1456-1462.Collaborative Study Group Trial

Drug choices in type 2 diabetics with overt nephropathy
• In type 2 diabetes with overt nephropathy, either an ACE inhibitor or an ARB may be used to retard the progression of renal disease.
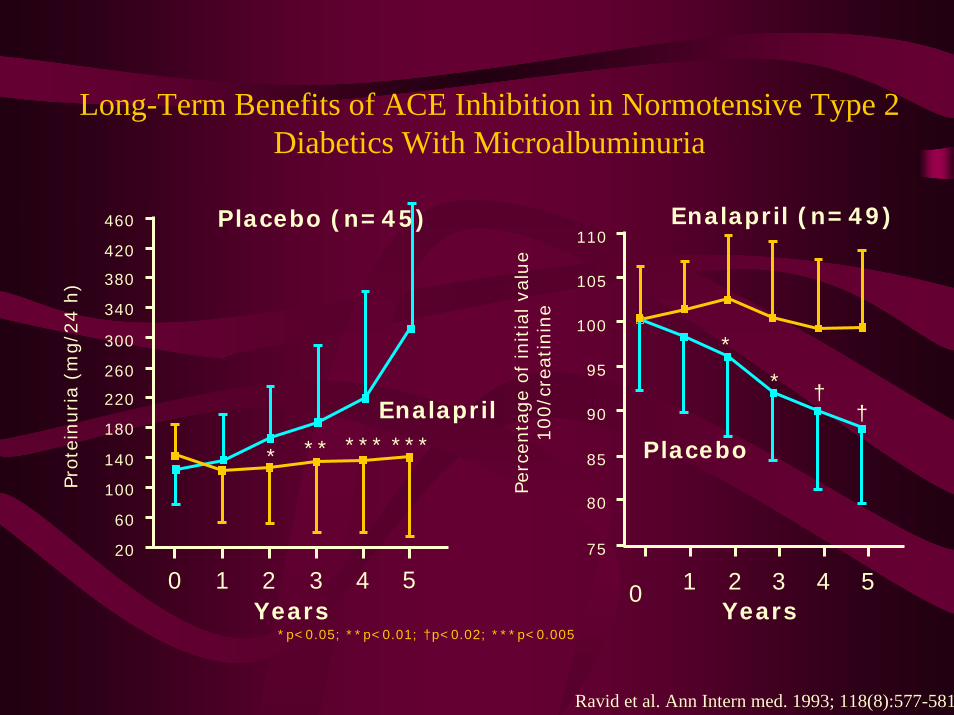
Long-Term Benefits of ACE Inhibition in Normotensive Type 2 Diabetics With Microalbuminuria
Years
Pro
tein
uria
(mg/2
4 h
)
460
420
380
340
300
260
220
180
140
100
60
20
0 1 2 3 4 5
Placebo (n=45)
Enalapril
Per
centa
ge
of
initia
l va
lue
100/c
reat
inin
e
Years0 1 2 3 4 5
75
Placebo
Enalapril (n=49)
* ** *** ***
*
* ††
*p<0.05; **p<0.01; †p<0.02; ***p<0.005
110
105
100
95
90
85
80
Ravid et al. Ann Intern med. 1993; 118(8):577-581

0
5
10
15
20
25
30
Irbesartan Amlodipine Placebo0
5
10
15
20
25
30
Losartan Placebo
Dou
blin
g of
seru
m c
reat
inin
e co
ncen
trat
ion
(% o
f pat
ient
s)
RENAAL IDNTp = 0.003 rr 20%
p < 0.001 rr 23%p = 0.006 rr 25%
ARBs Can Reduce Diabetic Renal Disease Progression
n = 1715; 2.6 years n = 1513; 3.45 yearsBrenner et al. N Engl J Med 2001;345:861–869; Lewis et al. N Engl J Med 2001;345:851–860

IRMA II Irbesartan vs Placebo Primary Endpoint at 2 Years
Progression toNephropathy
Total # of
Patients n %
Placebo 201 30 14.9 - - - -
UnadjustedRisk
Reduction
PValue†
Adjusted*Risk
Reduction
PValue†
300 mg Irbesartan 194 10 <0.001
19
5.2 70%
0.08
68%
44%
<0.001
150 mg Irbesartan 195 9.7 39% 0.05
† For irbesartan vs placebo (the significance level for the primary endpoint was
0.025)
*Hazard ratios were adjusted for baseline level of microalbuminuria and blood pressure achieved during the study Parving HH, et al. N Engl J Med. 2001;345(12):870-878.

IRMA II Change in Urinary Albumin Excretion*
-50
-40
-30
-20
-10
0
10
20
% c
han
ge i
n u
rin
ary
alb
um
in e
xcr
eti
on
0 3 6 12 18 22 24Months of Follow-up
150 mg of irbesartan
300 mg of irbesartan
Placebo
*P<0.001 for difference between both irbesartan groups and placebo
Parving HH, et al. N Engl J Med. 2001;345(12):870-878.

IRMA II Incidence of Progression to Diabetic Nephropathy
0
5
10
15
20
Inci
den
ce o
f D
iab
eti
c N
ep
hro
path
y (
%)
0 3 6 12 18 22 24
201 201 164 154 139
195 195 167 161 148
129
142
36
45
Placebo (n)Irbesartan 150 mg (n)Irbesartan 300 mg
Months of Follow-up
194 180 172 159 150 49194
Placebo 150 mg ofirbesartan
300 mg ofirbesartan
P<0.001 for difference between 300 mg irbesartan group and placebo
Parving HH, et al. N Engl J Med. 2001;345(12):870-878.
5.2%
9.7%
14.9%

Drug Choices in type 2 diabetics with early nephropathy
• Both an ARB and ACE inhibitor demonstrate similar benefit in reducing a decline in the GFR
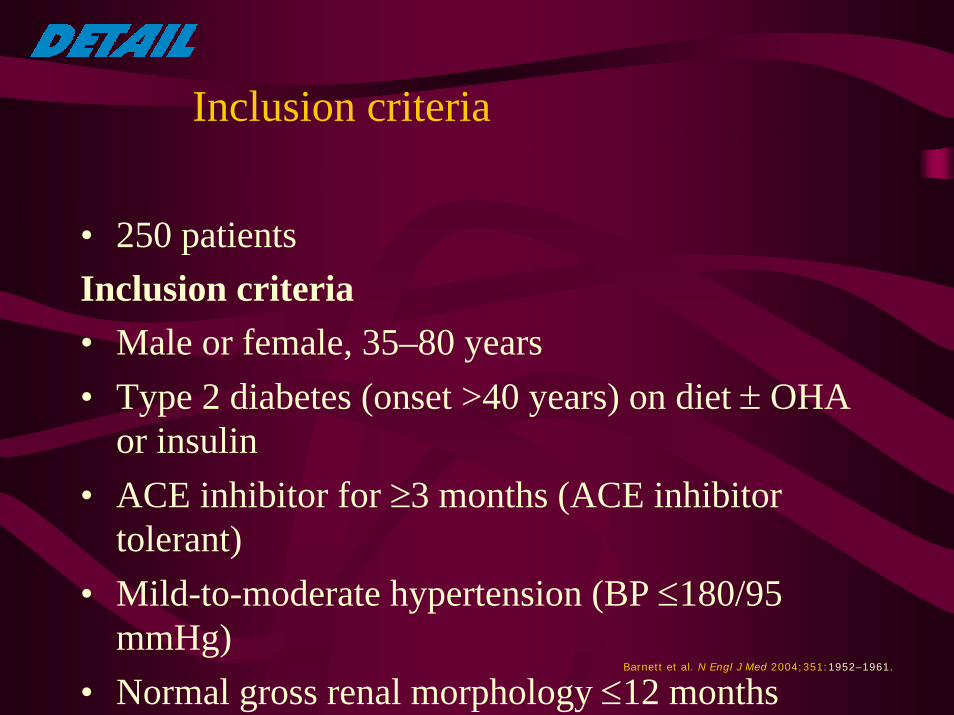
Inclusion criteria
• 250 patientsInclusion criteria• Male or female, 35–80 years• Type 2 diabetes (onset >40 years) on diet ± OHA
or insulin• ACE inhibitor for ≥3 months (ACE inhibitor
tolerant)• Mild-to-moderate hypertension (BP ≤180/95
mmHg)• Normal gross renal morphology ≤12 months
Barnett et al. N Engl J Med 2004;351:1952–1961.

Outcomes
Primary endpoint
• Change in GFR after 5 years
Secondary endpoints• Changes in GFR after 1, 2, 3 and 4 years• Changes in UAER and serum creatinine after 1, 2,
3, 4 and 5 years• Incidence of clinical events
– (end-stage renal disease, myocardial infarction,b l id i h f il )
Barnett et al. N Engl J Med 2004;351:1952–1961.

ARB vs ACE inhibitors in type 2 diabetes and incipient nephropathy
Total GFR
0102030405060708090
100
Telmisartan Enalapril
*All patients, LOCF; 250 patients; 5 years follow up†p = NS, telmisartan vs enalapril
p = NS†
-17.9-14.8
-25
-20
-15
-10
-5
0Telmisartan Enalapril
Change in GFR
p = NS†
Baseline After 5 years
ml/
min
/1.7
3m
2
ml/
min
/1.7
3m
2
Barnett et al. N Engl J Med 2004;351:1952–1961.

Drug choices in type 2 diabetics with overt nephropathy
• In type 2 diabetes with overt nephropathy, either an ACE inhibitor or an ARB may be used to retard the progression of renal disease.
Problems of use of ACE inhibitors
• Hyperkalaemia• Acute renal failure with underlying bilateral
renal artery stenosis

Slide SourceHypertensionOnline
www.hypertensiononline.org
125
140
155
170
Baseline 1 Month 5.6 Yrs Month offACE-I
+Clonidine
SB
P (
mm
Hg)
Impact of ACEImpact of ACE--I on BP and GFR:I on BP and GFR:Acute and Chronic EffectsAcute and Chronic Effects
60
65
70
75
80
85
90
Baseline 1 Month 5.6 Yrs Month offACE-I
+Clonidine
*P<0.05 compared to baseline
Bakris GL, Weir MR. Arch Intern Med. 2000;160(5):685-93.©American Medical Association
GFR
ml/
min
/1.7
3m
2
*
* *
*
*

Recommended Practices
• The serum creatinine and potassium should be checked within 4 weeks of initiation of treatment to detect any rise in the serum creatinine of hyperkalaemia

The effect of dietary protein restriction on the progression of diabetic and nondiabetic renal
diseases: a meta-analysis.
• Jan 1996 to Dec 1994• 5 studies IDDM; 5 studies non DM CRF• End points: Death and reduce GFR decline
FU (mths) Study Size ORIDDM 9 to 35 108 0.56 [0.44 -0.77]Non DM 18 to 36 1413 0.67 [0.50-0.89]
Pedrini MT et al; Ann Intern med 1996; 124: 627-32

Other measures: low protein diet
• Type 1 diabetics with overt nephropathy should be maintained on a low protein diet of 0.8gram / kg/ day of protein

Clinical Targets
• Therapy should aim to reduce albuminuriaas much as possible, and its is reasonable to aim for a urinary protein levels to less than 1 gram per day or at least 50% of the pre treatment value

Recommended nephrology consultation
• Decline in renal function• Difficulties in hyperkalaemia• Atypical features eg haematuria, casts, renal
bruits• Difficult blood pressure control• Heavy proteinuria (in excess of 3 gm/day)• Absence of retinopathy
Summary
Prevention
• Tight glucose control reduces the development of diabetic nephropathy

Prevention
• Blood pressure control reduces the development of microvascular disease in diabetics

Screening
• Screening for albuminuria should begin 5 years after the diagnosis of type 1 diabetes
• It should be done immediately after the diagnosis of type 2 diabetes.
• Screening for albuminuria should be done annually

Screening
• Serum creatinine should be done annually• and the GFR estimated
– Cockcroft – Gault equation (Age/weight/cr)– MDRD formula (Age, creatinine)

Blood Pressure Target
• The blood pressure target in all diabetics should be less than 130/80
• Diabetics with proteinuria in excess of 1 gram should attempt to achieve values of less than 125/75 mm Hg

Drug Choices in Type 1 diabetics with overt nephropathy
• In the presence of overt nephropathy in type 1 diabetes, there is evidence that an ACE inhbitor can retard the progression of otherwise progressive renal disease
Drug choices in type 2 diabetics with overt nephropathy
• In type 2 diabetes with overt nephropathy, either an ACE inhibitor or an ARB may be used to retard the progression of renal disease.

Other measures: low protein diet
• Type 1 diabetics with overt nephropathy should be maintained on a low protein diet of 0.8gram / kg/ day of protein

Clinical Targets
• Therapy should aim to reduce albuminuriaas much as possible, and its is reasonable to aim for a urinary protein levels to less than 1 gram per day or at least 50% of the pre treatment value

Recommended nephrology consultation
• Decline in renal function• Difficulties in hyperkalaemia• Atypical features eg haematuria, casts, renal
bruits• Difficult blood pressure control• Heavy proteinuria (in excess of 3 gm/day)• Absence of retinopathy