
Preventing Illegal Logging: Simultaneous Optimization …dkar/SecMAS2016/.../Sara_SecMAS.pdf ·...
7
Preventing Illegal Logging: Simultaneous Optimization of Resource Teams and Tactics for Security Sara Marie Mc Carthy University of Southern California [email protected] Milind Tambe University of Southern California [email protected] Christopher Kiekintveld University of Texas at El Paso [email protected] Meredith L. Gore Michigan State University [email protected] Alex Killion Michigan State University [email protected] ABSTRACT Green security – protection of forests, fish and wildlife – is a critical problem in environmental sustainability. We focus on the problem of optimizing the defense of forests against illegal logging, where often we are faced with the challenge of teaming up many different groups, from national police to forest guards to NGOs, each with differing capabilities and costs. This paper introduces a new, yet fundamental prob- lem: Simultaneous Optimization of Resource Teams and Tactics (SORT). SORT contrasts with most previous game- theoretic research for green security – in particular based on security games – that has solely focused on optimizing patrolling tactics, without consideration of team formation or coordination. We develop new models and scalable algo- rithms to apply SORT towards illegal logging in large forest areas. We evaluate our methods on a variety of synthetic examples, as well as a real-world case study using data from our on-going collaboration in Madagascar. 1 General Terms Algorithms, Security Keywords Game theory, Multi-Agent Systems 1. INTRODUCTION Illegal logging is a major problem for many developing countries. The economic and environmental impacts are se- vere, costing up to USD $30 billion annually and threatening ancient forests and critical habitats for wildlife [18]. As a re- sult, improving the protection of forests is of great concern for many countries [2, 17]. 1 This work has been previously published in AAAI-16 Appears in: Proceedings of the 15th International Confer- ence on Autonomous Agents and Multiagent Systems (AA- MAS 2016), John Thangarajah, Karl Tuyls, Stacy Marsella, Catholijn Jonker (eds.), May 9–13, 2016, Singapore. Copyright c 2016, International Foundation for Autonomous Agents and Multiagent Systems (www.ifaamas.org). All rights reserved. Unfortunately in developing countries, budgets for pro- tecting forests are often very limited, making it crucial to allocate these resources efficiently. We focus on deploying resources to interdict the traversal of illegal loggers on the network of roads and rivers around the forest area. However, we must first choose the right security team for interdiction; there are many different organizations that may be involved — from local volunteers, to police, to NGO personnel — each differing in their interdiction effectiveness (individual or jointly with others), and with varying costs of deploy- ment. This results in a very large number of resource teams and allocation strategies per team with varying effectiveness that could be deployed within a given budget. Our challenge is to simultaneously select the best team of security resources and the best allocation of these resources. Over the past decade, game-theoretic approaches, in par- ticular security games, have become a major computational paradigm for security resource allocation [16, 10]. The sub- area of security games relevant to this paper is at the inter- section of green security (i.e., protection of forests, fish and wildlife) [4, 9, 13], and network security games (NSG) (i.e., interdiction of adversaries on transportation networks) [7]. However, previous work in these areas suffer from two lim- itations relevant to our problem. First, they only consider the tactical allocation of a given team of resources, with- out considering the more strategic question of how to choose the right team. Indeed, the fact that the tactical question is already computationally challenging emphasizes the dif- ficulty of our problem, which requires evaluating the effec- tiveness of many teams to select the right one. Second, previous work has mostly failed to consider heterogeneous teams, with varying individual and joint effectiveness. To address these challenges we make the following key con- tributions. First, we introduce Simultaneous Optimization of Resource Teams and Tactics (SORT) as a new fundamen- tal research problem in security games that combines strate- gic and tactical decision making and provide a formal model of a SORT problem in an NSG. Second, at the strategic level, we introduce FORTIFY (Forming Optimal Response Teams for Forest safetY), a scalable algorithm for solving this problem. FORTIFY uses a hierarchical approach to ab- stract NSGs at varying levels of detail, providing bounds
Transcript of Preventing Illegal Logging: Simultaneous Optimization …dkar/SecMAS2016/.../Sara_SecMAS.pdf ·...
Preventing Illegal Logging:Simultaneous Optimization of Resource Teams and Tactics
for Security
Sara Marie Mc CarthyUniversity of Southern
Milind TambeUniversity of Southern
Christopher KiekintveldUniversity of Texas at El [email protected]
Meredith L. GoreMichigan State University
Alex KillionMichigan State University
ABSTRACTGreen security – protection of forests, fish and wildlife – isa critical problem in environmental sustainability. We focuson the problem of optimizing the defense of forests againstillegal logging, where often we are faced with the challengeof teaming up many different groups, from national police toforest guards to NGOs, each with differing capabilities andcosts. This paper introduces a new, yet fundamental prob-lem: Simultaneous Optimization of Resource Teams andTactics (SORT). SORT contrasts with most previous game-theoretic research for green security – in particular basedon security games – that has solely focused on optimizingpatrolling tactics, without consideration of team formationor coordination. We develop new models and scalable algo-rithms to apply SORT towards illegal logging in large forestareas. We evaluate our methods on a variety of syntheticexamples, as well as a real-world case study using data fromour on-going collaboration in Madagascar. 1
General TermsAlgorithms, Security
KeywordsGame theory, Multi-Agent Systems
1. INTRODUCTIONIllegal logging is a major problem for many developing
countries. The economic and environmental impacts are se-vere, costing up to USD $30 billion annually and threateningancient forests and critical habitats for wildlife [18]. As a re-sult, improving the protection of forests is of great concernfor many countries [2, 17].
1This work has been previously published in AAAI-16
Appears in: Proceedings of the 15th International Confer-ence on Autonomous Agents and Multiagent Systems (AA-MAS 2016), John Thangarajah, Karl Tuyls, Stacy Marsella,Catholijn Jonker (eds.), May 9–13, 2016, Singapore.Copyright c© 2016, International Foundation for Autonomous Agents andMultiagent Systems (www.ifaamas.org). All rights reserved.
Unfortunately in developing countries, budgets for pro-tecting forests are often very limited, making it crucial toallocate these resources efficiently. We focus on deployingresources to interdict the traversal of illegal loggers on thenetwork of roads and rivers around the forest area. However,we must first choose the right security team for interdiction;there are many different organizations that may be involved— from local volunteers, to police, to NGO personnel —each differing in their interdiction effectiveness (individualor jointly with others), and with varying costs of deploy-ment. This results in a very large number of resource teamsand allocation strategies per team with varying effectivenessthat could be deployed within a given budget. Our challengeis to simultaneously select the best team of security resourcesand the best allocation of these resources.
Over the past decade, game-theoretic approaches, in par-ticular security games, have become a major computationalparadigm for security resource allocation [16, 10]. The sub-area of security games relevant to this paper is at the inter-section of green security (i.e., protection of forests, fish andwildlife) [4, 9, 13], and network security games (NSG) (i.e.,interdiction of adversaries on transportation networks) [7].However, previous work in these areas suffer from two lim-itations relevant to our problem. First, they only considerthe tactical allocation of a given team of resources, with-out considering the more strategic question of how to choosethe right team. Indeed, the fact that the tactical questionis already computationally challenging emphasizes the dif-ficulty of our problem, which requires evaluating the effec-tiveness of many teams to select the right one. Second,previous work has mostly failed to consider heterogeneousteams, with varying individual and joint effectiveness.
To address these challenges we make the following key con-tributions. First, we introduce Simultaneous Optimizationof Resource Teams and Tactics (SORT) as a new fundamen-tal research problem in security games that combines strate-gic and tactical decision making and provide a formal modelof a SORT problem in an NSG. Second, at the strategiclevel, we introduce FORTIFY (Forming Optimal ResponseTeams for Forest safetY), a scalable algorithm for solvingthis problem. FORTIFY uses a hierarchical approach to ab-stract NSGs at varying levels of detail, providing bounds

on the value of different teams of resources to speed up thesearch for the optimal team. Third, at the tactical level,we generalize previous methods for optimizing tactical re-source allocation in network security games to account forheterogenous teams with varying capabilities. Lastly, wepresent experimental results on synthetic problems, as wellas problem instances obtained from joint work with NGOsengaged in forest protection in Madagascar.
2. MOTIVATING DOMAINAND GAME MODEL
Forests in Madagascar are under great threat, with valu-able hardwood trees such as rosewood and ebony being ille-gally harvested at an alarming rate. There is broad interestin improving forest protection via patrolling from differentgroups, e.g., NGOs, the Madagascar National Parks, localpolice and community volunteers. However, there is verylimited coordination among these groups. As a result thereis limited attention paid at the strategic level to optimize theselection of the right team of resources from among thesegroups, and the tactical level to optimally allocate the re-sulting team’s resources. Our model is designed to addressthese problems.
Figure 1: Illegal logging in progress in at risk area of Mada-gascar, images provided by our partnering NGOs working inthe area.
Model: We now describe our model for SORT. At thetactical level, the decision of how to optimally allocate ateam is a NSG problem. We model the physical space usinga graph G = (N,E), consisting of source nodes s ∈ S ⊂ N ,target nodes t ∈ T ⊂ N , and intermediate nodes. Theattacker (illegal loggers) acts by traversing a path from asource si to a target node ti. For illegal logging, the simay be attacker’s originating villages and ti may be areascontaining valuable trees. Each target node ti has a payoffvalue that is domain dependent. Based on the research ofcollaborating domain experts in Madagascar, these dependon the density of valuable trees in a particular area, and thedistance to the coast (for export) and local villages.
Previously models in NSGs assume a defender limited tohomogenous resources with no probability of failure, no jointeffectiveness and the ability to only cover a single edge [6,15]. This is insufficient to capture the complexities presentin the illegal logging domain, and so we present a new modelof the defender for green NSGs.
The defender conducts patrols in the network to inter-dict the attacker by placing resources on edges of the graph,as shown in Figure 2. The defender has K types of re-sources each of which can conduct a patrol along Lk con-
G(N,E) Graph representing security domainGc Compact Graph representing security domainτ(ti) Payoff of the ith target tiK Number of defender resource typesLk Number of edges covered by the kth
resource typebk Cost of the kth resource typePk Detection probability of resource type kB Total budget for the teammk Number of defender resources of type k
X = {Xi} Set of defender pure strategiesx = {xi} Defender’s mixed strategy over XA = {Aj} Set of attacker pure strategiesa = {aj} Attacker’s mixed strategy over AUd(Xi,a) Defender utility playing Xi against aUa(x, Aj) Attacker utility playing Aj against x
Table 1: Notation and Game Description
si ti
sj tj
sk tk
Figure 2: Pure strategies for the Defender (bold line) andAttacker (dashed line going from s to t).
nected edges. Multiple environmental factors can cause aresource to fail in detecting an attacker, such as limited vis-ibility or collusion with the adversaries. We model this usingan interdiction probability Pk for each resource type. Thedefender has a total budget B; each resource type has acost bk, and a team consists of mk resources of type k fork = 1 . . .K. Multiple resources placed on a single edge re-sults in a higher probability of detecting the attacker, whichmodels coordination among resources.
A defender pure strategy Xi is an allocation of all re-sources in a given team to a set of edges of the graph, sat-isfying the connectedness and length constraints for eachresource. An attacker pure strategy Aj is any path startingat a source node sj and ending at a target node tj . Figure 2shows three attacker pure strategies. Although these strate-gies take the shortest path from source to target, it is not arequirement in the game. The allocation of one resource ofsize Lk = 2 is shown, which intersects paths i and j. The at-tacker and defender can play mixed strategies a and x, i.e.,probability distributions over pure strategies. The probabil-ity of detecting an attacker on edge e if the defender followsa pure strategy Xi, allocating mk,e number of resources oftype k to edge e is given in Equation 1.
P (e,Xi) = 1−∏K
1(1− Pk)mk,e (1)
The total probability that a defender pure strategy Xi pro-tects against an attacker pure strategy Aj is given by theprobability intersection function in Equation 2, where wetake the product over all the edges in the attack path.
P (Xi, Aj) = 1−∏
e∈Aj(1− P (e,Xi)) (2)
The attacker obtains a payoff of τ(ti) if he is success-ful in reaching a target, and a payoff of zero he is caught.We assume a zero sum model, so the defender receives apenalty opposite of the attacker’s payoff. For this zero-sumgame, the optimal defender mixed strategy is the well-known
Algorithm 1: FORTIFY(B,R)1: Λ← getTeams(B,R), Λc = ∅,Λr = ∅,Λ∗ = ∅2: for each λ ∈ Λ:3: λ.value← Compact Layer(λ)4: Λc ← Λc ∪ {λ}5: repeat:6: λmax ← arg maxλ.value(Λ
c,Λr,Λ∗)7: if (λmax ∈ Λ∗) return λmax8: else: λ.value← NextLayer(λmax)9: ΛNextLayer ← ΛNextLayer ∪ {λmax}
minimax strategy. The game value is denoted F (λ), and isfunction of a team of resources λ selected from some set ofresources R. The strategic aspect of the SORT problem canbe formulated as the optimization problem in Equation 3,where the utility F (λ) is maximized subject to budgetaryconstraints.
maxλ⊂R
{F (λ) :
∑k∈λ
bk ≤ B
}(3)
Theorem 1 The SORT problem is NP-Hard even if we canevaluate F (λ) in constant time. The proof uses a reductionto knapsack. All absent proofs are located in the appendix.2
3. FORTIFY:THE HIERARCHICAL SEARCH
In NSGs F (λ) is computationally difficult to calculate,because it requires finding the optimal tactical allocation toassess the utility of a given team λ. Since there are exponen-tially many possible teams, the sequential approach of eval-uating F (λ) exactly for every team and picking the best oneis impractical. Instead, in our approach to SORT, we inte-grate the analysis of the strategic and tactical aspects of theproblem to search the space of teams much more efficiently.We use fast methods to quickly evaluate upper bounds onthe utilities for specific teams. Using these bounds we selectthe most promising team to evaluate in more detail, itera-tively tightening the bounds as the search progresses untilthe optimal team is identified.
FORTIFY uses a three layer hierarchical representationNSG to evaluate the performance of teams at different levelsof detail. Starting from the full representation of the game,each layer abstracts away additional details to approximatethe game value F (λ). We call the bottom later without anyabstraction the Optimal Layer, the Reduced Layer is in themiddle, and the Compact Layer is the most abstract.
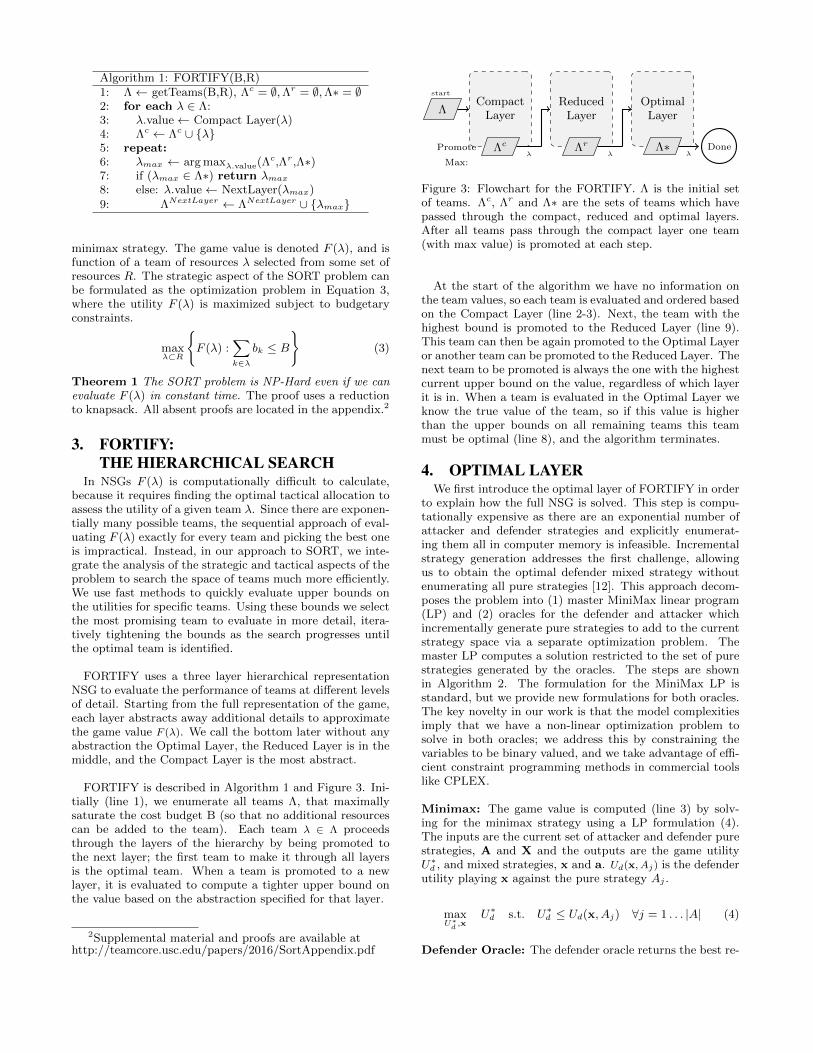
FORTIFY is described in Algorithm 1 and Figure 3. Ini-tially (line 1), we enumerate all teams Λ, that maximallysaturate the cost budget B (so that no additional resourcescan be added to the team). Each team λ ∈ Λ proceedsthrough the layers of the hierarchy by being promoted tothe next layer; the first team to make it through all layersis the optimal team. When a team is promoted to a newlayer, it is evaluated to compute a tighter upper bound onthe value based on the abstraction specified for that layer.
2Supplemental material and proofs are available athttp://teamcore.usc.edu/papers/2016/SortAppendix.pdf
ΛCompact
LayerReduced
LayerOptimal
Layer
Λc Λr Λ∗Promote
Max:
Done
start
λ λ λ
Figure 3: Flowchart for the FORTIFY. Λ is the initial setof teams. Λc, Λr and Λ∗ are the sets of teams which havepassed through the compact, reduced and optimal layers.After all teams pass through the compact layer one team(with max value) is promoted at each step.
At the start of the algorithm we have no information onthe team values, so each team is evaluated and ordered basedon the Compact Layer (line 2-3). Next, the team with thehighest bound is promoted to the Reduced Layer (line 9).This team can then be again promoted to the Optimal Layeror another team can be promoted to the Reduced Layer. Thenext team to be promoted is always the one with the highestcurrent upper bound on the value, regardless of which layerit is in. When a team is evaluated in the Optimal Layer weknow the true value of the team, so if this value is higherthan the upper bounds on all remaining teams this teammust be optimal (line 8), and the algorithm terminates.
4. OPTIMAL LAYERWe first introduce the optimal layer of FORTIFY in order
to explain how the full NSG is solved. This step is compu-tationally expensive as there are an exponential number ofattacker and defender strategies and explicitly enumerat-ing them all in computer memory is infeasible. Incrementalstrategy generation addresses the first challenge, allowingus to obtain the optimal defender mixed strategy withoutenumerating all pure strategies [12]. This approach decom-poses the problem into (1) master MiniMax linear program(LP) and (2) oracles for the defender and attacker whichincrementally generate pure strategies to add to the currentstrategy space via a separate optimization problem. Themaster LP computes a solution restricted to the set of purestrategies generated by the oracles. The steps are shownin Algorithm 2. The formulation for the MiniMax LP isstandard, but we provide new formulations for both oracles.The key novelty in our work is that the model complexitiesimply that we have a non-linear optimization problem tosolve in both oracles; we address this by constraining thevariables to be binary valued, and we take advantage of effi-cient constraint programming methods in commercial toolslike CPLEX.
Minimax: The game value is computed (line 3) by solv-ing for the minimax strategy using a LP formulation (4).The inputs are the current set of attacker and defender purestrategies, A and X and the outputs are the game utilityU∗d , and mixed strategies, x and a. Ud(x, Aj) is the defenderutility playing x against the pure strategy Aj .
maxU∗d,x
U∗d s.t. U∗d ≤ Ud(x, Aj) ∀j = 1 . . . |A| (4)
Defender Oracle: The defender oracle returns the best re-
sponse strategy Xi to add to the MiniMax LP. The objectiveis to maximize the utility expressed in Equation (5), givenan input distribution a over the current attacker strategiesA, where aj the probability of attacker taking path Aj .
Ud(Xi,a) = −∑
jaj(1− P (Xi, Aj))τ(tj) (5)
A pure strategy implies a single allocation of the given team’sresources. Resources are allocated by setting the binary de-cision variables λkm,e ∈ {0, 1} which corresponds to the mth
resource of type k being allocated to edge e. Our contri-butions formalize the constraints needed to accommodatearbitrary path coverage as well as failure probability. Pathconstraints are enforced with
∑eλkm,e = Lk and in Equa-
tions (6-7). Equation (6) ensures every allocated edge isconnected to at least one other edge. Since the number ofnodes in any path of length Lk should be Lk + 1, Equation(7) counts the number of nodes which are either a source ortarget of allocated edges, making sure not to double countnodes which belong to multiple edges. λkn,m ∈ {0, 1} andequals 1 if a node n is the source or target of any allocatededge λke,m = 1.
λkm,e ≤∑
e1∈in(ns)
λkm,e1 +∑
e2∈out(nt)
λkm,e2ns←source(e)nt←target(e) if Lk ≥ 1 (6)
λkm,e ≤ λkm,n s.t. n← source(e)∨ target(e)
∑n
λkm,n = Lk + 1 (7)
Attacker Oracle: The attacker oracle computes a best re-sponse strategy Aj which maximizes his utility (Equation8), playing against the defender mixed strategy x. An op-timization problem in the form of (8-9) is solved for eachtarget tj ; the best path for each target is computed and thetarget with the highest utility is chosen. The decision vari-ables γe ∈ {0, 1} are binary and correspond to edges e ∈ Aj .
Ua(x, Aj) =∑i
xi(1− P (Xi, Aj))τ(tj) (8)
∑e∈out(s)
γe = 1;∑
e∈in(t∗)
γe = 1;∑
e∈in(n)
γe =∑
e∈out(n)
γen 6=sourcen 6=target (9)
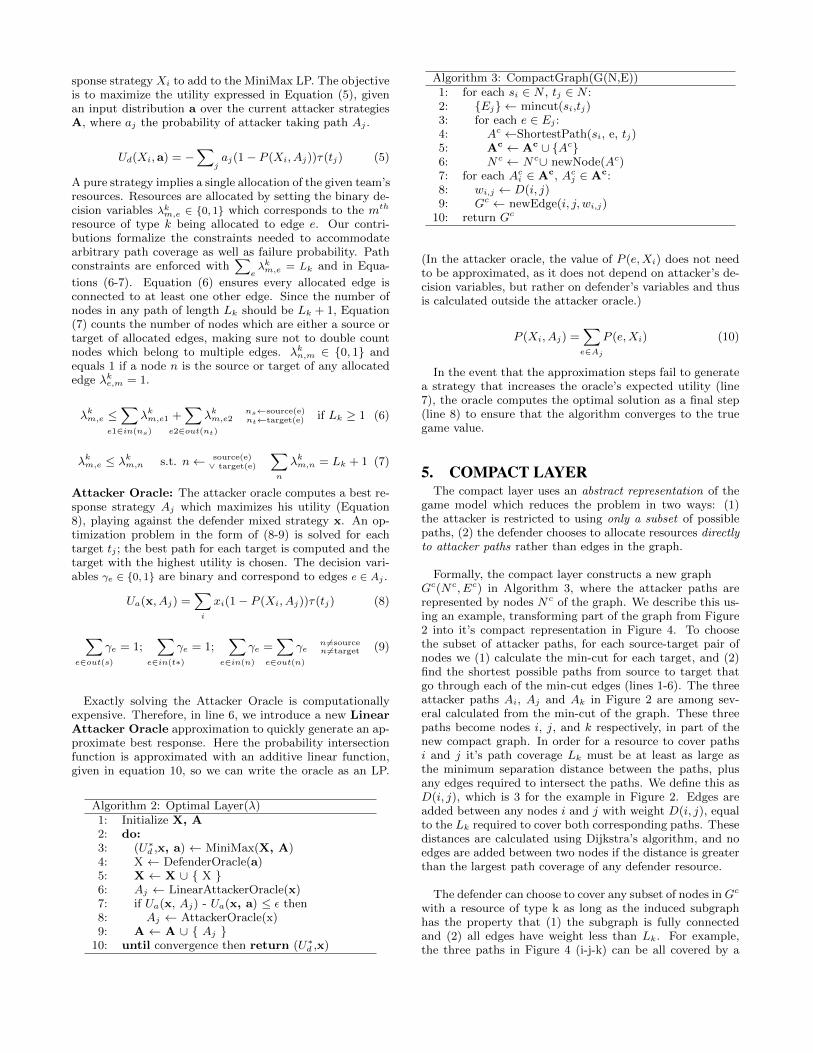
Exactly solving the Attacker Oracle is computationallyexpensive. Therefore, in line 6, we introduce a new LinearAttacker Oracle approximation to quickly generate an ap-proximate best response. Here the probability intersectionfunction is approximated with an additive linear function,given in equation 10, so we can write the oracle as an LP.
Algorithm 2: Optimal Layer(λ)1: Initialize X, A2: do:3: (U∗d ,x, a) ← MiniMax(X, A)4: X ← DefenderOracle(a)5: X ← X ∪ { X }6: Aj ← LinearAttackerOracle(x)7: if Ua(x, Aj) - Ua(x, a) ≤ ε then8: Aj ← AttackerOracle(x)9: A ← A ∪ { Aj }
10: until convergence then return (U∗d ,x)
Algorithm 3: CompactGraph(G(N,E))1: for each si ∈ N , tj ∈ N :2: {Ej} ← mincut(si,tj)3: for each e ∈ Ej :4: Ac ←ShortestPath(si, e, tj)5: Ac ← Ac ∪ {Ac}6: Nc ← Nc∪ newNode(Ac)7: for each Aci ∈ Ac, Acj ∈ Ac:8: wi,j ← D(i, j)9: Gc ← newEdge(i, j, wi,j)
10: return Gc
(In the attacker oracle, the value of P (e,Xi) does not needto be approximated, as it does not depend on attacker’s de-cision variables, but rather on defender’s variables and thusis calculated outside the attacker oracle.)
P (Xi, Aj) =∑e∈Aj
P (e,Xi) (10)
In the event that the approximation steps fail to generatea strategy that increases the oracle’s expected utility (line7), the oracle computes the optimal solution as a final step(line 8) to ensure that the algorithm converges to the truegame value.
5. COMPACT LAYERThe compact layer uses an abstract representation of the
game model which reduces the problem in two ways: (1)the attacker is restricted to using only a subset of possiblepaths, (2) the defender chooses to allocate resources directlyto attacker paths rather than edges in the graph.
Formally, the compact layer constructs a new graphGc(Nc, Ec) in Algorithm 3, where the attacker paths arerepresented by nodes Nc of the graph. We describe this us-ing an example, transforming part of the graph from Figure2 into it’s compact representation in Figure 4. To choosethe subset of attacker paths, for each source-target pair ofnodes we (1) calculate the min-cut for each target, and (2)find the shortest possible paths from source to target thatgo through each of the min-cut edges (lines 1-6). The threeattacker paths Ai, Aj and Ak in Figure 2 are among sev-eral calculated from the min-cut of the graph. These threepaths become nodes i, j, and k respectively, in part of thenew compact graph. In order for a resource to cover pathsi and j it’s path coverage Lk must be at least as large asthe minimum separation distance between the paths, plusany edges required to intersect the paths. We define this asD(i, j), which is 3 for the example in Figure 2. Edges areadded between any nodes i and j with weight D(i, j), equalto the Lk required to cover both corresponding paths. Thesedistances are calculated using Dijkstra’s algorithm, and noedges are added between two nodes if the distance is greaterthan the largest path coverage of any defender resource.
The defender can choose to cover any subset of nodes inGc
with a resource of type k as long as the induced subgraphhas the property that (1) the subgraph is fully connectedand (2) all edges have weight less than Lk. For example,the three paths in Figure 4 (i-j-k) can be all covered by a

Algorithm 4: Compact Layer1: Gc ← CompactGraph(G(N,E))2: Initialize mixed strategy a ← Uniform(Ac)3: do:4: Xc
i ← CompactDefenderOracle(a)5: Xc ← Xc ∪ {Xc
i }6: (x, a) ← MiniMax(Xc,Ac)7: until convergence Ud(X
ci , a) - Ud(x, a) ≤ ε
8: return Ud(x, a)
resource of size 4. If the defender has a resource of size 3,she can only cover paths (i-j) or (j-k).
The compact layer solves this abstract representation ofthe game for a single team. The problem is decomposed intomaster MiniMax and a single Defender Oracle. There is nooracle for the attacker, as the attacker’s strategy space isenumerated using the compact graph and fixed at the startof the algorithm. The game value is calculated using Algo-rithm 4. The compact graph and subset of attacker pathsare first generated (line 1). The attacker’s mixed strategy isinitialized with a uniform distribution (line 2). The compactdefender oracle continuously adds strategies to the masterLP until the defender’s value cannot be improved. Conver-gence occurs when the oracle can no longer find a strategyto add that will improve the defender’s utility (line 7).
Compact Defender Oracle The same objective function(Equation 5) is maximized, however the constraints are mod-ified to reflect the compact game representation. P (Xi, Aj)
is linearly approximated by Equation 11 and is capped at 1.Here, we want to conservatively over-estimate the defender’sinterdiction probability to ensure that the compact layer re-turns an upper bound. Therefore, when a defender resourcecovers a node in Gc, we assume that the corresponding at-tacker path is interdicted by the entire entire patrol of lengthLk of that resource. The probability of catching the attackeron the compact graph is set to (1− (1−Pk)Lk ).The defenderchooses to allocate the mth resource of type k to a node njcorresponding to attacker path Aj by setting the decisionvariables ηkj,m ∈ {0, 1}.
P (Xi, Aj) =∑
P ckηkj,m D(i, j)ηki,mη
kj,m ≤ Lk (11)
Lemma 1 Playing against the same attacker strategy, theOptimal Defender Oracle’s strategy space is a subset of theCompact Defender Oracle strategy space.
Lemma 2 If the Compact Oracle strategy space containsthe full strategy space of the DefenderOracle, then the gamevalue of the Compact Layer will always upper bound the truegame value.
6. REDUCED LAYER
Figure 4:Compact Graph
i j k3
4
3
The Reduced Layer uses the same restricted strategy spacefor the attacker as the Compact Layer. However, the de-fender uses the original, unrestricted strategy space to al-locate resources. While the reduced layer is more difficultto solve than the compact layer, it allows us to iterativelytighten the upper bounds and avoid more computation inthe Optimal Layer. The evaluation of teams in this layerfollows Algorithm 5. We additionally reduce the computa-tion effort spent in this layer by warm starting the attacker’smixed strategy with the solution from the compact layer.
7. EVALUATIONWe present four sets of experimental results: (1) We eval-
uate the scalability and runtime performance of FORTIFYon several classes of random graphs. We benchmark witha sequential search which sequentially evaluates enumeratedteams with cost saturating the budget. (2) We also evaluatethe impact of the initial compact layer on the runtime bycomparing the runtimes of FORTIFY with and without thecompact layer. (3) We investigate the benefit of optimizingteam composition as well as the diversity of optimal teamsand (4) we demonstrate that FORTIFY can scale up to thereal world by testing performance on a case study of Mada-gascar using real graph data. All values are averaged over20 trials. The experiments were run on a Linux cluster withHP-SL250, 2.4 GHz, dual-processor machines. We use thefollowing graphs:
(1) Grid graphs Labeled Gw,h,s,t consist of a grid withwidth w, height h, sources s, targets t and nearest neighborconnections between nodes. We define start and end pointsfor the attacker, with sources located at one end and targetsat another.
(2) Geometric graphs provide a good approximation ofreal road networks [3] allowing us to model the networks ofvillages and rivers in forest regions. n nodes are distributedrandomly in a plane and are connected based on their dis-tance which determines the density d of the graph. We labelthem Rn,s,t,d.
7.1 ScalabilityWe first evaluate the performance of FORTIFY using two
sets of resource types, and target values of 50. Each setcontains 4 resource types, with varying costs of b={5, 6, 7, 8}.The first set of resource types Λ1 have varied path cover-ages L1={1, 2, 3, 4} and constant detection probability P 1 =
{1, 1, 1, 1} while the second set Λ2 has constant path cov-erage L2={2, 2, 2, 2} and varied detection probabilities P 2=
{0.5, 0.6, 0.7, 0.8}. Experiments that did not terminate in 3hrs were cutoff and are shown as missing bars. Figure 5 showthe runtimes for our algorithms run on both graph types for
Algorithm 5: ReducedLayer2: Initialize mixed strategy a ← CompactLayer(Ac)3: do:4: Xc
i ← DefenderOracle(a)5: Xc ← Xc ∪ {Xc
i }6: (x, a) ← MiniMax(Xc,Ac)7: until convergence Ud(X
ci , a) - Ud(x, a) ≤ ε
8: return Ud(x, a)
FORTIFY FORTIFY-NoCompact Sequential
10 15 20 25
102
103
104
Budget
Ru
nti
me(
s)
a)15 20 25 30 35
102
103
Budget
Ru
nti
me(
s)
c)
15 20 25 30
102
103
104
Budget
Ru
nti
me(
s)
b)10 15 20 25 30
102
103
Budget
Ru
nti
me(
s)
d)
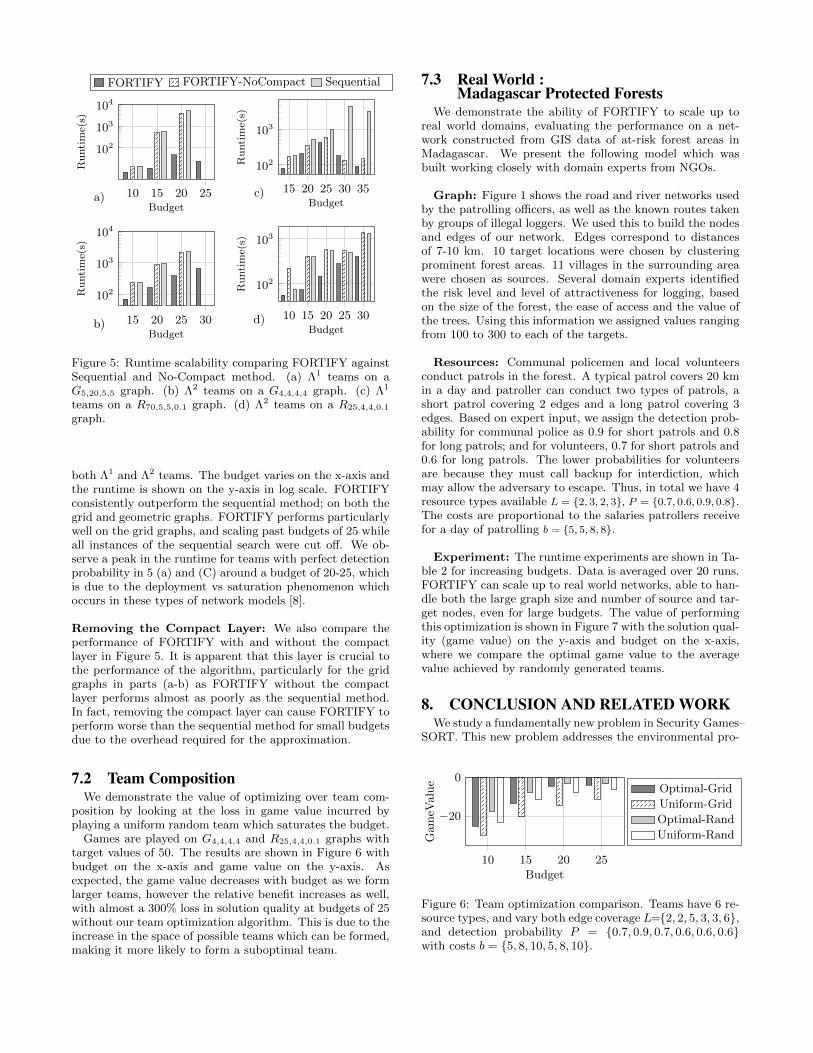
Figure 5: Runtime scalability comparing FORTIFY againstSequential and No-Compact method. (a) Λ1 teams on aG5,20,5,5 graph. (b) Λ2 teams on a G4,4,4,4 graph. (c) Λ1
teams on a R70,5,5,0.1 graph. (d) Λ2 teams on a R25,4,4,0.1
graph.
both Λ1 and Λ2 teams. The budget varies on the x-axis andthe runtime is shown on the y-axis in log scale. FORTIFYconsistently outperform the sequential method; on both thegrid and geometric graphs. FORTIFY performs particularlywell on the grid graphs, and scaling past budgets of 25 whileall instances of the sequential search were cut off. We ob-serve a peak in the runtime for teams with perfect detectionprobability in 5 (a) and (C) around a budget of 20-25, whichis due to the deployment vs saturation phenomenon whichoccurs in these types of network models [8].
Removing the Compact Layer: We also compare theperformance of FORTIFY with and without the compactlayer in Figure 5. It is apparent that this layer is crucial tothe performance of the algorithm, particularly for the gridgraphs in parts (a-b) as FORTIFY without the compactlayer performs almost as poorly as the sequential method.In fact, removing the compact layer can cause FORTIFY toperform worse than the sequential method for small budgetsdue to the overhead required for the approximation.
7.2 Team CompositionWe demonstrate the value of optimizing over team com-
position by looking at the loss in game value incurred byplaying a uniform random team which saturates the budget.
Games are played on G4,4,4,4 and R25,4,4,0.1 graphs withtarget values of 50. The results are shown in Figure 6 withbudget on the x-axis and game value on the y-axis. Asexpected, the game value decreases with budget as we formlarger teams, however the relative benefit increases as well,with almost a 300% loss in solution quality at budgets of 25without our team optimization algorithm. This is due to theincrease in the space of possible teams which can be formed,making it more likely to form a suboptimal team.
7.3 Real World :Madagascar Protected Forests
We demonstrate the ability of FORTIFY to scale up toreal world domains, evaluating the performance on a net-work constructed from GIS data of at-risk forest areas inMadagascar. We present the following model which wasbuilt working closely with domain experts from NGOs.
Graph: Figure 1 shows the road and river networks usedby the patrolling officers, as well as the known routes takenby groups of illegal loggers. We used this to build the nodesand edges of our network. Edges correspond to distancesof 7-10 km. 10 target locations were chosen by clusteringprominent forest areas. 11 villages in the surrounding areawere chosen as sources. Several domain experts identifiedthe risk level and level of attractiveness for logging, basedon the size of the forest, the ease of access and the value ofthe trees. Using this information we assigned values rangingfrom 100 to 300 to each of the targets.
Resources: Communal policemen and local volunteersconduct patrols in the forest. A typical patrol covers 20 kmin a day and patroller can conduct two types of patrols, ashort patrol covering 2 edges and a long patrol covering 3edges. Based on expert input, we assign the detection prob-ability for communal police as 0.9 for short patrols and 0.8for long patrols; and for volunteers, 0.7 for short patrols and0.6 for long patrols. The lower probabilities for volunteersare because they must call backup for interdiction, whichmay allow the adversary to escape. Thus, in total we have 4resource types available L = {2, 3, 2, 3}, P = {0.7, 0.6, 0.9, 0.8}.The costs are proportional to the salaries patrollers receivefor a day of patrolling b = {5, 5, 8, 8}.
Experiment: The runtime experiments are shown in Ta-ble 2 for increasing budgets. Data is averaged over 20 runs.FORTIFY can scale up to real world networks, able to han-dle both the large graph size and number of source and tar-get nodes, even for large budgets. The value of performingthis optimization is shown in Figure 7 with the solution qual-ity (game value) on the y-axis and budget on the x-axis,where we compare the optimal game value to the averagevalue achieved by randomly generated teams.
8. CONCLUSION AND RELATED WORKWe study a fundamentally new problem in Security Games–
SORT. This new problem addresses the environmental pro-
10 15 20 25
0
−20
Budget
Gam
eValu
e Optimal-Grid
Uniform-Grid
Optimal-Rand
Uniform-Rand
Figure 6: Team optimization comparison. Teams have 6 re-source types, and vary both edge coverage L={2, 2, 5, 3, 3, 6},and detection probability P = {0.7, 0.9, 0.7, 0.6, 0.6, 0.6}with costs b = {5, 8, 10, 5, 8, 10}.

B Runtime(s) GV10 203 -26615 388 -25620 653 -23925 1308 -23030 1742 -22035 2504 -21640 3675 -204
Table 2: Runtime onMadagascar Graph
10 20 30 40
−200
−250
−300
BudgetG
am
eValu
e
Optimized Random
Figure 7: Team optimiza-tion on Madagascar Graph
tection challenge of optimal investment and deployment ofsecurity resource teams. We use the rising threat of ille-gal logging in Madagascar as a motivating domain wherewe must work with a limited budget to coordinate and de-ploy such teams. To address this problem, we develop FOR-TIFY, a scalable solution addressing both aspects of theSORT problem, with the ability to both model and solvereal world problem instances. FORTIFY provides a valu-able tool for environmental protection agencies.
We have already discussed the shortcomings of relatedwork in security games earlier. In addition, there is sig-nificant research in team formation in multiagent systems,e.g., in network configuration [5], board gameplay [14] fan-tasy football [11] and multi-objective coalition [1]). How-ever, that work fails to security resource allocation at thetactical level.
9. ACKNOWLEDGEMENTSWe would like to thank Dr. Jonah Ratsimbazafy. This
research was supported by MURI Grant W911NF-11-1-0332.
REFERENCES[1] J.-H. Cho, I.-R. Chen, Y. Wang, K. S. Chan, and
A. Swami. Multi-objective optimization fortrustworthy tactical networks: A survey and insights.Technical report, DTIC Document, 2013.
[2] N. Dhital, R. R. Vololomboahangy, and D. P. Khasa.Issues and challenges of forest governance inmadagascar. Canadian Journal of DevelopmentStudies / Revue canadienne d’Al’tudes du
dAl’veloppement, 36(1):38–56, 2015.
[3] D. Eppstein and M. T. Goodrich. Studying(non-planar) road networks through an algorithmiclens. In Proceedings of the 16th ACM SIGSPATIALinternational conference on Advances in geographicinformation systems, page 16. ACM, 2008.
[4] F. Fang, P. Stone, and M. Tambe. When securitygames go green: Designing defender strategies toprevent poaching and illegal fishing. In InternationalJoint Conference on Artificial Intelligence (IJCAI),2015.
[5] M. E. Gaston and M. desJardins. Agent-organizednetworks for dynamic team formation. In AAMAS,pages 230–237. ACM, 2005.
[6] M. Jain, V. Conitzer, and M. Tambe. Security
scheduling for real-world networks. In AAMAS, pages215–222, 2013.
[7] M. Jain, D. Korzhyk, O. Vanek, V. Conitzer,M. Pechoucek, and M. Tambe. A double oraclealgorithm for zero-sum security games on graphs. InAAMAS, pages 327–334, 2011.
[8] M. Jain, K. Leyton-Brown, and M. Tambe. Thedeployment-to-saturation ratio in security games. InConference on Artificial Intelligence (AAAI), 2012.
[9] M. P. Johnson, F. Fang, , and M. Tambe. Patrolstrategies to maximize pristine forest area. InConference on Artificial Intelligence (AAAI), 2012.
[10] D. Korzhyk, V. Conitzer, and R. Parr. Complexity ofcomputing optimal stackelberg strategies in securityresource allocation games. In AAAI, 2010.
[11] T. Matthews, S. D. Ramchurn, and G. Chalkiadakis.Competing with humans at Fantasy Football: Teamformation in large partially-observable domains. InProceedings of the 26th Conference of the Associationsfor the Advancement for Artificial Intelligence, pages1394–1400, 2012.
[12] H. B. McMahan, G. J. Gordon, and A. Blum.Planning in the presence of cost functions controlledby an adversary. In In Proceedings of the TwentiethInternational Conference on Machine Learning, 2003.
[13] T. H. Nguyen, F. M. D. Fave, D. Kar, A. S.Lakshminarayanan, A. Yadav, M. Tambe, N. Agmon,A. J. Plumptre, M. Driciru, F. Wanyama, andA. Rwetsiba. Making the most of our regrets:Regret-based solutions to handle payoff uncertaintyand elicitation in green security games. In Conferenceon Decision and Game Theory for Security, 2015.
[14] T. Obata, T. Sugiyama, K. Hoki, and T. Ito.Consultation algorithm for Computer Shogi: Movedecisions by majority. In Computer and Games’10,volume 6515 of Lecture Notes in Computer Science,pages 156–165. Springer, 2011.
[15] S. Okamoto, N. Hazon, and K. Sycara. Solvingnon-zero sum multiagent network flow security gameswith attack costs. In AAMAS, pages 879–888, 2012.
[16] M. Tambe. Security and Game Theory: Algorithms,Deployed Systems, Lessons Learned. CambridgeUniversity Press, 2011.
[17] C. D. G. G. V. N. P. Thomas F. Allnutt, GregoryP. Asner. Mapping recent deforestation and forestdisturbance in northeastern madagascar. TropicalConservation Science, 6(1):1–15, 2013.
[18] WWF. http://wwf.panda.org/about our earth/deforestation/deforestation causes/illegal logging.2015.