prev.dailyherald.comprev.dailyherald.com/pdf/statebudget2009.pdfThe Government Finance Officers...
482
State of Illinois Pat Quinn, Governor
Transcript of prev.dailyherald.comprev.dailyherald.com/pdf/statebudget2009.pdfThe Government Finance Officers...
State of IllinoisPat Quinn, Governor
Printed by the Authority of the State of IllinoisIOCI 384-09 800 2/09
Printed on Recycled Content

ILLINOIS STATE BUDGET
Governor Pat Quinn
Fiscal Year 2010July 1, 2009 – June 30, 2010
www.state.il.us/budget
Printed/Created by Authority of the State of Illinois


The Government Finance Officers Association of the United States and Canada (GFOA) presented a Distinguished Budget Presentation Award to the State of Illinois, for its annual budget for the fiscal year beginning July 1, 2008 (fiscal year 2009). According to GFOA, this award “reflects the highest form of recognition in governmental budgeting.” In order to receive this award, a governmental unit must satisfy nationally recognized guidelines for effective budget presentation. These guidelines are designed to assess how well the entity’s budget serves as a policy document, as an operations guide, as a financial plan, and as a communications device. The Government Finance Officers Association’s Distinguished Budget Presentation Awards Program, established in 1984, recognizes exemplary budget documentation by state, provincial and local governments, as well as public universities and colleges. Entities participating in the program submit copies of their operating budgets for review. Each budget document is evaluated using a comprehensive evaluation checklist and those judged proficient receive the award. We are very pleased to have received this national recognition. We believe our current budget continues to conform to program requirements, and we are submitting it to GFOA to determine its eligibility for another award.

Table of Contents
Chapter-Page The Governor’s Letter of Transmittal READER’S GUIDE.................................................................................................................................... Chapter 1 Budget Documents.............................................................................................................................. 1-1 Budget Document Organization .......................................................................................................... 1-1 State of Illinois Organization Chart...................................................................................................... 1-2 Basis of Accounting............................................................................................................................. 1-3 Guide to Understanding Agency Budget Submissions ....................................................................... 1-3 Agency Budget Tables ........................................................................................................................ 1-4 Description of Funds ........................................................................................................................... 1-8 BUDGET SUMMARY ................................................................................................................................ Chapter 2 Fiscal Overview ................................................................................................................................... 2-1 Summary Tables I-A Operating Appropriations by Agency – All Funds ................................................................... 2-21 I-B Supplementals to Complete Fiscal Year 2007........................................................................ 2-31 II-A Revenues by Source – All Appropriated Funds..................................................................... 2-32 II-B Revenues by Source – General Funds.................................................................................. 2-33 II-C Budgeted Funds Revenues – Generally Accepted Accounting Principles (GAAP) Basis .... 2-34 II-D Budgeted Funds Expenditures – Generally Accepted Accounting Principles (GAAP) Basis 2-34 III-A Road Fund............................................................................................................................. 2-35 III-B Motor Fuel Tax – State Funds............................................................................................... 2-36 IV-A Appropriated Operating Funds by Fund Group for Fiscal Year 2008................................... 2-37 IV-B Appropriated Operating Funds by Fund for Fiscal Year 2008.............................................. 2-38 SHARED SERVICES ............................................................................................................................... Chapter 3
PUBLIC RETIREMENT SYSTEMS........................................................................................................... Chapter 4
ECONOMIC OUTLOOK AND REVENUE FORECAST............................................................................ Chapter 5
EDUCATION.............................................................................................................................................. Chapter 6 Elementary and Secondary Education Illinois State Board of Education................................................................................................... 6-1 Teachers’ Retirement System ...................................................................................................... 6-9 Higher Education................................................................................................................................. 6-10 Illinois Board of Higher Education................................................................................................. 6-16 Public Universities Chicago State University ........................................................................................................ 6-18 Eastern Illinois University ....................................................................................................... 6-20 Governors State University .................................................................................................... 6-22 Illinois State University ........................................................................................................... 6-24 Northeastern Illinois University............................................................................................... 6-26 Northern Illinois University...................................................................................................... 6-28 Southern Illinois University ..................................................................................................... 6-30 University of Illinois................................................................................................................. 6-32 Western Illinois University ...................................................................................................... 6-35 Illinois Community College Board................................................................................................. 6-37 Illinois Student Assistance Commission ....................................................................................... 6-39 Illinois Mathematics and Science Academy ................................................................................. 6-41 State Universities Civil Service System........................................................................................ 6-43 State Universities Retirement System .......................................................................................... 6-42 HUMAN SERVICES .................................................................................................................................. Chapter 7 Aging, Department on ......................................................................................................................... 7-1 Children and Family Services, Department of..................................................................................... 7-6 Comprehensive Health Insurance Plan............................................................................................... 7-12 Healthcare and Family Services, Department of ................................................................................ 7-14

Table of Contents
HUMAN SERVICES (continued) Human Services, Department of ......................................................................................................... 7-21 Illinois Deaf and Hard of Hearing Commission ................................................................................... 7-36 Illinois Council on Developmental Disabilities..................................................................................... 7-38 Illinois Guardianship and Advocacy Commission ............................................................................... 7-41 Illinois Violence Prevention Authority .................................................................................................. 7-44 Juvenile Justice, Department of .......................................................................................................... 7-47 Public Health, Department of .............................................................................................................. 7-51 Veterans’ Affairs, Department of ......................................................................................................... 7-63 PUBLIC SAFETY ...................................................................................................................................... Chapter 8 Corrections, Department of ................................................................................................................. 8-1 Illinois Criminal Justice Information Authority...................................................................................... 8-6 Illinois Emergency Management Agency ............................................................................................ 8-11 Law Enforcement Training Standards Board ...................................................................................... 8-18 Military Affairs, Department of ............................................................................................................. 8-21 Prisoner Review Board........................................................................................................................ 8-25 State Fire Marshal, Office of the.......................................................................................................... 8-28 State Police, Department of ................................................................................................................ 8-32 State Police Merit Board...................................................................................................................... 8-38 ENVIRONMENT AND BUSINESS REGULATIONS................................................................................. Chapter 9 Drycleaner Environmental Response Trust Fund Council .................................................................. 9-1 Environmental Protection Agency ....................................................................................................... 9-3 Financial and Professional Regulation, Department of....................................................................... 9-10 Human Rights, Department of............................................................................................................. 9-15 Human Rights Commission................................................................................................................. 9-18 Illinois Commerce Commission........................................................................................................... 9-20 Illinois Workers’ Compensation Commission...................................................................................... 9-23 Insurance, Department of.................................................................................................................... 9-26 Natural Resources, Department of...................................................................................................... 9-29 ECONOMIC DEVELOPMENT AND INFRASTRUCTURE ....................................................................... Chapter 10 Agriculture, Department of .................................................................................................................. 10-1 Commerce and Economic Opportunity, Department of ...................................................................... 10-9 Illinois Power Agency .......................................................................................................................... 10-19 East St. Louis Financial Advisory Authority......................................................................................... 10-21 Employment Security, Department of ................................................................................................. 10-22 Illinois Arts Council .............................................................................................................................. 10-27 Illinois Finance Authority ..................................................................................................................... 10-31 Illinois Medical District Commission .................................................................................................... 10-32 Illinois Sports Facilities Authority......................................................................................................... 10-33 Labor, Department of .......................................................................................................................... 10-34 Metropolitan Pier and Exposition Authority ......................................................................................... 10-38 Southwestern Illinois Development Authority...................................................................................... 10-39 Transportation, Department of ............................................................................................................ 10-40 Illinois State Toll Highway Authority .................................................................................................... 10-49 Upper Illinois River Valley Development Authority.............................................................................. 10-52 GOVERNMENT SERVICES...................................................................................................................... Chapter 11 Elected Officials: Governor, Office of the .............................................................................................................. 11-1 Lieutenant Governor, Office of the................................................................................................ 11-3 Attorney General, Office of the ..................................................................................................... 11-5 Secretary of State, Office of the.................................................................................................... 11-8 State Comptroller, Office of the .................................................................................................... 11-14 State Officers’ Salaries........................................................................................................... 11-17

Table of Contents
GOVERNMENT SERVICES (continued) State Treasurer, Office of the ....................................................................................................... 11-21 Judicial Agencies: Judges’ Retirement System.......................................................................................................... 11-24 Judicial Inquiry Board ................................................................................................................... 11-25 State Appellate Defender, Office of the ........................................................................................ 11-26 State’s Attorneys Appellate Prosecutor, Office of the................................................................... 11-29 Supreme Court & Illinois Court System ........................................................................................ 11-32 Supreme Court Historical Preservation Commission ................................................................... 11-35 General Assembly and Legislative Agencies: Auditor General, Office of the ....................................................................................................... 11-36 General Assembly......................................................................................................................... 11-38 General Assembly Retirement System......................................................................................... 11-40 Government Forecasting and Accountability, Commission on..................................................... 11-41 Joint Committee on Administrative Rules..................................................................................... 11-41 Legislative Audit Commission....................................................................................................... 11-41 Legislative Ethics Commission ..................................................................................................... 11-42 Legislative Information System..................................................................................................... 11-42 Legislative Printing Unit ................................................................................................................ 11-43 Legislative Reference Bureau....................................................................................................... 11-43 Legislative Research Unit ............................................................................................................. 11-44 Architect of the Capitol, Office of the ............................................................................................ 11-44 Other Boards and Commissions: Civil Service Commission ............................................................................................................. 11-45 Court of Claims ............................................................................................................................. 11-47 Elections, State Board of .............................................................................................................. 11-53 Executive Ethics Commission....................................................................................................... 11-56 Illinois Labor Relations Board ....................................................................................................... 11-57 Procurement Policy Board ............................................................................................................ 11-59 Property Tax Appeal Board .......................................................................................................... 11-60 Executive Inspector General, Office of................................................................................................ 11-63 Governor’s Office of Management and Budget................................................................................... 11-66 Capital Development Board ................................................................................................................ 11-69 Central Management Services, Department of ................................................................................... 11-72 Revenue, Department of ..................................................................................................................... 11-78 State Employees Retirement System ................................................................................................. 11-85 DEBT MANAGEMENT.............................................................................................................................. Chapter 12
DEMOGRAPHIC INFORMATION............................................................................................................. Chapter 13
GLOSSARY............................................................................................................................................... Chapter 14

Office of the Governor 207 State Capitol, Springfield, Illinois 62706
MARCH 18, 2009 To the Honorable Members of the General Assembly and the People of the State of Illinois: I respectfully submit to you the Fiscal Year 2010 Operating Budget, a $53 billion plan that makes difficult but responsible choices, yet maintains a commitment to our priorities during the worst fiscal period in Illinois history. We must confront the effects of a national recession that will likely be the longest and deepest since the Great Depression. This, along with poor fiscal discipline by previous administrations, has left us in a dire financial situation. We are not alone in this challenge. States across the country are struggling with an estimated $350 billion in budget shortfalls. To address these deficits, states are turning to major cuts in priorities like education or healthcare. In Illinois, we are facing an $11.5 billion deficit for fiscal years 2009 and 2010. This gap is too large to be addressed with any single measure – whether it is spending cuts, revenue increases, or federal recovery money. It calls for every type of solution. That is what this budget does. This plan makes tough decisions, while maintaining our commitment to our priorities and, more importantly, it protects our most vulnerable citizens. This budget is framed around the three core principles: Reform, Responsibility and Recovery. It makes major reforms by reducing spending in non-essential areas, and taking action on issues that have been neglected for too long, such as the pension system. It also guarantees tax equity in Illinois, and protects families that are unfairly affected by the current state income tax. To further families and spur the economy, I also proposing a back-to-school sales tax reprieve. Responsibility is critical in times like this, and this budget maintains our commitment to education and health care, yet calls for belt-tightening in areas throughout state government. Finally, the state cannot begin to recover without putting people to work. At 7.9 percent, our unemployment rate is unacceptable. My budget proposal includes a $26 capital plan – Illinois Jobs Now! – which will support 340,000 Illinois jobs. At the same time, it will build schools, fix aging roads and bridges, improve mass transit, and invest in energy and the environment. We can – and must – turn the state of our economy around. I believe it is not only possible to get Illinois back on the road to recovery, but make it stronger for future generations. I look forward to working with each of you to make this a reality. Sincerely,
Pat Quinn Governor, State of Illinois


The State of Illinois fiscal year 2010 budget book can be accessed online at
www.state.il.us/budget


READER’S GUIDE
www.state.il.us/budget
CHAPTER 1

Reader’s Guide
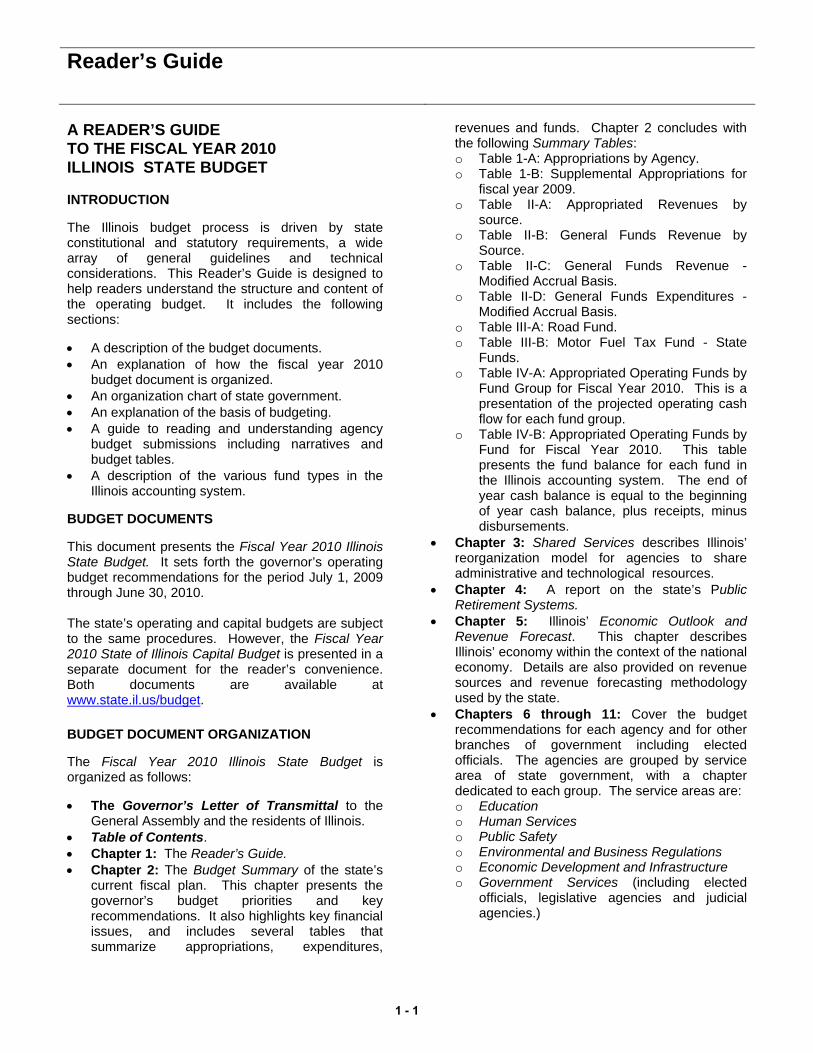
A READER’S GUIDE TO THE FISCAL YEAR 2010 ILLINOIS STATE BUDGET INTRODUCTION The Illinois budget process is driven by state constitutional and statutory requirements, a wide array of general guidelines and technical considerations. This Reader’s Guide is designed to help readers understand the structure and content of the operating budget. It includes the following sections: • A description of the budget documents. • An explanation of how the fiscal year 2010
budget document is organized. • An organization chart of state government. • An explanation of the basis of budgeting. • A guide to reading and understanding agency
budget submissions including narratives and budget tables.
• A description of the various fund types in the Illinois accounting system.
BUDGET DOCUMENTS
This document presents the Fiscal Year 2010 Illinois State Budget. It sets forth the governor’s operating budget recommendations for the period July 1, 2009 through June 30, 2010. The state’s operating and capital budgets are subject to the same procedures. However, the Fiscal Year 2010 State of Illinois Capital Budget is presented in a separate document for the reader’s convenience. Both documents are available at www.state.il.us/budget. BUDGET DOCUMENT ORGANIZATION The Fiscal Year 2010 Illinois State Budget is organized as follows: • The Governor’s Letter of Transmittal to the
General Assembly and the residents of Illinois. • Table of Contents. • Chapter 1: The Reader’s Guide. • Chapter 2: The Budget Summary of the state’s
current fiscal plan. This chapter presents the governor’s budget priorities and key recommendations. It also highlights key financial issues, and includes several tables that summarize appropriations, expenditures,
revenues and funds. Chapter 2 concludes with the following Summary Tables: o Table 1-A: Appropriations by Agency. o Table 1-B: Supplemental Appropriations for
fiscal year 2009. o Table II-A: Appropriated Revenues by
source. o Table II-B: General Funds Revenue by
Source. o Table II-C: General Funds Revenue -
Modified Accrual Basis. o Table II-D: General Funds Expenditures -
Modified Accrual Basis. o Table III-A: Road Fund. o Table III-B: Motor Fuel Tax Fund - State
Funds. o Table IV-A: Appropriated Operating Funds by
Fund Group for Fiscal Year 2010. This is a presentation of the projected operating cash flow for each fund group.
o Table IV-B: Appropriated Operating Funds by Fund for Fiscal Year 2010. This table presents the fund balance for each fund in the Illinois accounting system. The end of year cash balance is equal to the beginning of year cash balance, plus receipts, minus disbursements.
• Chapter 3: Shared Services describes Illinois’ reorganization model for agencies to share administrative and technological resources.
• Chapter 4: A report on the state’s Public Retirement Systems.
• Chapter 5: Illinois’ Economic Outlook and Revenue Forecast. This chapter describes Illinois’ economy within the context of the national economy. Details are also provided on revenue sources and revenue forecasting methodology used by the state.
• Chapters 6 through 11: Cover the budget recommendations for each agency and for other branches of government including elected officials. The agencies are grouped by service area of state government, with a chapter dedicated to each group. The service areas are: o Education o Human Services o Public Safety o Environmental and Business Regulations o Economic Development and Infrastructure o Government Services (including elected
officials, legislative agencies and judicial agencies.)
1 - 1
Reader’s Guide
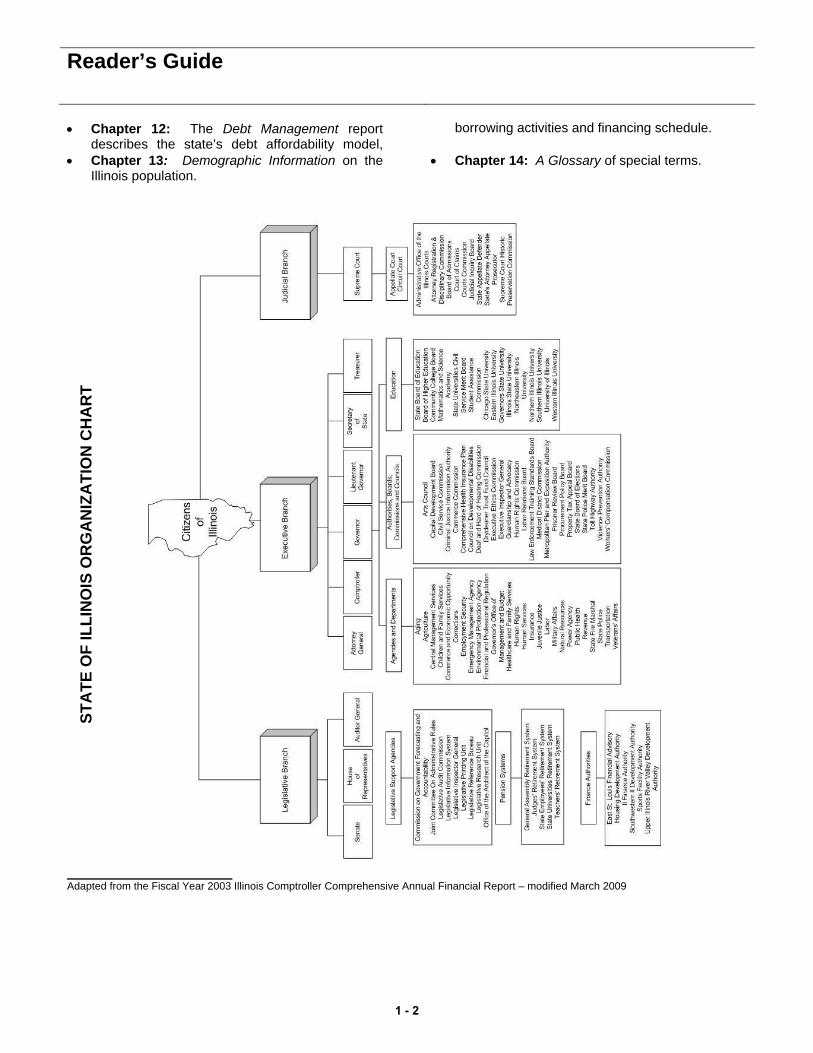
• Chapter 12: The Debt Management report describes the state’s debt affordability model,
borrowing activities and financing schedule.
• Chapter 13: Demographic Information on the Illinois population.
• Chapter 14: A Glossary of special terms.
____________________________ Adapted from the Fiscal Year 2003 Illinois Comptroller Comprehensive Annual Financial Report – modified March 2009
STA
TE O
F IL
LIN
OIS
OR
GA
NIZ
ATI
ON
CH
AR
T
1 - 2

Reader’s Guide
BASIS OF BUDGETING The Illinois Constitution requires the governor to prepare and submit a state budget to the General Assembly for the upcoming fiscal year. The budget sets forth the estimated balance of funds available for appropriation at the beginning of the fiscal year, the estimated receipts, and a plan for expenditures during the fiscal year. The Illinois Constitution requires the governor to submit a balanced budget. Public Act 90-479, enacted in 1999, amended the Civil Administrative Code (State Budget Law) to provide guidance to the governor as he proposes the budget, and to the General Assembly as it makes appropriations, regarding a balanced budget requirement. Public Act 90-479 applies only to six funds, which it defines as “budgeted funds”: General Revenue, Common School, Education Assistance, Road, Motor Fuel Tax and Agricultural Premium. For the budgeted funds, revenue estimates include the beginning fund balance, plus revenues to be received during the budgeted year, plus revenues due to the state as of June 30 of the budgeted fiscal year that are expected to be collected in the two-month lapse period following the budgeted year. Public Act 90-479 also requires the use of the “modified accrual” basis of budgeting: revenues are accounted for in the year they are due – not when they are received. However, the amounts due to the state in one fiscal year but actually received in the following fiscal year are typically small and consistent over time, and are due to the normal payment cycles set forth in law. For instance, final monthly sales tax payments are due the state on the 20th day of the month following the sale. Consequently, final sales tax payments for June sales are received in July, the first month of the ensuing fiscal year. Likewise, revenue estimates include only those revenues due to the state during the fiscal year, July 1 through June 30. They do not include revenues collected in the lapse period of the budgeted fiscal year, (through August 31) which were due to the state as of June 30 of that year. Revenue estimates also include federal reimbursements associated with the recognition of liabilities paid pursuant to Section 25 of the State Finance Act. The main Section 25 programs are Medicaid and employee health insurance.
Expenditure estimates for budgeted funds take into account the costs to be incurred in the budgeted fiscal year, including those to be paid from future fiscal year appropriations pursuant to Section 25 of the State Finance Act. Expenditure estimates in Table II-D do not include costs paid in the budgeted fiscal year that were incurred in the prior fiscal year. Of the budgeted funds, only the General Revenue Fund has expenditures pursuant to Section 25 of the State Finance Act. Thus, expenditure estimates for the other funds are unaffected by Public Act 90-479. Revenue and expenditure estimates also include transfers between funds that are based on revenues received or costs incurred during the budgeted year. All other funds must be balanced so that proposed expenditures and appropriations do not exceed funds estimated to be available. A GUIDE TO UNDERSTANDING AGENCY BUDGET SUBMISSIONS The budget recommendations of the Fiscal Year 2010 Illinois State Budget include a narrative of each agency’s operations and summary tables of its budget. AGENCY NARRATIVE The narrative for each agency includes the following sections: • Agency Mission: A statement reflecting the
core objective of the agency. • Strategic Priorities: A listing of key goals and
objectives that link to the agency’s mission. • Summary of Agency Operations: A brief
description of agency duties and responsibilities. • Agency Resources Employed: A table
summarizing funding sources, recommended appropriations and two-year history of actual appropriations. Also included is a three-year headcount trend.
• Major Accomplishments: A brief description of current fiscal year agency programming and/or operational achievements.
• Key Budget Initiatives: A brief description of new items included in the fiscal year 2010 budget recommendation that help to achieve the agency’s goals and objectives.
1 - 3

Reader’s Guide
• Programs: A brief description of agency programs along with a summary table of resources allocated to each program.
• Performance Measures: A table that captures the agency’s progress in key areas that relate to its strategic priorities and core mission. Emphasis is placed on outcomes, that is, results that impact the public.
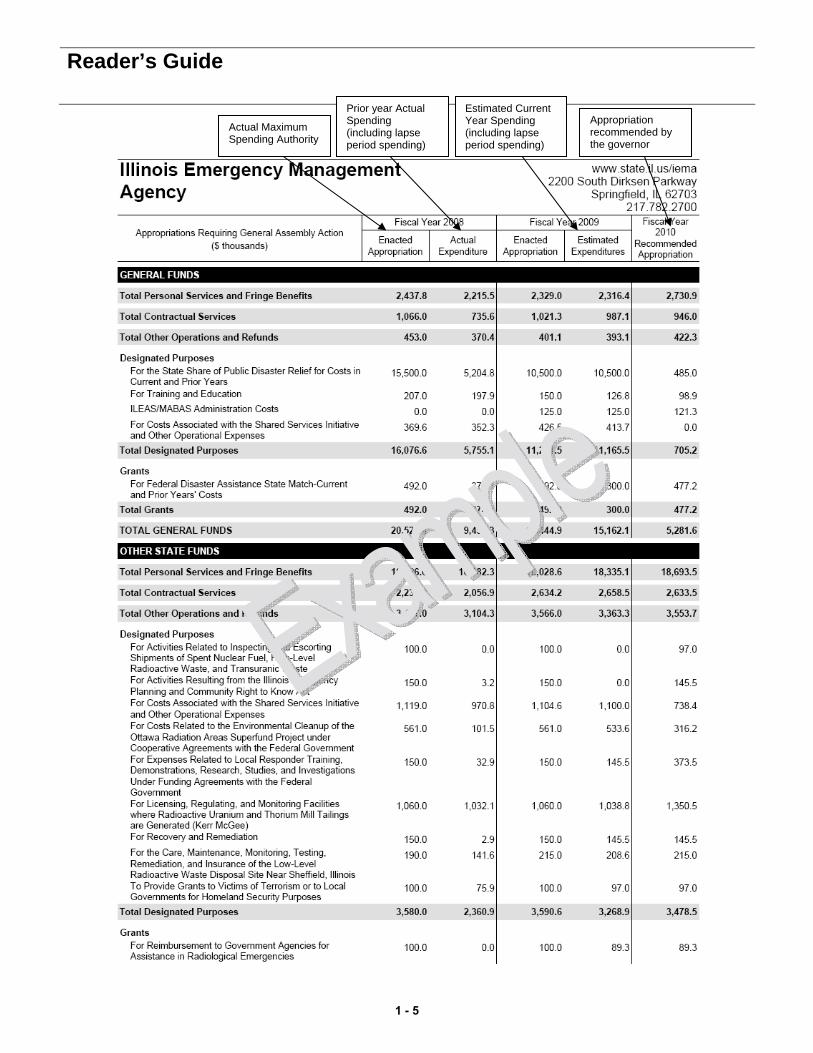
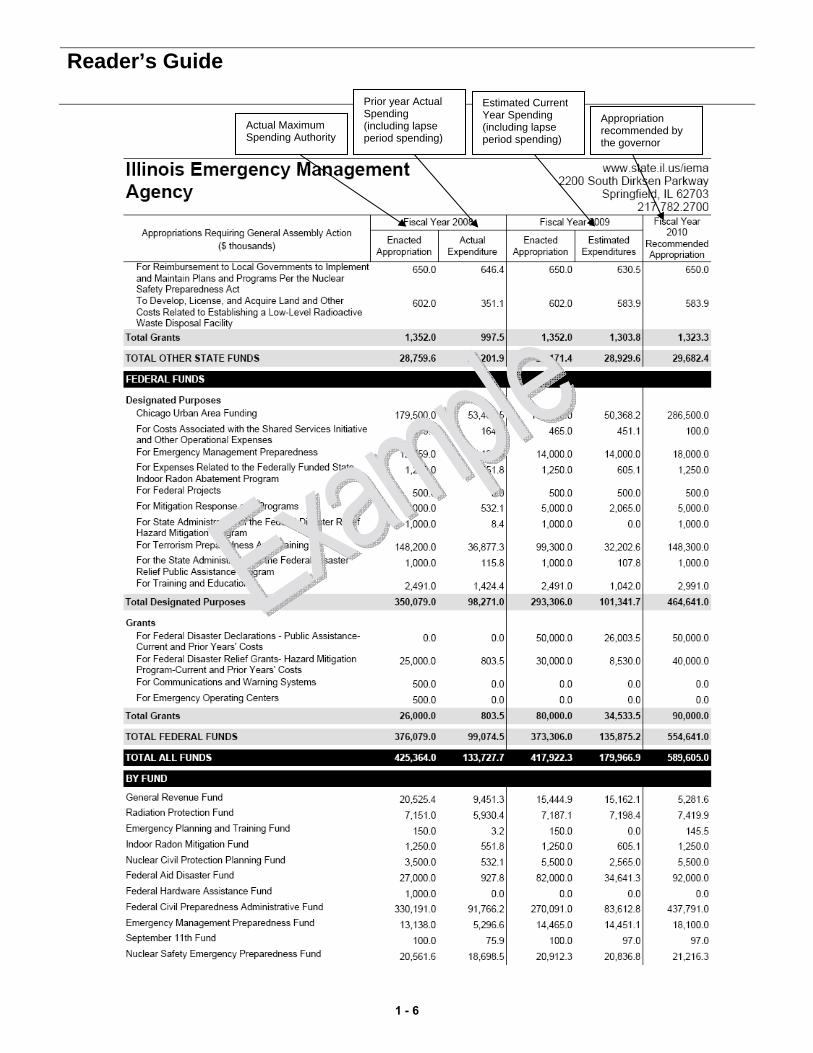
AGENCY BUDGET TABLES The budget tables provide summary detail on each agency’s budget. The budget tables list each agency’s appropriations and expenditures by major fund group, by fund and by division, as well as the agency’s headcount by division. Personnel detail forms, which list the agency’s staff by division and position title, are available in a separate volume. Appropriations by Major Fund Group • The appropriations recommendations requiring
General Assembly action are shown by type of expenditure for each of three major fund groups: general funds, other state funds and federal funds.
• Within each fund group, the appropriations and
expenditures are further subdivided into major categories such as personal services and fringe benefits, contractual services, other operations and refunds, designated purposes, and grants. Each appropriation for designated purposes and grants is listed individually.
Appropriations by Fund • The agency’s resources are shown in total for
each fund requiring appropriations by the General Assembly.
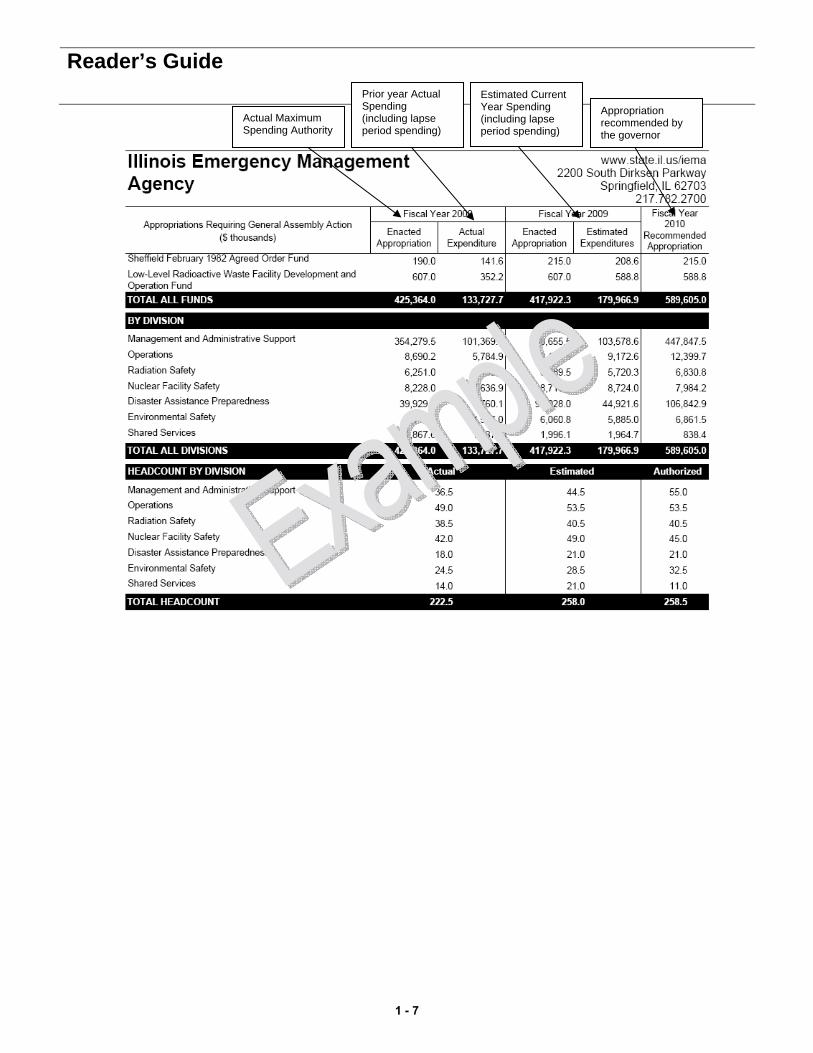
Appropriations by Division • The agency’s new appropriations and
reappropriations requiring General Assembly action are shown by division as classified by the comptroller.
Headcount by Division • The agency’s headcount by division is presented,
showing actual headcount at the end of fiscal year 2008, estimated headcount for fiscal year 2009 and recommended headcount for fiscal year 2010.
Column Descriptions • The fiscal year 2008 appropriations column
reports all original and supplemental appropriations and reappropriations enacted by the General Assembly and signed into law by the governor for fiscal year 2008. The amounts also reflect approved two percent transfers and executive orders issued by the governor.
• Fiscal year 2008 expenditures include those
incurred from July 1, 2007 through June 30, 2008 and during the two-month lapse period ending August 31, 2008. During the lapse period, outstanding fiscal year 2008 remaining state obligations were liquidated.
• Fiscal year 2009 appropriations reflect all original
and supplemental appropriations for fiscal year 2009 enacted by the General Assembly and signed by the governor through January 31, 2009. This column also reports changes due to approved two percent transfers and executive orders issued by the governor.
• Fiscal year 2009 estimated expenditures reflect
the expenditures projected to be incurred through the fiscal year, including the lapse period, and also account for anticipated two percent transfers, but do not include the requested fiscal year 2009 supplemental appropriations shown in Table I-B.
• Fiscal year 2010 appropriations show the
recommended or in the case of other elected officials or legislative/judicial branches of government, requested budget.
An example of the Budget Table follows.
1 - 4
Reader’s Guide
Actual Maximum Spending Authority
Estimated Current Year Spending (including lapse period spending)
Appropriation recommended by the governor
Prior year Actual Spending (including lapse period spending)
1 - 5
Reader’s Guide
Actual Maximum Spending Authority
Estimated Current Year Spending (including lapse period spending)
Appropriation recommended by the governor
Prior year Actual Spending (including lapse period spending)
1 - 6
Reader’s Guide
Estimated Current Year Spending (including lapse period spending)
Appropriation recommended by the governor
Actual Maximum Spending Authority
Prior year Actual Spending (including lapse period spending)
1 - 7

Reader’s Guide
DESCRIPTION OF FUNDS • The funds in the Illinois accounting system are
classified into two broad categories: Appropriated and Non-Appropriated Funds.
• Appropriated Funds are further classified into eight fund groups: General, Highway, Special State, Bond Financed, Debt Service, Federal Trust, Revolving and State Trust Funds.
• Non-Appropriated Funds are composed primarily of Federal and State Trust Funds, and include a few Special State Funds.
The following chart describes the major appropriated fund types, as well as the sources and uses of those funds:
State of Illinois Major Fund Group
Fund Group
Sources Purposes/Uses General Funds State income taxes,
sales taxes, other taxes and fees
Support the regular operating and administrative expenses of most state agencies. Includes General Revenue Fund, Education Assistance Fund, Common School Fund and General Revenue-Common School Special Account Fund.
Highway Funds
Motor fuel taxes, vehicle registrations, licenses and fees
Receive and distribute special assessments related to transportation. Support transportation-related activities at the state and local levels.
Special State Funds
Taxes and fees Represent a segregation of accounts restricted to the revenues and expenditures of a specific source. Supports such diverse activities as medical assistance, children’s services, environmental cleanup, financial regulation and health insurance. They are designated in Section 5 of the State Finance Act (30 ILCS 105/5) as special funds in the State Treasury and not elsewhere classified.
Bond Financed Funds
Build Illinois and General Obligation (GO) bonds
Receive and administer the proceeds of various state bond issues. Pays for capital improvements to local schools, state facilities, higher education facilities, development of coal-burning power plants, local water and wastewater treatment facilities, public transportation, airports, environmental programs and economic development projects.
Debt Service Funds
Transfers in from other funds
Account for the resources obtained and accumulated to pay interest and principal on debt obligations. Provides for debt service payments on state bonds.
Federal Trust Funds
Federal grants Support grants and contracts between state agencies and the federal government. Administered for specific purposes established by terms of grants and contracts. Supports a variety of programs including education, healthcare, human services, community development, transportation and energy.
Revolving Funds Repayments on project loans
Finance the operations of state agencies that render services to other state agencies on a cost reimbursement basis; supports local capital projects. Appropriation of these funds depends upon intra-governmental service requirements and appropriation of other state agencies.
State Trust Funds Various Hold funds on behalf of other entities or individuals (such as pensions). Established by statute or under statutory authority for specific purposes.
1 - 8

BUDGET SUMMARY
www.state.il.us/budget
CHAPTER 2

FY2010: Fiscal Overview & Budget Summary
www.state.il.us/budget108 State House
Springfield, IL 62706217.782.4520
Like the rest of the nation, Illinois is in the midst of one of the worst economic downturns in history. The country has been in a recession since December 2007 – a condition that is likely to be the longest and deepest since the Great Depression of the 1930s. Over the past year, global stock markets had their values cut in half, and every major asset class – stocks, real estate, commodities, and high-yield bonds – suffered significant double-digit percentage losses, resulting in the destruction of over $30 trillion of paper wealth.
In Illinois, the recession, combined with a lack of fiscal discipline by previous administrations, has deepened the state’s dire financial situation.
The combined effect of the state’s structural budget deficit and the loss of revenues caused by the recession results in a budget gap of $11.5 billion for fiscal years 2009 and 2010. This is the most challenging fiscal crisis ever in Illinois. It calls for every type of solution possible, including spending cuts, revenue increases, debt restructuring and pension reform.
Illinois is not alone in its struggle to recover. Combined state budget gaps for the remainder of the current fiscal year and the next year nationally are estimated to total more than $350 billion. Because states cannot run deficits, they must close their shortfalls by cutting spending or raising taxes. That causes two further problems. First, spending cuts and tax increases take money out of the economy, making the downturn even worse. Second, as states have to cut back, they cannot respond to the rising need for health care and other services that occurs when workers lose jobs or are otherwise hit by the economic downturn.
In response, the Obama administration in February signed into law the American Recovery and Reinvestment Act. The intent of the Act is to create or save 3.5 million jobs over the next two years – 148,000 jobs in Illinois alone. The federal recovery funds are also intended to mitigate some budget cuts and reduce the extent of even deeper cuts over the next two years, particularly in areas such as education and health care.
Illinois will receive a substantial portion of federal recovery funds over the next 27 months. Currently,
that amount is estimated at over $9 billion in direct funds to the state and even more to local entities, such as school districts. However, the state cannot solely rely on stimulus funds to close the budget gap.
Prior to achieving a balanced budget in fiscal year 2010, the state also has to face the expectation of the budget deficit remaining from fiscal year 2009. This deficit is estimated to be over $4 billion, driven primarily by the poor economy.
In fiscal year 2009, the state’s economic condition mirrored that of the national economy. The unemployment rate both nationally and statewide in December 2009 was 7.2 percent. In February, the national unemployment rate soared to 8.1 percent. In January, the Illinois unemployment rate surged to 7.9 percent. As economic conditions began sliding dramatically over the past year, the state saw a corresponding decline in its revenue intake. Losses in the number of jobs, as well as wages, led to a decrease in personal income, which drives state individual income tax collections. Job losses also impact disposable income, leading to a drop in state sales tax collections. Auto sales are down and the housing crisis means people are not buying or renovating homes. Both lead to a dramatic decline in the state’s sales tax revenues. Finally, after several strong years of corporate income tax (CIT) receipts, the state is expected to see a serious decline in CIT in fiscal year 2009. All of these factors have had a tremendous impact on the state’s revenue collections. Fiscal year 2009 revenues are forecast at $27.2 billion with expenditures at $31.5 billion. Fundamental spending and revenue reform, particularly of the magnitude necessary to re-establish the state’s fiscal balance, means making difficult, but responsible decisions. That’s why Governor Quinn’s fiscal year 2010 budget proposal is based on three ideals: Reform. Responsibility. Recovery.
2 - 1
FY2010: Fiscal Overview & Budget Summary
www.state.il.us/budget108 State House
Springfield, IL 62706217.782.4520
REFORM As Illinois struggles to stay afloat, Governor Quinn’s fiscal year 2010 budget proposal lays out two plans that will help with a financial turn-around. This is now the opportunity to take action on issues that have long been ignored and also to help families. Pension Uniformity The governor believes that state employees deserve a secure retirement after years of service. He also believes that benefits should be affordable to the state’s citizens both now and in the future.
The state currently has five public employee retirement systems. These systems have no uniformity – they provide different benefits, require different employment contributions, have different provisions for early retirement, allow for different retirement ages, and offer differing death and disability benefits. The governor proposes in his budget the following changes to state retirement system provisions applicable to new hires:
• Retirement Age – Work patterns have changed over the years, but the Illinois pension systems have not kept up. People work longer and live longer. The Social Security system has been updated to reflect these new work patterns. That’s why the governor proposes linking retirement age to Social Security. Eligibility for unreduced benefits would become the age at which the employee would become eligible for unreduced Social Security benefits. Early retirement could occur no earlier than age 62, just as for Social Security. There would be no combination of age and service that would qualify an employee for a full retirement benefit prior to achieving eligibility for unreduced Social Security benefits.
• Benefit Formula – Currently, there are multiple
benefit rates that have developed over time, but the original rationale was lost. This budget returns to principled benefit rate calculations. Participants covered by Social Security would earn 1.5 percent of final pay per year of service. Participants not covered by Social Security would earn 2 percent. Final pay would be defined as the final 8-year average and considered compensation would be limited to base pay.
Credited service would be limited to 35 years. The benefit would be payable as a life annuity.
• Cost of Living Adjustments (COLA) – Retirees
should not be placed at risk as costs increase and that Illinois’ systems should reflect others around the country. The COLA would be 50 percent of the change in the consumer price index or 3 percent, whichever is lower. The annual COLA would be applied to the amount of the annual benefit awarded upon retirement. This change would bring the five state retirement systems roughly in line with other public employee systems.
• Employee Contributions – New hires will pay
one percentage point less than the currently required contribution rates. Current employees will be asked to share the burden for the pension benefits to which they are entitled. The current contribution rate would be increased by two percentage points.
Pension Payments – Fiscal Year 2010
Each year, the state makes a contribution on behalf of employees to support their future retirement cost. This contribution is currently based on a statutory formula with automatic annual increases (ramp-up period), plus a calculation based on investment performance. Notably, no component of the calculation is based on the actual amount needed to cover the cost of the pension benefits, nor the enormous outstanding interest due to historical underfunding.
The five state retirement systems incurred an actuarial loss on investment performance in excess of $9 billion in fiscal year 2008. This effectively increased the state debt by $9 billion – a debt which will require an annual interest payment of over $700 million. So far in fiscal year 2009, the state retirement systems have incurred an actuarial loss in excess of $20 billion
The governor proposes to limit the state’s contribution to the five state retirement systems to the normal cost for fiscal year 2010. Normal cost represents the present value of the benefits earned by system members during each of those fiscal years.
2 - 2

FY2010: Fiscal Overview & Budget Summary
www.state.il.us/budget108 State House
Springfield, IL 62706217.782.4520
Tax Equity
When the Illinois income tax was enacted in 1969, the personal exemption was set at $1,000. The value of the exemption was left unchanged until 1998, when the legislature passed a bill doubling the exemption over three years. In tax year 2000, Illinois taxpayers could claim a personal exemption of $2,000 for each exemption claimed on the federal income tax. By claiming a personal exemption, the amount of income that is taxed is reduced.
The governor’s fiscal 2010 budget proposes increasing the personal exemption from $2,000 to $6,000, effective July 1, 2009. The budget also proposes increasing the income tax rate by 1.5 percentage points for individuals, and 2.4 percentage points for corporations.
For a family of four in Illinois, the current exemption is $8,000. This compares to states such as Missouri where the exemption for a four-person family is $15,100, and in Wisconsin where it’s $18,940. By increasing the exemption to $24,000 for a family of four, Governor Quinn’s proposal would help families who are struggling to make ends meet and are substantially burdened by the state income tax. It
would mean that a family of four making $24,000 per year would pay no income tax in Illinois. Currently, a family of four making that amount per year pays $480 in state taxes.
It is estimated that the increase will generate an additional $2.8 billion in individual income tax receipts in fiscal year 2010, and $350 million in corporate income tax receipts.
If the General Assembly passes the income tax changes proposed in the budget, total net individual income tax deposited into the general fund is forecast at $11.8 billion. The net figure translates into gross individual income tax revenue at $14.7 billion. Sales Tax Holiday A temporary back-to-school sales tax reprieve would reduce the tax burden on families with children. Sales taxes are regressive, requiring low- and middle-class families to pay a larger share of their income in tax than the wealthiest families. A 10-day sales tax holiday in August would also help spur the state’s economy. Sixteen states and the District of Columbia had sales tax holidays in 2008, according the Federation of Tax Administrators.
Qualifying items would include: clothing and footwear for $100 or less (per item) and school supplies. The Department of Revenue estimates the sales tax holiday would cost $40 to $50 million. This lost revenue is proposed to be recouped by lowering the retailer’s discount rate on sales tax to 0.75 percent.
RESPONSIBILITY Extremely difficult decisions must be made to bring the Illinois economy back to life. There are decisions that won’t please everyone, but during a time of fiscal crisis, all aspects of state government must be examined, and critical programs and services must be protected. Spending Cuts Given the revenue reduction and the emergence of the $11 billion General Fund budget gap, Governor Quinn proposes belt-tightening strategies and cuts such as: • Ordering spending reductions from fiscal year
2009. • Requiring state employees to take four furlough
days. This excludes workers who provide direct patient care or public safety, such as corrections workers and state police. $36 million
• Increasing healthcare contributions for state employees and state retirees. $200 million
• Targeted reductions and other efficiencies throughout various agencies, including
STATE INCOME TAX LIABILITY FOR A FAMILY OF FOUR
Gross Family Income
STATE INCOME TAX LIABILITY FOR A FAMILY OF FOUR
Gross Family Income
2 - 3

FY2010: Fiscal Overview & Budget Summary
www.state.il.us/budget108 State House
Springfield, IL 62706217.782.4520
consolidating the Historic Preservation agency into the Department of Natural Resources, saving $1.2 million annually.
• Across-the-board 2 percent reductions in grant programs, excluding healthcare and education programs. $80 million
Protecting Priorities
We have fundamental responsibilities as a state – protecting the public; helping our families and veterans; educating the next generation; and preserving our quality of life. The governor’s fiscal year 2010 budget: • Increases funding for P-12 education by $174
million and higher education by $40 million, while other states are cutting education programs.
• Holds the line on the gasoline tax when people are already struggling to make ends meet.
• Fully opens the 80-bed expansion at LaSalle Veterans’ Home, providing more space for veterans with Alzheimer’s.
• Funds a new 200-bed Chicago veterans’ home. • Properly funds the state’s parks to provide
Illinoisans affordable tourism options during a stressful economy. Because children already spend too much time in front of a television, nature sanctuaries should not be put on the back-burner.
• Creates nearly 2,000 slots for the Summer Jobs program, which will put teens to work at agencies throughout the state.
• Provides $1 million to food banks to ensure that struggling families have access to nutritious food during difficult economic times.
RECOVERY Job creation strategic and debt management are two ways to stimulate Illinois’ stagnant economy during these difficult times. Governor Quinn’s budget includes a $26 billion capital plan that will put people back to work and fix the state’s aging infrastructure. At the same time, the state will take advantage of the federal recovery funds that will improve healthcare, human services, as well as the environment and educational programs.
THE CAPITAL BUDGET Illinois Jobs Now! The state must address its desperate need for a capital plan. Governor Quinn’s $26 billion proposal – Illinois Jobs Now! – will create 340,000 jobs and help to jump-start the economy. The construction plan will provide funding to build schools, fix aging roads and bridges, improve public transit, and make investments in energy and the environment. Some of the plan’s highlights include:
• $14 billion for the state’s bridges, roads, highways and interstates.
• $4.6 billion for mass transit agencies. • $4.2 billion for education, including $3 billion in
school construction matching grants; $200 million in school maintenance funds; and $920 million for higher education capital projects.
• $971 million for economic development to help stimulate job growth, provide affordable housing, improve community healthcare centers, and improve infrastructures to attract new businesses to Illinois.
Illinois Jobs Now! will be supported through a combination of state funds, as well as federal and local matching funds. The state funding will be provided through:
• An increase in driver’s license fees and vehicle registration fees to pay for roads and bridges.
• Current motor fuel taxes and vehicle registrations, to also help pay for roads and bridges.
• An increase in title fees to pay for transit. • A 10 percent share of the personal income tax
increase and the corporate income tax increase. Also, additional revenue from the corporate tax increase will help pay for economic development, education, environment, and all other projects.
Because each year’s capital program presents a set of priorities which are paid for over multiple years, and because the sources and uses of each year’s capital program differ from those of the operating budget, it is more informative to discuss each independently. As such, the proposed fiscal year 2009 Capital Budget is presented in a separate volume.
2 - 4

FY2010: Fiscal Overview & Budget Summary
www.state.il.us/budget108 State House
Springfield, IL 62706217.782.4520
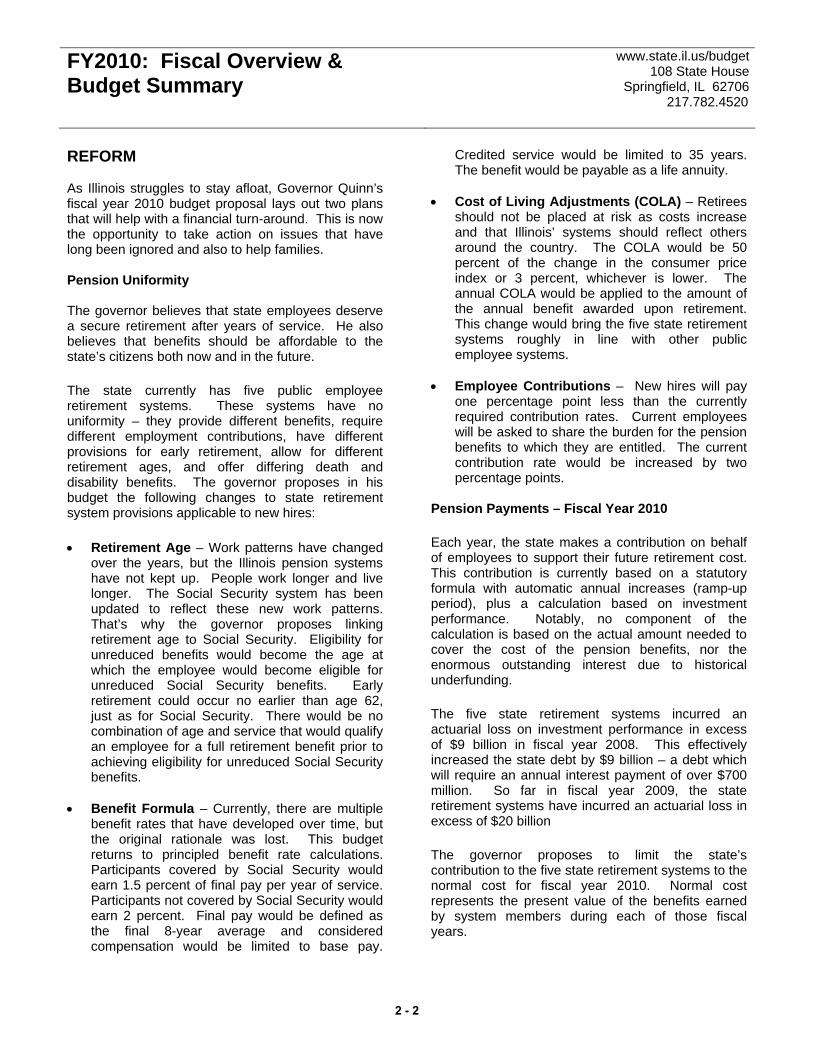
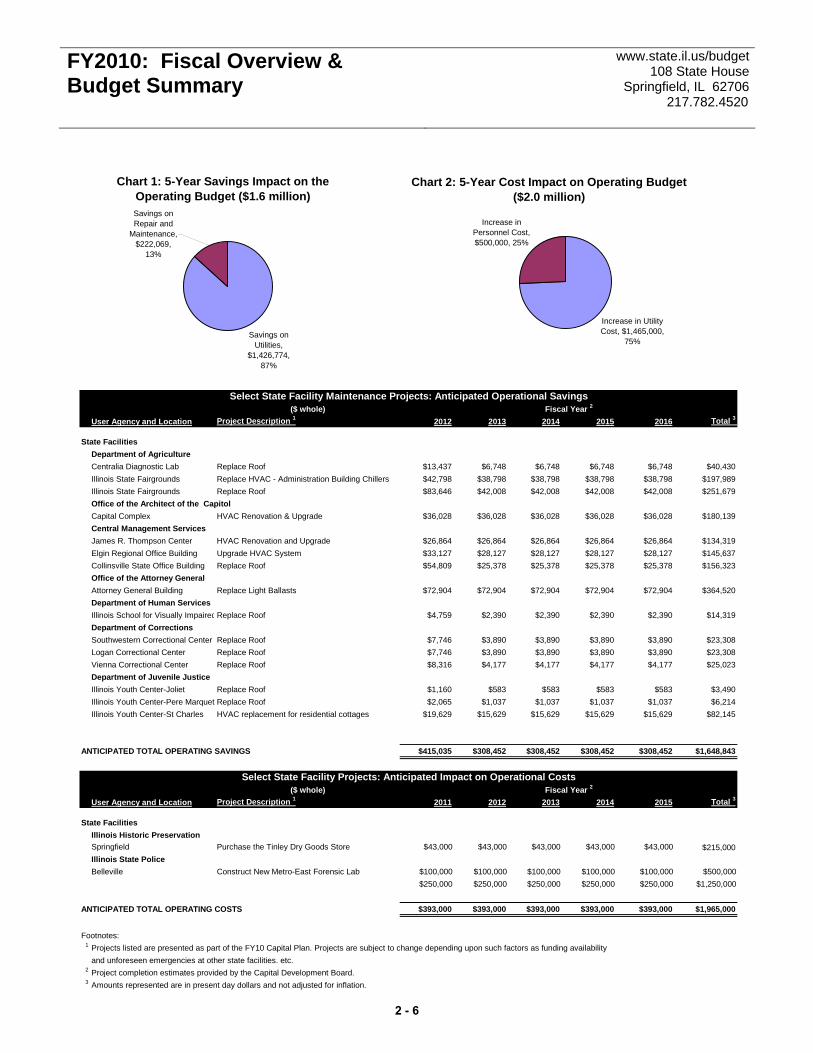
Table 1 on the outlines the estimated spending on capital programs proposed in the fiscal year 2010 Capital Budget by agency, including new appropriations and reappropriations of prior year projects not yet completed. Implementing a capital program impacts the operating budget in two ways: (1) the completion of new or renovated state facilities will have a direct impact on state spending since new or renovated facilities can be operated more efficiently, or can cost more to operate due to requiring more staffing or utility costs; and (2) the debt service incurred in financing capital programs will represent a new annual fixed cost. Charts 1 and 2 on the following page identifies the annual operating costs (or savings) associated with select capital projects.
AgencyFY 2010
TotalAppropriations
Board Of Higher Education 160,868 Capital Development Board 2,076,274,154 Chicago State University 48,798,293 Department Of Agriculture 15,005,193 Department Of Central Management Services 52,018,964 Department Of Commerce And Economic Opportunity 1,525,294,555 Department Of Corrections 296,427,841 Department Of Human Services 83,800,646 Department Of Juvenile Justice 7,752,874 Department Of Military Affairs 10,766,936 Department Of Natural Resources 646,190,659 Department Of Public Health 491,772 Department Of Revenue 12,170,102 Department Of State Police 14,815,043 Department Of Transportation 12,809,398,995 Department Of Veterans' Affairs 36,027,546 Eastern Illinois University 12,973,836 Governors State University 25,133,752 Illinois Commerce Commission 55,473 Illinois Community College Board 286,423,142 Illinois Emergency Management Agency 25,000,000 Illinois Environmental Protection Agency 1,591,309,013 Illinois Finance Authority 24,630,807 Illinois Historic Preservation Agency 15,980,528 Illinois Mathematics And Science Academy 10,330,153 Illinois Medical District Commission 3,915,252 Illinois State University 65,139,515 Northeastern Illinois University 83,400,863 Northern Illinois University 37,088,691 Office Of The Architect Of The Capitol 54,925,010 Office Of The Attorney General 1,661,000 Office Of The Secretary Of State 23,956,169 Southern Illinois University 167,529,622 State Board Of Education 5,000,000 Supreme Court 16,223,275 University Of Illinois 270,372,137 Western Illinois University 98,013,774 Total Capital Appropriations 20,454,456,453
2 - 5
FY2010: Fiscal Overview & Budget Summary
www.state.il.us/budget108 State House
Springfield, IL 62706217.782.4520
($ whole)User Agency and Location Project Description 1 2012 2013 2014 2015 2016 Total 3
State FacilitiesDepartment of AgricultureCentralia Diagnostic Lab Replace Roof $13,437 $6,748 $6,748 $6,748 $6,748 $40,430Illinois State Fairgrounds Replace HVAC - Administration Building Chillers $42,798 $38,798 $38,798 $38,798 $38,798 $197,989Illinois State Fairgrounds Replace Roof $83,646 $42,008 $42,008 $42,008 $42,008 $251,679Office of the Architect of the CapitolCapital Complex HVAC Renovation & Upgrade $36,028 $36,028 $36,028 $36,028 $36,028 $180,139Central Management ServicesJames R. Thompson Center HVAC Renovation and Upgrade $26,864 $26,864 $26,864 $26,864 $26,864 $134,319Elgin Regional Office Building Upgrade HVAC System $33,127 $28,127 $28,127 $28,127 $28,127 $145,637Collinsville State Office Building Replace Roof $54,809 $25,378 $25,378 $25,378 $25,378 $156,323Office of the Attorney GeneralAttorney General Building Replace Light Ballasts $72,904 $72,904 $72,904 $72,904 $72,904 $364,520Department of Human ServicesIllinois School for Visually ImpairedReplace Roof $4,759 $2,390 $2,390 $2,390 $2,390 $14,319Department of CorrectionsSouthwestern Correctional Center Replace Roof $7,746 $3,890 $3,890 $3,890 $3,890 $23,308Logan Correctional Center Replace Roof $7,746 $3,890 $3,890 $3,890 $3,890 $23,308Vienna Correctional Center Replace Roof $8,316 $4,177 $4,177 $4,177 $4,177 $25,023Department of Juvenile JusticeIllinois Youth Center-Joliet Replace Roof $1,160 $583 $583 $583 $583 $3,490Illinois Youth Center-Pere MarquettReplace Roof $2,065 $1,037 $1,037 $1,037 $1,037 $6,214Illinois Youth Center-St Charles HVAC replacement for residential cottages $19,629 $15,629 $15,629 $15,629 $15,629 $82,145
ANTICIPATED TOTAL OPERATING SAVINGS $415,035 $308,452 $308,452 $308,452 $308,452 $1,648,843
($ whole)User Agency and Location Project Description 1 2011 2012 2013 2014 2015 Total 3
State FacilitiesIllinois Historic PreservationSpringfield Purchase the Tinley Dry Goods Store $43,000 $43,000 $43,000 $43,000 $43,000 $215,000Illinois State PoliceBelleville Construct New Metro-East Forensic Lab $100,000 $100,000 $100,000 $100,000 $100,000 $500,000
$250,000 $250,000 $250,000 $250,000 $250,000 $1,250,000
ANTICIPATED TOTAL OPERATING COSTS $393,000 $393,000 $393,000 $393,000 $393,000 $1,965,000
Footnotes:1 Projects listed are presented as part of the FY10 Capital Plan. Projects are subject to change depending upon such factors as funding availability
and unforeseen emergencies at other state facilities. etc.2 Project completion estimates provided by the Capital Development Board.3 Amounts represented are in present day dollars and not adjusted for inflation.
Select State Facility Projects: Anticipated Impact on Operational CostsFiscal Year 2
Fiscal Year 2Select State Facility Maintenance Projects: Anticipated Operational Savings
Chart 1: 5-Year Savings Impact on the Operating Budget ($1.6 million)
Savings on Utilities,
$1,426,774, 87%
Savings on Repair and
Maintenance, $222,069,
13%
Chart 2: 5-Year Cost Impact on Operating Budget ($2.0 million)
Increase in Utility Cost, $1,465,000,
75%
Increase in Personnel Cost, $500,000, 25%
2 - 6
FY2010: Fiscal Overview & Budget Summary
www.state.il.us/budget108 State House
Springfield, IL 62706217.782.4520
American Recovery and Reinvestment Act of 2009 The American Recovery and Reinvestment Act of 2009 (ARRA) was signed by President Obama on February 17, 2009. It is an unprecedented effort to jump-start our economy, create or save millions of jobs, and put a down-payment on addressing long-neglected challenges so that our country can thrive in the 21st century. ARRA is geared towards creating jobs, modernizing health care, investing in renewable energy, making higher education more affordable and improving the nation’s roads, bridges and mass transit systems. ARRA also provides significant financial assistance to workers and families hit hard by the economic crisis. In Illinois, a variety of human services programs will benefit from this additional funding. The majority of recovery funds will flow through existing state programs. Below is a brief overview, by agency, of how some of the federal funding will assist Illinoisans in fiscal year 2010 and fiscal year 2011: • Illinois’ Medicaid program will receive an
increase in the federal matching rate from 50.32 percent to 60.48 percent for 27 months, beginning in October 2008. The estimated benefit to Illinois is $1.9 billion across all Medicaid spending and funds for fiscal years 2009 and 2010. The state is required to maintain payment times for practitioners at 30 days and reduce times for hospitals and nursing homes by 30 days by June 1, 2009, in order to take full advantage of the federal funds.
• Education will receive over $2 billion to help
support K-12 education and higher education. An additional $1 billion will go to school districts as unprecedented new funding for disadvantaged schools, special education, and education technology.
• Department of Commerce & Economic
Opportunity will receive approximately $935 million in federal stimulus funds to support a variety of economic development programs promoting renewable energy, energy efficiency, clean coal technology, broadband deployment, job re-training, community development, electric
grid expansion, and science and technology research.
• Department of Revenue will receive
approximately $346 million for the Home Investment Partnership Program and the Low-Income Housing Tax Credit Exchange Program, administered by the Illinois Housing Development Authority. This funding will allow for additional capital investments in qualified low-income housing developments and affordable housing developments.
• Environmental Protection Agency will receive
approximately $260 million to support the Drinking Water and Wastewater Infrastructure Revolving Loan Programs. These funds will be used for drinking water and wastewater treatment, and sewer projects. Twenty percent of the new funds are reserved for “green action projects” which conserve water, encourage low impact development, and energy efficiency at drinking water and wastewater treatment facilities.
• Department of Employment Security will
receive approximately $13 million in funding to expand services through the Employment Service Program. This program helps employers fill their vacancies and places job-seekers in the best available jobs, with an emphasis on returning unemployment claimants to work. The agency will also receive an additional $17.5 million to improve the efficiency of Unemployment Insurance administration.
• Department of Public Health will receive
approximately $10 million for immunization funding.
• Aging will receive nearly $6 million to further
extend nutrition and employment services to seniors.
• Department of Human Services will receive
$147 million to increase funding for the Women, Infants and Children (WIC), child care, vocational rehabilitation, early intervention and food stamps programs.
2 - 7
FY2010: Fiscal Overview & Budget Summary
www.state.il.us/budget108 State House
Springfield, IL 62706217.782.4520
Accountability for Federal Recovery Funds A key provision of the federal recovery plan is regular public reporting of project status, spending, and job creation and retention. Governor Quinn is required to report the following to each federal granting agency, Congress and www.recovery.gov before the end of each distribution period:
How funds will be used Whether funds were used correctly Jobs created/sustained by the funds Non-federal funding sources used to
complete projects Federal and state accountability and transparency measures will include:
Oversight of spending to prevent waste, fraud and abuse
Reporting compliance Competitive awards Whistleblower protections
Illinois will establish procedures for tracking and reporting on recovery grants and programs that meet and exceed the federal requirements. Data and reports will be published on www.recovery.illinois.gov. In addition, the state is planning to provide users with the ability to directly download raw data on project/program description, location, status, budget, spending, and job creation.
Debt Restructuring
Given the state’s deteriorating fiscal health, the governor proposes restructuring outstanding debt to take advantage of historically low interest rates. Other state and local governments have been able to do the same. Through the governor’s proposed debt restructuring plan, the state will save $530 million in fiscal year 2010.
OTHER FY2010 INITIATIVES TAXPAYER ACTION BOARD The State of Illinois faces significant fiscal challenges in 2010 and beyond. The Governor’s proposed budget for fiscal year 2010 meets the immediate challenge of the year ahead, but long-term concerns remain that cannot be fixed without major changes
that streamline operations and restructure organizations within state government. Governor Quinn plans to appoint a Taxpayer Action Board (TAB) to help identify the state’s major fiscal and structural impediments and most importantly, to make recommendations to help solve these problems. TAB’s recommendations will assure accountability and efficiency in state government, while ensuring it continues to meet the needs of the citizens of Illinois. TAB members will include a diverse group of individuals with expertise and experience in both the private and public sectors. Members of TAB will be charged to evaluate all state programs and to make significant recommendations that bring new approaches to dealing with difficult fiscal and operational issues. The recommendations will reinforce the state’s commitment to children, working families, taxpayers and seniors. The kinds of changes that are needed to bring Illinois to a responsible fiscal state cannot solely be resolved in the ordinary process of budget review and legislative action. Innovative change requires input from a diverse group that can look at all options for reorganizing state government and who can make choices that best serve the people of the state. ILLINOIS SUNSHINE PROJECT The Illinois Sunshine Project is a new initiative intended to make state government more open, more accountable, and more transparent. The state’s current Freedom of Information Act (FOIA) processes can be both slow and cumbersome. Through the Sunshine Project, we will take steps to dramatically improve access to state government information. This will include development of a new website making all major state government activities transparent to the public. The Sunshine website will provide access to electronic copies of all public documents appropriate for disclosure. These will include payroll records, contracts, licenses, and many other types of information. Up-to-date data will be made accessible to any person who wishes to view it.
2 - 8

FY2010: Fiscal Overview & Budget Summary
www.state.il.us/budget108 State House
Springfield, IL 62706217.782.4520
THE “FRAMEWORK PROJECT”
The Illinois Human Services and Healthcare Framework Project is a multi-year, comprehensive project of the Department on Aging, Department of Children and Family Services (DCFS), Department of Employment Security (IDES), Department of Healthcare and Family Services (HFS), Department of Human Services (DHS) and Department of Public Health (DPH).
Designed to develop a system to support data-sharing and efficient delivery of programs and services among the partner agencies, "the Framework Project" will employ modern technology and streamlined, standardized processes in order to expand residents' access to human and healthcare services, enhance the State's analysis and planning ability, and reduce the inefficiencies of the present systems.
The planning for such a system will begin in fiscal year 2010 with the state attempting to leverage federal funding to begin the phase of technical and process requirements gathering and across the board systems planning. Expected to span 24 months, the planning phase will yield the necessary information to implement software and systems change projects in subsequent years that will increase client outcomes and produce wide-scale administrative efficiencies.
These are a few of the projects included in Governor Quinn’s budget that will bring efficiency and transparency back to a state government that has long needed an overhaul in terms of freedom of information, efficiency and fiscal responsibility. The governor’s proposal calls for an honest government, fixes our tax system, but at the same time closes the budget gap.
FINANCIAL SUMMARY
The proposed level of operating appropriations from all funds in fiscal year 2010 is $52.9 billion, compared to a fiscal year 2009 appropriation of $50.8 billion once additional spending related to the federal recovery is accounted for. This represents an increase of $2.0 billion over fiscal year 2009, nearly all of which is accounted for by increased federal funding related to the Recovery Act.
General Fund appropriations for fiscal year 2010 are $28.4 billion. After taking in to account additional spending in fiscal year 2009 related to Federal Recovery. The fiscal year 2010 General Funds appropriations actually decline from $29.8 billion in fiscal year 2009 to $28.4 billion in fiscal year 2010.
Appropriations are made from individual funds, the names of which are often indicative of either the purpose of the appropriation or the major source of the funds’ receipts. The following table shows appropriations by major fund group.
Operating Appropriations by Fund Group Fiscal Year 2009
General Funds53.7%
Special State Funds22.0%
Federal Trust Funds16.7%
Highway Funds4.0%
Debt Service Funds2.9%
State Trust Funds0.6%
General funds - The largest fund group, in terms of dollars, are the General Funds. This fund group represents 53.7 percent of total recommended appropriations and consists of the General Revenue Fund, the Common School Fund, the Education Assistance Fund and the General Revenue-Common School Special Account Fund. The General Funds support the largest proportion of state programs as well as the executive, legislative and judicial branches of state government. The General Funds are commonly known as the state’s operating funds.
Special State Funds - The next largest fund group, in terms of dollars, are the Special State Funds. Included within this group are the following major categories:
• Highway Funds – These funds include the state Construction Account Fund (only presented in the capital budget), the Road Fund, the Grade Crossing Protection Fund (only presented in the capital budget) and the Motor Fuel Tax Fund. Appropriations from the highway funds support transportation and highway maintenance-related activities and include a mechanism for diverting a portion of road-related fees to local governments.
• Other Special State Funds – Over 300 funds support such diverse activities as medical assistance, children’s services, environmental cleanup, financial regulation and health insurance.
2 - 9

FY2010: Fiscal Overview & Budget Summary
www.state.il.us/budget108 State House
Springfield, IL 62706217.782.4520
Federal Trust Funds – This fund group supports a variety of state programs funded with Federal revenues, including education, health care, human
services, community development, transportation and energy. Nearly 60 percent of these dollars support education and employment related activities.
Appropriations also may be grouped according to purpose. The charts above show appropriations by major purpose, identifying the principal spending activities of state government. The charts show that the major portions of the state’s resources are allocated to education, healthcare and social human programs. Approximately 27 percent of the state’s All Funds total operating budget, or $14.5 billion, is dedicated
for educational purposes. The recommended appropriations for Human Services and Healthcare and Family Services - which include Medicaid, other medical assistance, income support, child and community care programs and other health and social services - total $24.7 billion or nearly 47 percent of the state’s total operating budget.
The two charts above identify the major revenue sources for all appropriated funds and the General Funds.
Fiscal Year 2010 Operating Appropriations by Major Purpose Percentage of Total
Fiscal Year 2010 Revenues by Source Percentage of Total
General Funds - $33.1 Billion
Healthcare And Family Services
29.8%
Education27.3%
Human Services16.8%
Economic Development And
Infrastructure10.2%
Government Services
9.3%
Public Safety4.9%
Environment And Business
Regulation1.6%
All Funds Total - $52.9 Billion
Education38.2%
Healthcare And Family Services
30.8%
Human Services21.3%
Public Safety5.2%
Government Services
3.7%
Economic Development And
Infrastructure0.6%
Environment And Business
Regulation0.3%
General Funds Total - $28.4 Billion
Income Tax22.7%
Sales Tax12.6%
Federal Aid36.4% Lottery &
Riverboat Gaming2.9%
Motor Fuel Tax2.4%
Public Utility Taxes3.2%
Other Receipts19.9%
All Appropriated Funds - $58.9 Billion
Individual Income Tax
39.0%
Sales Tax19.6%
Federal Aid16.8%
Federal Recovery5.5%
Public Utility3.5%
Corporate Income Tax
4.7%
Lottery & Riverboat Gaming
3.4%
Other Sources7.5%
2 - 10
FY2010: Fiscal Overview & Budget Summary
www.state.il.us/budget108 State House
Springfield, IL 62706217.782.4520
Total state revenues are projected to be $58.9 billion in fiscal year 2010, and General Funds receipts are estimated at $33.1 billion. General Funds revenues are estimated to increase by 21.7 percent, or $5.9 billion, in fiscal year 2010, though base revenues are estimated to fall by $198 million or -0.7 percent from fiscal year 2009 base revenues.
A breakdown by major revenue category can be found in Table II-A for total revenues and Table II-B for General Funds revenues. As can be seen in those tables, revenues from the income and sales taxes are the major source of state funds. They account for 35 percent of all receipts and 60 percent of General Funds receipts, as illustrated above.
2 - 11
FY2010: Fiscal Overview & Budget Summary
www.state.il.us/budget108 State House
Springfield, IL 62706217.782.4520
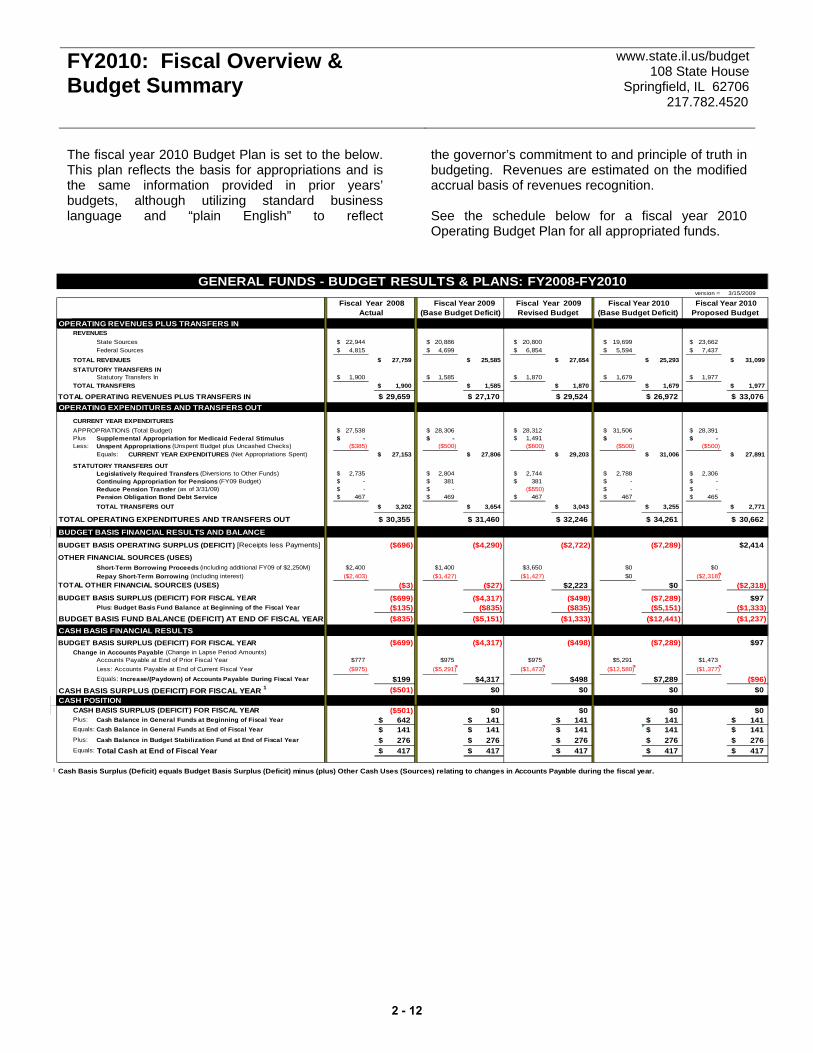
The fiscal year 2010 Budget Plan is set to the below. This plan reflects the basis for appropriations and is the same information provided in prior years’ budgets, although utilizing standard business language and “plain English” to reflect
the governor’s commitment to and principle of truth in budgeting. Revenues are estimated on the modified accrual basis of revenues recognition. See the schedule below for a fiscal year 2010 Operating Budget Plan for all appropriated funds.
version = 3/15/2009
OPERATING REVENUES PLUS TRANSFERS INREVENUES
State Sources 22,944$ 20,886$ 20,800$ 19,699$ 23,662$ Federal Sources 4,815$ 4,699$ 6,854$ 5,594$ 7,437$
TOTAL REVENUES 27,759$ 25,585$ 27,654$ 25,293$ 31,099$ STATUTORY TRANSFERS IN
Statutory Transfers In 1,900$ 1,585$ 1,870$ 1,679$ 1,977$ TOTAL TRANSFERS 1,900$ 1,585$ 1,870$ 1,679$ 1,977$
TOTAL OPERATING REVENUES PLUS TRANSFERS IN 29,659$ 27,170$ 29,524$ 26,972$ 33,076$ OPERATING EXPENDITURES AND TRANSFERS OUT
CURRENT YEAR EXPENDITURESAPPROPRIATIONS (Total Budget) 27,538$ 28,306$ 28,312$ 31,506$ 28,391$ Plus Supplemental Appropriation for Medicaid Federal Stimulus -$ -$ 1,491$ -$ -$ Less: Unspent Appropriations (Unspent Budget plus Uncashed Checks) ($385) ($500) ($600) ($500) ($500)
Equals: CURRENT YEAR EXPENDITURES (Net Appropriations Spent) 27,153$ 27,806$ 29,203$ 31,006$ 27,891$
STATUTORY TRANSFERS OUT Legislatively Required Transfers (Diversions to Other Funds) 2,735$ 2,804$ 2,744$ 2,788$ 2,306$ Continuing Appropriation for Pensions (FY09 Budget) -$ 381$ 381$ -$ -$ Reduce Pension Transfer (as of 3/31/09) -$ -$ ($550) -$ -$ Pension Obligation Bond Debt Service 467$ 469$ 467$ 467$ 465$ TOTAL TRANSFERS OUT 3,202$ 3,654$ 3,043$ 3,255$ 2,771$
TOTAL OPERATING EXPENDITURES AND TRANSFERS OUT 30,355$ 31,460$ 32,246$ 34,261$ 30,662$
BUDGET BASIS FINANCIAL RESULTS AND BALANCE
BUDGET BASIS OPERATING SURPLUS (DEFICIT) [Receipts less Payments] ($696) ($4,290) ($2,722) ($7,289) $2,414OTHER FINANCIAL SOURCES (USES)
Short-Term Borrowing Proceeds (including additional FY09 of $2,250M) $2,400 $1,400 $3,650 $0 $0Repay Short-Term Borrowing (including interest) ($2,403) ($1,427) ($1,427) $0 ($2,318)
TOTAL OTHER FINANCIAL SOURCES (USES) ($3) ($27) $2,223 $0 ($2,318)BUDGET BASIS SURPLUS (DEFICIT) FOR FISCAL YEAR ($699) ($4,317) ($498) ($7,289) $97
Plus: Budget Basis Fund Balance at Beginning of the Fiscal Year ($135) ($835) ($835) ($5,151) ($1,333)BUDGET BASIS FUND BALANCE (DEFICIT) AT END OF FISCAL YEAR ($835) ($5,151) ($1,333) ($12,441) ($1,237)CASH BASIS FINANCIAL RESULTSBUDGET BASIS SURPLUS (DEFICIT) FOR FISCAL YEAR ($699) ($4,317) ($498) ($7,289) $97
Change in Accounts Payable (Change in Lapse Period Amounts)Accounts Payable at End of Prior Fiscal Year $777 $975 $975 $5,291 $1,473Less: Accounts Payable at End of Current Fiscal Year ($975) ($5,291) ($1,473) ($12,580) ($1,377)Equals: Increase/(Paydown) of Accounts Payable During Fiscal Year $199 $4,317 $498 $7,289 ($96)
CASH BASIS SURPLUS (DEFICIT) FOR FISCAL YEAR 1 ($501) $0 $0 $0 $0CASH POSITION
CASH BASIS SURPLUS (DEFICIT) FOR FISCAL YEAR ($501) $0 $0 $0 $0Plus: Cash Balance in General Funds at Beginning of Fiscal Year 642$ 141$ 141$ 141$ 141$ Equals: Cash Balance in General Funds at End of Fiscal Year 141$ 141$ 141$ 141$ 141$ Plus: Cash Balance in Budget Stabilization Fund at End of Fiscal Year 276$ 276$ 276$ 276$ 276$ Equals: Total Cash at End of Fiscal Year 417$ 417$ 417$ 417$ 417$
1
GENERAL FUNDS - BUDGET RESULTS & PLANS: FY2008-FY2010Fiscal Year 2008
Actual Fiscal Year 2009
(Base Budget Deficit) Fiscal Year 2010
(Base Budget Deficit) Fiscal Year 2009 Revised Budget
Fiscal Year 2010 Proposed Budget
Cash Basis Surplus (Deficit) equals Budget Basis Surplus (Deficit) minus (plus) Other Cash Uses (Sources) relating to changes in Accounts Payable during the fiscal year.
2 - 12
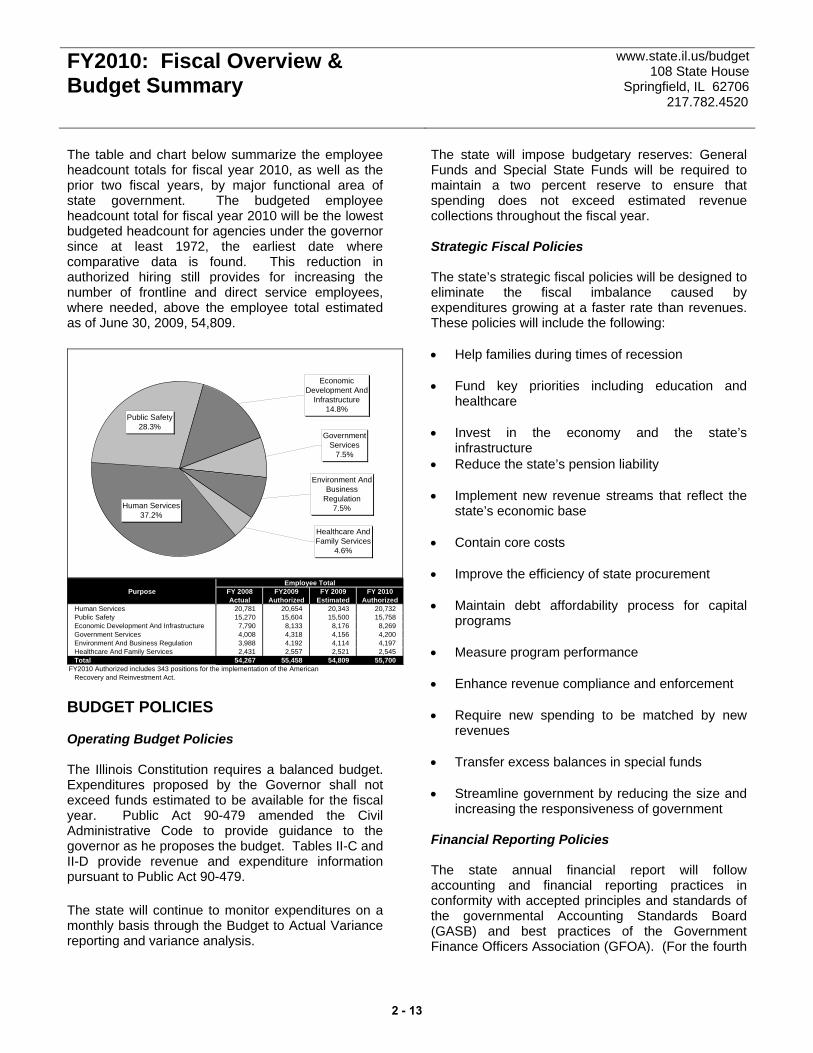
FY2010: Fiscal Overview & Budget Summary
www.state.il.us/budget108 State House
Springfield, IL 62706217.782.4520
The table and chart below summarize the employee headcount totals for fiscal year 2010, as well as the prior two fiscal years, by major functional area of state government. The budgeted employee headcount total for fiscal year 2010 will be the lowest budgeted headcount for agencies under the governor since at least 1972, the earliest date where comparative data is found. This reduction in authorized hiring still provides for increasing the number of frontline and direct service employees, where needed, above the employee total estimated as of June 30, 2009, 54,809.
Human Services37.2%
Public Safety28.3%
Economic Development And
Infrastructure14.8%
Government Services
7.5%
Environment And Business
Regulation7.5%
Healthcare And Family Services
4.6%
Purpose FY 2008 FY2009 FY 2009 FY 2010Actual Authorized Estimated Authorized
Human Services 20,781 20,654 20,343 20,732Public Safety 15,270 15,604 15,500 15,758Economic Development And Infrastructure 7,790 8,133 8,176 8,269Government Services 4,008 4,318 4,156 4,200Environment And Business Regulation 3,988 4,192 4,114 4,197Healthcare And Family Services 2,431 2,557 2,521 2,545Total 54,267 55,458 54,809 55,700
FY2010 Authorized includes 343 positions for the implementation of the AmericanRecovery and Reinvestment Act.
Employee Total
BUDGET POLICIES Operating Budget Policies The Illinois Constitution requires a balanced budget. Expenditures proposed by the Governor shall not exceed funds estimated to be available for the fiscal year. Public Act 90-479 amended the Civil Administrative Code to provide guidance to the governor as he proposes the budget. Tables II-C and II-D provide revenue and expenditure information pursuant to Public Act 90-479. The state will continue to monitor expenditures on a monthly basis through the Budget to Actual Variance reporting and variance analysis.
The state will impose budgetary reserves: General Funds and Special State Funds will be required to maintain a two percent reserve to ensure that spending does not exceed estimated revenue collections throughout the fiscal year. Strategic Fiscal Policies The state’s strategic fiscal policies will be designed to eliminate the fiscal imbalance caused by expenditures growing at a faster rate than revenues. These policies will include the following: • Help families during times of recession • Fund key priorities including education and
healthcare • Invest in the economy and the state’s
infrastructure • Reduce the state’s pension liability • Implement new revenue streams that reflect the
state’s economic base
• Contain core costs • Improve the efficiency of state procurement
• Maintain debt affordability process for capital
programs
• Measure program performance
• Enhance revenue compliance and enforcement
• Require new spending to be matched by new revenues
• Transfer excess balances in special funds • Streamline government by reducing the size and
increasing the responsiveness of government Financial Reporting Policies The state annual financial report will follow accounting and financial reporting practices in conformity with accepted principles and standards of the governmental Accounting Standards Board (GASB) and best practices of the Government Finance Officers Association (GFOA). (For the fourth
2 - 13
FY2010: Fiscal Overview & Budget Summary
www.state.il.us/budget108 State House
Springfield, IL 62706217.782.4520
consecutive year, the state has been awarded the GFOA Distinguished Budget Presentation Award). The state will follow the principles of full disclosure when preparing the Comprehensive Annual Financial Report and official bond statements and emphasize comparability with other state governments, especially the larger, industrial states. Revenue Policies The state will use the Council of Economic Advisors to review key revenue forecasts. The state will use independent national economic consulting firms. The state will utilize various revenue forecasting methodologies including econometric modeling, historical relationships and economic indicator projections. The state will monitor revenues on a daily, semi-monthly, and quarterly basis. Comparisons will be made to both budget and prior year, in order to facilitate a rapid response to changes in economic conditions and fiscal status. Expenditure Policies The state will monitor expenditures on a monthly basis through the Budget to Actual Variance reporting and variance analysis. Operating Expenditure Policy Agencies will prepare Budget to Actual Variance Reports: Actual expenditures will be compared to budget, monthly and quarterly allotments will be made, and significant variances will be analyzed and addressed on a monthly basis by all agencies under the governor. Agencies will prepare Corrective Action Plans: Budget to actual variances of two percent or more from their allotments will require a corrective action plan that will be monitored by the Governor’s Office of Management and Budget. The Governor’s Office of Management and Budget will approve procurement transactions of $1 million or more. The Governor’s Office of Management and Budget will approve all personnel transactions.
Reserve Policy The state will reserve general funds to use for cash management purposes to reduce the need for short term borrowing and provide additional resource to assist the state in meeting its needs. Debt Capacity, Issuance and Debt Service Policies The state will identify new or increased revenues when authorizing additional debt to support capital spending. The state will conduct debt affordability analyses to determine the long-term effects of debt repayment on future operating budgets. The state will not issue long-term debt to support the operating budget Unless otherwise necessary to offset pension liability, state will limit debt service expenditures to no more than seven percent of General Revenue and Road Funds appropriations. Capital Expenditure policy The state will annually forecast and analyze revenues available for capital expenditures. The state will conduct a formal capital planning process to annually rank projects based on specific criteria including life/safety factors, code compliance, infrastructure maintenance, cost benefit analysis and targeted new construction programs. The state will annually evaluate the impact of new capital spending on the Operating Budget. The state will perform facilities management and condition assessments in order to provide information and recommendations for current and future capital expenditures. Pensions The state will continue to implement recommended pension actions that improve the systems’ financial condition and affordability. The state will only approve a proposed increase in pension benefits only if matched by continuing revenue sources.
2 - 14
FY2010: Fiscal Overview & Budget Summary
www.state.il.us/budget108 State House
Springfield, IL 62706217.782.4520
Performance Measures The agencies under the governor will develop performance measures that indicate progress towards the governor’s priorities and each agency’s core mission. The performance measures will focus on outcome measurement in order to assess the impact on the public. The performance measures presented in the budget book will include estimated data for the current year, projected data for the budget year and historical data for the three prior fiscal years.
Legislative Policies Agencies under the governor will submit proposed legislation to the Governor’s Office of Management and Budget to determine the fiscal impact to the budget. All proposed legislation that has a fiscal impact will be accounted for in the governor’s proposed budget. During the course of the legislative session, the Governor’s Office of Management and Budget will prepare balanced budget notes at the request of members of the General Assembly. These notes assess the fiscal impact of proposed legislation on the budget. The Governor’s Office of Management and Budget will review rule change proposals of agencies under the governor to determine their current and fiscal impact on the operating budget. The table below summarizes additional fiscal policies of the state. The state’s fiscal policies are designed to minimize administrative cost and maximize state efficiency.
2 - 15

FY2010: Fiscal Overview & Budget Summary
www.state.il.us/budget108 State House
Springfield, IL 62706217.782.4520
SELECT FINANCIAL POLICIES
State Agency Financial Policy Brief Policy Description
Treasurer’s Office
State Treasurer’s Investment Policy http://www.state.il.us/treas/InsideOffice/invpolicy.htm
The Treasurer’s investment policy calls for investment of all funds in a manner that provides the highest investment return using authorized instruments while meeting the state’s daily cash flow demands. The policy covers the following areas: ethics and conflict of interest; authorized broker/dealers and financial institutions; authorized and suitable investments; investment restrictions; collateralization; diversification; custody and safekeeping; internal controls; limitation of liability; and reporting.
Comptroller’s Office
Statewide Accounting Management System procedures manual (SAMS Manual) ftp://163.191.177.34/ioc-pdf/SAMSManualMaster.pdf
The Comptroller’s SAMS Manual documents the fiscal policies, accounting principles, controls, operating procedures and reporting requirements for the Statewide Accounting Management System. The Manual assists State agencies by indicating the method to be used for processing accounting information between agencies and the Comptroller’ Office.
Governor’s Office of Management and
Budget
Interest Rate Risk Management Policy http://www.state.il.us/budget/Intr_Rate_Policy_October2003Final.pdf
This policy establishes the purposes and procedures by which the State may enter into an exchange contract or issue direct variable rate debt. The policy covers the following areas: definition of variable interest rate position; purposes of interest rate exchange contracts; risk assessment; form and legality of agreement; qualified counterparties and collateral provisions; counterparty aggregate position limits; liquidity facility; monitoring and reporting; and terms of policy review.
Central Management Services
Standard Procurement Rules http://www.state.il.us/cms/download/pdfs/sel_rule.pdf
All qualified vendors are invited to participate in bidding on the wide variety of commodities and equipment purchased by the state. The Department of Central Management Services is authorized by law to buy commodities and equipment for state agencies and elected officials. The state’s procurement rules establish standards for procurement authority, bid thresholds, bid publication, bid security, duration of contracts, contract pricing, preferences, ethics, protests, supply management and governmental joint purchasing.
Comptroller’s Office
Budget Stabilization Fund (30 ILCS 122/1) http://www.ilga.gov/legislation/ilcs/ilcs.asp
Funds are reserved for use in the cash management of the General Revenue Fund, thus reducing the need for short term borrowing and serving to provide additional resources to assist the state in meeting its needs. The priority for the use of these funds include secondary and elementary education, child care and other programs that may provide a direct benefit to children.
2 - 16

FY2010: Fiscal Overview & Budget Summary
www.state.il.us/budget108 State House
Springfield, IL 62706217.782.4520
THE BUDGET PROCESS The Illinois Constitution requires the governor to prepare and present a State budget recommendation for the state to the General Assembly. The Constitution also requires that the proposed budget be balanced and include recommended spending levels for state agencies, estimated funds available from tax collections and other sources, and state debt and liabilities. The Governor’s Office of Management and Budget (GOMB) estimates revenues in consultation with the Department of Revenue and GOMB subsequently develops budget recommendations that reflect the governor’s programmatic and spending priorities. Planning: September through January Planning for the next fiscal year begins each fall. During the planning phase, the following activities occur:
• Agencies work with GOMB and the Governor’s
Office to refine strategic priorities, develop initiatives to achieve those priorities, and evaluate actual performance compared to benchmarks from comparable states or other peer entities;
• GOMB and agency staff identify and estimate
potential spending for the coming fiscal year, including both the costs of current and potential programs and the value of expansion, modification or elimination of various programs;
• Working with the Council of Economic Advisors,
GOMB and the Department of Revenue review economic forecasts and make preliminary revenue estimates;
• GOMB, the Department of Central Management
Services and agencies review statewide trends and administrative processes to find and reduce inefficiencies and propose reallocation of resources to improve efficiency and promote better government;
• Based on targets, assumptions and materials
provided to agencies by GOMB, agencies prepare, and GOMB reviews, preliminary budget materials;
• GOMB, the Governor’s Office and agencies meet to review and discuss available revenue, anticipated spending and program priorities to develop budgets that reflect the core priorities of the agency;
• Periodically, GOMB reviews revenue and
spending estimates, resulting in review and reprioritization of agency and state priorities;
• When final budget options are developed, they
are presented to the governor for review and approval before they are drafted in legislative form. GOMB then produces the budget book, a narrative explaining the budget and providing complete budget table forms;
• The governor announces and describes the
budget in the annual Budget Address; and • GOMB drafts appropriation bills to implement the
governor’s budget recommendations. Legislative Deliberation: February through May After the Governor’s Budget Address in February, legislative review of the governor’s budget recommendations begins almost immediately with hearings before House and Senate appropriation committees. During this period, the following activities occur: • Appropriation committees may adopt
amendments to change the funding level recommended by the Governor;
• Once passed by the first committee, an
appropriation bill moves to the full House or Senate for consideration, amendment and a vote. Following passage in the first legislative chamber, the appropriation bill moves to the second chamber, where a similar process takes place. Changes made in either chamber must ultimately be accepted in identical form by both chambers for the bill to pass and be presented to the governor;
• As the budget moves through the legislature,
GOMB monitors any amendments as well as substantive legislation to identify potential fiscal impacts;
2 - 17
FY2010: Fiscal Overview & Budget Summary
www.state.il.us/budget108 State House
Springfield, IL 62706217.782.4520
• By statute, and if requested, any proposed
amendments to the budget and any substantive legislation with fiscal or revenue impacts must be accompanied by a fiscal note to describe such impacts; and
• Final approval of the budget usually occurs at the
end of the legislative session, typically by the end of May. The Illinois Constitution requires a simple majority vote of the General Assembly for a bill passed on or before May 31 to take effect immediately. On or after June 1, a three-fifths super majority vote of the General Assembly is required in order for a bill to take effect for the upcoming fiscal year.
Gubernatorial Review: Following end of Legislative Session Once the General Assembly passes the budget, the governor must sign appropriation bills before funds
can be spent. If the Governor chooses not to approve a specific appropriation, he may either veto a specific line item or reduce it. The rest of the appropriation bill is unaffected by these vetoes and becomes effective. Line items that have been vetoed or reduced must be reconsidered by the General Assembly during the fall session. The General Assembly may return an item to the enacted level by simple majority vote in both chambers in the case of a reduction veto and by a three-fifths super majority vote in the case of a line item veto. If additional resources beyond those initially approved in the budget become necessary, a supplemental appropriation bill may be passed any time the General Assembly is in session. Please refer to Table I-B for current supplemental appropriation bills being considered for spring 2010.
2 - 18

SUMMARY TABLES
www.state.il.us/budget
Table I-A Operating Appropriations by Agency – All FundsSummarizes each agency’s general funds, other state funds, federal funds and total appropriations for fiscal years 2008, 2009, and 2010. The footnotes to Table I-A explain the various transfers of functions and funds related to agency reorganizations and program changes.
Table I-B: Supplementals to Complete Fiscal Year 2009 Lists of the Governor’s recommended supplemental appropriations for fiscal year 2010 as of February 18, 2009.
Table II-A: Revenues by Source – All Appropriated FundsSummarizes, by source, all appropriated state revenues for four fiscal years.
Table II-B: Revenues by Source – General FundsSummarizes, by source, all revenues deposited into the state’s general funds for four fiscal years.
Table II-C: Budgeted Funds Revenues – GAAP BasisBudgeted funds revenues prepared in accordance with Public Act 90-479 for fiscal year 2010.
Table II-D: Budgeted Funds Expenditures – GAAP BasisBudgeted funds expenditures prepared in accordance with Public Act 90-479 for fiscal year 2010.
Table III-A: Road FundProvides a summary of the receipts into the Road Fund and allocations from the fund to various state agencies for four fiscal years.
Table III-B: Motor Fuel Tax – State FundsSummarizes the receipts into the Motor Fuel Tax Fund and distributions from the fund for four fiscal years.
Table IV-A: Appropriated Operating Funds by Fund Group for Fiscal Year 2010Summarizes, by fund group, the appropriated funds and projected operating cash flow for fiscal year 2010.
Table IV-B: Appropriated Operating Funds by Fund for Fiscal Year 2010Lists all appropriated funds and describes each fund’s projected operating cash flow for fiscal year 2010.

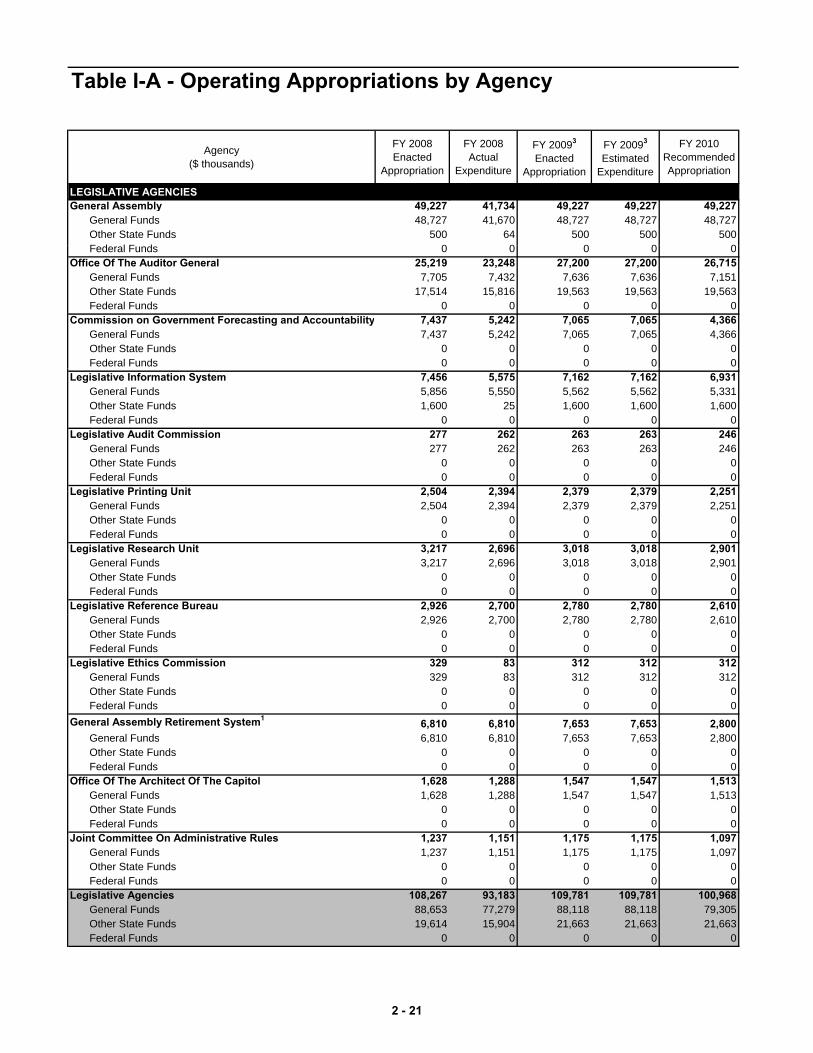
Table I-A - Operating Appropriations by Agency
Agency($ thousands)
FY 2008 Enacted
Appropriation
FY 2008 Actual
Expenditure
FY 20093
Enacted Appropriation
FY 20093
Estimated Expenditure
FY 2010 Recommended Appropriation
LEGISLATIVE AGENCIESGeneral Assembly 49,227 41,734 49,227 49,227 49,227
General Funds 48,727 41,670 48,727 48,727 48,727Other State Funds 500 64 500 500 500F d l F d 0 0 0 0 0Federal Funds 0 0 0 0 0
Office Of The Auditor General 25,219 23,248 27,200 27,200 26,715General Funds 7,705 7,432 7,636 7,636 7,151Other State Funds 17,514 15,816 19,563 19,563 19,563Federal Funds 0 0 0 0 0
Commission on Government Forecasting and Accountability 7,437 5,242 7,065 7,065 4,366General Funds 7,437 5,242 7,065 7,065 4,366Other State Funds 0 0 0 0 0Federal Funds 0 0 0 0 0
Legislative Information System 7,456 5,575 7,162 7,162 6,931General Funds 5,856 5,550 5,562 5,562 5,331Other State Funds 1,600 25 1,600 1,600 1,600Federal Funds 0 0 0 0 0
Legislative Audit Commission 277 262 263 263 246General Funds 277 262 263 263 246Other State Funds 0 0 0 0 0Federal Funds 0 0 0 0 0
Legislative Printing Unit 2 504 2 394 2 379 2 379 2 251Legislative Printing Unit 2,504 2,394 2,379 2,379 2,251General Funds 2,504 2,394 2,379 2,379 2,251Other State Funds 0 0 0 0 0Federal Funds 0 0 0 0 0
Legislative Research Unit 3,217 2,696 3,018 3,018 2,901General Funds 3,217 2,696 3,018 3,018 2,901Other State Funds 0 0 0 0 0Federal Funds 0 0 0 0 0
Legislative Reference Bureau 2,926 2,700 2,780 2,780 2,610General Funds 2,926 2,700 2,780 2,780 2,610Other State Funds 0 0 0 0 0Federal Funds 0 0 0 0 0
Legislative Ethics Commission 329 83 312 312 312General Funds 329 83 312 312 312Other State Funds 0 0 0 0 0Federal Funds 0 0 0 0 0
General Assembly Retirement System1 6,810 6,810 7,653 7,653 2,800General Funds 6 810 6 810 7 653 7 653 2 800General Funds 6,810 6,810 7,653 7,653 2,800Other State Funds 0 0 0 0 0Federal Funds 0 0 0 0 0
Office Of The Architect Of The Capitol 1,628 1,288 1,547 1,547 1,513General Funds 1,628 1,288 1,547 1,547 1,513Other State Funds 0 0 0 0 0Federal Funds 0 0 0 0 0
Joint Committee On Administrative Rules 1,237 1,151 1,175 1,175 1,097General Funds 1,237 1,151 1,175 1,175 1,097Other State Funds 0 0 0 0 0Federal Funds 0 0 0 0 0
Legislative Agencies 108,267 93,183 109,781 109,781 100,968General Funds 88,653 77,279 88,118 88,118 79,305Other State Funds 19,614 15,904 21,663 21,663 21,663Federal Funds 0 0 0 0 0
2 - 21
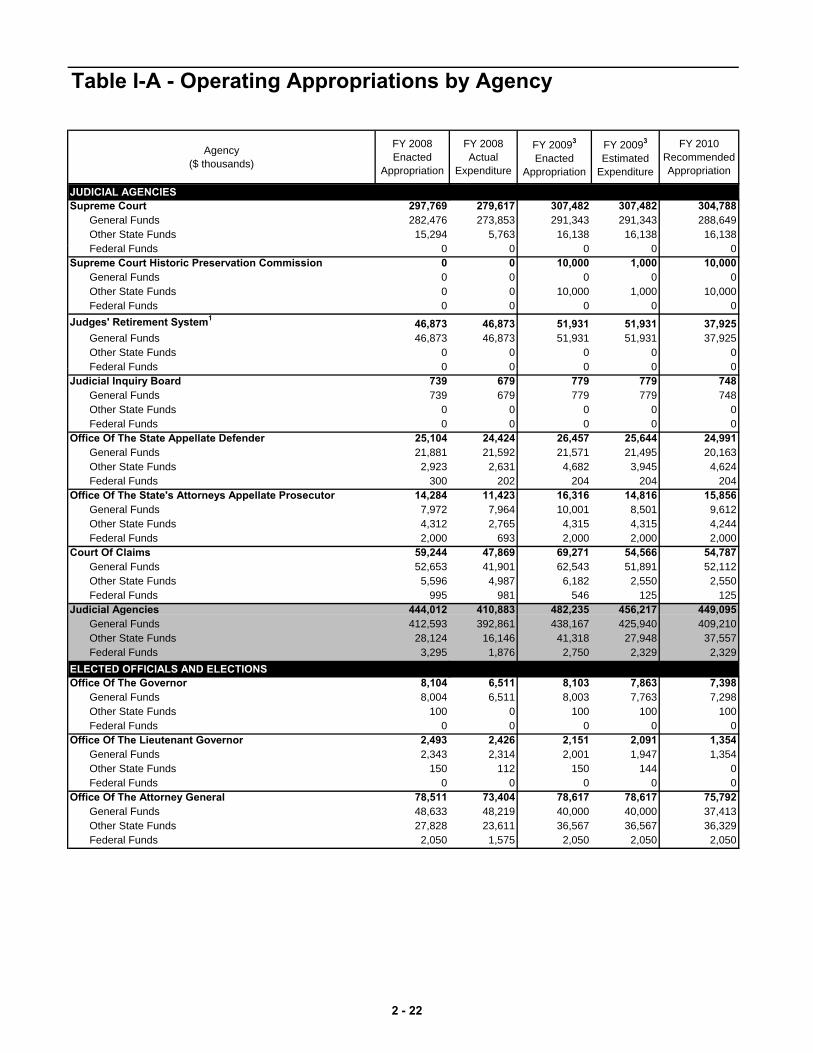
Table I-A - Operating Appropriations by Agency
Agency($ thousands)
FY 2008 Enacted
Appropriation
FY 2008 Actual
Expenditure
FY 20093
Enacted Appropriation
FY 20093
Estimated Expenditure
FY 2010 Recommended Appropriation
JUDICIAL AGENCIESSupreme Court 297,769 279,617 307,482 307,482 304,788
General Funds 282,476 273,853 291,343 291,343 288,649Other State Funds 15,294 5,763 16,138 16,138 16,138F d l F d 0 0 0 0 0Federal Funds 0 0 0 0 0
Supreme Court Historic Preservation Commission 0 0 10,000 1,000 10,000General Funds 0 0 0 0 0Other State Funds 0 0 10,000 1,000 10,000Federal Funds 0 0 0 0 0
Judges' Retirement System1 46,873 46,873 51,931 51,931 37,925General Funds 46,873 46,873 51,931 51,931 37,925Other State Funds 0 0 0 0 0Federal Funds 0 0 0 0 0Federal Funds 0 0 0 0 0
Judicial Inquiry Board 739 679 779 779 748General Funds 739 679 779 779 748Other State Funds 0 0 0 0 0Federal Funds 0 0 0 0 0
Office Of The State Appellate Defender 25,104 24,424 26,457 25,644 24,991General Funds 21,881 21,592 21,571 21,495 20,163Other State Funds 2,923 2,631 4,682 3,945 4,624Federal Funds 300 202 204 204 204
Offi Of Th St t ' Att A ll t P t 14 284 11 423 16 316 14 816 15 856Office Of The State's Attorneys Appellate Prosecutor 14,284 11,423 16,316 14,816 15,856General Funds 7,972 7,964 10,001 8,501 9,612Other State Funds 4,312 2,765 4,315 4,315 4,244Federal Funds 2,000 693 2,000 2,000 2,000
Court Of Claims 59,244 47,869 69,271 54,566 54,787General Funds 52,653 41,901 62,543 51,891 52,112Other State Funds 5,596 4,987 6,182 2,550 2,550Federal Funds 995 981 546 125 125
Judicial Agencies 444,012 410,883 482,235 456,217 449,095gGeneral Funds 412,593 392,861 438,167 425,940 409,210Other State Funds 28,124 16,146 41,318 27,948 37,557Federal Funds 3,295 1,876 2,750 2,329 2,329
ELECTED OFFICIALS AND ELECTIONSOffice Of The Governor 8,104 6,511 8,103 7,863 7,398
General Funds 8,004 6,511 8,003 7,763 7,298Other State Funds 100 0 100 100 100Federal Funds 0 0 0 0 0
Office Of The Lie tenant Go ernor 2 493 2 426 2 151 2 091 1 354Office Of The Lieutenant Governor 2,493 2,426 2,151 2,091 1,354General Funds 2,343 2,314 2,001 1,947 1,354Other State Funds 150 112 150 144 0Federal Funds 0 0 0 0 0
Office Of The Attorney General 78,511 73,404 78,617 78,617 75,792General Funds 48,633 48,219 40,000 40,000 37,413Other State Funds 27,828 23,611 36,567 36,567 36,329Federal Funds 2,050 1,575 2,050 2,050 2,050
2 - 22

Table I-A - Operating Appropriations by Agency
Agency($ thousands)
FY 2008 Enacted
Appropriation
FY 2008 Actual
Expenditure
FY 20093
Enacted Appropriation
FY 20093
Estimated Expenditure
FY 2010 Recommended Appropriation
Office Of The Secretary Of State 398,902 366,326 407,896 406,896 390,239General Funds 143,554 142,791 138,504 138,504 130,982Other State Funds 247,248 216,912 260,892 259,892 250,758Federal Funds 8,100 6,623 8,500 8,500 8,500
Office Of The State Comptroller 111 898 101 873 112 887 112 887 106 548Office Of The State Comptroller 111,898 101,873 112,887 112,887 106,548General Funds 109,799 100,155 110,756 110,756 104,476Other State Funds 1,750 1,424 1,766 1,766 1,762Federal Funds 350 294 366 366 311
Office Of The State Treasurer 1,827,969 1,752,018 1,791,477 1,791,477 1,792,347General Funds 23,673 19,145 19,659 19,659 19,208Other State Funds 1,804,296 1,732,873 1,771,818 1,771,818 1,773,139Federal Funds 0 0 0 0 0
State Board Of Elections 67,190 15,097 51,825 25,205 51,517General Funds 8,390 7,896 18,899 18,879 18,591Other State Funds 58,800 7,201 32,926 6,326 32,926Federal Funds 0 0 0 0 0
Elected Officials And Elections 2,495,066 2,317,655 2,452,955 2,425,035 2,425,195General Funds 344,395 327,030 337,822 337,508 319,321Other State Funds 2,140,171 1,982,132 2,104,218 2,076,612 2,095,013Federal Funds 10,500 8,492 10,916 10,916 10,861
GOVERNOR'S AGENCIES 2D t t O A i 541 018 525 276 622 203 693 180 709 939Department On Aging 541,018 525,276 622,203 693,180 709,939
General Funds 459,741 457,814 538,536 610,809 620,282Other State Funds 8,136 8,057 9,136 9,136 9,436Federal Funds 73,141 59,404 74,531 73,235 80,221
Department Of Agriculture 117,397 104,387 110,918 102,234 109,210General Funds 49,219 46,354 41,859 40,582 39,124Other State Funds 51,675 48,986 52,304 50,289 55,588Federal Funds 16,502 9,047 16,756 11,363 14,498
Department Of Central Management Services 960,120 796,277 935,511 816,225 952,907p gGeneral Funds 83,920 81,873 75,653 73,839 75,040Other State Funds 876,200 714,403 859,858 742,386 877,867Federal Funds 0 0 0 0 0
Department Of Children And Family Services 1,337,733 1,270,019 1,328,121 1,316,066 1,337,751General Funds 896,822 887,022 864,986 863,255 899,308Other State Funds 432,099 378,515 455,067 446,311 430,376Federal Funds 8,811 4,483 8,068 6,500 8,068
Department Of Commerce And Economic Opportunity 1,137,325 676,089 1,109,984 865,420 2,456,990General Funds 123 407 102 243 62 667 55 522 55 217General Funds 123,407 102,243 62,667 55,522 55,217Other State Funds 246,931 187,758 259,622 229,210 253,851Federal Funds 766,987 386,088 787,695 580,689 2,147,922
Department Of Natural Resources 245,254 193,280 239,319 210,660 274,626General Funds 81,922 76,320 63,170 62,801 68,514Other State Funds 149,000 108,518 162,691 134,401 188,666Federal Funds 14,332 8,442 13,458 13,458 17,447
Department Of Juvenile Justice 139,335 124,989 139,371 131,211 141,707General Funds 126,335 119,649 126,371 122,580 124,707, , , , ,Other State Funds 13,000 5,340 13,000 8,631 17,000Federal Funds 0 0 0 0 0
2 - 23

Table I-A - Operating Appropriations by Agency
Agency($ thousands)
FY 2008 Enacted
Appropriation
FY 2008 Actual
Expenditure
FY 20093
Enacted Appropriation
FY 20093
Estimated Expenditure
FY 2010 Recommended Appropriation
Department Of Corrections 1,343,065 1,289,598 1,436,265 1,377,515 1,370,647General Funds 1,236,282 1,208,474 1,328,357 1,309,901 1,244,185Other State Funds 106,783 81,124 107,908 67,614 126,462Federal Funds 0 0 0 0 0
Department Of Employment Security 288 840 217 760 281 202 284 484 310 456Department Of Employment Security 288,840 217,760 281,202 284,484 310,456General Funds 15,121 13,471 14,243 14,243 13,815Other State Funds 1,917 1,900 1,917 1,917 1,917Federal Funds 271,802 202,389 265,042 268,325 294,724
Department Of Financial And Professional Regulation 84,552 74,579 85,532 82,840 78,759General Funds 0 0 0 0 0Other State Funds 84,552 74,579 85,532 82,840 78,759Federal Funds 0 0 0 0 0
Department Of Human Rights 12,503 11,745 12,597 12,303 12,091General Funds 9,748 9,731 9,822 9,527 9,424Other State Funds 0 0 0 0 0Federal Funds 2,755 2,014 2,775 2,775 2,667
Department Of Human Services 5,614,948 5,209,853 5,823,652 5,732,468 6,082,226General Funds 4,135,137 4,086,486 4,208,861 4,117,677 4,163,532Other State Funds 380,217 320,976 503,658 503,658 557,923Federal Funds 1,099,594 802,391 1,111,134 1,111,134 1,360,771
Illinois Power Agency 1,250 0 1,250 0 5,100General Funds 1 250 0 1 250 0 0General Funds 1,250 0 1,250 0 0Other State Funds 0 0 0 0 5,100Federal Funds 0 0 0 0 0
Department Of Insurance4 22,288 18,748 22,206 21,690 20,745General Funds 0 0 0 0 0Other State Funds 21,488 18,205 21,406 21,066 19,945Federal Funds 800 542 800 624 800
Department Of Labor 7,470 7,069 7,215 6,779 8,218General Funds 7,270 6,872 6,815 6,379 6,318Other State Funds 200 197 400 400 400Federal Funds 0 0 0 0 1,500
Department Of Military Affairs 48,842 34,224 52,634 53,062 52,176General Funds 15,112 14,119 19,051 19,479 17,785Other State Funds 6,432 1,131 6,432 6,432 6,432Federal Funds 27,298 18,974 27,151 27,151 27,959
Department Of Healthcare And Family Services 14,361,290 13,053,063 13,361,583 12,716,655 14,599,802General Funds 7,062,339 7,033,824 7,090,360 6,875,982 7,734,168Other State Funds 7 098 952 5 894 105 6 071 224 5 640 673 6 665 634Other State Funds 7,098,952 5,894,105 6,071,224 5,640,673 6,665,634Federal Funds 200,000 125,134 200,000 200,000 200,000
Department Of Healthcare And Family Services Group Ins. 3,073,992 2,975,924 3,078,429 2,925,807 3,254,320General Funds 1,055,038 1,055,038 1,057,891 1,026,154 1,059,918Other State Funds 2,018,955 1,920,887 2,020,538 1,899,653 2,194,403Federal Funds 0 0 0 0 0
Department Of Public Health 431,325 356,274 445,006 433,660 464,895General Funds 159,624 152,409 160,422 154,001 150,296Other State Funds 83,531 66,745 96,156 93,332 102,816F d l F d 188 170 137 120 188 428 186 328 211 784Federal Funds 188,170 137,120 188,428 186,328 211,784
2 - 24
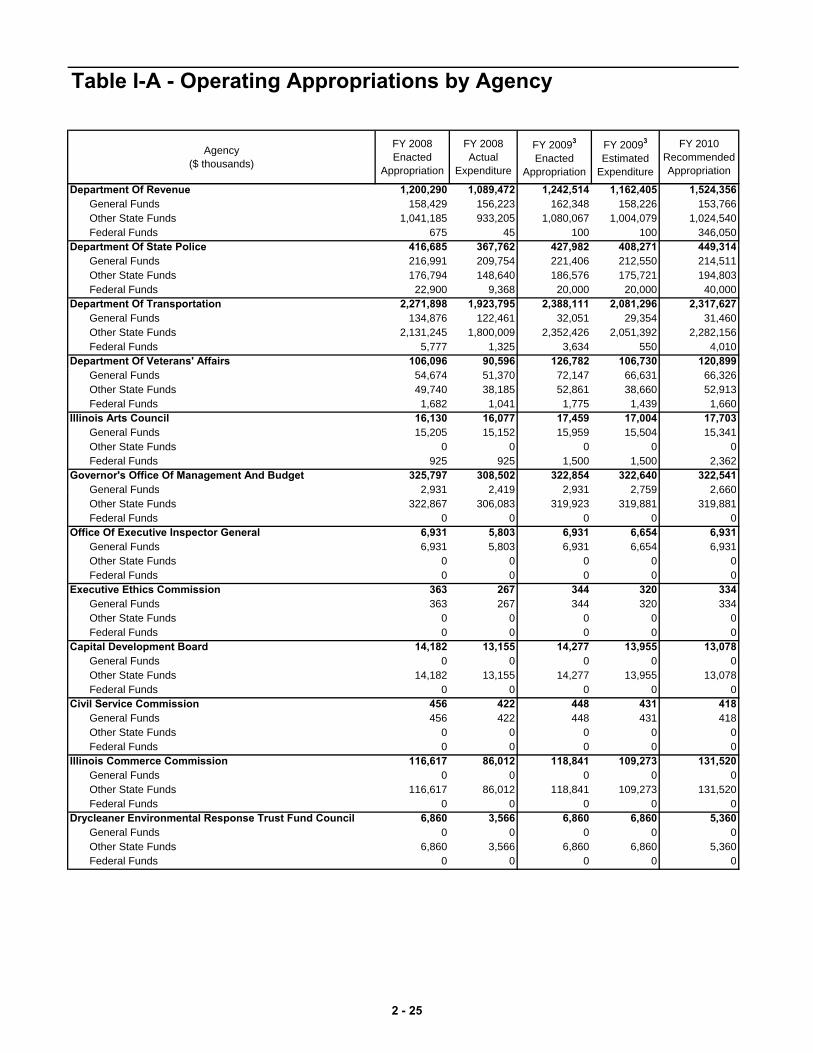
Table I-A - Operating Appropriations by Agency
Agency($ thousands)
FY 2008 Enacted
Appropriation
FY 2008 Actual
Expenditure
FY 20093
Enacted Appropriation
FY 20093
Estimated Expenditure
FY 2010 Recommended Appropriation
Department Of Revenue 1,200,290 1,089,472 1,242,514 1,162,405 1,524,356General Funds 158,429 156,223 162,348 158,226 153,766Other State Funds 1,041,185 933,205 1,080,067 1,004,079 1,024,540Federal Funds 675 45 100 100 346,050
Department Of State Police 416 685 367 762 427 982 408 271 449 314Department Of State Police 416,685 367,762 427,982 408,271 449,314General Funds 216,991 209,754 221,406 212,550 214,511Other State Funds 176,794 148,640 186,576 175,721 194,803Federal Funds 22,900 9,368 20,000 20,000 40,000
Department Of Transportation 2,271,898 1,923,795 2,388,111 2,081,296 2,317,627General Funds 134,876 122,461 32,051 29,354 31,460Other State Funds 2,131,245 1,800,009 2,352,426 2,051,392 2,282,156Federal Funds 5,777 1,325 3,634 550 4,010
Department Of Veterans' Affairs 106,096 90,596 126,782 106,730 120,899General Funds 54,674 51,370 72,147 66,631 66,326Other State Funds 49,740 38,185 52,861 38,660 52,913Federal Funds 1,682 1,041 1,775 1,439 1,660
Illinois Arts Council 16,130 16,077 17,459 17,004 17,703General Funds 15,205 15,152 15,959 15,504 15,341Other State Funds 0 0 0 0 0Federal Funds 925 925 1,500 1,500 2,362
Governor's Office Of Management And Budget 325,797 308,502 322,854 322,640 322,541General Funds 2 931 2 419 2 931 2 759 2 660General Funds 2,931 2,419 2,931 2,759 2,660Other State Funds 322,867 306,083 319,923 319,881 319,881Federal Funds 0 0 0 0 0
Office Of Executive Inspector General 6,931 5,803 6,931 6,654 6,931General Funds 6,931 5,803 6,931 6,654 6,931Other State Funds 0 0 0 0 0Federal Funds 0 0 0 0 0
Executive Ethics Commission 363 267 344 320 334General Funds 363 267 344 320 334Oth St t F d 0 0 0 0 0Other State Funds 0 0 0 0 0Federal Funds 0 0 0 0 0
Capital Development Board 14,182 13,155 14,277 13,955 13,078General Funds 0 0 0 0 0Other State Funds 14,182 13,155 14,277 13,955 13,078Federal Funds 0 0 0 0 0
Civil Service Commission 456 422 448 431 418General Funds 456 422 448 431 418Other State Funds 0 0 0 0 0Federal Funds 0 0 0 0 0
Illinois Commerce Commission 116,617 86,012 118,841 109,273 131,520General Funds 0 0 0 0 0Other State Funds 116,617 86,012 118,841 109,273 131,520Federal Funds 0 0 0 0 0
Drycleaner Environmental Response Trust Fund Council 6,860 3,566 6,860 6,860 5,360General Funds 0 0 0 0 0Other State Funds 6,860 3,566 6,860 6,860 5,360Federal Funds 0 0 0 0 0Federal Funds 0 0 0 0 0
2 - 25
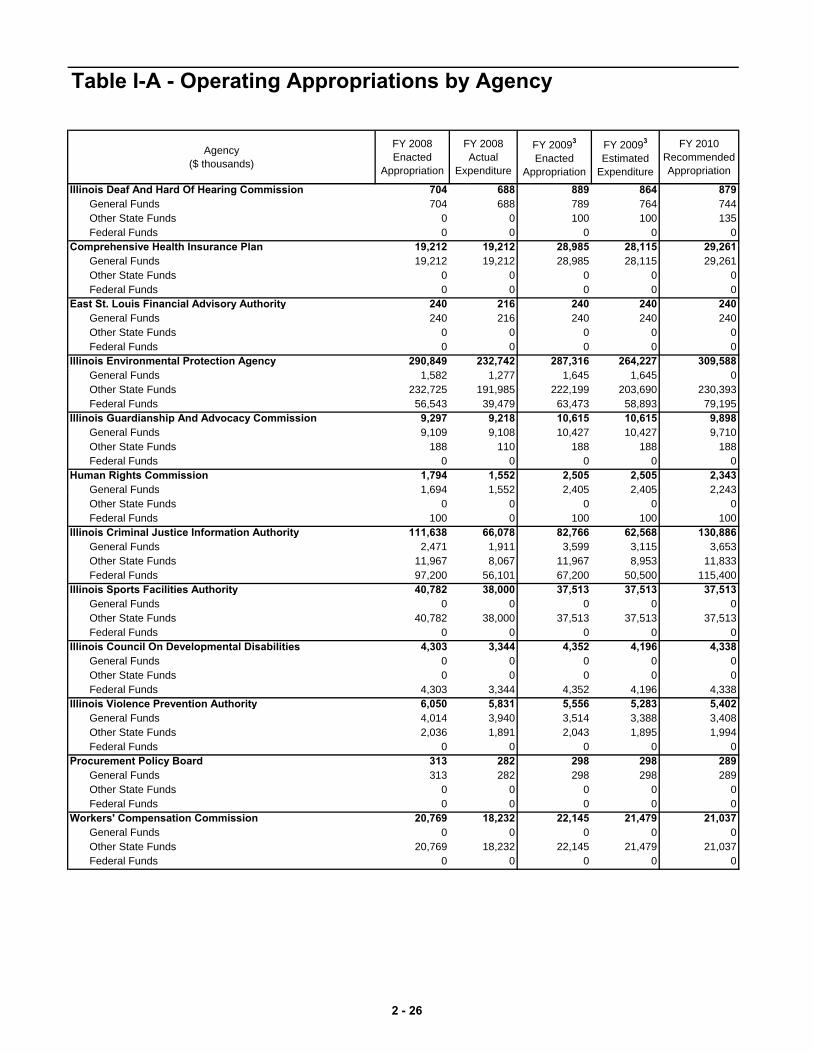
Table I-A - Operating Appropriations by Agency
Agency($ thousands)
FY 2008 Enacted
Appropriation
FY 2008 Actual
Expenditure
FY 20093
Enacted Appropriation
FY 20093
Estimated Expenditure
FY 2010 Recommended Appropriation
Illinois Deaf And Hard Of Hearing Commission 704 688 889 864 879General Funds 704 688 789 764 744Other State Funds 0 0 100 100 135Federal Funds 0 0 0 0 0
Comprehensive Health Insurance Plan 19 212 19 212 28 985 28 115 29 261Comprehensive Health Insurance Plan 19,212 19,212 28,985 28,115 29,261General Funds 19,212 19,212 28,985 28,115 29,261Other State Funds 0 0 0 0 0Federal Funds 0 0 0 0 0
East St. Louis Financial Advisory Authority 240 216 240 240 240General Funds 240 216 240 240 240Other State Funds 0 0 0 0 0Federal Funds 0 0 0 0 0
Illinois Environmental Protection Agency 290,849 232,742 287,316 264,227 309,588General Funds 1,582 1,277 1,645 1,645 0Other State Funds 232,725 191,985 222,199 203,690 230,393Federal Funds 56,543 39,479 63,473 58,893 79,195
Illinois Guardianship And Advocacy Commission 9,297 9,218 10,615 10,615 9,898General Funds 9,109 9,108 10,427 10,427 9,710Other State Funds 188 110 188 188 188Federal Funds 0 0 0 0 0
Human Rights Commission 1,794 1,552 2,505 2,505 2,343General Funds 1 694 1 552 2 405 2 405 2 243General Funds 1,694 1,552 2,405 2,405 2,243Other State Funds 0 0 0 0 0Federal Funds 100 0 100 100 100
Illinois Criminal Justice Information Authority 111,638 66,078 82,766 62,568 130,886General Funds 2,471 1,911 3,599 3,115 3,653Other State Funds 11,967 8,067 11,967 8,953 11,833Federal Funds 97,200 56,101 67,200 50,500 115,400
Illinois Sports Facilities Authority 40,782 38,000 37,513 37,513 37,513General Funds 0 0 0 0 0Oth St t F d 40 782 38 000 37 513 37 513 37 513Other State Funds 40,782 38,000 37,513 37,513 37,513Federal Funds 0 0 0 0 0
Illinois Council On Developmental Disabilities 4,303 3,344 4,352 4,196 4,338General Funds 0 0 0 0 0Other State Funds 0 0 0 0 0Federal Funds 4,303 3,344 4,352 4,196 4,338
Illinois Violence Prevention Authority 6,050 5,831 5,556 5,283 5,402General Funds 4,014 3,940 3,514 3,388 3,408Other State Funds 2,036 1,891 2,043 1,895 1,994Federal Funds 0 0 0 0 0
Procurement Policy Board 313 282 298 298 289General Funds 313 282 298 298 289Other State Funds 0 0 0 0 0Federal Funds 0 0 0 0 0
Workers' Compensation Commission 20,769 18,232 22,145 21,479 21,037General Funds 0 0 0 0 0Other State Funds 20,769 18,232 22,145 21,479 21,037Federal Funds 0 0 0 0 0Federal Funds 0 0 0 0 0
2 - 26
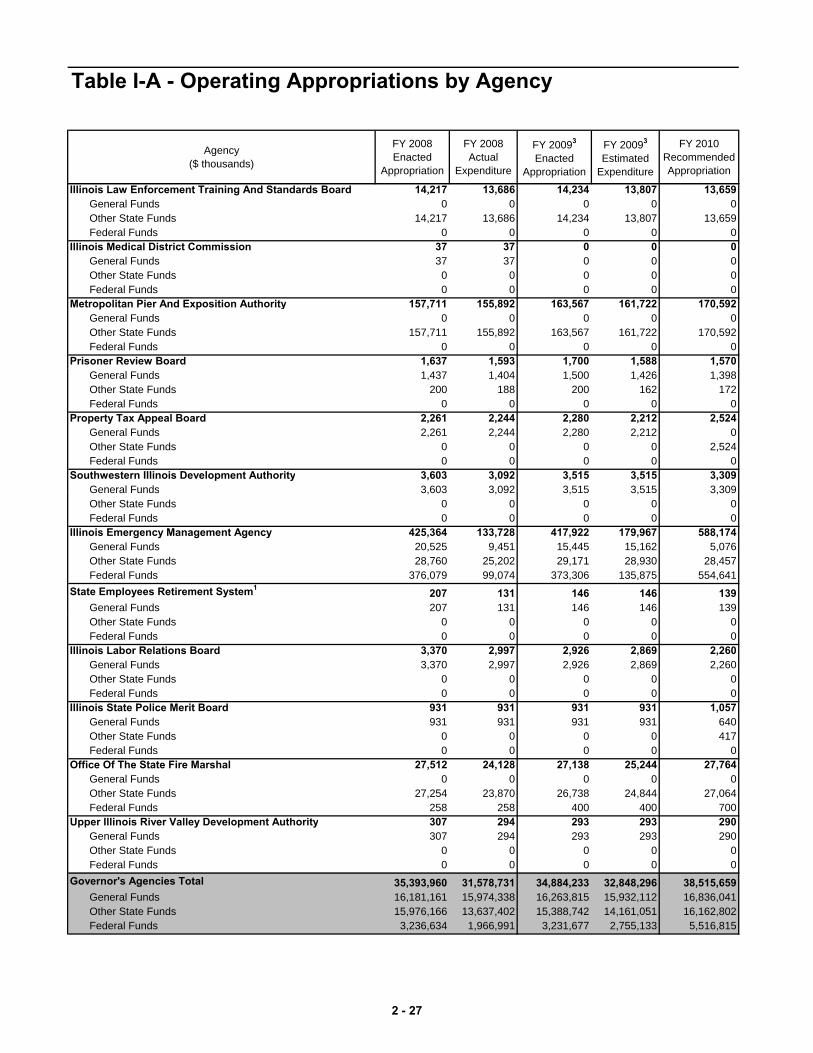
Table I-A - Operating Appropriations by Agency
Agency($ thousands)
FY 2008 Enacted
Appropriation
FY 2008 Actual
Expenditure
FY 20093
Enacted Appropriation
FY 20093
Estimated Expenditure
FY 2010 Recommended Appropriation
Illinois Law Enforcement Training And Standards Board 14,217 13,686 14,234 13,807 13,659General Funds 0 0 0 0 0Other State Funds 14,217 13,686 14,234 13,807 13,659Federal Funds 0 0 0 0 0
Illinois Medical District Commission 37 37 0 0 0Illinois Medical District Commission 37 37 0 0 0General Funds 37 37 0 0 0Other State Funds 0 0 0 0 0Federal Funds 0 0 0 0 0
Metropolitan Pier And Exposition Authority 157,711 155,892 163,567 161,722 170,592General Funds 0 0 0 0 0Other State Funds 157,711 155,892 163,567 161,722 170,592Federal Funds 0 0 0 0 0
Prisoner Review Board 1,637 1,593 1,700 1,588 1,570General Funds 1,437 1,404 1,500 1,426 1,398Other State Funds 200 188 200 162 172Federal Funds 0 0 0 0 0
Property Tax Appeal Board 2,261 2,244 2,280 2,212 2,524General Funds 2,261 2,244 2,280 2,212 0Other State Funds 0 0 0 0 2,524Federal Funds 0 0 0 0 0
Southwestern Illinois Development Authority 3,603 3,092 3,515 3,515 3,309General Funds 3 603 3 092 3 515 3 515 3 309General Funds 3,603 3,092 3,515 3,515 3,309Other State Funds 0 0 0 0 0Federal Funds 0 0 0 0 0
Illinois Emergency Management Agency 425,364 133,728 417,922 179,967 588,174General Funds 20,525 9,451 15,445 15,162 5,076Other State Funds 28,760 25,202 29,171 28,930 28,457Federal Funds 376,079 99,074 373,306 135,875 554,641
State Employees Retirement System1 207 131 146 146 139General Funds 207 131 146 146 139Other State Funds 0 0 0 0 0Federal Funds 0 0 0 0 0
Illinois Labor Relations Board 3,370 2,997 2,926 2,869 2,260General Funds 3,370 2,997 2,926 2,869 2,260Other State Funds 0 0 0 0 0Federal Funds 0 0 0 0 0
Illinois State Police Merit Board 931 931 931 931 1,057General Funds 931 931 931 931 640Other State Funds 0 0 0 0 417Other State Funds 0 0 0 0 417Federal Funds 0 0 0 0 0
Office Of The State Fire Marshal 27,512 24,128 27,138 25,244 27,764General Funds 0 0 0 0 0Other State Funds 27,254 23,870 26,738 24,844 27,064Federal Funds 258 258 400 400 700
Upper Illinois River Valley Development Authority 307 294 293 293 290General Funds 307 294 293 293 290Other State Funds 0 0 0 0 0F d l F d 0 0 0 0 0Federal Funds 0 0 0 0 0
Governor's Agencies Total 35,393,960 31,578,731 34,884,233 32,848,296 38,515,659General Funds 16,181,161 15,974,338 16,263,815 15,932,112 16,836,041Other State Funds 15,976,166 13,637,402 15,388,742 14,161,051 16,162,802Federal Funds 3,236,634 1,966,991 3,231,677 2,755,133 5,516,815
2 - 27
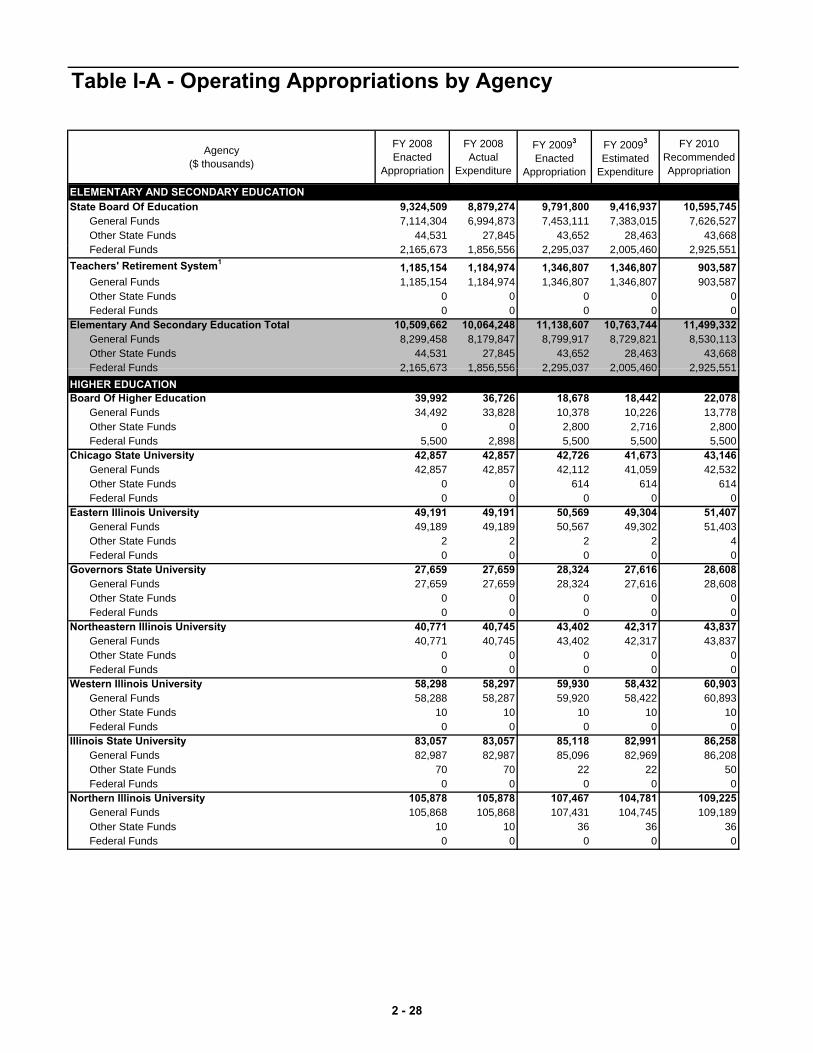
Table I-A - Operating Appropriations by Agency
Agency($ thousands)
FY 2008 Enacted
Appropriation
FY 2008 Actual
Expenditure
FY 20093
Enacted Appropriation
FY 20093
Estimated Expenditure
FY 2010 Recommended Appropriation
ELEMENTARY AND SECONDARY EDUCATIONState Board Of Education 9,324,509 8,879,274 9,791,800 9,416,937 10,595,745
General Funds 7,114,304 6,994,873 7,453,111 7,383,015 7,626,527Other State Funds 44,531 27,845 43,652 28,463 43,668F d l F d 2 165 673 1 856 556 2 295 037 2 005 460 2 925 551Federal Funds 2,165,673 1,856,556 2,295,037 2,005,460 2,925,551
Teachers' Retirement System1 1,185,154 1,184,974 1,346,807 1,346,807 903,587General Funds 1,185,154 1,184,974 1,346,807 1,346,807 903,587Other State Funds 0 0 0 0 0Federal Funds 0 0 0 0 0
Elementary And Secondary Education Total 10,509,662 10,064,248 11,138,607 10,763,744 11,499,332General Funds 8,299,458 8,179,847 8,799,917 8,729,821 8,530,113Other State Funds 44,531 27,845 43,652 28,463 43,668Federal Funds 2 165 673 1 856 556 2 295 037 2 005 460 2 925 551Federal Funds 2,165,673 1,856,556 2,295,037 2,005,460 2,925,551
HIGHER EDUCATIONBoard Of Higher Education 39,992 36,726 18,678 18,442 22,078
General Funds 34,492 33,828 10,378 10,226 13,778Other State Funds 0 0 2,800 2,716 2,800Federal Funds 5,500 2,898 5,500 5,500 5,500
Chicago State University 42,857 42,857 42,726 41,673 43,146General Funds 42,857 42,857 42,112 41,059 42,532Other State Funds 0 0 614 614 614Federal Funds 0 0 0 0 0
Eastern Illinois University 49,191 49,191 50,569 49,304 51,407General Funds 49,189 49,189 50,567 49,302 51,403Other State Funds 2 2 2 2 4Federal Funds 0 0 0 0 0
Governors State University 27,659 27,659 28,324 27,616 28,608General Funds 27,659 27,659 28,324 27,616 28,608Other State Funds 0 0 0 0 0Federal Funds 0 0 0 0 0Federal Funds 0 0 0 0 0
Northeastern Illinois University 40,771 40,745 43,402 42,317 43,837General Funds 40,771 40,745 43,402 42,317 43,837Other State Funds 0 0 0 0 0Federal Funds 0 0 0 0 0
Western Illinois University 58,298 58,297 59,930 58,432 60,903General Funds 58,288 58,287 59,920 58,422 60,893Other State Funds 10 10 10 10 10Federal Funds 0 0 0 0 0
Illi i St t U i it 83 057 83 057 85 118 82 991 86 258Illinois State University 83,057 83,057 85,118 82,991 86,258General Funds 82,987 82,987 85,096 82,969 86,208Other State Funds 70 70 22 22 50Federal Funds 0 0 0 0 0
Northern Illinois University 105,878 105,878 107,467 104,781 109,225General Funds 105,868 105,868 107,431 104,745 109,189Other State Funds 10 10 36 36 36Federal Funds 0 0 0 0 0
2 - 28
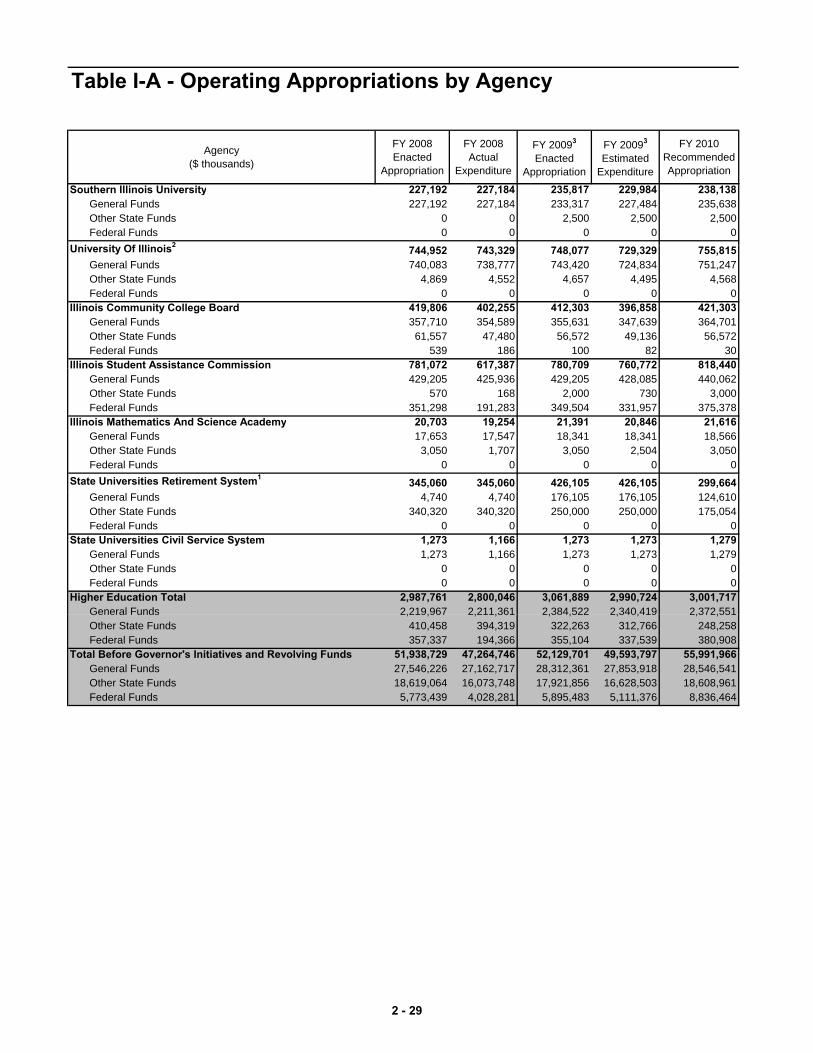
Table I-A - Operating Appropriations by Agency
Agency($ thousands)
FY 2008 Enacted
Appropriation
FY 2008 Actual
Expenditure
FY 20093
Enacted Appropriation
FY 20093
Estimated Expenditure
FY 2010 Recommended Appropriation
Southern Illinois University 227,192 227,184 235,817 229,984 238,138General Funds 227,192 227,184 233,317 227,484 235,638Other State Funds 0 0 2,500 2,500 2,500Federal Funds 0 0 0 0 0
U i it Of Illi i 2University Of Illinois2 744,952 743,329 748,077 729,329 755,815General Funds 740,083 738,777 743,420 724,834 751,247Other State Funds 4,869 4,552 4,657 4,495 4,568Federal Funds 0 0 0 0 0
Illinois Community College Board 419,806 402,255 412,303 396,858 421,303General Funds 357,710 354,589 355,631 347,639 364,701Other State Funds 61,557 47,480 56,572 49,136 56,572Federal Funds 539 186 100 82 30
Illinois Student Assistance Commission 781,072 617,387 780,709 760,772 818,440, , , , ,General Funds 429,205 425,936 429,205 428,085 440,062Other State Funds 570 168 2,000 730 3,000Federal Funds 351,298 191,283 349,504 331,957 375,378
Illinois Mathematics And Science Academy 20,703 19,254 21,391 20,846 21,616General Funds 17,653 17,547 18,341 18,341 18,566Other State Funds 3,050 1,707 3,050 2,504 3,050Federal Funds 0 0 0 0 0
State Universities Retirement System1 345,060 345,060 426,105 426,105 299,664General Funds 4,740 4,740 176,105 176,105 124,610Other State Funds 340,320 340,320 250,000 250,000 175,054Federal Funds 0 0 0 0 0
State Universities Civil Service System 1,273 1,166 1,273 1,273 1,279General Funds 1,273 1,166 1,273 1,273 1,279Other State Funds 0 0 0 0 0Federal Funds 0 0 0 0 0
Higher Education Total 2,987,761 2,800,046 3,061,889 2,990,724 3,001,717General Funds 2,219,967 2,211,361 2,384,522 2,340,419 2,372,551General Funds 2,219,967 2,211,361 2,384,522 2,340,419 2,372,551Other State Funds 410,458 394,319 322,263 312,766 248,258Federal Funds 357,337 194,366 355,104 337,539 380,908
Total Before Governor's Initiatives and Revolving Funds 51,938,729 47,264,746 52,129,701 49,593,797 55,991,966General Funds 27,546,226 27,162,717 28,312,361 27,853,918 28,546,541Other State Funds 18,619,064 16,073,748 17,921,856 16,628,503 18,608,961Federal Funds 5,773,439 4,028,281 5,895,483 5,111,376 8,836,464
2 - 29
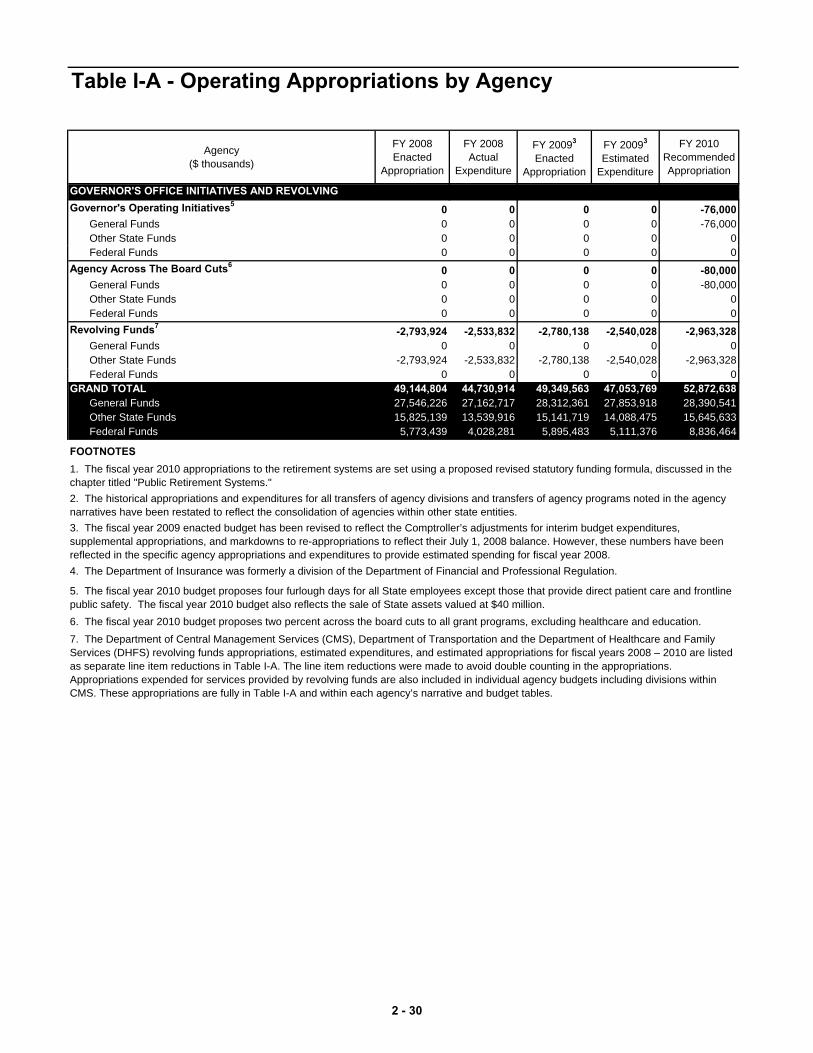
Table I-A - Operating Appropriations by Agency
Agency($ thousands)
FY 2008 Enacted
Appropriation
FY 2008 Actual
Expenditure
FY 20093
Enacted Appropriation
FY 20093
Estimated Expenditure
FY 2010 Recommended Appropriation
GOVERNOR'S OFFICE INITIATIVES AND REVOLVING Governor's Operating Initiatives5 0 0 0 0 -76,000
General Funds 0 0 0 0 -76,000Other State Funds 0 0 0 0 0Federal Funds 0 0 0 0 0
Agency Across The Board Cuts6 0 0 0 0 -80,000General Funds 0 0 0 0 -80,000Other State Funds 0 0 0 0 0Federal Funds 0 0 0 0 0
Revolving Funds7 -2,793,924 -2,533,832 -2,780,138 -2,540,028 -2,963,328General Funds 0 0 0 0 0Other State Funds -2,793,924 -2,533,832 -2,780,138 -2,540,028 -2,963,328Federal Funds 0 0 0 0 0
GRAND TOTAL 49,144,804 44,730,914 49,349,563 47,053,769 52,872,638General Funds 27,546,226 27,162,717 28,312,361 27,853,918 28,390,541Other State Funds 15,825,139 13,539,916 15,141,719 14,088,475 15,645,633Federal Funds 5,773,439 4,028,281 5,895,483 5,111,376 8,836,464
FOOTNOTES1. The fiscal year 2010 appropriations to the retirement systems are set using a proposed revised statutory funding formula, discussed in the chapter titled "Public Retirement Systems."
5. The fiscal year 2010 budget proposes four furlough days for all State employees except those that provide direct patient care and frontline public safety. The fiscal year 2010 budget also reflects the sale of State assets valued at $40 million.
4. The Department of Insurance was formerly a division of the Department of Financial and Professional Regulation.
2. The historical appropriations and expenditures for all transfers of agency divisions and transfers of agency programs noted in the agency narratives have been restated to reflect the consolidation of agencies within other state entities.3. The fiscal year 2009 enacted budget has been revised to reflect the Comptroller’s adjustments for interim budget expenditures, supplemental appropriations, and markdowns to re-appropriations to reflect their July 1, 2008 balance. However, these numbers have been reflected in the specific agency appropriations and expenditures to provide estimated spending for fiscal year 2008.
6. The fiscal year 2010 budget proposes two percent across the board cuts to all grant programs, excluding healthcare and education.7. The Department of Central Management Services (CMS), Department of Transportation and the Department of Healthcare and Family Services (DHFS) revolving funds appropriations, estimated expenditures, and estimated appropriations for fiscal years 2008 – 2010 are listed as separate line item reductions in Table I-A. The line item reductions were made to avoid double counting in the appropriations. Appropriations expended for services provided by revolving funds are also included in individual agency budgets including divisions within CMS. These appropriations are fully in Table I-A and within each agency’s narrative and budget tables.
2 - 30

Agency Total General Other State Federal($ thousands) All Funds Funds Funds Funds
Regular Supplemental RequestsDepartment of Agriculture.............................................................. 500.0 0.0 500.0 0.0Department of Commerce and Economic Opportunity.................. 20,000.0 0.0 0.0 20,000.0Department of Children and Family Services................................. 42,700.0 42,700.0 0.0 0.0Department of Human Services..................................................... 25,000.0 0.0 0.0 25,000.0Department of Military Affairs......................................................... 1,000.0 1,000.0 0.0 0.0Department of Transportation........................................................ 3,539.1 0.0 1,810.7 1,728.4
TOTAL REGULAR SUPPLEMENTALS 92,739.1 43,700.0 2,310.7 46,728.4
Federal Recovery Supplemental RequestsDepartment on Aging..................................................................... 5,950.0 0.0 0.0 5,950.0Criminal Justice Information Authority............................................ 29,400.0 0.0 0.0 29,400.0Department of Commerce and Economic Opportunity.................. 1,060,000.0 0.0 0.0 1,060,000.0Department of Employment Security............................................. 8,507.0 0.0 0.0 8,507.0Department of Human Services..................................................... 157,500.0 0.0 0.0 157,500.0Department of Juvenile Justice...................................................... 1,000.0 0.0 0.0 1,000.0Department of Natural Resources.................................................. 5,000.0 0.0 0.0 5,000.0Department of Corrections............................................................. 5,000.0 0.0 0.0 5,000.0Department of Revenue................................................................. 346,000.0 0.0 0.0 346,000.0Department of Public Health.......................................................... 10,000.0 0.0 0.0 10,000.0Environmental Protection Agency.................................................. 260,200.0 0.0 0.0 260,200.0Department of Healthcare and Family Services............................. 1,765,889.9 0.0 0.0 1,765,889.9Department of Transportation........................................................ 2,556,000.0 0.0 0.0 2,556,000.0Illinois State Board of Education.................................................... 474,490.0 0.0 0.0 474,490.0
TOTAL FEDERAL RECOVERY SUPPLEMENTALS 6,684,936.9 0.0 0.0 6,684,936.9TOTAL SUPPLEMENTALS 6,777,676.0 43,700.0 2,310.7 6,731,665.3
Table I-B - Supplementals to Complete FY 2009
2 - 31
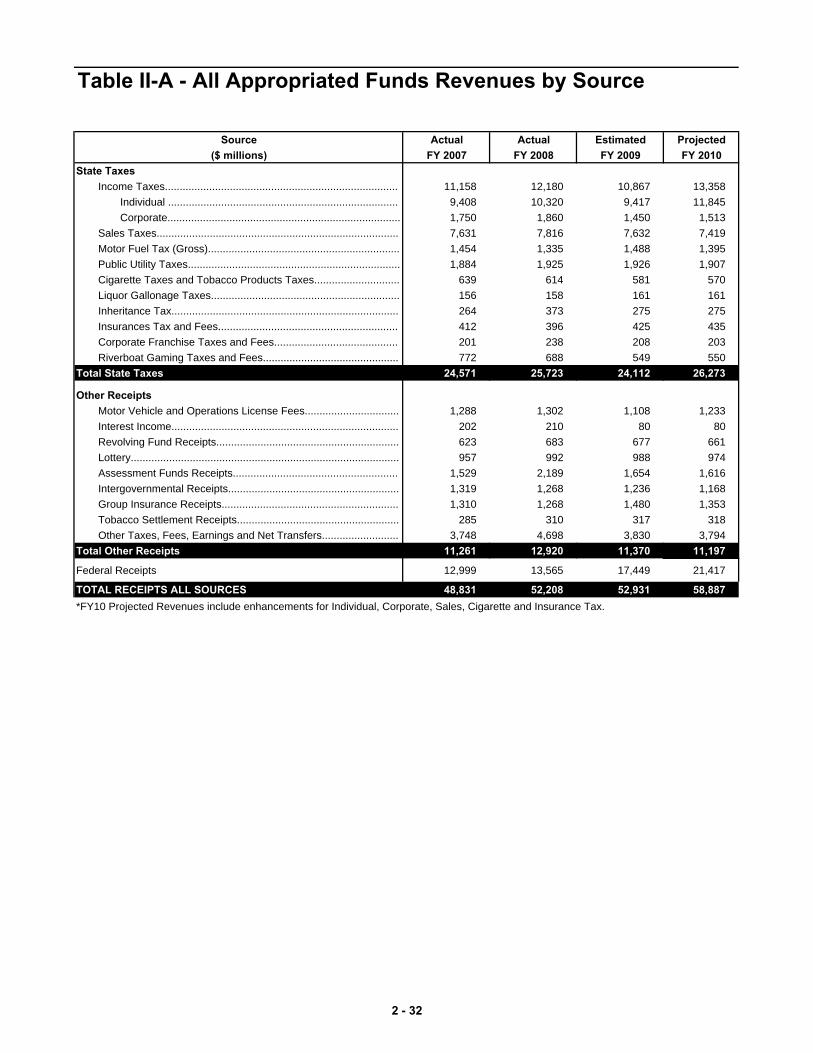
Source Actual Actual Estimated Projected($ millions) FY 2007 FY 2008 FY 2009 FY 2010
State TaxesIncome Taxes............................................................................... 11,158 12,180 10,867 13,358
Individual .............................................................................. 9,408 10,320 9,417 11,845Corporate............................................................................... 1,750 1,860 1,450 1,513
Sales Taxes.................................................................................. 7,631 7,816 7,632 7,419Motor Fuel Tax (Gross)................................................................. 1,454 1,335 1,488 1,395Public Utility Taxes........................................................................ 1,884 1,925 1,926 1,907Cigarette Taxes and Tobacco Products Taxes............................. 639 614 581 570Liquor Gallonage Taxes................................................................ 156 158 161 161Inheritance Tax............................................................................. 264 373 275 275Insurances Tax and Fees............................................................. 412 396 425 435Corporate Franchise Taxes and Fees.......................................... 201 238 208 203Riverboat Gaming Taxes and Fees.............................................. 772 688 549 550
Total State Taxes 24,571 25,723 24,112 26,273
Other ReceiptsMotor Vehicle and Operations License Fees................................ 1,288 1,302 1,108 1,233Interest Income............................................................................. 202 210 80 80Revolving Fund Receipts.............................................................. 623 683 677 661Lottery........................................................................................... 957 992 988 974Assessment Funds Receipts........................................................ 1,529 2,189 1,654 1,616Intergovernmental Receipts.......................................................... 1,319 1,268 1,236 1,168Group Insurance Receipts............................................................ 1,310 1,268 1,480 1,353Tobacco Settlement Receipts....................................................... 285 310 317 318Other Taxes, Fees, Earnings and Net Transfers.......................... 3,748 4,698 3,830 3,794
Total Other Receipts 11,261 12,920 11,370 11,197
Federal Receipts 12,999 13,565 17,449 21,417
TOTAL RECEIPTS ALL SOURCES 48,831 52,208 52,931 58,887
Table II-A - All Appropriated Funds Revenues by Source
*FY10 Projected Revenues include enhancements for Individual, Corporate, Sales, Cigarette and Insurance Tax.
2 - 32

Source Actual Actual Estimated Projected($ millions) FY 2007 FY 2008 FY 2009 FY 2010
Base RevenuesState Sources: Revenues
Income Taxes . . . . . . . . . . . . . . . . . . . . . . . . . . . . . . . . . . . . . . . . . . . . . . 11,159 12,180 10,867 9,968Individual . . . . . . . . . . . . . . . . . . . . . . . . . . . . . . . . . . . . . . . . . . . . . . 9,409 10,320 9,417 8,925Corporate . . . . . . . . . . . . . . . . . . . . . . . . . . . . . . . . . . . . . . . . . . . . . . 1,750 1,860 1,450 1,043
Sales Taxes . . . . . . . . . . . . . . . . . . . . . . . . . . . . . . . . . . . . . . . . . . . . . . 7,136 7,215 6,674 6,394Public Utility Taxes . . . . . . . . . . . . . . . . . . . . . . . . . . . . . . . . . . . . . . . . . . . . . 1,130 1,157 1,159 1,150Cigarette Taxes . . . . . . . . . . . . . . . . . . . . . . . . . . . . . . . . . . . . . . . . . . . . . . 349 350 350 350Liquor Gallonage Taxes . . . . . . . . . . . . . . . . . . . . . . . . . . . . . . . . . . . . . . . . . . 156 158 161 161Inheritance Tax . . . . . . . . . . . . . . . . . . . . . . . . . . . . . . . . . . . . . . . . . . . . . . 264 373 275 275Insurances Tax and Fees . . . . . . . . . . . . . . . . . . . . . . . . . . . . . . . . . . . . . . . . 310 299 325 325Corporate Franchise Taxes and Fees . . . . . . . . . . . . . . . . . . . . . . . . . . . . . . . 193 225 205 205Interest on State Funds and Investments . . . . . . . . . . . . . . . . . . . . . . . . . . . . 204 212 80 80Cook County Intergovernmental Transfer . . . . . . . . . . . . . . . . . . . . . . . . . . . . 307 302 253 240Other State Sources . . . . . . . . . . . . . . . . . . . . . . . . . . . . . . . . . . . . . . . . . . . . 482 475 452 430
Total State Sources: Revenues 21,690 22,946 20,801 19,578State Sources: Transfers In
Lottery . . . . . . . . . . . . . . . . . . . . . . . . . . . . . . . . . . . . . . . . . . . . . . 623 656 625 645Riverboat Gaming Taxes . . . . . . . . . . . . . . . . . . . . . . . . . . . . . . . . . . . . . 685 564 470 478Other Transfers . . . . . . . . . . . . . . . . . . . . . . . . . . . . . . . . . . . . . . . . . . . . 935 679 575 480Tenth License 0 0 0 50
Total State Sources 23,933 24,845 22,471 21,231
Federal Sources . . . . . . . . . . . . . . . . . . . . . . . . . . . . . . . . . . . . . . . . . . . . . . 4,702 4,815 4,700 5,555
Total Base Revenues 28,635 29,660 27,171 26,786
Increases to Base Revenues1
One Time Revenues Federal Recovery........................................................................................... 0 0 2,154 1,882Transfer In...................................................................................................... 0 0 200 364
Recurring Revenues Income Taxes................................................................................................. 0 0 0 3,207Cigarette Tax and Other Tobaco Products..................................................... 0 0 0 365Equity Changes............................................................................................... 0 0 0 287Titles and Fees............................................................................................... 0 0 0 185
Total Adjusting Sources 0 0 2,354 6,290
TOTAL REVENUES GENERAL FUNDS 28,635 29,660 29,525 33,0761 Increases to base revenues are proposed for passage in fiscal year 2009.Note: Totals may not add due to rounding.
Table II-B - General Funds Revenues by Source
2 - 33

General Funds 1 . . . . . . . . . . . . . . . . . . . . . . . . . . . . . . . . 141 33,076 (1,498) 1,523 33,242Road . . . . . . . . . . . . . . . . . . . . . . . . . . . . . . . . . . . . . . . . . 229 4,519 (428) 753 5,073Motor Fuel Tax . . . . . . . . . . . . . . . . . . . . . . . . . . . . . . . . . 7 1,324 (233) 221 1,319Agriculture Premium . . . . . . . . . . . . . . . . . . . . . . . . . . . . . 3 25 0 0 28
Total 380 38,944 (2,159) 2,497 39,662
Table II-C - Budgeted Funds Revenues - Generally Accepted Accounting Principles (GAAP) Basis1
GAAP Basis
FY10 GAAP
Revenues
Adjustments
Fund Group
Resources
Estimated Beginning Fund Balance July 1,
2009
Estimated FY10
Receipts
FY09 Receivable
June 30, 2009
FY10 Receivable
June 30, 2010
2 - 34
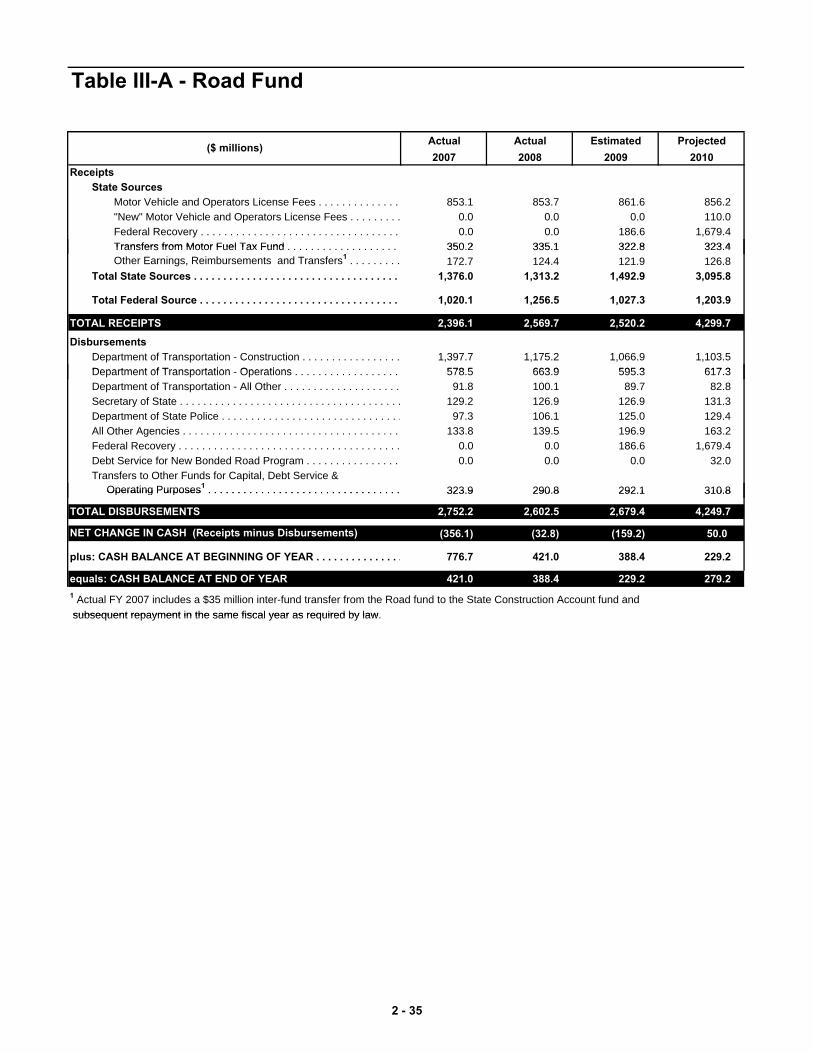
Table III-A - Road Fund
Actual Actual Estimated Projected2007 2008 2009 2010
ReceiptsState Sources
Motor Vehicle and Operators License Fees . . . . . . . . . . . . . . 853.1 853.7 861.6 856.2"New" Motor Vehicle and Operators License Fees . . . . . . . . . 0.0 0.0 0.0 110.0Federal Recovery . . . . . . . . . . . . . . . . . . . . . . . . . . . . . . . . . . 0.0 0.0 186.6 1,679.4Transfers from Motor Fuel Tax Fund 350 2 335 1 322 8 323 4
($ millions)
Transfers from Motor Fuel Tax Fund . . . . . . . . . . . . . . . . . . . 350.2 335.1 322.8 323.4Other Earnings, Reimbursements and Transfers1 . . . . . . . . . 172.7 124.4 121.9 126.8
Total State Sources . . . . . . . . . . . . . . . . . . . . . . . . . . . . . . . . . . . 1,376.0 1,313.2 1,492.9 3,095.8
Total Federal Source . . . . . . . . . . . . . . . . . . . . . . . . . . . . . . . . . . 1,020.1 1,256.5 1,027.3 1,203.9
TOTAL RECEIPTS 2,396.1 2,569.7 2,520.2 4,299.7
DisbursementsDepartment of Transportation - Construction . . . . . . . . . . . . . . . . . 1,397.7 1,175.2 1,066.9 1,103.5Department of Transportation Operations 578 5 663 9 595 3 617 3Department of Transportation - Operations . . . . . . . . . . . . . . . . . . 578.5 663.9 595.3 617.3Department of Transportation - All Other . . . . . . . . . . . . . . . . . . . . 91.8 100.1 89.7 82.8Secretary of State . . . . . . . . . . . . . . . . . . . . . . . . . . . . . . . . . . . . . . 129.2 126.9 126.9 131.3Department of State Police . . . . . . . . . . . . . . . . . . . . . . . . . . . . . . . 97.3 106.1 125.0 129.4All Other Agencies . . . . . . . . . . . . . . . . . . . . . . . . . . . . . . . . . . . . . 133.8 139.5 196.9 163.2Federal Recovery . . . . . . . . . . . . . . . . . . . . . . . . . . . . . . . . . . . . . . 0.0 0.0 186.6 1,679.4Debt Service for New Bonded Road Program . . . . . . . . . . . . . . . . 0.0 0.0 0.0 32.0Transfers to Other Funds for Capital, Debt Service & Operating Purposes1 . . . . . . . . . . . . . . . . . . . . . . . . . . . . . . . . . 323.9 290.8 292.1 310.8 Operating Purposes . . . . . . . . . . . . . . . . . . . . . . . . . . . . . . . . . 323.9 290.8 292.1 310.8
TOTAL DISBURSEMENTS 2,752.2 2,602.5 2,679.4 4,249.7
NET CHANGE IN CASH (Receipts minus Disbursements) (356.1) (32.8) (159.2) 50.0
plus: CASH BALANCE AT BEGINNING OF YEAR . . . . . . . . . . . . . . . 776.7 421.0 388.4 229.2
equals: CASH BALANCE AT END OF YEAR 421.0 388.4 229.2 279.21 Actual FY 2007 includes a $35 million inter-fund transfer from the Road fund to the State Construction Account fund andsubsequent repayment in the same fiscal year as required by law subsequent repayment in the same fiscal year as required by law.
2 - 35
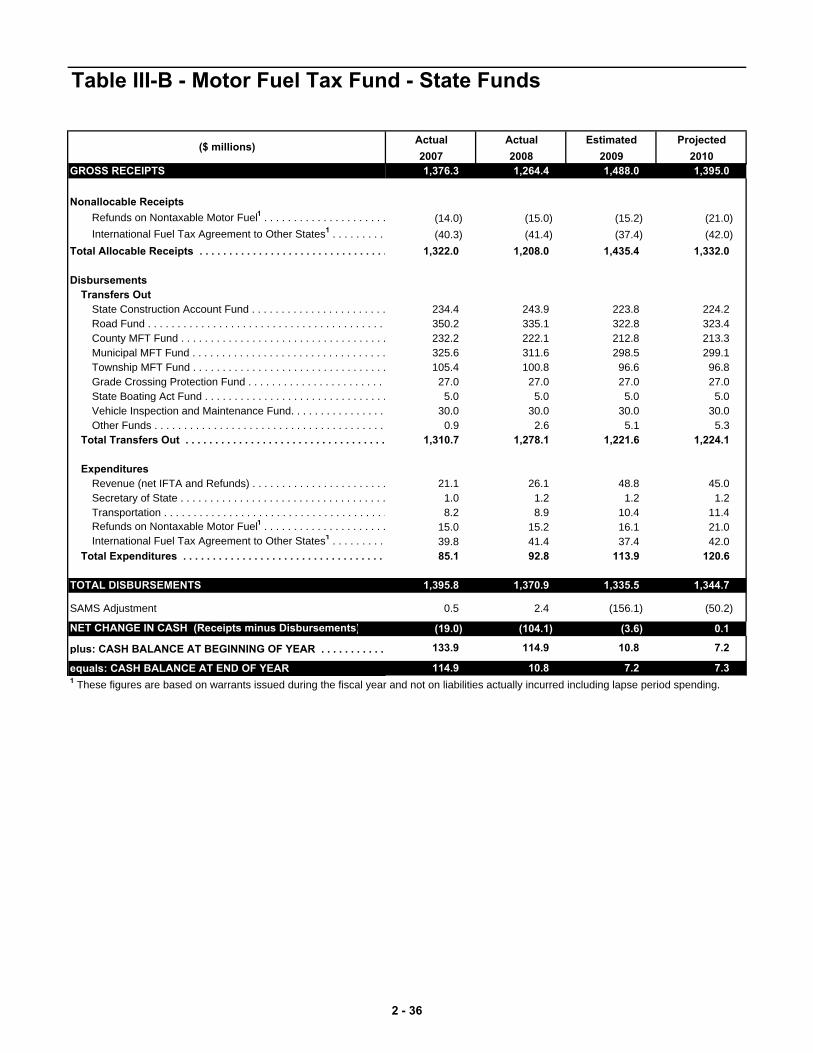
Actual Actual Estimated Projected2007 2008 2009 2010
GROSS RECEIPTS 1,376.3 1,264.4 1,488.0 1,395.0
Nonallocable ReceiptsRefunds on Nontaxable Motor Fuel1 . . . . . . . . . . . . . . . . . . . . . (14.0) (15.0) (15.2) (21.0)International Fuel Tax Agreement to Other States1 . . . . . . . . . (40.3) (41.4) (37.4) (42.0)
Total Allocable Receipts . . . . . . . . . . . . . . . . . . . . . . . . . . . . . . . . 1,322.0 1,208.0 1,435.4 1,332.0
DisbursementsTransfers Out
State Construction Account Fund . . . . . . . . . . . . . . . . . . . . . . . 234.4 243.9 223.8 224.2Road Fund . . . . . . . . . . . . . . . . . . . . . . . . . . . . . . . . . . . . . . . . 350.2 335.1 322.8 323.4County MFT Fund . . . . . . . . . . . . . . . . . . . . . . . . . . . . . . . . . . . 232.2 222.1 212.8 213.3Municipal MFT Fund . . . . . . . . . . . . . . . . . . . . . . . . . . . . . . . . . 325.6 311.6 298.5 299.1Township MFT Fund . . . . . . . . . . . . . . . . . . . . . . . . . . . . . . . . . 105.4 100.8 96.6 96.8Grade Crossing Protection Fund . . . . . . . . . . . . . . . . . . . . . . . 27.0 27.0 27.0 27.0State Boating Act Fund . . . . . . . . . . . . . . . . . . . . . . . . . . . . . . . 5.0 5.0 5.0 5.0Vehicle Inspection and Maintenance Fund. . . . . . . . . . . . . . . . 30.0 30.0 30.0 30.0Other Funds . . . . . . . . . . . . . . . . . . . . . . . . . . . . . . . . . . . . . . . 0.9 2.6 5.1 5.3
Total Transfers Out . . . . . . . . . . . . . . . . . . . . . . . . . . . . . . . . . . 1,310.7 1,278.1 1,221.6 1,224.1
ExpendituresRevenue (net IFTA and Refunds) . . . . . . . . . . . . . . . . . . . . . . . 21.1 26.1 48.8 45.0Secretary of State . . . . . . . . . . . . . . . . . . . . . . . . . . . . . . . . . . . 1.0 1.2 1.2 1.2Transportation . . . . . . . . . . . . . . . . . . . . . . . . . . . . . . . . . . . . . . 8.2 8.9 10.4 11.4Refunds on Nontaxable Motor Fuel1 . . . . . . . . . . . . . . . . . . . . . 15.0 15.2 16.1 21.0International Fuel Tax Agreement to Other States1 . . . . . . . . . 39.8 41.4 37.4 42.0
Total Expenditures . . . . . . . . . . . . . . . . . . . . . . . . . . . . . . . . . . 85.1 92.8 113.9 120.6
TOTAL DISBURSEMENTS 1,395.8 1,370.9 1,335.5 1,344.7
SAMS Adjustment 0.5 2.4 (156.1) (50.2)
NET CHANGE IN CASH (Receipts minus Disbursements) (19.0) (104.1) (3.6) 0.1
plus: CASH BALANCE AT BEGINNING OF YEAR . . . . . . . . . . . 133.9 114.9 10.8 7.2
equals: CASH BALANCE AT END OF YEAR 114.9 10.8 7.2 7.3
Table III-B - Motor Fuel Tax Fund - State Funds
1 These figures are based on warrants issued during the fiscal year and not on liabilities actually incurred including lapse period spending.
($ millions)
2 - 36
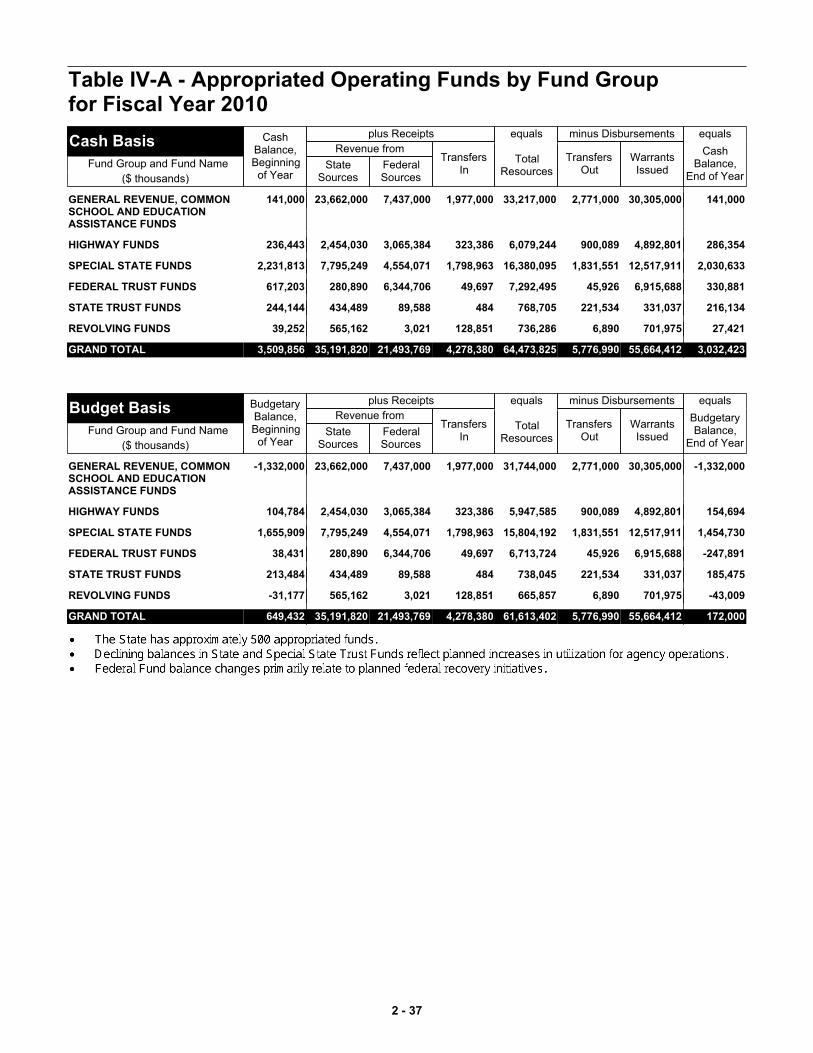
Cash Basis
Fund Group and Fund Name
($ thousands)
CashBalance,Beginningof Year
plus Receipts
Revenue from
StateSources
FederalSources
TransfersIn
equals
TotalResources
minus Disbursements
TransfersOut
WarrantsIssued
equals
CashBalance,
End of Year
GENERAL REVENUE, COMMON SCHOOL AND EDUCATION ASSISTANCE FUNDS
141,000 23,662,000 7,437,000 1,977,000 33,217,000 2,771,000 30,305,000 141,000
HIGHWAY FUNDS 236,443 2,454,030 3,065,384 323,386 6,079,244 900,089 4,892,801 286,354
SPECIAL STATE FUNDS 2,231,813 7,795,249 4,554,071 1,798,963 16,380,095 1,831,551 12,517,911 2,030,633
FEDERAL TRUST FUNDS 617,203 280,890 6,344,706 49,697 7,292,495 45,926 6,915,688 330,881
STATE TRUST FUNDS 244,144 434,489 89,588 484 768,705 221,534 331,037 216,134
REVOLVING FUNDS 39,252 565,162 3,021 128,851 736,286 6,890 701,975 27,421
GRAND TOTAL 3,509,856 35,191,820 21,493,769 4,278,380 64,473,825 5,776,990 55,664,412 3,032,423
Budget Basis
Fund Group and Fund Name
($ thousands)
BudgetaryBalance,Beginningof Year
plus Receipts
Revenue from
StateSources
FederalSources
TransfersIn
equals
TotalResources
minus Disbursements
TransfersOut
WarrantsIssued
equals
BudgetaryBalance,
End of Year
GENERAL REVENUE, COMMON SCHOOL AND EDUCATION ASSISTANCE FUNDS
-1,332,000 23,662,000 7,437,000 1,977,000 31,744,000 2,771,000 30,305,000 -1,332,000
HIGHWAY FUNDS 104,784 2,454,030 3,065,384 323,386 5,947,585 900,089 4,892,801 154,694
SPECIAL STATE FUNDS 1,655,909 7,795,249 4,554,071 1,798,963 15,804,192 1,831,551 12,517,911 1,454,730
FEDERAL TRUST FUNDS 38,431 280,890 6,344,706 49,697 6,713,724 45,926 6,915,688 -247,891
STATE TRUST FUNDS 213,484 434,489 89,588 484 738,045 221,534 331,037 185,475
REVOLVING FUNDS -31,177 565,162 3,021 128,851 665,857 6,890 701,975 -43,009
GRAND TOTAL 649,432 35,191,820 21,493,769 4,278,380 61,613,402 5,776,990 55,664,412 172,000
Table IV-A - Appropriated Operating Funds by Fund Group for Fiscal Year 2010
2 - 37

GENERAL REVENUE, COMMON SCHOOL AND EDUCATION ASSISTANCE FUNDS
141,000 23,662,000 7,437,000 1,977,000 33,217,000 2,771,000 30,305,000 141,000
HIGHWAY FUNDS
Motor Fuel Tax 7,293 1,324,161 0 0 1,331,453 607,168 717,081 7,205
Road 229,151 1,129,869 3,065,384 323,386 4,747,790 292,921 4,175,721 279,149
TOTAL HIGHWAY FUNDS 236,443 2,454,030 3,065,384 323,386 6,079,244 900,089 4,892,801 286,354
SPECIAL STATE FUNDS
Accessible Electronic Information Service
82 0 0 77 159 0 77 82
Adeline Jay Geo-Karis Illinois Beach Marina
453 3,092 0 0 3,545 1,137 2,242 167
Aeronautics 111 317 0 0 428 0 230 198
African-American HIV/AIDS Response
0 0 0 0 0 0 0 0
AG Court Ordered and Voluntary Compliance Payment Projects
18,513 5,000 0 0 23,512 0 3,750 19,762
AG Whistleblower Reward and Protection
19,750 3,000 0 0 22,750 0 2,050 20,700
Aggregate Operations Regulatory 152 249 0 0 401 0 253 148
Agricultural Premium 2,690 1,577 0 23,765 28,032 161 26,969 902
Agriculture in the Classroom 31 30 0 0 61 0 10 51
Agriculture Laboratory Services Revolving
17 782 0 0 799 0 779 20
Alternate Fuels 2,277 1,755 0 0 4,032 0 1,186 2,847
Alternative Compliance Market Account
49 125 0 0 174 0 150 24
Alzheimer's Disease Research 287 0 0 156 443 0 318 125
Anna Veterans Home 573 793 1,440 0 2,806 0 2,501 305
Appraisal Administration 345 2,674 0 0 3,019 898 714 1,407
Asbestos Abatement 6,478 3,270 0 0 9,748 0 3,596 6,152
Assistance to the Homeless 139 0 0 172 311 0 170 141
Assisted Living and Shared Housing Regulatory
186 280 0 0 466 0 333 133
Attorney General's Grant 5 0 0 0 5 0 0 5
Auction Regulation Administration 252 639 0 0 890 113 157 620
Audit Expense 11,641 1,000 0 21,152 33,793 400 23,896 9,497
Autism Research Checkoff 64 3 0 0 67 0 65 2
Autoimmune Disease Research 0 0 0 0 0 0 0 0
Bank and Trust Company 56,437 31,316 0 0 87,753 4,525 15,647 67,580
Boy Scout and Girl Scout 3 3 0 0 6 0 3 3
Brownfields Redevelopment 1,366 1,084 11,382 0 13,832 0 13,829 3
Budget Relief 18,152 0 0 174,086 192,238 0 191,499 739
Capital Litigation Trust 3,406 299 0 13,500 17,205 9 12,020 5,176
Care Provider Fund for Persons with a Developmental Disability
435 18,963 29,095 1 48,494 15 48,063 416
Career and Technical Education 0 0 0 23,606 23,606 0 23,606 0
CDLIS/AAMVAnet Trust 561 736 430 0 1,726 0 1,032 694
Charter Schools Revolving Loan 87 20 0 0 107 0 15 92
Chicago and Northeast Illinois District Council of Carpenters
0 1 0 0 1 0 1 0
Child Abuse Prevention 590 22 0 243 855 0 557 298
Child Labor and Day and Temporary Labor Services Enforcement
807 500 0 0 1,307 0 433 874
Child Support Administrative 5,304 33,361 109,719 47,362 195,745 2,264 189,664 3,818
Table IV-B - Appropriated Operating Funds by Fund for Fiscal Year 2010
Cash Basis
Fund Group and Fund Name
($ thousands)
CashBalance,Beginningof Year
plus Receipts
Revenue from
StateSources
FederalSources
TransfersIn
equals
TotalResources
minus Disbursements
TransfersOut
WarrantsIssued
equals
CashBalance,
End of Year
2 - 38
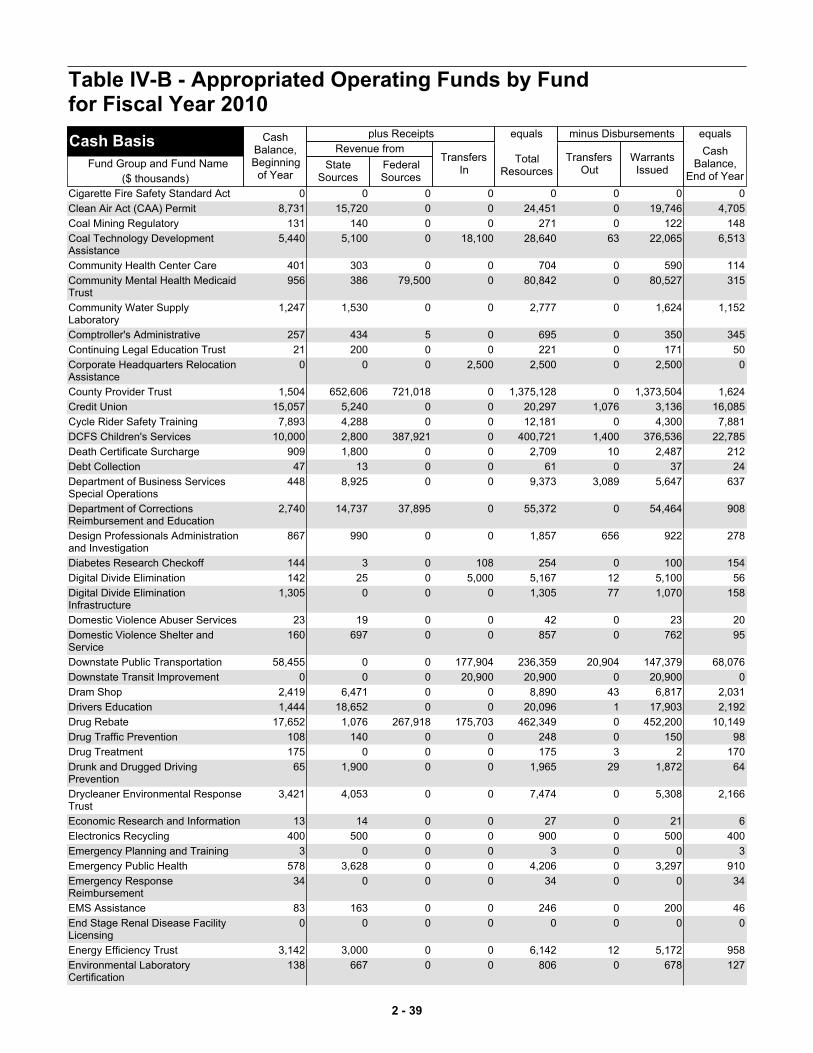
Cigarette Fire Safety Standard Act 0 0 0 0 0 0 0 0
Clean Air Act (CAA) Permit 8,731 15,720 0 0 24,451 0 19,746 4,705
Coal Mining Regulatory 131 140 0 0 271 0 122 148
Coal Technology Development Assistance
5,440 5,100 0 18,100 28,640 63 22,065 6,513
Community Health Center Care 401 303 0 0 704 0 590 114
Community Mental Health Medicaid Trust
956 386 79,500 0 80,842 0 80,527 315
Community Water Supply Laboratory
1,247 1,530 0 0 2,777 0 1,624 1,152
Comptroller's Administrative 257 434 5 0 695 0 350 345
Continuing Legal Education Trust 21 200 0 0 221 0 171 50
Corporate Headquarters Relocation Assistance
0 0 0 2,500 2,500 0 2,500 0
County Provider Trust 1,504 652,606 721,018 0 1,375,128 0 1,373,504 1,624
Credit Union 15,057 5,240 0 0 20,297 1,076 3,136 16,085
Cycle Rider Safety Training 7,893 4,288 0 0 12,181 0 4,300 7,881
DCFS Children's Services 10,000 2,800 387,921 0 400,721 1,400 376,536 22,785
Death Certificate Surcharge 909 1,800 0 0 2,709 10 2,487 212
Debt Collection 47 13 0 0 61 0 37 24
Department of Business Services Special Operations
448 8,925 0 0 9,373 3,089 5,647 637
Department of Corrections Reimbursement and Education
2,740 14,737 37,895 0 55,372 0 54,464 908
Design Professionals Administration and Investigation
867 990 0 0 1,857 656 922 278
Diabetes Research Checkoff 144 3 0 108 254 0 100 154
Digital Divide Elimination 142 25 0 5,000 5,167 12 5,100 56
Digital Divide Elimination Infrastructure
1,305 0 0 0 1,305 77 1,070 158
Domestic Violence Abuser Services 23 19 0 0 42 0 23 20
Domestic Violence Shelter and Service
160 697 0 0 857 0 762 95
Downstate Public Transportation 58,455 0 0 177,904 236,359 20,904 147,379 68,076
Downstate Transit Improvement 0 0 0 20,900 20,900 0 20,900 0
Dram Shop 2,419 6,471 0 0 8,890 43 6,817 2,031
Drivers Education 1,444 18,652 0 0 20,096 1 17,903 2,192
Drug Rebate 17,652 1,076 267,918 175,703 462,349 0 452,200 10,149
Drug Traffic Prevention 108 140 0 0 248 0 150 98
Drug Treatment 175 0 0 0 175 3 2 170
Drunk and Drugged Driving Prevention
65 1,900 0 0 1,965 29 1,872 64
Drycleaner Environmental Response Trust
3,421 4,053 0 0 7,474 0 5,308 2,166
Economic Research and Information 13 14 0 0 27 0 21 6
Electronics Recycling 400 500 0 0 900 0 500 400
Emergency Planning and Training 3 0 0 0 3 0 0 3
Emergency Public Health 578 3,628 0 0 4,206 0 3,297 910
Emergency Response Reimbursement
34 0 0 0 34 0 0 34
EMS Assistance 83 163 0 0 246 0 200 46
End Stage Renal Disease Facility Licensing
0 0 0 0 0 0 0 0
Energy Efficiency Trust 3,142 3,000 0 0 6,142 12 5,172 958
Environmental Laboratory Certification
138 667 0 0 806 0 678 127
Table IV-B - Appropriated Operating Funds by Fund for Fiscal Year 2010
Cash Basis
Fund Group and Fund Name
($ thousands)
CashBalance,Beginningof Year
plus Receipts
Revenue from
StateSources
FederalSources
TransfersIn
equals
TotalResources
minus Disbursements
TransfersOut
WarrantsIssued
equals
CashBalance,
End of Year
2 - 39

Environmental Protection Permit and Inspection
1,621 10,160 0 0 11,781 0 11,688 92
Epilepsy Treatment and Education Grants-in-Aid
0 0 0 0 0 0 0 0
Estate Tax Collection Distributive 175 0 0 18,700 18,875 1 18,550 324
Explosives Regulatory 95 115 0 0 209 0 101 108
Facility Licensing 306 545 0 0 851 7 25 819
Fair and Exposition 2,093 0 0 1,661 3,754 0 1,317 2,438
Family Care 145 30,609 0 0 30,754 0 30,609 145
Federal Asset Forfeiture 1,262 22 1,576 0 2,860 0 1,952 908
Feed Control 577 1,500 0 0 2,077 0 1,439 639
Fertilizer Control 52 564 0 0 616 0 500 116
Financial Institution 6,799 6,595 0 0 13,394 965 5,088 7,341
Fire Prevention 31,358 25,683 0 0 57,041 0 21,390 35,651
Fire Service and Small Equipment 2,065 64 0 0 2,128 0 936 1,192
Firearm Owner's Notification 536 705 0 0 1,241 0 661 580
Food and Drug Safety 9 1,272 0 0 1,281 9 1,262 10
Foreign Language Interpreter 0 0 0 0 0 0 0 0
Fund for Illinois' Future 14,577 0 0 0 14,577 0 10,000 4,577
Gaining Early Awareness and Readiness for Undergraduate Programs
7,148 188 3,393 0 10,729 0 1,793 8,936
General Assembly Computer Equipment Revolving
263 20 0 0 283 0 50 233
General Assembly Operations Revolving
79 20 0 0 99 0 40 59
General Professions Dedicated 7,593 8,951 0 0 16,544 5,834 6,012 4,697
Good Samaritan Energy Trust 26 1 0 0 27 0 1 26
Governor's Grant 7 0 0 0 7 0 0 7
Group Home Loan Revolving 10 47 0 0 57 0 55 2
Guardianship and Advocacy 21 81 0 0 102 0 93 9
Hazardous Waste 1,092 25,274 0 0 26,366 0 25,725 641
Hazardous Waste Occupational Licensing
10 62 0 0 72 0 72 1
Hazardous Waste Research 96 374 0 0 470 0 414 55
Health and Human Services Medicaid Trust
47,651 1,500 0 20,000 69,151 0 49,000 20,151
Health Facility Plan Review 1,364 1,795 0 0 3,159 24 1,712 1,424
Health Insurance Reserve 17,914 1,985,653 34,357 0 2,037,924 0 2,027,860 10,063
Healthy Smiles 70 0 0 100 170 0 100 70
Hearing Instrument Dispenser Examining and Disciplinary
86 68 0 0 154 2 96 56
Heartsaver AED 0 0 0 0 0 0 0 0
Help Illinois Vote 16,716 200 5,480 0 22,396 0 22,392 4
High Speed Internet Services and Information Technology
4,000 0 0 0 4,000 0 0 4,000
Home Care Services Agency Licensure
150 600 0 0 750 0 540 210
Home Inspector Administration 2,011 179 0 0 2,190 355 134 1,702
Horse Racing 276 7,645 0 0 7,921 23 7,897 0
Hospice 4 0 0 0 4 0 0 4
Hospital Basic Services Preservation 0 0 0 0 0 0 0 0
Hospital Provider 132,582 896,846 1,121,952 0 2,151,380 130,000 1,867,321 154,059
ICCB Adult Education 0 0 20,993 0 20,993 0 20,993 0
ICCB Contracts and Grants 157 2,175 0 0 2,332 0 2,175 157
Table IV-B - Appropriated Operating Funds by Fund for Fiscal Year 2010
Cash Basis
Fund Group and Fund Name
($ thousands)
CashBalance,Beginningof Year
plus Receipts
Revenue from
StateSources
FederalSources
TransfersIn
equals
TotalResources
minus Disbursements
TransfersOut
WarrantsIssued
equals
CashBalance,
End of Year
2 - 40
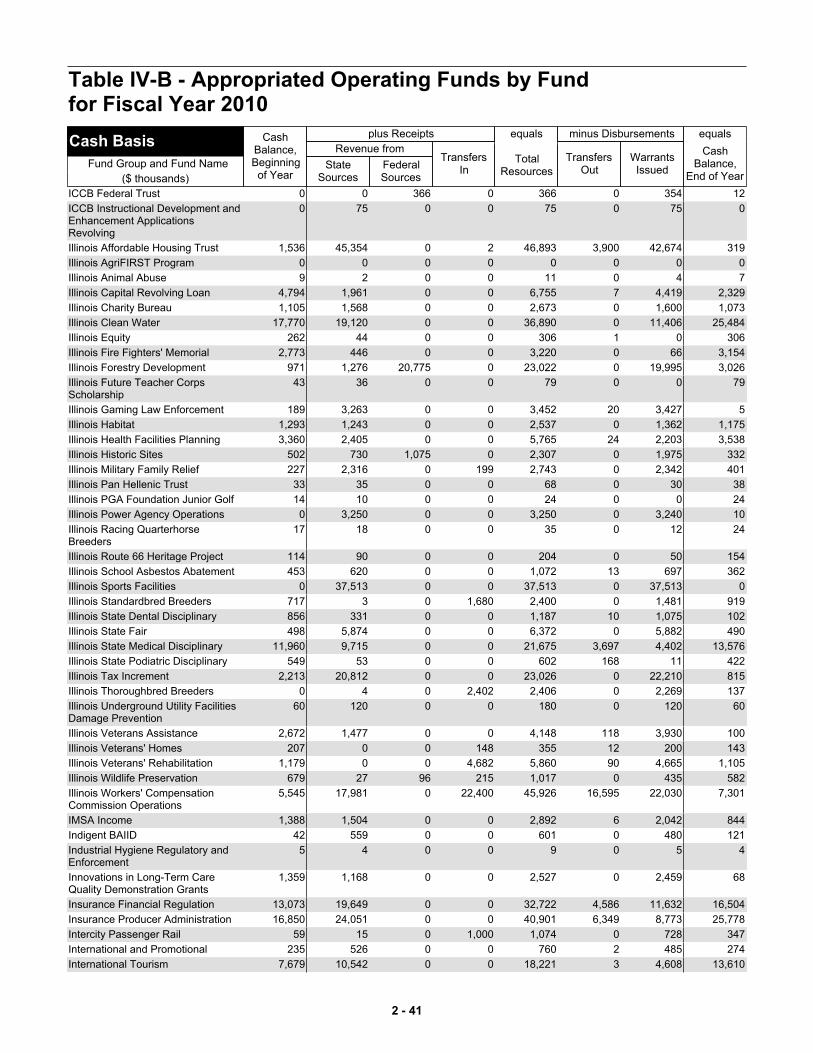
ICCB Federal Trust 0 0 366 0 366 0 354 12
ICCB Instructional Development and Enhancement Applications Revolving
0 75 0 0 75 0 75 0
Illinois Affordable Housing Trust 1,536 45,354 0 2 46,893 3,900 42,674 319
Illinois AgriFIRST Program 0 0 0 0 0 0 0 0
Illinois Animal Abuse 9 2 0 0 11 0 4 7
Illinois Capital Revolving Loan 4,794 1,961 0 0 6,755 7 4,419 2,329
Illinois Charity Bureau 1,105 1,568 0 0 2,673 0 1,600 1,073
Illinois Clean Water 17,770 19,120 0 0 36,890 0 11,406 25,484
Illinois Equity 262 44 0 0 306 1 0 306
Illinois Fire Fighters' Memorial 2,773 446 0 0 3,220 0 66 3,154
Illinois Forestry Development 971 1,276 20,775 0 23,022 0 19,995 3,026
Illinois Future Teacher Corps Scholarship
43 36 0 0 79 0 0 79
Illinois Gaming Law Enforcement 189 3,263 0 0 3,452 20 3,427 5
Illinois Habitat 1,293 1,243 0 0 2,537 0 1,362 1,175
Illinois Health Facilities Planning 3,360 2,405 0 0 5,765 24 2,203 3,538
Illinois Historic Sites 502 730 1,075 0 2,307 0 1,975 332
Illinois Military Family Relief 227 2,316 0 199 2,743 0 2,342 401
Illinois Pan Hellenic Trust 33 35 0 0 68 0 30 38
Illinois PGA Foundation Junior Golf 14 10 0 0 24 0 0 24
Illinois Power Agency Operations 0 3,250 0 0 3,250 0 3,240 10
Illinois Racing Quarterhorse Breeders
17 18 0 0 35 0 12 24
Illinois Route 66 Heritage Project 114 90 0 0 204 0 50 154
Illinois School Asbestos Abatement 453 620 0 0 1,072 13 697 362
Illinois Sports Facilities 0 37,513 0 0 37,513 0 37,513 0
Illinois Standardbred Breeders 717 3 0 1,680 2,400 0 1,481 919
Illinois State Dental Disciplinary 856 331 0 0 1,187 10 1,075 102
Illinois State Fair 498 5,874 0 0 6,372 0 5,882 490
Illinois State Medical Disciplinary 11,960 9,715 0 0 21,675 3,697 4,402 13,576
Illinois State Podiatric Disciplinary 549 53 0 0 602 168 11 422
Illinois Tax Increment 2,213 20,812 0 0 23,026 0 22,210 815
Illinois Thoroughbred Breeders 0 4 0 2,402 2,406 0 2,269 137
Illinois Underground Utility Facilities Damage Prevention
60 120 0 0 180 0 120 60
Illinois Veterans Assistance 2,672 1,477 0 0 4,148 118 3,930 100
Illinois Veterans' Homes 207 0 0 148 355 12 200 143
Illinois Veterans' Rehabilitation 1,179 0 0 4,682 5,860 90 4,665 1,105
Illinois Wildlife Preservation 679 27 96 215 1,017 0 435 582
Illinois Workers' Compensation Commission Operations
5,545 17,981 0 22,400 45,926 16,595 22,030 7,301
IMSA Income 1,388 1,504 0 0 2,892 6 2,042 844
Indigent BAIID 42 559 0 0 601 0 480 121
Industrial Hygiene Regulatory and Enforcement
5 4 0 0 9 0 5 4
Innovations in Long-Term Care Quality Demonstration Grants
1,359 1,168 0 0 2,527 0 2,459 68
Insurance Financial Regulation 13,073 19,649 0 0 32,722 4,586 11,632 16,504
Insurance Producer Administration 16,850 24,051 0 0 40,901 6,349 8,773 25,778
Intercity Passenger Rail 59 15 0 1,000 1,074 0 728 347
International and Promotional 235 526 0 0 760 2 485 274
International Tourism 7,679 10,542 0 0 18,221 3 4,608 13,610
Table IV-B - Appropriated Operating Funds by Fund for Fiscal Year 2010
Cash Basis
Fund Group and Fund Name
($ thousands)
CashBalance,Beginningof Year
plus Receipts
Revenue from
StateSources
FederalSources
TransfersIn
equals
TotalResources
minus Disbursements
TransfersOut
WarrantsIssued
equals
CashBalance,
End of Year
2 - 41
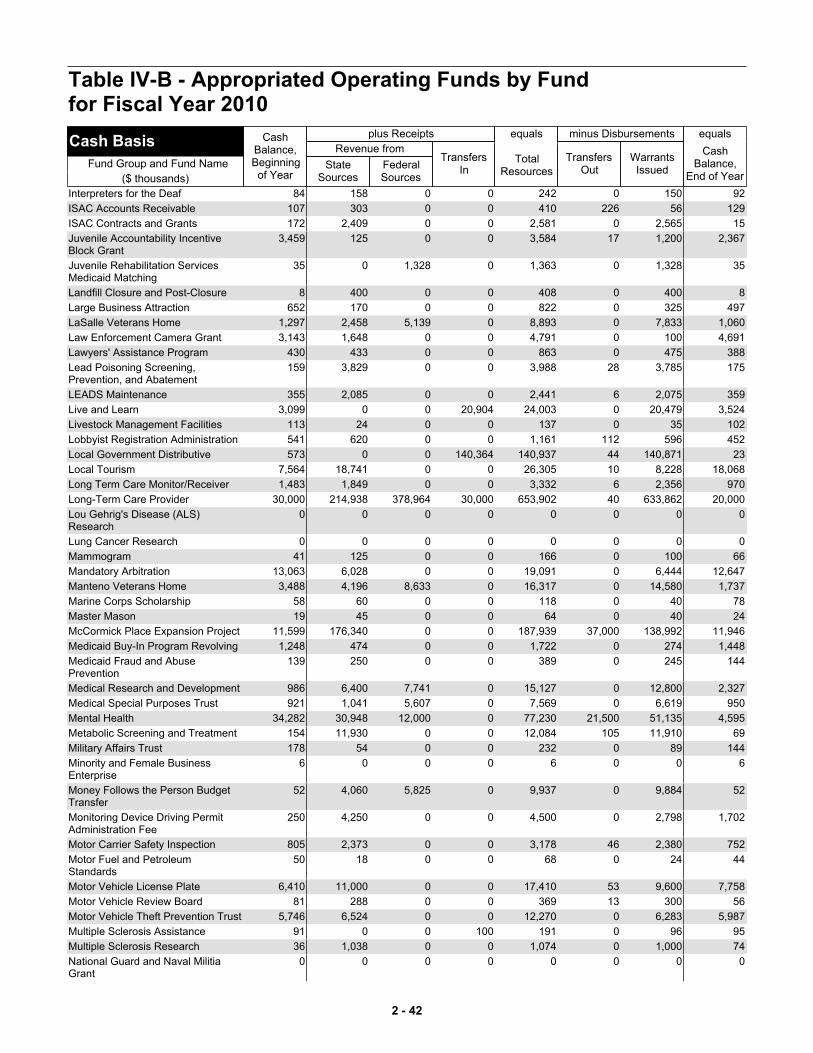
Interpreters for the Deaf 84 158 0 0 242 0 150 92
ISAC Accounts Receivable 107 303 0 0 410 226 56 129
ISAC Contracts and Grants 172 2,409 0 0 2,581 0 2,565 15
Juvenile Accountability Incentive Block Grant
3,459 125 0 0 3,584 17 1,200 2,367
Juvenile Rehabilitation Services Medicaid Matching
35 0 1,328 0 1,363 0 1,328 35
Landfill Closure and Post-Closure 8 400 0 0 408 0 400 8
Large Business Attraction 652 170 0 0 822 0 325 497
LaSalle Veterans Home 1,297 2,458 5,139 0 8,893 0 7,833 1,060
Law Enforcement Camera Grant 3,143 1,648 0 0 4,791 0 100 4,691
Lawyers' Assistance Program 430 433 0 0 863 0 475 388
Lead Poisoning Screening, Prevention, and Abatement
159 3,829 0 0 3,988 28 3,785 175
LEADS Maintenance 355 2,085 0 0 2,441 6 2,075 359
Live and Learn 3,099 0 0 20,904 24,003 0 20,479 3,524
Livestock Management Facilities 113 24 0 0 137 0 35 102
Lobbyist Registration Administration 541 620 0 0 1,161 112 596 452
Local Government Distributive 573 0 0 140,364 140,937 44 140,871 23
Local Tourism 7,564 18,741 0 0 26,305 10 8,228 18,068
Long Term Care Monitor/Receiver 1,483 1,849 0 0 3,332 6 2,356 970
Long-Term Care Provider 30,000 214,938 378,964 30,000 653,902 40 633,862 20,000
Lou Gehrig's Disease (ALS) Research
0 0 0 0 0 0 0 0
Lung Cancer Research 0 0 0 0 0 0 0 0
Mammogram 41 125 0 0 166 0 100 66
Mandatory Arbitration 13,063 6,028 0 0 19,091 0 6,444 12,647
Manteno Veterans Home 3,488 4,196 8,633 0 16,317 0 14,580 1,737
Marine Corps Scholarship 58 60 0 0 118 0 40 78
Master Mason 19 45 0 0 64 0 40 24
McCormick Place Expansion Project 11,599 176,340 0 0 187,939 37,000 138,992 11,946
Medicaid Buy-In Program Revolving 1,248 474 0 0 1,722 0 274 1,448
Medicaid Fraud and Abuse Prevention
139 250 0 0 389 0 245 144
Medical Research and Development 986 6,400 7,741 0 15,127 0 12,800 2,327
Medical Special Purposes Trust 921 1,041 5,607 0 7,569 0 6,619 950
Mental Health 34,282 30,948 12,000 0 77,230 21,500 51,135 4,595
Metabolic Screening and Treatment 154 11,930 0 0 12,084 105 11,910 69
Military Affairs Trust 178 54 0 0 232 0 89 144
Minority and Female Business Enterprise
6 0 0 0 6 0 0 6
Money Follows the Person Budget Transfer
52 4,060 5,825 0 9,937 0 9,884 52
Monitoring Device Driving Permit Administration Fee
250 4,250 0 0 4,500 0 2,798 1,702
Motor Carrier Safety Inspection 805 2,373 0 0 3,178 46 2,380 752
Motor Fuel and Petroleum Standards
50 18 0 0 68 0 24 44
Motor Vehicle License Plate 6,410 11,000 0 0 17,410 53 9,600 7,758
Motor Vehicle Review Board 81 288 0 0 369 13 300 56
Motor Vehicle Theft Prevention Trust 5,746 6,524 0 0 12,270 0 6,283 5,987
Multiple Sclerosis Assistance 91 0 0 100 191 0 96 95
Multiple Sclerosis Research 36 1,038 0 0 1,074 0 1,000 74
National Guard and Naval Militia Grant
0 0 0 0 0 0 0 0
Table IV-B - Appropriated Operating Funds by Fund for Fiscal Year 2010
Cash Basis
Fund Group and Fund Name
($ thousands)
CashBalance,Beginningof Year
plus Receipts
Revenue from
StateSources
FederalSources
TransfersIn
equals
TotalResources
minus Disbursements
TransfersOut
WarrantsIssued
equals
CashBalance,
End of Year
2 - 42
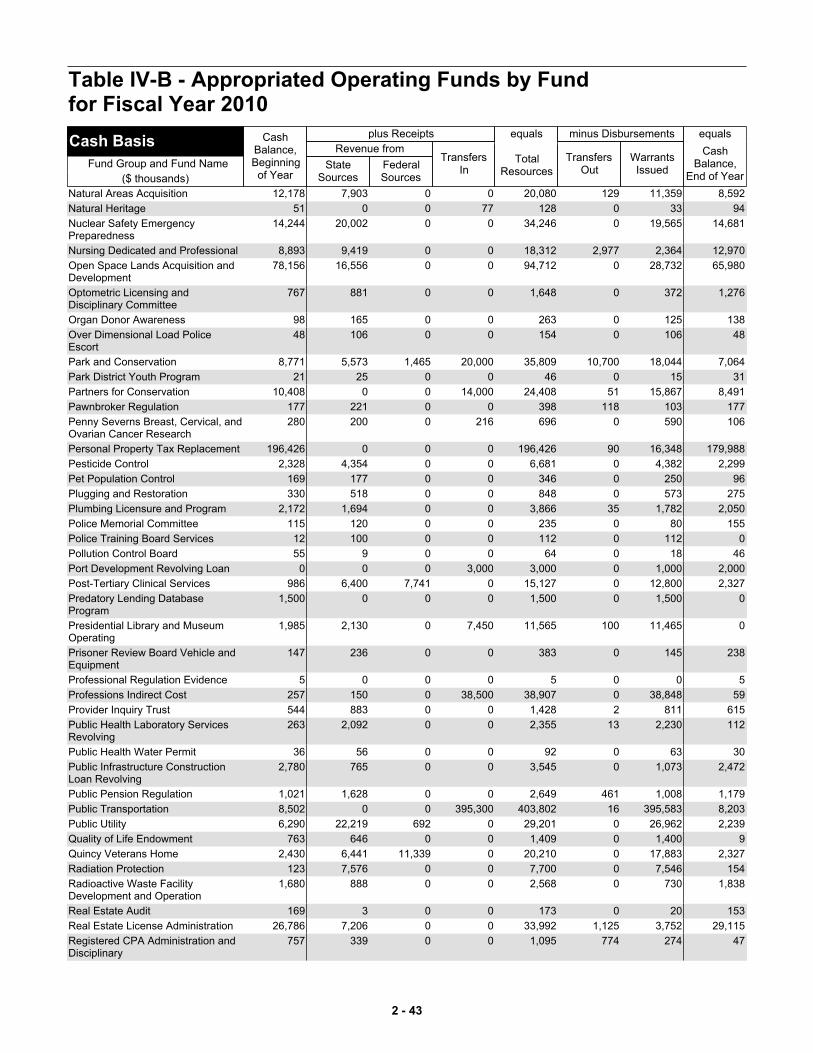
Natural Areas Acquisition 12,178 7,903 0 0 20,080 129 11,359 8,592
Natural Heritage 51 0 0 77 128 0 33 94
Nuclear Safety Emergency Preparedness
14,244 20,002 0 0 34,246 0 19,565 14,681
Nursing Dedicated and Professional 8,893 9,419 0 0 18,312 2,977 2,364 12,970
Open Space Lands Acquisition and Development
78,156 16,556 0 0 94,712 0 28,732 65,980
Optometric Licensing and Disciplinary Committee
767 881 0 0 1,648 0 372 1,276
Organ Donor Awareness 98 165 0 0 263 0 125 138
Over Dimensional Load Police Escort
48 106 0 0 154 0 106 48
Park and Conservation 8,771 5,573 1,465 20,000 35,809 10,700 18,044 7,064
Park District Youth Program 21 25 0 0 46 0 15 31
Partners for Conservation 10,408 0 0 14,000 24,408 51 15,867 8,491
Pawnbroker Regulation 177 221 0 0 398 118 103 177
Penny Severns Breast, Cervical, and Ovarian Cancer Research
280 200 0 216 696 0 590 106
Personal Property Tax Replacement 196,426 0 0 0 196,426 90 16,348 179,988
Pesticide Control 2,328 4,354 0 0 6,681 0 4,382 2,299
Pet Population Control 169 177 0 0 346 0 250 96
Plugging and Restoration 330 518 0 0 848 0 573 275
Plumbing Licensure and Program 2,172 1,694 0 0 3,866 35 1,782 2,050
Police Memorial Committee 115 120 0 0 235 0 80 155
Police Training Board Services 12 100 0 0 112 0 112 0
Pollution Control Board 55 9 0 0 64 0 18 46
Port Development Revolving Loan 0 0 0 3,000 3,000 0 1,000 2,000
Post-Tertiary Clinical Services 986 6,400 7,741 0 15,127 0 12,800 2,327
Predatory Lending Database Program
1,500 0 0 0 1,500 0 1,500 0
Presidential Library and Museum Operating
1,985 2,130 0 7,450 11,565 100 11,465 0
Prisoner Review Board Vehicle and Equipment
147 236 0 0 383 0 145 238
Professional Regulation Evidence 5 0 0 0 5 0 0 5
Professions Indirect Cost 257 150 0 38,500 38,907 0 38,848 59
Provider Inquiry Trust 544 883 0 0 1,428 2 811 615
Public Health Laboratory Services Revolving
263 2,092 0 0 2,355 13 2,230 112
Public Health Water Permit 36 56 0 0 92 0 63 30
Public Infrastructure Construction Loan Revolving
2,780 765 0 0 3,545 0 1,073 2,472
Public Pension Regulation 1,021 1,628 0 0 2,649 461 1,008 1,179
Public Transportation 8,502 0 0 395,300 403,802 16 395,583 8,203
Public Utility 6,290 22,219 692 0 29,201 0 26,962 2,239
Quality of Life Endowment 763 646 0 0 1,409 0 1,400 9
Quincy Veterans Home 2,430 6,441 11,339 0 20,210 0 17,883 2,327
Radiation Protection 123 7,576 0 0 7,700 0 7,546 154
Radioactive Waste Facility Development and Operation
1,680 888 0 0 2,568 0 730 1,838
Real Estate Audit 169 3 0 0 173 0 20 153
Real Estate License Administration 26,786 7,206 0 0 33,992 1,125 3,752 29,115
Registered CPA Administration and Disciplinary
757 339 0 0 1,095 774 274 47
Table IV-B - Appropriated Operating Funds by Fund for Fiscal Year 2010
Cash Basis
Fund Group and Fund Name
($ thousands)
CashBalance,Beginningof Year
plus Receipts
Revenue from
StateSources
FederalSources
TransfersIn
equals
TotalResources
minus Disbursements
TransfersOut
WarrantsIssued
equals
CashBalance,
End of Year
2 - 43

Registered Limited Liability Partnership
394 393 0 0 787 452 136 200
Regulatory Evaluation and Basic Enforcement
96 49 0 0 145 0 131 14
Renewable Energy Resources Trust 7,379 5,104 0 0 12,483 36 6,370 6,077
Rental Housing Support Program 12,353 16,214 0 0 28,567 0 27,100 1,467
RTA Occupation and Use Tax Replacement
1 0 0 27,228 27,229 1 27,228 0
Rural/Downstate Health Access 2 0 0 0 2 0 0 2
Safe Bottled Water 14 28 0 0 42 0 40 2
Salmon 186 264 0 0 450 0 319 130
Savings and Residential Finance Regulatory
34,832 9,885 0 0 44,717 4,240 5,182 35,295
School District Emergency Financial Assistance
1,259 602 0 0 1,861 0 0 1,861
School Infrastructure 17,991 156,000 0 62,125 236,116 210,000 745 25,371
School Technology Revolving Loan 1,799 3,308 0 0 5,107 0 2,905 2,202
Secretary of State DUI Administration
878 1,434 0 0 2,312 4 1,625 682
Secretary of State Evidence 5 1 0 0 6 0 3 3
Secretary of State Identification Security and Theft Prevention
20,900 0 0 7,875 28,775 50 12,400 16,325
Secretary of State Police DUI 16 15 0 0 31 0 15 16
Secretary of State Police Services 11 50 0 0 61 0 61 0
Secretary of State Special License Plate
1,570 5,200 0 0 6,770 24 4,600 2,147
Secretary of State Special Services 8,276 24,871 360 0 33,507 169 23,900 9,438
Secretary of State's Grant 1,065 300 0 0 1,365 0 325 1,040
Securities Audit and Enforcement 4,158 10,000 0 0 14,158 925 8,604 4,629
Securities Investors Education 3,098 1,000 0 0 4,098 755 720 2,623
Senior Citizens Real Estate Deferred Tax Revolving
779 3,892 0 0 4,671 0 4,350 321
September 11th 205 107 0 0 312 0 97 215
Sex Offender Investigation 2 7 0 0 9 0 9 1
Sex Offender Management Board 91 12 0 0 103 0 16 88
Sex Offender Registration 14 10 0 0 23 0 20 3
Sexual Assault Services 4 58 0 0 62 0 58 4
Small Business Environmental Assistance
97 301 0 0 398 2 340 56
Solid Waste Management 6,635 25,000 0 0 31,635 2,000 16,621 13,014
Spinal Cord Injury Paralysis Cure Research Trust
304 150 0 0 454 0 400 54
State and Local Sales Tax Reform 42,315 250,151 0 0 292,467 212,269 55,866 24,331
State Asset Forfeiture 1,094 2,770 0 0 3,864 8 3,563 293
State Boating Act 5,195 4,461 2,974 5,040 17,671 149 14,600 2,922
State College and University Trust 205 253 0 0 458 0 217 241
State Crime Laboratory 354 786 0 0 1,140 1 750 388
State Furbearer 136 84 0 14 234 0 90 144
State Gaming 6,850 549,579 0 0 556,429 430,000 112,791 13,638
State Library 2 7 0 0 9 0 7 2
State Lottery 9,855 974,256 0 0 984,111 645,000 331,462 7,649
State Migratory Waterfowl Stamp 2,576 760 0 0 3,336 0 461 2,874
State Offender DNA Identification System
1,368 2,688 0 0 4,055 2 3,262 792
State Parking Facility Maintenance 111 45 0 0 156 100 40 16
Table IV-B - Appropriated Operating Funds by Fund for Fiscal Year 2010
Cash Basis
Fund Group and Fund Name
($ thousands)
CashBalance,Beginningof Year
plus Receipts
Revenue from
StateSources
FederalSources
TransfersIn
equals
TotalResources
minus Disbursements
TransfersOut
WarrantsIssued
equals
CashBalance,
End of Year
2 - 44

State Parks 1,913 11,065 0 0 12,978 117 11,901 959
State Pensions 93,301 0 0 110,000 203,301 0 182,377 20,924
State Pheasant 326 419 0 77 822 0 322 500
State Police DUI 619 836 0 0 1,455 1 1,150 304
State Police Services 7,257 31,026 35 0 38,317 260 33,936 4,122
State Police Vehicle 3,163 10,656 0 0 13,819 0 9,900 3,919
State Police Vehicle Maintenance 0 50 0 0 50 0 50 0
State Police Whistleblower Reward and Protection
20,431 2,500 0 0 22,931 2 17,251 5,679
State Police Wireless Service Emergency
2,354 1,616 0 0 3,970 0 1,888 2,082
State Treasurer's Bank Services Trust
6,226 0 0 7,020 13,246 0 6,266 6,980
State's Attorneys Appellate Prosecutor's County
485 1,672 0 0 2,157 0 1,985 172
Subtitle D Management 583 2,785 0 0 3,368 0 2,917 451
Supplemental Low-Income Energy Assistance
24,469 102,982 0 75 127,527 0 100,851 26,675
Support Our Troops 0 5 0 0 5 0 0 5
Supreme Court Historic Preservation 4,248 75 0 0 4,323 0 3,000 1,323
Tanning Facility Permit 19 303 0 0 321 5 285 32
Tattoo and Body Piercing Establishment Registration
15 300 0 0 315 0 299 16
Tax Compliance and Administration 885 2,277 0 854 4,016 25 3,984 8
Tax Recovery 971 371 0 0 1,342 0 212 1,130
Teacher Certificate Fee Revolving 24 1,620 0 0 1,644 0 1,612 32
Temporary Relocation Expenses Revolving Grant
618 663 0 0 1,281 0 562 719
Ticket For The Cure 1,327 2,156 0 0 3,483 0 3,165 318
Tobacco Settlement Recovery 81,526 317,948 439,709 0 839,183 0 760,265 78,918
TOMA Consumer Protection 110 0 0 0 110 0 20 90
Tourism Promotion 38,686 0 0 46,800 85,486 93 37,240 48,152
Traffic and Criminal Conviction Surcharge
7,139 20,000 0 0 27,139 0 19,869 7,271
Transportation Regulatory 4,234 9,209 0 2,250 15,693 300 12,239 3,154
Transportation Safety Highway Hire-back
36 300 0 0 336 0 300 36
Trauma Center 9,696 12,730 9,741 0 32,167 11 21,609 10,547
Underground Resources Conservation Enforcement
203 659 0 0 862 0 823 39
Underground Storage Tank 3,599 73,568 0 0 77,167 13,993 59,033 4,141
University Grant 68 70 0 0 138 0 70 68
University of Illinois Hospital Services
0 82,004 163,296 44,700 290,000 20,000 270,000 0
Used Tire Management 5,738 13,983 0 0 19,722 0 9,211 10,510
Vehicle Inspection 8,133 31 0 30,000 38,164 45 23,137 14,982
Vince Demuzio Memorial Colon Cancer
0 0 0 0 0 0 0 0
Violence Prevention 106 481 0 1,400 1,987 0 1,898 89
Violent Crime Victims Assistance 759 9,647 0 0 10,406 0 10,399 7
Water Revolving 426,199 153,250 622,600 0 1,202,049 0 771,214 430,835
Weights and Measures 3,798 4,300 0 0 8,098 0 4,400 3,698
Wildlife and Fish 14,841 40,122 12,497 0 67,460 0 65,030 2,430
Wildlife Prairie Park 8 23 0 0 31 0 30 1
Wireless Carrier Reimbursement 12,518 14,888 0 0 27,406 5,000 9,000 13,406
Table IV-B - Appropriated Operating Funds by Fund for Fiscal Year 2010
Cash Basis
Fund Group and Fund Name
($ thousands)
CashBalance,Beginningof Year
plus Receipts
Revenue from
StateSources
FederalSources
TransfersIn
equals
TotalResources
minus Disbursements
TransfersOut
WarrantsIssued
equals
CashBalance,
End of Year
2 - 45
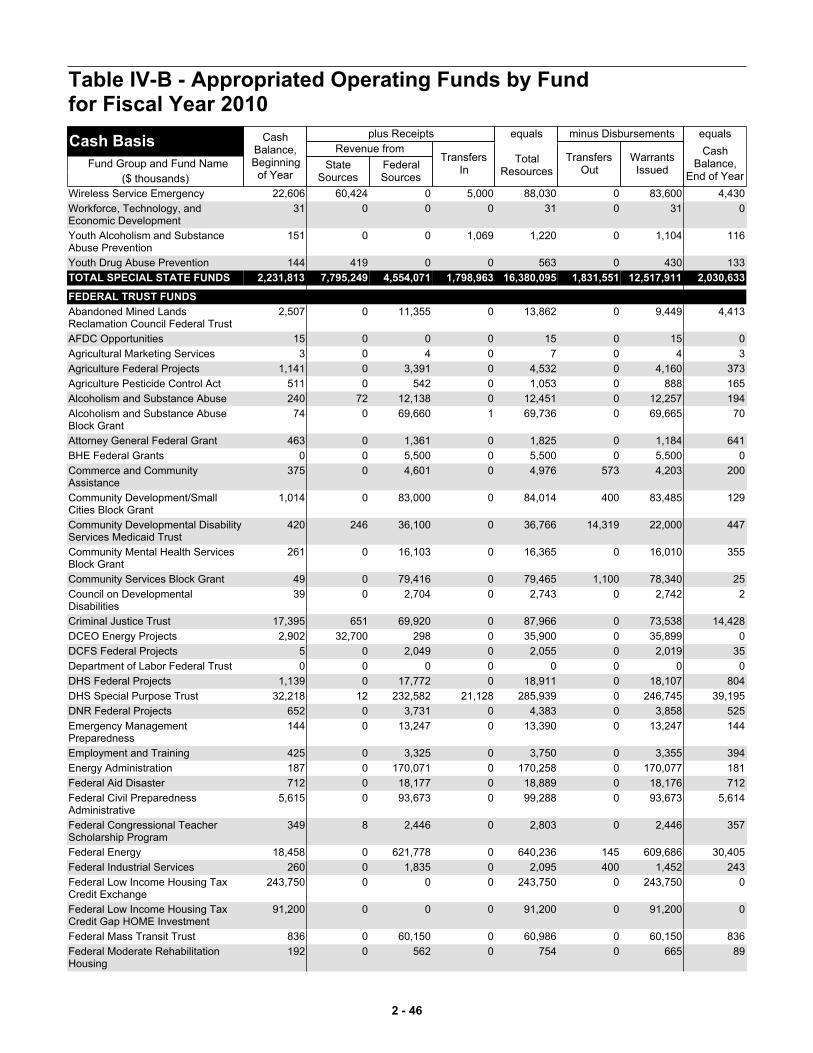
Wireless Service Emergency 22,606 60,424 0 5,000 88,030 0 83,600 4,430
Workforce, Technology, and Economic Development
31 0 0 0 31 0 31 0
Youth Alcoholism and Substance Abuse Prevention
151 0 0 1,069 1,220 0 1,104 116
Youth Drug Abuse Prevention 144 419 0 0 563 0 430 133
TOTAL SPECIAL STATE FUNDS 2,231,813 7,795,249 4,554,071 1,798,963 16,380,095 1,831,551 12,517,911 2,030,633
FEDERAL TRUST FUNDS
Abandoned Mined Lands Reclamation Council Federal Trust
2,507 0 11,355 0 13,862 0 9,449 4,413
AFDC Opportunities 15 0 0 0 15 0 15 0
Agricultural Marketing Services 3 0 4 0 7 0 4 3
Agriculture Federal Projects 1,141 0 3,391 0 4,532 0 4,160 373
Agriculture Pesticide Control Act 511 0 542 0 1,053 0 888 165
Alcoholism and Substance Abuse 240 72 12,138 0 12,451 0 12,257 194
Alcoholism and Substance Abuse Block Grant
74 0 69,660 1 69,736 0 69,665 70
Attorney General Federal Grant 463 0 1,361 0 1,825 0 1,184 641
BHE Federal Grants 0 0 5,500 0 5,500 0 5,500 0
Commerce and Community Assistance
375 0 4,601 0 4,976 573 4,203 200
Community Development/Small Cities Block Grant
1,014 0 83,000 0 84,014 400 83,485 129
Community Developmental Disability Services Medicaid Trust
420 246 36,100 0 36,766 14,319 22,000 447
Community Mental Health Services Block Grant
261 0 16,103 0 16,365 0 16,010 355
Community Services Block Grant 49 0 79,416 0 79,465 1,100 78,340 25
Council on Developmental Disabilities
39 0 2,704 0 2,743 0 2,742 2
Criminal Justice Trust 17,395 651 69,920 0 87,966 0 73,538 14,428
DCEO Energy Projects 2,902 32,700 298 0 35,900 0 35,899 0
DCFS Federal Projects 5 0 2,049 0 2,055 0 2,019 35
Department of Labor Federal Trust 0 0 0 0 0 0 0 0
DHS Federal Projects 1,139 0 17,772 0 18,911 0 18,107 804
DHS Special Purpose Trust 32,218 12 232,582 21,128 285,939 0 246,745 39,195
DNR Federal Projects 652 0 3,731 0 4,383 0 3,858 525
Emergency Management Preparedness
144 0 13,247 0 13,390 0 13,247 144
Employment and Training 425 0 3,325 0 3,750 0 3,355 394
Energy Administration 187 0 170,071 0 170,258 0 170,077 181
Federal Aid Disaster 712 0 18,177 0 18,889 0 18,176 712
Federal Civil Preparedness Administrative
5,615 0 93,673 0 99,288 0 93,673 5,614
Federal Congressional Teacher Scholarship Program
349 8 2,446 0 2,803 0 2,446 357
Federal Energy 18,458 0 621,778 0 640,236 145 609,686 30,405
Federal Industrial Services 260 0 1,835 0 2,095 400 1,452 243
Federal Low Income Housing Tax Credit Exchange
243,750 0 0 0 243,750 0 243,750 0
Federal Low Income Housing Tax Credit Gap HOME Investment
91,200 0 0 0 91,200 0 91,200 0
Federal Mass Transit Trust 836 0 60,150 0 60,986 0 60,150 836
Federal Moderate Rehabilitation Housing
192 0 562 0 754 0 665 89
Table IV-B - Appropriated Operating Funds by Fund for Fiscal Year 2010
Cash Basis
Fund Group and Fund Name
($ thousands)
CashBalance,Beginningof Year
plus Receipts
Revenue from
StateSources
FederalSources
TransfersIn
equals
TotalResources
minus Disbursements
TransfersOut
WarrantsIssued
equals
CashBalance,
End of Year
2 - 46
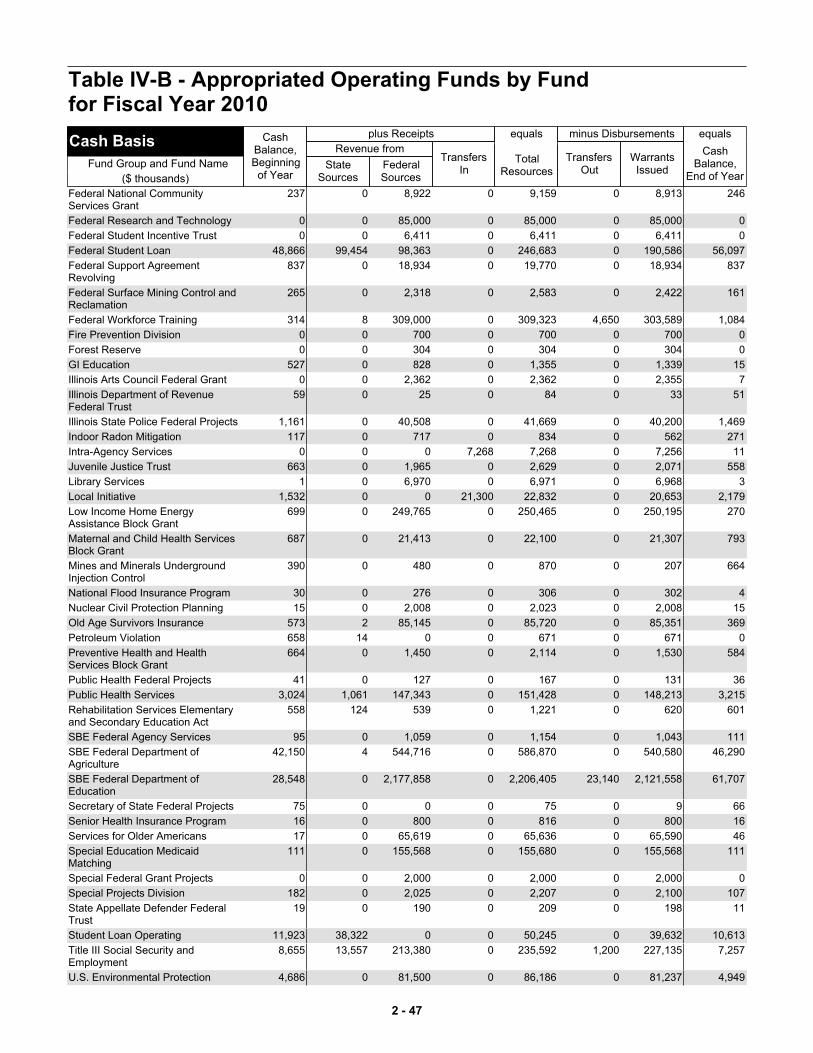
Federal National Community Services Grant
237 0 8,922 0 9,159 0 8,913 246
Federal Research and Technology 0 0 85,000 0 85,000 0 85,000 0
Federal Student Incentive Trust 0 0 6,411 0 6,411 0 6,411 0
Federal Student Loan 48,866 99,454 98,363 0 246,683 0 190,586 56,097
Federal Support Agreement Revolving
837 0 18,934 0 19,770 0 18,934 837
Federal Surface Mining Control and Reclamation
265 0 2,318 0 2,583 0 2,422 161
Federal Workforce Training 314 8 309,000 0 309,323 4,650 303,589 1,084
Fire Prevention Division 0 0 700 0 700 0 700 0
Forest Reserve 0 0 304 0 304 0 304 0
GI Education 527 0 828 0 1,355 0 1,339 15
Illinois Arts Council Federal Grant 0 0 2,362 0 2,362 0 2,355 7
Illinois Department of Revenue Federal Trust
59 0 25 0 84 0 33 51
Illinois State Police Federal Projects 1,161 0 40,508 0 41,669 0 40,200 1,469
Indoor Radon Mitigation 117 0 717 0 834 0 562 271
Intra-Agency Services 0 0 0 7,268 7,268 0 7,256 11
Juvenile Justice Trust 663 0 1,965 0 2,629 0 2,071 558
Library Services 1 0 6,970 0 6,971 0 6,968 3
Local Initiative 1,532 0 0 21,300 22,832 0 20,653 2,179
Low Income Home Energy Assistance Block Grant
699 0 249,765 0 250,465 0 250,195 270
Maternal and Child Health Services Block Grant
687 0 21,413 0 22,100 0 21,307 793
Mines and Minerals Underground Injection Control
390 0 480 0 870 0 207 664
National Flood Insurance Program 30 0 276 0 306 0 302 4
Nuclear Civil Protection Planning 15 0 2,008 0 2,023 0 2,008 15
Old Age Survivors Insurance 573 2 85,145 0 85,720 0 85,351 369
Petroleum Violation 658 14 0 0 671 0 671 0
Preventive Health and Health Services Block Grant
664 0 1,450 0 2,114 0 1,530 584
Public Health Federal Projects 41 0 127 0 167 0 131 36
Public Health Services 3,024 1,061 147,343 0 151,428 0 148,213 3,215
Rehabilitation Services Elementary and Secondary Education Act
558 124 539 0 1,221 0 620 601
SBE Federal Agency Services 95 0 1,059 0 1,154 0 1,043 111
SBE Federal Department of Agriculture
42,150 4 544,716 0 586,870 0 540,580 46,290
SBE Federal Department of Education
28,548 0 2,177,858 0 2,206,405 23,140 2,121,558 61,707
Secretary of State Federal Projects 75 0 0 0 75 0 9 66
Senior Health Insurance Program 16 0 800 0 816 0 800 16
Services for Older Americans 17 0 65,619 0 65,636 0 65,590 46
Special Education Medicaid Matching
111 0 155,568 0 155,680 0 155,568 111
Special Federal Grant Projects 0 0 2,000 0 2,000 0 2,000 0
Special Projects Division 182 0 2,025 0 2,207 0 2,100 107
State Appellate Defender Federal Trust
19 0 190 0 209 0 198 11
Student Loan Operating 11,923 38,322 0 0 50,245 0 39,632 10,613
Title III Social Security and Employment
8,655 13,557 213,380 0 235,592 1,200 227,135 7,257
U.S. Environmental Protection 4,686 0 81,500 0 86,186 0 81,237 4,949
Table IV-B - Appropriated Operating Funds by Fund for Fiscal Year 2010
Cash Basis
Fund Group and Fund Name
($ thousands)
CashBalance,Beginningof Year
plus Receipts
Revenue from
StateSources
FederalSources
TransfersIn
equals
TotalResources
minus Disbursements
TransfersOut
WarrantsIssued
equals
CashBalance,
End of Year
2 - 47
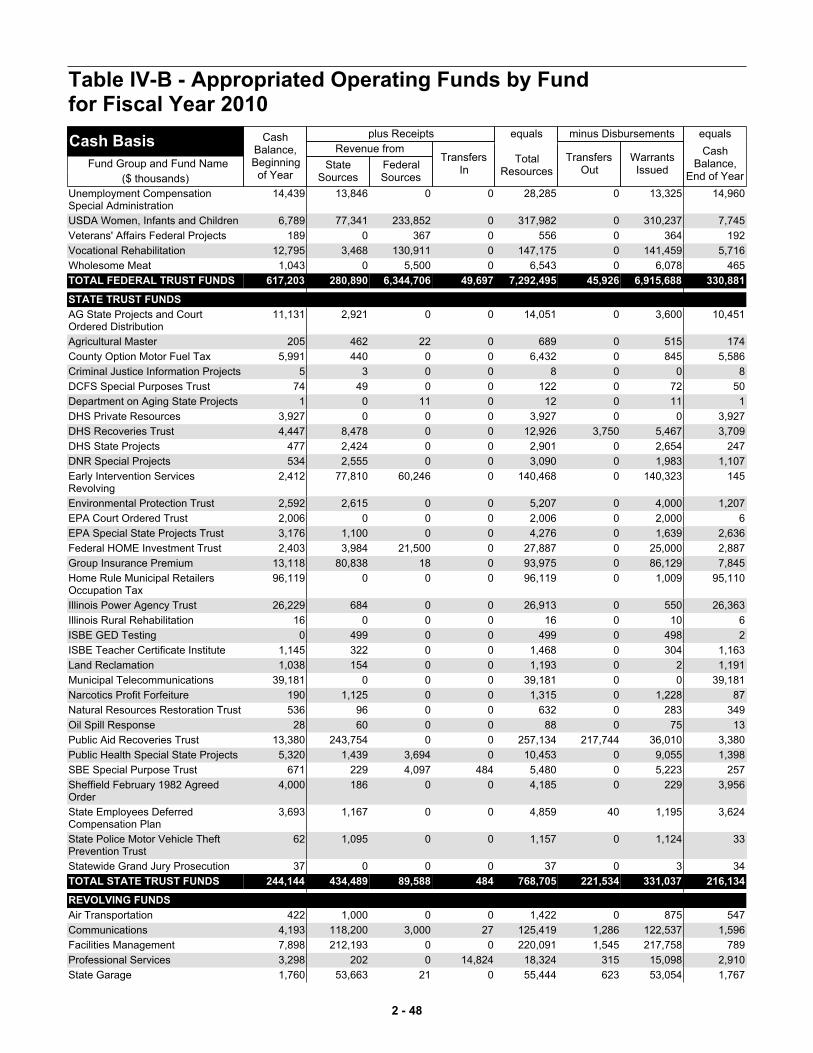
Unemployment Compensation Special Administration
14,439 13,846 0 0 28,285 0 13,325 14,960
USDA Women, Infants and Children 6,789 77,341 233,852 0 317,982 0 310,237 7,745
Veterans' Affairs Federal Projects 189 0 367 0 556 0 364 192
Vocational Rehabilitation 12,795 3,468 130,911 0 147,175 0 141,459 5,716
Wholesome Meat 1,043 0 5,500 0 6,543 0 6,078 465
TOTAL FEDERAL TRUST FUNDS 617,203 280,890 6,344,706 49,697 7,292,495 45,926 6,915,688 330,881
STATE TRUST FUNDS
AG State Projects and Court Ordered Distribution
11,131 2,921 0 0 14,051 0 3,600 10,451
Agricultural Master 205 462 22 0 689 0 515 174
County Option Motor Fuel Tax 5,991 440 0 0 6,432 0 845 5,586
Criminal Justice Information Projects 5 3 0 0 8 0 0 8
DCFS Special Purposes Trust 74 49 0 0 122 0 72 50
Department on Aging State Projects 1 0 11 0 12 0 11 1
DHS Private Resources 3,927 0 0 0 3,927 0 0 3,927
DHS Recoveries Trust 4,447 8,478 0 0 12,926 3,750 5,467 3,709
DHS State Projects 477 2,424 0 0 2,901 0 2,654 247
DNR Special Projects 534 2,555 0 0 3,090 0 1,983 1,107
Early Intervention Services Revolving
2,412 77,810 60,246 0 140,468 0 140,323 145
Environmental Protection Trust 2,592 2,615 0 0 5,207 0 4,000 1,207
EPA Court Ordered Trust 2,006 0 0 0 2,006 0 2,000 6
EPA Special State Projects Trust 3,176 1,100 0 0 4,276 0 1,639 2,636
Federal HOME Investment Trust 2,403 3,984 21,500 0 27,887 0 25,000 2,887
Group Insurance Premium 13,118 80,838 18 0 93,975 0 86,129 7,845
Home Rule Municipal Retailers Occupation Tax
96,119 0 0 0 96,119 0 1,009 95,110
Illinois Power Agency Trust 26,229 684 0 0 26,913 0 550 26,363
Illinois Rural Rehabilitation 16 0 0 0 16 0 10 6
ISBE GED Testing 0 499 0 0 499 0 498 2
ISBE Teacher Certificate Institute 1,145 322 0 0 1,468 0 304 1,163
Land Reclamation 1,038 154 0 0 1,193 0 2 1,191
Municipal Telecommunications 39,181 0 0 0 39,181 0 0 39,181
Narcotics Profit Forfeiture 190 1,125 0 0 1,315 0 1,228 87
Natural Resources Restoration Trust 536 96 0 0 632 0 283 349
Oil Spill Response 28 60 0 0 88 0 75 13
Public Aid Recoveries Trust 13,380 243,754 0 0 257,134 217,744 36,010 3,380
Public Health Special State Projects 5,320 1,439 3,694 0 10,453 0 9,055 1,398
SBE Special Purpose Trust 671 229 4,097 484 5,480 0 5,223 257
Sheffield February 1982 Agreed Order
4,000 186 0 0 4,185 0 229 3,956
State Employees Deferred Compensation Plan
3,693 1,167 0 0 4,859 40 1,195 3,624
State Police Motor Vehicle Theft Prevention Trust
62 1,095 0 0 1,157 0 1,124 33
Statewide Grand Jury Prosecution 37 0 0 0 37 0 3 34
TOTAL STATE TRUST FUNDS 244,144 434,489 89,588 484 768,705 221,534 331,037 216,134
REVOLVING FUNDS
Air Transportation 422 1,000 0 0 1,422 0 875 547
Communications 4,193 118,200 3,000 27 125,419 1,286 122,537 1,596
Facilities Management 7,898 212,193 0 0 220,091 1,545 217,758 789
Professional Services 3,298 202 0 14,824 18,324 315 15,098 2,910
State Garage 1,760 53,663 21 0 55,444 623 53,054 1,767
Table IV-B - Appropriated Operating Funds by Fund for Fiscal Year 2010
Cash Basis
Fund Group and Fund Name
($ thousands)
CashBalance,Beginningof Year
plus Receipts
Revenue from
StateSources
FederalSources
TransfersIn
equals
TotalResources
minus Disbursements
TransfersOut
WarrantsIssued
equals
CashBalance,
End of Year
2 - 48
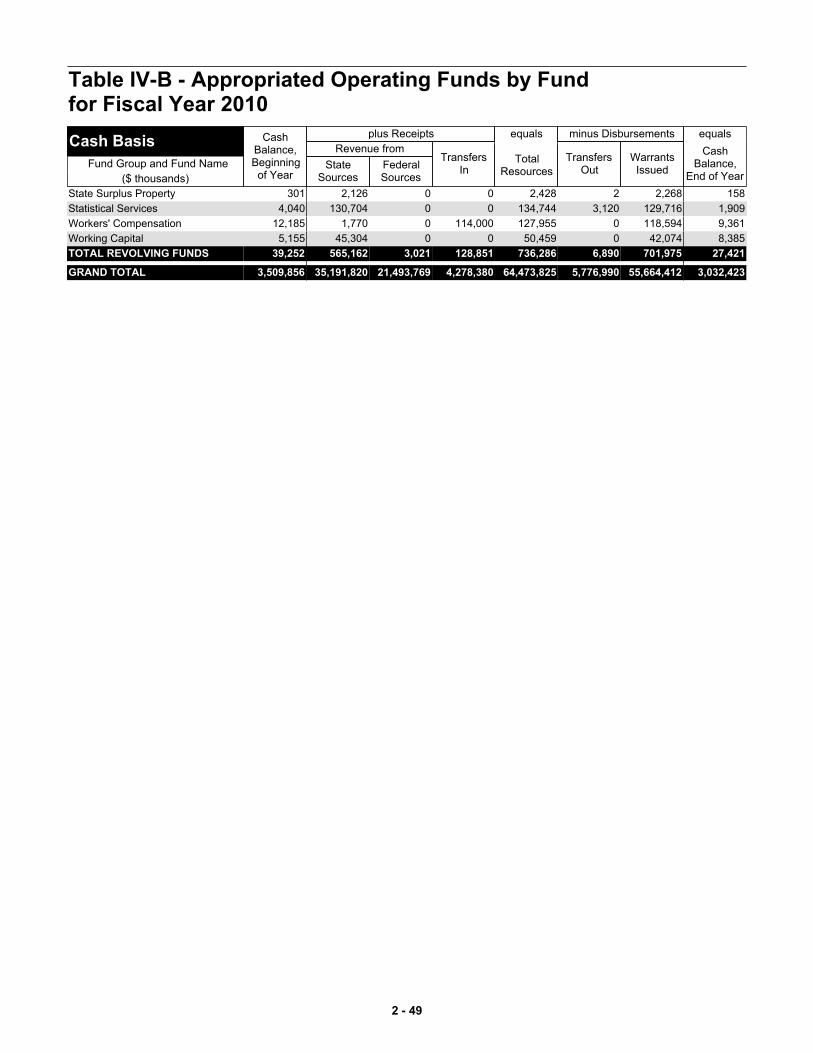
State Surplus Property 301 2,126 0 0 2,428 2 2,268 158
Statistical Services 4,040 130,704 0 0 134,744 3,120 129,716 1,909
Workers' Compensation 12,185 1,770 0 114,000 127,955 0 118,594 9,361
Working Capital 5,155 45,304 0 0 50,459 0 42,074 8,385
TOTAL REVOLVING FUNDS 39,252 565,162 3,021 128,851 736,286 6,890 701,975 27,421
GRAND TOTAL 3,509,856 35,191,820 21,493,769 4,278,380 64,473,825 5,776,990 55,664,412 3,032,423
Table IV-B - Appropriated Operating Funds by Fund for Fiscal Year 2010
Cash Basis
Fund Group and Fund Name
($ thousands)
CashBalance,Beginningof Year
plus Receipts
Revenue from
StateSources
FederalSources
TransfersIn
equals
TotalResources
minus Disbursements
TransfersOut
WarrantsIssued
equals
CashBalance,
End of Year
2 - 49

2 - 50
Shared Services
www.state.il.us/budget
CHAPTER 3

Shared Services
www.sharedservices.illinois.gov108 State House
Springfield, IL 62706217.782.4520
STATE OF ILLINOIS SHARED SERVICES
http://www.sharedservices.illinois.gov Working Together to Create a More Efficient State Government.
PROGRAM VISION
The vision of the Shared Services Program is to redesign and reorganize state fiscal and human resources (HR) functions to achieve maximum efficiency and effectiveness. The primary objectives of the Shared Services Program are to:
• Increase the quality and consistency of fiscal and HR-related information for better decision-making and improved management of state operations.
• Increase the overall efficiency of the delivery of these services.
• Promote cross-training and implement a more effective knowledge transfer among fiscal and HR personnel.
To achieve these goals, Shared Services has been created based on several leading practices:
• Reorganization based on client needs. Government reorganizations have historically been marked by the centralization of functions into individual bureaus based on narrowly-defined business processes, such as procurement and sourcing or HR-benefits. Often this results in “siloed” organizations that encounter difficulties addressing issues outside specialized scopes of service and meeting the vastly diverse service needs of all client agencies.
Shared Services reorganization is different in two important ways. First, rather than creating one center to serve all state agencies, the state is creating five unique Shared Services Centers, each of which will be dedicated to meeting the fiscal and HR needs of a group of client agencies who share similar agency missions. This will allow the centers to stay focused on meeting a select type of service need and not become over stretched.
Second, instead of centralizing based on business process, the Shared Services Program is reorganizing operations into vertically-integrated Shared Services centers, which will provide a full array of fiscal and HR services. For example, each center will not only provide procurement-specific services like bid solicitation, but also closely related services such as accounts payable, contract monitoring and general accounting, etc. Thus, the centers will serve agencies in a holistic, client-oriented approach, and agencies will enjoy one-stop-shopping for their fiscal and HR service needs.
• Commitment to business process
improvement. Consolidating offices to achieve “economies of scale” has been shown to produce a decrease in the overall long-term costs of performing the service, but with limited potential for broader improvements. The Shared Services Program is taking a much more expansive approach to reorganization of services by launching the following initiatives:
o Implementing a uniform accounting and
human resources system, the Illinois Statewide Information System (ISIS), to support streamlined business processes and provide business users with reliable, real-time access to robust and consistent fiscal and human resources information.
o Updating and standardizing fiscal and human
resource related policies to be in line with mainstream business process needs and demands.
3 - 1

Shared Services
www.sharedservices.illinois.gov108 State House
Springfield, IL 62706217.782.4520
Currently, the state is facing many challenges related to its internal fiscal and HR operations: • Fiscal and HR processes are dependent upon
over 700 unique fiscal, HR and payroll systems, many of which are over 20-years-old. As current systems continue to age, their relative functionality decreases, leading to costly band-aid system maintenance and the creation of ad hoc systems to keep up with evolving needs. Traumatic system failures pose a constant looming threat.
• Inconsistent processes and incompatible,
technologically-obsolete systems create major operational inefficiencies. Fiscal and HR information, which is extremely data-intensive, must be manually entered and re-entered multiple times into multiple systems, and continually reconciled from one system to another.
• Basic business tools such as timely reports are largely dependent upon manual paper-based processes. As a result, the information needed for optimal management of state operations is too often either incomplete or unavailable in a timely manner, or both.
• The performance of the current fiscal and HR operations relies too heavily on the institutional knowledge of some of the state’s longest serving employees, one-third of whom will be eligible for retirement within the next five years, according to the State Employees Retirement System. When those employees leave state employment, the state will be losing both dedicated employees and their institutional knowledge that is necessary to maintain current fiscal and HR operational levels.
MAJOR MILESTONES IN PROGRAM HISTORY Fiscal Year 2006 • Evaluation and program launch. In early fiscal
year 2006, the Governor’s Office of Management and Budget formed a working group of key state and agency leaders to assess operational issues and identify and evaluate solutions. The working group initially identified four major service areas poised for major improvement. Further evaluation and deliberation resulted in a
decision to focus on improving fiscal and HR operations, and to do so by launching a Shared Services Program, based on client-oriented Shared Services centers.
• Shared Services Center creation and program
staffing. In March 2006 Executive Order 2006-06 created the first two Shared Services Centers: the Public Safety Center and the Administrative and Regulatory Center.
Fiscal Year 2007 Fiscal year 2007 included efforts to plan and design the future shared services environment. Major activities included: • Business Process Redesign. The Business
Process Redesign (BPR) project was launched to create standardized fiscal and HR processes to be implemented in step with ISIS launch. Standardization of business processes enables greater process transparency and a more flexible workforce.
• Determining information technology needs. The program successfully created an application profile database, which identifies all IT applications at each state agency that have “touch-points” with fiscal and HR processes and how these applications integrate with each other. The IT team also collected an extensive list of functional and technical requirements that a new system will need to meet.
• Managing the change process. In fiscal year
2007 the program leadership began a number of change management activities, including:
o Hosting demonstrations of procurable fiscal
and HR systems by industry-leading vendors.
o Launching a publicly-viewable program
website outlining program activities.
o Creating a monthly program newsletter, which is available online and mailed to over 900 project participants.
o Meeting extensively with agency leaders and
other stakeholders to note concerns and provide important information.
3 - 2
Shared Services
www.sharedservices.illinois.gov108 State House
Springfield, IL 62706217.782.4520
o Building intranet team sites to enable project participants and stakeholders to have reliable, real-time access to key project documents and information.
Fiscal Year 2008 By November 2007, the Shared Services Program successfully transitioned the majority of human resources operations to the Public Safety Center and the Administrative and Regulatory Center from their respective client agencies. The Interim Business Process Mapping (IBPM) project was launched to guard against the risk of operational failures during and after interim transition of operations to the centers. In June 2007 through August 2007, fiscal and HR subject matter experts from the Administrative and Regulatory and Public Safety agencies, leaders from the Shared Services Program, and leading process design consultants reconvened in multiple day-long meetings to document current as-is fiscal and HR processes across agencies to be transitioned, noting critical touch-points such as signatures and document hand-offs. This project laid the foundation for the successful and seamless transition of services to a shared services environment. The project was repeated in December 2007 through February 2008 for the Environmental and Economic Development Center. Early in fiscal year 2008, a Cost Allocation Working Group (CAWG) was launched, with the specific goal of researching, developing, and recommending methodologies by which the monetary value of services provided by Shared Services centers could be most accurately quantified. In the near future, CAWG will be preparing an initial proposal to be submitted to the federal government, to inform them of the state’s plans to measure the costs of services the centers are providing. In August 2007, the Shared Services Program issued an RFP for statewide timekeeping solutions seeking to address various inefficiencies with current manual, paper-based timekeeping processes. This RFP was created with strategic business and IT input, and included functional and technical requirements that were developed throughout the design process in fiscal year 2007. Kronos Incorporated was selected as the winner of this procurement in May.
• In March 2008 CMS issued an RFP for ISIS software.
Fiscal Year 2009 • Transition of fiscal operations. In November
2008, the Shared Services Program successfully transitioned the majority of fiscal operations to the Public Safety Center and the Administrative and Regulatory Center from their respective client agencies.
• ISIS software procurement. Central
Management Services and the Shared Services Program made tremendous progress in this area.
• Statewide timekeeping project. CMS Bureau
of Communications and Computer Services (BCCS), the state’s enterprise IT organization, was tapped to manage the implementation of the Kronos solution.
• Cost allocation. The Shared Services Program
has laid the groundwork for a cost allocation approach for the operations of the Shared Services Centers.
ACTIVITIES PROJECTED FOR FISCAL YEAR 2010 The following is a list of major projects for the Shared Services Program for fiscal year 2010: • ISIS software selection • Issue RFP for ISIS integration services. • Continue identifying and implementing interim
service improvements at the Administrative and Regulatory and Public Safety Centers.
IMPORTANCE OF NEW SYSTEMS In a day and age when Illinois residents can view bank balances and view pending and posted bank transactions online in real-time, the state finds itself in a precarious and unenviable situation in which having immediate access to real-time financial and HR data enterprise-wide is nearly impossible. The state’s fiscal and HR operations are currently dependent on more than 700 unique information systems, some which are over two decades old and many that are not integrated with one another.
3 - 3
Shared Services
www.sharedservices.illinois.gov108 State House
Springfield, IL 62706217.782.4520
The result is that critical business information for making sound, everyday decisions is often incomplete or outdated. This severely limits the state’s ability to analyze business functions for operational improvement and to take corrective or diligent action. The Shared Services Program is not solely focused on technology improvements. For example, updated policies and the creation of dynamic, client-focused service centers have the potential to provide appreciable internal service improvements in the near term. But a single, integrated source of fiscal and HR information and related process efficiencies cannot be realized without the support of a new robust system like ISIS. Essentially, processes can only be as efficient as the IT systems that support them, and fiscal and HR employees can only be as productive as their tools, i.e., their fiscal and HR IT systems, empower them to be.
RESOURCES FOR FURTHER INFORMATION The Shared Services Program is committed to keeping stakeholders and interested parties informed of important developments and events related to the Shared Services Program. Interested parties should visit the program’s public web site at: www.sharedservices.illinois.gov
3 - 4
PUBLIC RETIREMENT SYSTEMS
www.state.il.us/budget
CHAPTER 4

Public Retirement Systems
OVERVIEW Funding the accrued pension liability of the five state retirement systems is Illinois government’s single greatest financial challenge. For decades, Illinois’ unfunded pension liability has been significantly greater than all of the state’s bonded debt combined.
The five state-sponsored retirement systems provide benefits to eligible public employees, public school teachers, public university and community college personnel, judges and members of the General Assembly. Contributions and investment income provide for the payment of benefits, refunds, administrative costs and the purchase of fund investments.
The following table shows the active and retired workforce by system. A table of current and estimated assets, liabilities and funded ratios is included at the end of this chapter.
Members of the Illinois Retirement Systems
Pension Fund June 30, 2008 Members Annuitants
Teachers 265,735 91,497
University 159,795 45,346
State Employees 87,916 56,111
Judges 982 956
General Assembly 257 395
Total 514,685 194,305
FUNDING HISTORY
The five state retirement systems have been under-funded each year since the 1970s. State pension contributions were inadequate even during good economic times.
By 1995, the unfunded liability was almost $20 billion. To address this issue, the state enacted an annual funding schedule that became effective in fiscal year 1996 and is sometimes referred to as “the 50-year funding plan.” By 2010 and through 2045, state employees’ contributions for pensions are to be maintained as a level percent of payroll adequate to achieve 90 percent funding of retirement systems liabilities by 2045. Adopting a statutory payment plan for the state pension systems was necessary. However, the 50-year funding plan was structurally unaffordable from the moment it was enacted. It did not reduce
principal until 2034, did not pay the annual interest cost, and incorporated a ramp-up period of 15 years that increased contributions over an arbitrary starting level. This had the result of deferring the entire 1995 unfunded liability of $19.5 billion almost 40 years, while allowing this deferral to grow at a set rate of 8.5 percent annually.
Left unchecked, this $19.5 billion debt grew to $43 billion by 2003. This growth in unfunded liability was exacerbated by benefit enhancements enacted in the late 1990s through 2002 without any corresponding state funding.
ACTIONS TAKEN TO IMPROVE FUNDING AND SECURE PENSIONS Issuance of Pension Obligation Bonds During June 2003, the state first took action by issuing $10 billion of pension obligation bonds at an interest rate of 5.05 percent. This transaction was within one-tenth of one percent of the lowest long term interest rate in 30 years. The bonds were the first bonds issued by a governmental entity to be awarded the Moody’s Investors Service “AAA Corporate Equivalent” rating. The proceeds from the financing provided the Illinois retirement systems with an immediate infusion of cash, improving the funded ratio of the combined pension funds from 48.6 percent to 57.3 percent. For the 60-month period ending June 30, 2008, the state incurred debt service of $2.53 billion on the bonds, while the pension funds earned $4.53 billion in investment income on the invested proceeds. This provided $2 billion in additional pension funding assets that would not have been available to the retirement systems without the issuance of the pension obligation bonds.
Pension Benefit Reform In 2005, reforms of the state pension systems reduced the projected unfunded liability by $83 billion through 2045 (Public Act 94-004). Deloitte Consulting LLP, the consulting actuary, and the Governor’s Office of Management and Budget have concluded that, of several estimates prepared by different actuaries, the most appropriate, reasonable and complete estimate of the net savings associated with these reforms is a projected reduction in the 2045 actuarial accrued liability of approximately $83 billion (or 16 percent). This estimate also provided a
4 - 1
Public Retirement Systems
reduction in state contribution requirements of approximately an additional $3 billion over the next 40 years.
CURRENT FUNDED STATUS The five state retirement systems incurred an actuarial loss on investment performance in excess of $9 billion during fiscal year 2008. This resulted in the funded ratio declining from 62.6 percent to 54.3 percent. This performance has effectively increased state debt by $9 billion, a debt which will require an additional interest payment of over $700 million, for a total interest payment of $4.6 billion. Thus far in state fiscal year 2009, the financial markets have experienced losses not seen in a generation. With investment losses through February in excess of 25 percent, the state retirement systems have incurred an actuarial loss in excess of $20 billion in state fiscal year 2009. Again, unless financial markets improve dramatically by June 30, 2009, this loss has effectively increased state debt by another $20 billion, a debt which will require an additional annual interest payment of $1.7 billion beginning in fiscal year 2011. Adverse financial conditions have severely impacted state revenues while at the same time investment losses, coupled with the ramp-up period of the 50 year funding plan, have resulted in statutorily required state pension contributions growing 80 percent, or $2 billion, from fiscal year 2008 to fiscal year 2010. This growth would be unmanageable in a robust economy, let alone during the major recession our nation is currently suffering through. THE GOVERNOR’S PROPOSAL FOR THE FUTURE Governor Quinn believes that state employees and educators deserve a secure retirement after a lifetime of service. He also believes that benefits must be affordable to the state’s citizens both now and in the future. To that end, the governor proposes the following changes to state retirement system provisions applicable to new hires. • Retirement Age – Eligibility for unreduced
benefits would become the age at which the participant would become eligible for unreduced Social Security benefits, which is currently age 67 for those born after 1960. This change reflects
gains in life expectancy and is more consistent with plans covering private sector employees. Early retirement could occur no earlier than age 62, just as for Social Security. There would be no combinations of age and service that would qualify an employee for a full retirement benefit prior to achieving eligibility for unreduced Social Security benefits.
• Benefit Formula – Participants covered by
Social Security would earn 1.5 percent of final pay per year of service. Participants not covered by Social Security would earn 2 percent. Final pay would be defined as the final eight year average, and considered compensation would be limited to base pay. Credited service would be limited to 35 years. The benefit would be payable as a life annuity.
• Cost of Living Adjustments (COLA) – The
COLA would be 50 percent of the change in the consumer price index or 3 percent, whichever is lower. The annual COLA would be applied to the amount of the annual benefit awarded upon retirement. This change would bring the five state retirement systems approximately in line with other public employee retirement systems.
• Employee Contributions –New participants
would contribute one percentage point less than currently required contribution rates.
In addition, current employees will be asked to share the burden for the pension benefits they are entitled to. Therefore the employee contribution rate for current participants is proposed to be increased by 2 percentage points.
4 - 2
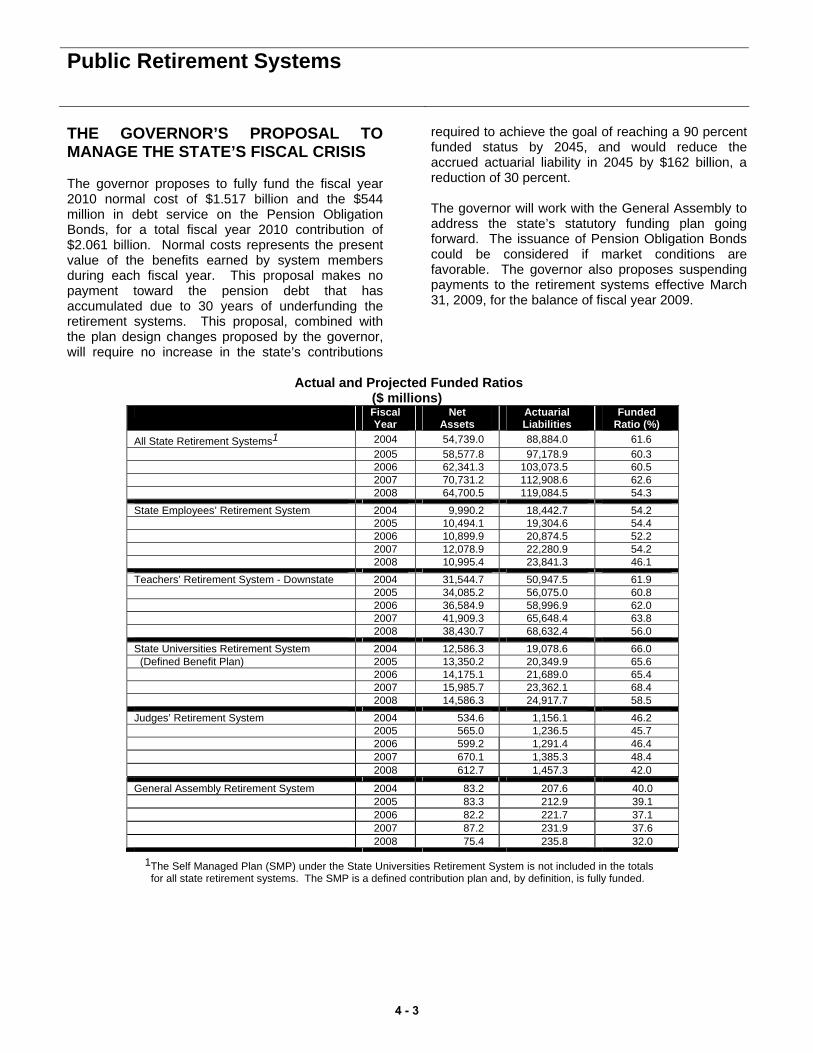
Public Retirement Systems
THE GOVERNOR’S PROPOSAL TO MANAGE THE STATE’S FISCAL CRISIS The governor proposes to fully fund the fiscal year 2010 normal cost of $1.517 billion and the $544 million in debt service on the Pension Obligation Bonds, for a total fiscal year 2010 contribution of $2.061 billion. Normal costs represents the present value of the benefits earned by system members during each fiscal year. This proposal makes no payment toward the pension debt that has accumulated due to 30 years of underfunding the retirement systems. This proposal, combined with the plan design changes proposed by the governor, will require no increase in the state’s contributions
required to achieve the goal of reaching a 90 percent funded status by 2045, and would reduce the accrued actuarial liability in 2045 by $162 billion, a reduction of 30 percent. The governor will work with the General Assembly to address the state’s statutory funding plan going forward. The issuance of Pension Obligation Bonds could be considered if market conditions are favorable. The governor also proposes suspending payments to the retirement systems effective March 31, 2009, for the balance of fiscal year 2009.
Actual and Projected Funded Ratios
($ millions) Fiscal
Year Net
Assets Actuarial Liabilities
Funded Ratio (%)
All State Retirement Systems1 2004 54,739.0 88,884.0 61.6 2005 58,577.8 97,178.9 60.3 2006 62,341.3 103,073.5 60.5 2007 70,731.2 112,908.6 62.6 2008 64,700.5 119,084.5 54.3 State Employees’ Retirement System 2004 9,990.2 18,442.7 54.2 2005 10,494.1 19,304.6 54.4 2006 10,899.9 20,874.5 52.2 2007 12,078.9 22,280.9 54.2 2008 10,995.4 23,841.3 46.1 Teachers’ Retirement System - Downstate 2004 31,544.7 50,947.5 61.9 2005 34,085.2 56,075.0 60.8 2006 36,584.9 58,996.9 62.0 2007 41,909.3 65,648.4 63.8 2008 38,430.7 68,632.4 56.0 State Universities Retirement System 2004 12,586.3 19,078.6 66.0 (Defined Benefit Plan) 2005 13,350.2 20,349.9 65.6 2006 14,175.1 21,689.0 65.4 2007 15,985.7 23,362.1 68.4 2008 14,586.3 24,917.7 58.5 Judges’ Retirement System 2004 534.6 1,156.1 46.2 2005 565.0 1,236.5 45.7 2006 599.2 1,291.4 46.4 2007 670.1 1,385.3 48.4 2008 612.7 1,457.3 42.0 General Assembly Retirement System 2004 83.2 207.6 40.0 2005 83.3 212.9 39.1 2006 82.2 221.7 37.1 2007 87.2 231.9 37.6 2008 75.4 235.8 32.0
1The Self Managed Plan (SMP) under the State Universities Retirement System is not included in the totals for all state retirement systems. The SMP is a defined contribution plan and, by definition, is fully funded.
4 - 3

4 - 4
ECONOMIC OUTLOOK AND REVENUE FORECAST
www.state.il.us/budget
CHAPTER 5

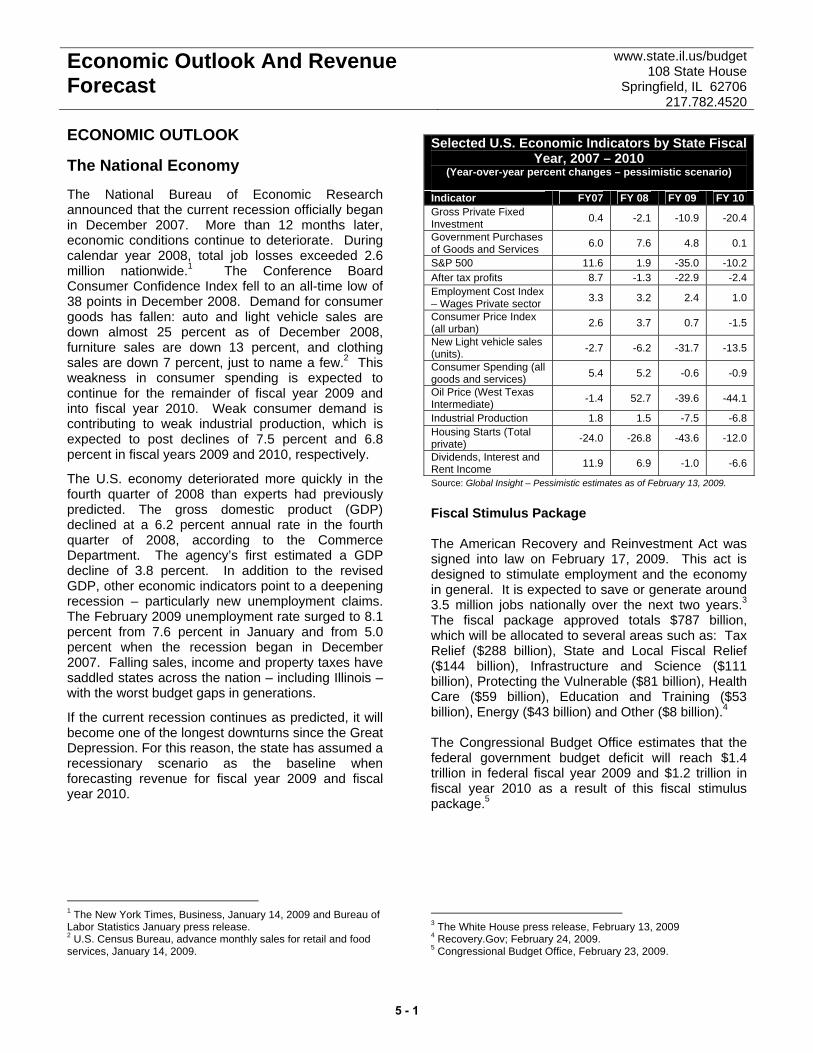
Economic Outlook And Revenue Forecast
www.state.il.us/budget 108 State House
Springfield, IL 62706 217.782.4520
ECONOMIC OUTLOOK The National Economy The National Bureau of Economic Research announced that the current recession officially began in December 2007. More than 12 months later, economic conditions continue to deteriorate. During calendar year 2008, total job losses exceeded 2.6 million nationwide.1 The Conference Board Consumer Confidence Index fell to an all-time low of 38 points in December 2008. Demand for consumer goods has fallen: auto and light vehicle sales are down almost 25 percent as of December 2008, furniture sales are down 13 percent, and clothing sales are down 7 percent, just to name a few.2 This weakness in consumer spending is expected to continue for the remainder of fiscal year 2009 and into fiscal year 2010. Weak consumer demand is contributing to weak industrial production, which is expected to post declines of 7.5 percent and 6.8 percent in fiscal years 2009 and 2010, respectively.
The U.S. economy deteriorated more quickly in the fourth quarter of 2008 than experts had previously predicted. The gross domestic product (GDP) declined at a 6.2 percent annual rate in the fourth quarter of 2008, according to the Commerce Department. The agency’s first estimated a GDP decline of 3.8 percent. In addition to the revised GDP, other economic indicators point to a deepening recession – particularly new unemployment claims. The February 2009 unemployment rate surged to 8.1 percent from 7.6 percent in January and from 5.0 percent when the recession began in December 2007. Falling sales, income and property taxes have saddled states across the nation – including Illinois – with the worst budget gaps in generations.
If the current recession continues as predicted, it will become one of the longest downturns since the Great Depression. For this reason, the state has assumed a recessionary scenario as the baseline when forecasting revenue for fiscal year 2009 and fiscal year 2010.
1 The New York Times, Business, January 14, 2009 and Bureau of Labor Statistics January press release. 2 U.S. Census Bureau, advance monthly sales for retail and food services, January 14, 2009.
Selected U.S. Economic Indicators by State Fiscal Year, 2007 – 2010
(Year-over-year percent changes – pessimistic scenario)
Indicator FY07 FY 08 FY 09 FY 10 Gross Private Fixed Investment 0.4 -2.1 -10.9 -20.4
Government Purchases of Goods and Services 6.0 7.6 4.8 0.1
S&P 500 11.6 1.9 -35.0 -10.2 After tax profits 8.7 -1.3 -22.9 -2.4 Employment Cost Index – Wages Private sector 3.3 3.2 2.4 1.0
Consumer Price Index (all urban) 2.6 3.7 0.7 -1.5
New Light vehicle sales (units). -2.7 -6.2 -31.7 -13.5
Consumer Spending (all goods and services) 5.4 5.2 -0.6 -0.9
Oil Price (West Texas Intermediate) -1.4 52.7 -39.6 -44.1
Industrial Production 1.8 1.5 -7.5 -6.8 Housing Starts (Total private) -24.0 -26.8 -43.6 -12.0
Dividends, Interest and Rent Income 11.9 6.9 -1.0 -6.6
Source: Global Insight – Pessimistic estimates as of February 13, 2009.
Fiscal Stimulus Package The American Recovery and Reinvestment Act was signed into law on February 17, 2009. This act is designed to stimulate employment and the economy in general. It is expected to save or generate around 3.5 million jobs nationally over the next two years.3 The fiscal package approved totals $787 billion, which will be allocated to several areas such as: Tax Relief ($288 billion), State and Local Fiscal Relief ($144 billion), Infrastructure and Science ($111 billion), Protecting the Vulnerable ($81 billion), Health Care ($59 billion), Education and Training ($53 billion), Energy ($43 billion) and Other ($8 billion).4 The Congressional Budget Office estimates that the federal government budget deficit will reach $1.4 trillion in federal fiscal year 2009 and $1.2 trillion in fiscal year 2010 as a result of this fiscal stimulus package.5
3 The White House press release, February 13, 2009 4 Recovery.Gov; February 24, 2009. 5 Congressional Budget Office, February 23, 2009.
5 - 1
Economic Outlook And Revenue Forecast
www.state.il.us/budget 108 State House
Springfield, IL 62706 217.782.4520
Gross Domestic Product Real growth in the gross domestic product (GDP) is expected to decrease 1.5 percent in fiscal year 2009 and 2.9 percent in fiscal year 2010.6 This compares to growth of 2.4 percent during fiscal year 2008 and 2.0 percent during fiscal year 2007. Consumption, the main component of the GDP, has declined dramatically, and is expected to continue declining into fiscal year 2010. U.S. Employment, Wages, and Personal Income There has also been a sharp decline in employment during fiscal year 2009. By December 2008, the national unemployment rate stood at 7.2 percent.7 No longer concentrated in the finance and real estate sectors, jobs losses have now spread throughout the economy. Going forward, this decrease in employment levels will place downward pressure on wage and salary growth. At the national level, wages and salaries are forecasted to grow at 0.9 percent in fiscal year 2009, compared with a 5.1 percent average growth rate in the two previous years. Wage and salary growth in fiscal year 2010 is expected to show a decrease of 1.1 percent. Looking ahead, personal income growth will decline due to the slowdown in employment and wage and salary growth. Personal income growth will decline sharply for the forecast period, from a 5.9 percent average increase in fiscal years 2007 and 2008 to growth of just 1.8 percent in fiscal year 2009 and a decline of 0.3 percent in fiscal year 2010. Real Estate Market Housing starts have fallen consistently since fiscal year 2006. The rate of decline accelerated in fiscal year 2008, when national housing starts declined by almost 27 percent. For fiscal year 2009, housing starts are expected to drop by an additional 43.6 percent. Some additional decline is expected during fiscal year 2010, when housing starts are projected to fall by 12 percent.8 In addition to the sub-prime crisis that marked the initial phase of the housing collapse, tighter credit 6 Global Insight DataInsight, February 2009. 7 Bureau of Labor Statistics, employment situation summary, January 9, 2009. 8 Global Insight, February 2009.
conditions are currently being experienced. In spite of lower mortgage rates; there are an increasing number of foreclosures and not much new lending. The resulting decrease in home prices has contributed to huge declines in household wealth, exacerbating an already bad economic situation. Consumer Spending Consumer spending is expected to decline by 0.6 percent in fiscal year 2009. For fiscal year 2010, forecasts suggest an additional decline of 0.9 percent. Motor vehicle sales, for example, have declined dramatically and are expected to decrease 31.7 percent for fiscal year 2009. Generally, consumer spending is exhibiting a decline not seen in many years. Consumer sentiment has fallen to historic lows, and credit conditions are much tighter than in prior years. These factors, combined with falling household wealth and an increasing unemployment rate, are placing significant downward pressure on consumer spending. Interest Rates and Monetary Policy On December 16, 2008, the Federal Reserve Open Markets Committee (FOMC), reduced the benchmark overnight funds rate target to between zero and 0.25 percent. The committee took this action in response to the deteriorating economic conditions.9 In addition to rate cuts, the Federal Reserve Board (FRB) has injected cash directly into the banking and financial system by, for example, buying commercial paper directly. In spite of the actions of the FRB and the FOMC, financial markets remain under considerable stress, and credit is still tight for businesses as well as households.10 Inflation Inflation is at an historic low.11 Generally speaking, the decrease in inflation is due to the deepening recession. Consumer demand has declined, which is being reflected in decreasing prices. According to the Bureau of Labor Statistics during the last quarter of 2008, consumer price index (CPI) increased at its lowest rate since 1954.12 Going forward, prices are expected to increase 0.7 percent during fiscal year
9 Board of Governors of the Federal Reserve System, press release, December 16, 2008 10 USA Today, January 6, 2009 11 According to BLS data, inflation is the lowest in more than fifty years. 12 BLS news release, January 16, 2009.
5 - 2
Economic Outlook And Revenue Forecast
www.state.il.us/budget 108 State House
Springfield, IL 62706 217.782.4520
2009 and decrease 1.5 percent in fiscal year 2010. This decline is being driven by falling energy prices, especially gasoline, which, for example, dropped 17.2 percent during December 2008, the largest monthly price drop in more than 70 years.13 Corporate Profits After-tax corporate profits are expected to continue a decline that started in fiscal year 2008. These after-tax profits are forecast to decrease 22.9 percent during fiscal year 2009 and decline again in fiscal year 2010 (2.4 percent). For the remainder of this fiscal year and the beginning of fiscal year 2010, the energy sector is expected to lead the decline due to downward pressure on energy prices.14 Given tight credit conditions, increasing unemployment, and all-time low consumer sentiment, the retail sector will not fare much better. The International Council for Shopping Centers in New York, for example, estimates that 73,000 stores may have to close in the second half of fiscal year 2009. According to a survey conducted by PriceWaterhouseCoopers, two-thirds of large manufacturers expect zero or negative growth in calendar year 2009.15 Employment in manufacturing, for example, is expected to decline 7 percent and 11.3 percent in fiscal years 2009 and 2010 respectively.16 Healthcare is the only sector that seems to be performing well during the current recession. People may reduce spending in several ways, but it is unlikely that they will skip medication or visits to the doctor. Additionally, the fiscal stimulus package signed into law by the Obama administration contains several items related to healthcare. This fact should also foster growth and productivity in this sector. Recent Trends in State Taxes The recession that officially began in December 2007 is negatively affecting state tax receipts nationwide. According to the National Association of State Budget Officers, growth in revenue collections slowed significantly during fiscal year 2008 compared with fiscal year 2007. Nationally, sales tax revenue was 0.8 percent higher, individual income tax revenue 13 U.S Department of Labor, January 16, 2009. 14 Bloomberg.com, January 6 2009. 15 PriceWaterhouse Coopers, 4th Quarter 2008 Manufacturing barometer, January 2009. 16 Global Insight dataweb, February 2009.
was 4.5 percent higher, and corporate income tax declined by 4.8 percent.17 Recent nationwide data for the first quarter of fiscal year 2009 indicates continued weakness: individual income tax is up only 2.1 percent; corporate income tax is down 5.4 percent; and sales tax is up 0.3 percent, all compared with the same quarter a year earlier and after adjusting for changes in legislation.18 Overall, total tax revenue for all states was up just 0.6 percent in the first quarter of fiscal year 2009 after adjusting for inflation. Preliminary revenue data from November 2008 confirm the downward trend.19 Declining state tax revenue has led to budgetary problems in many states. For the first quarter of fiscal year 2009, 25 states are below their budgetary revenue projections, and only eight states are above projections.20 In response to anticipated declines in revenue, states have enacted net tax and fee increases of $1.5 billion in fiscal year 2009. The largest enacted net increases were in corporate income tax ($1.4 billion), fees ($805 million) and sales tax ($677 million). States cut individual income and other taxes by $1.6 billion. The revenue impact of the ongoing recession has varied by region across the United States. In the first quarter of fiscal year 2009, the Southeast region experienced the largest decline in revenue: down 1 percent compared with the same quarter one year earlier.21 Revenue growth was weak in the New England and the Rocky Mountain regions, with growth of 1.2 percent and 1.7 percent, respectively. Revenue in the Great Lakes region, which includes Illinois, has not experienced the same level of decline, with revenue growth of 4.8 percent during the first quarter of fiscal year 2009.22
17 The Fiscal Survey of States. National Association of State Budget Officers, December 2008. 18 State Revenue Report. The Rockefeller Institute. Boyd, Donald and Lucy Dadayan. January 2009. 19 http://www.taxexchange.org/member/research/research.html 20 The Fiscal Survey of States. National Association of State Budget Officers, December 2008. 21 State Revenue Report. The Rockefeller Institute. Boyd, Donald and Lucy Dadayan. January 2009. The Southeast includes Alabama, Arkansas, Florida, Georgia, Kentucky, Louisiana, Mississippi, North Carolina, South Carolina, Tennessee, Virginia, and West Virginia. 22 Ibid.
5 - 3

Economic Outlook And Revenue Forecast
www.state.il.us/budget 108 State House
Springfield, IL 62706 217.782.4520
The Illinois Economy The Illinois economy, like the national economy, is in a recession which began in December 2007. The state is now in the midst of one of the most distressed economic situations in decades. Gross State Product Illinois’ Real Gross State Product (RGSP) grew an estimated 1.8 percent on average during fiscal year 2007 and fiscal year 2006. Given current economic conditions, this is expected to decline sharply. The RGSP is forecast to decline 1.8 percent in fiscal year 2009 and 3.3 percent during fiscal year 2010.23 The decrease in the RGSP is expected to be widespread, impacting almost all economic sectors. Illinois Employment, Wages and Personal Income Illinois’ employment is forecasted to decline by 1.6 percent in fiscal year 2009 and 2.6 percent in fiscal year 2010.24 Concomitantly, the unemployment rate is expected to reach 7.7 percent in fiscal year 2009 and 9.7 percent in fiscal year 2010. Major state job losses are expected to continue in manufacturing, construction, and retail. Wages and salaries depend largely on the employment level. Reflecting this relationship, wages and salaries are forecast to increase just 0.7 percent during fiscal year 2009 and decline 0.7 percent during fiscal year 2010. This growth pales in comparison to the 4.7 percent average growth that wages and salaries exhibited in Illinois during fiscal years 2007 and 2008. Finally, because wages and salaries are a major component of personal income, growth in personal income in Illinois is forecast to be 1.7 percent in fiscal year 2009 and to decline 0.3 percent in 2010. This compares to growth above 6 percent during the two previous fiscal years. Real Estate Market Illinois’ housing starts fell an average of 25 percent during fiscal years 2007 and 2008. The sub-prime crisis added to the tightening of credit conditions, while increased uncertainty and unemployment exerted downward pressure on the real estate
23 Global Insight, Dataweb February 2009, pessimistic estimates. 24 Global Insight, Dataweb February 2009, pessimistic scenario.
market. Real estate prices have continued to fall during fiscal year 2009, and such downward price adjustment is expected to continue.25 Global Insight expects that total Illinois private housing starts will decease by 48.3 percent during fiscal year 2009 and will further decline by 0.9 percent in fiscal year 2010. Consumer Spending The current recession is having a negative impact on Illinois consumer spending. Illinois’ retail sales, for example, are forecast to decrease by 8 percent during fiscal year 2009, with a further 4.4 percent decline during fiscal year 2010. During this recessionary period, growth in consumer spending and retail sales is expected to be lower than personal income growth. This is already evidenced by the positive personal saving rate that started during fiscal year 2009. Households are beginning to allocate disposable income away from consumer spending in light of high levels of household debt and falling consumer confidence. All these trends combined will have a detrimental effect on Illinois’ sales tax revenue, as well as several other revenue sources.
Illinois Economic Indicators Used in Forecasting Fiscal Year 2010 Revenues
Percent change, fiscal year basis, 2010
Global Insight Pessimistic Economy.com
Population 0.5 0.6 Wages and Salaries -0.7 0.6 Employment Manufacturing -11.0 -4.1
Employment Wholesale Trade -3.0 -2.7
Employment Information -4.1 -1.8 Retail Sales -4.4 -0.1 Personal Income -0.3 2.7
Source: Global Insight; Moody’s Economy.Com – Very severe recession scenario estimates as of February 23, 2009
Illinois Revenue Source The starting point for developing the fiscal year forecasts is analyzing Illinois’ revenue structure. The majority of general fund tax revenue in Illinois consists of the following:
25 Global Insight, Consumer Market Monthly Briefing, December 2008.
5 - 4
Economic Outlook And Revenue Forecast
www.state.il.us/budget 108 State House
Springfield, IL 62706 217.782.4520
• Economically Sensitive Tax Structure: Illinois’
revenue structure is largely based on economically sensitive taxes, especially individual income tax, corporate income tax and sales tax.
• Special Funds: Illinois has historically used
general revenues to subsidize the internal administrative support services provided to other specialized funds. General revenues continue to subsidize the operating costs of these special purpose and special interest funds, due in part to Illinois’ low fee structure. Many fees earmarked and paid into special funds in Illinois are, in contrast, deposited into the general fund in other states. In recent years, a limited number of user fees for state regulatory services and licenses have been increased to bring them more in line with other states.
• Utility Taxes: Illinois has usage-based utility
taxes for gas and electricity, rather than ad valorem utility taxes based upon the dollar value of the utility provided. As homeowners and businesses install more energy-efficient heating and cooling equipment, utility taxes will experience downward pressure. Telecommunication taxes are based on gross receipts and are therefore driven by price and consumption. Over the last few years, ongoing technological changes, such as the growth of wireless phone subscriptions and services, have helped boost telecommunication tax receipts.
All three major economically sensitive taxes are expected to decline in fiscal years 2009 and 2010. Consequently, overall tax collections will fall below those experienced in recent years. The average annual percentage change for the individual income tax, corporate income tax, and sales tax combined is 4.8 percent over the last two business cycles. In contrast, the state expects a combined decrease of 6.7 percent for fiscal year 2010. REVENUE FORECASTS: FISCAL YEAR 2009 REVISED AND FISCAL YEAR 2010 Using consensus economic forecasts, we estimate economically sensitive revenues, such as individual income tax, corporate income tax and sales tax, using a variety of modeling techniques, including structural economic models that measure relationships between the Illinois economy and the Illinois revenue base.
Other revenue sources, such as utility taxes, cigarette taxes and user fees, are not significantly affected by economic changes in the absence of any definitional, rate or compliance changes they are fairly stable from year to year. Information is obtained on economic conditions, developments and trends from a variety of sources, including: • Governor’s Council of Economic Advisors
(CEA): The CEA is comprised of economists and members of the business and public policy communities. Staff support is provided in part by the departments of Revenue and Employment Security. The CEA actively provides input into the budget process with an emphasis on economic forecasting.
• National economic consulting firms: The
state uses Economy.com and Global Insight to provide current national, regional and Illinois data, to analyze historical economic trends; to monitor current economic conditions; and to develop forecasts of key economic indicators.
• State Agencies:
o Department of Revenue (DOR): DOR forecasts corporate and individual income taxes, sales tax, utility taxes, and gaming taxes, among others. In developing forecasts for these sources, DOR analyzes economic trends, draws upon historical revenue data and develops econometric models.
o Department of Employment Security
(DES): DES analyzes and interprets Illinois labor market conditions in the context of national economic trends. DES provides employment and wage data for the econometric models that are used to forecast Illinois revenues, particularly individual income tax and sales taxes.
o Governor’s Office of Management and
Budget (GOMB): GOMB analyzes and reviews economic indicators, interprets economic forecasts and tracks state revenues. Major sources of revenues are tracked on a daily, semi-monthly and quarterly basis to provide timely information on the state’s financial position.
5 - 5
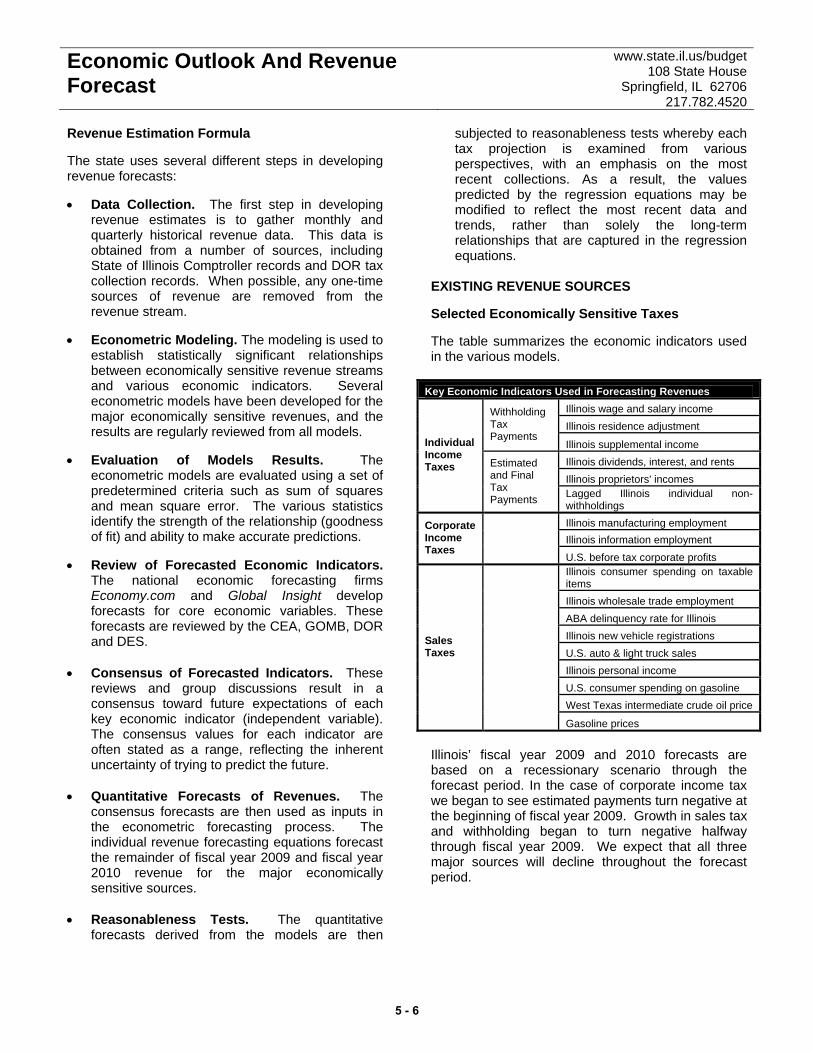
Economic Outlook And Revenue Forecast
www.state.il.us/budget 108 State House
Springfield, IL 62706 217.782.4520
Revenue Estimation Formula The state uses several different steps in developing revenue forecasts: • Data Collection. The first step in developing
revenue estimates is to gather monthly and quarterly historical revenue data. This data is obtained from a number of sources, including State of Illinois Comptroller records and DOR tax collection records. When possible, any one-time sources of revenue are removed from the revenue stream.
• Econometric Modeling. The modeling is used to
establish statistically significant relationships between economically sensitive revenue streams and various economic indicators. Several econometric models have been developed for the major economically sensitive revenues, and the results are regularly reviewed from all models.
• Evaluation of Models Results. The
econometric models are evaluated using a set of predetermined criteria such as sum of squares and mean square error. The various statistics identify the strength of the relationship (goodness of fit) and ability to make accurate predictions.
• Review of Forecasted Economic Indicators.
The national economic forecasting firms Economy.com and Global Insight develop forecasts for core economic variables. These forecasts are reviewed by the CEA, GOMB, DOR and DES.
• Consensus of Forecasted Indicators. These
reviews and group discussions result in a consensus toward future expectations of each key economic indicator (independent variable). The consensus values for each indicator are often stated as a range, reflecting the inherent uncertainty of trying to predict the future.
• Quantitative Forecasts of Revenues. The
consensus forecasts are then used as inputs in the econometric forecasting process. The individual revenue forecasting equations forecast the remainder of fiscal year 2009 and fiscal year 2010 revenue for the major economically sensitive sources.
• Reasonableness Tests. The quantitative
forecasts derived from the models are then
subjected to reasonableness tests whereby each tax projection is examined from various perspectives, with an emphasis on the most recent collections. As a result, the values predicted by the regression equations may be modified to reflect the most recent data and trends, rather than solely the long-term relationships that are captured in the regression equations.
EXISTING REVENUE SOURCES Selected Economically Sensitive Taxes The table summarizes the economic indicators used in the various models.
Key Economic Indicators Used in Forecasting Revenues Illinois wage and salary income Illinois residence adjustment
Withholding Tax Payments
Illinois supplemental income Illinois dividends, interest, and rents Illinois proprietors' incomes
Individual Income Taxes Estimated
and Final Tax Payments Lagged Illinois individual non-
withholdings Illinois manufacturing employment Illinois information employment
Corporate Income Taxes U.S. before tax corporate profits
Illinois consumer spending on taxable items Illinois wholesale trade employment ABA delinquency rate for Illinois Illinois new vehicle registrations U.S. auto & light truck sales Illinois personal income U.S. consumer spending on gasoline West Texas intermediate crude oil price
Sales Taxes
Gasoline prices Illinois’ fiscal year 2009 and 2010 forecasts are based on a recessionary scenario through the forecast period. In the case of corporate income tax we began to see estimated payments turn negative at the beginning of fiscal year 2009. Growth in sales tax and withholding began to turn negative halfway through fiscal year 2009. We expect that all three major sources will decline throughout the forecast period.
5 - 6
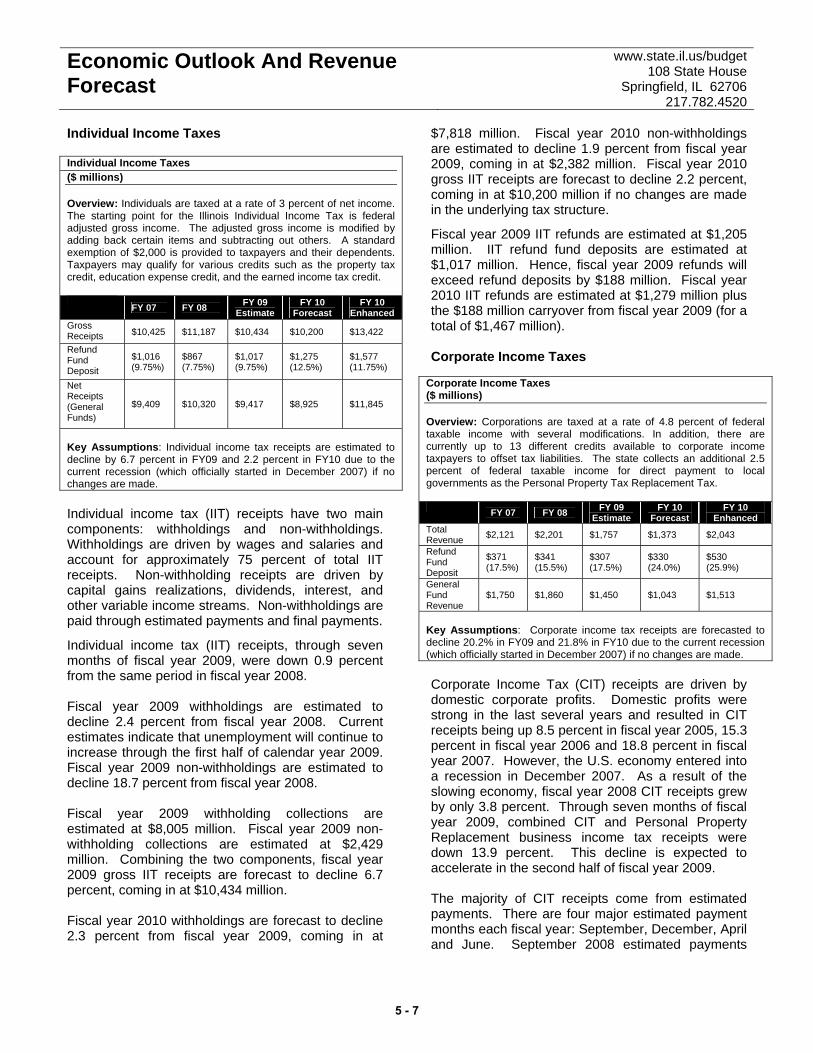
Economic Outlook And Revenue Forecast
www.state.il.us/budget 108 State House
Springfield, IL 62706 217.782.4520
Individual Income Taxes Individual Income Taxes ($ millions) Overview: Individuals are taxed at a rate of 3 percent of net income. The starting point for the Illinois Individual Income Tax is federal adjusted gross income. The adjusted gross income is modified by adding back certain items and subtracting out others. A standard exemption of $2,000 is provided to taxpayers and their dependents. Taxpayers may qualify for various credits such as the property tax credit, education expense credit, and the earned income tax credit. FY 07 FY 08 FY 09
Estimate FY 10
Forecast FY 10
Enhanced Gross Receipts $10,425 $11,187 $10,434 $10,200 $13,422
Refund Fund Deposit
$1,016 (9.75%)
$867 (7.75%)
$1,017 (9.75%)
$1,275 (12.5%)
$1,577 (11.75%)
Net Receipts (General Funds)
$9,409 $10,320 $9,417 $8,925 $11,845
Key Assumptions: Individual income tax receipts are estimated to decline by 6.7 percent in FY09 and 2.2 percent in FY10 due to the current recession (which officially started in December 2007) if no changes are made. Individual income tax (IIT) receipts have two main components: withholdings and non-withholdings. Withholdings are driven by wages and salaries and account for approximately 75 percent of total IIT receipts. Non-withholding receipts are driven by capital gains realizations, dividends, interest, and other variable income streams. Non-withholdings are paid through estimated payments and final payments.
Individual income tax (IIT) receipts, through seven months of fiscal year 2009, were down 0.9 percent from the same period in fiscal year 2008. Fiscal year 2009 withholdings are estimated to decline 2.4 percent from fiscal year 2008. Current estimates indicate that unemployment will continue to increase through the first half of calendar year 2009. Fiscal year 2009 non-withholdings are estimated to decline 18.7 percent from fiscal year 2008. Fiscal year 2009 withholding collections are estimated at $8,005 million. Fiscal year 2009 non-withholding collections are estimated at $2,429 million. Combining the two components, fiscal year 2009 gross IIT receipts are forecast to decline 6.7 percent, coming in at $10,434 million. Fiscal year 2010 withholdings are forecast to decline 2.3 percent from fiscal year 2009, coming in at
$7,818 million. Fiscal year 2010 non-withholdings are estimated to decline 1.9 percent from fiscal year 2009, coming in at $2,382 million. Fiscal year 2010 gross IIT receipts are forecast to decline 2.2 percent, coming in at $10,200 million if no changes are made in the underlying tax structure.
Fiscal year 2009 IIT refunds are estimated at $1,205 million. IIT refund fund deposits are estimated at $1,017 million. Hence, fiscal year 2009 refunds will exceed refund deposits by $188 million. Fiscal year 2010 IIT refunds are estimated at $1,279 million plus the $188 million carryover from fiscal year 2009 (for a total of $1,467 million). Corporate Income Taxes
Corporate Income Taxes ($ millions) Overview: Corporations are taxed at a rate of 4.8 percent of federal taxable income with several modifications. In addition, there are currently up to 13 different credits available to corporate income taxpayers to offset tax liabilities. The state collects an additional 2.5 percent of federal taxable income for direct payment to local governments as the Personal Property Tax Replacement Tax. FY 07 FY 08 FY 09
Estimate FY 10
Forecast FY 10
Enhanced Total Revenue $2,121 $2,201 $1,757 $1,373 $2,043
Refund Fund Deposit
$371 (17.5%)
$341 (15.5%)
$307 (17.5%)
$330 (24.0%)
$530 (25.9%)
General Fund Revenue
$1,750 $1,860 $1,450 $1,043 $1,513
Key Assumptions: Corporate income tax receipts are forecasted to decline 20.2% in FY09 and 21.8% in FY10 due to the current recession (which officially started in December 2007) if no changes are made. Corporate Income Tax (CIT) receipts are driven by domestic corporate profits. Domestic profits were strong in the last several years and resulted in CIT receipts being up 8.5 percent in fiscal year 2005, 15.3 percent in fiscal year 2006 and 18.8 percent in fiscal year 2007. However, the U.S. economy entered into a recession in December 2007. As a result of the slowing economy, fiscal year 2008 CIT receipts grew by only 3.8 percent. Through seven months of fiscal year 2009, combined CIT and Personal Property Replacement business income tax receipts were down 13.9 percent. This decline is expected to accelerate in the second half of fiscal year 2009. The majority of CIT receipts come from estimated payments. There are four major estimated payment months each fiscal year: September, December, April and June. September 2008 estimated payments
5 - 7
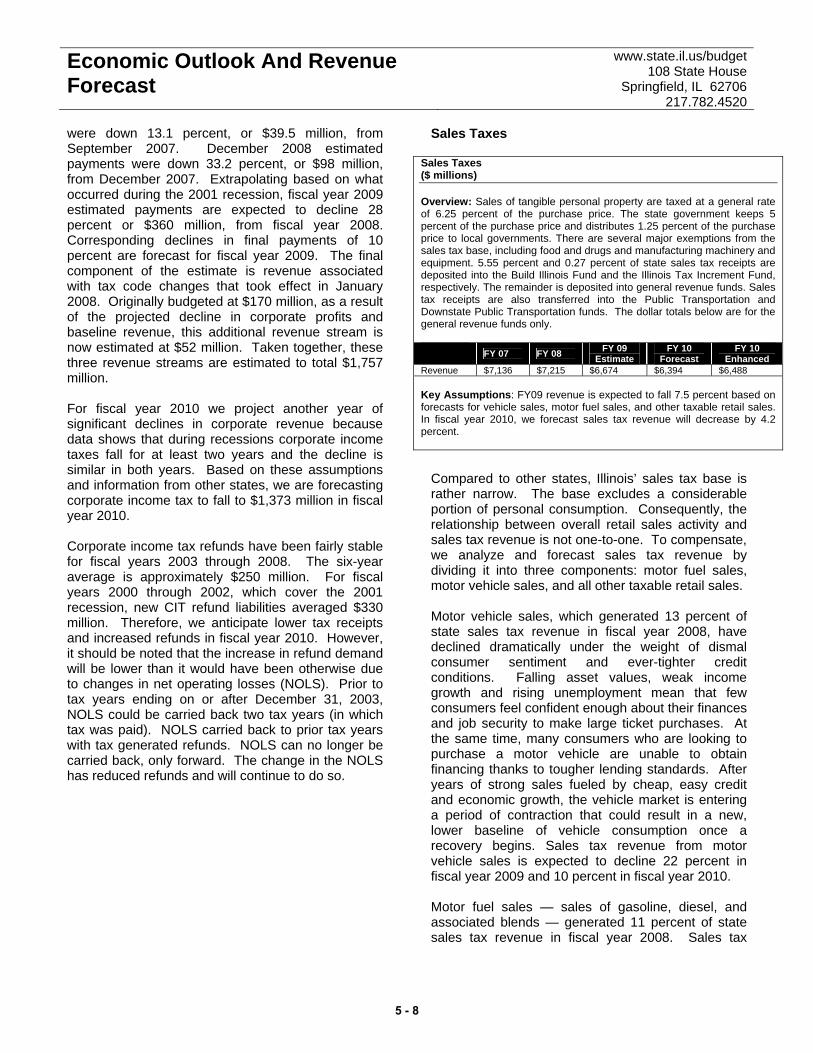
Economic Outlook And Revenue Forecast
www.state.il.us/budget 108 State House
Springfield, IL 62706 217.782.4520
were down 13.1 percent, or $39.5 million, from September 2007. December 2008 estimated payments were down 33.2 percent, or $98 million, from December 2007. Extrapolating based on what occurred during the 2001 recession, fiscal year 2009 estimated payments are expected to decline 28 percent or $360 million, from fiscal year 2008. Corresponding declines in final payments of 10 percent are forecast for fiscal year 2009. The final component of the estimate is revenue associated with tax code changes that took effect in January 2008. Originally budgeted at $170 million, as a result of the projected decline in corporate profits and baseline revenue, this additional revenue stream is now estimated at $52 million. Taken together, these three revenue streams are estimated to total $1,757 million. For fiscal year 2010 we project another year of significant declines in corporate revenue because data shows that during recessions corporate income taxes fall for at least two years and the decline is similar in both years. Based on these assumptions and information from other states, we are forecasting corporate income tax to fall to $1,373 million in fiscal year 2010. Corporate income tax refunds have been fairly stable for fiscal years 2003 through 2008. The six-year average is approximately $250 million. For fiscal years 2000 through 2002, which cover the 2001 recession, new CIT refund liabilities averaged $330 million. Therefore, we anticipate lower tax receipts and increased refunds in fiscal year 2010. However, it should be noted that the increase in refund demand will be lower than it would have been otherwise due to changes in net operating losses (NOLS). Prior to tax years ending on or after December 31, 2003, NOLS could be carried back two tax years (in which tax was paid). NOLS carried back to prior tax years with tax generated refunds. NOLS can no longer be carried back, only forward. The change in the NOLS has reduced refunds and will continue to do so.
Sales Taxes
Compared to other states, Illinois’ sales tax base is rather narrow. The base excludes a considerable portion of personal consumption. Consequently, the relationship between overall retail sales activity and sales tax revenue is not one-to-one. To compensate, we analyze and forecast sales tax revenue by dividing it into three components: motor fuel sales, motor vehicle sales, and all other taxable retail sales. Motor vehicle sales, which generated 13 percent of state sales tax revenue in fiscal year 2008, have declined dramatically under the weight of dismal consumer sentiment and ever-tighter credit conditions. Falling asset values, weak income growth and rising unemployment mean that few consumers feel confident enough about their finances and job security to make large ticket purchases. At the same time, many consumers who are looking to purchase a motor vehicle are unable to obtain financing thanks to tougher lending standards. After years of strong sales fueled by cheap, easy credit and economic growth, the vehicle market is entering a period of contraction that could result in a new, lower baseline of vehicle consumption once a recovery begins. Sales tax revenue from motor vehicle sales is expected to decline 22 percent in fiscal year 2009 and 10 percent in fiscal year 2010. Motor fuel sales — sales of gasoline, diesel, and associated blends — generated 11 percent of state sales tax revenue in fiscal year 2008. Sales tax
Sales Taxes ($ millions) Overview: Sales of tangible personal property are taxed at a general rate of 6.25 percent of the purchase price. The state government keeps 5 percent of the purchase price and distributes 1.25 percent of the purchase price to local governments. There are several major exemptions from the sales tax base, including food and drugs and manufacturing machinery and equipment. 5.55 percent and 0.27 percent of state sales tax receipts are deposited into the Build Illinois Fund and the Illinois Tax Increment Fund, respectively. The remainder is deposited into general revenue funds. Sales tax receipts are also transferred into the Public Transportation and Downstate Public Transportation funds. The dollar totals below are for the general revenue funds only. FY 07 FY 08 FY 09
Estimate FY 10
Forecast FY 10
Enhanced Revenue $7,136 $7,215 $6,674 $6,394 $6,488 Key Assumptions: FY09 revenue is expected to fall 7.5 percent based on forecasts for vehicle sales, motor fuel sales, and other taxable retail sales. In fiscal year 2010, we forecast sales tax revenue will decrease by 4.2 percent.
5 - 8
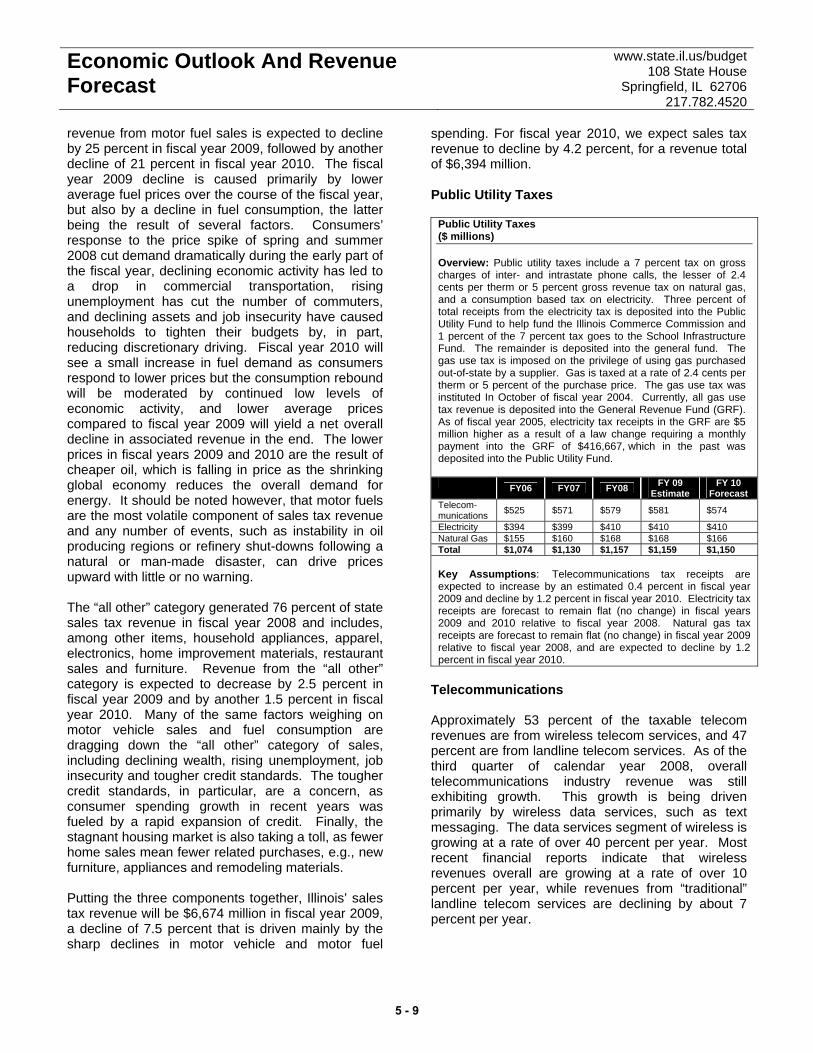
Economic Outlook And Revenue Forecast
www.state.il.us/budget 108 State House
Springfield, IL 62706 217.782.4520
revenue from motor fuel sales is expected to decline by 25 percent in fiscal year 2009, followed by another decline of 21 percent in fiscal year 2010. The fiscal year 2009 decline is caused primarily by lower average fuel prices over the course of the fiscal year, but also by a decline in fuel consumption, the latter being the result of several factors. Consumers’ response to the price spike of spring and summer 2008 cut demand dramatically during the early part of the fiscal year, declining economic activity has led to a drop in commercial transportation, rising unemployment has cut the number of commuters, and declining assets and job insecurity have caused households to tighten their budgets by, in part, reducing discretionary driving. Fiscal year 2010 will see a small increase in fuel demand as consumers respond to lower prices but the consumption rebound will be moderated by continued low levels of economic activity, and lower average prices compared to fiscal year 2009 will yield a net overall decline in associated revenue in the end. The lower prices in fiscal years 2009 and 2010 are the result of cheaper oil, which is falling in price as the shrinking global economy reduces the overall demand for energy. It should be noted however, that motor fuels are the most volatile component of sales tax revenue and any number of events, such as instability in oil producing regions or refinery shut-downs following a natural or man-made disaster, can drive prices upward with little or no warning. The “all other” category generated 76 percent of state sales tax revenue in fiscal year 2008 and includes, among other items, household appliances, apparel, electronics, home improvement materials, restaurant sales and furniture. Revenue from the “all other” category is expected to decrease by 2.5 percent in fiscal year 2009 and by another 1.5 percent in fiscal year 2010. Many of the same factors weighing on motor vehicle sales and fuel consumption are dragging down the “all other” category of sales, including declining wealth, rising unemployment, job insecurity and tougher credit standards. The tougher credit standards, in particular, are a concern, as consumer spending growth in recent years was fueled by a rapid expansion of credit. Finally, the stagnant housing market is also taking a toll, as fewer home sales mean fewer related purchases, e.g., new furniture, appliances and remodeling materials. Putting the three components together, Illinois’ sales tax revenue will be $6,674 million in fiscal year 2009, a decline of 7.5 percent that is driven mainly by the sharp declines in motor vehicle and motor fuel
spending. For fiscal year 2010, we expect sales tax revenue to decline by 4.2 percent, for a revenue total of $6,394 million. Public Utility Taxes
Public Utility Taxes ($ millions) Overview: Public utility taxes include a 7 percent tax on gross charges of inter- and intrastate phone calls, the lesser of 2.4 cents per therm or 5 percent gross revenue tax on natural gas, and a consumption based tax on electricity. Three percent of total receipts from the electricity tax is deposited into the Public Utility Fund to help fund the Illinois Commerce Commission and 1 percent of the 7 percent tax goes to the School Infrastructure Fund. The remainder is deposited into the general fund. The gas use tax is imposed on the privilege of using gas purchased out-of-state by a supplier. Gas is taxed at a rate of 2.4 cents per therm or 5 percent of the purchase price. The gas use tax was instituted In October of fiscal year 2004. Currently, all gas use tax revenue is deposited into the General Revenue Fund (GRF). As of fiscal year 2005, electricity tax receipts in the GRF are $5 million higher as a result of a law change requiring a monthly payment into the GRF of $416,667, which in the past was deposited into the Public Utility Fund. FY06 FY07 FY08 FY 09
Estimate FY 10
Forecast Telecom-munications $525 $571 $579 $581 $574
Electricity $394 $399 $410 $410 $410 Natural Gas $155 $160 $168 $168 $166 Total $1,074 $1,130 $1,157 $1,159 $1,150 Key Assumptions: Telecommunications tax receipts are expected to increase by an estimated 0.4 percent in fiscal year 2009 and decline by 1.2 percent in fiscal year 2010. Electricity tax receipts are forecast to remain flat (no change) in fiscal years 2009 and 2010 relative to fiscal year 2008. Natural gas tax receipts are forecast to remain flat (no change) in fiscal year 2009 relative to fiscal year 2008, and are expected to decline by 1.2 percent in fiscal year 2010.
Telecommunications Approximately 53 percent of the taxable telecom revenues are from wireless telecom services, and 47 percent are from landline telecom services. As of the third quarter of calendar year 2008, overall telecommunications industry revenue was still exhibiting growth. This growth is being driven primarily by wireless data services, such as text messaging. The data services segment of wireless is growing at a rate of over 40 percent per year. Most recent financial reports indicate that wireless revenues overall are growing at a rate of over 10 percent per year, while revenues from “traditional” landline telecom services are declining by about 7 percent per year.
5 - 9
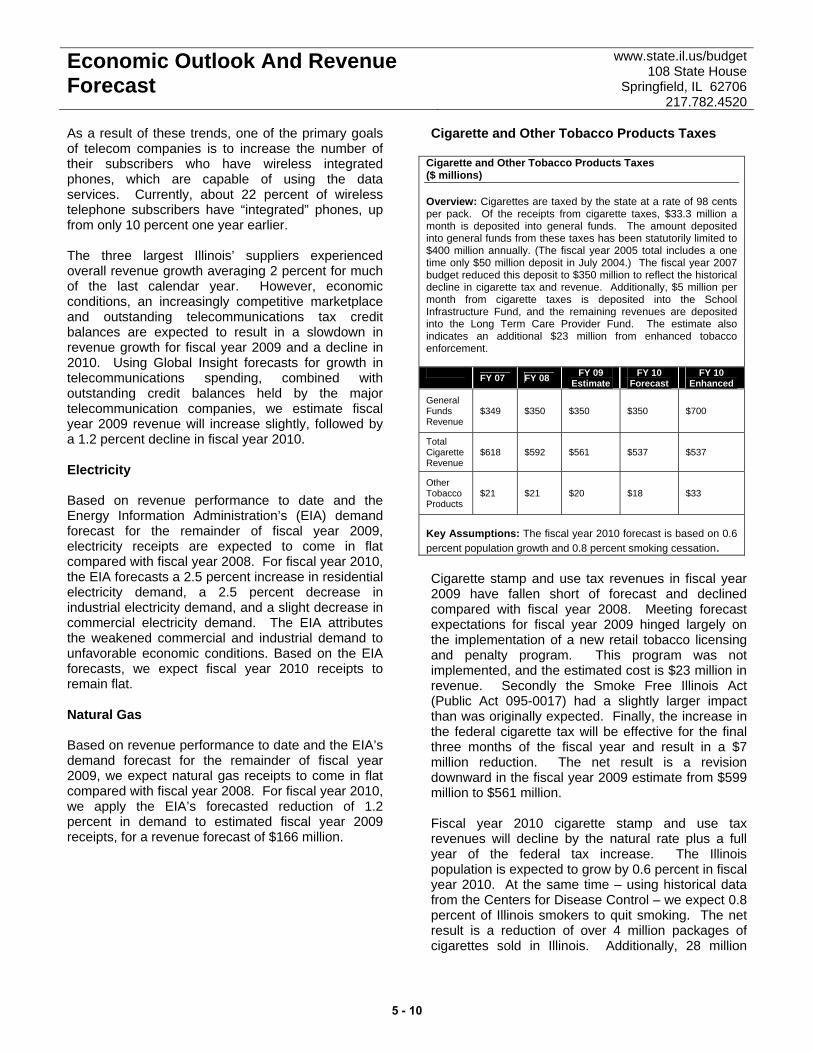
Economic Outlook And Revenue Forecast
www.state.il.us/budget 108 State House
Springfield, IL 62706 217.782.4520
As a result of these trends, one of the primary goals of telecom companies is to increase the number of their subscribers who have wireless integrated phones, which are capable of using the data services. Currently, about 22 percent of wireless telephone subscribers have “integrated” phones, up from only 10 percent one year earlier. The three largest Illinois’ suppliers experienced overall revenue growth averaging 2 percent for much of the last calendar year. However, economic conditions, an increasingly competitive marketplace and outstanding telecommunications tax credit balances are expected to result in a slowdown in revenue growth for fiscal year 2009 and a decline in 2010. Using Global Insight forecasts for growth in telecommunications spending, combined with outstanding credit balances held by the major telecommunication companies, we estimate fiscal year 2009 revenue will increase slightly, followed by a 1.2 percent decline in fiscal year 2010. Electricity Based on revenue performance to date and the Energy Information Administration’s (EIA) demand forecast for the remainder of fiscal year 2009, electricity receipts are expected to come in flat compared with fiscal year 2008. For fiscal year 2010, the EIA forecasts a 2.5 percent increase in residential electricity demand, a 2.5 percent decrease in industrial electricity demand, and a slight decrease in commercial electricity demand. The EIA attributes the weakened commercial and industrial demand to unfavorable economic conditions. Based on the EIA forecasts, we expect fiscal year 2010 receipts to remain flat. Natural Gas Based on revenue performance to date and the EIA’s demand forecast for the remainder of fiscal year 2009, we expect natural gas receipts to come in flat compared with fiscal year 2008. For fiscal year 2010, we apply the EIA’s forecasted reduction of 1.2 percent in demand to estimated fiscal year 2009 receipts, for a revenue forecast of $166 million.
Cigarette and Other Tobacco Products Taxes
Cigarette and Other Tobacco Products Taxes ($ millions) Overview: Cigarettes are taxed by the state at a rate of 98 cents per pack. Of the receipts from cigarette taxes, $33.3 million a month is deposited into general funds. The amount deposited into general funds from these taxes has been statutorily limited to $400 million annually. (The fiscal year 2005 total includes a one time only $50 million deposit in July 2004.) The fiscal year 2007 budget reduced this deposit to $350 million to reflect the historical decline in cigarette tax and revenue. Additionally, $5 million per month from cigarette taxes is deposited into the School Infrastructure Fund, and the remaining revenues are deposited into the Long Term Care Provider Fund. The estimate also indicates an additional $23 million from enhanced tobacco enforcement. FY 07 FY 08 FY 09
Estimate FY 10
Forecast FY 10
Enhanced
General Funds Revenue
$349 $350 $350 $350 $700
Total Cigarette Revenue
$618
$592
$561 $537 $537
Other Tobacco Products
$21 $21 $20 $18 $33
Key Assumptions: The fiscal year 2010 forecast is based on 0.6 percent population growth and 0.8 percent smoking cessation. Cigarette stamp and use tax revenues in fiscal year 2009 have fallen short of forecast and declined compared with fiscal year 2008. Meeting forecast expectations for fiscal year 2009 hinged largely on the implementation of a new retail tobacco licensing and penalty program. This program was not implemented, and the estimated cost is $23 million in revenue. Secondly the Smoke Free Illinois Act (Public Act 095-0017) had a slightly larger impact than was originally expected. Finally, the increase in the federal cigarette tax will be effective for the final three months of the fiscal year and result in a $7 million reduction. The net result is a revision downward in the fiscal year 2009 estimate from $599 million to $561 million. Fiscal year 2010 cigarette stamp and use tax revenues will decline by the natural rate plus a full year of the federal tax increase. The Illinois population is expected to grow by 0.6 percent in fiscal year 2010. At the same time – using historical data from the Centers for Disease Control – we expect 0.8 percent of Illinois smokers to quit smoking. The net result is a reduction of over 4 million packages of cigarettes sold in Illinois. Additionally, 28 million
5 - 10
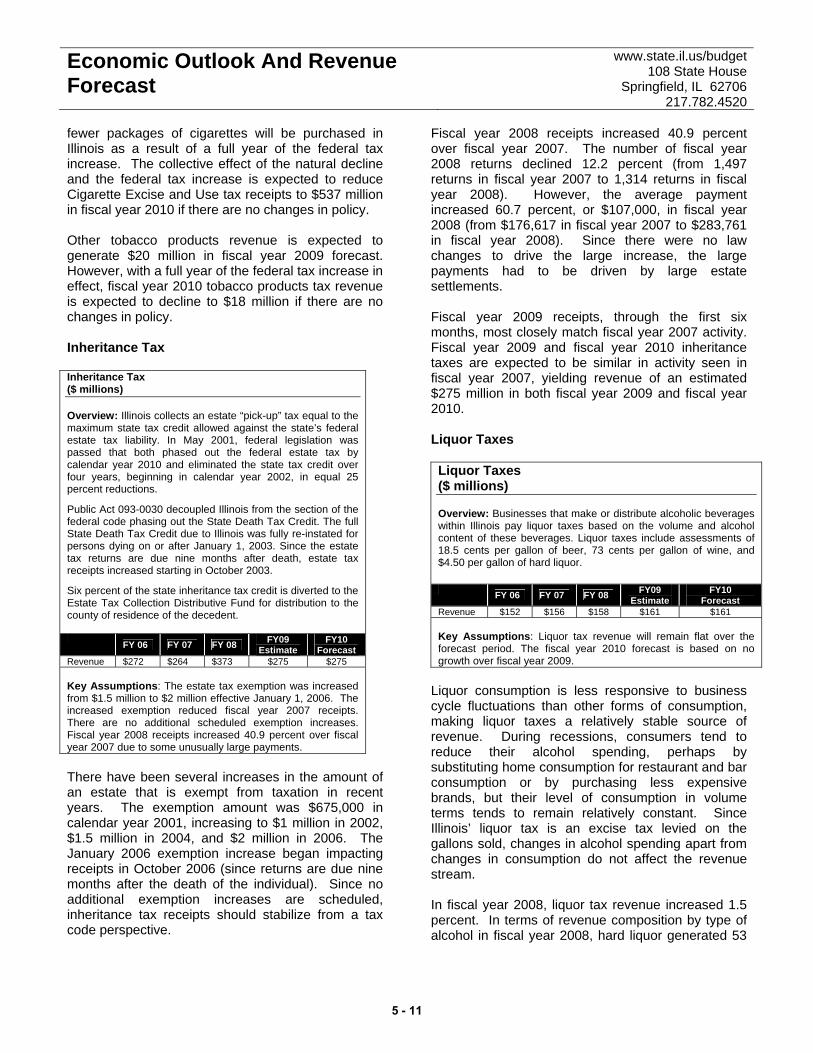
Economic Outlook And Revenue Forecast
www.state.il.us/budget 108 State House
Springfield, IL 62706 217.782.4520
fewer packages of cigarettes will be purchased in Illinois as a result of a full year of the federal tax increase. The collective effect of the natural decline and the federal tax increase is expected to reduce Cigarette Excise and Use tax receipts to $537 million in fiscal year 2010 if there are no changes in policy. Other tobacco products revenue is expected to generate $20 million in fiscal year 2009 forecast. However, with a full year of the federal tax increase in effect, fiscal year 2010 tobacco products tax revenue is expected to decline to $18 million if there are no changes in policy. Inheritance Tax Inheritance Tax ($ millions) Overview: Illinois collects an estate “pick-up” tax equal to the maximum state tax credit allowed against the state’s federal estate tax liability. In May 2001, federal legislation was passed that both phased out the federal estate tax by calendar year 2010 and eliminated the state tax credit over four years, beginning in calendar year 2002, in equal 25 percent reductions.
Public Act 093-0030 decoupled Illinois from the section of the federal code phasing out the State Death Tax Credit. The full State Death Tax Credit due to Illinois was fully re-instated for persons dying on or after January 1, 2003. Since the estate tax returns are due nine months after death, estate tax receipts increased starting in October 2003.
Six percent of the state inheritance tax credit is diverted to the Estate Tax Collection Distributive Fund for distribution to the county of residence of the decedent. FY 06 FY 07 FY 08 FY09
Estimate FY10
Forecast Revenue $272 $264 $373 $275 $275 Key Assumptions: The estate tax exemption was increased from $1.5 million to $2 million effective January 1, 2006. The increased exemption reduced fiscal year 2007 receipts. There are no additional scheduled exemption increases. Fiscal year 2008 receipts increased 40.9 percent over fiscal year 2007 due to some unusually large payments. There have been several increases in the amount of an estate that is exempt from taxation in recent years. The exemption amount was $675,000 in calendar year 2001, increasing to $1 million in 2002, $1.5 million in 2004, and $2 million in 2006. The January 2006 exemption increase began impacting receipts in October 2006 (since returns are due nine months after the death of the individual). Since no additional exemption increases are scheduled, inheritance tax receipts should stabilize from a tax code perspective.
Fiscal year 2008 receipts increased 40.9 percent over fiscal year 2007. The number of fiscal year 2008 returns declined 12.2 percent (from 1,497 returns in fiscal year 2007 to 1,314 returns in fiscal year 2008). However, the average payment increased 60.7 percent, or $107,000, in fiscal year 2008 (from $176,617 in fiscal year 2007 to $283,761 in fiscal year 2008). Since there were no law changes to drive the large increase, the large payments had to be driven by large estate settlements. Fiscal year 2009 receipts, through the first six months, most closely match fiscal year 2007 activity. Fiscal year 2009 and fiscal year 2010 inheritance taxes are expected to be similar in activity seen in fiscal year 2007, yielding revenue of an estimated $275 million in both fiscal year 2009 and fiscal year 2010. Liquor Taxes Liquor Taxes ($ millions) Overview: Businesses that make or distribute alcoholic beverages within Illinois pay liquor taxes based on the volume and alcohol content of these beverages. Liquor taxes include assessments of 18.5 cents per gallon of beer, 73 cents per gallon of wine, and $4.50 per gallon of hard liquor. FY 06 FY 07 FY 08 FY09
Estimate FY10
Forecast Revenue $152 $156 $158 $161 $161 Key Assumptions: Liquor tax revenue will remain flat over the forecast period. The fiscal year 2010 forecast is based on no growth over fiscal year 2009.
Liquor consumption is less responsive to business cycle fluctuations than other forms of consumption, making liquor taxes a relatively stable source of revenue. During recessions, consumers tend to reduce their alcohol spending, perhaps by substituting home consumption for restaurant and bar consumption or by purchasing less expensive brands, but their level of consumption in volume terms tends to remain relatively constant. Since Illinois’ liquor tax is an excise tax levied on the gallons sold, changes in alcohol spending apart from changes in consumption do not affect the revenue stream. In fiscal year 2008, liquor tax revenue increased 1.5 percent. In terms of revenue composition by type of alcohol in fiscal year 2008, hard liquor generated 53
5 - 11
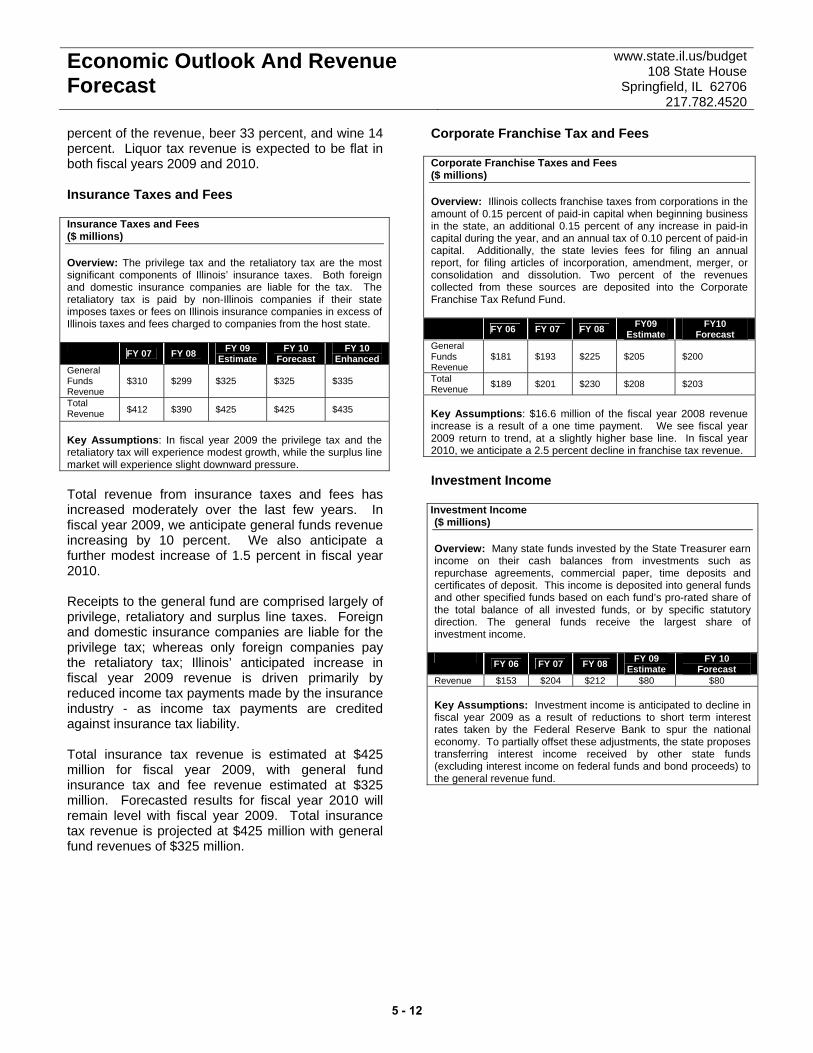
Economic Outlook And Revenue Forecast
www.state.il.us/budget 108 State House
Springfield, IL 62706 217.782.4520
percent of the revenue, beer 33 percent, and wine 14 percent. Liquor tax revenue is expected to be flat in both fiscal years 2009 and 2010. Insurance Taxes and Fees Insurance Taxes and Fees ($ millions) Overview: The privilege tax and the retaliatory tax are the most significant components of Illinois’ insurance taxes. Both foreign and domestic insurance companies are liable for the tax. The retaliatory tax is paid by non-Illinois companies if their state imposes taxes or fees on Illinois insurance companies in excess of Illinois taxes and fees charged to companies from the host state. FY 07 FY 08 FY 09
Estimate FY 10
Forecast FY 10
Enhanced General Funds Revenue
$310 $299 $325 $325 $335
Total Revenue $412 $390 $425 $425 $435
Key Assumptions: In fiscal year 2009 the privilege tax and the retaliatory tax will experience modest growth, while the surplus line market will experience slight downward pressure. Total revenue from insurance taxes and fees has increased moderately over the last few years. In fiscal year 2009, we anticipate general funds revenue increasing by 10 percent. We also anticipate a further modest increase of 1.5 percent in fiscal year 2010. Receipts to the general fund are comprised largely of privilege, retaliatory and surplus line taxes. Foreign and domestic insurance companies are liable for the privilege tax; whereas only foreign companies pay the retaliatory tax; Illinois’ anticipated increase in fiscal year 2009 revenue is driven primarily by reduced income tax payments made by the insurance industry - as income tax payments are credited against insurance tax liability. Total insurance tax revenue is estimated at $425 million for fiscal year 2009, with general fund insurance tax and fee revenue estimated at $325 million. Forecasted results for fiscal year 2010 will remain level with fiscal year 2009. Total insurance tax revenue is projected at $425 million with general fund revenues of $325 million.
Corporate Franchise Tax and Fees Corporate Franchise Taxes and Fees ($ millions) Overview: Illinois collects franchise taxes from corporations in the amount of 0.15 percent of paid-in capital when beginning business in the state, an additional 0.15 percent of any increase in paid-in capital during the year, and an annual tax of 0.10 percent of paid-in capital. Additionally, the state levies fees for filing an annual report, for filing articles of incorporation, amendment, merger, or consolidation and dissolution. Two percent of the revenues collected from these sources are deposited into the Corporate Franchise Tax Refund Fund. FY 06 FY 07 FY 08 FY09
Estimate FY10
Forecast General Funds Revenue
$181 $193 $225 $205 $200
Total Revenue $189 $201 $230 $208 $203
Key Assumptions: $16.6 million of the fiscal year 2008 revenue increase is a result of a one time payment. We see fiscal year 2009 return to trend, at a slightly higher base line. In fiscal year 2010, we anticipate a 2.5 percent decline in franchise tax revenue. Investment Income Investment Income ($ millions) Overview: Many state funds invested by the State Treasurer earn income on their cash balances from investments such as repurchase agreements, commercial paper, time deposits and certificates of deposit. This income is deposited into general funds and other specified funds based on each fund’s pro-rated share of the total balance of all invested funds, or by specific statutory direction. The general funds receive the largest share of investment income. FY 06 FY 07 FY 08 FY 09
Estimate FY 10
Forecast Revenue $153 $204 $212 $80 $80 Key Assumptions: Investment income is anticipated to decline in fiscal year 2009 as a result of reductions to short term interest rates taken by the Federal Reserve Bank to spur the national economy. To partially offset these adjustments, the state proposes transferring interest income received by other state funds (excluding interest income on federal funds and bond proceeds) to the general revenue fund.
5 - 12
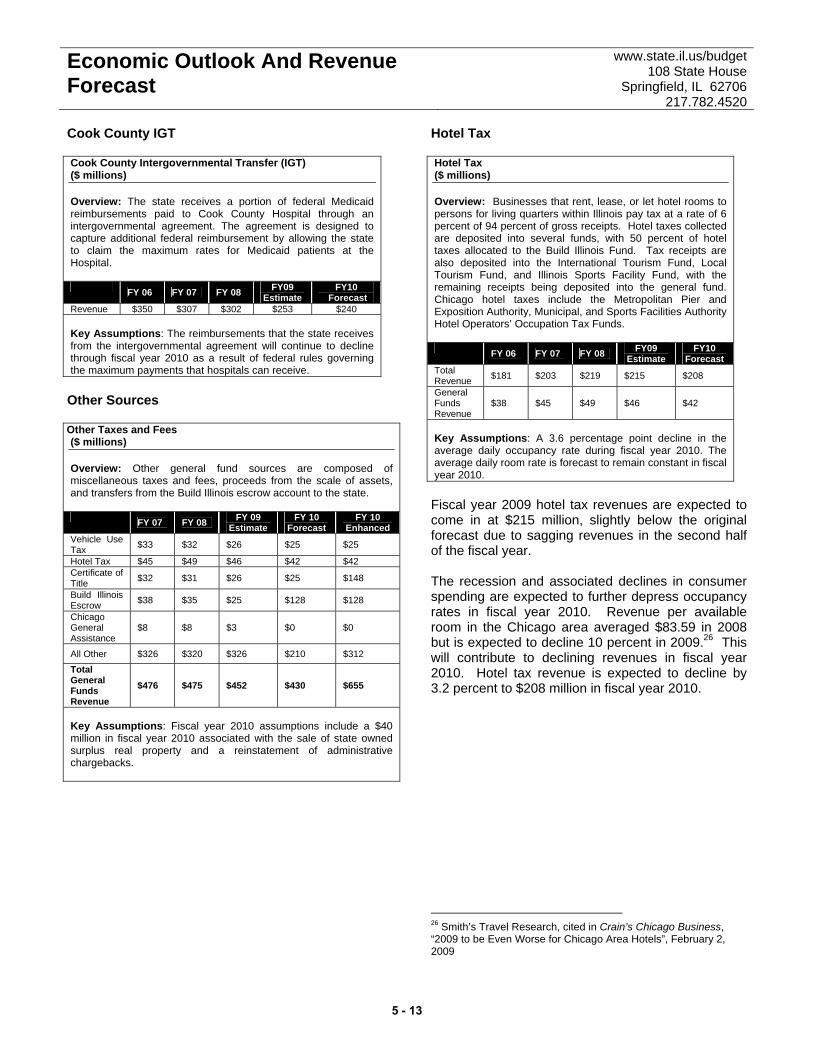
Economic Outlook And Revenue Forecast
www.state.il.us/budget 108 State House
Springfield, IL 62706 217.782.4520
Cook County IGT Cook County Intergovernmental Transfer (IGT) ($ millions) Overview: The state receives a portion of federal Medicaid reimbursements paid to Cook County Hospital through an intergovernmental agreement. The agreement is designed to capture additional federal reimbursement by allowing the state to claim the maximum rates for Medicaid patients at the Hospital. FY 06 FY 07 FY 08 FY09
Estimate FY10
Forecast Revenue $350 $307 $302 $253 $240 Key Assumptions: The reimbursements that the state receives from the intergovernmental agreement will continue to decline through fiscal year 2010 as a result of federal rules governing the maximum payments that hospitals can receive. Other Sources Other Taxes and Fees ($ millions) Overview: Other general fund sources are composed of miscellaneous taxes and fees, proceeds from the scale of assets, and transfers from the Build Illinois escrow account to the state. FY 07 FY 08 FY 09
Estimate FY 10
Forecast FY 10
Enhanced Vehicle Use Tax $33 $32 $26 $25 $25
Hotel Tax $45 $49 $46 $42 $42 Certificate of Title $32 $31 $26 $25 $148
Build Illinois Escrow $38 $35 $25 $128 $128
Chicago General Assistance
$8 $8 $3 $0 $0
All Other $326 $320 $326 $210 $312
Total General Funds Revenue
$476 $475 $452 $430 $655
Key Assumptions: Fiscal year 2010 assumptions include a $40 million in fiscal year 2010 associated with the sale of state owned surplus real property and a reinstatement of administrative chargebacks.
Hotel Tax Hotel Tax ($ millions) Overview: Businesses that rent, lease, or let hotel rooms to persons for living quarters within Illinois pay tax at a rate of 6 percent of 94 percent of gross receipts. Hotel taxes collected are deposited into several funds, with 50 percent of hotel taxes allocated to the Build Illinois Fund. Tax receipts are also deposited into the International Tourism Fund, Local Tourism Fund, and Illinois Sports Facility Fund, with the remaining receipts being deposited into the general fund. Chicago hotel taxes include the Metropolitan Pier and Exposition Authority, Municipal, and Sports Facilities Authority Hotel Operators’ Occupation Tax Funds. FY 06 FY 07 FY 08 FY09
Estimate FY10
Forecast Total Revenue $181 $203 $219 $215 $208
General Funds Revenue
$38 $45 $49 $46 $42
Key Assumptions: A 3.6 percentage point decline in the average daily occupancy rate during fiscal year 2010. The average daily room rate is forecast to remain constant in fiscal year 2010. Fiscal year 2009 hotel tax revenues are expected to come in at $215 million, slightly below the original forecast due to sagging revenues in the second half of the fiscal year. The recession and associated declines in consumer spending are expected to further depress occupancy rates in fiscal year 2010. Revenue per available room in the Chicago area averaged $83.59 in 2008 but is expected to decline 10 percent in 2009.26 This will contribute to declining revenues in fiscal year 2010. Hotel tax revenue is expected to decline by 3.2 percent to $208 million in fiscal year 2010.
26 Smith’s Travel Research, cited in Crain’s Chicago Business, “2009 to be Even Worse for Chicago Area Hotels”, February 2, 2009
5 - 13
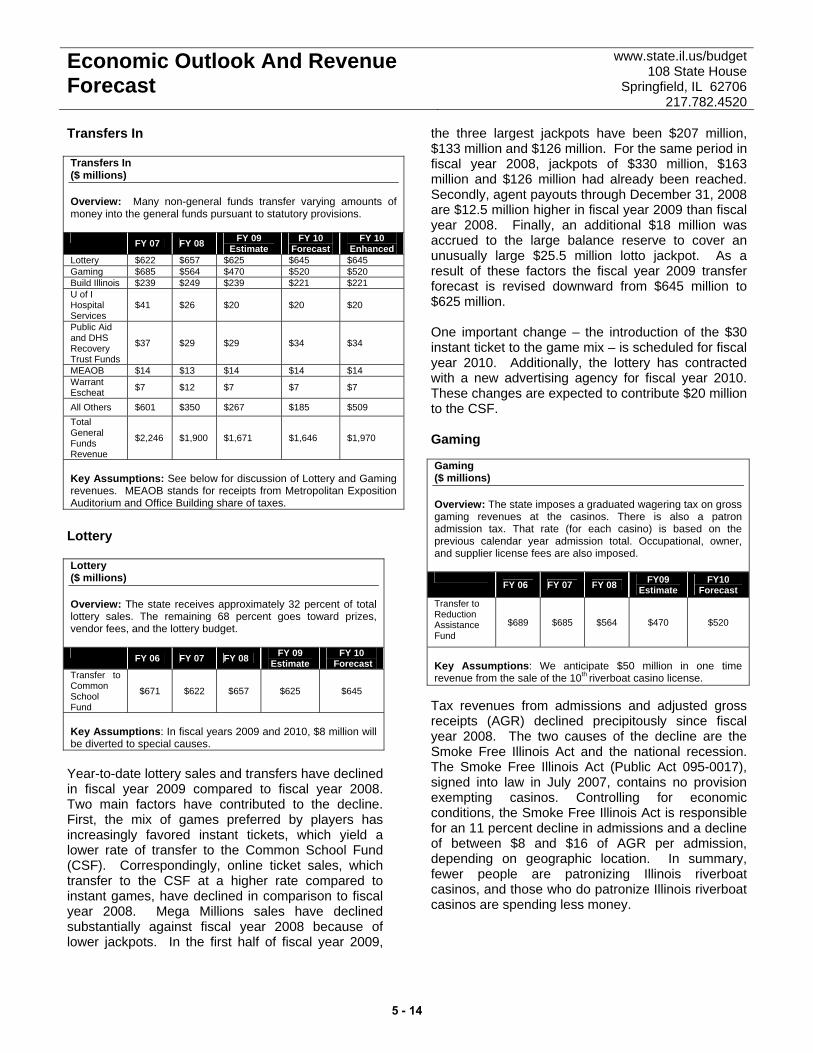
Economic Outlook And Revenue Forecast
www.state.il.us/budget 108 State House
Springfield, IL 62706 217.782.4520
Transfers In Transfers In ($ millions) Overview: Many non-general funds transfer varying amounts of money into the general funds pursuant to statutory provisions. FY 07 FY 08 FY 09
Estimate FY 10
Forecast FY 10
Enhanced Lottery $622 $657 $625 $645 $645 Gaming $685 $564 $470 $520 $520 Build Illinois $239 $249 $239 $221 $221 U of I Hospital Services
$41 $26 $20 $20 $20
Public Aid and DHS Recovery Trust Funds
$37 $29 $29 $34 $34
MEAOB $14 $13 $14 $14 $14 Warrant Escheat $7 $12 $7 $7 $7
All Others $601 $350 $267 $185 $509 Total General Funds Revenue
$2,246 $1,900 $1,671 $1,646 $1,970
Key Assumptions: See below for discussion of Lottery and Gaming revenues. MEAOB stands for receipts from Metropolitan Exposition Auditorium and Office Building share of taxes.
Lottery Lottery ($ millions) Overview: The state receives approximately 32 percent of total lottery sales. The remaining 68 percent goes toward prizes, vendor fees, and the lottery budget. FY 06 FY 07 FY 08 FY 09
Estimate FY 10
Forecast Transfer to Common School Fund
$671 $622 $657 $625 $645
Key Assumptions: In fiscal years 2009 and 2010, $8 million will be diverted to special causes. Year-to-date lottery sales and transfers have declined in fiscal year 2009 compared to fiscal year 2008. Two main factors have contributed to the decline. First, the mix of games preferred by players has increasingly favored instant tickets, which yield a lower rate of transfer to the Common School Fund (CSF). Correspondingly, online ticket sales, which transfer to the CSF at a higher rate compared to instant games, have declined in comparison to fiscal year 2008. Mega Millions sales have declined substantially against fiscal year 2008 because of lower jackpots. In the first half of fiscal year 2009,
the three largest jackpots have been $207 million, $133 million and $126 million. For the same period in fiscal year 2008, jackpots of $330 million, $163 million and $126 million had already been reached. Secondly, agent payouts through December 31, 2008 are $12.5 million higher in fiscal year 2009 than fiscal year 2008. Finally, an additional $18 million was accrued to the large balance reserve to cover an unusually large $25.5 million lotto jackpot. As a result of these factors the fiscal year 2009 transfer forecast is revised downward from $645 million to $625 million. One important change – the introduction of the $30 instant ticket to the game mix – is scheduled for fiscal year 2010. Additionally, the lottery has contracted with a new advertising agency for fiscal year 2010. These changes are expected to contribute $20 million to the CSF. Gaming Gaming ($ millions) Overview: The state imposes a graduated wagering tax on gross gaming revenues at the casinos. There is also a patron admission tax. That rate (for each casino) is based on the previous calendar year admission total. Occupational, owner, and supplier license fees are also imposed.
FY 06 FY 07 FY 08 FY09 Estimate
FY10 Forecast
Transfer to Reduction Assistance Fund
$689 $685 $564 $470 $520
Key Assumptions: We anticipate $50 million in one time revenue from the sale of the 10th riverboat casino license.
Tax revenues from admissions and adjusted gross receipts (AGR) declined precipitously since fiscal year 2008. The two causes of the decline are the Smoke Free Illinois Act and the national recession. The Smoke Free Illinois Act (Public Act 095-0017), signed into law in July 2007, contains no provision exempting casinos. Controlling for economic conditions, the Smoke Free Illinois Act is responsible for an 11 percent decline in admissions and a decline of between $8 and $16 of AGR per admission, depending on geographic location. In summary, fewer people are patronizing Illinois riverboat casinos, and those who do patronize Illinois riverboat casinos are spending less money.
5 - 14
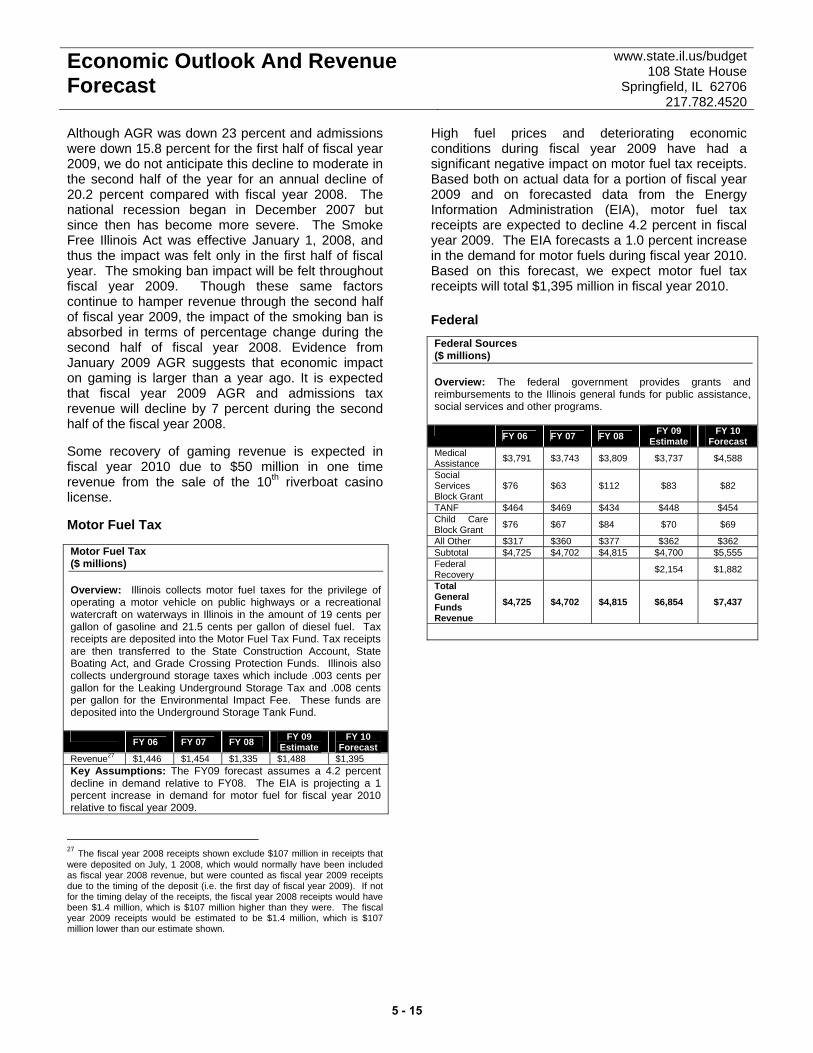
Economic Outlook And Revenue Forecast
www.state.il.us/budget 108 State House
Springfield, IL 62706 217.782.4520
Although AGR was down 23 percent and admissions were down 15.8 percent for the first half of fiscal year 2009, we do not anticipate this decline to moderate in the second half of the year for an annual decline of 20.2 percent compared with fiscal year 2008. The national recession began in December 2007 but since then has become more severe. The Smoke Free Illinois Act was effective January 1, 2008, and thus the impact was felt only in the first half of fiscal year. The smoking ban impact will be felt throughout fiscal year 2009. Though these same factors continue to hamper revenue through the second half of fiscal year 2009, the impact of the smoking ban is absorbed in terms of percentage change during the second half of fiscal year 2008. Evidence from January 2009 AGR suggests that economic impact on gaming is larger than a year ago. It is expected that fiscal year 2009 AGR and admissions tax revenue will decline by 7 percent during the second half of the fiscal year 2008. Some recovery of gaming revenue is expected in fiscal year 2010 due to $50 million in one time revenue from the sale of the 10th riverboat casino license. Motor Fuel Tax Motor Fuel Tax ($ millions) Overview: Illinois collects motor fuel taxes for the privilege of operating a motor vehicle on public highways or a recreational watercraft on waterways in Illinois in the amount of 19 cents per gallon of gasoline and 21.5 cents per gallon of diesel fuel. Tax receipts are deposited into the Motor Fuel Tax Fund. Tax receipts are then transferred to the State Construction Account, State Boating Act, and Grade Crossing Protection Funds. Illinois also collects underground storage taxes which include .003 cents per gallon for the Leaking Underground Storage Tax and .008 cents per gallon for the Environmental Impact Fee. These funds are deposited into the Underground Storage Tank Fund. FY 06 FY 07 FY 08 FY 09
Estimate FY 10
Forecast Revenue27 $1,446 $1,454 $1,335 $1,488 $1,395 Key Assumptions: The FY09 forecast assumes a 4.2 percent decline in demand relative to FY08. The EIA is projecting a 1 percent increase in demand for motor fuel for fiscal year 2010 relative to fiscal year 2009.
27 The fiscal year 2008 receipts shown exclude $107 million in receipts that were deposited on July, 1 2008, which would normally have been included as fiscal year 2008 revenue, but were counted as fiscal year 2009 receipts due to the timing of the deposit (i.e. the first day of fiscal year 2009). If not for the timing delay of the receipts, the fiscal year 2008 receipts would have been $1.4 million, which is $107 million higher than they were. The fiscal year 2009 receipts would be estimated to be $1.4 million, which is $107 million lower than our estimate shown.
High fuel prices and deteriorating economic conditions during fiscal year 2009 have had a significant negative impact on motor fuel tax receipts. Based both on actual data for a portion of fiscal year 2009 and on forecasted data from the Energy Information Administration (EIA), motor fuel tax receipts are expected to decline 4.2 percent in fiscal year 2009. The EIA forecasts a 1.0 percent increase in the demand for motor fuels during fiscal year 2010. Based on this forecast, we expect motor fuel tax receipts will total $1,395 million in fiscal year 2010. Federal Federal Sources ($ millions) Overview: The federal government provides grants and reimbursements to the Illinois general funds for public assistance, social services and other programs. FY 06 FY 07 FY 08 FY 09
Estimate FY 10
Forecast Medical Assistance $3,791 $3,743 $3,809 $3,737 $4,588
Social Services Block Grant
$76 $63 $112 $83 $82
TANF $464 $469 $434 $448 $454 Child Care Block Grant $76 $67 $84 $70 $69
All Other $317 $360 $377 $362 $362 Subtotal $4,725 $4,702 $4,815 $4,700 $5,555 Federal Recovery $2,154 $1,882
Total General Funds Revenue
$4,725 $4,702 $4,815 $6,854 $7,437
5 - 15

Economic Outlook And Revenue Forecast
www.state.il.us/budget 108 State House
Springfield, IL 62706 217.782.4520
Real Estate Transfer Tax Real Estate Transfer Tax ($ millions) Overview: The tax is imposed on the privilege of transferring title to real estate or a beneficial interest in a land trust in Illinois. The recorder of deeds in each county collects the tax through the sale of revenue stamps which counties purchase from the Department of Revenue. The state rate is 50 cents for each $500 of value. Counties may impose a tax of 25 cents per $500 of value on real estate transactions. Home rule units of government may also impose an additional real estate transfer tax. Collections are deposited as follows: 50 percent into the Illinois Affordable Housing Trust Fund; 35 percent into the Open Space Lands Acquisition and Development Fund; and 15 percent into the National Areas Acquisition Fund FY 06 FY 07 FY 08 FY09
Estimate FY10
Forecast Revenue $117 $100 $77 $53 $51 Key Assumptions: Dollar volumes will fall 31.2 percent in fiscal year 2009. In fiscal year 2010, we anticipate a decrease of 3.4 percent. Real estate transfer tax (RETT) revenues for fiscal year 2009 will come in $29 million below budget. Altogether, RETT revenues are expected to fall just over 30 percent for fiscal year 2009. This revision reflects the expectation that home sales and home prices will continue to erode during the second half of fiscal year 2009. The most severe declines will be observed in the market for new homes, in which annual unit sales and average prices are expected to fall approximately 35.1 percent and 9.6 percent, respectively. Revenue declines will continue through the first half of fiscal year 2010. Although real estate prices are not expected to stabilize until the first half of fiscal year 2011, continued price reductions will help spur demand in the latter half of fiscal year 2010 causing revenue to pick up slightly. However, gains in the second half of the fiscal year will not be large enough to offset the declines in the first half of the year, causing RETT revenues to decline slightly in fiscal year 2010. NEW REVENUE SOURCES Tax Changes Proposed in the Governor’s Fiscal Year 2010 Budget Individual and Corporate Income Taxes The governor’s 2010 budget proposes increasing the personal exemption from $2,000 to $6,000, effective
July 1, 2009. The budget also proposes increasing the income tax rate by 1.5 percentage points for individuals and 2.4 percentage points for corporations. This means that a family of four making $24,000 per year will pay no income tax. Under the current tax system, this family on average would pay $480 in income taxes. A family making the median Illinois income of $72,000 will pay only $240 more in income taxes than under the current system. Overall, the governor’s proposal will make the Illinois tax code more progressive, preventing poor families from being taxed further into poverty and protecting low to middle-income families from tax increases. For fiscal year 2010, the increase will generate an additional $2.8 billion in general fund individual income tax receipts and $350 million in general fund corporate income tax receipts. Ten percent of net income tax receipts will be set aside to pay for the governor’s capital plan program, Illinois Jobs Now!, leaving the amount available for state spending at $2.8 billion. With the income tax changes proposed in the budget, total net individual income tax deposited into the general fund is forecast at $11.7 billion. The net figure translates into gross individual income tax revenue of $14.7 billion. Based on previous experience and model simulation, we anticipate that the proposed income tax changes will increase the refund rate to around 20 percent of gross revenue in fiscal year 2010. In the case of corporate income tax, we assume a 24 percent refund rate, consistent with the refund rate associated with our base revenue. Equity Changes The budget includes several proposals to make the tax code fairer. These reforms will change provisions of law that need to be revised or are not affordable given the state’s current fiscal position. Reforms are proposed primarily to Corporate Income Tax and Sales Tax. Corporate Income Tax The governor’s proposed reforms to the Corporate Income Tax would result in $173 million in revenue for the state. These reforms include: correcting the Illinois Tax Code to include the Outer Continental Shelf and U.S. Territories in the United States; decoupling from federal tax incentives that flow through to Illinois and reduce state tax receipts;
5 - 16

Economic Outlook And Revenue Forecast
www.state.il.us/budget 108 State House
Springfield, IL 62706 217.782.4520
repealing the Research and Development Credit that is used by a small number of firms and has not been demonstrated to be effective; and limiting credits that a corporation can take to 50 percent of their tax owed so that all taxpayers pay something. Sales Tax Another $94 million in revenues for the state could result from reforms to the sales tax, which includes making prewritten software that is acquired via a licensing agreement subject to the same tax as software purchased off the shelf. In addition, Illinois would join a number of other states that align the exemption for graphic arts equipment to that allowed for manufacturing machinery by limiting it to graphic arts firms. The budget also includes proposals to: allow expiration of the Manufacturers’ Purchase Credit, an anomaly that allows a credit based on tax never paid; subject sweetened tea and coffee drinks to the same taxation as soft drinks; and tax all grooming and hygiene products at the same rate. Miscellaneous Finally, the state could realize an additional $20 million in increased revenues by implementing other tax reforms. For instance, the budget includes a proposal to revise a provision in the Insurance Tax Law that allows large entities to purchase insurance directly from an underwriter who is not licensed in Illinois, and thus avoid the insurance tax. In addition, the state will also seek to require banks to match their account holders to a list of tax scofflaws, a practice already required for child support payments. Federal Stimulus and Decoupling Several provisions of the American Recovery and Reinvestment Act of 2009 (ARRA) will have a negative impact on Illinois’ income tax revenue. However by decoupling Illinois from two key federal tax provisions, the state will save a combined $158 million in fiscal year 2010.
Section 1231 of ARRA allows firms to defer recognition of a gain from reacquisition of a business debt security by a borrower at less than face value in 2009 or 2010. Since Illinois piggybacks on federal taxable income, our income tax automatically incorporates this change. Decoupling will save the state $143 million. Section 1211 of ARRA allows a five-year carry-back of net operating losses (NOLS) by small business (including proprietorships, S and C corporations and partnerships). Sales Tax Holiday A ten-day sales tax holiday in August fiscal year 2010 on (a) clothing and footwear with a selling price of $100 or less and (b) school supplies would cost state government approximately $40 million to $50 million in sales tax revenue (based on 5 percent tax rate). This lost revenue could be recouped by lowering the retailer’s discount rate on the ST-1 to 0.75 percent for all of fiscal year 2010. Given certain assumptions about sales tax revenue in fiscal year 2010, a 0.75 percent rate would reduce the state’s allowed discount by $57 million in fiscal year 2010, compared to what would be allowed under a 1.75 percent rate. Illinois uses a per item price cap of $100 for clothing and footwear and assume certain items such as athletic gear, handbags, and jewelry will be excluded from the holiday because these features are typical of other states’ holidays. Our information on other states’ holidays comes from a state-by-state review of sales tax holidays published in State Tax Notes (Vol. 47, No. 13, March 31, 2008). We do not apply a price cap to school supplies, which we treat as stationery and writing supplies for the purpose of this estimate. School supplies holidays in other states tend to also include items such as scissors and calculators, but the available data does not separately identify expenditures for these items. The following table summarizes other state sales tax holidays that include clothing and footwear and/or school supplies.
5 - 17

5 - 18

EDUCATIONELEMENTARY AND SECONDARY EDUCATION
Illinois State Board of EducationTeachers’ Retirement System
HIGHER EDUCATION
Illinois Board of Higher Education
Public UniversitiesChicago State UniversityEastern Illinois University
Governors State UniversityIllinois State University
Northeastern Illinois UniversityNorthern Illinois UniversitySouthern Illinois University
University of IllinoisWestern Illinois University
Illinois Community College BoardIllinois Student Assistance Commission
Illinois Mathematics and Science AcademyState Universities Civil Service Merit Board
State Universities Retirement System
www.state.il.us/budget
CHAPTER 6

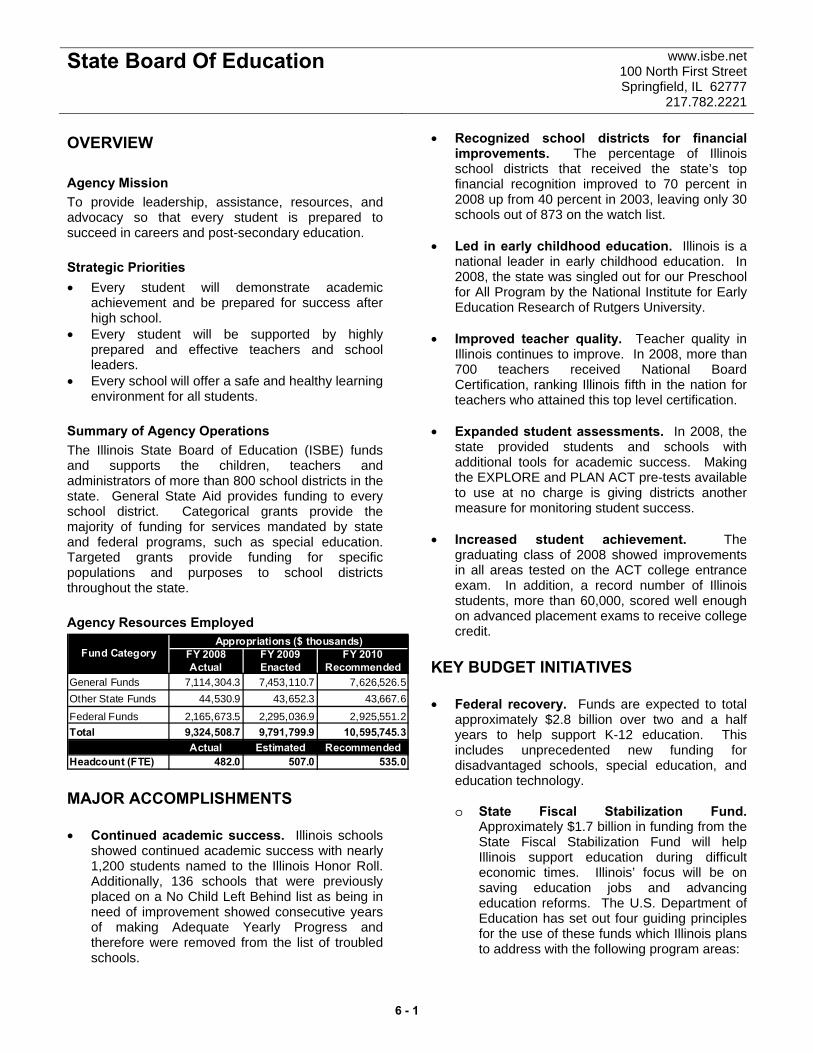
State Board Of Education www.isbe.net 100 North First Street Springfield, IL 62777
217.782.2221
OVERVIEW Agency Mission To provide leadership, assistance, resources, and advocacy so that every student is prepared to succeed in careers and post-secondary education. Strategic Priorities • Every student will demonstrate academic
achievement and be prepared for success after high school.
• Every student will be supported by highly prepared and effective teachers and school leaders.
• Every school will offer a safe and healthy learning environment for all students.
Summary of Agency Operations The Illinois State Board of Education (ISBE) funds and supports the children, teachers and administrators of more than 800 school districts in the state. General State Aid provides funding to every school district. Categorical grants provide the majority of funding for services mandated by state and federal programs, such as special education. Targeted grants provide funding for specific populations and purposes to school districts throughout the state. Agency Resources Employed
FY 2008 FY 2009 FY 2010Actual Enacted Recommended
General Funds 7,114,304.3 7,453,110.7 7,626,526.5Other State Funds 44,530.9 43,652.3 43,667.6
Federal Funds 2,165,673.5 2,295,036.9 2,925,551.2Total 9,324,508.7 9,791,799.9 10,595,745.3
Actual Estimated RecommendedHeadcount (FTE) 482.0 507.0 535.0
Appropriations ($ thousands)Fund Category
MAJOR ACCOMPLISHMENTS • Continued academic success. Illinois schools
showed continued academic success with nearly 1,200 students named to the Illinois Honor Roll. Additionally, 136 schools that were previously placed on a No Child Left Behind list as being in need of improvement showed consecutive years of making Adequate Yearly Progress and therefore were removed from the list of troubled schools.
• Recognized school districts for financial improvements. The percentage of Illinois school districts that received the state’s top financial recognition improved to 70 percent in 2008 up from 40 percent in 2003, leaving only 30 schools out of 873 on the watch list.
• Led in early childhood education. Illinois is a
national leader in early childhood education. In 2008, the state was singled out for our Preschool for All Program by the National Institute for Early Education Research of Rutgers University.
• Improved teacher quality. Teacher quality in
Illinois continues to improve. In 2008, more than 700 teachers received National Board Certification, ranking Illinois fifth in the nation for teachers who attained this top level certification.
• Expanded student assessments. In 2008, the
state provided students and schools with additional tools for academic success. Making the EXPLORE and PLAN ACT pre-tests available to use at no charge is giving districts another measure for monitoring student success.
• Increased student achievement. The
graduating class of 2008 showed improvements in all areas tested on the ACT college entrance exam. In addition, a record number of Illinois students, more than 60,000, scored well enough on advanced placement exams to receive college credit.
KEY BUDGET INITIATIVES • Federal recovery. Funds are expected to total
approximately $2.8 billion over two and a half years to help support K-12 education. This includes unprecedented new funding for disadvantaged schools, special education, and education technology.
o State Fiscal Stabilization Fund.
Approximately $1.7 billion in funding from the State Fiscal Stabilization Fund will help Illinois support education during difficult economic times. Illinois’ focus will be on saving education jobs and advancing education reforms. The U.S. Department of Education has set out four guiding principles for the use of these funds which Illinois plans to address with the following program areas:
6 - 1
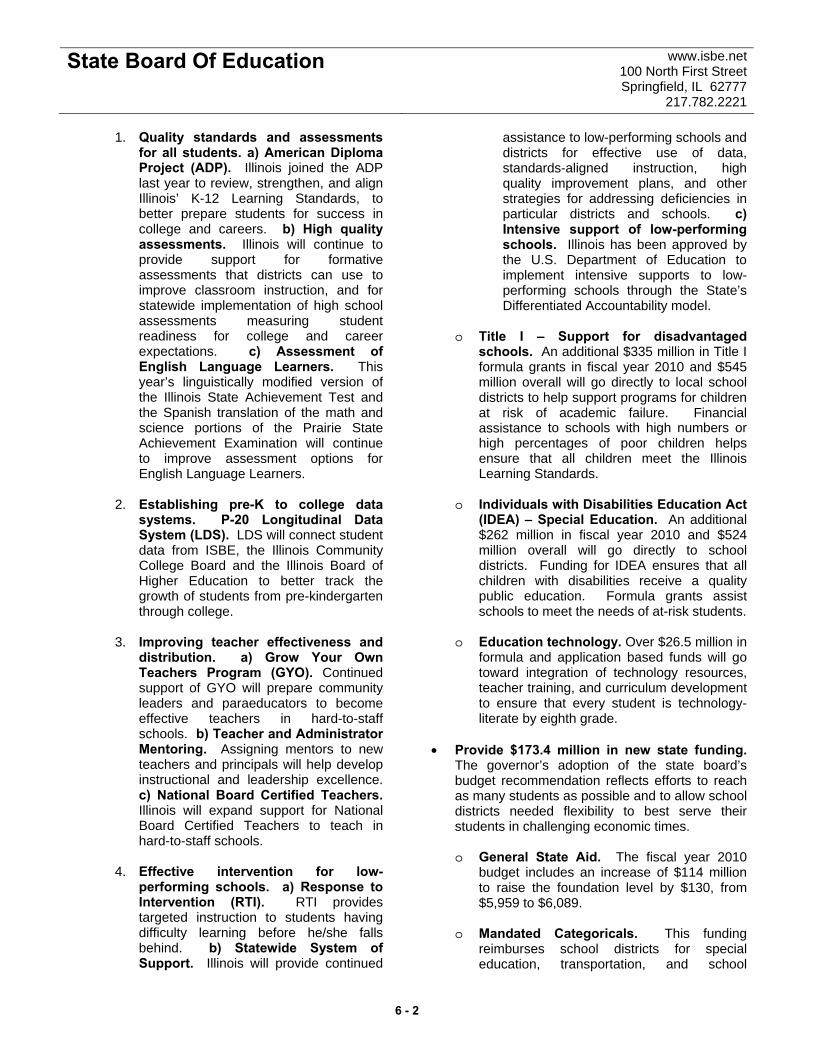
State Board Of Education www.isbe.net 100 North First Street Springfield, IL 62777
217.782.2221
1. Quality standards and assessments for all students. a) American Diploma Project (ADP). Illinois joined the ADP last year to review, strengthen, and align Illinois’ K-12 Learning Standards, to better prepare students for success in college and careers. b) High quality assessments. Illinois will continue to provide support for formative assessments that districts can use to improve classroom instruction, and for statewide implementation of high school assessments measuring student readiness for college and career expectations. c) Assessment of English Language Learners. This year’s linguistically modified version of the Illinois State Achievement Test and the Spanish translation of the math and science portions of the Prairie State Achievement Examination will continue to improve assessment options for English Language Learners.
2. Establishing pre-K to college data
systems. P-20 Longitudinal Data System (LDS). LDS will connect student data from ISBE, the Illinois Community College Board and the Illinois Board of Higher Education to better track the growth of students from pre-kindergarten through college.
3. Improving teacher effectiveness and
distribution. a) Grow Your Own Teachers Program (GYO). Continued support of GYO will prepare community leaders and paraeducators to become effective teachers in hard-to-staff schools. b) Teacher and Administrator Mentoring. Assigning mentors to new teachers and principals will help develop instructional and leadership excellence. c) National Board Certified Teachers. Illinois will expand support for National Board Certified Teachers to teach in hard-to-staff schools.
4. Effective intervention for low-
performing schools. a) Response to Intervention (RTI). RTI provides targeted instruction to students having difficulty learning before he/she falls behind. b) Statewide System of Support. Illinois will provide continued
assistance to low-performing schools and districts for effective use of data, standards-aligned instruction, high quality improvement plans, and other strategies for addressing deficiencies in particular districts and schools. c) Intensive support of low-performing schools. Illinois has been approved by the U.S. Department of Education to implement intensive supports to low-performing schools through the State’s Differentiated Accountability model.
o Title I – Support for disadvantaged
schools. An additional $335 million in Title I formula grants in fiscal year 2010 and $545 million overall will go directly to local school districts to help support programs for children at risk of academic failure. Financial assistance to schools with high numbers or high percentages of poor children helps ensure that all children meet the Illinois Learning Standards.
o Individuals with Disabilities Education Act
(IDEA) – Special Education. An additional $262 million in fiscal year 2010 and $524 million overall will go directly to school districts. Funding for IDEA ensures that all children with disabilities receive a quality public education. Formula grants assist schools to meet the needs of at-risk students.
o Education technology. Over $26.5 million in
formula and application based funds will go toward integration of technology resources, teacher training, and curriculum development to ensure that every student is technology-literate by eighth grade.
• Provide $173.4 million in new state funding.
The governor’s adoption of the state board’s budget recommendation reflects efforts to reach as many students as possible and to allow school districts needed flexibility to best serve their students in challenging economic times.
o General State Aid. The fiscal year 2010
budget includes an increase of $114 million to raise the foundation level by $130, from $5,959 to $6,089.
o Mandated Categoricals. This funding
reimburses school districts for special education, transportation, and school
6 - 2
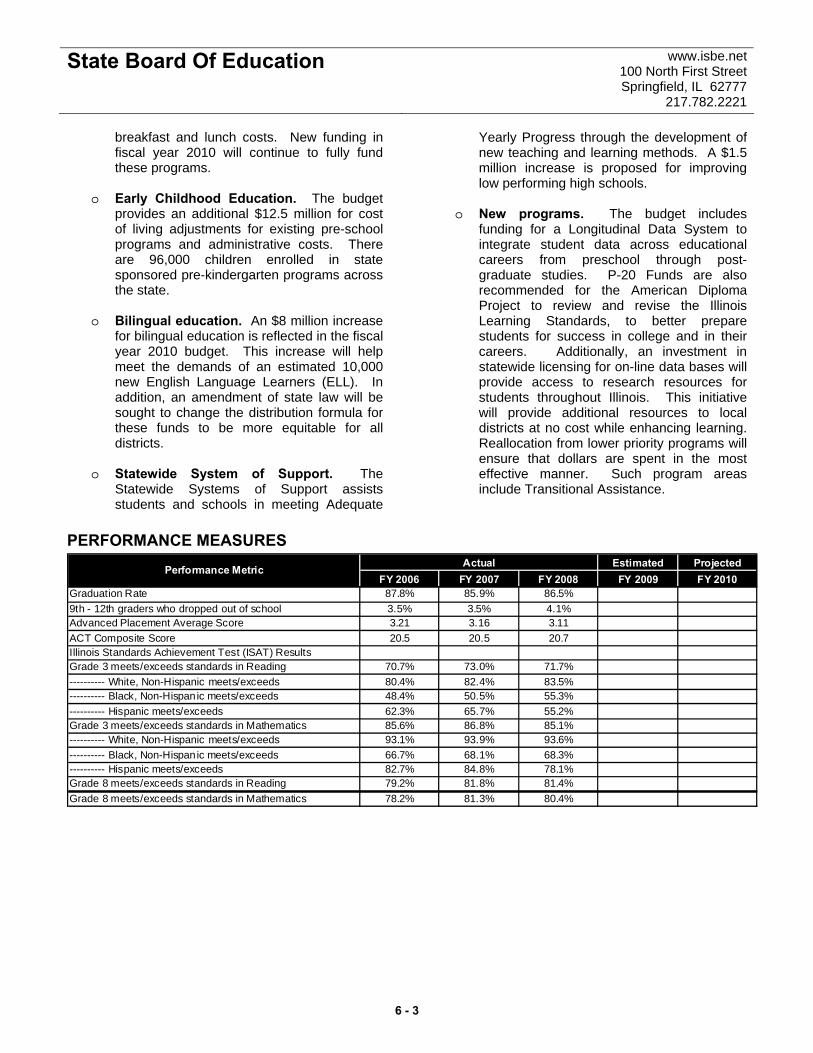
State Board Of Education www.isbe.net 100 North First Street Springfield, IL 62777
217.782.2221
breakfast and lunch costs. New funding in fiscal year 2010 will continue to fully fund these programs.
o Early Childhood Education. The budget
provides an additional $12.5 million for cost of living adjustments for existing pre-school programs and administrative costs. There are 96,000 children enrolled in state sponsored pre-kindergarten programs across the state.
o Bilingual education. An $8 million increase
for bilingual education is reflected in the fiscal year 2010 budget. This increase will help meet the demands of an estimated 10,000 new English Language Learners (ELL). In addition, an amendment of state law will be sought to change the distribution formula for these funds to be more equitable for all districts.
o Statewide System of Support. The
Statewide Systems of Support assists students and schools in meeting Adequate
Yearly Progress through the development of new teaching and learning methods. A $1.5 million increase is proposed for improving low performing high schools.
o New programs. The budget includes
funding for a Longitudinal Data System to integrate student data across educational careers from preschool through post-graduate studies. P-20 Funds are also recommended for the American Diploma Project to review and revise the Illinois Learning Standards, to better prepare students for success in college and in their careers. Additionally, an investment in statewide licensing for on-line data bases will provide access to research resources for students throughout Illinois. This initiative will provide additional resources to local districts at no cost while enhancing learning. Reallocation from lower priority programs will ensure that dollars are spent in the most effective manner. Such program areas include Transitional Assistance.
PERFORMANCE MEASURES Estimated Projected
FY 2006 FY 2007 FY 2008 FY 2009 FY 2010Graduation Rate 87.8% 85.9% 86.5%9th - 12th graders who dropped out of school 3.5% 3.5% 4.1%Advanced Placement Average Score 3.21 3.16 3.11ACT Composite Score 20.5 20.5 20.7Illinois Standards Achievement Test (ISAT) ResultsGrade 3 meets/exceeds standards in Reading 70.7% 73.0% 71.7%---------- White, Non-Hispanic meets/exceeds 80.4% 82.4% 83.5%---------- Black, Non-Hispanic meets/exceeds 48.4% 50.5% 55.3%---------- Hispanic meets/exceeds 62.3% 65.7% 55.2%Grade 3 meets/exceeds standards in Mathematics 85.6% 86.8% 85.1%---------- White, Non-Hispanic meets/exceeds 93.1% 93.9% 93.6%---------- Black, Non-Hispanic meets/exceeds 66.7% 68.1% 68.3%---------- Hispanic meets/exceeds 82.7% 84.8% 78.1%Grade 8 meets/exceeds standards in Reading 79.2% 81.8% 81.4%Grade 8 meets/exceeds standards in Mathematics 78.2% 81.3% 80.4%
ActualPerformance Metric
6 - 3
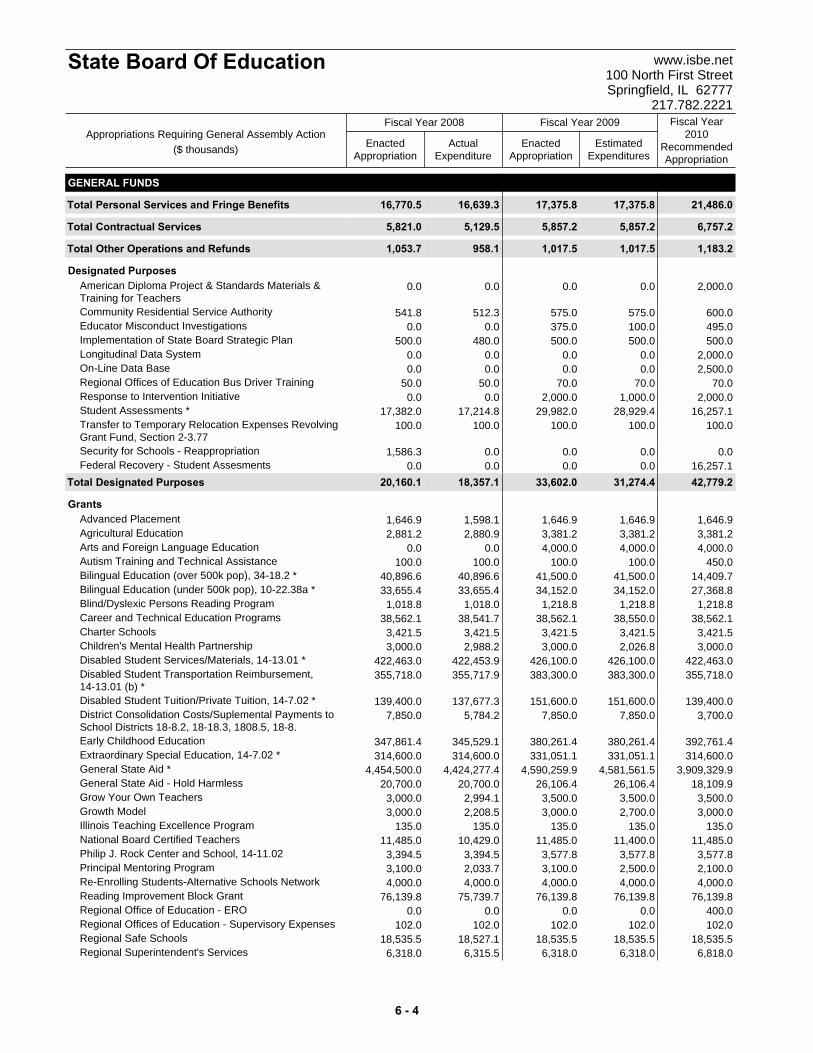
ActualExpenditure
EnactedAppropriation
EstimatedExpenditures
EnactedAppropriation
Fiscal Year2010
RecommendedAppropriation
Fiscal Year 2008 Fiscal Year 2009
State Board Of Education www.isbe.net100 North First StreetSpringfield, IL 62777
217.782.2221
Appropriations Requiring General Assembly Action($ thousands)
GENERAL FUNDS
Total 16,770.5 21,486.017,375.817,375.816,639.3Personal Services and Fringe Benefits
Total 5,821.0 6,757.25,857.25,857.25,129.5Contractual Services
Total 1,053.7 1,183.21,017.51,017.5958.1Other Operations and Refunds
Designated Purposes0.0 2,000.00.00.00.0American Diploma Project & Standards Materials &
Training for Teachers541.8 600.0575.0575.0512.3Community Residential Service Authority
0.0 495.0100.0375.00.0Educator Misconduct Investigations500.0 500.0500.0500.0480.0Implementation of State Board Strategic Plan
0.0 2,000.00.00.00.0Longitudinal Data System0.0 2,500.00.00.00.0On-Line Data Base
50.0 70.070.070.050.0Regional Offices of Education Bus Driver Training0.0 2,000.01,000.02,000.00.0Response to Intervention Initiative
17,382.0 16,257.128,929.429,982.017,214.8Student Assessments *100.0 100.0100.0100.0100.0Transfer to Temporary Relocation Expenses Revolving
Grant Fund, Section 2-3.771,586.3 0.00.00.00.0Security for Schools - Reappropriation
0.0 16,257.10.00.00.0Federal Recovery - Student AssesmentsTotal 20,160.1 42,779.231,274.433,602.018,357.1Designated Purposes
Grants1,646.9 1,646.91,646.91,646.91,598.1Advanced Placement2,881.2 3,381.23,381.23,381.22,880.9Agricultural Education
0.0 4,000.04,000.04,000.00.0Arts and Foreign Language Education100.0 450.0100.0100.0100.0Autism Training and Technical Assistance
40,896.6 14,409.741,500.041,500.040,896.6Bilingual Education (over 500k pop), 34-18.2 *33,655.4 27,368.834,152.034,152.033,655.4Bilingual Education (under 500k pop), 10-22.38a *
1,018.8 1,218.81,218.81,218.81,018.0Blind/Dyslexic Persons Reading Program38,562.1 38,562.138,550.038,562.138,541.7Career and Technical Education Programs
3,421.5 3,421.53,421.53,421.53,421.5Charter Schools3,000.0 3,000.02,026.83,000.02,988.2Children's Mental Health Partnership
422,463.0 422,463.0426,100.0426,100.0422,453.9Disabled Student Services/Materials, 14-13.01 *355,718.0 355,718.0383,300.0383,300.0355,717.9Disabled Student Transportation Reimbursement,
14-13.01 (b) *139,400.0 139,400.0151,600.0151,600.0137,677.3Disabled Student Tuition/Private Tuition, 14-7.02 *
7,850.0 3,700.07,850.07,850.05,784.2District Consolidation Costs/Suplemental Payments toSchool Districts 18-8.2, 18-18.3, 1808.5, 18-8.
347,861.4 392,761.4380,261.4380,261.4345,529.1Early Childhood Education314,600.0 314,600.0331,051.1331,051.1314,600.0Extraordinary Special Education, 14-7.02 *
4,454,500.0 3,909,329.94,581,561.54,590,259.94,424,277.4General State Aid *20,700.0 18,109.926,106.426,106.420,700.0General State Aid - Hold Harmless
3,000.0 3,500.03,500.03,500.02,994.1Grow Your Own Teachers3,000.0 3,000.02,700.03,000.02,208.5Growth Model
135.0 135.0135.0135.0135.0Illinois Teaching Excellence Program11,485.0 11,485.011,400.011,485.010,429.0National Board Certified Teachers
3,394.5 3,577.83,577.83,577.83,394.5Philip J. Rock Center and School, 14-11.023,100.0 2,100.02,500.03,100.02,033.7Principal Mentoring Program4,000.0 4,000.04,000.04,000.04,000.0Re-Enrolling Students-Alternative Schools Network
76,139.8 76,139.876,139.876,139.875,739.7Reading Improvement Block Grant0.0 400.00.00.00.0Regional Office of Education - ERO
102.0 102.0102.0102.0102.0Regional Offices of Education - Supervisory Expenses18,535.5 18,535.518,535.518,535.518,527.1Regional Safe Schools
6,318.0 6,818.06,318.06,318.06,315.5Regional Superintendent's Services
6 - 4
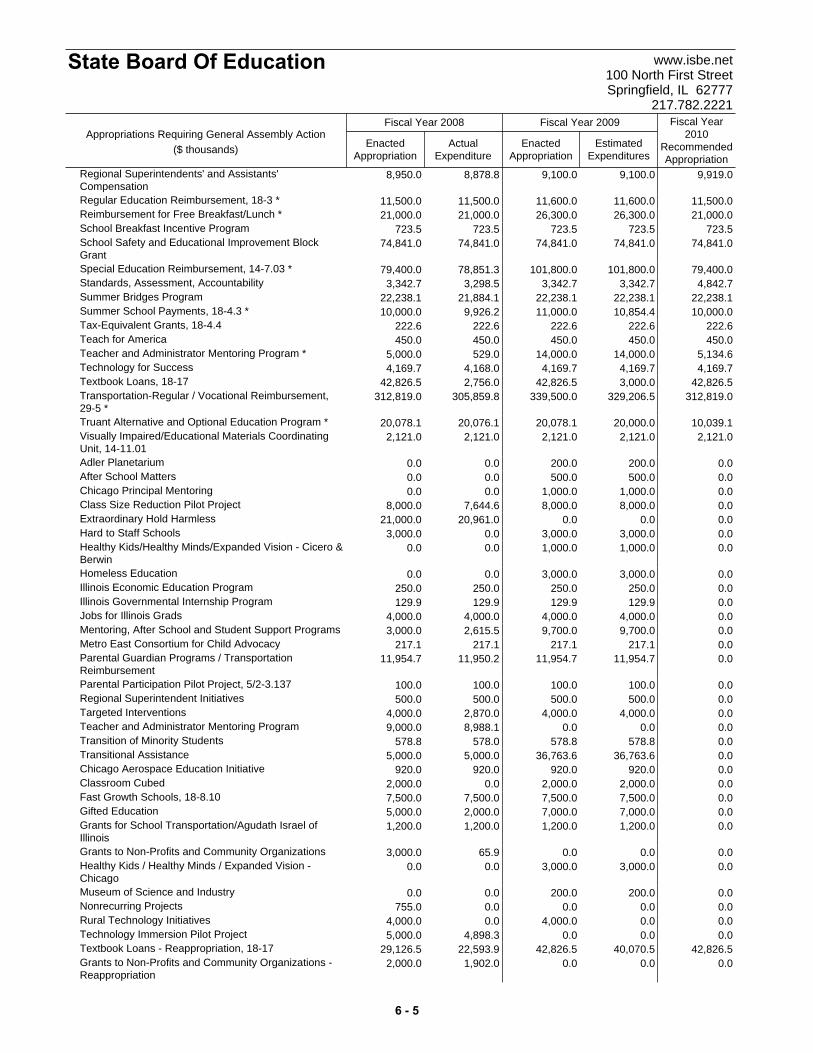
ActualExpenditure
EnactedAppropriation
EstimatedExpenditures
EnactedAppropriation
Fiscal Year2010
RecommendedAppropriation
Fiscal Year 2008 Fiscal Year 2009
State Board Of Education www.isbe.net100 North First StreetSpringfield, IL 62777
217.782.2221
Appropriations Requiring General Assembly Action($ thousands)
8,950.0 9,919.09,100.09,100.08,878.8Regional Superintendents' and Assistants'Compensation
11,500.0 11,500.011,600.011,600.011,500.0Regular Education Reimbursement, 18-3 *21,000.0 21,000.026,300.026,300.021,000.0Reimbursement for Free Breakfast/Lunch *
723.5 723.5723.5723.5723.5School Breakfast Incentive Program74,841.0 74,841.074,841.074,841.074,841.0School Safety and Educational Improvement Block
Grant79,400.0 79,400.0101,800.0101,800.078,851.3Special Education Reimbursement, 14-7.03 *
3,342.7 4,842.73,342.73,342.73,298.5Standards, Assessment, Accountability22,238.1 22,238.122,238.122,238.121,884.1Summer Bridges Program10,000.0 10,000.010,854.411,000.09,926.2Summer School Payments, 18-4.3 *
222.6 222.6222.6222.6222.6Tax-Equivalent Grants, 18-4.4450.0 450.0450.0450.0450.0Teach for America
5,000.0 5,134.614,000.014,000.0529.0Teacher and Administrator Mentoring Program *4,169.7 4,169.74,169.74,169.74,168.0Technology for Success
42,826.5 42,826.53,000.042,826.52,756.0Textbook Loans, 18-17312,819.0 312,819.0329,206.5339,500.0305,859.8Transportation-Regular / Vocational Reimbursement,
29-5 *20,078.1 10,039.120,000.020,078.120,076.1Truant Alternative and Optional Education Program *
2,121.0 2,121.02,121.02,121.02,121.0Visually Impaired/Educational Materials CoordinatingUnit, 14-11.01
0.0 0.0200.0200.00.0Adler Planetarium0.0 0.0500.0500.00.0After School Matters0.0 0.01,000.01,000.00.0Chicago Principal Mentoring
8,000.0 0.08,000.08,000.07,644.6Class Size Reduction Pilot Project21,000.0 0.00.00.020,961.0Extraordinary Hold Harmless
3,000.0 0.03,000.03,000.00.0Hard to Staff Schools0.0 0.01,000.01,000.00.0Healthy Kids/Healthy Minds/Expanded Vision - Cicero &
Berwin0.0 0.03,000.03,000.00.0Homeless Education
250.0 0.0250.0250.0250.0Illinois Economic Education Program129.9 0.0129.9129.9129.9Illinois Governmental Internship Program
4,000.0 0.04,000.04,000.04,000.0Jobs for Illinois Grads3,000.0 0.09,700.09,700.02,615.5Mentoring, After School and Student Support Programs
217.1 0.0217.1217.1217.1Metro East Consortium for Child Advocacy11,954.7 0.011,954.711,954.711,950.2Parental Guardian Programs / Transportation
Reimbursement100.0 0.0100.0100.0100.0Parental Participation Pilot Project, 5/2-3.137500.0 0.0500.0500.0500.0Regional Superintendent Initiatives
4,000.0 0.04,000.04,000.02,870.0Targeted Interventions9,000.0 0.00.00.08,988.1Teacher and Administrator Mentoring Program
578.8 0.0578.8578.8578.0Transition of Minority Students5,000.0 0.036,763.636,763.65,000.0Transitional Assistance
920.0 0.0920.0920.0920.0Chicago Aerospace Education Initiative2,000.0 0.02,000.02,000.00.0Classroom Cubed7,500.0 0.07,500.07,500.07,500.0Fast Growth Schools, 18-8.105,000.0 0.07,000.07,000.02,000.0Gifted Education1,200.0 0.01,200.01,200.01,200.0Grants for School Transportation/Agudath Israel of
Illinois3,000.0 0.00.00.065.9Grants to Non-Profits and Community Organizations
0.0 0.03,000.03,000.00.0Healthy Kids / Healthy Minds / Expanded Vision -Chicago
0.0 0.0200.0200.00.0Museum of Science and Industry755.0 0.00.00.00.0Nonrecurring Projects
4,000.0 0.00.04,000.00.0Rural Technology Initiatives5,000.0 0.00.00.04,898.3Technology Immersion Pilot Project
29,126.5 42,826.540,070.542,826.522,593.9Textbook Loans - Reappropriation, 18-172,000.0 0.00.00.01,902.0Grants to Non-Profits and Community Organizations -
Reappropriation
6 - 5
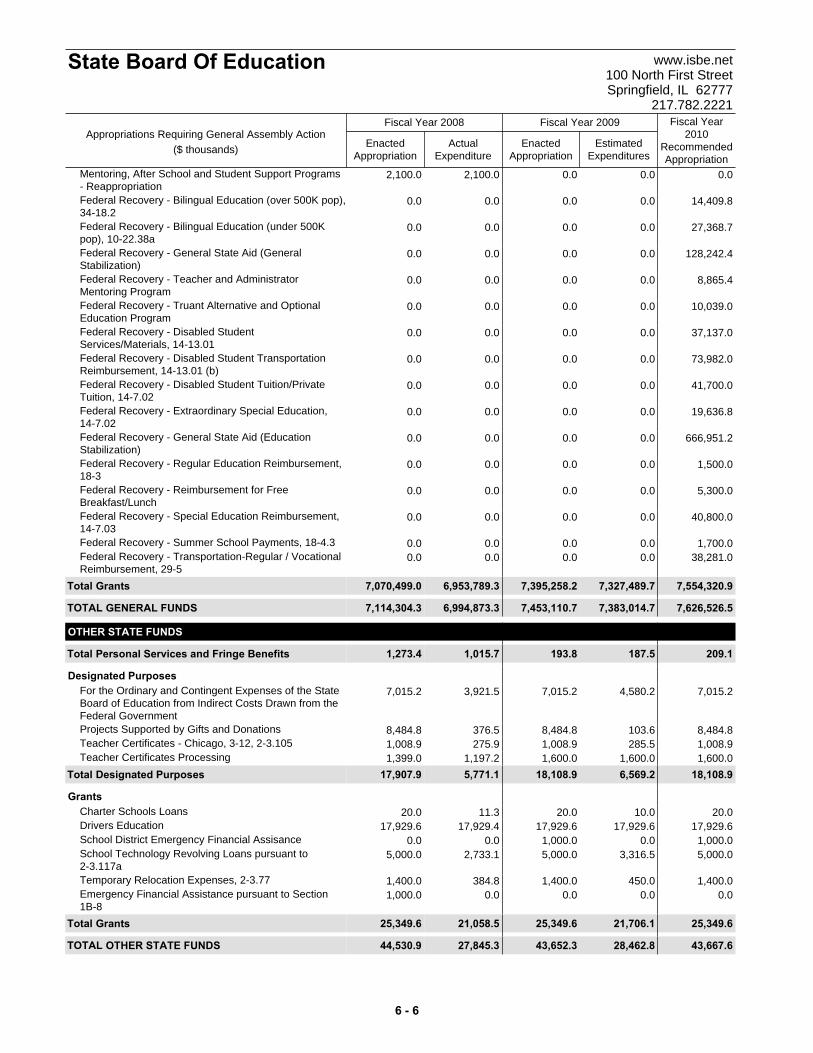
ActualExpenditure
EnactedAppropriation
EstimatedExpenditures
EnactedAppropriation
Fiscal Year2010
RecommendedAppropriation
Fiscal Year 2008 Fiscal Year 2009
State Board Of Education www.isbe.net100 North First StreetSpringfield, IL 62777
217.782.2221
Appropriations Requiring General Assembly Action($ thousands)
2,100.0 0.00.00.02,100.0Mentoring, After School and Student Support Programs- Reappropriation
0.0 14,409.80.00.00.0Federal Recovery - Bilingual Education (over 500K pop),34-18.2
0.0 27,368.70.00.00.0Federal Recovery - Bilingual Education (under 500Kpop), 10-22.38a
0.0 128,242.40.00.00.0Federal Recovery - General State Aid (GeneralStabilization)
0.0 8,865.40.00.00.0Federal Recovery - Teacher and AdministratorMentoring Program
0.0 10,039.00.00.00.0Federal Recovery - Truant Alternative and OptionalEducation Program
0.0 37,137.00.00.00.0Federal Recovery - Disabled StudentServices/Materials, 14-13.01
0.0 73,982.00.00.00.0Federal Recovery - Disabled Student TransportationReimbursement, 14-13.01 (b)
0.0 41,700.00.00.00.0Federal Recovery - Disabled Student Tuition/PrivateTuition, 14-7.02
0.0 19,636.80.00.00.0Federal Recovery - Extraordinary Special Education,14-7.02
0.0 666,951.20.00.00.0Federal Recovery - General State Aid (EducationStabilization)
0.0 1,500.00.00.00.0Federal Recovery - Regular Education Reimbursement,18-3
0.0 5,300.00.00.00.0Federal Recovery - Reimbursement for FreeBreakfast/Lunch
0.0 40,800.00.00.00.0Federal Recovery - Special Education Reimbursement,14-7.03
0.0 1,700.00.00.00.0Federal Recovery - Summer School Payments, 18-4.30.0 38,281.00.00.00.0Federal Recovery - Transportation-Regular / Vocational
Reimbursement, 29-5Total 7,070,499.0 7,554,320.97,327,489.77,395,258.26,953,789.3Grants
TOTAL GENERAL FUNDS 7,114,304.3 7,626,526.57,383,014.77,453,110.76,994,873.3
OTHER STATE FUNDS
Total 1,273.4 209.1187.5193.81,015.7Personal Services and Fringe Benefits
Designated Purposes7,015.2 7,015.24,580.27,015.23,921.5For the Ordinary and Contingent Expenses of the State
Board of Education from Indirect Costs Drawn from theFederal Government
8,484.8 8,484.8103.68,484.8376.5Projects Supported by Gifts and Donations1,008.9 1,008.9285.51,008.9275.9Teacher Certificates - Chicago, 3-12, 2-3.1051,399.0 1,600.01,600.01,600.01,197.2Teacher Certificates Processing
Total 17,907.9 18,108.96,569.218,108.95,771.1Designated Purposes
Grants20.0 20.010.020.011.3Charter Schools Loans
17,929.6 17,929.617,929.617,929.617,929.4Drivers Education0.0 1,000.00.01,000.00.0School District Emergency Financial Assisance
5,000.0 5,000.03,316.55,000.02,733.1School Technology Revolving Loans pursuant to2-3.117a
1,400.0 1,400.0450.01,400.0384.8Temporary Relocation Expenses, 2-3.771,000.0 0.00.00.00.0Emergency Financial Assistance pursuant to Section
1B-8Total 25,349.6 25,349.621,706.125,349.621,058.5Grants
TOTAL OTHER STATE FUNDS 44,530.9 43,667.628,462.843,652.327,845.3
6 - 6
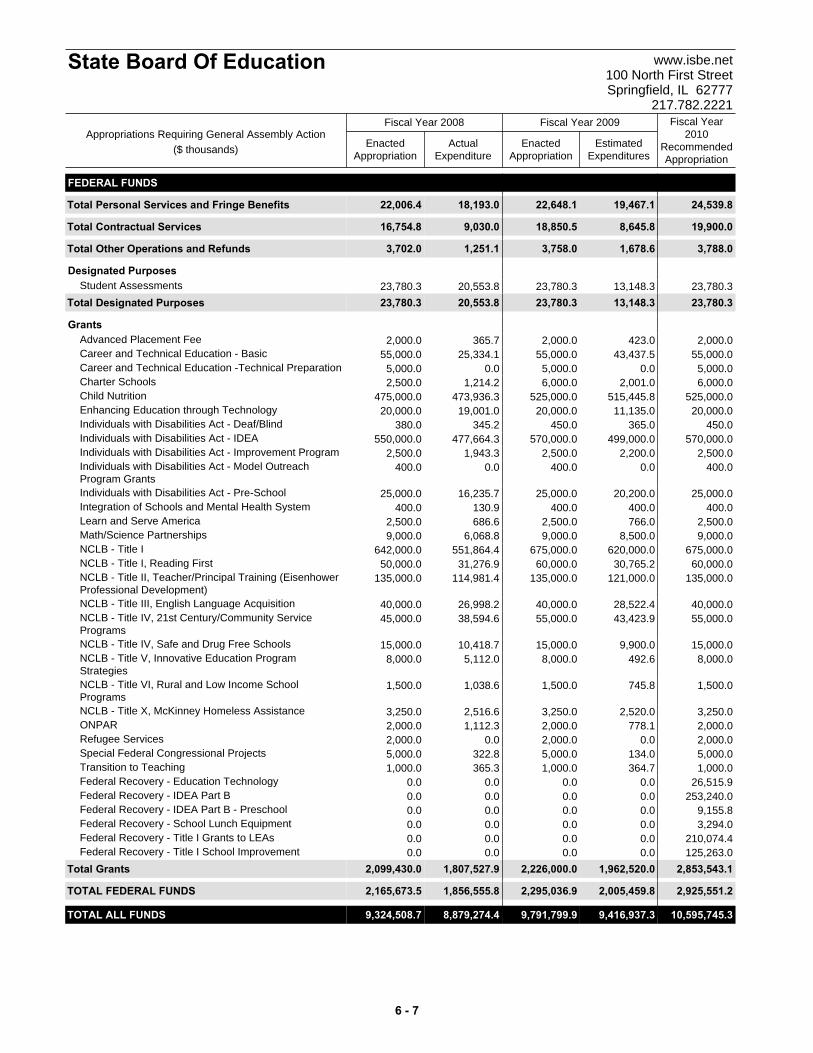
ActualExpenditure
EnactedAppropriation
EstimatedExpenditures
EnactedAppropriation
Fiscal Year2010
RecommendedAppropriation
Fiscal Year 2008 Fiscal Year 2009
State Board Of Education www.isbe.net100 North First StreetSpringfield, IL 62777
217.782.2221
Appropriations Requiring General Assembly Action($ thousands)
FEDERAL FUNDS
Total 22,006.4 24,539.819,467.122,648.118,193.0Personal Services and Fringe Benefits
Total 16,754.8 19,900.08,645.818,850.59,030.0Contractual Services
Total 3,702.0 3,788.01,678.63,758.01,251.1Other Operations and Refunds
Designated Purposes23,780.3 23,780.313,148.323,780.320,553.8Student Assessments
Total 23,780.3 23,780.313,148.323,780.320,553.8Designated Purposes
Grants2,000.0 2,000.0423.02,000.0365.7Advanced Placement Fee
55,000.0 55,000.043,437.555,000.025,334.1Career and Technical Education - Basic5,000.0 5,000.00.05,000.00.0Career and Technical Education -Technical Preparation2,500.0 6,000.02,001.06,000.01,214.2Charter Schools
475,000.0 525,000.0515,445.8525,000.0473,936.3Child Nutrition20,000.0 20,000.011,135.020,000.019,001.0Enhancing Education through Technology
380.0 450.0365.0450.0345.2Individuals with Disabilities Act - Deaf/Blind550,000.0 570,000.0499,000.0570,000.0477,664.3Individuals with Disabilities Act - IDEA
2,500.0 2,500.02,200.02,500.01,943.3Individuals with Disabilities Act - Improvement Program400.0 400.00.0400.00.0Individuals with Disabilities Act - Model Outreach
Program Grants25,000.0 25,000.020,200.025,000.016,235.7Individuals with Disabilities Act - Pre-School
400.0 400.0400.0400.0130.9Integration of Schools and Mental Health System2,500.0 2,500.0766.02,500.0686.6Learn and Serve America9,000.0 9,000.08,500.09,000.06,068.8Math/Science Partnerships
642,000.0 675,000.0620,000.0675,000.0551,864.4NCLB - Title I50,000.0 60,000.030,765.260,000.031,276.9NCLB - Title I, Reading First
135,000.0 135,000.0121,000.0135,000.0114,981.4NCLB - Title II, Teacher/Principal Training (EisenhowerProfessional Development)
40,000.0 40,000.028,522.440,000.026,998.2NCLB - Title III, English Language Acquisition45,000.0 55,000.043,423.955,000.038,594.6NCLB - Title IV, 21st Century/Community Service
Programs15,000.0 15,000.09,900.015,000.010,418.7NCLB - Title IV, Safe and Drug Free Schools
8,000.0 8,000.0492.68,000.05,112.0NCLB - Title V, Innovative Education ProgramStrategies
1,500.0 1,500.0745.81,500.01,038.6NCLB - Title VI, Rural and Low Income SchoolPrograms
3,250.0 3,250.02,520.03,250.02,516.6NCLB - Title X, McKinney Homeless Assistance2,000.0 2,000.0778.12,000.01,112.3ONPAR2,000.0 2,000.00.02,000.00.0Refugee Services5,000.0 5,000.0134.05,000.0322.8Special Federal Congressional Projects1,000.0 1,000.0364.71,000.0365.3Transition to Teaching
0.0 26,515.90.00.00.0Federal Recovery - Education Technology0.0 253,240.00.00.00.0Federal Recovery - IDEA Part B0.0 9,155.80.00.00.0Federal Recovery - IDEA Part B - Preschool0.0 3,294.00.00.00.0Federal Recovery - School Lunch Equipment0.0 210,074.40.00.00.0Federal Recovery - Title I Grants to LEAs0.0 125,263.00.00.00.0Federal Recovery - Title I School Improvement
Total 2,099,430.0 2,853,543.11,962,520.02,226,000.01,807,527.9Grants
TOTAL FEDERAL FUNDS 2,165,673.5 2,925,551.22,005,459.82,295,036.91,856,555.8
TOTAL ALL FUNDS 9,324,508.7 10,595,745.39,416,937.39,791,799.98,879,274.4
6 - 7

ActualExpenditure
EnactedAppropriation
EstimatedExpenditures
EnactedAppropriation
Fiscal Year2010
RecommendedAppropriation
Fiscal Year 2008 Fiscal Year 2009
State Board Of Education www.isbe.net100 North First StreetSpringfield, IL 62777
217.782.2221
Appropriations Requiring General Assembly Action($ thousands)
* Additional funding provided through Federal Recovery funds, shown later in the table.
BY FUND
2,401,999.4 3,111,167.42,542,942.92,604,243.42,314,699.2General Revenue Fund1,613,667.9 599,510.61,372,530.21,372,627.31,611,399.0Education Assistance Fund3,098,636.9 3,915,848.53,467,541.63,476,240.03,068,775.1Common School Fund
2,482.9 1,600.01,600.01,600.02,035.0Teacher Certificate Fee Revolving Fund18,008.2 18,018.618,010.418,010.418,000.2Drivers Education Fund
1,000.0 1,000.00.01,000.00.0School District Emergency Financial Assistance Fund15,500.0 15,500.04,683.815,500.04,298.0State Board of Education Special Purpose Trust Fund
1,008.9 1,008.9285.51,008.9275.9ISBE Teacher Certificate Institute Fund483,548.2 538,409.1522,513.9534,075.8480,443.9SBE Federal Department of Agriculture Fund
5,406.7 5,611.21,036.35,592.9943.9SBE Federal Agency Services Fund1,676,718.6 2,381,530.91,481,909.61,755,368.21,375,168.0SBE Federal Department of Education Fund
20.0 20.010.020.011.3Charter Schools Revolving Loan Fund110.9 120.1106.7113.0107.1School Infrastructure Fund
5,000.0 5,000.03,316.55,000.02,733.1School Technology Revolving Loan Fund1,400.0 1,400.0450.01,400.0384.8Temporary Relocation Expenses Revolving Grant Fund
TOTAL ALL FUNDS 9,324,508.7 10,595,745.39,416,937.39,791,799.98,879,274.4
BY DIVISION
8,740.9 13,502.96,821.112,839.15,124.2General Office
22,641.4 27,530.819,208.124,867.216,039.9Fiscal Support Services
18,749.3 18,871.418,719.018,719.018,715.3Human Resources
16,757.7 18,014.38,923.716,628.99,449.1School Support Services for All Schools
184.7 180.9168.3168.3177.5Internal Audit
7,706.3 10,449.77,526.69,687.86,822.9Special Education Services
1,305,155.3 1,374,295.31,206,721.21,378,852.51,115,618.4Teaching and Learning Services for All Children
7,943,818.2 7,373,186.58,148,849.38,330,037.17,707,327.1Grants
0.0 926,988.00.00.00.0Federal Recovery - Education Stabilization
0.0 205,182.40.00.00.0Federal Recovery - General Stabilization
0.0 627,543.10.00.00.0Federal Recovery
755.0 0.00.00.00.0Nonrecurring Programs
TOTAL ALL DIVISIONS 9,324,508.7 10,595,745.39,416,937.39,791,799.98,879,274.4
HEADCOUNT BY DIVISION Actual Estimated Authorized
38.0 31.343.0General Office
116.1 191.3123.1Fiscal Support Services
14.0 13.315.0Human Resources
95.0 89.6101.0School Support Services for All Schools
2.0 2.33.0Internal Audit
61.0 60.061.0Special Education Services
145.9 129.3150.9Teaching and Learning Services for All Children
10.0 17.910.0Grants
TOTAL HEADCOUNT 482.0 535.0507.0 t
6 - 8
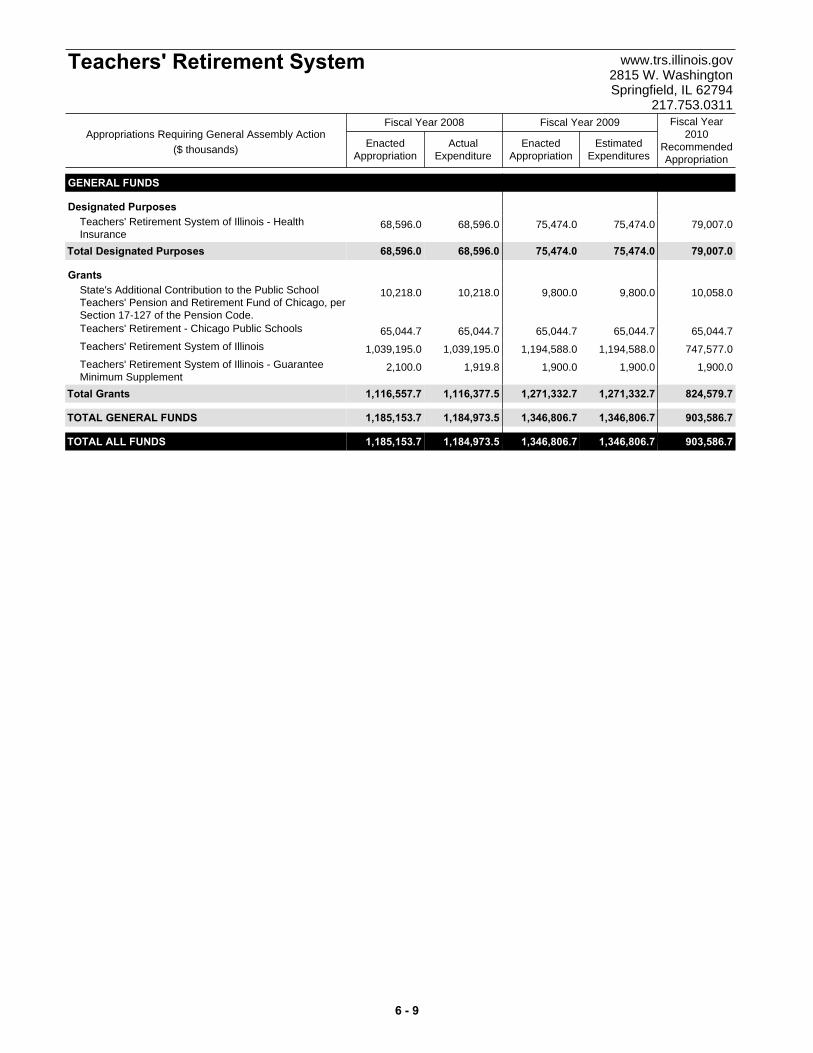
GENERAL FUNDS
Designated Purposes68,596.0 79,007.075,474.075,474.068,596.0Teachers' Retirement System of Illinois - Health
Insurance Total 68,596.0 79,007.075,474.075,474.068,596.0Designated Purposes
Grants10,218.0 10,058.09,800.09,800.010,218.0State's Additional Contribution to the Public School
Teachers' Pension and Retirement Fund of Chicago, perSection 17-127 of the Pension Code.
65,044.7 65,044.765,044.765,044.765,044.7Teachers' Retirement - Chicago Public Schools
1,039,195.0 747,577.01,194,588.01,194,588.01,039,195.0Teachers' Retirement System of Illinois
2,100.0 1,900.01,900.01,900.01,919.8Teachers' Retirement System of Illinois - GuaranteeMinimum Supplement
Total 1,116,557.7 824,579.71,271,332.71,271,332.71,116,377.5Grants
TOTAL GENERAL FUNDS 1,185,153.7 903,586.71,346,806.71,346,806.71,184,973.5
TOTAL ALL FUNDS 1,185,153.7 903,586.71,346,806.71,346,806.71,184,973.5
ActualExpenditure
EnactedAppropriation
EstimatedExpenditures
EnactedAppropriation
Fiscal Year2010
RecommendedAppropriation
Fiscal Year 2008 Fiscal Year 2009
Teachers' Retirement System www.trs.illinois.gov2815 W. WashingtonSpringfield, IL 62794
217.753.0311
Appropriations Requiring General Assembly Action($ thousands)
6 - 9

Higher Education www.ibhe.org 431 East Adams, Second Floor
Springfield, IL 62701-1418 217.782.2551
OVERVIEW Agency Mission To provide a preeminent system of higher education for the benefit of all Illinois citizens. Strategic Priorities • Increase success of students at each stage of the
P-20 educational pipeline to eliminate achievement gaps by race, ethnicity, socioeconomic status, gender and disability.
• Increase the number of adults, including GED recipients, reentering education and completing postsecondary credentials.
• Reduce geographical disparities in educational attainment.
• Ensure college affordability for students, families and taxpayers by making Illinois one of the five most affordable states in the country.
• Increase the number of people with quality postsecondary credentials to ensure the state has an educated workforce and an engaged citizenry.
• Improve transitions all along the educational pipeline: From adult education to postsecondary education, from remedial classes to credit-bearing coursework; and from associate to baccalaureate degree levels.
• Increase the number of postsecondary degrees in fields of critical skills shortages, such as nursing, allied health and information technology.
• Boost Illinois into the ranks of the five states with the fastest growing economies through cutting-edge research, technology transfer, workforce training, innovation education and a culture of entrepreneurship
Summary of Agency Operations The Illinois higher education system consists of nine public universities on 12 campuses, 48 community colleges, 97 private not-for-profit institutions, 35 proprietary institutions, and 22 out-of-state institutions approved to offer degree programs in Illinois. In addition to degree and certificate programs, many of these institutions engage in research, and most provide a variety of public services in the communities they serve. The higher education system is supported by a number of related agencies, including the Illinois Board of Higher Education (IBHE), the statewide
coordinating board for higher education in Illinois; the Illinois Community College Board (ICCB), which provides statewide coordination for the community college system; the Illinois Student Assistance Commission (ISAC), which administers student financial aid programs; and the Illinois Mathematics and Science Academy (IMSA), a discipline-focused secondary school located in Aurora and serving students from throughout Illinois. Agency Resources Employed
FY 2008 FY 2009 FY 2010Actual Enacted Recommended
General Funds 2,219,966.6 2,384,521.7 2,372,551.2
Other State Funds 410,457.9 322,263.4 248,258.0
Federal Funds 357,336.6 355,103.9 380,907.5
University Income Funds 1,113,063.8 1,293,075.0 1,351,502.7
University Held Funds 3,069,711.4 3,253,513.5 3,353,532.6Total 7,170,536.3 7,608,477.6 7,706,752.0
Appropriations ($ thousands)Fund Category
MAJOR ACCOMPLISHMENTS • Established the Public Agenda for College
and Career Success. The 95th General Assembly formed a strategic task force to study the challenges and opportunities facing higher education, including analysis of the state’s workforce needs, demographic trends, higher education funding and student financial aid. With the assistance of the National Center for Higher Education Management Systems and broad participation by all sectors of higher education, the State of Illinois has established a solid framework of the future of the higher education system. The Public Agenda was adopted by the Board of Higher Education in December 2008.
• Created the Campus Security Enhancement
Act. As a result of Public Act 95-881, Illinois colleges and universities will strengthen their emergency response strategies by developing and exercising an all-hazards emergency response plan and a campus violence prevention plan with the assistance of state and local emergency agencies.
• Supported the Monetary Award Program
(MAP). Fiscal year 2009 funding served more than 145,000 low and middle income students at colleges and universities through this needs-based aid program essential to affordability in the higher education system in Illinois.
6 - 10
Higher Education www.ibhe.org 431 East Adams, Second Floor
Springfield, IL 62701-1418 217.782.2551
• Promoted the Nurse Educator Scholarship
Program. In an effort to address the state’s nursing shortage, IBHE has provided 75 awards totaling $1.35 million in state assistance to nurse educators for tuition and fees and living expenses in exchange for being a nurse educator in Illinois for five years. Nine nurse educators have graduated from the program, and 106 additional nurse educators have started in the program since its inception.
• Achieved success for Adult and Technical
Education. Illinois Adult Education and Perkins Career & Technology Education (CTE) programs were among the highest achieving among states in fiscal year 2008 for GED attainment, placement in employment and employment retention, as well as technical skill attainment, and degree completion.
• Launched online scholarship applications.
The Illinois Student Assistance Commission’s new online resource will provide students the option to apply for scholarships online, which can ultimately reduce the timeframe in which they can receive their awards. The new Web site has electronic applications and payments for the Illinois Future Teacher Corps and the Minority Teachers of Illinois Scholarship Programs. In fiscal year 2009, these programs were expected to provide more than $7 million in awards to more than 1,100 future Illinois teachers.
KEY BUDGET INITIATIVES • Federal Recovery - Fiscal Stabilization. Nearly
$119 million in federal recovery funds will be used to ensure funding to universities and community colleges including restoring funding to fiscal year 2009 levels and providing for increases in fiscal year 2010.
• Federal Recovery - PELL. Beginning July 1,
2009, the United States Department of Education (DOE) will provide an additional $500 to each eligible PELL grant student, increasing the award from $4,850 to $5,350. For Illinois, an additional 10,000 students will receive awards totaling nearly $65 million, about half of whom are MAP grant recipients.
• Integrate a P-20 Student Information System.
This longitudinal data system will track a
student’s educational career in an effort to understand pitfalls, hurdles and the many transitions a student makes throughout their education. Such a system will incorporate student information needs agreed upon by the Illinois State Board of Education, the Illinois Community College Board and the Illinois Board of Higher Education. This will help Illinois meet one of the four assurances required by the Recovery Act for fiscal stabilization funds. The higher education system will also meet the new accountability standards required by the Recovery Act.
• Increase need based financial aid. Support for
the Monetary Award Program (MAP) is increased by nearly $21 million to help meet student costs.
• Support community college system.
Community colleges have been allotted an additional $9.6 million through the Base Operating Grants program to further address affordability by reducing the reliance on student tuition and local property taxes.
• Invest in public universities. Public universities
will receive an additional $16 million to help ensure student access to affordable higher education.
• Address high need health professions. The
Illinois Board of Higher Education has initiated a High Needs Health Occupations program which will focus on jobs indicated as a high need health profession by the Illinois Department of Employment Security.
• Ensure continuity between colleges and
universities. The Illinois Board of Higher Education initiated the u.Select Web-based information tool (formerly known as the Course Applicability System (CAS)) to be used by colleges and universities to communicate student coursework among peer institutions in an effort to better serve transfer students and track their progress towards graduation.
PROGRAMS Educational Institutions Public Universities The public university system includes nine public universities on 12 campuses located throughout
6 - 11

Higher Education www.ibhe.org 431 East Adams, Second Floor
Springfield, IL 62701-1418 217.782.2551
Illinois. These institutions are maintained using a combination of state general funds, tuition revenues and a variety of other non-appropriated fund sources. Included are Chicago State University, Eastern Illinois University, Governors State University, Illinois State University, Northeastern Illinois University, Northern Illinois University, Western Illinois University, Southern Illinois University with primary campuses in Carbondale and Edwardsville, and the University of Illinois with campuses in Chicago, Springfield and Urbana-Champaign. Community Colleges The community college system is comprised of 39 community college districts and 48 distinct colleges located throughout the state. The Illinois Community College Board, which is the statewide coordinating board for the system, also serves as the sole agency responsible for the administration of Adult Education programs in Illinois, and plays a major role in the administration of Postsecondary Career and Technical Education programs in the state. Illinois Mathematics and Science Academy (IMSA) IMSA, located in Aurora, enrolls academically talented Illinois students (grades 10-12) in its advanced, residential college preparatory program. The academy offers a full curriculum and challenging educational experiences to develop creative, ethical leaders in science, technology, engineering and mathematics. IMSA also delivers professional development programs for mathematics and science teachers and enrichment programs for elementary, middle and high school students. These are offered at IMSA, at sites throughout Illinois and online. IMSA also advances education through research, groundbreaking ventures and strategic partnerships. Student Financial Aid The Illinois Student Assistance Commission is the state's central provider of financial assistance for
students and families seeking access to higher education and/or training. ISAC administers state and federal scholarship and grant programs, serves as the state's guarantor for federal student loans and offers College Illinois!, the state's prepaid tuition program, to families in Illinois. ISAC also provides students and families with a broad array of outreach and information services to ensure access to information on student financial aid, and is recognized as a national leader in the field. Grants Program/Statewide Initiatives The Illinois Board of Higher Education administers a variety of state and federal grant programs that provide financial assistance to both public and non-public higher education institutions. In addition, the IBHE is responsible for statewide planning, policy development and coordination in higher education. The State Universities Civil Service System maintains and administers a program of personnel administration for the state universities system and related entities in higher education. Retirement The State Universities Retirement System (SURS) administers a program of retirement annuities and other benefits, including death, disability and survivor benefits for employees of the state universities, community colleges and higher education agencies. Capital Construction The higher education system in Illinois includes significant capital facilities, including 12 public university campuses, 48 community college campuses and the Illinois Mathematics and Science Academy buildings and grounds located in Aurora. Capital appropriations for the system are included in the state's capital budget, with state support supplemented by local and private fund sources.
6 - 12
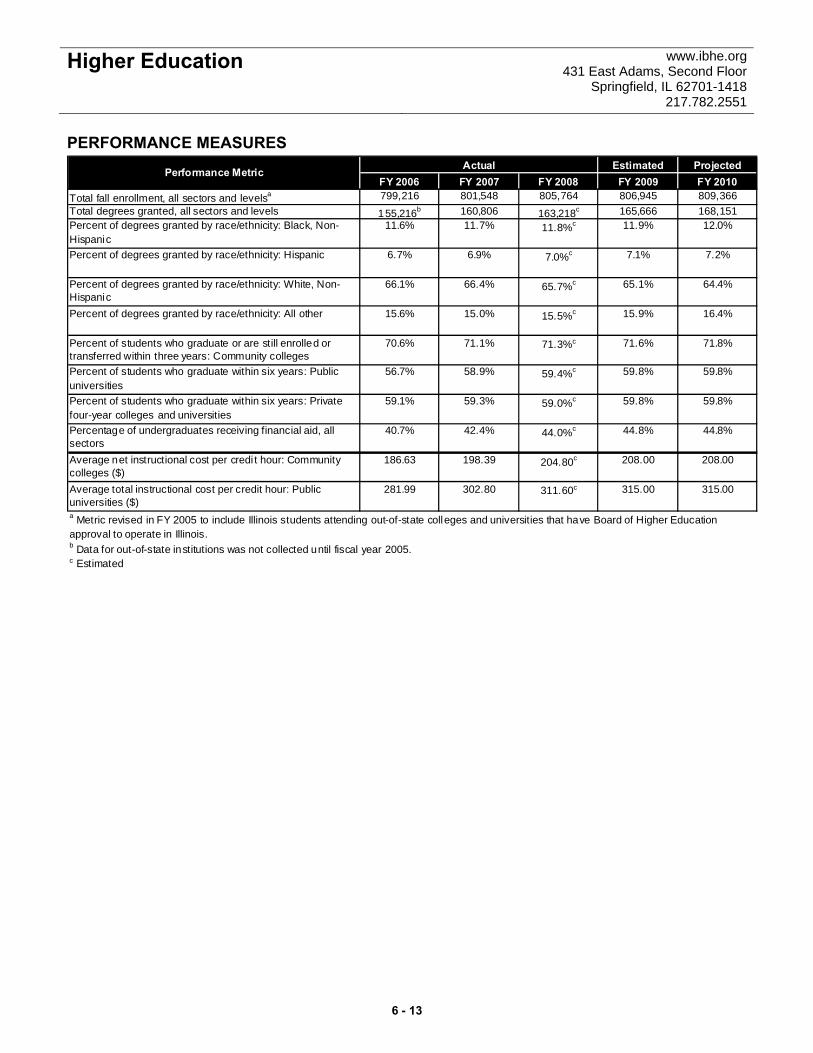
Higher Education www.ibhe.org 431 East Adams, Second Floor
Springfield, IL 62701-1418 217.782.2551
PERFORMANCE MEASURES Estimated Projected
FY 2006 FY 2007 FY 2008 FY 2009 FY 2010Total fall enrollment, all sectors and levelsa 799,216 801,548 805,764 806,945 809,366Total degrees granted, all sectors and levels 155,216b 160,806 163,218c 165,666 168,151Percent of degrees granted by race/ethnicity: Black, Non-Hispanic
11.6% 11.7% 11.8%c 11.9% 12.0%
Percent of degrees granted by race/ethnicity: Hispanic 6.7% 6.9% 7.0%c 7.1% 7.2%
Percent of degrees granted by race/ethnicity: White, Non-Hispanic
66.1% 66.4% 65.7%c 65.1% 64.4%
Percent of degrees granted by race/ethnicity: All other 15.6% 15.0% 15.5%c 15.9% 16.4%
Percent of students who graduate or are still enrolled or transferred within three years: Community colleges
70.6% 71.1% 71.3%c 71.6% 71.8%
Percent of students who graduate within six years: Public universities
56.7% 58.9% 59.4%c 59.8% 59.8%
Percent of students who graduate within six years: Private four-year colleges and universities
59.1% 59.3% 59.0%c 59.8% 59.8%
Percentage of undergraduates receiving financial aid, all sectors
40.7% 42.4% 44.0%c 44.8% 44.8%
Average net instructional cost per credi t hour: Community colleges ($)
186.63 198.39 204.80c 208.00 208.00
Average total instructional cost per credit hour: Public universities ($)
281.99 302.80 311.60c 315.00 315.00
ActualPerformance Metric
a Metric revised in FY 2005 to include Illinois students attending out-of-state colleges and universities that have Board of Higher Education approval to operate in Illinois.b Data for out-of-state institutions was not collected until fiscal year 2005.c Estimated
6 - 13

Higher Education www.ibhe.org 431 East Adams, Second Floor
Springfield, IL 62701-1418 217.782.2551
FY 2008 FY 2009 FY 2010Actual Enacted Recommended
Chicago State University 107,325 112,826 116,122General Funds 42,857 42,112 42,532Other State Funds 0 614 614University Income Funds 23,985 28,578 31,027University Held Funds 40,483 41,521 41,949
Eastern Illinois University 182,503 195,584 207,029General Funds 49,189 50,567 51,403Other State Funds 2 2 4University Income Funds 51,317 54,735 62,220University Held Funds 81,994 90,280 93,402
Governors State University 82,106 92,436 102,499General Funds 27,659 28,324 28,608Other State Funds 0 0 0University Income Funds 16,653 19,213 23,242University Held Funds 37,794 44,898 50,650
Northeastern Illinois University 40,771 127,135 132,825General Funds 40,771 43,402 43,837Other State Funds 0 0 0University Income Funds 0 37,630 42,482University Held Funds 0 46,103 46,506
Western Illinois University 206,637 218,330 225,323General Funds 58,288 59,920 60,893Other State Funds 10 10 10University Income Funds 58,538 62,000 64,000University Held Funds 89,802 96,400 100,420
Illinois State University 331,939 350,852 374,705General Funds 82,987 85,096 86,208Other State Funds 70 22 50University Income Funds 96,207 109,352 120,531University Held Funds 152,676 156,382 167,916
Northern Illinois University 407,433 421,334 423,092General Funds 105,868 107,431 109,189Other State Funds 10 36 36University Income Funds 121,235 125,939 125,939University Held Funds 180,321 187,927 187,927
Southern Illinois University 725,045 808,291 823,996General Funds 227,192 233,317 235,638Other State Funds 0 2,500 2,500University Income Funds 156,359 184,352 189,031University Held Funds 341,494 388,122 396,827
University Of Illinois 3,478,870 3,621,232 3,716,781General Funds 740,083 743,420 751,247Other State Funds 4,869 4,657 4,568University Income Funds 588,770 671,276 693,031University Held Funds 2,145,148 2,201,879 2,267,935
Total Public Universities 5,562,630 5,948,018 6,122,373General Funds 1,374,894 1,393,589 1,409,556Other State Funds 4,961 7,841 7,782University Income Funds 1,113,064 1,293,075 1,351,503University Held Funds 3,069,711 3,253,514 3,353,533
Appropriations ($ thousands)Public Universities
6 - 14
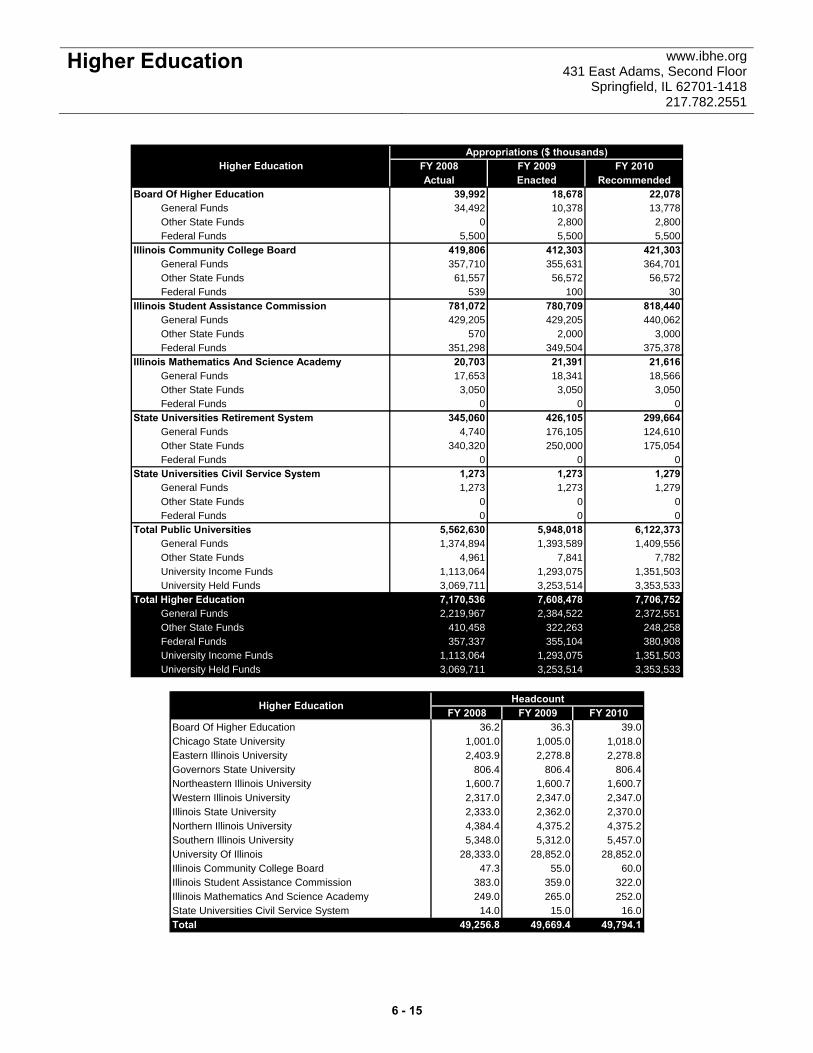
Higher Education www.ibhe.org 431 East Adams, Second Floor
Springfield, IL 62701-1418 217.782.2551
FY 2008 FY 2009 FY 2010Actual Enacted Recommended
Board Of Higher Education 39,992 18,678 22,078General Funds 34,492 10,378 13,778Other State Funds 0 2,800 2,800Federal Funds 5,500 5,500 5,500
Illinois Community College Board 419,806 412,303 421,303General Funds 357,710 355,631 364,701Other State Funds 61,557 56,572 56,572Federal Funds 539 100 30
Illinois Student Assistance Commission 781,072 780,709 818,440General Funds 429,205 429,205 440,062Other State Funds 570 2,000 3,000Federal Funds 351,298 349,504 375,378
Illinois Mathematics And Science Academy 20,703 21,391 21,616General Funds 17,653 18,341 18,566Other State Funds 3,050 3,050 3,050Federal Funds 0 0 0
State Universities Retirement System 345,060 426,105 299,664General Funds 4,740 176,105 124,610Other State Funds 340,320 250,000 175,054Federal Funds 0 0 0
State Universities Civil Service System 1,273 1,273 1,279General Funds 1,273 1,273 1,279Other State Funds 0 0 0Federal Funds 0 0 0
Total Public Universities 5,562,630 5,948,018 6,122,373General Funds 1,374,894 1,393,589 1,409,556Other State Funds 4,961 7,841 7,782University Income Funds 1,113,064 1,293,075 1,351,503University Held Funds 3,069,711 3,253,514 3,353,533
Total Higher Education 7,170,536 7,608,478 7,706,752General Funds 2,219,967 2,384,522 2,372,551Other State Funds 410,458 322,263 248,258Federal Funds 357,337 355,104 380,908University Income Funds 1,113,064 1,293,075 1,351,503University Held Funds 3,069,711 3,253,514 3,353,533
Appropriations ($ thousands)Higher Education
FY 2008 FY 2009 FY 2010Board Of Higher Education 36.2 36.3 39.0Chicago State University 1,001.0 1,005.0 1,018.0Eastern Illinois University 2,403.9 2,278.8 2,278.8Governors State University 806.4 806.4 806.4Northeastern Illinois University 1,600.7 1,600.7 1,600.7Western Illinois University 2,317.0 2,347.0 2,347.0Illinois State University 2,333.0 2,362.0 2,370.0Northern Illinois University 4,384.4 4,375.2 4,375.2Southern Illinois University 5,348.0 5,312.0 5,457.0University Of Illinois 28,333.0 28,852.0 28,852.0Illinois Community College Board 47.3 55.0 60.0Illinois Student Assistance Commission 383.0 359.0 322.0Illinois Mathematics And Science Academy 249.0 265.0 252.0State Universities Civil Service System 14.0 15.0 16.0Total 49,256.8 49,669.4 49,794.1
HeadcountHigher Education
6 - 15
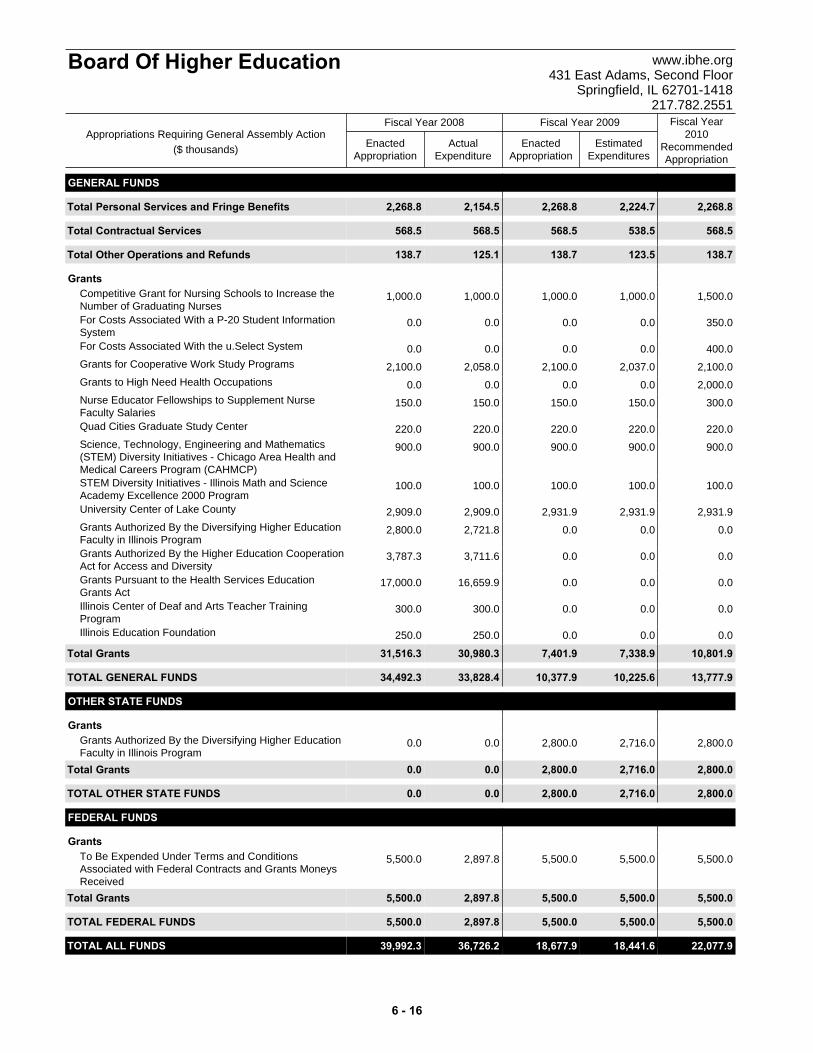
ActualExpenditure
EnactedAppropriation
EstimatedExpenditures
EnactedAppropriation
Fiscal Year2010
RecommendedAppropriation
Fiscal Year 2008 Fiscal Year 2009
Board Of Higher Education www.ibhe.org431 East Adams, Second Floor
Springfield, IL 62701-1418217.782.2551
Appropriations Requiring General Assembly Action($ thousands)
GENERAL FUNDS
Total 2,268.8 2,268.82,224.72,268.82,154.5Personal Services and Fringe Benefits
Total 568.5 568.5538.5568.5568.5Contractual Services
Total 138.7 138.7123.5138.7125.1Other Operations and Refunds
Grants1,000.0 1,500.01,000.01,000.01,000.0Competitive Grant for Nursing Schools to Increase the
Number of Graduating Nurses0.0 350.00.00.00.0For Costs Associated With a P-20 Student Information
System0.0 400.00.00.00.0For Costs Associated With the u.Select System
2,100.0 2,100.02,037.02,100.02,058.0Grants for Cooperative Work Study Programs
0.0 2,000.00.00.00.0Grants to High Need Health Occupations
150.0 300.0150.0150.0150.0Nurse Educator Fellowships to Supplement NurseFaculty Salaries
220.0 220.0220.0220.0220.0Quad Cities Graduate Study Center
900.0 900.0900.0900.0900.0Science, Technology, Engineering and Mathematics(STEM) Diversity Initiatives - Chicago Area Health andMedical Careers Program (CAHMCP)
100.0 100.0100.0100.0100.0STEM Diversity Initiatives - Illinois Math and ScienceAcademy Excellence 2000 Program
2,909.0 2,931.92,931.92,931.92,909.0University Center of Lake County
2,800.0 0.00.00.02,721.8Grants Authorized By the Diversifying Higher EducationFaculty in Illinois Program
3,787.3 0.00.00.03,711.6Grants Authorized By the Higher Education CooperationAct for Access and Diversity
17,000.0 0.00.00.016,659.9Grants Pursuant to the Health Services EducationGrants Act
300.0 0.00.00.0300.0Illinois Center of Deaf and Arts Teacher TrainingProgram
250.0 0.00.00.0250.0Illinois Education Foundation
Total 31,516.3 10,801.97,338.97,401.930,980.3Grants
TOTAL GENERAL FUNDS 34,492.3 13,777.910,225.610,377.933,828.4
OTHER STATE FUNDS
Grants0.0 2,800.02,716.02,800.00.0Grants Authorized By the Diversifying Higher Education
Faculty in Illinois ProgramTotal 0.0 2,800.02,716.02,800.00.0Grants
TOTAL OTHER STATE FUNDS 0.0 2,800.02,716.02,800.00.0
FEDERAL FUNDS
Grants5,500.0 5,500.05,500.05,500.02,897.8To Be Expended Under Terms and Conditions
Associated with Federal Contracts and Grants MoneysReceived
Total 5,500.0 5,500.05,500.05,500.02,897.8Grants
TOTAL FEDERAL FUNDS 5,500.0 5,500.05,500.05,500.02,897.8
TOTAL ALL FUNDS 39,992.3 22,077.918,441.618,677.936,726.2
6 - 16
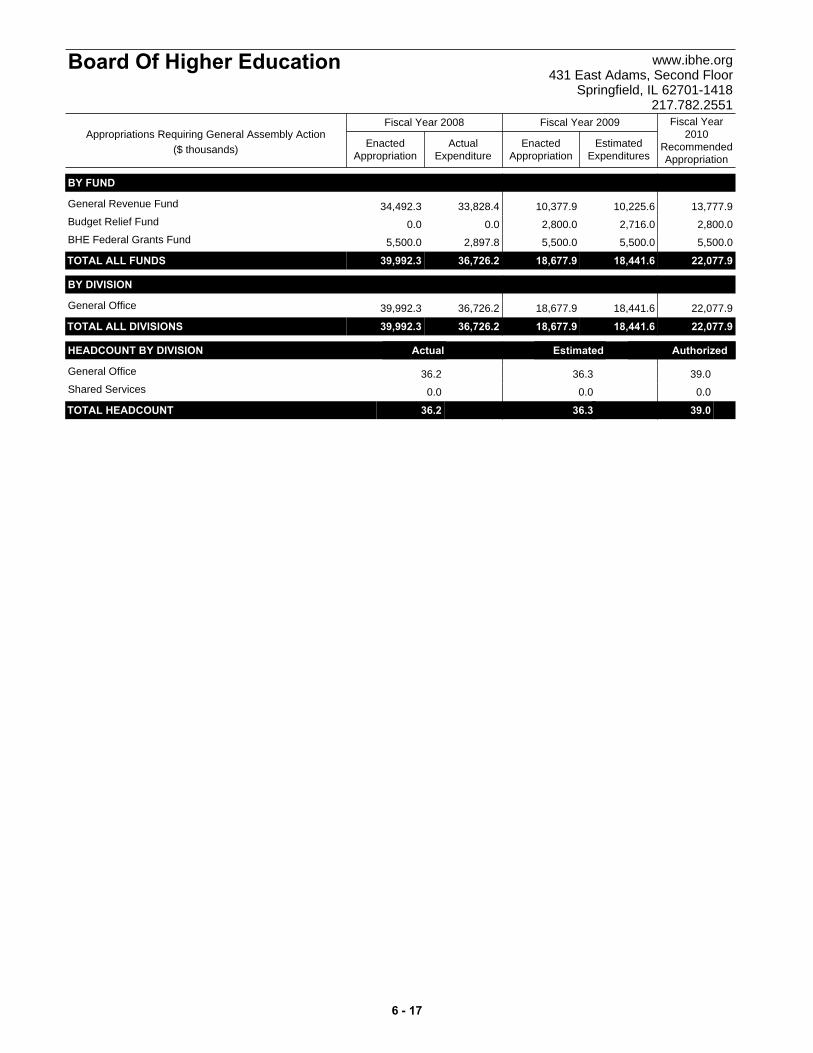
ActualExpenditure
EnactedAppropriation
EstimatedExpenditures
EnactedAppropriation
Fiscal Year2010
RecommendedAppropriation
Fiscal Year 2008 Fiscal Year 2009
Board Of Higher Education www.ibhe.org431 East Adams, Second Floor
Springfield, IL 62701-1418217.782.2551
Appropriations Requiring General Assembly Action($ thousands)
BY FUND
34,492.3 13,777.910,225.610,377.933,828.4General Revenue Fund
0.0 2,800.02,716.02,800.00.0Budget Relief Fund
5,500.0 5,500.05,500.05,500.02,897.8BHE Federal Grants Fund
TOTAL ALL FUNDS 39,992.3 22,077.918,441.618,677.936,726.2
BY DIVISION
39,992.3 22,077.918,441.618,677.936,726.2General Office
TOTAL ALL DIVISIONS 39,992.3 22,077.918,441.618,677.936,726.2
HEADCOUNT BY DIVISION Actual Estimated Authorized
36.2 39.036.3General Office
0.0 0.00.0Shared Services
TOTAL HEADCOUNT 36.2 39.036.3 t
6 - 17
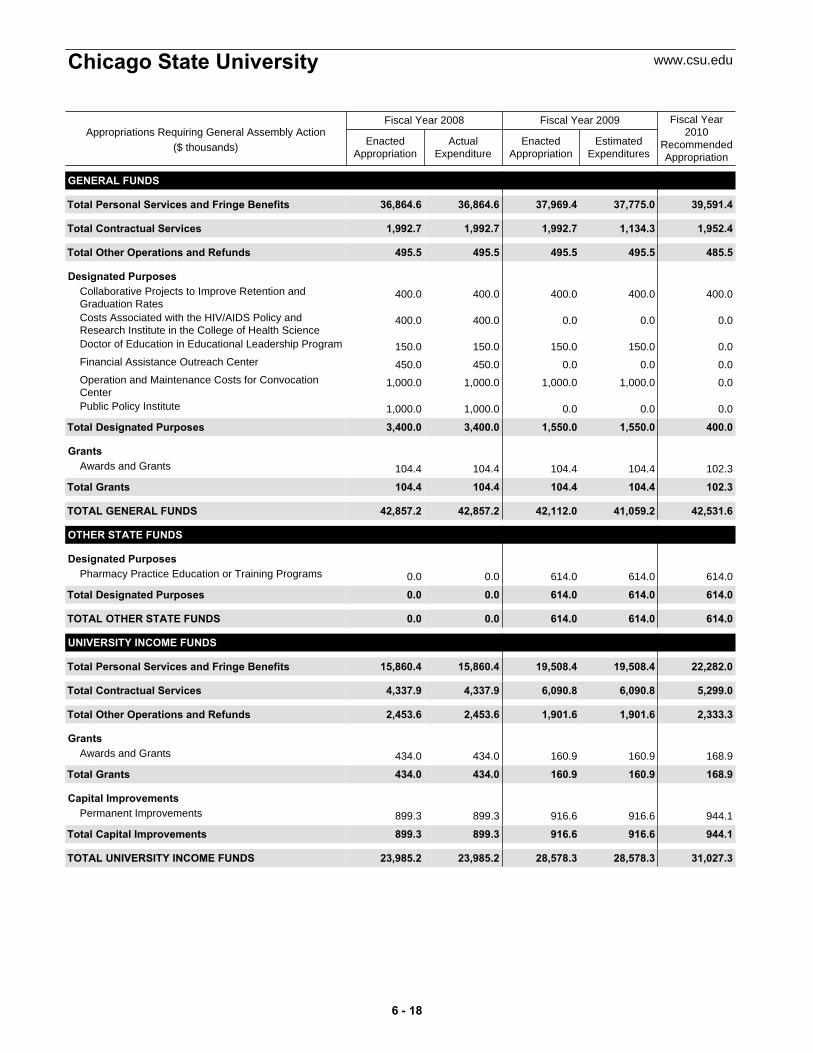
ActualExpenditure
EnactedAppropriation
EstimatedExpenditures
EnactedAppropriation
Fiscal Year2010
RecommendedAppropriation
Fiscal Year 2008 Fiscal Year 2009
Chicago State University www.csu.edu
Appropriations Requiring General Assembly Action($ thousands)
GENERAL FUNDS
Total 36,864.6 39,591.437,775.037,969.436,864.6Personal Services and Fringe Benefits
Total 1,992.7 1,952.41,134.31,992.71,992.7Contractual Services
Total 495.5 485.5495.5495.5495.5Other Operations and Refunds
Designated Purposes400.0 400.0400.0400.0400.0Collaborative Projects to Improve Retention and
Graduation Rates 400.0 0.00.00.0400.0Costs Associated with the HIV/AIDS Policy and
Research Institute in the College of Health Science150.0 0.0150.0150.0150.0Doctor of Education in Educational Leadership Program
450.0 0.00.00.0450.0Financial Assistance Outreach Center
1,000.0 0.01,000.01,000.01,000.0Operation and Maintenance Costs for ConvocationCenter
1,000.0 0.00.00.01,000.0Public Policy Institute
Total 3,400.0 400.01,550.01,550.03,400.0Designated Purposes
Grants104.4 102.3104.4104.4104.4Awards and Grants
Total 104.4 102.3104.4104.4104.4Grants
TOTAL GENERAL FUNDS 42,857.2 42,531.641,059.242,112.042,857.2
OTHER STATE FUNDS
Designated Purposes0.0 614.0614.0614.00.0Pharmacy Practice Education or Training Programs
Total 0.0 614.0614.0614.00.0Designated Purposes
TOTAL OTHER STATE FUNDS 0.0 614.0614.0614.00.0
UNIVERSITY INCOME FUNDS
Total 15,860.4 22,282.019,508.419,508.415,860.4Personal Services and Fringe Benefits
Total 4,337.9 5,299.06,090.86,090.84,337.9Contractual Services
Total 2,453.6 2,333.31,901.61,901.62,453.6Other Operations and Refunds
Grants434.0 168.9160.9160.9434.0Awards and Grants
Total 434.0 168.9160.9160.9434.0Grants
Capital Improvements899.3 944.1916.6916.6899.3Permanent Improvements
Total 899.3 944.1916.6916.6899.3Capital Improvements
TOTAL UNIVERSITY INCOME FUNDS 23,985.2 31,027.328,578.328,578.323,985.2
6 - 18
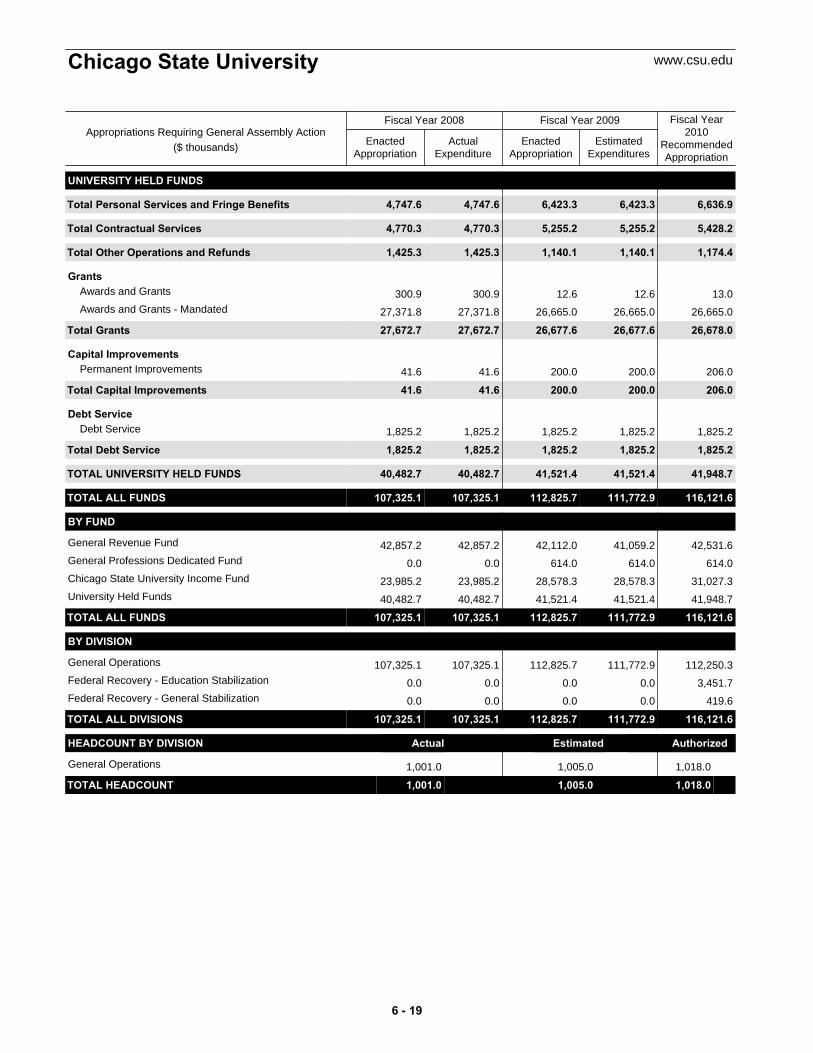
ActualExpenditure
EnactedAppropriation
EstimatedExpenditures
EnactedAppropriation
Fiscal Year2010
RecommendedAppropriation
Fiscal Year 2008 Fiscal Year 2009
Chicago State University www.csu.edu
Appropriations Requiring General Assembly Action($ thousands)
UNIVERSITY HELD FUNDS
Total 4,747.6 6,636.96,423.36,423.34,747.6Personal Services and Fringe Benefits
Total 4,770.3 5,428.25,255.25,255.24,770.3Contractual Services
Total 1,425.3 1,174.41,140.11,140.11,425.3Other Operations and Refunds
Grants300.9 13.012.612.6300.9Awards and Grants
27,371.8 26,665.026,665.026,665.027,371.8Awards and Grants - Mandated
Total 27,672.7 26,678.026,677.626,677.627,672.7Grants
Capital Improvements41.6 206.0200.0200.041.6Permanent Improvements
Total 41.6 206.0200.0200.041.6Capital Improvements
Debt Service1,825.2 1,825.21,825.21,825.21,825.2Debt Service
Total 1,825.2 1,825.21,825.21,825.21,825.2Debt Service
TOTAL UNIVERSITY HELD FUNDS 40,482.7 41,948.741,521.441,521.440,482.7
TOTAL ALL FUNDS 107,325.1 116,121.6111,772.9112,825.7107,325.1
BY FUND
42,857.2 42,531.641,059.242,112.042,857.2General Revenue Fund
0.0 614.0614.0614.00.0General Professions Dedicated Fund
23,985.2 31,027.328,578.328,578.323,985.2Chicago State University Income Fund
40,482.7 41,948.741,521.441,521.440,482.7University Held Funds
TOTAL ALL FUNDS 107,325.1 116,121.6111,772.9112,825.7107,325.1
BY DIVISION
107,325.1 112,250.3111,772.9112,825.7107,325.1General Operations
0.0 3,451.70.00.00.0Federal Recovery - Education Stabilization
0.0 419.60.00.00.0Federal Recovery - General Stabilization
TOTAL ALL DIVISIONS 107,325.1 116,121.6111,772.9112,825.7107,325.1
HEADCOUNT BY DIVISION Actual Estimated Authorized
1,001.0 1,018.01,005.0General Operations
TOTAL HEADCOUNT 1,001.0 1,018.01,005.0 t
6 - 19

ActualExpenditure
EnactedAppropriation
EstimatedExpenditures
EnactedAppropriation
Fiscal Year2010
RecommendedAppropriation
Fiscal Year 2008 Fiscal Year 2009
Eastern Illinois University www.eiu.edu
Appropriations Requiring General Assembly Action($ thousands)
GENERAL FUNDS
Total 47,089.2 49,302.847,202.348,466.547,089.2Personal Services and Fringe Benefits
Total 1,000.0 1,000.01,000.01,000.01,000.0Contractual Services
Total 1,100.0 1,100.01,100.01,100.01,100.0Other Operations and Refunds
TOTAL GENERAL FUNDS 49,189.2 51,402.849,302.350,566.549,189.2
OTHER STATE FUNDS
Grants2.0 4.32.02.02.0Scholarship Grant Awards, Pursuant to Public Act 91-83
Total 2.0 4.32.02.02.0Grants
TOTAL OTHER STATE FUNDS 2.0 4.32.02.02.0
UNIVERSITY INCOME FUNDS
Total 33,689.2 36,255.334,420.634,420.633,689.2Personal Services and Fringe Benefits
Total 8,309.8 12,239.69,576.39,576.38,309.8Contractual Services
Total 7,255.8 10,687.08,361.68,361.67,255.8Other Operations and Refunds
Grants870.1 1,281.61,002.71,002.7870.1Awards and Grants
Total 870.1 1,281.61,002.71,002.7870.1Grants
Capital Improvements1,192.3 1,756.11,374.01,374.01,192.3Permanent Improvements
Total 1,192.3 1,756.11,374.01,374.01,192.3Capital Improvements
TOTAL UNIVERSITY INCOME FUNDS 51,317.2 62,219.654,735.254,735.251,317.2
UNIVERSITY HELD FUNDS
Total 27,891.2 33,712.532,774.932,774.927,891.2Personal Services and Fringe Benefits
Total 15,626.6 17,280.516,624.516,624.515,626.6Contractual Services
Total 18,166.0 20,182.219,301.119,301.118,166.0Other Operations and Refunds
Grants11,162.9 12,216.211,860.411,860.411,162.9Awards and Grants
Total 11,162.9 12,216.211,860.411,860.411,162.9Grants
Capital Improvements9,147.6 10,010.89,719.19,719.19,147.6Permanent Improvements
Total 9,147.6 10,010.89,719.19,719.19,147.6Capital Improvements
TOTAL UNIVERSITY HELD FUNDS 81,994.3 93,402.290,280.090,280.081,994.3
TOTAL ALL FUNDS 182,502.7 207,028.8194,319.5195,583.7182,502.7
6 - 20

ActualExpenditure
EnactedAppropriation
EstimatedExpenditures
EnactedAppropriation
Fiscal Year2010
RecommendedAppropriation
Fiscal Year 2008 Fiscal Year 2009
Eastern Illinois University www.eiu.edu
Appropriations Requiring General Assembly Action($ thousands)
BY FUND
49,189.2 51,402.849,302.350,566.549,189.2General Revenue Fund
51,317.2 62,219.654,735.254,735.251,317.2Eastern Illinois University Income Fund
2.0 4.32.02.02.0State College and University Trust Fund
81,994.3 93,402.290,280.090,280.081,994.3University Held Funds
TOTAL ALL FUNDS 182,502.7 207,028.8194,319.5195,583.7182,502.7
BY DIVISION
182,502.7 203,235.5194,319.5195,583.7182,502.7General Operations
0.0 2,957.00.00.00.0Federal Recovery - Education Stabilization
0.0 836.30.00.00.0Federal Recovery - General Stabilization
TOTAL ALL DIVISIONS 182,502.7 207,028.8194,319.5195,583.7182,502.7
HEADCOUNT BY DIVISION Actual Estimated Authorized
2,403.9 2,278.82,278.8General Operations
TOTAL HEADCOUNT 2,403.9 2,278.82,278.8 t
6 - 21

ActualExpenditure
EnactedAppropriation
EstimatedExpenditures
EnactedAppropriation
Fiscal Year2010
RecommendedAppropriation
Fiscal Year 2008 Fiscal Year 2009
Governors State University www.govst.edu
Appropriations Requiring General Assembly Action($ thousands)
GENERAL FUNDS
Total 22,453.4 24,807.623,018.423,218.422,453.4Personal Services and Fringe Benefits
Total 3,050.0 3,050.02,541.93,050.03,050.0Contractual Services
Total 650.0 650.0650.0650.0650.0Other Operations and Refunds
Designated Purposes325.0 0.0325.0325.0325.0Center for Excellence in Health Professions Education
331.0 0.0331.0331.0331.0Global Trade Center
650.0 0.0650.0650.0650.0Metropolitan Institute for Leadership in Education
Total 1,306.0 0.01,306.01,306.01,306.0Designated Purposes
Grants100.0 100.0100.0100.0100.0Awards and Grants
Total 100.0 100.0100.0100.0100.0Grants
Capital Improvements100.0 0.00.00.0100.0Permanent Improvements
Total 100.0 0.00.00.0100.0Capital Improvements
TOTAL GENERAL FUNDS 27,659.4 28,607.627,616.328,324.427,659.4
UNIVERSITY INCOME FUNDS
Total 10,546.8 14,491.711,169.711,169.710,546.8Personal Services and Fringe Benefits
Total 3,050.2 6,000.05,678.55,678.53,050.2Contractual Services
Total 1,909.0 2,400.02,112.02,112.01,909.0Other Operations and Refunds
Grants173.0 250.0173.0173.0173.0Awards and Grants
Total 173.0 250.0173.0173.0173.0Grants
Capital Improvements973.5 100.080.080.0973.5Permanent Improvements
Total 973.5 100.080.080.0973.5Capital Improvements
TOTAL UNIVERSITY INCOME FUNDS 16,652.5 23,241.719,213.219,213.216,652.5
UNIVERSITY HELD FUNDS
Total 12,166.8 14,981.913,022.413,022.412,166.8Personal Services and Fringe Benefits
Total 2,610.1 5,757.94,905.14,905.12,610.1Contractual Services
Total 1,516.9 2,960.02,980.52,980.51,516.9Other Operations and Refunds
Grants21,500.0 26,950.023,990.323,990.321,500.0Awards and Grants
Total 21,500.0 26,950.023,990.323,990.321,500.0Grants
TOTAL UNIVERSITY HELD FUNDS 37,793.8 50,649.844,898.344,898.337,793.8
TOTAL ALL FUNDS 82,105.7 102,499.191,727.892,435.982,105.7
6 - 22
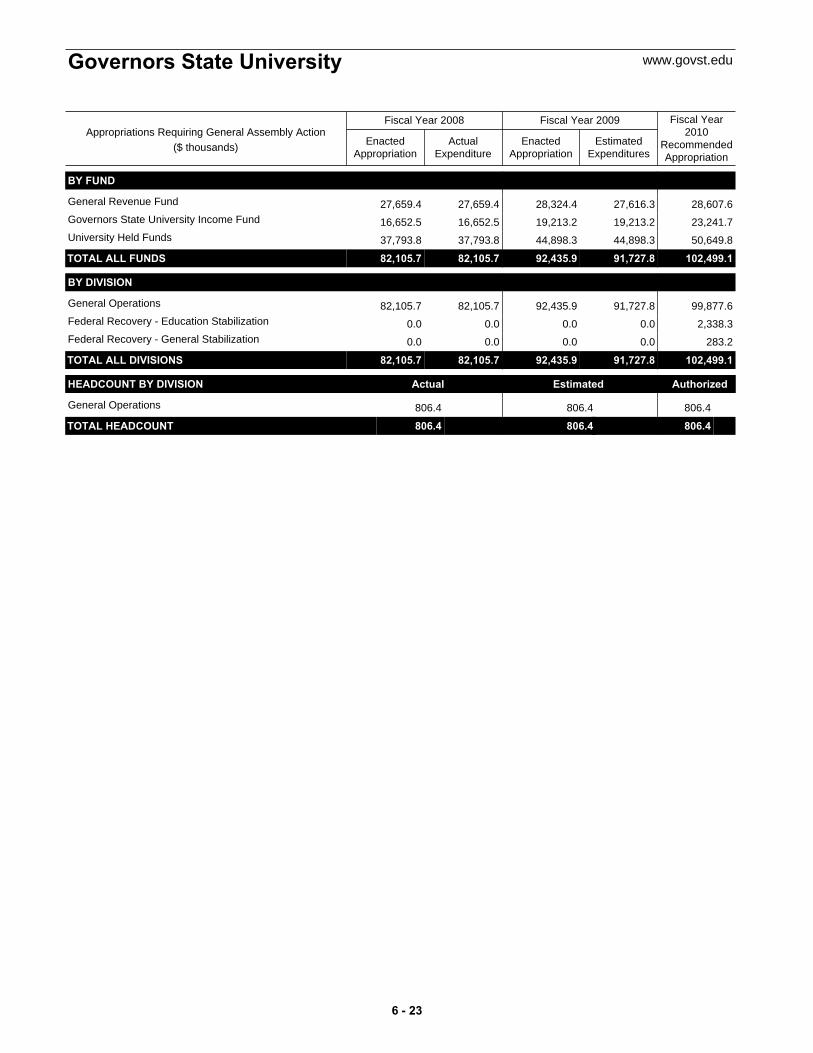
ActualExpenditure
EnactedAppropriation
EstimatedExpenditures
EnactedAppropriation
Fiscal Year2010
RecommendedAppropriation
Fiscal Year 2008 Fiscal Year 2009
Governors State University www.govst.edu
Appropriations Requiring General Assembly Action($ thousands)
BY FUND
27,659.4 28,607.627,616.328,324.427,659.4General Revenue Fund
16,652.5 23,241.719,213.219,213.216,652.5Governors State University Income Fund
37,793.8 50,649.844,898.344,898.337,793.8University Held Funds
TOTAL ALL FUNDS 82,105.7 102,499.191,727.892,435.982,105.7
BY DIVISION
82,105.7 99,877.691,727.892,435.982,105.7General Operations
0.0 2,338.30.00.00.0Federal Recovery - Education Stabilization
0.0 283.20.00.00.0Federal Recovery - General Stabilization
TOTAL ALL DIVISIONS 82,105.7 102,499.191,727.892,435.982,105.7
HEADCOUNT BY DIVISION Actual Estimated Authorized
806.4 806.4806.4General Operations
TOTAL HEADCOUNT 806.4 806.4806.4 t
6 - 23
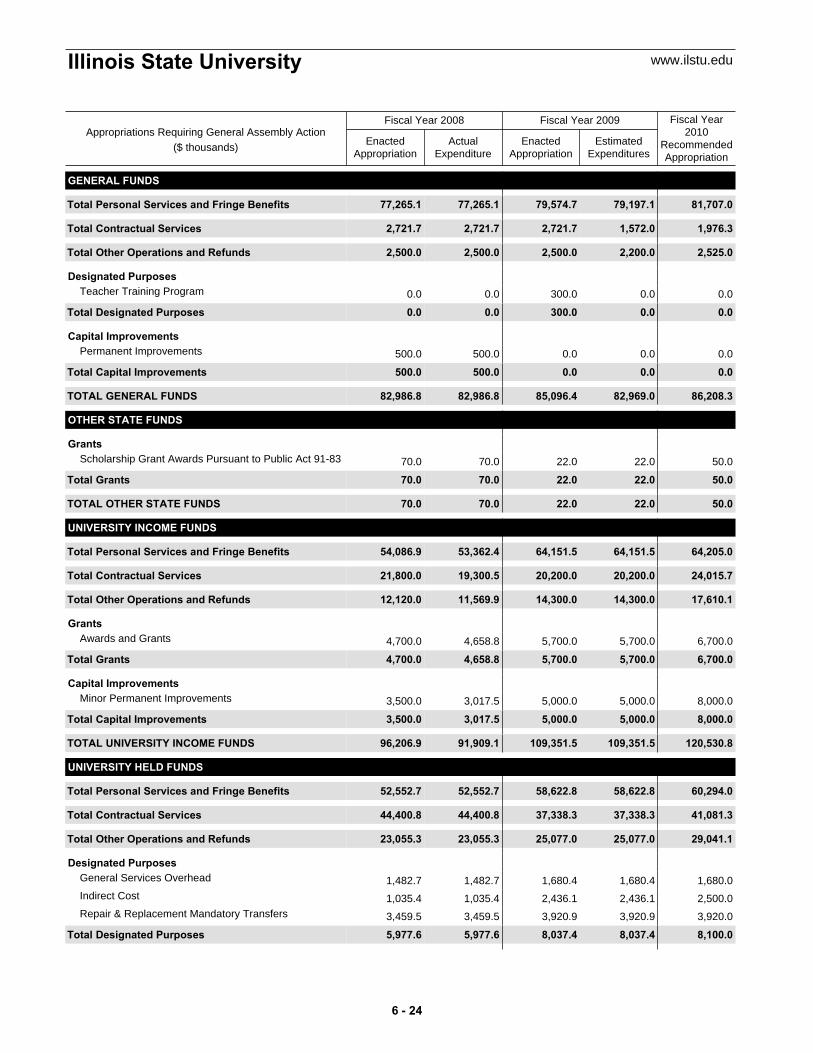
ActualExpenditure
EnactedAppropriation
EstimatedExpenditures
EnactedAppropriation
Fiscal Year2010
RecommendedAppropriation
Fiscal Year 2008 Fiscal Year 2009
Illinois State University www.ilstu.edu
Appropriations Requiring General Assembly Action($ thousands)
GENERAL FUNDS
Total 77,265.1 81,707.079,197.179,574.777,265.1Personal Services and Fringe Benefits
Total 2,721.7 1,976.31,572.02,721.72,721.7Contractual Services
Total 2,500.0 2,525.02,200.02,500.02,500.0Other Operations and Refunds
Designated Purposes0.0 0.00.0300.00.0Teacher Training Program
Total 0.0 0.00.0300.00.0Designated Purposes
Capital Improvements500.0 0.00.00.0500.0Permanent Improvements
Total 500.0 0.00.00.0500.0Capital Improvements
TOTAL GENERAL FUNDS 82,986.8 86,208.382,969.085,096.482,986.8
OTHER STATE FUNDS
Grants70.0 50.022.022.070.0Scholarship Grant Awards Pursuant to Public Act 91-83
Total 70.0 50.022.022.070.0Grants
TOTAL OTHER STATE FUNDS 70.0 50.022.022.070.0
UNIVERSITY INCOME FUNDS
Total 54,086.9 64,205.064,151.564,151.553,362.4Personal Services and Fringe Benefits
Total 21,800.0 24,015.720,200.020,200.019,300.5Contractual Services
Total 12,120.0 17,610.114,300.014,300.011,569.9Other Operations and Refunds
Grants4,700.0 6,700.05,700.05,700.04,658.8Awards and Grants
Total 4,700.0 6,700.05,700.05,700.04,658.8Grants
Capital Improvements3,500.0 8,000.05,000.05,000.03,017.5Minor Permanent Improvements
Total 3,500.0 8,000.05,000.05,000.03,017.5Capital Improvements
TOTAL UNIVERSITY INCOME FUNDS 96,206.9 120,530.8109,351.5109,351.591,909.1
UNIVERSITY HELD FUNDS
Total 52,552.7 60,294.058,622.858,622.852,552.7Personal Services and Fringe Benefits
Total 44,400.8 41,081.337,338.337,338.344,400.8Contractual Services
Total 23,055.3 29,041.125,077.025,077.023,055.3Other Operations and Refunds
Designated Purposes1,482.7 1,680.01,680.41,680.41,482.7General Services Overhead
1,035.4 2,500.02,436.12,436.11,035.4Indirect Cost
3,459.5 3,920.03,920.93,920.93,459.5Repair & Replacement Mandatory Transfers
Total 5,977.6 8,100.08,037.48,037.45,977.6Designated Purposes
6 - 24
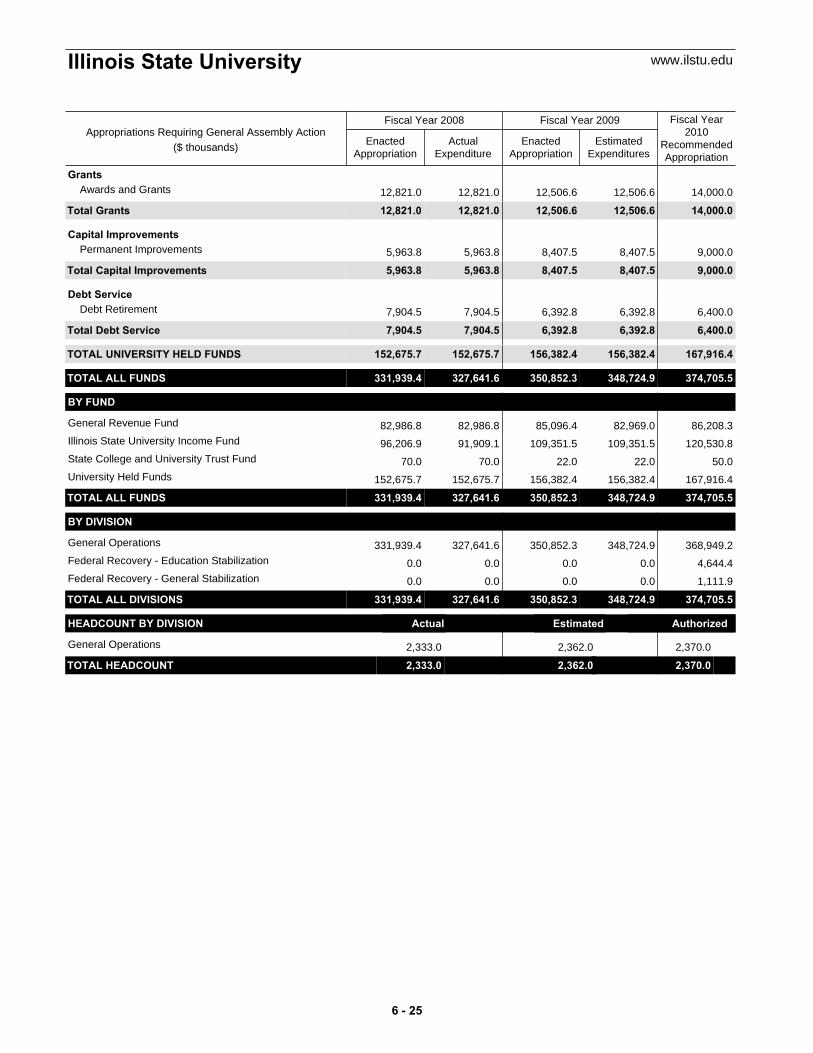
ActualExpenditure
EnactedAppropriation
EstimatedExpenditures
EnactedAppropriation
Fiscal Year2010
RecommendedAppropriation
Fiscal Year 2008 Fiscal Year 2009
Illinois State University www.ilstu.edu
Appropriations Requiring General Assembly Action($ thousands)
Grants12,821.0 14,000.012,506.612,506.612,821.0Awards and Grants
Total 12,821.0 14,000.012,506.612,506.612,821.0Grants
Capital Improvements5,963.8 9,000.08,407.58,407.55,963.8Permanent Improvements
Total 5,963.8 9,000.08,407.58,407.55,963.8Capital Improvements
Debt Service7,904.5 6,400.06,392.86,392.87,904.5Debt Retirement
Total 7,904.5 6,400.06,392.86,392.87,904.5Debt Service
TOTAL UNIVERSITY HELD FUNDS 152,675.7 167,916.4156,382.4156,382.4152,675.7
TOTAL ALL FUNDS 331,939.4 374,705.5348,724.9350,852.3327,641.6
BY FUND
82,986.8 86,208.382,969.085,096.482,986.8General Revenue Fund
96,206.9 120,530.8109,351.5109,351.591,909.1Illinois State University Income Fund
70.0 50.022.022.070.0State College and University Trust Fund
152,675.7 167,916.4156,382.4156,382.4152,675.7University Held Funds
TOTAL ALL FUNDS 331,939.4 374,705.5348,724.9350,852.3327,641.6
BY DIVISION
331,939.4 368,949.2348,724.9350,852.3327,641.6General Operations
0.0 4,644.40.00.00.0Federal Recovery - Education Stabilization
0.0 1,111.90.00.00.0Federal Recovery - General Stabilization
TOTAL ALL DIVISIONS 331,939.4 374,705.5348,724.9350,852.3327,641.6
HEADCOUNT BY DIVISION Actual Estimated Authorized
2,333.0 2,370.02,362.0General Operations
TOTAL HEADCOUNT 2,333.0 2,370.02,362.0 t
6 - 25
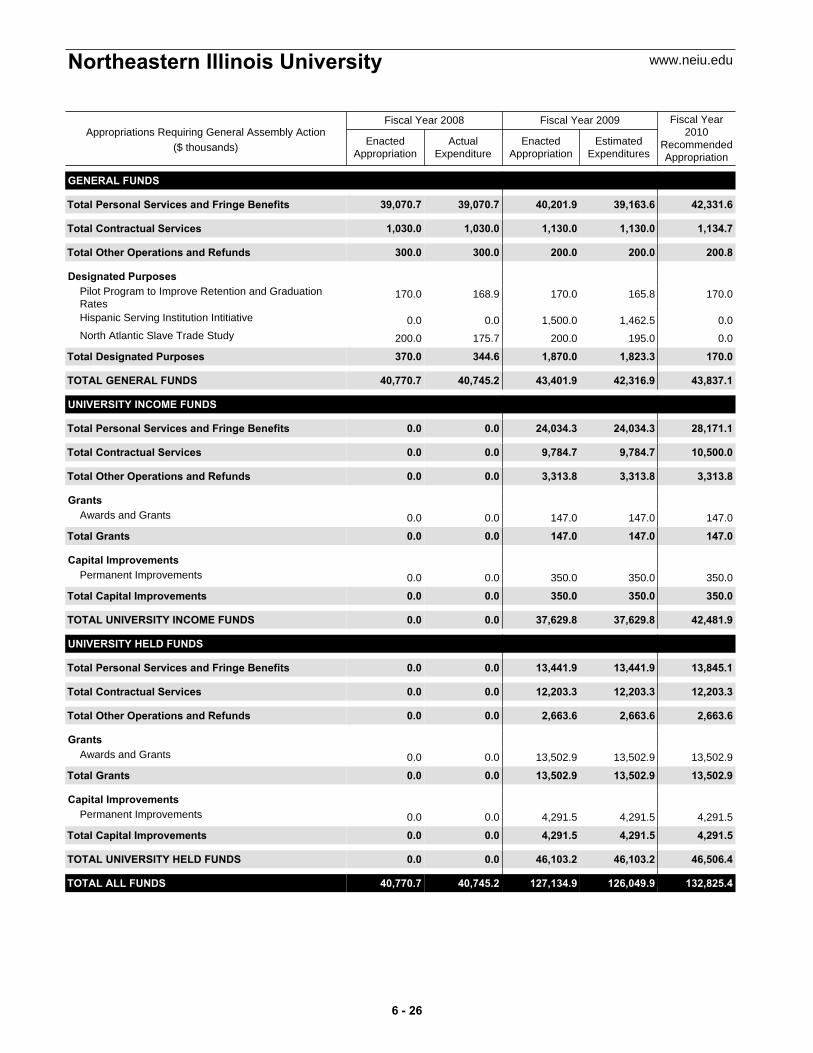
ActualExpenditure
EnactedAppropriation
EstimatedExpenditures
EnactedAppropriation
Fiscal Year2010
RecommendedAppropriation
Fiscal Year 2008 Fiscal Year 2009
Northeastern Illinois University www.neiu.edu
Appropriations Requiring General Assembly Action($ thousands)
GENERAL FUNDS
Total 39,070.7 42,331.639,163.640,201.939,070.7Personal Services and Fringe Benefits
Total 1,030.0 1,134.71,130.01,130.01,030.0Contractual Services
Total 300.0 200.8200.0200.0300.0Other Operations and Refunds
Designated Purposes170.0 170.0165.8170.0168.9Pilot Program to Improve Retention and Graduation
Rates 0.0 0.01,462.51,500.00.0Hispanic Serving Institution Intitiative
200.0 0.0195.0200.0175.7North Atlantic Slave Trade Study
Total 370.0 170.01,823.31,870.0344.6Designated Purposes
TOTAL GENERAL FUNDS 40,770.7 43,837.142,316.943,401.940,745.2
UNIVERSITY INCOME FUNDS
Total 0.0 28,171.124,034.324,034.30.0Personal Services and Fringe Benefits
Total 0.0 10,500.09,784.79,784.70.0Contractual Services
Total 0.0 3,313.83,313.83,313.80.0Other Operations and Refunds
Grants0.0 147.0147.0147.00.0Awards and Grants
Total 0.0 147.0147.0147.00.0Grants
Capital Improvements0.0 350.0350.0350.00.0Permanent Improvements
Total 0.0 350.0350.0350.00.0Capital Improvements
TOTAL UNIVERSITY INCOME FUNDS 0.0 42,481.937,629.837,629.80.0
UNIVERSITY HELD FUNDS
Total 0.0 13,845.113,441.913,441.90.0Personal Services and Fringe Benefits
Total 0.0 12,203.312,203.312,203.30.0Contractual Services
Total 0.0 2,663.62,663.62,663.60.0Other Operations and Refunds
Grants0.0 13,502.913,502.913,502.90.0Awards and Grants
Total 0.0 13,502.913,502.913,502.90.0Grants
Capital Improvements0.0 4,291.54,291.54,291.50.0Permanent Improvements
Total 0.0 4,291.54,291.54,291.50.0Capital Improvements
TOTAL UNIVERSITY HELD FUNDS 0.0 46,506.446,103.246,103.20.0
TOTAL ALL FUNDS 40,770.7 132,825.4126,049.9127,134.940,745.2
6 - 26
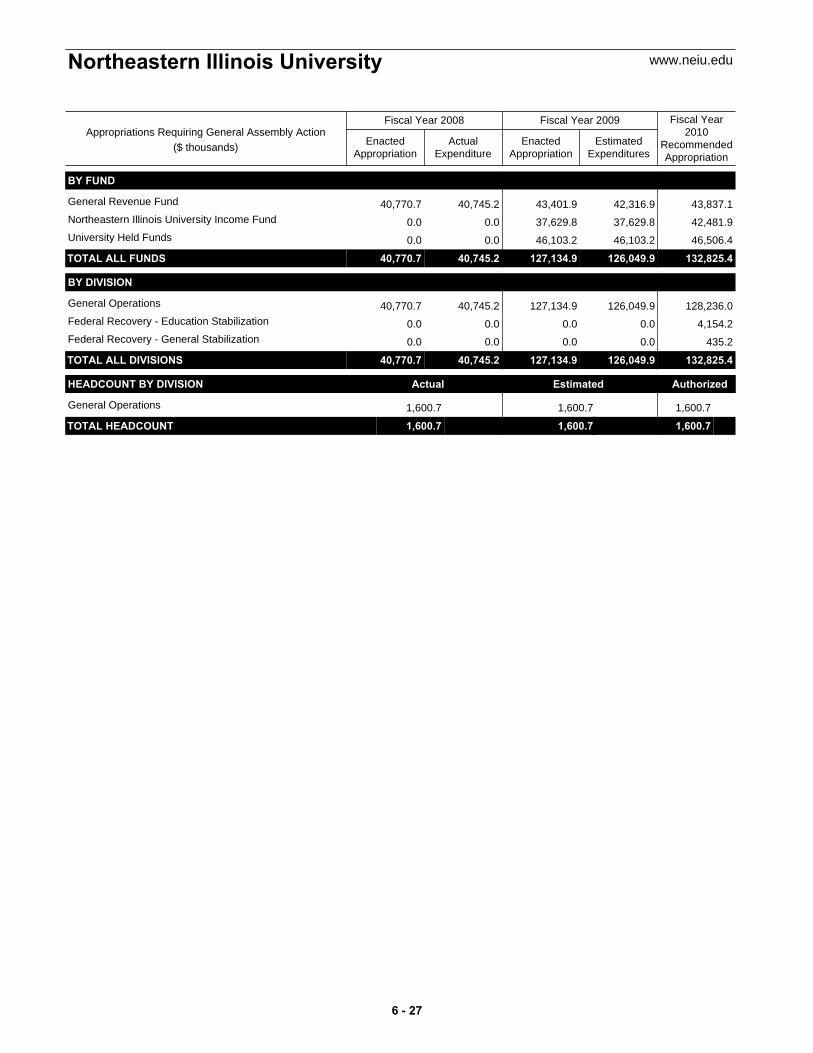
ActualExpenditure
EnactedAppropriation
EstimatedExpenditures
EnactedAppropriation
Fiscal Year2010
RecommendedAppropriation
Fiscal Year 2008 Fiscal Year 2009
Northeastern Illinois University www.neiu.edu
Appropriations Requiring General Assembly Action($ thousands)
BY FUND
40,770.7 43,837.142,316.943,401.940,745.2General Revenue Fund
0.0 42,481.937,629.837,629.80.0Northeastern Illinois University Income Fund
0.0 46,506.446,103.246,103.20.0University Held Funds
TOTAL ALL FUNDS 40,770.7 132,825.4126,049.9127,134.940,745.2
BY DIVISION
40,770.7 128,236.0126,049.9127,134.940,745.2General Operations
0.0 4,154.20.00.00.0Federal Recovery - Education Stabilization
0.0 435.20.00.00.0Federal Recovery - General Stabilization
TOTAL ALL DIVISIONS 40,770.7 132,825.4126,049.9127,134.940,745.2
HEADCOUNT BY DIVISION Actual Estimated Authorized
1,600.7 1,600.71,600.7General Operations
TOTAL HEADCOUNT 1,600.7 1,600.71,600.7 t
6 - 27
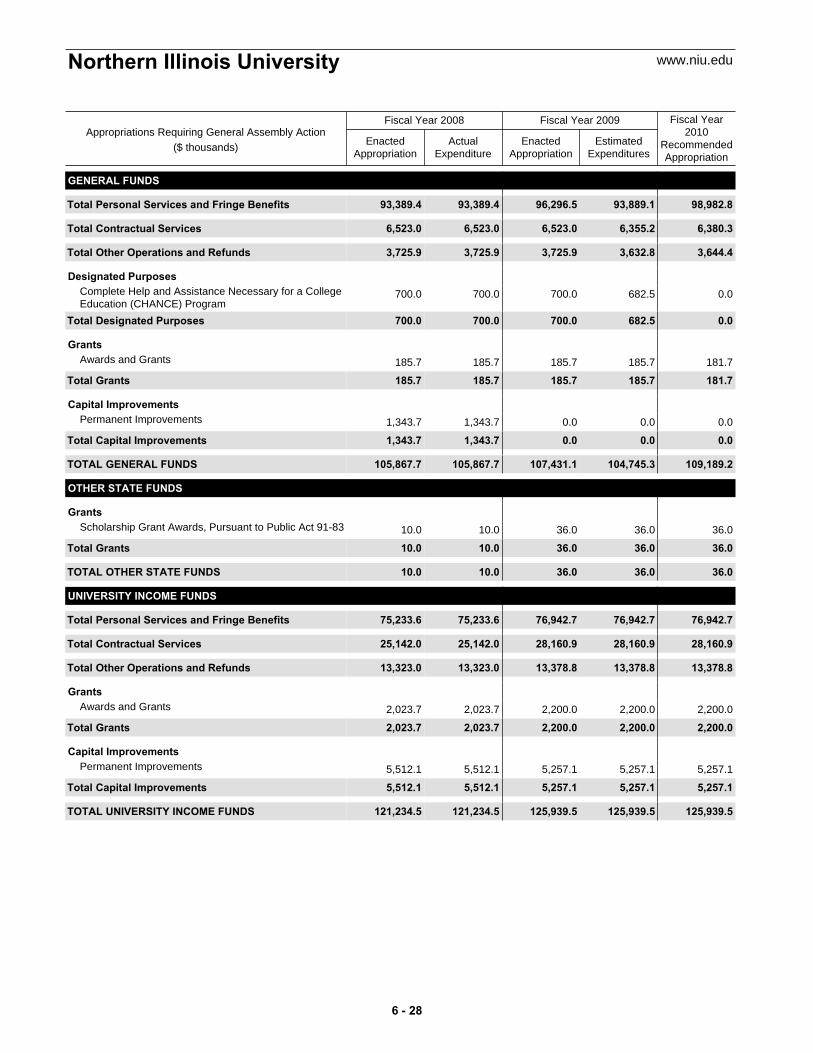
ActualExpenditure
EnactedAppropriation
EstimatedExpenditures
EnactedAppropriation
Fiscal Year2010
RecommendedAppropriation
Fiscal Year 2008 Fiscal Year 2009
Northern Illinois University www.niu.edu
Appropriations Requiring General Assembly Action($ thousands)
GENERAL FUNDS
Total 93,389.4 98,982.893,889.196,296.593,389.4Personal Services and Fringe Benefits
Total 6,523.0 6,380.36,355.26,523.06,523.0Contractual Services
Total 3,725.9 3,644.43,632.83,725.93,725.9Other Operations and Refunds
Designated Purposes700.0 0.0682.5700.0700.0Complete Help and Assistance Necessary for a College
Education (CHANCE) ProgramTotal 700.0 0.0682.5700.0700.0Designated Purposes
Grants185.7 181.7185.7185.7185.7Awards and Grants
Total 185.7 181.7185.7185.7185.7Grants
Capital Improvements1,343.7 0.00.00.01,343.7Permanent Improvements
Total 1,343.7 0.00.00.01,343.7Capital Improvements
TOTAL GENERAL FUNDS 105,867.7 109,189.2104,745.3107,431.1105,867.7
OTHER STATE FUNDS
Grants10.0 36.036.036.010.0Scholarship Grant Awards, Pursuant to Public Act 91-83
Total 10.0 36.036.036.010.0Grants
TOTAL OTHER STATE FUNDS 10.0 36.036.036.010.0
UNIVERSITY INCOME FUNDS
Total 75,233.6 76,942.776,942.776,942.775,233.6Personal Services and Fringe Benefits
Total 25,142.0 28,160.928,160.928,160.925,142.0Contractual Services
Total 13,323.0 13,378.813,378.813,378.813,323.0Other Operations and Refunds
Grants2,023.7 2,200.02,200.02,200.02,023.7Awards and Grants
Total 2,023.7 2,200.02,200.02,200.02,023.7Grants
Capital Improvements5,512.1 5,257.15,257.15,257.15,512.1Permanent Improvements
Total 5,512.1 5,257.15,257.15,257.15,512.1Capital Improvements
TOTAL UNIVERSITY INCOME FUNDS 121,234.5 125,939.5125,939.5125,939.5121,234.5
6 - 28

ActualExpenditure
EnactedAppropriation
EstimatedExpenditures
EnactedAppropriation
Fiscal Year2010
RecommendedAppropriation
Fiscal Year 2008 Fiscal Year 2009
Northern Illinois University www.niu.edu
Appropriations Requiring General Assembly Action($ thousands)
UNIVERSITY HELD FUNDS
Total 62,763.2 63,705.463,705.463,705.462,763.2Personal Services and Fringe Benefits
Total 65,029.7 69,705.769,705.769,705.765,029.7Contractual Services
Total 26,298.0 27,427.727,427.727,427.726,298.0Other Operations and Refunds
Grants21,591.5 22,151.222,151.222,151.221,591.5Awards and Grants
Total 21,591.5 22,151.222,151.222,151.221,591.5Grants
Capital Improvements4,638.8 4,937.44,937.44,937.44,638.8Permanent Improvements
Total 4,638.8 4,937.44,937.44,937.44,638.8Capital Improvements
TOTAL UNIVERSITY HELD FUNDS 180,321.2 187,927.4187,927.4187,927.4180,321.2
TOTAL ALL FUNDS 407,433.4 423,092.1418,648.2421,334.0407,433.4
BY FUND
105,867.7 109,189.2104,745.3107,431.1105,867.7General Revenue Fund
121,234.5 125,939.5125,939.5125,939.5121,234.5Northern Illinois University Income Fund
10.0 36.036.036.010.0State College and University Trust Fund
180,321.2 187,927.4187,927.4187,927.4180,321.2University Held Funds
TOTAL ALL FUNDS 407,433.4 423,092.1418,648.2421,334.0407,433.4
BY DIVISION
407,433.4 416,877.8418,648.2421,334.0407,433.4General Operations
0.0 4,456.20.00.00.0Federal Recovery - Education Stabilization
0.0 1,758.10.00.00.0Federal Recovery - General Stabilization
TOTAL ALL DIVISIONS 407,433.4 423,092.1418,648.2421,334.0407,433.4
HEADCOUNT BY DIVISION Actual Estimated Authorized
4,384.4 4,375.24,375.2General Operations
TOTAL HEADCOUNT 4,384.4 4,375.24,375.2 t
6 - 29

ActualExpenditure
EnactedAppropriation
EstimatedExpenditures
EnactedAppropriation
Fiscal Year2010
RecommendedAppropriation
Fiscal Year 2008 Fiscal Year 2009
Southern Illinois University www.siu.edu
Appropriations Requiring General Assembly Action($ thousands)
GENERAL FUNDS
Total 205,209.3 216,691.0209,231.2211,490.2205,209.3Personal Services and Fringe Benefits
Total 12,345.0 12,625.710,577.912,345.012,345.0Contractual Services
Total 6,406.3 6,321.74,985.06,406.36,406.3Other Operations and Refunds
Designated Purposes1,200.0 0.01,170.01,200.01,200.0Operation and Maintenance Costs for School of
Medicine Cancer Lab200.0 0.0200.0200.0200.0Special Services TRIO Program
250.0 0.0250.0250.0242.4Vince Demuzio Governmental Internship Program
Total 1,650.0 0.01,620.01,650.01,642.4Designated Purposes
Grants355.5 0.00.0355.5355.5Awards and Grants
1,070.0 0.01,070.01,070.01,069.4Presidential Scholarship Fund
Total 1,425.5 0.01,070.01,425.51,424.9Grants
Capital Improvements156.2 0.00.00.0156.2Southern Illinois University Carbondale Touch of Nature
Environmental Center Total 156.2 0.00.00.0156.2Capital Improvements
TOTAL GENERAL FUNDS 227,192.3 235,638.4227,484.1233,317.0227,184.1
OTHER STATE FUNDS
Designated Purposes0.0 2,500.02,500.02,500.00.0Pharmacy Practice Education or Training Programs at
SIUETotal 0.0 2,500.02,500.02,500.00.0Designated Purposes
TOTAL OTHER STATE FUNDS 0.0 2,500.02,500.02,500.00.0
UNIVERSITY INCOME FUNDS
Total 89,423.8 109,740.9107,767.0107,767.089,423.8Personal Services and Fringe Benefits
Total 29,642.5 45,122.543,978.843,978.829,642.5Contractual Services
Total 20,225.6 22,983.122,397.922,397.920,225.6Other Operations and Refunds
Grants8,636.6 9,617.88,685.48,685.48,636.6Awards and Grants
Total 8,636.6 9,617.88,685.48,685.48,636.6Grants
Capital Improvements8,430.8 1,567.11,522.91,522.98,430.8Permanent Improvements
Total 8,430.8 1,567.11,522.91,522.98,430.8Capital Improvements
TOTAL UNIVERSITY INCOME FUNDS 156,359.3 189,031.4184,352.0184,352.0156,359.3
6 - 30
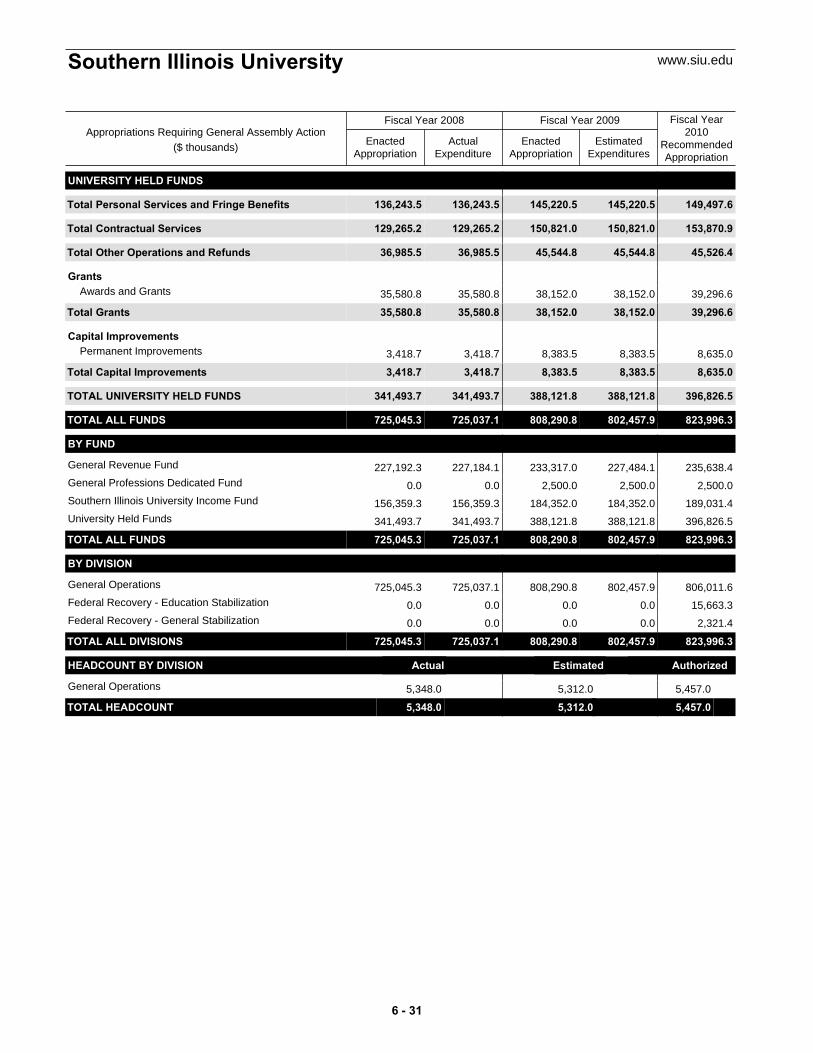
ActualExpenditure
EnactedAppropriation
EstimatedExpenditures
EnactedAppropriation
Fiscal Year2010
RecommendedAppropriation
Fiscal Year 2008 Fiscal Year 2009
Southern Illinois University www.siu.edu
Appropriations Requiring General Assembly Action($ thousands)
UNIVERSITY HELD FUNDS
Total 136,243.5 149,497.6145,220.5145,220.5136,243.5Personal Services and Fringe Benefits
Total 129,265.2 153,870.9150,821.0150,821.0129,265.2Contractual Services
Total 36,985.5 45,526.445,544.845,544.836,985.5Other Operations and Refunds
Grants35,580.8 39,296.638,152.038,152.035,580.8Awards and Grants
Total 35,580.8 39,296.638,152.038,152.035,580.8Grants
Capital Improvements3,418.7 8,635.08,383.58,383.53,418.7Permanent Improvements
Total 3,418.7 8,635.08,383.58,383.53,418.7Capital Improvements
TOTAL UNIVERSITY HELD FUNDS 341,493.7 396,826.5388,121.8388,121.8341,493.7
TOTAL ALL FUNDS 725,045.3 823,996.3802,457.9808,290.8725,037.1
BY FUND
227,192.3 235,638.4227,484.1233,317.0227,184.1General Revenue Fund
0.0 2,500.02,500.02,500.00.0General Professions Dedicated Fund
156,359.3 189,031.4184,352.0184,352.0156,359.3Southern Illinois University Income Fund
341,493.7 396,826.5388,121.8388,121.8341,493.7University Held Funds
TOTAL ALL FUNDS 725,045.3 823,996.3802,457.9808,290.8725,037.1
BY DIVISION
725,045.3 806,011.6802,457.9808,290.8725,037.1General Operations
0.0 15,663.30.00.00.0Federal Recovery - Education Stabilization
0.0 2,321.40.00.00.0Federal Recovery - General Stabilization
TOTAL ALL DIVISIONS 725,045.3 823,996.3802,457.9808,290.8725,037.1
HEADCOUNT BY DIVISION Actual Estimated Authorized
5,348.0 5,457.05,312.0General Operations
TOTAL HEADCOUNT 5,348.0 5,457.05,312.0 t
6 - 31
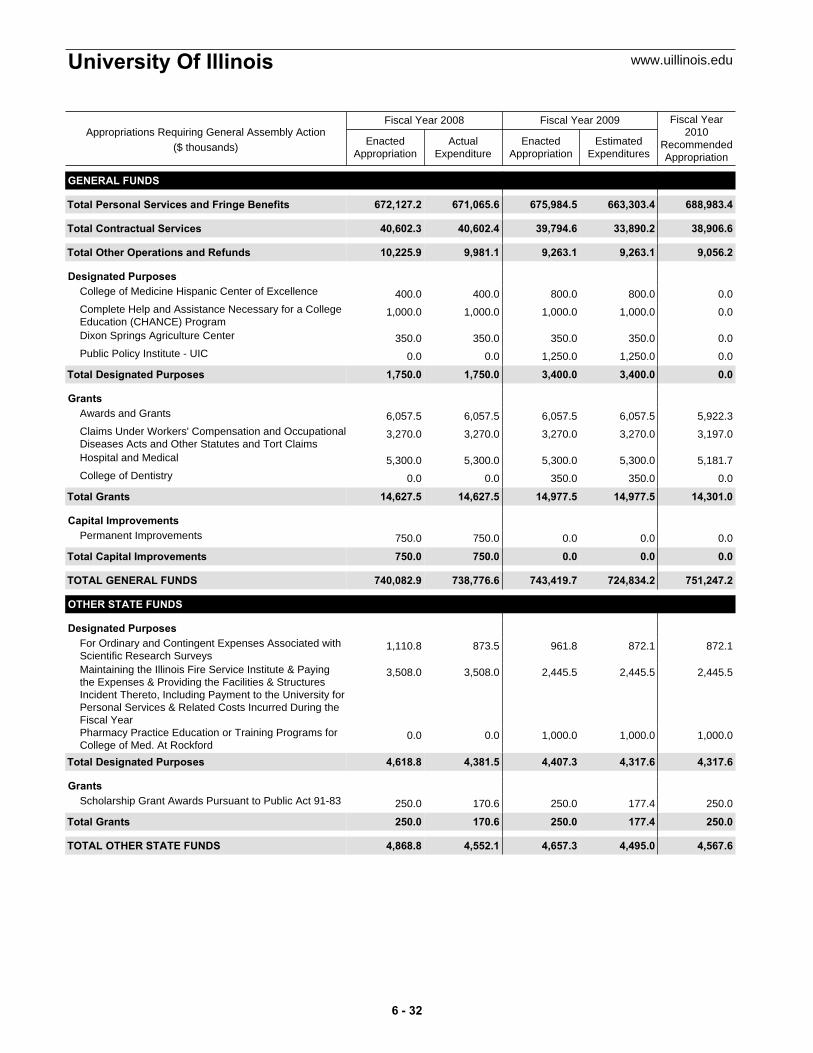
ActualExpenditure
EnactedAppropriation
EstimatedExpenditures
EnactedAppropriation
Fiscal Year2010
RecommendedAppropriation
Fiscal Year 2008 Fiscal Year 2009
University Of Illinois www.uillinois.edu
Appropriations Requiring General Assembly Action($ thousands)
GENERAL FUNDS
Total 672,127.2 688,983.4663,303.4675,984.5671,065.6Personal Services and Fringe Benefits
Total 40,602.3 38,906.633,890.239,794.640,602.4Contractual Services
Total 10,225.9 9,056.29,263.19,263.19,981.1Other Operations and Refunds
Designated Purposes400.0 0.0800.0800.0400.0College of Medicine Hispanic Center of Excellence
1,000.0 0.01,000.01,000.01,000.0Complete Help and Assistance Necessary for a CollegeEducation (CHANCE) Program
350.0 0.0350.0350.0350.0Dixon Springs Agriculture Center
0.0 0.01,250.01,250.00.0Public Policy Institute - UIC
Total 1,750.0 0.03,400.03,400.01,750.0Designated Purposes
Grants6,057.5 5,922.36,057.56,057.56,057.5Awards and Grants
3,270.0 3,197.03,270.03,270.03,270.0Claims Under Workers' Compensation and OccupationalDiseases Acts and Other Statutes and Tort Claims
5,300.0 5,181.75,300.05,300.05,300.0Hospital and Medical
0.0 0.0350.0350.00.0College of Dentistry
Total 14,627.5 14,301.014,977.514,977.514,627.5Grants
Capital Improvements750.0 0.00.00.0750.0Permanent Improvements
Total 750.0 0.00.00.0750.0Capital Improvements
TOTAL GENERAL FUNDS 740,082.9 751,247.2724,834.2743,419.7738,776.6
OTHER STATE FUNDS
Designated Purposes1,110.8 872.1872.1961.8873.5For Ordinary and Contingent Expenses Associated with
Scientific Research Surveys3,508.0 2,445.52,445.52,445.53,508.0Maintaining the Illinois Fire Service Institute & Paying
the Expenses & Providing the Facilities & StructuresIncident Thereto, Including Payment to the University forPersonal Services & Related Costs Incurred During theFiscal Year
0.0 1,000.01,000.01,000.00.0Pharmacy Practice Education or Training Programs forCollege of Med. At Rockford
Total 4,618.8 4,317.64,317.64,407.34,381.5Designated Purposes
Grants250.0 250.0177.4250.0170.6Scholarship Grant Awards Pursuant to Public Act 91-83
Total 250.0 250.0177.4250.0170.6Grants
TOTAL OTHER STATE FUNDS 4,868.8 4,567.64,495.04,657.34,552.1
6 - 32
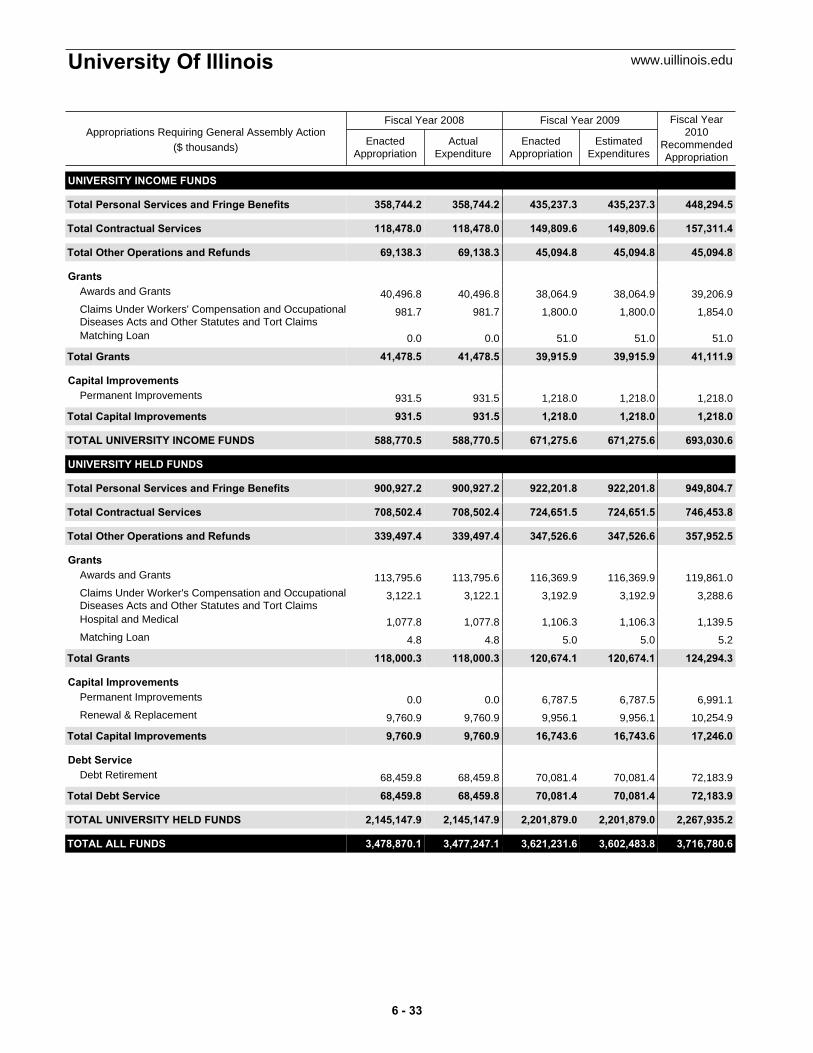
ActualExpenditure
EnactedAppropriation
EstimatedExpenditures
EnactedAppropriation
Fiscal Year2010
RecommendedAppropriation
Fiscal Year 2008 Fiscal Year 2009
University Of Illinois www.uillinois.edu
Appropriations Requiring General Assembly Action($ thousands)
UNIVERSITY INCOME FUNDS
Total 358,744.2 448,294.5435,237.3435,237.3358,744.2Personal Services and Fringe Benefits
Total 118,478.0 157,311.4149,809.6149,809.6118,478.0Contractual Services
Total 69,138.3 45,094.845,094.845,094.869,138.3Other Operations and Refunds
Grants40,496.8 39,206.938,064.938,064.940,496.8Awards and Grants
981.7 1,854.01,800.01,800.0981.7Claims Under Workers' Compensation and OccupationalDiseases Acts and Other Statutes and Tort Claims
0.0 51.051.051.00.0Matching Loan
Total 41,478.5 41,111.939,915.939,915.941,478.5Grants
Capital Improvements931.5 1,218.01,218.01,218.0931.5Permanent Improvements
Total 931.5 1,218.01,218.01,218.0931.5Capital Improvements
TOTAL UNIVERSITY INCOME FUNDS 588,770.5 693,030.6671,275.6671,275.6588,770.5
UNIVERSITY HELD FUNDS
Total 900,927.2 949,804.7922,201.8922,201.8900,927.2Personal Services and Fringe Benefits
Total 708,502.4 746,453.8724,651.5724,651.5708,502.4Contractual Services
Total 339,497.4 357,952.5347,526.6347,526.6339,497.4Other Operations and Refunds
Grants113,795.6 119,861.0116,369.9116,369.9113,795.6Awards and Grants
3,122.1 3,288.63,192.93,192.93,122.1Claims Under Worker's Compensation and OccupationalDiseases Acts and Other Statutes and Tort Claims
1,077.8 1,139.51,106.31,106.31,077.8Hospital and Medical
4.8 5.25.05.04.8Matching Loan
Total 118,000.3 124,294.3120,674.1120,674.1118,000.3Grants
Capital Improvements0.0 6,991.16,787.56,787.50.0Permanent Improvements
9,760.9 10,254.99,956.19,956.19,760.9Renewal & Replacement
Total 9,760.9 17,246.016,743.616,743.69,760.9Capital Improvements
Debt Service68,459.8 72,183.970,081.470,081.468,459.8Debt Retirement
Total 68,459.8 72,183.970,081.470,081.468,459.8Debt Service
TOTAL UNIVERSITY HELD FUNDS 2,145,147.9 2,267,935.22,201,879.02,201,879.02,145,147.9
TOTAL ALL FUNDS 3,478,870.1 3,716,780.63,602,483.83,621,231.63,477,247.1
6 - 33
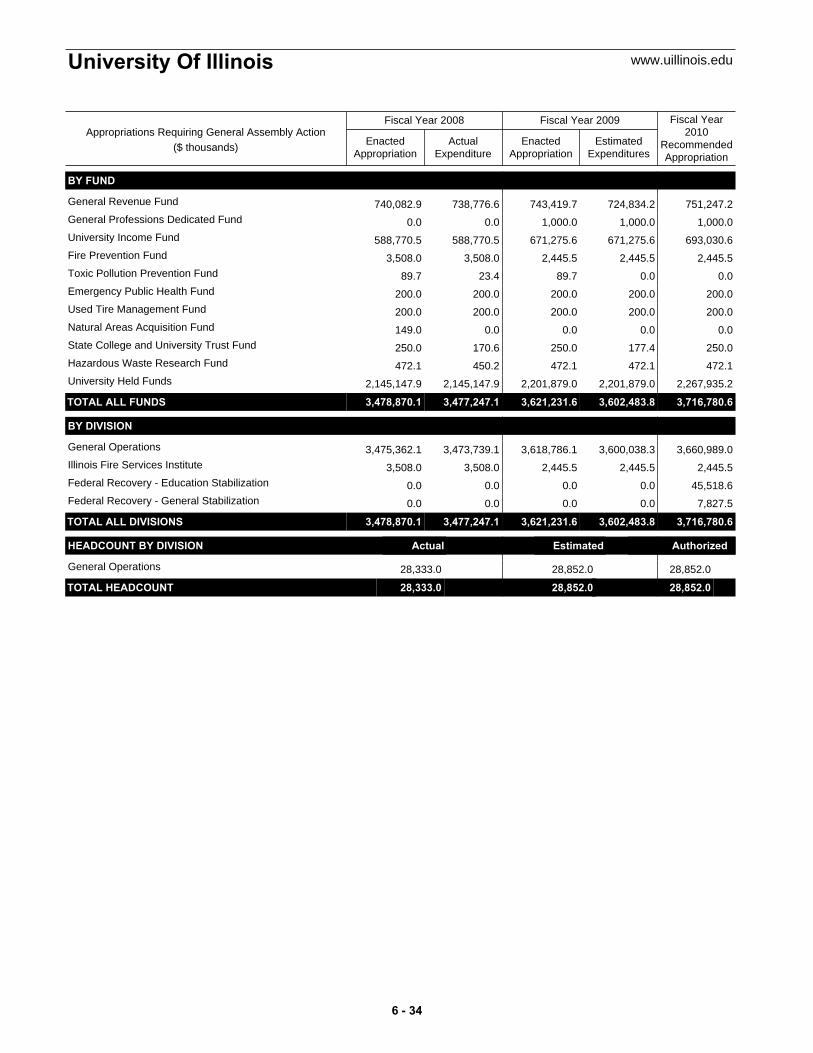
ActualExpenditure
EnactedAppropriation
EstimatedExpenditures
EnactedAppropriation
Fiscal Year2010
RecommendedAppropriation
Fiscal Year 2008 Fiscal Year 2009
University Of Illinois www.uillinois.edu
Appropriations Requiring General Assembly Action($ thousands)
BY FUND
740,082.9 751,247.2724,834.2743,419.7738,776.6General Revenue Fund
0.0 1,000.01,000.01,000.00.0General Professions Dedicated Fund
588,770.5 693,030.6671,275.6671,275.6588,770.5University Income Fund
3,508.0 2,445.52,445.52,445.53,508.0Fire Prevention Fund
89.7 0.00.089.723.4Toxic Pollution Prevention Fund
200.0 200.0200.0200.0200.0Emergency Public Health Fund
200.0 200.0200.0200.0200.0Used Tire Management Fund
149.0 0.00.00.00.0Natural Areas Acquisition Fund
250.0 250.0177.4250.0170.6State College and University Trust Fund
472.1 472.1472.1472.1450.2Hazardous Waste Research Fund
2,145,147.9 2,267,935.22,201,879.02,201,879.02,145,147.9University Held Funds
TOTAL ALL FUNDS 3,478,870.1 3,716,780.63,602,483.83,621,231.63,477,247.1
BY DIVISION
3,475,362.1 3,660,989.03,600,038.33,618,786.13,473,739.1General Operations
3,508.0 2,445.52,445.52,445.53,508.0Illinois Fire Services Institute
0.0 45,518.60.00.00.0Federal Recovery - Education Stabilization
0.0 7,827.50.00.00.0Federal Recovery - General Stabilization
TOTAL ALL DIVISIONS 3,478,870.1 3,716,780.63,602,483.83,621,231.63,477,247.1
HEADCOUNT BY DIVISION Actual Estimated Authorized
28,333.0 28,852.028,852.0General Operations
TOTAL HEADCOUNT 28,333.0 28,852.028,852.0 t
6 - 34
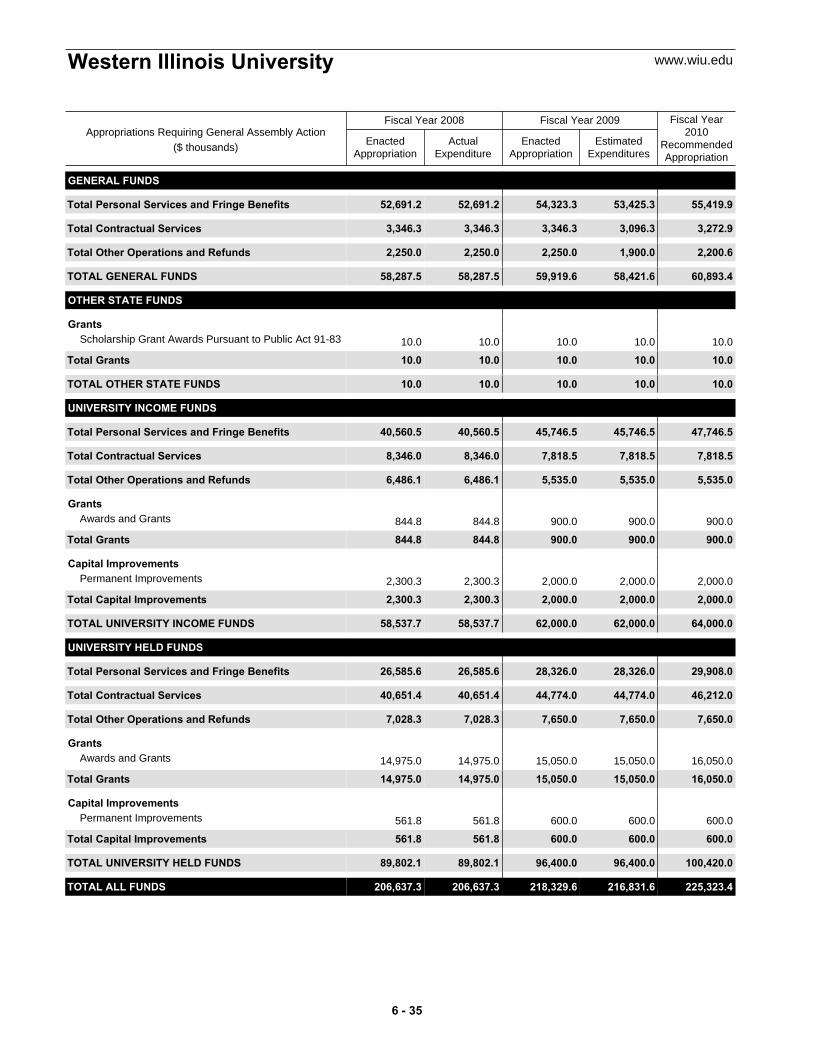
ActualExpenditure
EnactedAppropriation
EstimatedExpenditures
EnactedAppropriation
Fiscal Year2010
RecommendedAppropriation
Fiscal Year 2008 Fiscal Year 2009
Western Illinois University www.wiu.edu
Appropriations Requiring General Assembly Action($ thousands)
GENERAL FUNDS
Total 52,691.2 55,419.953,425.354,323.352,691.2Personal Services and Fringe Benefits
Total 3,346.3 3,272.93,096.33,346.33,346.3Contractual Services
Total 2,250.0 2,200.61,900.02,250.02,250.0Other Operations and Refunds
TOTAL GENERAL FUNDS 58,287.5 60,893.458,421.659,919.658,287.5
OTHER STATE FUNDS
Grants10.0 10.010.010.010.0Scholarship Grant Awards Pursuant to Public Act 91-83
Total 10.0 10.010.010.010.0Grants
TOTAL OTHER STATE FUNDS 10.0 10.010.010.010.0
UNIVERSITY INCOME FUNDS
Total 40,560.5 47,746.545,746.545,746.540,560.5Personal Services and Fringe Benefits
Total 8,346.0 7,818.57,818.57,818.58,346.0Contractual Services
Total 6,486.1 5,535.05,535.05,535.06,486.1Other Operations and Refunds
Grants844.8 900.0900.0900.0844.8Awards and Grants
Total 844.8 900.0900.0900.0844.8Grants
Capital Improvements2,300.3 2,000.02,000.02,000.02,300.3Permanent Improvements
Total 2,300.3 2,000.02,000.02,000.02,300.3Capital Improvements
TOTAL UNIVERSITY INCOME FUNDS 58,537.7 64,000.062,000.062,000.058,537.7
UNIVERSITY HELD FUNDS
Total 26,585.6 29,908.028,326.028,326.026,585.6Personal Services and Fringe Benefits
Total 40,651.4 46,212.044,774.044,774.040,651.4Contractual Services
Total 7,028.3 7,650.07,650.07,650.07,028.3Other Operations and Refunds
Grants14,975.0 16,050.015,050.015,050.014,975.0Awards and Grants
Total 14,975.0 16,050.015,050.015,050.014,975.0Grants
Capital Improvements561.8 600.0600.0600.0561.8Permanent Improvements
Total 561.8 600.0600.0600.0561.8Capital Improvements
TOTAL UNIVERSITY HELD FUNDS 89,802.1 100,420.096,400.096,400.089,802.1
TOTAL ALL FUNDS 206,637.3 225,323.4216,831.6218,329.6206,637.3
6 - 35
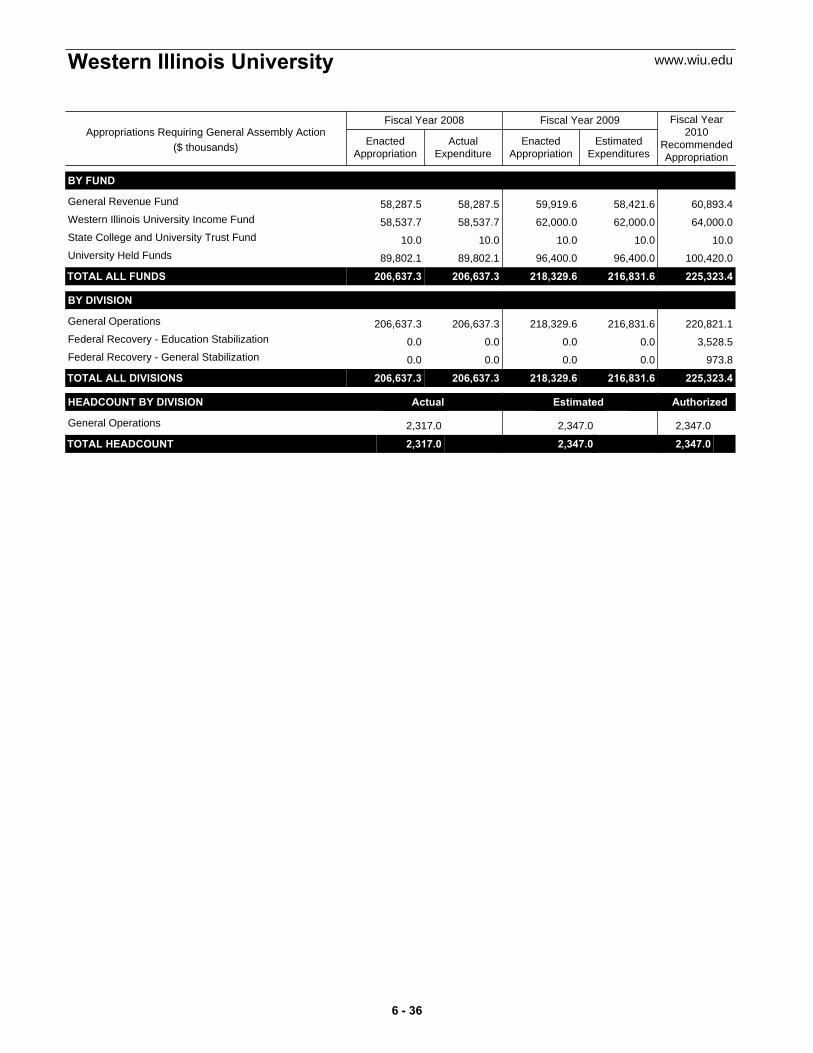
ActualExpenditure
EnactedAppropriation
EstimatedExpenditures
EnactedAppropriation
Fiscal Year2010
RecommendedAppropriation
Fiscal Year 2008 Fiscal Year 2009
Western Illinois University www.wiu.edu
Appropriations Requiring General Assembly Action($ thousands)
BY FUND
58,287.5 60,893.458,421.659,919.658,287.5General Revenue Fund
58,537.7 64,000.062,000.062,000.058,537.7Western Illinois University Income Fund
10.0 10.010.010.010.0State College and University Trust Fund
89,802.1 100,420.096,400.096,400.089,802.1University Held Funds
TOTAL ALL FUNDS 206,637.3 225,323.4216,831.6218,329.6206,637.3
BY DIVISION
206,637.3 220,821.1216,831.6218,329.6206,637.3General Operations
0.0 3,528.50.00.00.0Federal Recovery - Education Stabilization
0.0 973.80.00.00.0Federal Recovery - General Stabilization
TOTAL ALL DIVISIONS 206,637.3 225,323.4216,831.6218,329.6206,637.3
HEADCOUNT BY DIVISION Actual Estimated Authorized
2,317.0 2,347.02,347.0General Operations
TOTAL HEADCOUNT 2,317.0 2,347.02,347.0 t
6 - 36

ActualExpenditure
EnactedAppropriation
EstimatedExpenditures
EnactedAppropriation
Fiscal Year2010
RecommendedAppropriation
Fiscal Year 2008 Fiscal Year 2009
Illinois Community CollegeBoard
www.iccb.state.il.us401 East Capitol Avenue
Springfield, IL 62701217-785-0123
Appropriations Requiring General Assembly Action($ thousands)
GENERAL FUNDS
Total 1,248.0 1,240.51,286.31,285.51,242.6Personal Services and Fringe Benefits
Total 345.3 342.2339.2325.2313.3Contractual Services
Total 549.6 561.7511.1533.7146.1Other Operations and Refunds
Designated Purposes750.0 750.0750.0750.0741.2College and Career Readiness Program
807.6 1,163.8807.6807.6802.1For Costs Associated with GED Testing
1.5 0.00.00.00.0East St. Louis Educational Center Operations
Total 1,559.1 1,913.81,557.61,557.61,543.3Designated Purposes
Grants16,026.2 16,026.215,625.516,026.216,005.3Adult Education - Grants to Eligible Providers
10,701.6 10,701.610,434.110,701.610,682.7Adult Education - Performanced Based Grants
8,080.5 8,080.58,080.58,080.58,079.3Adult Education - Public Assistance
12,149.9 12,271.412,149.912,149.911,702.7Career and Technical Education Grants to Colleges(State Match)
15,000.0 15,000.014,625.015,000.015,000.0City Colleges of Chicago - Educational-RelatedExpenses
626.6 626.6626.6626.6626.6City Colleges of Chicago - Retirees Health InsuranceGrant
197,818.0 195,745.1192,872.6197,818.0197,758.0Community Colleges - Base Operating Grants
77,383.7 73,024.575,449.177,383.777,383.7Community Colleges - Equalization Grants
840.0 840.0780.0840.0840.0Community Colleges - Small College Grants
3,311.3 3,311.33,311.33,311.33,311.3Community Colleges - Workforce Development Grants
0.0 2,589.60.00.00.0Federal Recovery - Education Stabilization - CommunityColleges - Equalization Grants
0.0 6,941.50.00.00.0Federal Recovery - Education Stablization - CommunityColleges - Base Operating Grants
0.0 1,769.70.00.00.0Federal Recovery - General Stabilization - CommunityColleges - Equalization Grants
0.0 4,743.60.00.00.0Federal Recovery - General Stablization - CommunityColleges - Base Operating Grants
1,589.1 1,589.11,589.11,589.11,589.1Operate Educational Facility in East St. Louis
120.1 120.1120.1120.1103.5Scholarships to Qualifying Graduates of the Lincoln'sChallenge Program
7,261.5 7,261.57,261.57,261.55,486.2Veterans' Grants Reimbursements
300.0 0.00.00.00.0Grant to the Black United Fund of Illinois to ProvideAssistance to Minority Students in Completing TheirBaccalaureate Degrees
20.0 0.020.020.00.0Grants to Community Colleges
0.0 0.01,000.01,000.00.0Moraine Valley - Healthcare Professional Program
2,779.0 0.00.00.02,775.9P-16 Initiative Grants
Total 354,007.5 360,642.3343,945.3351,928.5351,344.2Grants
TOTAL GENERAL FUNDS 357,709.5 364,700.5347,639.4355,630.5354,589.4
6 - 37

ActualExpenditure
EnactedAppropriation
EstimatedExpenditures
EnactedAppropriation
Fiscal Year2010
RecommendedAppropriation
Fiscal Year 2008 Fiscal Year 2009
Illinois Community CollegeBoard
www.iccb.state.il.us401 East Capitol Avenue
Springfield, IL 62701217-785-0123
Appropriations Requiring General Assembly Action($ thousands)
OTHER STATE FUNDS
Designated Purposes10,000.0 5,000.02,506.25,000.01,375.4For Any Grants/Contracts Received to be Expended
Under Terms and Conditions Associated with Receipt ofGrant
500.0 750.0497.5750.0418.4For Costs Associated with GED Testing
550.0 300.0122.0300.071.2For Costs Associated with Maintaining and UpdatingInstructional Technology
1,500.0 1,500.0943.01,500.0803.8Operational Expenses Associated with Administration ofAdult Education and Literacy Activities
400.0 415.0227.5415.0380.3Ordinary and Contingent Expenses of the IllinoisCommunity College Board
Total 12,950.0 7,965.04,296.27,965.03,049.1Designated Purposes
Grants25,000.0 25,000.021,233.125,000.022,569.5Adult Education Grants to Eligible Providers
23,607.1 23,607.123,607.123,607.121,860.9Career and Technical Education Grant to colleges
Total 48,607.1 48,607.144,840.248,607.144,430.5Grants
TOTAL OTHER STATE FUNDS 61,557.1 56,572.149,136.456,572.147,479.6
FEDERAL FUNDS
Grants539.0 30.082.2100.0185.7Grants to Colleges for Workforce, Training, Technology,
and Operating Costs of the BoardTotal 539.0 30.082.2100.0185.7Grants
TOTAL FEDERAL FUNDS 539.0 30.082.2100.0185.7
TOTAL ALL FUNDS 419,805.6 421,302.6396,858.0412,302.6402,254.7
BY FUND
357,709.5 168,955.4347,639.4355,630.5354,589.4General Revenue Fund0.0 195,745.10.00.00.0Education Assistance Fund
550.0 300.0122.0300.071.2ICCB Instructional Development and EnhancementApplications Revolving Fund
500.0 750.0497.5750.0418.4ISBE GED Testing Fund10,000.0 5,000.02,506.25,000.01,375.4Illinois Community College Board Contracts and Grants
Fund539.0 30.082.2100.0185.7AFDC Opportunities Fund400.0 415.0227.5415.0380.3ICCB Federal Trust Fund
26,500.0 26,500.022,176.126,500.023,373.4ICCB Adult Education Fund23,607.1 23,607.123,607.123,607.121,860.9Career and Technical Education Fund
TOTAL ALL FUNDS 419,805.6 421,302.6396,858.0412,302.6402,254.7
BY DIVISION
419,805.6 405,258.2396,858.0412,302.6402,254.7Central Office0.0 9,531.10.00.00.0Federal Recovery - Education Stabilization0.0 6,513.30.00.00.0Federal Recovery - General Stabilization
TOTAL ALL DIVISIONS 419,805.6 421,302.6396,858.0412,302.6402,254.7
HEADCOUNT BY DIVISION Actual Estimated Authorized
47.3 60.055.0Central Office
TOTAL HEADCOUNT 47.3 60.055.0 t
6 - 38
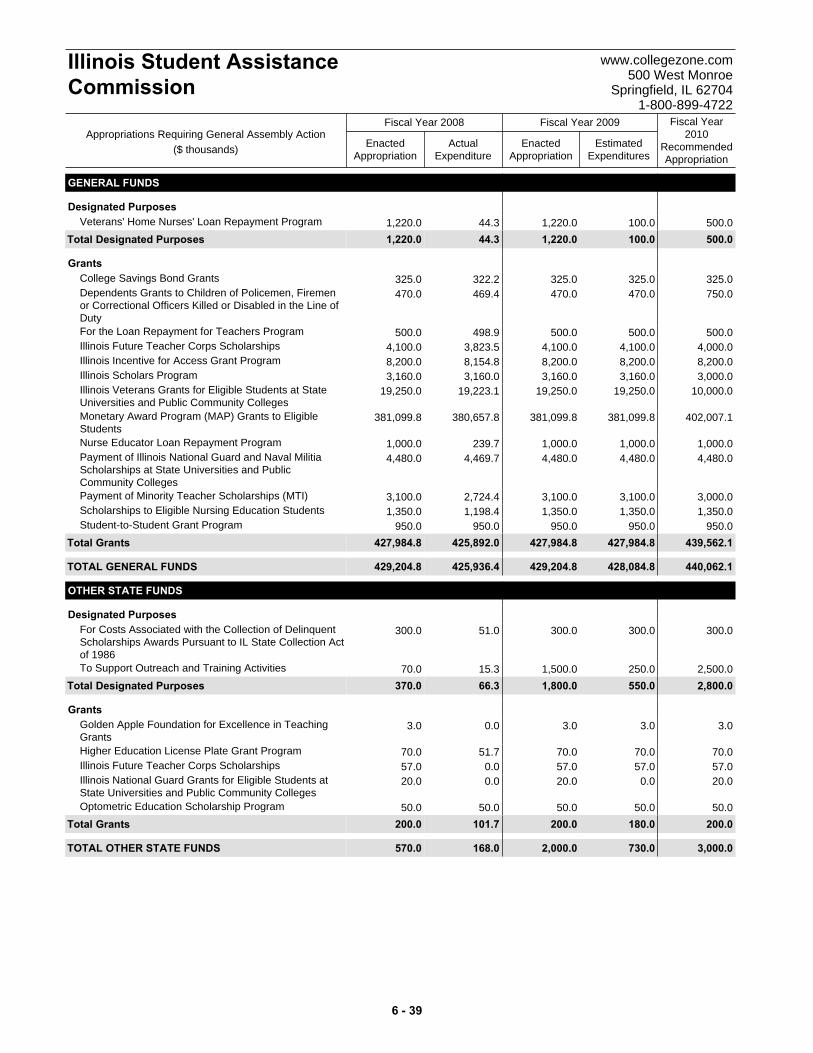
ActualExpenditure
EnactedAppropriation
EstimatedExpenditures
EnactedAppropriation
Fiscal Year2010
RecommendedAppropriation
Fiscal Year 2008 Fiscal Year 2009
Illinois Student AssistanceCommission
www.collegezone.com500 West Monroe
Springfield, IL 627041-800-899-4722
Appropriations Requiring General Assembly Action($ thousands)
GENERAL FUNDS
Designated Purposes1,220.0 500.0100.01,220.044.3Veterans' Home Nurses' Loan Repayment Program
Total 1,220.0 500.0100.01,220.044.3Designated Purposes
Grants325.0 325.0325.0325.0322.2College Savings Bond Grants470.0 750.0470.0470.0469.4Dependents Grants to Children of Policemen, Firemen
or Correctional Officers Killed or Disabled in the Line ofDuty
500.0 500.0500.0500.0498.9For the Loan Repayment for Teachers Program4,100.0 4,000.04,100.04,100.03,823.5Illinois Future Teacher Corps Scholarships8,200.0 8,200.08,200.08,200.08,154.8Illinois Incentive for Access Grant Program3,160.0 3,000.03,160.03,160.03,160.0Illinois Scholars Program
19,250.0 10,000.019,250.019,250.019,223.1Illinois Veterans Grants for Eligible Students at StateUniversities and Public Community Colleges
381,099.8 402,007.1381,099.8381,099.8380,657.8Monetary Award Program (MAP) Grants to EligibleStudents
1,000.0 1,000.01,000.01,000.0239.7Nurse Educator Loan Repayment Program 4,480.0 4,480.04,480.04,480.04,469.7Payment of Illinois National Guard and Naval Militia
Scholarships at State Universities and PublicCommunity Colleges
3,100.0 3,000.03,100.03,100.02,724.4Payment of Minority Teacher Scholarships (MTI)1,350.0 1,350.01,350.01,350.01,198.4Scholarships to Eligible Nursing Education Students
950.0 950.0950.0950.0950.0Student-to-Student Grant Program
Total 427,984.8 439,562.1427,984.8427,984.8425,892.0Grants
TOTAL GENERAL FUNDS 429,204.8 440,062.1428,084.8429,204.8425,936.4
OTHER STATE FUNDS
Designated Purposes300.0 300.0300.0300.051.0For Costs Associated with the Collection of Delinquent
Scholarships Awards Pursuant to IL State Collection Actof 1986
70.0 2,500.0250.01,500.015.3To Support Outreach and Training Activities
Total 370.0 2,800.0550.01,800.066.3Designated Purposes
Grants3.0 3.03.03.00.0Golden Apple Foundation for Excellence in Teaching
Grants70.0 70.070.070.051.7Higher Education License Plate Grant Program57.0 57.057.057.00.0Illinois Future Teacher Corps Scholarships20.0 20.00.020.00.0Illinois National Guard Grants for Eligible Students at
State Universities and Public Community Colleges50.0 50.050.050.050.0Optometric Education Scholarship Program
Total 200.0 200.0180.0200.0101.7Grants
TOTAL OTHER STATE FUNDS 570.0 3,000.0730.02,000.0168.0
6 - 39

ActualExpenditure
EnactedAppropriation
EstimatedExpenditures
EnactedAppropriation
Fiscal Year2010
RecommendedAppropriation
Fiscal Year 2008 Fiscal Year 2009
Illinois Student AssistanceCommission
www.collegezone.com500 West Monroe
Springfield, IL 627041-800-899-4722
Appropriations Requiring General Assembly Action($ thousands)
FEDERAL FUNDS
Total 27,925.9 28,276.325,813.625,932.223,127.8Personal Services and Fringe Benefits
Total 12,471.8 12,630.712,471.812,471.88,359.8Contractual Services
Total 3,665.5 3,570.53,160.83,665.51,218.1Other Operations and Refunds
Designated Purposes0.0 5,000.02,411.05,000.00.0Federal College Access Challenge Grant Program
5,000.0 3,500.03,500.03,500.01,259.4Federal Loan System Development and Maintenance21,334.4 15,000.015,000.021,334.42,899.2Payment of Collection Agency Fees Associated with
Collection Activities for Federal Family Education Loans15,000.0 10,000.02,000.010,000.011,733.1Payment of Federal Default Fees
400.0 400.0400.0400.00.0Payment of funds collected for Federal Paul DouglasTeacher Program to the Federal Government
0.0 0.00.00.077.3For Costs Associated with the Shared Services Initiativeand Other Operational Expenses
Total 41,734.4 33,900.023,311.040,234.415,969.0Designated Purposes
Grants1,800.0 3,000.03,000.03,000.01,571.6Federal Robert C. Byrd Scholarship Program
260,000.0 290,000.0260,000.0260,000.0137,336.3Lender Reimbursements on Defaulted Loans,Transfer ofCollection Revenues to Operating Fund
3,700.0 4,000.04,200.04,200.03,700.0Repository for Federal LEAP Funding to SupplementMonetary Award Program
Total 265,500.0 297,000.0267,200.0267,200.0142,607.9Grants
TOTAL FEDERAL FUNDS 351,297.6 375,377.5331,957.2349,503.9191,282.6
TOTAL ALL FUNDS 781,072.4 818,439.6760,772.0780,708.7617,386.9
BY FUND
429,204.8 28,055.027,735.028,855.0425,936.4General Revenue Fund0.0 412,007.1400,349.8400,349.80.0Education Assistance Fund
2,200.0 3,400.03,400.03,400.01,571.6Federal Congressional Teacher Scholarship Program Fund300.0 300.0300.0300.051.0ISAC Accounts Receivable Fund
50.0 50.050.050.050.0Optometric Licensing and Disciplinary Board Fund70.0 70.070.070.051.7University Grant Fund
260,000.0 290,000.0260,000.0260,000.0137,336.3Federal Student Loan Fund85,397.6 72,977.561,946.276,903.948,674.7Student Loan Operating Fund
70.0 2,500.0250.01,500.015.3Illinois Student Assistance Commission Contracts andGrants Fund
3,700.0 9,000.06,611.09,200.03,700.0Federal Student Incentive Trust Fund20.0 20.00.020.00.0National Guard and Naval Militia Grant Fund60.0 60.060.060.00.0Illinois Future Teacher Corps Scholarship Fund
TOTAL ALL FUNDS 781,072.4 818,439.6760,772.0780,708.7617,386.9
BY DIVISION
87,057.6 76,347.562,666.279,993.948,837.0Executive Division Administration694,014.8 742,092.1698,105.8700,714.8568,549.9Student Grant Programs
TOTAL ALL DIVISIONS 781,072.4 818,439.6760,772.0780,708.7617,386.9
HEADCOUNT BY DIVISION Actual Estimated Authorized
383.0 322.0359.0Executive Division AdministrationTOTAL HEADCOUNT 383.0 322.0359.0 t
6 - 40

GENERAL FUNDS
Total 11,154.0 11,742.511,642.511,642.511,133.3Personal Services and Fringe Benefits
Total 4,187.8 4,399.44,324.44,324.44,107.2Contractual Services
Total 1,861.1 1,724.51,724.51,724.51,856.8Other Operations and Refunds
Designated Purposes0.0 50.00.00.00.0For Costs Associated With Two Field Offices
Total 0.0 50.00.00.00.0Designated Purposes
Grants450.0 650.0650.0650.0450.0Excellence 2000 Program
Total 450.0 650.0650.0650.0450.0Grants
TOTAL GENERAL FUNDS 17,652.9 18,566.418,341.418,341.417,547.3
OTHER STATE FUNDS
Total 1,686.4 1,625.41,621.21,686.41,454.7Personal Services and Fringe Benefits
Total 920.1 977.1567.9920.1157.9Contractual Services
Total 443.5 447.5315.0443.594.4Other Operations and Refunds
TOTAL OTHER STATE FUNDS 3,050.0 3,050.02,504.13,050.01,707.0
TOTAL ALL FUNDS 20,702.9 21,616.420,845.521,391.419,254.3
BY FUND
17,652.9 18,566.418,341.418,341.417,547.3General Revenue Fund
3,050.0 3,050.02,504.13,050.01,707.0IMSA Income Fund
TOTAL ALL FUNDS 20,702.9 21,616.420,845.521,391.419,254.3
BY DIVISION
20,702.9 21,616.420,845.521,391.419,254.3General Office
TOTAL ALL DIVISIONS 20,702.9 21,616.420,845.521,391.419,254.3
HEADCOUNT BY DIVISION Actual Estimated Authorized
249.0 252.0265.0General Office
TOTAL HEADCOUNT 249.0 252.0265.0 t
ActualExpenditure
EnactedAppropriation
EstimatedExpenditures
EnactedAppropriation
Fiscal Year2010
RecommendedAppropriation
Fiscal Year 2008 Fiscal Year 2009
Illinois Mathematics AndScience Academy
www.imsa.edu500 West Sullivan Road
Aurora, IL 60506630-907-5000
Appropriations Requiring General Assembly Action($ thousands)
6 - 41

GENERAL FUNDS
Total 4,740.2 120,550.0172,189.0172,189.04,740.2Personal Services and Fringe Benefits
Designated Purposes0.0 4,059.53,916.33,916.30.0Group Insurance
Total 0.0 4,059.53,916.33,916.30.0Designated Purposes
TOTAL GENERAL FUNDS 4,740.2 124,609.5176,105.3176,105.34,740.2
OTHER STATE FUNDS
Grants340,320.0 175,054.0250,000.0250,000.0340,320.0Retirement Payments per Section 8.12 of the State
Finance ActTotal 340,320.0 175,054.0250,000.0250,000.0340,320.0Grants
TOTAL OTHER STATE FUNDS 340,320.0 175,054.0250,000.0250,000.0340,320.0
TOTAL ALL FUNDS 345,060.2 299,663.5426,105.3426,105.3345,060.2
ActualExpenditure
EnactedAppropriation
EstimatedExpenditures
EnactedAppropriation
Fiscal Year2010
RecommendedAppropriation
Fiscal Year 2008 Fiscal Year 2009
State Universities RetirementSystem
www.surs.com1901 Fox Drive
Champaign, IL 61820217.378.8800
Appropriations Requiring General Assembly Action($ thousands)
6 - 42
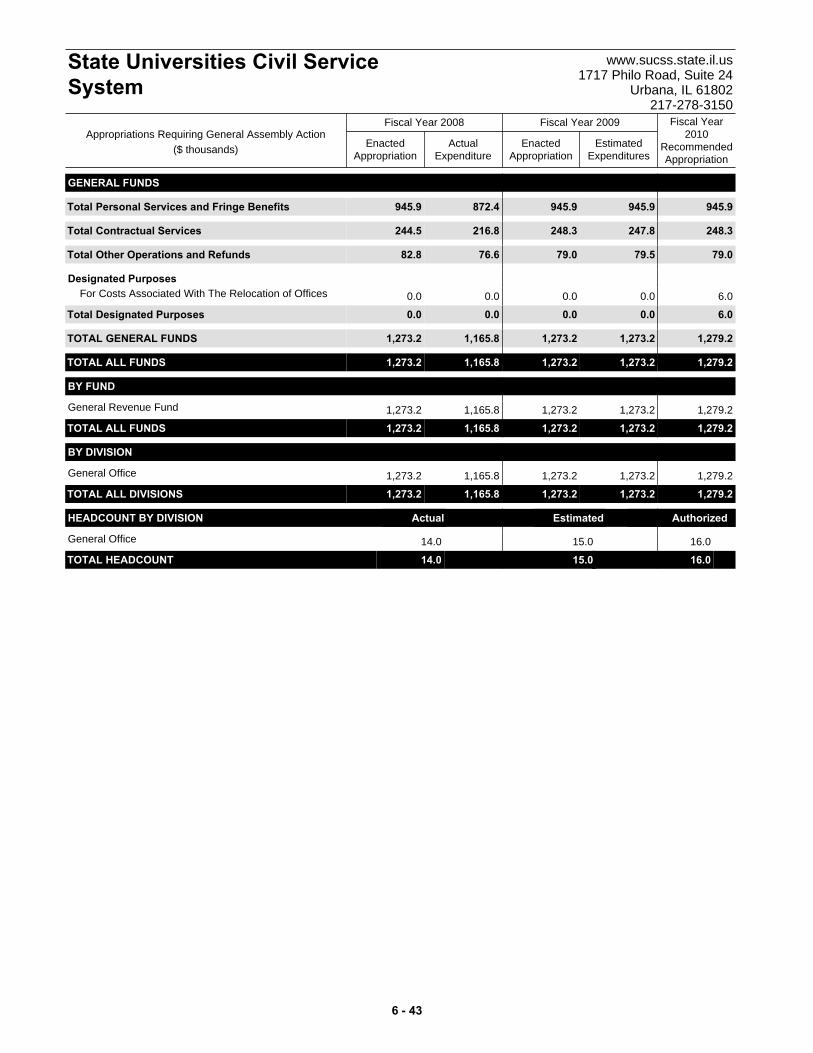
GENERAL FUNDS
Total 945.9 945.9945.9945.9872.4Personal Services and Fringe Benefits
Total 244.5 248.3247.8248.3216.8Contractual Services
Total 82.8 79.079.579.076.6Other Operations and Refunds
Designated Purposes0.0 6.00.00.00.0For Costs Associated With The Relocation of Offices
Total 0.0 6.00.00.00.0Designated Purposes
TOTAL GENERAL FUNDS 1,273.2 1,279.21,273.21,273.21,165.8
TOTAL ALL FUNDS 1,273.2 1,279.21,273.21,273.21,165.8
BY FUND
1,273.2 1,279.21,273.21,273.21,165.8General Revenue Fund
TOTAL ALL FUNDS 1,273.2 1,279.21,273.21,273.21,165.8
BY DIVISION
1,273.2 1,279.21,273.21,273.21,165.8General Office
TOTAL ALL DIVISIONS 1,273.2 1,279.21,273.21,273.21,165.8
HEADCOUNT BY DIVISION Actual Estimated Authorized
14.0 16.015.0General Office
TOTAL HEADCOUNT 14.0 16.015.0 t
ActualExpenditure
EnactedAppropriation
EstimatedExpenditures
EnactedAppropriation
Fiscal Year2010
RecommendedAppropriation
Fiscal Year 2008 Fiscal Year 2009
State Universities Civil ServiceSystem
www.sucss.state.il.us1717 Philo Road, Suite 24
Urbana, IL 61802217-278-3150
Appropriations Requiring General Assembly Action($ thousands)
6 - 43

6 - 44
HUMAN SERVICES
CODE DEPARTMENTS
Department on AgingDepartment of Children and Family Services
Department of Healthcare and Family ServicesDepartment of Human ServicesDepartment of Juvenile Justice
Department of Public HealthDepartment of Veterans’ Affairs
AUTHORITIES, BOARDS and COMMISSIONS
Comprehensive Health Insurance PlanIllinois Deaf and Hard of Hearing CommissionIllinois Council on Developmental Disabilities
Illinois Guardianship and Advocacy CommissionIllinois Violence Prevention Authority
www.state.il.us/budget
CHAPTER 7

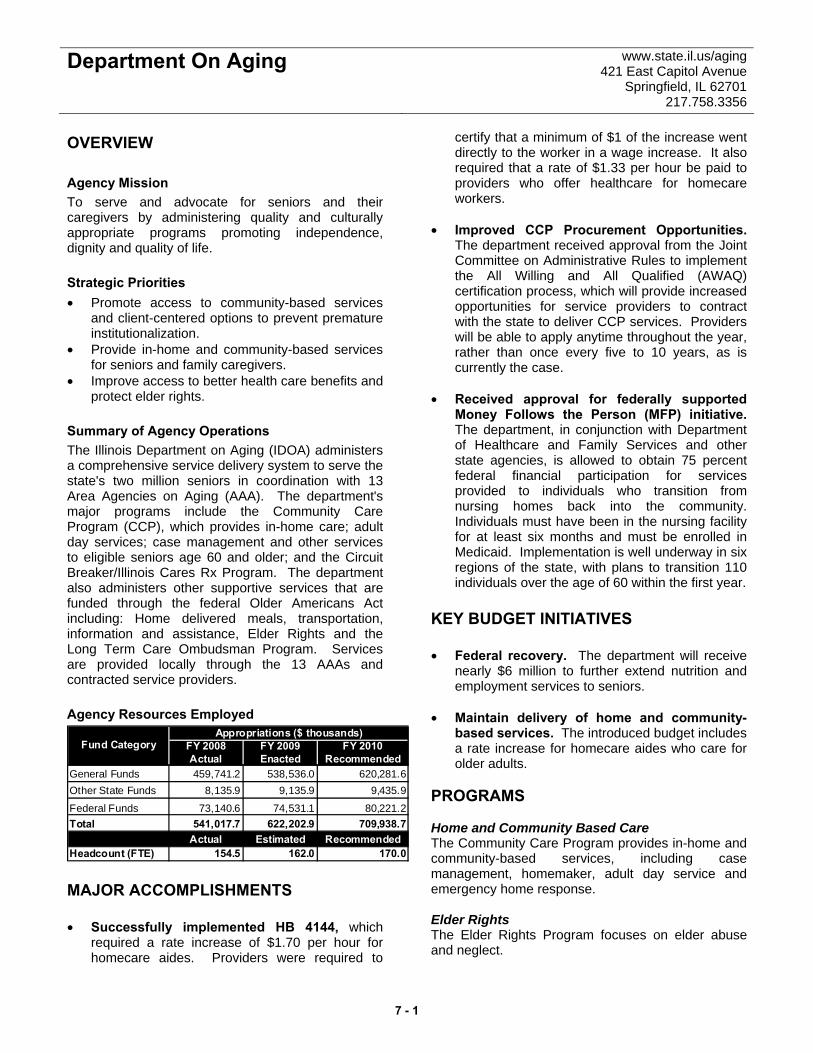
Department On Aging www.state.il.us/aging 421 East Capitol Avenue
Springfield, IL 62701 217.758.3356
OVERVIEW Agency Mission To serve and advocate for seniors and their caregivers by administering quality and culturally appropriate programs promoting independence, dignity and quality of life. Strategic Priorities • Promote access to community-based services
and client-centered options to prevent premature institutionalization.
• Provide in-home and community-based services for seniors and family caregivers.
• Improve access to better health care benefits and protect elder rights.
Summary of Agency Operations The Illinois Department on Aging (IDOA) administers a comprehensive service delivery system to serve the state's two million seniors in coordination with 13 Area Agencies on Aging (AAA). The department's major programs include the Community Care Program (CCP), which provides in-home care; adult day services; case management and other services to eligible seniors age 60 and older; and the Circuit Breaker/Illinois Cares Rx Program. The department also administers other supportive services that are funded through the federal Older Americans Act including: Home delivered meals, transportation, information and assistance, Elder Rights and the Long Term Care Ombudsman Program. Services are provided locally through the 13 AAAs and contracted service providers. Agency Resources Employed
FY 2008 FY 2009 FY 2010Actual Enacted Recommended
General Funds 459,741.2 538,536.0 620,281.6Other State Funds 8,135.9 9,135.9 9,435.9
Federal Funds 73,140.6 74,531.1 80,221.2Total 541,017.7 622,202.9 709,938.7
Actual Estimated RecommendedHeadcount (FTE) 154.5 162.0 170.0
Appropriations ($ thousands)Fund Category
MAJOR ACCOMPLISHMENTS • Successfully implemented HB 4144, which
required a rate increase of $1.70 per hour for homecare aides. Providers were required to
certify that a minimum of $1 of the increase went directly to the worker in a wage increase. It also required that a rate of $1.33 per hour be paid to providers who offer healthcare for homecare workers.
• Improved CCP Procurement Opportunities.
The department received approval from the Joint Committee on Administrative Rules to implement the All Willing and All Qualified (AWAQ) certification process, which will provide increased opportunities for service providers to contract with the state to deliver CCP services. Providers will be able to apply anytime throughout the year, rather than once every five to 10 years, as is currently the case.
• Received approval for federally supported
Money Follows the Person (MFP) initiative. The department, in conjunction with Department of Healthcare and Family Services and other state agencies, is allowed to obtain 75 percent federal financial participation for services provided to individuals who transition from nursing homes back into the community. Individuals must have been in the nursing facility for at least six months and must be enrolled in Medicaid. Implementation is well underway in six regions of the state, with plans to transition 110 individuals over the age of 60 within the first year.
KEY BUDGET INITIATIVES • Federal recovery. The department will receive
nearly $6 million to further extend nutrition and employment services to seniors.
• Maintain delivery of home and community-
based services. The introduced budget includes a rate increase for homecare aides who care for older adults.
PROGRAMS Home and Community Based Care The Community Care Program provides in-home and community-based services, including case management, homemaker, adult day service and emergency home response. Elder Rights The Elder Rights Program focuses on elder abuse and neglect.
7 - 1
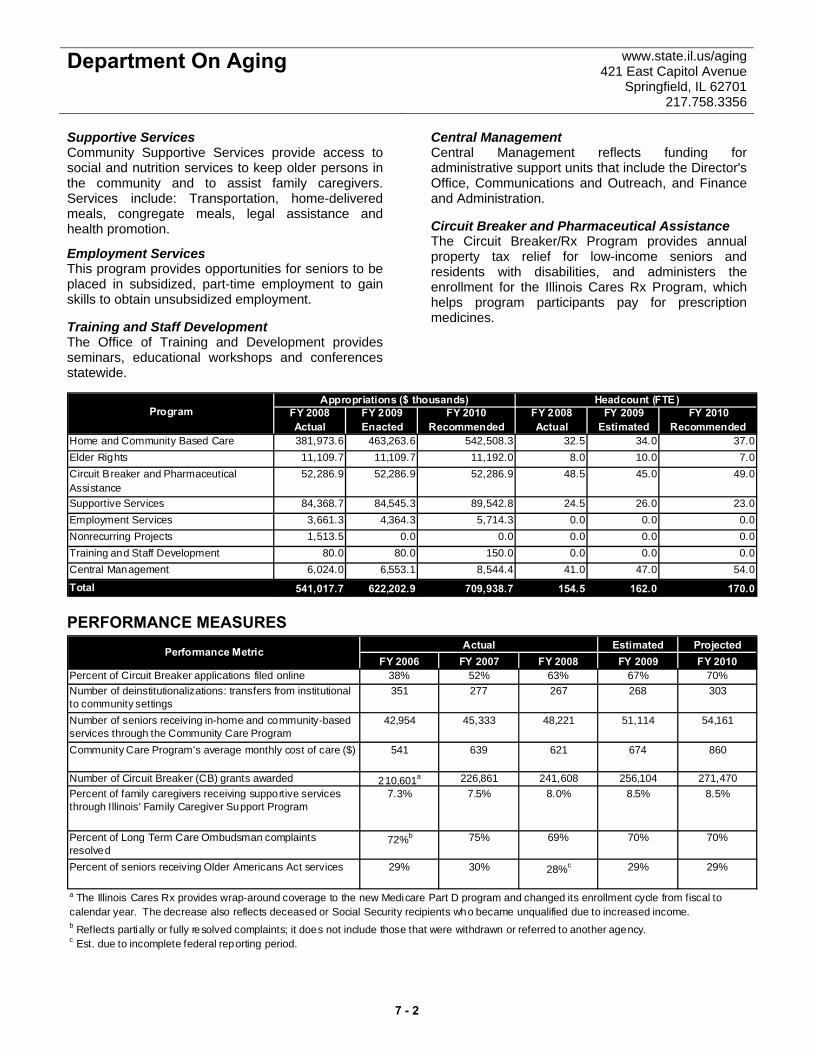
Department On Aging www.state.il.us/aging 421 East Capitol Avenue
Springfield, IL 62701 217.758.3356
Supportive Services Community Supportive Services provide access to social and nutrition services to keep older persons in the community and to assist family caregivers. Services include: Transportation, home-delivered meals, congregate meals, legal assistance and health promotion.
Employment Services This program provides opportunities for seniors to be placed in subsidized, part-time employment to gain skills to obtain unsubsidized employment. Training and Staff Development The Office of Training and Development provides seminars, educational workshops and conferences statewide.
Central Management Central Management reflects funding for administrative support units that include the Director's Office, Communications and Outreach, and Finance and Administration. Circuit Breaker and Pharmaceutical Assistance The Circuit Breaker/Rx Program provides annual property tax relief for low-income seniors and residents with disabilities, and administers the enrollment for the Illinois Cares Rx Program, which helps program participants pay for prescription medicines.
Program FY 2008 FY 2009 FY 2010 FY 2008 FY 2009 FY 2010Actual Enacted Recommended Actual Estimated Recommended
Home and Community Based Care 381,973.6 463,263.6 542,508.3 32.5 34.0 37.0Elder Rights 11,109.7 11,109.7 11,192.0 8.0 10.0 7.0Circuit Breaker and Pharmaceutical Assistance
52,286.9 52,286.9 52,286.9 48.5 45.0 49.0
Supportive Services 84,368.7 84,545.3 89,542.8 24.5 26.0 23.0Employment Services 3,661.3 4,364.3 5,714.3 0.0 0.0 0.0Nonrecurring Projects 1,513.5 0.0 0.0 0.0 0.0 0.0Training and Staff Development 80.0 80.0 150.0 0.0 0.0 0.0Central Management 6,024.0 6,553.1 8,544.4 41.0 47.0 54.0
Total 541,017.7 622,202.9 709,938.7 154.5 162.0 170.0
Appropriations ($ thousands) Headcount (FTE)
PERFORMANCE MEASURES Estimated Projected
FY 2006 FY 2007 FY 2008 FY 2009 FY 2010Percent of Circuit Breaker applications filed online 38% 52% 63% 67% 70%Number of deinstitutionalizations: transfers from institutional to community settings
351 277 267 268 303
Number of seniors receiving in-home and community-based services through the Community Care Program
42,954 45,333 48,221 51,114 54,161
Community Care Program's average monthly cost of care ($) 541 639 621 674 860
Number of Circuit Breaker (CB) grants awarded 210,601a 226,861 241,608 256,104 271,470Percent of family caregivers receiving supportive services through Illinois' Family Caregiver Support Program
7.3% 7.5% 8.0% 8.5% 8.5%
Percent of Long Term Care Ombudsman complaints resolved
72%b 75% 69% 70% 70%
Percent of seniors receiving Older Americans Act services 29% 30% 28%c 29% 29%
ActualPerformance Metric
a The Illinois Cares Rx provides wrap-around coverage to the new Medicare Part D program and changed its enrollment cycle from fiscal to calendar year. The decrease also reflects deceased or Social Security recipients who became unqualified due to increased income.b Reflects partially or fully resolved complaints; it does not include those that were withdrawn or referred to another agency.c Est. due to incomplete federal reporting period.
7 - 2
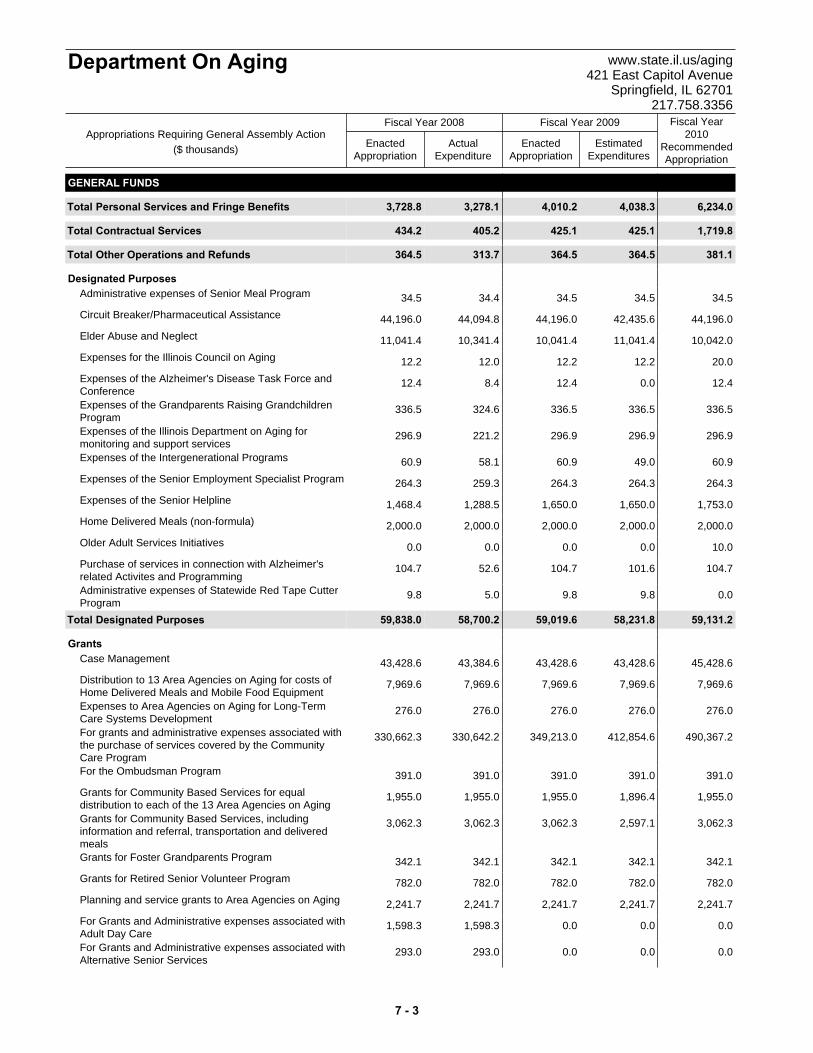
ActualExpenditure
EnactedAppropriation
EstimatedExpenditures
EnactedAppropriation
Fiscal Year2010
RecommendedAppropriation
Fiscal Year 2008 Fiscal Year 2009
Department On Aging www.state.il.us/aging421 East Capitol Avenue
Springfield, IL 62701217.758.3356
Appropriations Requiring General Assembly Action($ thousands)
GENERAL FUNDS
Total 3,728.8 6,234.04,038.34,010.23,278.1Personal Services and Fringe Benefits
Total 434.2 1,719.8425.1425.1405.2Contractual Services
Total 364.5 381.1364.5364.5313.7Other Operations and Refunds
Designated Purposes
34.5 34.534.534.534.4Administrative expenses of Senior Meal Program
44,196.0 44,196.042,435.644,196.044,094.8Circuit Breaker/Pharmaceutical Assistance
11,041.4 10,042.011,041.410,041.410,341.4Elder Abuse and Neglect
12.2 20.012.212.212.0Expenses for the Illinois Council on Aging
12.4 12.40.012.48.4Expenses of the Alzheimer's Disease Task Force andConference
336.5 336.5336.5336.5324.6Expenses of the Grandparents Raising GrandchildrenProgram
296.9 296.9296.9296.9221.2Expenses of the Illinois Department on Aging formonitoring and support services
60.9 60.949.060.958.1Expenses of the Intergenerational Programs
264.3 264.3264.3264.3259.3Expenses of the Senior Employment Specialist Program
1,468.4 1,753.01,650.01,650.01,288.5Expenses of the Senior Helpline
2,000.0 2,000.02,000.02,000.02,000.0Home Delivered Meals (non-formula)
0.0 10.00.00.00.0Older Adult Services Initiatives
104.7 104.7101.6104.752.6Purchase of services in connection with Alzheimer'srelated Activites and Programming
9.8 0.09.89.85.0Administrative expenses of Statewide Red Tape CutterProgram
Total 59,838.0 59,131.258,231.859,019.658,700.2Designated Purposes
Grants
43,428.6 45,428.643,428.643,428.643,384.6Case Management
7,969.6 7,969.67,969.67,969.67,969.6Distribution to 13 Area Agencies on Aging for costs ofHome Delivered Meals and Mobile Food Equipment
276.0 276.0276.0276.0276.0Expenses to Area Agencies on Aging for Long-TermCare Systems Development
330,662.3 490,367.2412,854.6349,213.0330,642.2For grants and administrative expenses associated withthe purchase of services covered by the CommunityCare Program
391.0 391.0391.0391.0391.0For the Ombudsman Program
1,955.0 1,955.01,896.41,955.01,955.0Grants for Community Based Services for equaldistribution to each of the 13 Area Agencies on Aging
3,062.3 3,062.32,597.13,062.33,062.3Grants for Community Based Services, includinginformation and referral, transportation and deliveredmeals
342.1 342.1342.1342.1342.1Grants for Foster Grandparents Program
782.0 782.0782.0782.0782.0Grants for Retired Senior Volunteer Program
2,241.7 2,241.72,241.72,241.72,241.7Planning and service grants to Area Agencies on Aging
1,598.3 0.00.00.01,598.3For Grants and Administrative expenses associated withAdult Day Care
293.0 0.00.00.0293.0For Grants and Administrative expenses associated withAlternative Senior Services
7 - 3
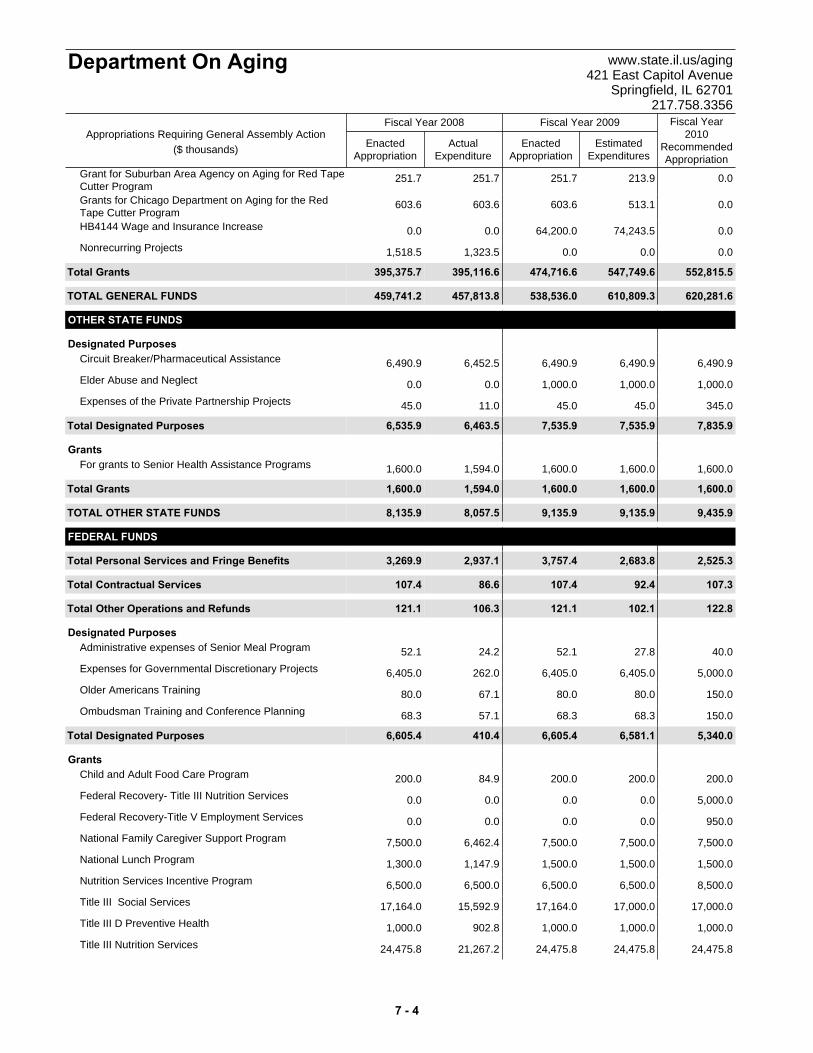
ActualExpenditure
EnactedAppropriation
EstimatedExpenditures
EnactedAppropriation
Fiscal Year2010
RecommendedAppropriation
Fiscal Year 2008 Fiscal Year 2009
Department On Aging www.state.il.us/aging421 East Capitol Avenue
Springfield, IL 62701217.758.3356
Appropriations Requiring General Assembly Action($ thousands)
251.7 0.0213.9251.7251.7Grant for Suburban Area Agency on Aging for Red TapeCutter Program
603.6 0.0513.1603.6603.6Grants for Chicago Department on Aging for the RedTape Cutter Program
0.0 0.074,243.564,200.00.0HB4144 Wage and Insurance Increase
1,518.5 0.00.00.01,323.5Nonrecurring Projects
Total 395,375.7 552,815.5547,749.6474,716.6395,116.6Grants
TOTAL GENERAL FUNDS 459,741.2 620,281.6610,809.3538,536.0457,813.8
OTHER STATE FUNDS
Designated Purposes
6,490.9 6,490.96,490.96,490.96,452.5Circuit Breaker/Pharmaceutical Assistance
0.0 1,000.01,000.01,000.00.0Elder Abuse and Neglect
45.0 345.045.045.011.0Expenses of the Private Partnership Projects
Total 6,535.9 7,835.97,535.97,535.96,463.5Designated Purposes
Grants
1,600.0 1,600.01,600.01,600.01,594.0For grants to Senior Health Assistance Programs
Total 1,600.0 1,600.01,600.01,600.01,594.0Grants
TOTAL OTHER STATE FUNDS 8,135.9 9,435.99,135.99,135.98,057.5
FEDERAL FUNDS
Total 3,269.9 2,525.32,683.83,757.42,937.1Personal Services and Fringe Benefits
Total 107.4 107.392.4107.486.6Contractual Services
Total 121.1 122.8102.1121.1106.3Other Operations and Refunds
Designated Purposes
52.1 40.027.852.124.2Administrative expenses of Senior Meal Program
6,405.0 5,000.06,405.06,405.0262.0Expenses for Governmental Discretionary Projects
80.0 150.080.080.067.1Older Americans Training
68.3 150.068.368.357.1Ombudsman Training and Conference Planning
Total 6,605.4 5,340.06,581.16,605.4410.4Designated Purposes
Grants
200.0 200.0200.0200.084.9Child and Adult Food Care Program
0.0 5,000.00.00.00.0Federal Recovery- Title III Nutrition Services
0.0 950.00.00.00.0Federal Recovery-Title V Employment Services
7,500.0 7,500.07,500.07,500.06,462.4National Family Caregiver Support Program
1,300.0 1,500.01,500.01,500.01,147.9National Lunch Program
6,500.0 8,500.06,500.06,500.06,500.0Nutrition Services Incentive Program
17,164.0 17,000.017,000.017,164.015,592.9Title III Social Services
1,000.0 1,000.01,000.01,000.0902.8Title III D Preventive Health
24,475.8 24,475.824,475.824,475.821,267.2Title III Nutrition Services
7 - 4
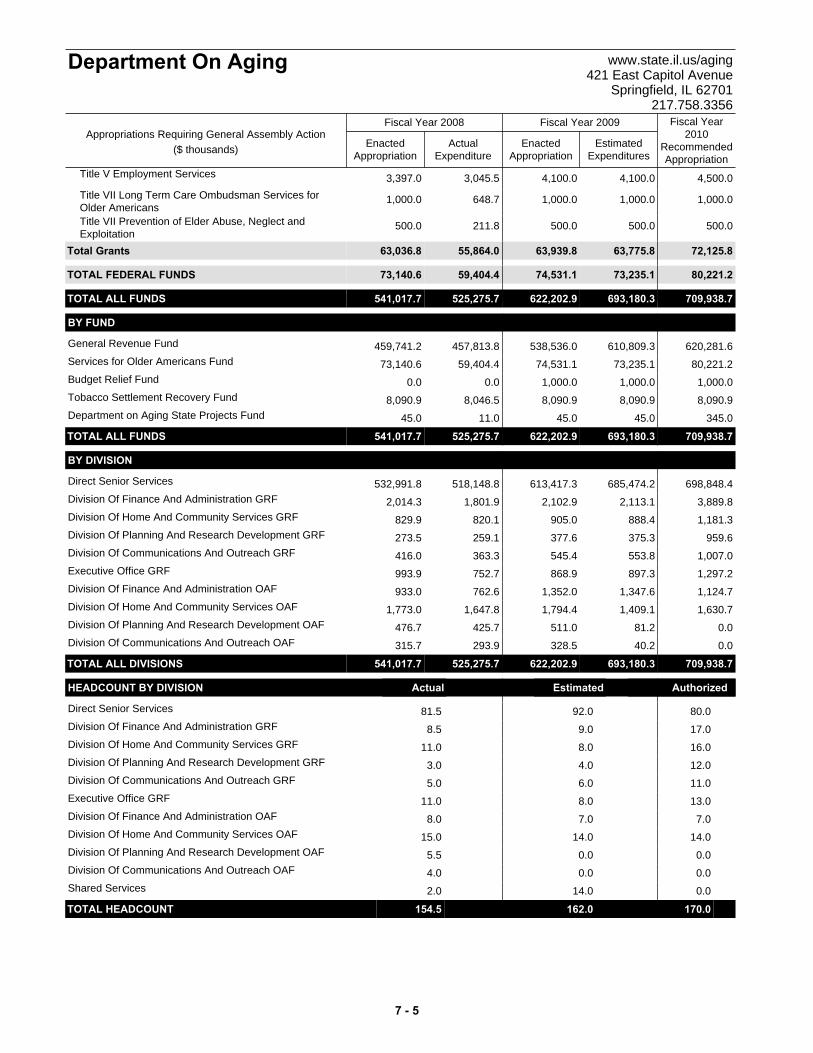
ActualExpenditure
EnactedAppropriation
EstimatedExpenditures
EnactedAppropriation
Fiscal Year2010
RecommendedAppropriation
Fiscal Year 2008 Fiscal Year 2009
Department On Aging www.state.il.us/aging421 East Capitol Avenue
Springfield, IL 62701217.758.3356
Appropriations Requiring General Assembly Action($ thousands)
3,397.0 4,500.04,100.04,100.03,045.5Title V Employment Services
1,000.0 1,000.01,000.01,000.0648.7Title VII Long Term Care Ombudsman Services forOlder Americans
500.0 500.0500.0500.0211.8Title VII Prevention of Elder Abuse, Neglect andExploitation
Total 63,036.8 72,125.863,775.863,939.855,864.0Grants
TOTAL FEDERAL FUNDS 73,140.6 80,221.273,235.174,531.159,404.4
TOTAL ALL FUNDS 541,017.7 709,938.7693,180.3622,202.9525,275.7
BY FUND
459,741.2 620,281.6610,809.3538,536.0457,813.8General Revenue Fund
73,140.6 80,221.273,235.174,531.159,404.4Services for Older Americans Fund
0.0 1,000.01,000.01,000.00.0Budget Relief Fund
8,090.9 8,090.98,090.98,090.98,046.5Tobacco Settlement Recovery Fund
45.0 345.045.045.011.0Department on Aging State Projects Fund
TOTAL ALL FUNDS 541,017.7 709,938.7693,180.3622,202.9525,275.7
BY DIVISION
532,991.8 698,848.4685,474.2613,417.3518,148.8Direct Senior Services
2,014.3 3,889.82,113.12,102.91,801.9Division Of Finance And Administration GRF
829.9 1,181.3888.4905.0820.1Division Of Home And Community Services GRF
273.5 959.6375.3377.6259.1Division Of Planning And Research Development GRF
416.0 1,007.0553.8545.4363.3Division Of Communications And Outreach GRF
993.9 1,297.2897.3868.9752.7Executive Office GRF
933.0 1,124.71,347.61,352.0762.6Division Of Finance And Administration OAF
1,773.0 1,630.71,409.11,794.41,647.8Division Of Home And Community Services OAF
476.7 0.081.2511.0425.7Division Of Planning And Research Development OAF
315.7 0.040.2328.5293.9Division Of Communications And Outreach OAF
TOTAL ALL DIVISIONS 541,017.7 709,938.7693,180.3622,202.9525,275.7
HEADCOUNT BY DIVISION Actual Estimated Authorized
81.5 80.092.0Direct Senior Services
8.5 17.09.0Division Of Finance And Administration GRF
11.0 16.08.0Division Of Home And Community Services GRF
3.0 12.04.0Division Of Planning And Research Development GRF
5.0 11.06.0Division Of Communications And Outreach GRF
11.0 13.08.0Executive Office GRF
8.0 7.07.0Division Of Finance And Administration OAF
15.0 14.014.0Division Of Home And Community Services OAF
5.5 0.00.0Division Of Planning And Research Development OAF
4.0 0.00.0Division Of Communications And Outreach OAF
2.0 0.014.0Shared Services
TOTAL HEADCOUNT 154.5 170.0162.0 t
7 - 5
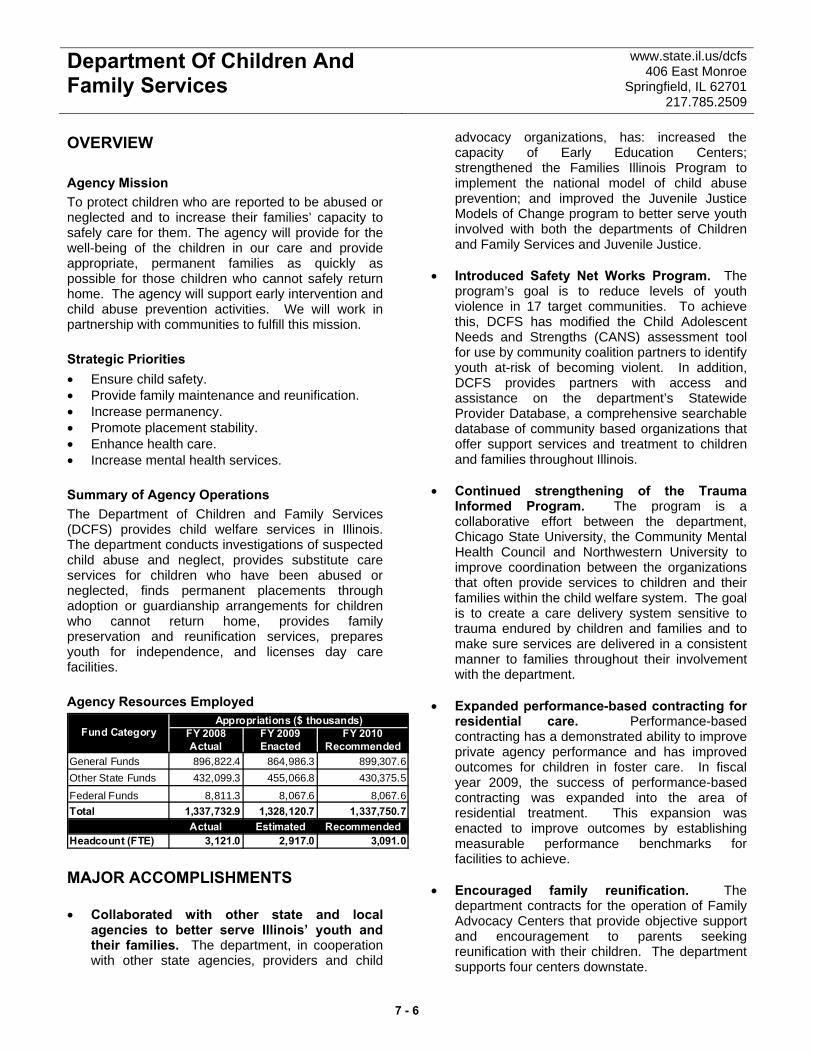
Department Of Children And Family Services
www.state.il.us/dcfs 406 East Monroe
Springfield, IL 62701 217.785.2509
OVERVIEW Agency Mission To protect children who are reported to be abused or neglected and to increase their families’ capacity to safely care for them. The agency will provide for the well-being of the children in our care and provide appropriate, permanent families as quickly as possible for those children who cannot safely return home. The agency will support early intervention and child abuse prevention activities. We will work in partnership with communities to fulfill this mission. Strategic Priorities • Ensure child safety. • Provide family maintenance and reunification. • Increase permanency. • Promote placement stability. • Enhance health care. • Increase mental health services. Summary of Agency Operations The Department of Children and Family Services (DCFS) provides child welfare services in Illinois. The department conducts investigations of suspected child abuse and neglect, provides substitute care services for children who have been abused or neglected, finds permanent placements through adoption or guardianship arrangements for children who cannot return home, provides family preservation and reunification services, prepares youth for independence, and licenses day care facilities. Agency Resources Employed
FY 2008 FY 2009 FY 2010Actual Enacted Recommended
General Funds 896,822.4 864,986.3 899,307.6Other State Funds 432,099.3 455,066.8 430,375.5
Federal Funds 8,811.3 8,067.6 8,067.6Total 1,337,732.9 1,328,120.7 1,337,750.7
Actual Estimated RecommendedHeadcount (FTE) 3,121.0 2,917.0 3,091.0
Appropriations ($ thousands)Fund Category
MAJOR ACCOMPLISHMENTS • Collaborated with other state and local
agencies to better serve Illinois’ youth and their families. The department, in cooperation with other state agencies, providers and child
advocacy organizations, has: increased the capacity of Early Education Centers; strengthened the Families Illinois Program to implement the national model of child abuse prevention; and improved the Juvenile Justice Models of Change program to better serve youth involved with both the departments of Children and Family Services and Juvenile Justice.
• Introduced Safety Net Works Program. The
program’s goal is to reduce levels of youth violence in 17 target communities. To achieve this, DCFS has modified the Child Adolescent Needs and Strengths (CANS) assessment tool for use by community coalition partners to identify youth at-risk of becoming violent. In addition, DCFS provides partners with access and assistance on the department’s Statewide Provider Database, a comprehensive searchable database of community based organizations that offer support services and treatment to children and families throughout Illinois.
• Continued strengthening of the Trauma
Informed Program. The program is a collaborative effort between the department, Chicago State University, the Community Mental Health Council and Northwestern University to improve coordination between the organizations that often provide services to children and their families within the child welfare system. The goal is to create a care delivery system sensitive to trauma endured by children and families and to make sure services are delivered in a consistent manner to families throughout their involvement with the department.
• Expanded performance-based contracting for
residential care. Performance-based contracting has a demonstrated ability to improve private agency performance and has improved outcomes for children in foster care. In fiscal year 2009, the success of performance-based contracting was expanded into the area of residential treatment. This expansion was enacted to improve outcomes by establishing measurable performance benchmarks for facilities to achieve.
• Encouraged family reunification. The
department contracts for the operation of Family Advocacy Centers that provide objective support and encouragement to parents seeking reunification with their children. The department supports four centers downstate.
7 - 6
Department Of Children And Family Services
www.state.il.us/dcfs 406 East Monroe
Springfield, IL 62701 217.785.2509
KEY BUDGET INITIATIVES • Federal recovery. The agency will receive
$16.6 million through increased federal reimbursement for Title IV-E eligible programs. A 6.2 percent increase became effective October 1, 2008 and will conclude December 31, 2010.
• Increase the number of licensed foster care
homes. Licensing of foster homes meets two purposes: It increases payments to the foster parent, and it ensures that the home is meeting a high standard of care. The department works to maintain children in a safe, familiar and comfortable setting while providing the highest level of reimbursement to the foster parent.
• Increase federal revenue. The department has
two initiatives to maximize federal revenues: increasing the number of licensed homes where children are cared for by relatives, and having contracted providers adhere to all Medicaid claiming requirements. Both initiatives, in addition to earning federal reimbursement, will help ensure that quality care continues to be provided.
• Increase in delinquent youth treatment. The expansion of residential treatment services for youth ages 13 through 15 will divert delinquent youth who have an independent finding of neglect or dependency by the Juvenile Court from incarceration. This change is intended to better meet the treatment needs of this population in a less restrictive setting and is a result of PA 95-642.
PROGRAMS Protective Services Protective Services are provided to children who are reported as being abused or neglected. The department assures their safety by providing sound service; placement and permanency planning decisions; by licensing foster homes, group homes, child care institutions and day care facilities; and by enhancing their family’s capacity to safely care for children. Early intervention and child abuse prevention activities are also provided under this program.
Adoption and Guardianship Adoption Services are the identification, legal freeing and preparation for adoption of children whose biological parents are judged by the courts as being unwilling or unable to provide safe and nurturing care. These services include preparation, training, financial and emotional support for adoptive families both before and after adoption of special-needs children. Permanent guardianship is also offered as an alternative permanent placement to children for whom adoption is not an option. Family Maintenance Family Maintenance services are interventions with the child and family to prevent the unnecessary removal of children from their homes and to reunite children safely with their families. These services are designed to promote a permanent, safe, secure and nurturing environment for children. Professional judgments, informed by assessment tools, are made regarding each family's ability to provide this environment. The federal government supports family maintenance through the Adoption Assistance and Child Welfare Act and federal subsidies to the state. Family Reunification and Substitute Care Family Reunification and Substitute Care services provide for the safe and healthy development of children for whom a Juvenile Court has determined these needs cannot be met in their home. The services are provided until the family is able to meet the child's needs or until another safe, permanent home is found. Substitute care involves placing a child with a foster family, relative, or in a group home, institution or independent living arrangement. Family reunification services include interventions in families' lives to make behavioral changes and to promote the development of skills necessary to parent and care for children safely. Services are also provided under this program to drug-addicted newborns, youth requiring clinical services, sibling groups, pregnant and parenting teens, and adolescents requiring transitional services in order to attain self-sufficiency. Budget and Finance The department's central operations consist of Budget and Finance, which are designed to ensure that the highest quality of service is effectively and efficiently delivered.
7 - 7
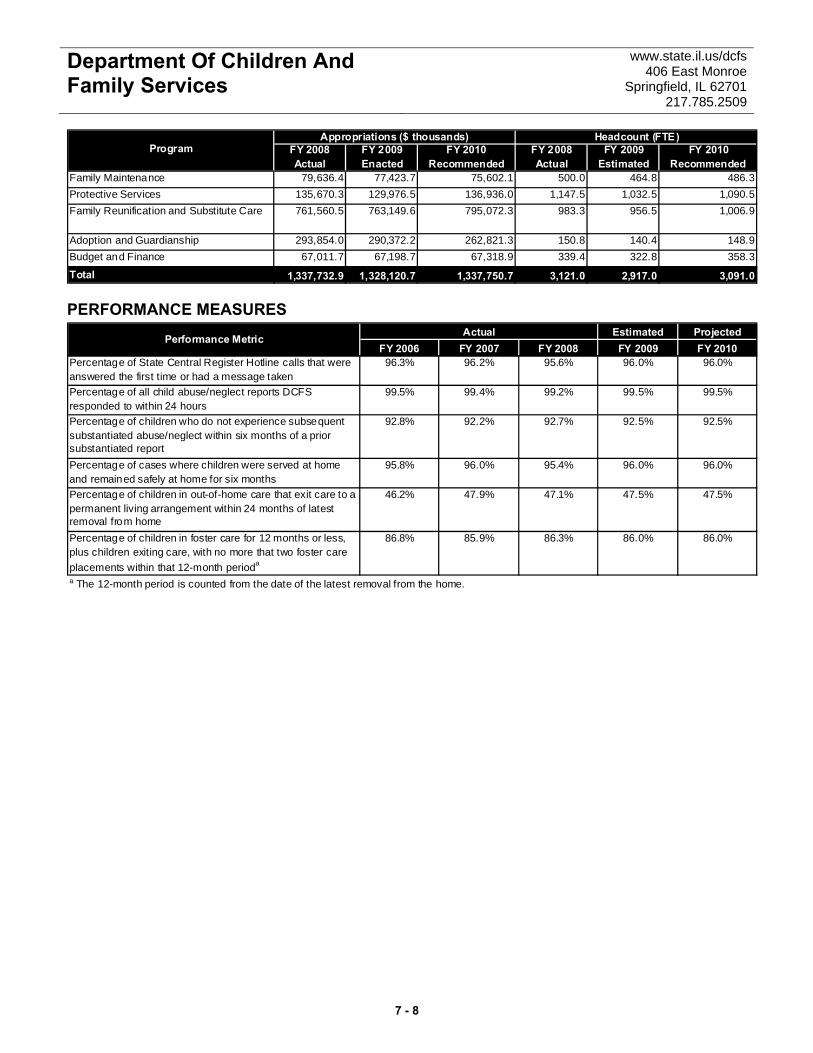
Department Of Children And Family Services
www.state.il.us/dcfs 406 East Monroe
Springfield, IL 62701 217.785.2509
Program FY 2008 FY 2009 FY 2010 FY 2008 FY 2009 FY 2010Actual Enacted Recommended Actual Estimated Recommended
Family Maintenance 79,636.4 77,423.7 75,602.1 500.0 464.8 486.3Protective Services 135,670.3 129,976.5 136,936.0 1,147.5 1,032.5 1,090.5Family Reunification and Substitute Care 761,560.5 763,149.6 795,072.3 983.3 956.5 1,006.9
Adoption and Guardianship 293,854.0 290,372.2 262,821.3 150.8 140.4 148.9Budget and Finance 67,011.7 67,198.7 67,318.9 339.4 322.8 358.3
Total 1,337,732.9 1,328,120.7 1,337,750.7 3,121.0 2,917.0 3,091.0
Appropriations ($ thousands) Headcount (FTE)
PERFORMANCE MEASURES Estimated Projected
FY 2006 FY 2007 FY 2008 FY 2009 FY 2010Percentage of State Central Register Hotline calls that were answered the first time or had a message taken
96.3% 96.2% 95.6% 96.0% 96.0%
Percentage of all child abuse/neglect reports DCFS responded to within 24 hours
99.5% 99.4% 99.2% 99.5% 99.5%
Percentage of children who do not experience subsequent substantiated abuse/neglect within six months of a prior substantiated report
92.8% 92.2% 92.7% 92.5% 92.5%
Percentage of cases where children were served at home and remained safely at home for six months
95.8% 96.0% 95.4% 96.0% 96.0%
Percentage of children in out-of-home care that exit care to a permanent living arrangement within 24 months of latest removal from home
46.2% 47.9% 47.1% 47.5% 47.5%
Percentage of children in foster care for 12 months or less, plus children exiting care, with no more that two foster care placements within that 12-month perioda
86.8% 85.9% 86.3% 86.0% 86.0%
ActualPerformance Metric
a The 12-month period is counted from the date of the latest removal from the home.
7 - 8

ActualExpenditure
EnactedAppropriation
EstimatedExpenditures
EnactedAppropriation
Fiscal Year2010
RecommendedAppropriation
Fiscal Year 2008 Fiscal Year 2009
Department Of Children AndFamily Services
www.state.il.us/dcfs406 East Monroe
Springfield, IL 62701217.785.2509
Appropriations Requiring General Assembly Action($ thousands)
GENERAL FUNDS
Total 244,128.5 242,329.6230,638.7232,156.3239,516.9Personal Services and Fringe Benefits
Total 33,719.4 32,719.433,719.433,719.432,739.3Contractual Services
Total 20,804.4 18,571.820,800.520,804.420,306.8Other Operations and Refunds
Designated Purposes120.0 120.0120.0120.0100.0Child Death Review Teams
247.2 247.2247.2247.2247.2Cook County Referral Support System
574.1 574.1574.1574.1555.4For Attorney General Representation on Child WelfareLitigation Issues
9,307.7 9,307.79,307.79,307.78,477.8Targeted Case Management
681.4 0.00.00.00.0Additional Frontline Staff *
Total 10,930.4 10,249.010,249.010,249.09,380.3Designated Purposes
Grants202,384.1 163,448.0199,584.1199,584.1202,377.3Adoption and Guardianship Services
1,432.0 1,432.01,389.01,432.01,256.1Cash Assistance and Housing Locator Services tofamilies in Class Defined in Norman Consent Order
2,069.5 2,069.52,069.52,069.52,069.5Children's Advocacy Centers
12,893.0 12,128.514,028.514,028.512,880.2Counseling and Auxiliary Services
842.5 817.2842.5842.5836.6Department Scholarship Program
189,660.0 195,025.0174,788.6174,788.8189,613.9Foster Homes and Specialized Foster Care
4,198.5 4,072.54,198.54,198.54,197.7Health Care Network
125,980.6 174,160.3128,780.6128,780.6124,545.9Institution and Group Home Care and Prevention
1,650.0 1,600.51,650.01,650.01,588.8MCO Technical Assistance and Program Development
8,671.8 3,200.23,128.33,225.08,671.7Pre-Admission/Post Discharge Psychiatric Screening
25,928.5 25,928.525,928.525,928.525,741.9Protective/Family Maintenance Day Care
3,200.0 3,273.63,137.23,200.03,045.8Psychological Assessments, Including Operations andAdministrative Expenses
338.5 338.5338.5338.5338.5Reimbursing Counties
6,812.2 6,812.26,812.26,812.26,805.9Services Associated with the Foster Care Initiative
233.8 164.9226.8233.8164.9Tort Claims
944.7 966.4944.7944.7943.7Youth in Transition Program
Total 587,239.7 595,437.8567,847.5568,057.2585,078.3Grants
TOTAL GENERAL FUNDS 896,822.4 899,307.6863,255.0864,986.3887,021.6
OTHER STATE FUNDS
Designated Purposes20,370.4 20,370.419,759.320,370.413,891.7AFCARS/SACWIS Information System
10,300.0 10,300.09,114.310,300.07,670.6Independent Living Initiative
0.0 8,100.08,100.08,100.00.0Personal Services & Related
360.0 344.016.0360.016.0Private Grants for Child Welfare Improvements
1,513.3 1,513.31,435.51,513.31,411.5SSI Reimbursement
4,128.8 4,128.83,866.54,128.83,866.5Title IV-E Reimbursement Enhancement
Total 36,672.5 44,756.542,291.644,772.526,856.4Designated Purposes
7 - 9
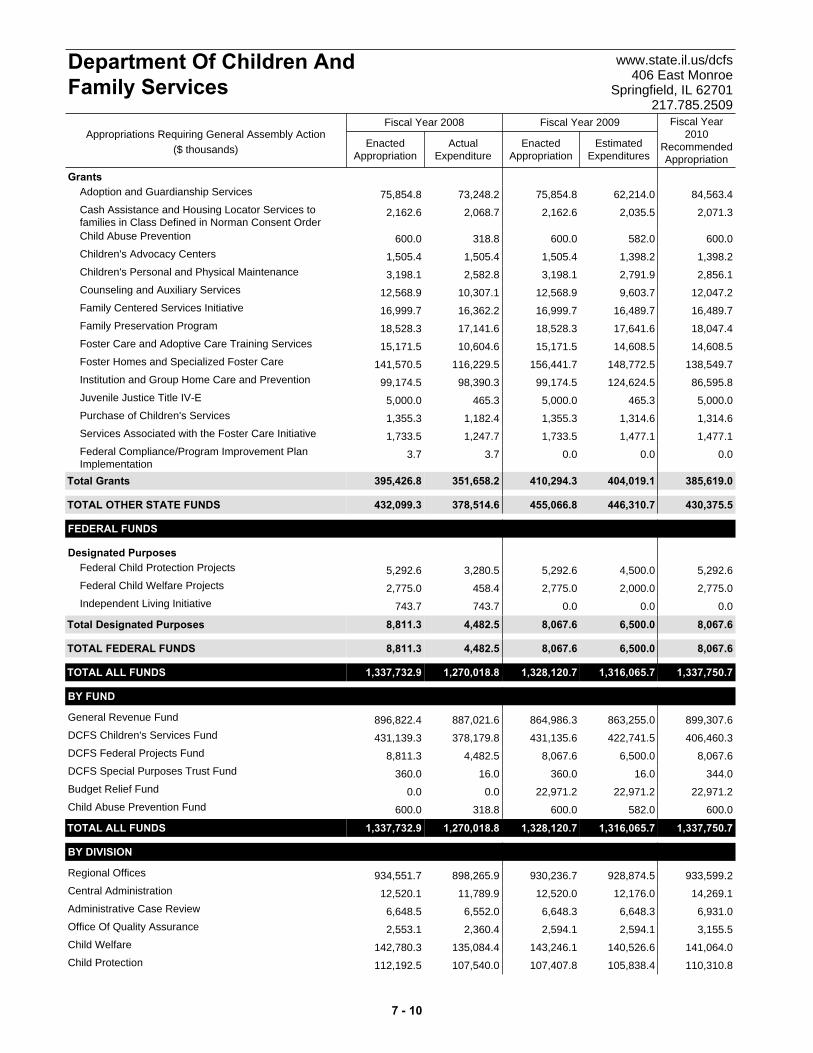
ActualExpenditure
EnactedAppropriation
EstimatedExpenditures
EnactedAppropriation
Fiscal Year2010
RecommendedAppropriation
Fiscal Year 2008 Fiscal Year 2009
Department Of Children AndFamily Services
www.state.il.us/dcfs406 East Monroe
Springfield, IL 62701217.785.2509
Appropriations Requiring General Assembly Action($ thousands)
Grants75,854.8 84,563.462,214.075,854.873,248.2Adoption and Guardianship Services
2,162.6 2,071.32,035.52,162.62,068.7Cash Assistance and Housing Locator Services tofamilies in Class Defined in Norman Consent Order
600.0 600.0582.0600.0318.8Child Abuse Prevention
1,505.4 1,398.21,398.21,505.41,505.4Children's Advocacy Centers
3,198.1 2,856.12,791.93,198.12,582.8Children's Personal and Physical Maintenance
12,568.9 12,047.29,603.712,568.910,307.1Counseling and Auxiliary Services
16,999.7 16,489.716,489.716,999.716,362.2Family Centered Services Initiative
18,528.3 18,047.417,641.618,528.317,141.6Family Preservation Program
15,171.5 14,608.514,608.515,171.510,604.6Foster Care and Adoptive Care Training Services
141,570.5 138,549.7148,772.5156,441.7116,229.5Foster Homes and Specialized Foster Care
99,174.5 86,595.8124,624.599,174.598,390.3Institution and Group Home Care and Prevention
5,000.0 5,000.0465.35,000.0465.3Juvenile Justice Title IV-E
1,355.3 1,314.61,314.61,355.31,182.4Purchase of Children's Services
1,733.5 1,477.11,477.11,733.51,247.7Services Associated with the Foster Care Initiative
3.7 0.00.00.03.7Federal Compliance/Program Improvement PlanImplementation
Total 395,426.8 385,619.0404,019.1410,294.3351,658.2Grants
TOTAL OTHER STATE FUNDS 432,099.3 430,375.5446,310.7455,066.8378,514.6
FEDERAL FUNDS
Designated Purposes5,292.6 5,292.64,500.05,292.63,280.5Federal Child Protection Projects
2,775.0 2,775.02,000.02,775.0458.4Federal Child Welfare Projects
743.7 0.00.00.0743.7Independent Living Initiative
Total 8,811.3 8,067.66,500.08,067.64,482.5Designated Purposes
TOTAL FEDERAL FUNDS 8,811.3 8,067.66,500.08,067.64,482.5
TOTAL ALL FUNDS 1,337,732.9 1,337,750.71,316,065.71,328,120.71,270,018.8
BY FUND
896,822.4 899,307.6863,255.0864,986.3887,021.6General Revenue Fund
431,139.3 406,460.3422,741.5431,135.6378,179.8DCFS Children's Services Fund
8,811.3 8,067.66,500.08,067.64,482.5DCFS Federal Projects Fund
360.0 344.016.0360.016.0DCFS Special Purposes Trust Fund
0.0 22,971.222,971.222,971.20.0Budget Relief Fund
600.0 600.0582.0600.0318.8Child Abuse Prevention Fund
TOTAL ALL FUNDS 1,337,732.9 1,337,750.71,316,065.71,328,120.71,270,018.8
BY DIVISION
934,551.7 933,599.2928,874.5930,236.7898,265.9Regional Offices
12,520.1 14,269.112,176.012,520.011,789.9Central Administration
6,648.5 6,931.06,648.36,648.36,552.0Administrative Case Review
2,553.1 3,155.52,594.12,594.12,360.4Office Of Quality Assurance
142,780.3 141,064.0140,526.6143,246.1135,084.4Child Welfare
112,192.5 110,310.8105,838.4107,407.8107,540.0Child Protection
7 - 10

ActualExpenditure
EnactedAppropriation
EstimatedExpenditures
EnactedAppropriation
Fiscal Year2010
RecommendedAppropriation
Fiscal Year 2008 Fiscal Year 2009
Department Of Children AndFamily Services
www.state.il.us/dcfs406 East Monroe
Springfield, IL 62701217.785.2509
Appropriations Requiring General Assembly Action($ thousands)
75,088.2 72,168.569,692.075,188.862,698.0Budget and Finance
19,493.6 19,307.018,930.619,493.614,711.2Clinical Services
5,294.3 5,837.45,382.05,382.05,042.6Office Of The Guardian
1,979.0 2,100.31,978.91,979.01,809.8Inspector General
24,631.6 29,007.923,424.423,424.424,164.5Purchase Of Service Monitoring
TOTAL ALL DIVISIONS 1,337,732.9 1,337,750.71,316,065.71,328,120.71,270,018.8
HEADCOUNT BY DIVISION Actual Estimated Authorized
6.0 8.08.0Regional Offices
106.5 123.599.5Central Administration
71.0 75.071.0Administrative Case Review
26.0 30.026.0Office Of Quality Assurance
1,376.0 1,390.01,332.0Child Welfare
902.0 839.0836.0Child Protection
189.0 179.0174.0Budget and Finance
55.0 42.039.0Clinical Services
46.0 53.053.0Office Of The Guardian
17.5 17.517.5Inspector General
326.0 334.0261.0Purchase Of Service Monitoring
TOTAL HEADCOUNT 3,121.0 3,091.02,917.0 t
7 - 11
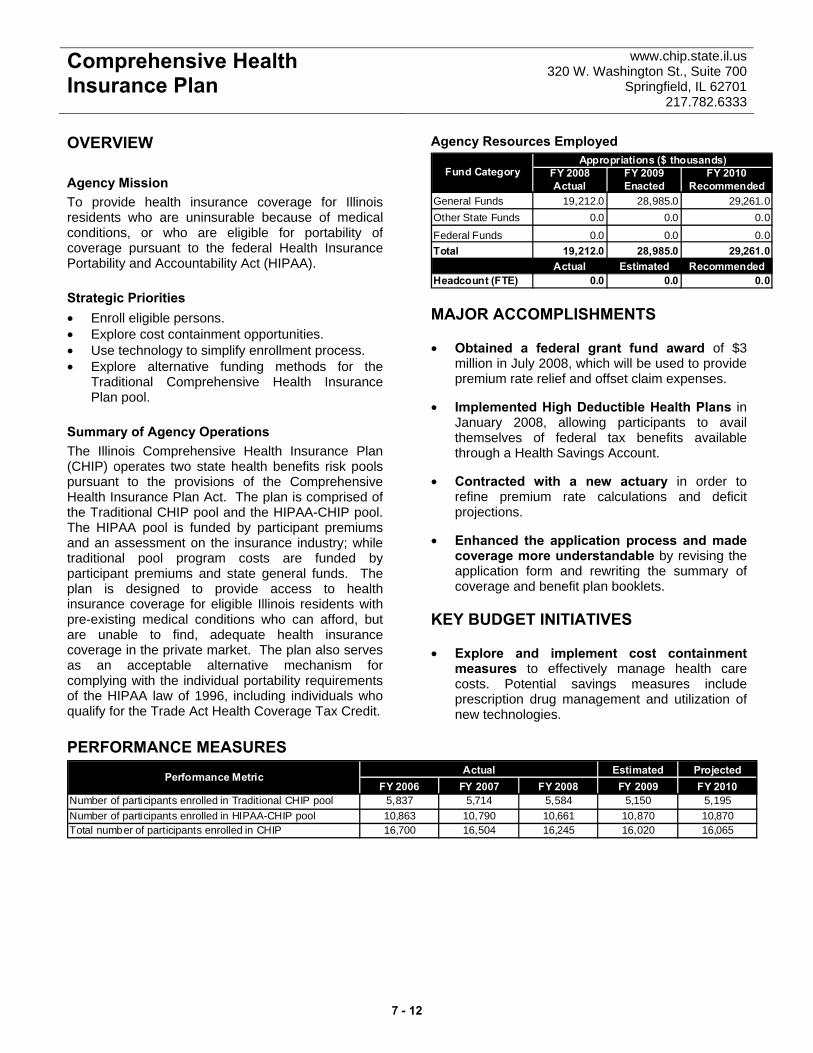
Comprehensive Health Insurance Plan
www.chip.state.il.us 320 W. Washington St., Suite 700
Springfield, IL 62701 217.782.6333
OVERVIEW Agency Mission To provide health insurance coverage for Illinois residents who are uninsurable because of medical conditions, or who are eligible for portability of coverage pursuant to the federal Health Insurance Portability and Accountability Act (HIPAA). Strategic Priorities • Enroll eligible persons. • Explore cost containment opportunities. • Use technology to simplify enrollment process. • Explore alternative funding methods for the
Traditional Comprehensive Health Insurance Plan pool.
Summary of Agency Operations The Illinois Comprehensive Health Insurance Plan (CHIP) operates two state health benefits risk pools pursuant to the provisions of the Comprehensive Health Insurance Plan Act. The plan is comprised of the Traditional CHIP pool and the HIPAA-CHIP pool. The HIPAA pool is funded by participant premiums and an assessment on the insurance industry; while traditional pool program costs are funded by participant premiums and state general funds. The plan is designed to provide access to health insurance coverage for eligible Illinois residents with pre-existing medical conditions who can afford, but are unable to find, adequate health insurance coverage in the private market. The plan also serves as an acceptable alternative mechanism for complying with the individual portability requirements of the HIPAA law of 1996, including individuals who qualify for the Trade Act Health Coverage Tax Credit.
Agency Resources Employed
FY 2008 FY 2009 FY 2010Actual Enacted Recommended
General Funds 19,212.0 28,985.0 29,261.0Other State Funds 0.0 0.0 0.0
Federal Funds 0.0 0.0 0.0Total 19,212.0 28,985.0 29,261.0
Actual Estimated RecommendedHeadcount (FTE) 0.0 0.0 0.0
Appropriations ($ thousands)Fund Category
MAJOR ACCOMPLISHMENTS • Obtained a federal grant fund award of $3
million in July 2008, which will be used to provide premium rate relief and offset claim expenses.
• Implemented High Deductible Health Plans in
January 2008, allowing participants to avail themselves of federal tax benefits available through a Health Savings Account.
• Contracted with a new actuary in order to
refine premium rate calculations and deficit projections.
• Enhanced the application process and made
coverage more understandable by revising the application form and rewriting the summary of coverage and benefit plan booklets.
KEY BUDGET INITIATIVES • Explore and implement cost containment
measures to effectively manage health care costs. Potential savings measures include prescription drug management and utilization of new technologies.
PERFORMANCE MEASURES Estimated Projected
FY 2006 FY 2007 FY 2008 FY 2009 FY 2010Number of participants enrolled in Traditional CHIP pool 5,837 5,714 5,584 5,150 5,195Number of participants enrolled in HIPAA-CHIP pool 10,863 10,790 10,661 10,870 10,870Total number of participants enrolled in CHIP 16,700 16,504 16,245 16,020 16,065
ActualPerformance Metric
7 - 12
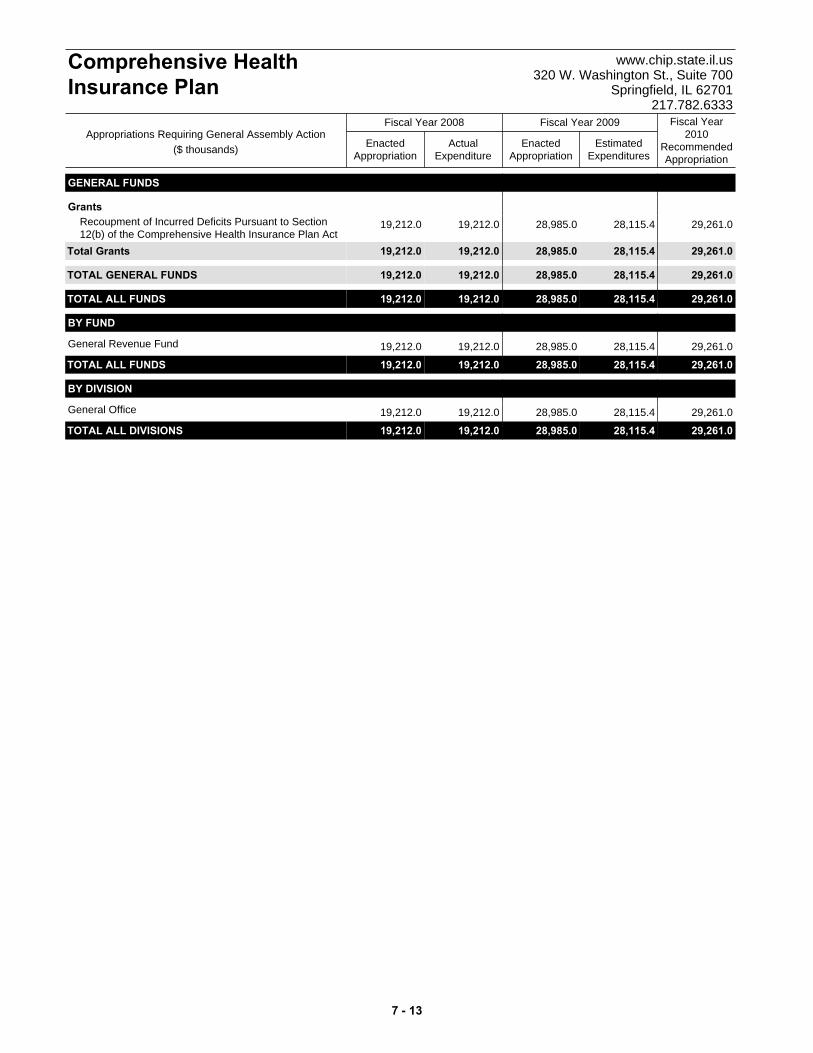
GENERAL FUNDS
Grants19,212.0 29,261.028,115.428,985.019,212.0Recoupment of Incurred Deficits Pursuant to Section
12(b) of the Comprehensive Health Insurance Plan ActTotal 19,212.0 29,261.028,115.428,985.019,212.0Grants
TOTAL GENERAL FUNDS 19,212.0 29,261.028,115.428,985.019,212.0
TOTAL ALL FUNDS 19,212.0 29,261.028,115.428,985.019,212.0
BY FUND
19,212.0 29,261.028,115.428,985.019,212.0General Revenue Fund
TOTAL ALL FUNDS 19,212.0 29,261.028,115.428,985.019,212.0
BY DIVISION
19,212.0 29,261.028,115.428,985.019,212.0General Office
TOTAL ALL DIVISIONS 19,212.0 29,261.028,115.428,985.019,212.0
ActualExpenditure
EnactedAppropriation
EstimatedExpenditures
EnactedAppropriation
Fiscal Year2010
RecommendedAppropriation
Fiscal Year 2008 Fiscal Year 2009
Comprehensive HealthInsurance Plan
www.chip.state.il.us320 W. Washington St., Suite 700
Springfield, IL 62701217.782.6333
Appropriations Requiring General Assembly Action($ thousands)
7 - 13
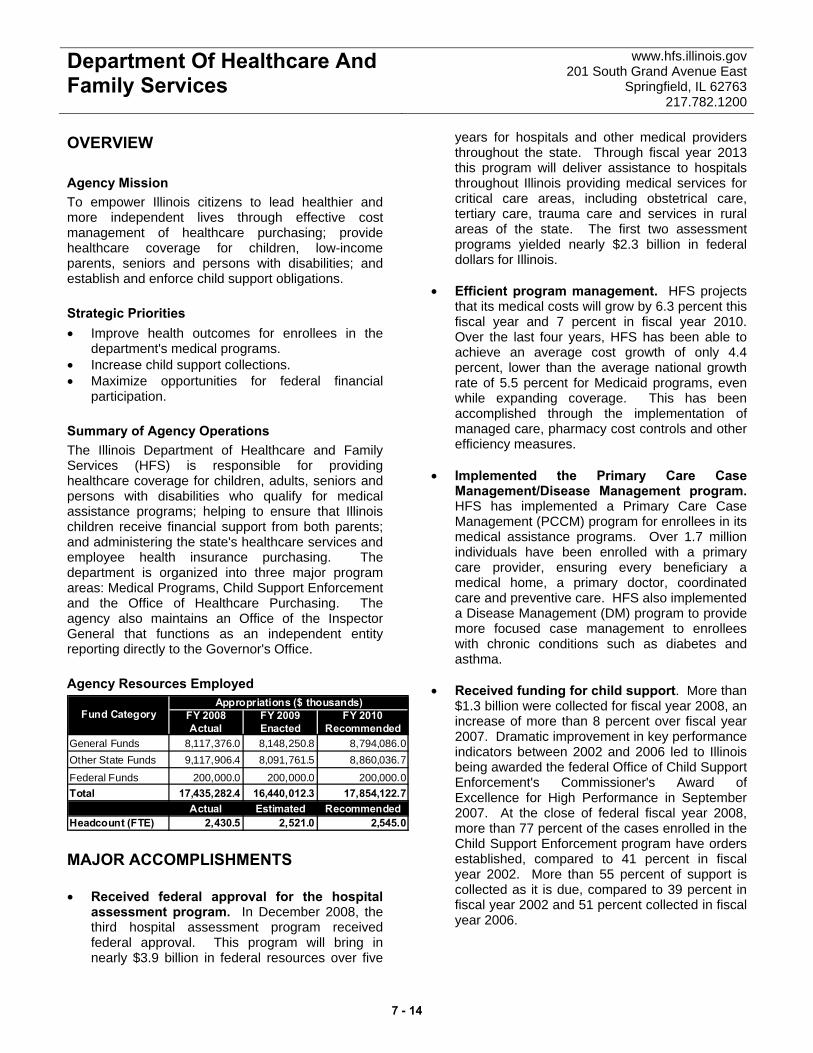
Department Of Healthcare And Family Services
www.hfs.illinois.gov 201 South Grand Avenue East
Springfield, IL 62763 217.782.1200
OVERVIEW Agency Mission To empower Illinois citizens to lead healthier and more independent lives through effective cost management of healthcare purchasing; provide healthcare coverage for children, low-income parents, seniors and persons with disabilities; and establish and enforce child support obligations. Strategic Priorities • Improve health outcomes for enrollees in the
department's medical programs. • Increase child support collections. • Maximize opportunities for federal financial
participation. Summary of Agency Operations The Illinois Department of Healthcare and Family Services (HFS) is responsible for providing healthcare coverage for children, adults, seniors and persons with disabilities who qualify for medical assistance programs; helping to ensure that Illinois children receive financial support from both parents; and administering the state's healthcare services and employee health insurance purchasing. The department is organized into three major program areas: Medical Programs, Child Support Enforcement and the Office of Healthcare Purchasing. The agency also maintains an Office of the Inspector General that functions as an independent entity reporting directly to the Governor's Office. Agency Resources Employed
FY 2008 FY 2009 FY 2010Actual Enacted Recommended
General Funds 8,117,376.0 8,148,250.8 8,794,086.0Other State Funds 9,117,906.4 8,091,761.5 8,860,036.7
Federal Funds 200,000.0 200,000.0 200,000.0Total 17,435,282.4 16,440,012.3 17,854,122.7
Actual Estimated RecommendedHeadcount (FTE) 2,430.5 2,521.0 2,545.0
Appropriations ($ thousands)Fund Category
MAJOR ACCOMPLISHMENTS • Received federal approval for the hospital
assessment program. In December 2008, the third hospital assessment program received federal approval. This program will bring in nearly $3.9 billion in federal resources over five
years for hospitals and other medical providers throughout the state. Through fiscal year 2013 this program will deliver assistance to hospitals throughout Illinois providing medical services for critical care areas, including obstetrical care, tertiary care, trauma care and services in rural areas of the state. The first two assessment programs yielded nearly $2.3 billion in federal dollars for Illinois.
• Efficient program management. HFS projects
that its medical costs will grow by 6.3 percent this fiscal year and 7 percent in fiscal year 2010. Over the last four years, HFS has been able to achieve an average cost growth of only 4.4 percent, lower than the average national growth rate of 5.5 percent for Medicaid programs, even while expanding coverage. This has been accomplished through the implementation of managed care, pharmacy cost controls and other efficiency measures.
• Implemented the Primary Care Case
Management/Disease Management program. HFS has implemented a Primary Care Case Management (PCCM) program for enrollees in its medical assistance programs. Over 1.7 million individuals have been enrolled with a primary care provider, ensuring every beneficiary a medical home, a primary doctor, coordinated care and preventive care. HFS also implemented a Disease Management (DM) program to provide more focused case management to enrollees with chronic conditions such as diabetes and asthma.
• Received funding for child support. More than
$1.3 billion were collected for fiscal year 2008, an increase of more than 8 percent over fiscal year 2007. Dramatic improvement in key performance indicators between 2002 and 2006 led to Illinois being awarded the federal Office of Child Support Enforcement's Commissioner's Award of Excellence for High Performance in September 2007. At the close of federal fiscal year 2008, more than 77 percent of the cases enrolled in the Child Support Enforcement program have orders established, compared to 41 percent in fiscal year 2002. More than 55 percent of support is collected as it is due, compared to 39 percent in fiscal year 2002 and 51 percent collected in fiscal year 2006.
7 - 14
Department Of Healthcare And Family Services
www.hfs.illinois.gov 201 South Grand Avenue East
Springfield, IL 62763 217.782.1200
KEY BUDGET INITIATIVES • Federal recovery. On February 17, 2009, the
president signed the American Recovery and Reinvestment Act of 2009 into law. Among other actions, this law increased the federal matching rate for Illinois’ Medicaid program from 50.32 percent to 60.48 percent for 27 months, starting October 1, 2008. The estimated benefit to Illinois is $2.9 billion across all Medicaid spending and funds. The state is required to maintain payment times for practitioners at 30 days and reduce payment times for hospitals and nursing homes to 30 days by June 1, 2009, in order to take full advantage of the bonus.
• Reduce employee heathcare cost. As the state
faces a challenging fiscal year, the governor proposes to require both employees and retirees to bear a greater share of the state’s ever increasing cost of providing healthcare coverage. The employee subsidy would be limited to the subsidy provided to state employees enrolled in managed care. The retiree subsidy would be limited to the subsidy provided to retirees enrolled in Medicare.
• Develop health information technology. The
development of a state-level health information exchange (HIE) of claims and clinical data will provide a powerful tool to improve healthcare quality for patients in Illinois. A state-level HIE will help reduce medical errors, increase care coordination and control healthcare costs. HFS will be a leading partner in a multi-agency effort to promote a sustainable HIE and build upon the best practices and lessons learned from the department's fiscal year 2009 HIE planning grants program. HFS will work with providers and other healthcare stakeholders throughout Illinois to ensure that the state strategy is consistent with the objectives outlined in the American Reinvestment and Recovery Act's health information technology initiatives, and help coordinate efforts to maximize federal investment in Illinois.
PROGRAMS Medical Assistance The Division of Medical Programs operates all medical programs covered under statutory provisions of the Illinois Public Aid Code: the Children's Health
Insurance Program Act, the Covering ALL KIDS Health Insurance Act, as well as Titles XIX and XXI of the federal Social Security Act. Medical Assistance includes physician, dental, durable medical equipment, hospital, pharmacy, long-term care residential, residential home and community-based services for seniors and persons with physical disabilities, transportation and other comprehensive medical services. Medical assistance programs, including Medicaid, All Kids, FamilyCare, Health Benefits for Persons with Breast and Cervical Cancer, Health Benefits for Workers with Disabilities and Illinois Cares Rx, provide health benefits for more than 2.4 million Illinois residents on a monthly basis. More than 1.4 million Illinois children are currently enrolled in All Kids, and nearly 200,000 Illinois seniors and persons with disabilities are receiving drug benefits through the Illinois Cares Rx Program. The medical assistance programs consist of a network of nearly 60,000 medical providers and cover approximately 50 percent of Illinois births. The programs account for almost one-fifth of all healthcare spending in Illinois. Child Support Enforcement The Division of Child Support Enforcement (DCSE) provides a wide range of legal support, collection and referral services to custodial parents and caretakers regardless of family income. DCSE also provides services to non-custodial parents, including job training referrals and a program to assist low-income non-custodial parents in reducing arrearages. DCSE coordinates child support enforcement activities with federal agencies and other state, county and municipal organizations. Office of the Inspector General The Office of the Inspector General (OIG) is responsible for all program integrity activities for the department. The OIG's duties include Medicaid fraud prevention and detection, employee and contractor misconduct investigations, medical quality of care reviews, medical provider audits and sanctions, recipient investigations, and physical security operations for department locations. Office of Healthcare Purchasing The Office of Healthcare Purchasing (OHP) is responsible for procurement of healthcare services for state government outside the department's medical assistance programs. This office reviews healthcare services previously procured through the Departments of Central Management Services, Corrections, Human Services and Veterans' Affairs.
7 - 15

Department Of Healthcare And Family Services
www.hfs.illinois.gov 201 South Grand Avenue East
Springfield, IL 62763 217.782.1200
Program FY 2008 FY 2009 FY 2010 FY 2008 FY 2009 FY 2010Actual Enacted Recommended Actual Estimated Recommended
Medical Assistance 13,955,611.9 12,956,589.6 14,211,790.8 213.0 234.0 234.0Office of Healthcare Purchasing 3,073,992.4 3,078,428.8 3,254,320.4 21.0 21.0 21.0Child Support Enforcement 230,637.1 230,631.4 217,380.9 1,017.5 1,066.0 1,079.0Office of Inspector General 20,233.7 19,335.8 20,345.8 197.0 198.0 198.0Cost Recoveries 40,226.0 40,413.8 38,224.5 120.0 135.0 135.0Administration 114,581.4 114,612.9 112,060.3 862.0 867.0 878.0
Total 17,435,282.4 16,440,012.3 17,854,122.7 2,430.5 2,521.0 2,545.0
Appropriations ($ thousands) Headcount (FTE)
PERFORMANCE MEASURES Estimated Projected
FY 2006 FY 2007 FY 2008 FY 2009 FY 2010All Kids enrollmenta 1,218,813 1,368,222 1,458,460 1,490,000 1,550,000Adults with disabilities enrolled in Medical Assistance Programs
236,641 238,294 243,642 240,500 241,000
Adults without disabilities enrolled in Medical Assistance Programs
468,891 496,414 527,871 534,000 537,000
Seniors enrolled in Medical Assistance Programs 149,479 153,492 158,189 158,000 160,000Percent of Child Support children with paternity established 59.0% 66.3% 62.7% 66.0% 68.0%
Percent of Child Support cases paying towards arrearages 50.0% 50.7% 55.3% 57.5% 59.7%
Percentage of Child Support cases with support orders established
59.3% 73.3% 75.5% 77.5% 79.0%
Current Child Support collected as a percent of current support due
51.3% 52.2% 54.4% 56.6% 58.3%
Total Child Support collected ($ millions) 1,145.0 1,224.2 1,327.9 1,366.4 1,407.4Supportive Living enrollment 4,624 5,699 7,057 9,600 10,980
ActualPerformance Metric
a All Kids offers health care coverage to qual ified recipients at all income levels. It includes all recipients previously eligible under Medicaid and KidCare. Historial data has been restated to include changes in el igibility and as well as provider claims submitted since fiscal year 2009 Budget Book publication (providers have up to one year to submit their claims).
7 - 16
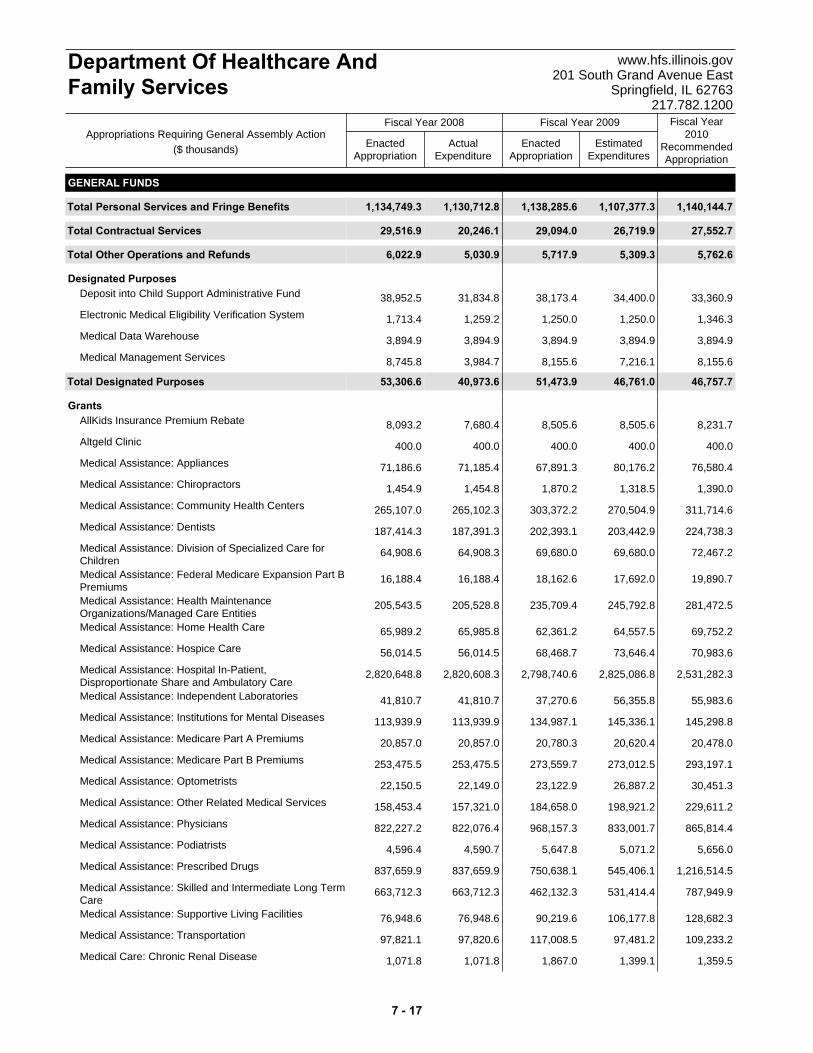
ActualExpenditure
EnactedAppropriation
EstimatedExpenditures
EnactedAppropriation
Fiscal Year2010
RecommendedAppropriation
Fiscal Year 2008 Fiscal Year 2009
Department Of Healthcare AndFamily Services
www.hfs.illinois.gov201 South Grand Avenue East
Springfield, IL 62763217.782.1200
Appropriations Requiring General Assembly Action($ thousands)
GENERAL FUNDS
Total 1,134,749.3 1,140,144.71,107,377.31,138,285.61,130,712.8Personal Services and Fringe Benefits
Total 29,516.9 27,552.726,719.929,094.020,246.1Contractual Services
Total 6,022.9 5,762.65,309.35,717.95,030.9Other Operations and Refunds
Designated Purposes
38,952.5 33,360.934,400.038,173.431,834.8Deposit into Child Support Administrative Fund
1,713.4 1,346.31,250.01,250.01,259.2Electronic Medical Eligibility Verification System
3,894.9 3,894.93,894.93,894.93,894.9Medical Data Warehouse
8,745.8 8,155.67,216.18,155.63,984.7Medical Management Services
Total 53,306.6 46,757.746,761.051,473.940,973.6Designated Purposes
Grants
8,093.2 8,231.78,505.68,505.67,680.4AllKids Insurance Premium Rebate
400.0 400.0400.0400.0400.0Altgeld Clinic
71,186.6 76,580.480,176.267,891.371,185.4Medical Assistance: Appliances
1,454.9 1,390.01,318.51,870.21,454.8Medical Assistance: Chiropractors
265,107.0 311,714.6270,504.9303,372.2265,102.3Medical Assistance: Community Health Centers
187,414.3 224,738.3203,442.9202,393.1187,391.3Medical Assistance: Dentists
64,908.6 72,467.269,680.069,680.064,908.3Medical Assistance: Division of Specialized Care forChildren
16,188.4 19,890.717,692.018,162.616,188.4Medical Assistance: Federal Medicare Expansion Part BPremiums
205,543.5 281,472.5245,792.8235,709.4205,528.8Medical Assistance: Health MaintenanceOrganizations/Managed Care Entities
65,989.2 69,752.264,557.562,361.265,985.8Medical Assistance: Home Health Care
56,014.5 70,983.673,646.468,468.756,014.5Medical Assistance: Hospice Care
2,820,648.8 2,531,282.32,825,086.82,798,740.62,820,608.3Medical Assistance: Hospital In-Patient,Disproportionate Share and Ambulatory Care
41,810.7 55,983.656,355.837,270.641,810.7Medical Assistance: Independent Laboratories
113,939.9 145,298.8145,336.1134,987.1113,939.9Medical Assistance: Institutions for Mental Diseases
20,857.0 20,478.020,620.420,780.320,857.0Medical Assistance: Medicare Part A Premiums
253,475.5 293,197.1273,012.5273,559.7253,475.5Medical Assistance: Medicare Part B Premiums
22,150.5 30,451.326,887.223,122.922,149.0Medical Assistance: Optometrists
158,453.4 229,611.2198,921.2184,658.0157,321.0Medical Assistance: Other Related Medical Services
822,227.2 865,814.4833,001.7968,157.3822,076.4Medical Assistance: Physicians
4,596.4 5,656.05,071.25,647.84,590.7Medical Assistance: Podiatrists
837,659.9 1,216,514.5545,406.1750,638.1837,659.9Medical Assistance: Prescribed Drugs
663,712.3 787,949.9531,414.4462,132.3663,712.3Medical Assistance: Skilled and Intermediate Long TermCare
76,948.6 128,682.3106,177.890,219.676,948.6Medical Assistance: Supportive Living Facilities
97,821.1 109,233.297,481.2117,008.597,820.6Medical Assistance: Transportation
1,071.8 1,359.51,399.11,867.01,071.8Medical Care: Chronic Renal Disease
7 - 17

ActualExpenditure
EnactedAppropriation
EstimatedExpenditures
EnactedAppropriation
Fiscal Year2010
RecommendedAppropriation
Fiscal Year 2008 Fiscal Year 2009
Department Of Healthcare AndFamily Services
www.hfs.illinois.gov201 South Grand Avenue East
Springfield, IL 62763217.782.1200
Appropriations Requiring General Assembly Action($ thousands)
11,903.7 12,732.012,005.913,374.711,822.8Medical Care: Hemophilia
1,703.4 2,003.01,574.82,200.61,693.7Medical Care: Sexual Assault Victims
500.0 0.0500.0500.0500.0Gilead Outreach and Referral Center
2,000.0 0.00.00.02,000.0Oak Forest Hospital
Total 6,893,780.3 7,573,868.36,715,969.06,923,679.46,891,898.1Grants
TOTAL GENERAL FUNDS 8,117,376.0 8,794,086.07,902,136.58,148,250.88,088,861.4
OTHER STATE FUNDS
Total 240,569.9 253,695.9245,840.0248,272.9227,748.2Personal Services and Fringe Benefits
Total 89,330.9 87,217.687,922.691,350.067,366.9Contractual Services
Total 18,097.6 17,942.217,376.718,423.25,281.5Other Operations and Refunds
Designated Purposes
1,500.0 1,500.01,500.01,500.0714.3Access and Utilization of Department Eligibility Files toVerify Eligibility
13,058.7 10,900.010,726.911,058.79,416.7Administrative Costs Related to Enhanced CollectionEfforts
94.5 130.9129.1129.161.5Care Provider Fund for Persons with a DevelopmentalDisability-Administration
1,400.0 1,000.0700.01,000.0678.4Child Support Enforcement Demonstration Projects
6,400.0 6,400.06,400.06,400.06,400.0Deposit into Medical Research and Development Fund
6,400.0 6,400.06,400.06,400.06,400.0Deposit into Post-Tertiary Clinical Services Fund
500.0 500.0500.0500.00.0Hospitals-Administration
8,673.3 10,000.09,787.79,787.74,836.0Medical Demonstration Projects and Federal HIPAACompliance Efforts
2,282.6 2,335.82,308.92,308.91,043.2Skilled and Intermediate Long Term Care-Administration
16,159.4 12,643.216,643.216,643.215,414.6State Disbursement Unit (SDU)
1,000.0 0.00.00.01,000.0Deposit into Independent Academic Medical CenterFund
350.0 0.00.00.00.0Expenses related to the Illinois Prescription DrugDiscount Program
Total 57,818.5 51,809.955,095.855,727.645,964.7Designated Purposes
Grants
0.0 11,000.011,000.011,000.00.0Costs in Support of a Federally-Approved MoneyFollows the Person (MFP) Demonstration Project
1,981,119.0 1,981,119.01,981,119.01,981,119.01,282,129.2County Hospital Services
8,500.0 8,500.08,500.08,500.0943.4Court-Ordered Juvenile Behavioral HealthServices-Medicaid Rehab Option
40,000.0 40,000.040,000.040,000.030,820.6FamilyCare Program
0.0 20,000.00.00.00.0Federal Recovery - Health Information Technology
300.0 300.0300.0300.0200.4Health Benefits for Workers with Disabilities (HBWD) /Medicaid Buy-In Program
2,430,400.0 2,231,687.11,550,000.01,550,000.02,409,489.2Medical Assistance: Hospital In-Patient,Disproportionate Share and Ambulatory Care
0.0 87,668.70.00.00.0Medical Assistance: Physicians
1,102,000.0 667,972.1924,353.81,000,600.0854,660.5Medical Assistance: Prescribed Drugs
7 - 18
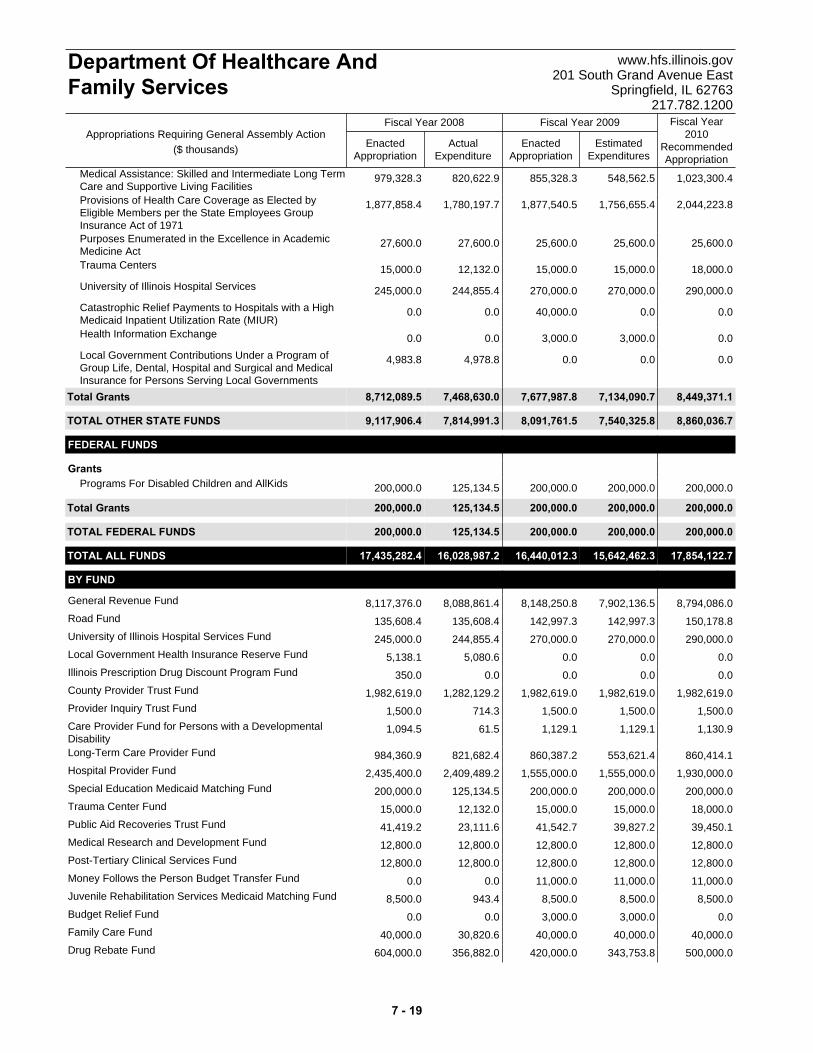
ActualExpenditure
EnactedAppropriation
EstimatedExpenditures
EnactedAppropriation
Fiscal Year2010
RecommendedAppropriation
Fiscal Year 2008 Fiscal Year 2009
Department Of Healthcare AndFamily Services
www.hfs.illinois.gov201 South Grand Avenue East
Springfield, IL 62763217.782.1200
Appropriations Requiring General Assembly Action($ thousands)
979,328.3 1,023,300.4548,562.5855,328.3820,622.9Medical Assistance: Skilled and Intermediate Long TermCare and Supportive Living Facilities
1,877,858.4 2,044,223.81,756,655.41,877,540.51,780,197.7Provisions of Health Care Coverage as Elected byEligible Members per the State Employees GroupInsurance Act of 1971
27,600.0 25,600.025,600.025,600.027,600.0Purposes Enumerated in the Excellence in AcademicMedicine Act
15,000.0 18,000.015,000.015,000.012,132.0Trauma Centers
245,000.0 290,000.0270,000.0270,000.0244,855.4University of Illinois Hospital Services
0.0 0.00.040,000.00.0Catastrophic Relief Payments to Hospitals with a HighMedicaid Inpatient Utilization Rate (MIUR)
0.0 0.03,000.03,000.00.0Health Information Exchange
4,983.8 0.00.00.04,978.8Local Government Contributions Under a Program ofGroup Life, Dental, Hospital and Surgical and MedicalInsurance for Persons Serving Local Governments
Total 8,712,089.5 8,449,371.17,134,090.77,677,987.87,468,630.0Grants
TOTAL OTHER STATE FUNDS 9,117,906.4 8,860,036.77,540,325.88,091,761.57,814,991.3
FEDERAL FUNDS
Grants
200,000.0 200,000.0200,000.0200,000.0125,134.5Programs For Disabled Children and AllKids
Total 200,000.0 200,000.0200,000.0200,000.0125,134.5Grants
TOTAL FEDERAL FUNDS 200,000.0 200,000.0200,000.0200,000.0125,134.5
TOTAL ALL FUNDS 17,435,282.4 17,854,122.715,642,462.316,440,012.316,028,987.2
BY FUND
8,117,376.0 8,794,086.07,902,136.58,148,250.88,088,861.4General Revenue Fund
135,608.4 150,178.8142,997.3142,997.3135,608.4Road Fund
245,000.0 290,000.0270,000.0270,000.0244,855.4University of Illinois Hospital Services Fund
5,138.1 0.00.00.05,080.6Local Government Health Insurance Reserve Fund
350.0 0.00.00.00.0Illinois Prescription Drug Discount Program Fund
1,982,619.0 1,982,619.01,982,619.01,982,619.01,282,129.2County Provider Trust Fund
1,500.0 1,500.01,500.01,500.0714.3Provider Inquiry Trust Fund
1,094.5 1,130.91,129.11,129.161.5Care Provider Fund for Persons with a DevelopmentalDisability
984,360.9 860,414.1553,621.4860,387.2821,682.4Long-Term Care Provider Fund
2,435,400.0 1,930,000.01,555,000.01,555,000.02,409,489.2Hospital Provider Fund
200,000.0 200,000.0200,000.0200,000.0125,134.5Special Education Medicaid Matching Fund
15,000.0 18,000.015,000.015,000.012,132.0Trauma Center Fund
41,419.2 39,450.139,827.241,542.723,111.6Public Aid Recoveries Trust Fund
12,800.0 12,800.012,800.012,800.012,800.0Medical Research and Development Fund
12,800.0 12,800.012,800.012,800.012,800.0Post-Tertiary Clinical Services Fund
0.0 11,000.011,000.011,000.00.0Money Follows the Person Budget Transfer Fund
8,500.0 8,500.08,500.08,500.0943.4Juvenile Rehabilitation Services Medicaid Matching Fund
0.0 0.03,000.03,000.00.0Budget Relief Fund
40,000.0 40,000.040,000.040,000.030,820.6Family Care Fund
604,000.0 500,000.0343,753.8420,000.0356,882.0Drug Rebate Fund
7 - 19
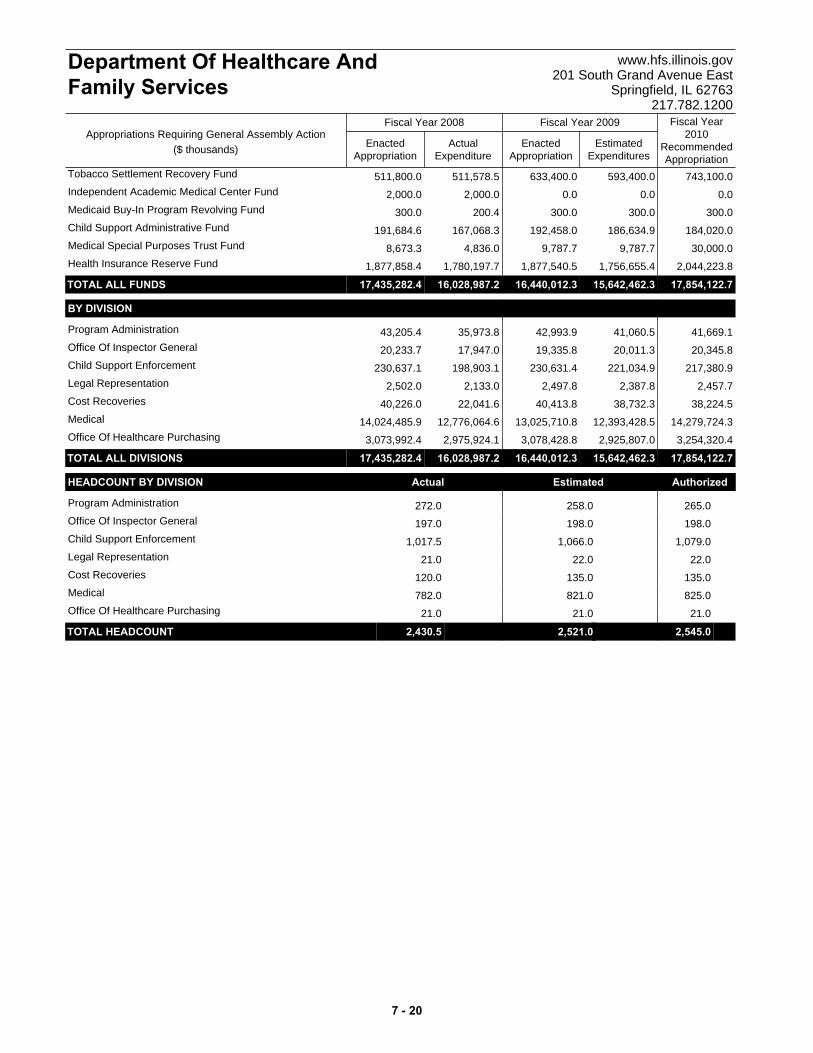
ActualExpenditure
EnactedAppropriation
EstimatedExpenditures
EnactedAppropriation
Fiscal Year2010
RecommendedAppropriation
Fiscal Year 2008 Fiscal Year 2009
Department Of Healthcare AndFamily Services
www.hfs.illinois.gov201 South Grand Avenue East
Springfield, IL 62763217.782.1200
Appropriations Requiring General Assembly Action($ thousands)
511,800.0 743,100.0593,400.0633,400.0511,578.5Tobacco Settlement Recovery Fund
2,000.0 0.00.00.02,000.0Independent Academic Medical Center Fund
300.0 300.0300.0300.0200.4Medicaid Buy-In Program Revolving Fund
191,684.6 184,020.0186,634.9192,458.0167,068.3Child Support Administrative Fund
8,673.3 30,000.09,787.79,787.74,836.0Medical Special Purposes Trust Fund
1,877,858.4 2,044,223.81,756,655.41,877,540.51,780,197.7Health Insurance Reserve Fund
TOTAL ALL FUNDS 17,435,282.4 17,854,122.715,642,462.316,440,012.316,028,987.2
BY DIVISION
43,205.4 41,669.141,060.542,993.935,973.8Program Administration
20,233.7 20,345.820,011.319,335.817,947.0Office Of Inspector General
230,637.1 217,380.9221,034.9230,631.4198,903.1Child Support Enforcement
2,502.0 2,457.72,387.82,497.82,133.0Legal Representation
40,226.0 38,224.538,732.340,413.822,041.6Cost Recoveries
14,024,485.9 14,279,724.312,393,428.513,025,710.812,776,064.6Medical
3,073,992.4 3,254,320.42,925,807.03,078,428.82,975,924.1Office Of Healthcare Purchasing
TOTAL ALL DIVISIONS 17,435,282.4 17,854,122.715,642,462.316,440,012.316,028,987.2
HEADCOUNT BY DIVISION Actual Estimated Authorized
272.0 265.0258.0Program Administration
197.0 198.0198.0Office Of Inspector General
1,017.5 1,079.01,066.0Child Support Enforcement
21.0 22.022.0Legal Representation
120.0 135.0135.0Cost Recoveries
782.0 825.0821.0Medical
21.0 21.021.0Office Of Healthcare Purchasing
TOTAL HEADCOUNT 2,430.5 2,545.02,521.0 t
7 - 20
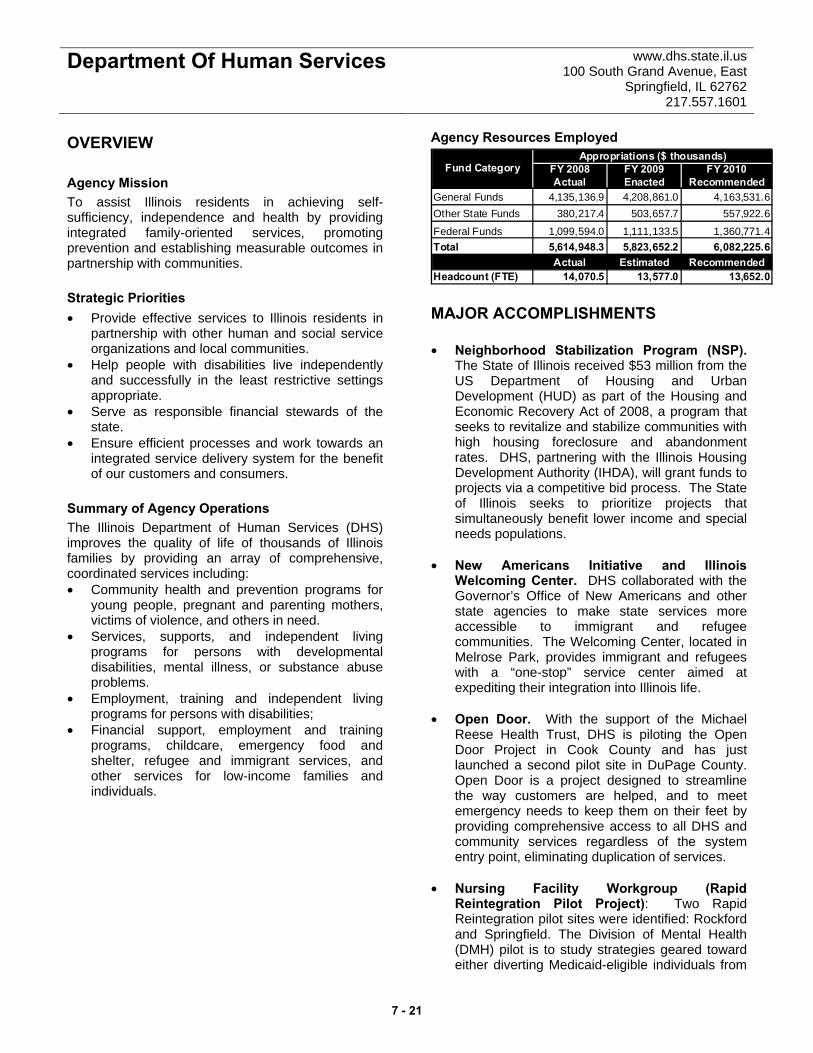
Department Of Human Services www.dhs.state.il.us 100 South Grand Avenue, East
Springfield, IL 62762 217.557.1601
OVERVIEW Agency Mission To assist Illinois residents in achieving self-sufficiency, independence and health by providing integrated family-oriented services, promoting prevention and establishing measurable outcomes in partnership with communities. Strategic Priorities • Provide effective services to Illinois residents in
partnership with other human and social service organizations and local communities.
• Help people with disabilities live independently and successfully in the least restrictive settings appropriate.
• Serve as responsible financial stewards of the state.
• Ensure efficient processes and work towards an integrated service delivery system for the benefit of our customers and consumers.
Summary of Agency Operations The Illinois Department of Human Services (DHS) improves the quality of life of thousands of Illinois families by providing an array of comprehensive, coordinated services including: • Community health and prevention programs for
young people, pregnant and parenting mothers, victims of violence, and others in need.
• Services, supports, and independent living programs for persons with developmental disabilities, mental illness, or substance abuse problems.
• Employment, training and independent living programs for persons with disabilities;
• Financial support, employment and training programs, childcare, emergency food and shelter, refugee and immigrant services, and other services for low-income families and individuals.
Agency Resources Employed
FY 2008 FY 2009 FY 2010Actual Enacted Recommended
General Funds 4,135,136.9 4,208,861.0 4,163,531.6Other State Funds 380,217.4 503,657.7 557,922.6
Federal Funds 1,099,594.0 1,111,133.5 1,360,771.4Total 5,614,948.3 5,823,652.2 6,082,225.6
Actual Estimated RecommendedHeadcount (FTE) 14,070.5 13,577.0 13,652.0
Appropriations ($ thousands)Fund Category
MAJOR ACCOMPLISHMENTS • Neighborhood Stabilization Program (NSP).
The State of Illinois received $53 million from the US Department of Housing and Urban Development (HUD) as part of the Housing and Economic Recovery Act of 2008, a program that seeks to revitalize and stabilize communities with high housing foreclosure and abandonment rates. DHS, partnering with the Illinois Housing Development Authority (IHDA), will grant funds to projects via a competitive bid process. The State of Illinois seeks to prioritize projects that simultaneously benefit lower income and special needs populations.
• New Americans Initiative and Illinois
Welcoming Center. DHS collaborated with the Governor’s Office of New Americans and other state agencies to make state services more accessible to immigrant and refugee communities. The Welcoming Center, located in Melrose Park, provides immigrant and refugees with a “one-stop” service center aimed at expediting their integration into Illinois life.
• Open Door. With the support of the Michael
Reese Health Trust, DHS is piloting the Open Door Project in Cook County and has just launched a second pilot site in DuPage County. Open Door is a project designed to streamline the way customers are helped, and to meet emergency needs to keep them on their feet by providing comprehensive access to all DHS and community services regardless of the system entry point, eliminating duplication of services.
• Nursing Facility Workgroup (Rapid
Reintegration Pilot Project): Two Rapid Reintegration pilot sites were identified: Rockford and Springfield. The Division of Mental Health (DMH) pilot is to study strategies geared toward either diverting Medicaid-eligible individuals from
7 - 21
Department Of Human Services www.dhs.state.il.us 100 South Grand Avenue, East
Springfield, IL 62762 217.557.1601
nursing home placements or if admitted to a nursing home, to enable them to return to the community with access to community residential options and mental health support services, upon improvement in their medical/psychiatric condition. The Division of Rehabilitation Services (DRS) pilot goal is focused on identifying systemic barriers that prevent individuals from accessing services and supports they need to go home after a hospitalization or return home after a rehabilitation stay in a nursing facility.
• Transitions to community-based services.
The Division of Developmental Disabilities (DDD) continued its effort at helping individuals live in least restrictive settings, as 160 individuals moved from State Operated Developmental Centers (SODCs) to community-based services during fiscal year 2008 and an additional 190 are set to move during fiscal year 09.
• Mailing LINK Cards. In 2008, the Division of
Human Capital Development (HCD) created a more efficient Link Card distribution initiative. Following an eligibility interview, cash assistance and food stamp customers now receive initial and replacement Link cards by mail. A toll-free automated voice response phone system assists customers to perform many functions by phone instead of re-visiting the local Family and Community Resource Centers (FCRC). Statewide, customer activity for replacing Link cards at the FCRCs was reduced from 66,000 customers per month to approximately 22,000. Staff efficiencies have improved, as regular casework can take precedence over replacement card activity.
• Improvement of Services through
Technology. New system enhancements provide additional avenues of customer service through an online application process. These enhancements allow outreach to customers who prefer to apply for services (cash, medical or Food Stamp programs) via their own locations and time schedules. Over 14,500 Web-based applications were received during the first quarter of 2009, with more than 25 percent of the applications being submitted after 5 p.m. or on weekends.
KEY INITIATIVES • Federal recovery. Funds provided will help to
increase the federal reimbursement for the department’s Medicaid-eligible programs. In addition to the increased reimbursement, the department will also receive $147.6 million in increased funding for the Women, Infants and Children (WIC), child care, vocational rehabilitation, early intervention and food stamps programs.
• “No Wrong Door” Service Framework. The
Illinois Human Services and Healthcare Framework is a multi-year, comprehensive project of the Department on Aging, Department of Children and Family Services (DCFS), Department of Employment Security (IDES), Department of Healthcare and Family Services (HFS), Department of Human Services (DHS) and Department of Public Health (DPH), which is designed to develop and implement an enterprise system to support data sharing and efficient delivery of programs and services across all of the partner agencies. The “Framework" will employ modern technology and streamlined, standardized processes in order to expand residents' access to human and healthcare services, enhance the state's analysis and planning ability, and reduce the inefficiencies of the present systems.
• Improvements to community services for
persons with developmental disabilities. The department is implementing the next phase of a multi-year plan to rebalance the developmental disability system’s use of community and institutional settings. The state recently reached an agreement with the plaintiffs in the Ligas vs. Maram class action Olmstead lawsuit. Under the settlement, those that want to transition from private Intermediate Care Facilities for the Developmentally Disabled (ICF/DD) to Community Integrated Living Arrangements (CILA) and have the ability to do so will require increased capacity in the Medicaid waiver program to serve an additional 3,000 people living at home over the next six years. In addition, the state will continue efforts to develop a long-term plan for state-operated developmental centers with a particular focus in the near-term on the appropriate role for the Howe Developmental Center.
7 - 22

Department Of Human Services www.dhs.state.il.us 100 South Grand Avenue, East
Springfield, IL 62762 217.557.1601
PROGRAMS Addiction Prevention Provides leadership and resources to the Illinois community-based alcohol, tobacco and other drug abuse prevention systems. It sets direction, promotes quality services and provides funds, training, technical assistance, and monitoring for quality assurance. Addiction Treatment Licenses, develops, maintains, monitors and evaluates a comprehensive statewide intervention and treatment delivery system. System components include: screening, assessment, referral, intervention, treatment and continuing care for individuals with limited or no financial resources. Blind Rehabilitation Services Assists individuals who are blind or visually impaired to obtain or maintain employment. Counselors provide evaluation and guidance, job development, placement and follow-up services. Centers for Independent Living Centers for Independent Living are a network of 23 not-for-profit, community-based organizations that provide services to individuals with disabilities. Services provided by the centers include advocacy, peer counseling, skills training, information and referral. Children's Residential and Education Services Operates residential schools: the Illinois School for the Deaf, the Illinois School for the Visually Impaired and the Illinois Center for Rehabilitation and Education. Community Health Administers services in the areas of maternal and child health, family support, youth development and violence prevention, and intervention. The activities are directed toward the promotion of healthy lifestyles so that children are born and remain healthy and ready to learn, avoid high-risk behaviors as they grow and ultimately develop skills and values to lead lives as independent adults. Developmental Disability Grants Coordinates and funds approximately 350 community service providers, and funds over 300 private intermediate care facilities for persons with developmental disabilities.
Developmental Disability Operations Nine State-Operated Developmental Centers (SODCs) provide residential and program services to individuals with developmental disabilities who need active treatment programs and have complex needs, including medical or behavioral issues that require intensive supervision and programming. Disability Determination Services Determines the eligibility of applicants for benefits under the Social Security Administrations two disability programs: Social Security Disability Insurance (SSDI) and Supplemental Security Income (SSI). Human Capital Development Administers Illinois public assistance programs through 115 family and community resource centers statewide. With its primary focus on low-income or no-income families and individuals, programs and services offered include: cash assistance, food stamps, medical, child care, employment and training, homeless services, refugee and immigrant services, and other social service programs through Title XX. Home Services Program Assists individuals with severe disabilities who need assistance with daily living activities to remain in their homes, in order to prevent unnecessary institutionalization. The program serves individuals with AIDS, as well as a wide range of disabilities including physical disabilities and traumatic brain injuries. Mental Health Grants Monitors and funds mental health services provided by more than 200 community providers and hospitals to assist in the assessment, evaluation and treatment of mental illness in adults and severe emotional disturbance in children and youth. Mental Health Operations Delivers services through nine state psychiatric hospitals that provide civil and forensic inpatient services. These hospitals also provide a secure setting for those deemed by the court to be unfit to stand trial and who are found not guilty by reason of insanity. Sexually Violent Persons Program This statutorily mandated program for sexually violent persons provides psychiatric treatment services and care for court ordered and detained persons.
7 - 23

Department Of Human Services www.dhs.state.il.us 100 South Grand Avenue, East
Springfield, IL 62762 217.557.1601
Vocational Rehab Services Provides services to individuals with disabilities through counselors and other rehabilitation professionals. Services include training, medical services, physical and/or mental restoration, assistive technology devices and services, counseling and guidance, evaluation and diagnostics, basic adaptive skills, placement, follow-up and post employment services.
Youth Services Targets youth to help stabilize families in crisis, prevent juvenile delinquency and divert youth at risk of involvement in the child welfare, juvenile justice, or corrections systems. Early Intervention Services are offered to infants and toddlers from birth to three-years-old who have or are likely to have developmental delays.
Program FY 2008 FY 2009 FY 2010 FY 2008 FY 2009 FY 2010Actual Enacted Recommended Actual Estimated Recommended
Addiction Prevention 30,827.9 30,827.9 29,823.3 0.0 0.0 0.0Addiction Treatment 258,745.8 259,065.8 251,874.7 55.3 54.7 54.7Administration and Program Support 179,826.4 181,349.5 240,366.2 776.7 732.7 732.7Blind Rehabilitation Services 7,352.6 7,363.3 7,387.2 23.0 23.0 23.0Centers for Independent Living 7,212.6 7,212.6 7,212.6 0.0 0.0 0.0Children's Residential and Education Services
34,254.9 35,910.4 36,591.7 428.5 442.3 442.3
Community Health 493,940.0 502,620.1 541,777.8 152.7 167.8 167.8Developmental Disability Grants 1,096,380.1 1,157,315.6 1,251,183.7 8.0 11.0 11.0Developmental Disability Operations 342,614.4 357,126.0 324,418.9 4,808.1 4,471.8 4,471.8Disabi lity Determination Services 82,853.2 84,539.4 84,388.5 475.1 538.9 538.9Human Capi tal Development Grants 1,127,152.9 1,155,201.8 1,231,004.8 79.0 84.0 155.0Human Capi tal Development Operations 261,772.0 260,844.6 255,599.3 3,425.5 3,197.0 3,197.0
Home Services Program 436,679.6 497,469.4 524,044.4 112.0 164.1 164.1Administration and Program Support 57,621.3 54,307.4 55,253.1 142.0 144.0 144.0Mental Health Grants 501,548.4 504,721.8 498,495.1 200.5 201.7 201.7Mental Health Operations 241,446.2 252,024.2 236,511.2 2,545.7 2,521.4 2,521.4Sexually Violent Persons Program 29,222.1 29,111.4 29,032.4 230.7 224.8 224.8Vocational Rehab Services 143,240.6 148,735.7 168,550.5 579.0 569.8 573.8Youth Services 269,951.0 294,502.0 308,710.2 28.8 28.0 28.0Nonrecurring Projects 12,306.4 3,403.4 0.0 0.0 0.0 0.0
Total 5,614,948.3 5,823,652.2 6,082,225.6 14,070.5 13,577.0 13,652.0
Appropriations ($ thousands) Headcount (FTE)
7 - 24
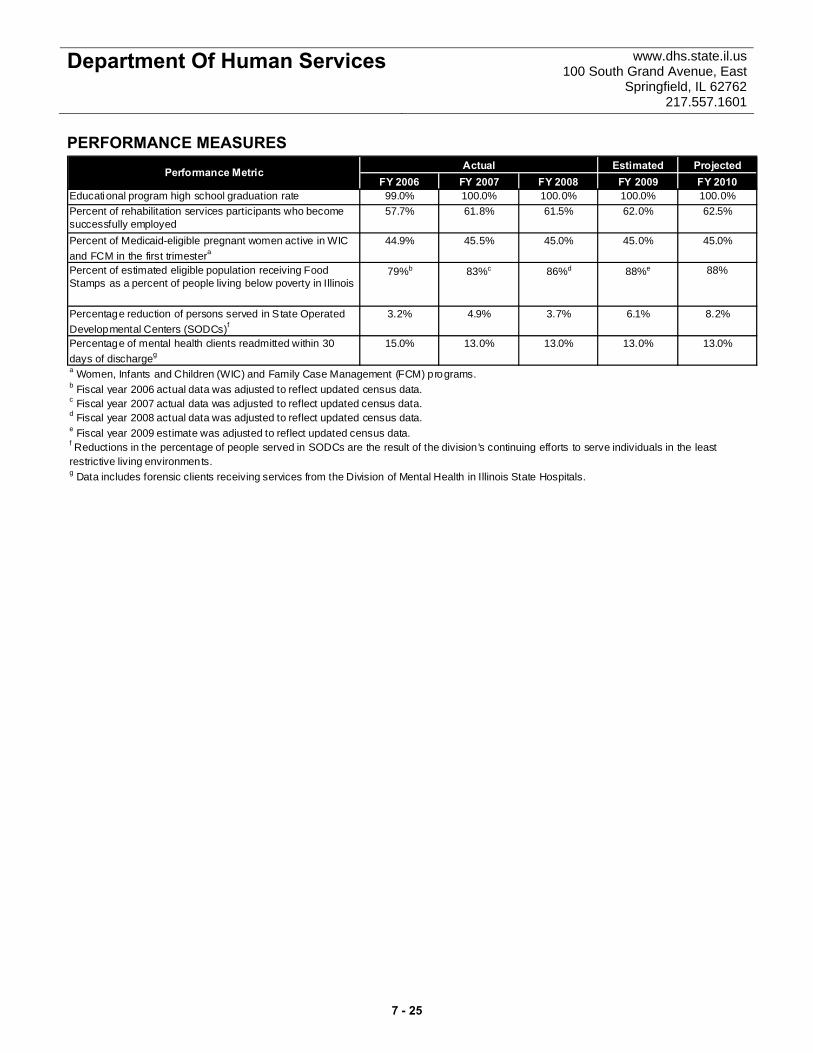
Department Of Human Services www.dhs.state.il.us 100 South Grand Avenue, East
Springfield, IL 62762 217.557.1601
PERFORMANCE MEASURES Estimated Projected
FY 2006 FY 2007 FY 2008 FY 2009 FY 2010Educational program high school graduation rate 99.0% 100.0% 100.0% 100.0% 100.0%Percent of rehabilitation services participants who become successfully employed
57.7% 61.8% 61.5% 62.0% 62.5%
Percent of Medicaid-eligible pregnant women active in WIC and FCM in the first trimestera
44.9% 45.5% 45.0% 45.0% 45.0%
Percent of estimated eligible population receiving Food Stamps as a percent of people living below poverty in Illinois
79%b 83%c 86%d 88%e 88%
Percentage reduction of persons served in State Operated Developmental Centers (SODCs)f
3.2% 4.9% 3.7% 6.1% 8.2%
Percentage of mental health clients readmitted within 30 days of dischargeg
15.0% 13.0% 13.0% 13.0% 13.0%
g Data includes forensic clients receiving services from the Division of Mental Health in Illinois State Hospitals.
e Fiscal year 2009 estimate was adjusted to reflect updated census data.f Reductions in the percentage of people served in SODCs are the result of the division 's continuing efforts to serve individuals in the least restrictive living environments.
ActualPerformance Metric
a Women, Infants and Children (WIC) and Family Case Management (FCM) programs.b Fiscal year 2006 actual data was adjusted to reflect updated census data.c Fiscal year 2007 actual data was adjusted to reflect updated census data.d Fiscal year 2008 actual data was adjusted to reflect updated census data.
7 - 25
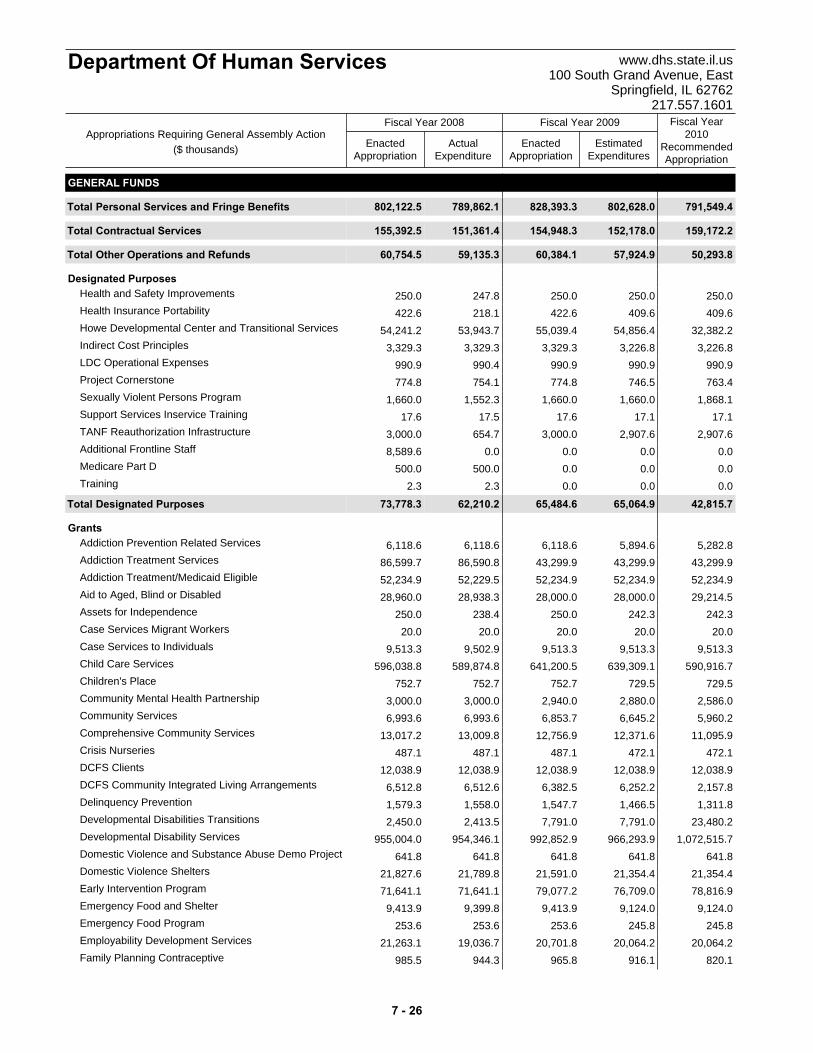
ActualExpenditure
EnactedAppropriation
EstimatedExpenditures
EnactedAppropriation
Fiscal Year2010
RecommendedAppropriation
Fiscal Year 2008 Fiscal Year 2009
Department Of Human Services www.dhs.state.il.us100 South Grand Avenue, East
Springfield, IL 62762217.557.1601
Appropriations Requiring General Assembly Action($ thousands)
GENERAL FUNDS
Total 802,122.5 791,549.4802,628.0828,393.3789,862.1Personal Services and Fringe Benefits
Total 155,392.5 159,172.2152,178.0154,948.3151,361.4Contractual Services
Total 60,754.5 50,293.857,924.960,384.159,135.3Other Operations and Refunds
Designated Purposes250.0 250.0250.0250.0247.8Health and Safety Improvements
422.6 409.6409.6422.6218.1Health Insurance Portability
54,241.2 32,382.254,856.455,039.453,943.7Howe Developmental Center and Transitional Services
3,329.3 3,226.83,226.83,329.33,329.3Indirect Cost Principles
990.9 990.9990.9990.9990.4LDC Operational Expenses
774.8 763.4746.5774.8754.1Project Cornerstone
1,660.0 1,868.11,660.01,660.01,552.3Sexually Violent Persons Program
17.6 17.117.117.617.5Support Services Inservice Training
3,000.0 2,907.62,907.63,000.0654.7TANF Reauthorization Infrastructure
8,589.6 0.00.00.00.0Additional Frontline Staff
500.0 0.00.00.0500.0Medicare Part D
2.3 0.00.00.02.3Training
Total 73,778.3 42,815.765,064.965,484.662,210.2Designated Purposes
Grants6,118.6 5,282.85,894.66,118.66,118.6Addiction Prevention Related Services
86,599.7 43,299.943,299.943,299.986,590.8Addiction Treatment Services
52,234.9 52,234.952,234.952,234.952,229.5Addiction Treatment/Medicaid Eligible
28,960.0 29,214.528,000.028,000.028,938.3Aid to Aged, Blind or Disabled
250.0 242.3242.3250.0238.4Assets for Independence
20.0 20.020.020.020.0Case Services Migrant Workers
9,513.3 9,513.39,513.39,513.39,502.9Case Services to Individuals
596,038.8 590,916.7639,309.1641,200.5589,874.8Child Care Services
752.7 729.5729.5752.7752.7Children's Place
3,000.0 2,586.02,880.02,940.03,000.0Community Mental Health Partnership
6,993.6 5,960.26,645.26,853.76,993.6Community Services
13,017.2 11,095.912,371.612,756.913,009.8Comprehensive Community Services
487.1 472.1472.1487.1487.1Crisis Nurseries
12,038.9 12,038.912,038.912,038.912,038.9DCFS Clients
6,512.8 2,157.86,252.26,382.56,512.6DCFS Community Integrated Living Arrangements
1,579.3 1,311.81,466.51,547.71,558.0Delinquency Prevention
2,450.0 23,480.27,791.07,791.02,413.5Developmental Disabilities Transitions
955,004.0 1,072,515.7966,293.9992,852.9954,346.1Developmental Disability Services
641.8 641.8641.8641.8641.8Domestic Violence and Substance Abuse Demo Project
21,827.6 21,354.421,354.421,591.021,789.8Domestic Violence Shelters
71,641.1 78,816.976,709.079,077.271,641.1Early Intervention Program
9,413.9 9,124.09,124.09,413.99,399.8Emergency Food and Shelter
253.6 245.8245.8253.6253.6Emergency Food Program
21,263.1 20,064.220,064.220,701.819,036.7Employability Development Services
985.5 820.1916.1965.8944.3Family Planning Contraceptive
7 - 26

ActualExpenditure
EnactedAppropriation
EstimatedExpenditures
EnactedAppropriation
Fiscal Year2010
RecommendedAppropriation
Fiscal Year 2008 Fiscal Year 2009
Department Of Human Services www.dhs.state.il.us100 South Grand Avenue, East
Springfield, IL 62762217.557.1601
Appropriations Requiring General Assembly Action($ thousands)
0.0 1,000.00.00.00.0Food Pantries
10,642.2 10,314.410,314.410,642.29,851.3Food Stamp Employment and Training
10,737.5 12,581.29,150.79,150.710,735.0Funeral and Burial Expense
9,977.3 10,123.011,247.811,247.89,929.9Healthy Families
510.5 480.0402.9500.3492.2Home and Community Based Waiver
430,873.7 518,084.1491,789.5491,789.5430,339.8Home Services Program
4,747.7 3,929.44,394.74,652.74,721.2Homeless Youth Services
112.6 112.6112.6112.6112.6IL Coalition Citizens with Disabilities
8,150.0 9,997.69,997.610,315.38,105.1Immigrant Integration Services
2,131.7 2,131.72,131.72,131.71,982.2Implement Title VI Part C-Vocational Rehabilitation
5,022.8 5,022.85,022.85,022.85,022.8Independent Living Centers
142.6 142.6142.6142.6141.1Independent Living Older Blind
45,638.7 42,471.842,471.844,725.945,638.7Infant Mortality
5,150.0 4,288.04,792.75,047.04,893.0Intensive Prenatal Performance Project
0.0 511.1569.9588.00.0Juvenile Intervention Services
3,771.5 3,145.33,514.93,696.13,713.8Juvenile Justice Reform
189.2 189.2189.2189.2154.8Living Skills
36,975.4 35,496.435,496.436,235.936,367.7Mental Health Children and Adolescent Grants
22,982.6 22,132.422,063.222,522.922,453.3Mental Health Community Transitions
231,036.6 214,426.2213,890.1228,375.9230,896.9Mental Health Grants
28,112.8 26,988.226,988.227,550.528,059.1Mental Health Individual Care Grants
3,000.0 2,880.02,880.02,940.03,000.0Mental Health Psychotropic Medications
1,200.0 1,552.01,152.01,176.0526.3Mental Health Transportation
1,500.0 1,331.21,481.21,500.01,495.2Methamphetamine Awareness
7,562.0 6,939.77,710.87,710.87,557.8Parents Too Soon
5,000.0 4,118.54,608.54,900.04,871.0Project for Autism
5,810.8 5,229.85,810.85,810.85,810.8Rape Victims/Prevention Act
2,295.0 3,129.63,129.63,229.12,043.3Redeploy Illinois
541.0 524.3524.3541.0541.0Refugee Social Services
1,866.7 1,575.72,175.72,175.71,850.0Refugees
569.5 512.5569.5569.5567.3Scandinavian Lekotek Play Library
9,232.2 7,577.18,063.68,647.99,186.0Special Services
2,428.6 2,381.12,381.12,454.72,428.2SSI Advocacy Services
1,499.0 1,339.01,339.01,339.01,493.6State Family and Child Assistance Program
11,569.0 11,000.011,000.011,000.011,558.9State Transitional Assistance
3,490.3 3,382.83,382.83,490.33,490.0Supportive Housing Services
7,163.9 5,959.16,661.77,020.67,079.4Teen Parents Services
111,065.0 99,297.594,297.697,515.0110,730.5Temporary Assistance to Needy Families
20,527.5 20,639.220,639.220,900.920,453.5Tinley Park Mental Health Center and TransitionalServices
313.7 100.0100.0580.9313.7Tort Claims
12.6 12.212.212.62.9Tort Claims Employees
3,080.8 2,559.32,861.23,019.23,044.8Unified Delinquency Intervention Services
19,114.8 16,282.518,155.518,732.519,015.9Youth Programs
9,057.4 0.00.00.09,054.0Addiction Treatment-Special Population
10.0 0.00.00.010.0Against Methamphetamine Abuse
30.0 0.00.00.00.0Amer-I-Can Illinois
7 - 27
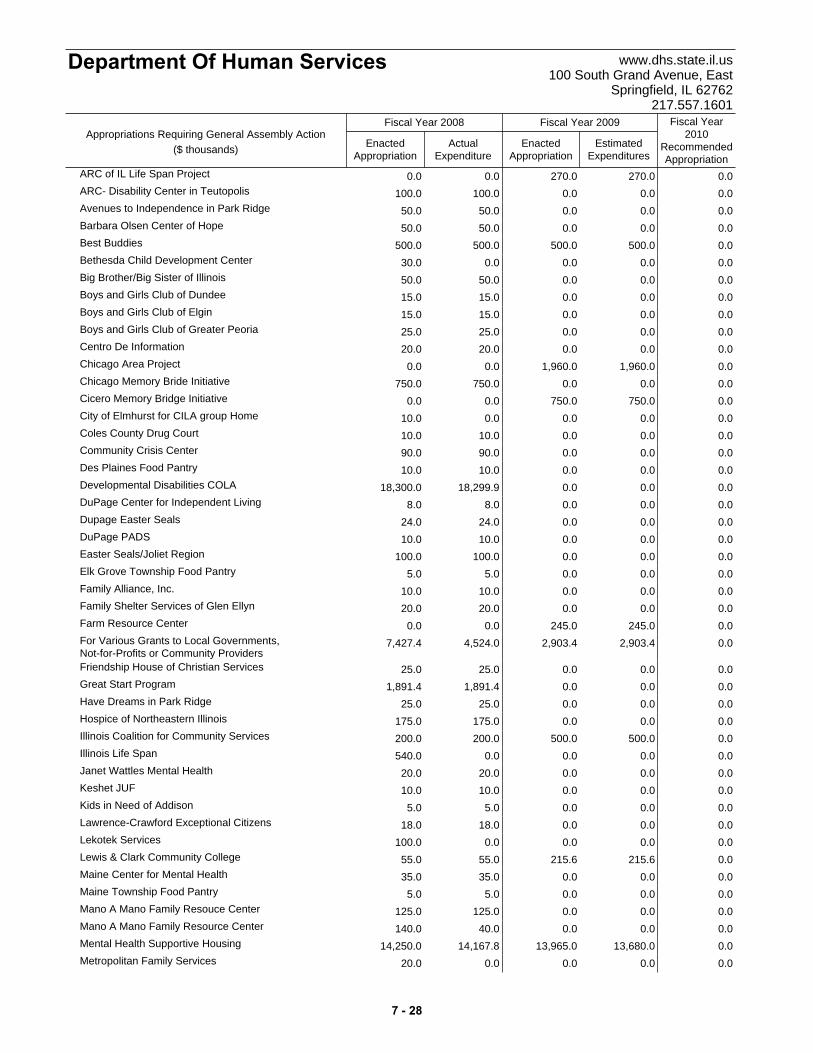
ActualExpenditure
EnactedAppropriation
EstimatedExpenditures
EnactedAppropriation
Fiscal Year2010
RecommendedAppropriation
Fiscal Year 2008 Fiscal Year 2009
Department Of Human Services www.dhs.state.il.us100 South Grand Avenue, East
Springfield, IL 62762217.557.1601
Appropriations Requiring General Assembly Action($ thousands)
0.0 0.0270.0270.00.0ARC of IL Life Span Project
100.0 0.00.00.0100.0ARC- Disability Center in Teutopolis
50.0 0.00.00.050.0Avenues to Independence in Park Ridge
50.0 0.00.00.050.0Barbara Olsen Center of Hope
500.0 0.0500.0500.0500.0Best Buddies
30.0 0.00.00.00.0Bethesda Child Development Center
50.0 0.00.00.050.0Big Brother/Big Sister of Illinois
15.0 0.00.00.015.0Boys and Girls Club of Dundee
15.0 0.00.00.015.0Boys and Girls Club of Elgin
25.0 0.00.00.025.0Boys and Girls Club of Greater Peoria
20.0 0.00.00.020.0Centro De Information
0.0 0.01,960.01,960.00.0Chicago Area Project
750.0 0.00.00.0750.0Chicago Memory Bride Initiative
0.0 0.0750.0750.00.0Cicero Memory Bridge Initiative
10.0 0.00.00.00.0City of Elmhurst for CILA group Home
10.0 0.00.00.010.0Coles County Drug Court
90.0 0.00.00.090.0Community Crisis Center
10.0 0.00.00.010.0Des Plaines Food Pantry
18,300.0 0.00.00.018,299.9Developmental Disabilities COLA
8.0 0.00.00.08.0DuPage Center for Independent Living
24.0 0.00.00.024.0Dupage Easter Seals
10.0 0.00.00.010.0DuPage PADS
100.0 0.00.00.0100.0Easter Seals/Joliet Region
5.0 0.00.00.05.0Elk Grove Township Food Pantry
10.0 0.00.00.010.0Family Alliance, Inc.
20.0 0.00.00.020.0Family Shelter Services of Glen Ellyn
0.0 0.0245.0245.00.0Farm Resource Center
7,427.4 0.02,903.42,903.44,524.0For Various Grants to Local Governments,Not-for-Profits or Community Providers
25.0 0.00.00.025.0Friendship House of Christian Services
1,891.4 0.00.00.01,891.4Great Start Program
25.0 0.00.00.025.0Have Dreams in Park Ridge
175.0 0.00.00.0175.0Hospice of Northeastern Illinois
200.0 0.0500.0500.0200.0Illinois Coalition for Community Services
540.0 0.00.00.00.0Illinois Life Span
20.0 0.00.00.020.0Janet Wattles Mental Health
10.0 0.00.00.010.0Keshet JUF
5.0 0.00.00.05.0Kids in Need of Addison
18.0 0.00.00.018.0Lawrence-Crawford Exceptional Citizens
100.0 0.00.00.00.0Lekotek Services
55.0 0.0215.6215.655.0Lewis & Clark Community College
35.0 0.00.00.035.0Maine Center for Mental Health
5.0 0.00.00.05.0Maine Township Food Pantry
125.0 0.00.00.0125.0Mano A Mano Family Resouce Center
140.0 0.00.00.040.0Mano A Mano Family Resource Center
14,250.0 0.013,680.013,965.014,167.8Mental Health Supportive Housing
20.0 0.00.00.00.0Metropolitan Family Services
7 - 28
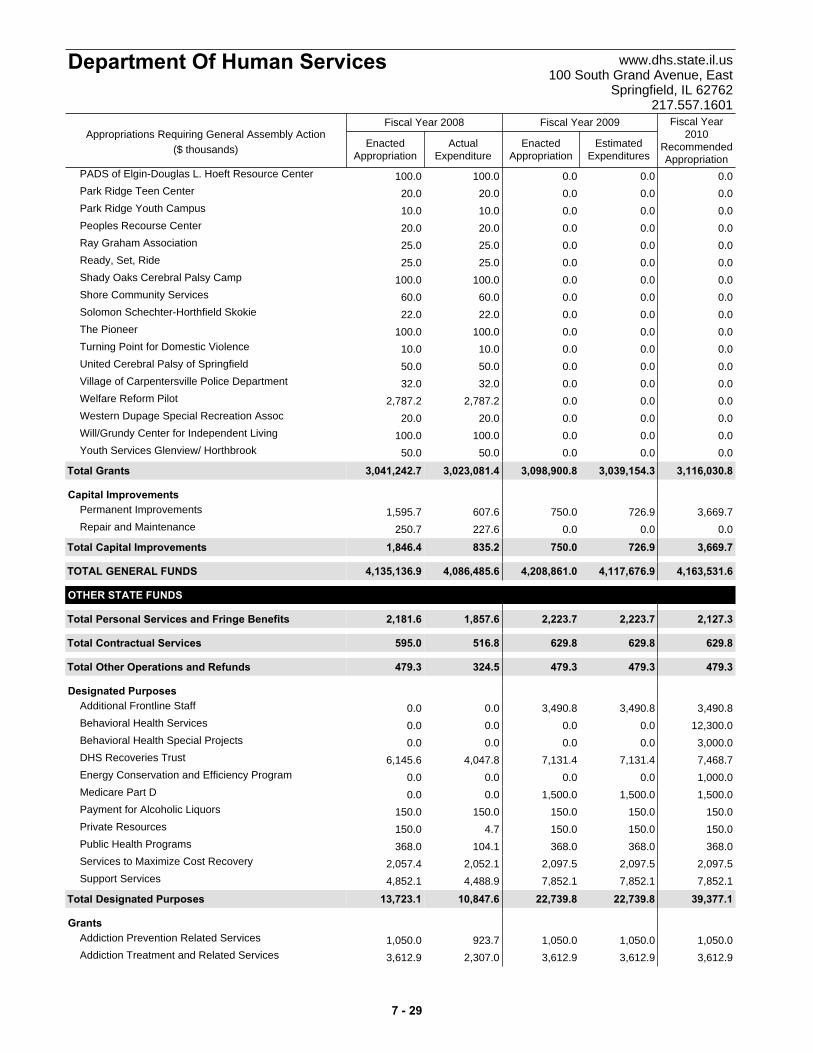
ActualExpenditure
EnactedAppropriation
EstimatedExpenditures
EnactedAppropriation
Fiscal Year2010
RecommendedAppropriation
Fiscal Year 2008 Fiscal Year 2009
Department Of Human Services www.dhs.state.il.us100 South Grand Avenue, East
Springfield, IL 62762217.557.1601
Appropriations Requiring General Assembly Action($ thousands)
100.0 0.00.00.0100.0PADS of Elgin-Douglas L. Hoeft Resource Center
20.0 0.00.00.020.0Park Ridge Teen Center
10.0 0.00.00.010.0Park Ridge Youth Campus
20.0 0.00.00.020.0Peoples Recourse Center
25.0 0.00.00.025.0Ray Graham Association
25.0 0.00.00.025.0Ready, Set, Ride
100.0 0.00.00.0100.0Shady Oaks Cerebral Palsy Camp
60.0 0.00.00.060.0Shore Community Services
22.0 0.00.00.022.0Solomon Schechter-Horthfield Skokie
100.0 0.00.00.0100.0The Pioneer
10.0 0.00.00.010.0Turning Point for Domestic Violence
50.0 0.00.00.050.0United Cerebral Palsy of Springfield
32.0 0.00.00.032.0Village of Carpentersville Police Department
2,787.2 0.00.00.02,787.2Welfare Reform Pilot
20.0 0.00.00.020.0Western Dupage Special Recreation Assoc
100.0 0.00.00.0100.0Will/Grundy Center for Independent Living
50.0 0.00.00.050.0Youth Services Glenview/ Horthbrook
Total 3,041,242.7 3,116,030.83,039,154.33,098,900.83,023,081.4Grants
Capital Improvements1,595.7 3,669.7726.9750.0607.6Permanent Improvements
250.7 0.00.00.0227.6Repair and Maintenance
Total 1,846.4 3,669.7726.9750.0835.2Capital Improvements
TOTAL GENERAL FUNDS 4,135,136.9 4,163,531.64,117,676.94,208,861.04,086,485.6
OTHER STATE FUNDS
Total 2,181.6 2,127.32,223.72,223.71,857.6Personal Services and Fringe Benefits
Total 595.0 629.8629.8629.8516.8Contractual Services
Total 479.3 479.3479.3479.3324.5Other Operations and Refunds
Designated Purposes0.0 3,490.83,490.83,490.80.0Additional Frontline Staff
0.0 12,300.00.00.00.0Behavioral Health Services
0.0 3,000.00.00.00.0Behavioral Health Special Projects
6,145.6 7,468.77,131.47,131.44,047.8DHS Recoveries Trust
0.0 1,000.00.00.00.0Energy Conservation and Efficiency Program
0.0 1,500.01,500.01,500.00.0Medicare Part D
150.0 150.0150.0150.0150.0Payment for Alcoholic Liquors
150.0 150.0150.0150.04.7Private Resources
368.0 368.0368.0368.0104.1Public Health Programs
2,057.4 2,097.52,097.52,097.52,052.1Services to Maximize Cost Recovery
4,852.1 7,852.17,852.17,852.14,488.9Support Services
Total 13,723.1 39,377.122,739.822,739.810,847.6Designated Purposes
Grants1,050.0 1,050.01,050.01,050.0923.7Addiction Prevention Related Services
3,612.9 3,612.93,612.93,612.92,307.0Addiction Treatment and Related Services
7 - 29

ActualExpenditure
EnactedAppropriation
EstimatedExpenditures
EnactedAppropriation
Fiscal Year2010
RecommendedAppropriation
Fiscal Year 2008 Fiscal Year 2009
Department Of Human Services www.dhs.state.il.us100 South Grand Avenue, East
Springfield, IL 62762217.557.1601
Appropriations Requiring General Assembly Action($ thousands)
5,000.0 36,399.948,299.948,299.94,437.8Addiction Treatment Services
0.0 9,057.49,057.49,057.40.0Addiction Treatment-Special Population
0.0 5,000.00.00.00.0Addiction Treatment/Medicaid Eligible
300.0 300.0300.0300.0233.7Assistance for Homeless
100.0 100.0100.0100.00.0Autism Research Checkoff
2,413.7 2,413.72,413.72,413.72,412.5Case Services to Individuals
250.0 250.0250.0250.0250.0Coalition for Technical Assistance and Training
0.0 60.060.060.00.0Community Mental Health Partnership
960.0 960.0960.0960.0793.7Compulsive Gamblers Treatment
0.0 130.3130.3130.30.0DCFS Community Integrated Living Arrangements
0.0 31.631.631.60.0Delinquency Prevention
0.0 19,214.028,100.028,100.00.0Developmental Disabilities Grants and Purchase of Care
1,300.0 1,300.01,300.01,300.01,300.0Developmental Disabilities Home Based SupportServices
43,000.0 50,000.040,000.040,000.042,871.6Developmental Disabilities Long Term Care
9,965.6 9,965.69,965.69,965.69,964.6Developmental Disabilities Purchase of Care
100.0 100.0100.0100.0100.0Diabetes Research Checkoff
100.0 100.0100.0100.025.1Domestic Violence Programs
952.2 1,188.81,188.81,188.8800.7Domestic Violence Shelters
134,914.3 160,000.0150,000.0150,000.0134,438.4Early Intervention Program
0.0 19.719.719.70.0Family Planning Contraceptive
0.0 10,000.00.00.00.0Federal Recovery - Early Intervention Program
2,118.5 2,118.52,118.52,118.52,118.5For Children's Health Programs
3,500.0 3,500.03,500.03,500.01,636.5Gear Up
300.0 300.0300.0300.096.7Grants for Multiple Sclerosis
0.0 1,891.41,891.41,891.40.0Great Start Program
0.0 200.0200.0200.00.0Group Home Loans
32,950.0 34,450.034,450.034,450.07,344.4Health and Human Services Medicaid Trust
2,361.4 2,361.42,361.42,361.41,698.9Health Care System DCFS Wards
0.0 10.210.210.20.0Home and Community Based Waiver
0.0 95.095.095.00.0Homeless Youth Services
11,000.0 11,000.011,000.011,000.010,991.6Homelessness Prevention
0.0 5,000.05,000.05,000.00.0Housing Development Grants
0.0 912.8912.8912.80.0Infant Mortality
0.0 103.0103.0103.00.0Intensive Prenatal Performance Project
0.0 75.475.475.40.0Juvenile Justice Reform
105,689.9 115,689.9105,689.9105,689.982,241.3Medicaid-Mentally Ill/Kid Care
0.0 739.5739.5739.50.0Mental Health Children and Adolescent Grants
0.0 459.7459.7459.70.0Mental Health Community Transitions
0.0 2,660.72,660.72,660.70.0Mental Health Grants
0.0 562.3562.3562.30.0Mental Health Individual Care Grants
0.0 60.060.060.00.0Mental Health Psychotropic Medications
0.0 17,965.04,285.04,285.00.0Mental Health Supportive Housing
1,200.0 24.024.024.0373.0Mental Health Transportation
0.0 100.00.00.00.0Open Door Project
0.0 100.0100.0100.00.0Project for Autism
100.0 100.0100.0100.070.0Sexual Assault Services
7 - 30
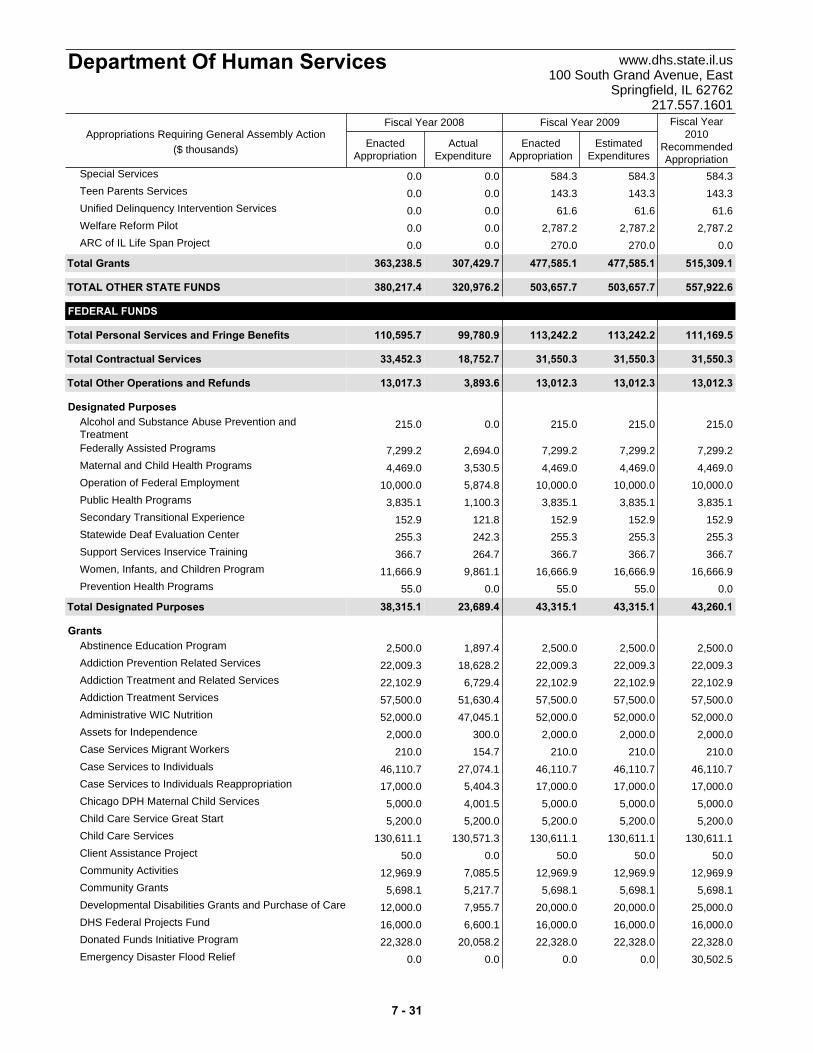
ActualExpenditure
EnactedAppropriation
EstimatedExpenditures
EnactedAppropriation
Fiscal Year2010
RecommendedAppropriation
Fiscal Year 2008 Fiscal Year 2009
Department Of Human Services www.dhs.state.il.us100 South Grand Avenue, East
Springfield, IL 62762217.557.1601
Appropriations Requiring General Assembly Action($ thousands)
0.0 584.3584.3584.30.0Special Services
0.0 143.3143.3143.30.0Teen Parents Services
0.0 61.661.661.60.0Unified Delinquency Intervention Services
0.0 2,787.22,787.22,787.20.0Welfare Reform Pilot
0.0 0.0270.0270.00.0ARC of IL Life Span Project
Total 363,238.5 515,309.1477,585.1477,585.1307,429.7Grants
TOTAL OTHER STATE FUNDS 380,217.4 557,922.6503,657.7503,657.7320,976.2
FEDERAL FUNDS
Total 110,595.7 111,169.5113,242.2113,242.299,780.9Personal Services and Fringe Benefits
Total 33,452.3 31,550.331,550.331,550.318,752.7Contractual Services
Total 13,017.3 13,012.313,012.313,012.33,893.6Other Operations and Refunds
Designated Purposes215.0 215.0215.0215.00.0Alcohol and Substance Abuse Prevention and
Treatment7,299.2 7,299.27,299.27,299.22,694.0Federally Assisted Programs
4,469.0 4,469.04,469.04,469.03,530.5Maternal and Child Health Programs
10,000.0 10,000.010,000.010,000.05,874.8Operation of Federal Employment
3,835.1 3,835.13,835.13,835.11,100.3Public Health Programs
152.9 152.9152.9152.9121.8Secondary Transitional Experience
255.3 255.3255.3255.3242.3Statewide Deaf Evaluation Center
366.7 366.7366.7366.7264.7Support Services Inservice Training
11,666.9 16,666.916,666.916,666.99,861.1Women, Infants, and Children Program
55.0 0.055.055.00.0Prevention Health Programs
Total 38,315.1 43,260.143,315.143,315.123,689.4Designated Purposes
Grants2,500.0 2,500.02,500.02,500.01,897.4Abstinence Education Program
22,009.3 22,009.322,009.322,009.318,628.2Addiction Prevention Related Services
22,102.9 22,102.922,102.922,102.96,729.4Addiction Treatment and Related Services
57,500.0 57,500.057,500.057,500.051,630.4Addiction Treatment Services
52,000.0 52,000.052,000.052,000.047,045.1Administrative WIC Nutrition
2,000.0 2,000.02,000.02,000.0300.0Assets for Independence
210.0 210.0210.0210.0154.7Case Services Migrant Workers
46,110.7 46,110.746,110.746,110.727,074.1Case Services to Individuals
17,000.0 17,000.017,000.017,000.05,404.3Case Services to Individuals Reappropriation
5,000.0 5,000.05,000.05,000.04,001.5Chicago DPH Maternal Child Services
5,200.0 5,200.05,200.05,200.05,200.0Child Care Service Great Start
130,611.1 130,611.1130,611.1130,611.1130,571.3Child Care Services
50.0 50.050.050.00.0Client Assistance Project
12,969.9 12,969.912,969.912,969.97,085.5Community Activities
5,698.1 5,698.15,698.15,698.15,217.7Community Grants
12,000.0 25,000.020,000.020,000.07,955.7Developmental Disabilities Grants and Purchase of Care
16,000.0 16,000.016,000.016,000.06,600.1DHS Federal Projects Fund
22,328.0 22,328.022,328.022,328.020,058.2Donated Funds Initiative Program
0.0 30,502.50.00.00.0Emergency Disaster Flood Relief
7 - 31
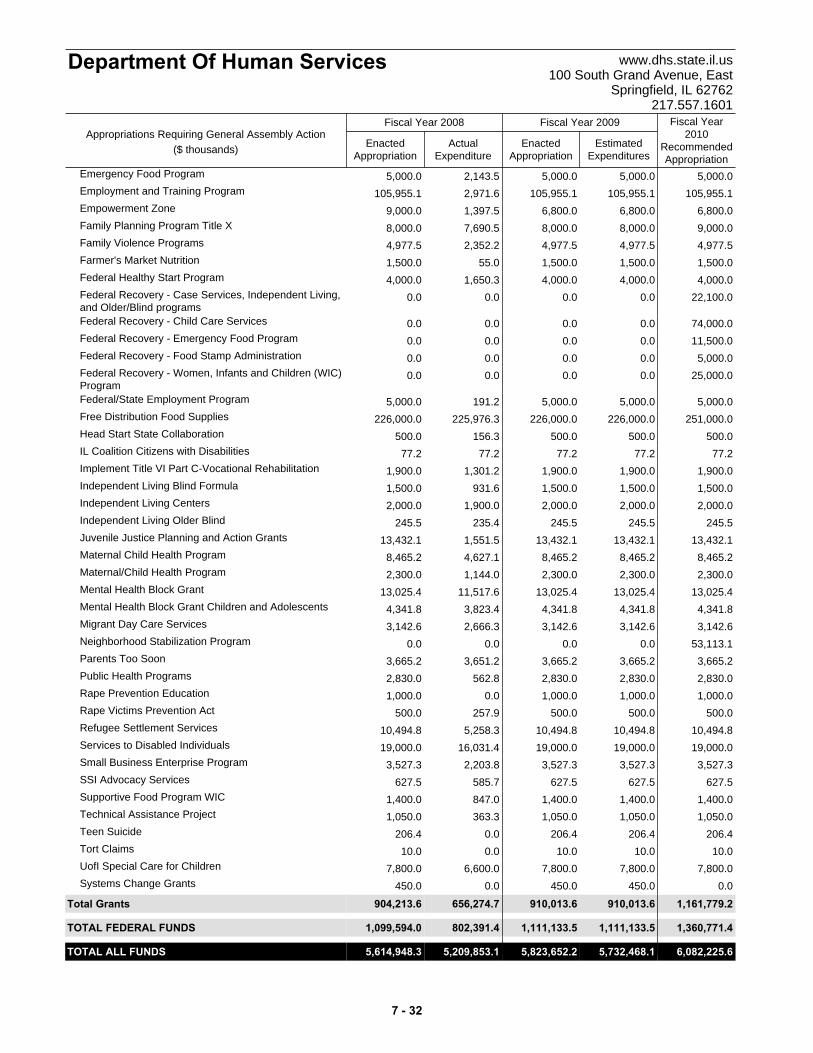
ActualExpenditure
EnactedAppropriation
EstimatedExpenditures
EnactedAppropriation
Fiscal Year2010
RecommendedAppropriation
Fiscal Year 2008 Fiscal Year 2009
Department Of Human Services www.dhs.state.il.us100 South Grand Avenue, East
Springfield, IL 62762217.557.1601
Appropriations Requiring General Assembly Action($ thousands)
5,000.0 5,000.05,000.05,000.02,143.5Emergency Food Program
105,955.1 105,955.1105,955.1105,955.12,971.6Employment and Training Program
9,000.0 6,800.06,800.06,800.01,397.5Empowerment Zone
8,000.0 9,000.08,000.08,000.07,690.5Family Planning Program Title X
4,977.5 4,977.54,977.54,977.52,352.2Family Violence Programs
1,500.0 1,500.01,500.01,500.055.0Farmer's Market Nutrition
4,000.0 4,000.04,000.04,000.01,650.3Federal Healthy Start Program
0.0 22,100.00.00.00.0Federal Recovery - Case Services, Independent Living,and Older/Blind programs
0.0 74,000.00.00.00.0Federal Recovery - Child Care Services
0.0 11,500.00.00.00.0Federal Recovery - Emergency Food Program
0.0 5,000.00.00.00.0Federal Recovery - Food Stamp Administration
0.0 25,000.00.00.00.0Federal Recovery - Women, Infants and Children (WIC)Program
5,000.0 5,000.05,000.05,000.0191.2Federal/State Employment Program
226,000.0 251,000.0226,000.0226,000.0225,976.3Free Distribution Food Supplies
500.0 500.0500.0500.0156.3Head Start State Collaboration
77.2 77.277.277.277.2IL Coalition Citizens with Disabilities
1,900.0 1,900.01,900.01,900.01,301.2Implement Title VI Part C-Vocational Rehabilitation
1,500.0 1,500.01,500.01,500.0931.6Independent Living Blind Formula
2,000.0 2,000.02,000.02,000.01,900.0Independent Living Centers
245.5 245.5245.5245.5235.4Independent Living Older Blind
13,432.1 13,432.113,432.113,432.11,551.5Juvenile Justice Planning and Action Grants
8,465.2 8,465.28,465.28,465.24,627.1Maternal Child Health Program
2,300.0 2,300.02,300.02,300.01,144.0Maternal/Child Health Program
13,025.4 13,025.413,025.413,025.411,517.6Mental Health Block Grant
4,341.8 4,341.84,341.84,341.83,823.4Mental Health Block Grant Children and Adolescents
3,142.6 3,142.63,142.63,142.62,666.3Migrant Day Care Services
0.0 53,113.10.00.00.0Neighborhood Stabilization Program
3,665.2 3,665.23,665.23,665.23,651.2Parents Too Soon
2,830.0 2,830.02,830.02,830.0562.8Public Health Programs
1,000.0 1,000.01,000.01,000.00.0Rape Prevention Education
500.0 500.0500.0500.0257.9Rape Victims Prevention Act
10,494.8 10,494.810,494.810,494.85,258.3Refugee Settlement Services
19,000.0 19,000.019,000.019,000.016,031.4Services to Disabled Individuals
3,527.3 3,527.33,527.33,527.32,203.8Small Business Enterprise Program
627.5 627.5627.5627.5585.7SSI Advocacy Services
1,400.0 1,400.01,400.01,400.0847.0Supportive Food Program WIC
1,050.0 1,050.01,050.01,050.0363.3Technical Assistance Project
206.4 206.4206.4206.40.0Teen Suicide
10.0 10.010.010.00.0Tort Claims
7,800.0 7,800.07,800.07,800.06,600.0UofI Special Care for Children
450.0 0.0450.0450.00.0Systems Change Grants
Total 904,213.6 1,161,779.2910,013.6910,013.6656,274.7Grants
TOTAL FEDERAL FUNDS 1,099,594.0 1,360,771.41,111,133.51,111,133.5802,391.4
TOTAL ALL FUNDS 5,614,948.3 6,082,225.65,732,468.15,823,652.25,209,853.1
7 - 32
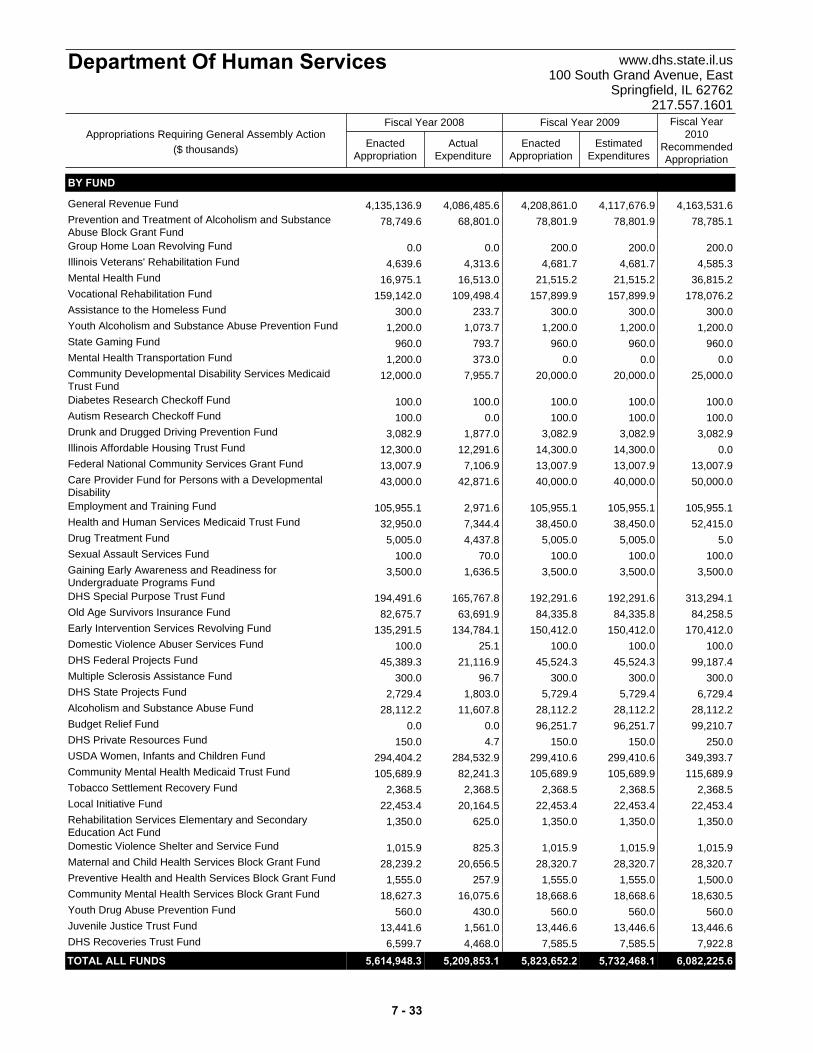
ActualExpenditure
EnactedAppropriation
EstimatedExpenditures
EnactedAppropriation
Fiscal Year2010
RecommendedAppropriation
Fiscal Year 2008 Fiscal Year 2009
Department Of Human Services www.dhs.state.il.us100 South Grand Avenue, East
Springfield, IL 62762217.557.1601
Appropriations Requiring General Assembly Action($ thousands)
BY FUND
4,135,136.9 4,163,531.64,117,676.94,208,861.04,086,485.6General Revenue Fund
78,749.6 78,785.178,801.978,801.968,801.0Prevention and Treatment of Alcoholism and SubstanceAbuse Block Grant Fund
0.0 200.0200.0200.00.0Group Home Loan Revolving Fund
4,639.6 4,585.34,681.74,681.74,313.6Illinois Veterans' Rehabilitation Fund
16,975.1 36,815.221,515.221,515.216,513.0Mental Health Fund
159,142.0 178,076.2157,899.9157,899.9109,498.4Vocational Rehabilitation Fund
300.0 300.0300.0300.0233.7Assistance to the Homeless Fund
1,200.0 1,200.01,200.01,200.01,073.7Youth Alcoholism and Substance Abuse Prevention Fund
960.0 960.0960.0960.0793.7State Gaming Fund
1,200.0 0.00.00.0373.0Mental Health Transportation Fund
12,000.0 25,000.020,000.020,000.07,955.7Community Developmental Disability Services MedicaidTrust Fund
100.0 100.0100.0100.0100.0Diabetes Research Checkoff Fund
100.0 100.0100.0100.00.0Autism Research Checkoff Fund
3,082.9 3,082.93,082.93,082.91,877.0Drunk and Drugged Driving Prevention Fund
12,300.0 0.014,300.014,300.012,291.6Illinois Affordable Housing Trust Fund
13,007.9 13,007.913,007.913,007.97,106.9Federal National Community Services Grant Fund
43,000.0 50,000.040,000.040,000.042,871.6Care Provider Fund for Persons with a DevelopmentalDisability
105,955.1 105,955.1105,955.1105,955.12,971.6Employment and Training Fund
32,950.0 52,415.038,450.038,450.07,344.4Health and Human Services Medicaid Trust Fund
5,005.0 5.05,005.05,005.04,437.8Drug Treatment Fund
100.0 100.0100.0100.070.0Sexual Assault Services Fund
3,500.0 3,500.03,500.03,500.01,636.5Gaining Early Awareness and Readiness forUndergraduate Programs Fund
194,491.6 313,294.1192,291.6192,291.6165,767.8DHS Special Purpose Trust Fund
82,675.7 84,258.584,335.884,335.863,691.9Old Age Survivors Insurance Fund
135,291.5 170,412.0150,412.0150,412.0134,784.1Early Intervention Services Revolving Fund
100.0 100.0100.0100.025.1Domestic Violence Abuser Services Fund
45,389.3 99,187.445,524.345,524.321,116.9DHS Federal Projects Fund
300.0 300.0300.0300.096.7Multiple Sclerosis Assistance Fund
2,729.4 6,729.45,729.45,729.41,803.0DHS State Projects Fund
28,112.2 28,112.228,112.228,112.211,607.8Alcoholism and Substance Abuse Fund
0.0 99,210.796,251.796,251.70.0Budget Relief Fund
150.0 250.0150.0150.04.7DHS Private Resources Fund
294,404.2 349,393.7299,410.6299,410.6284,532.9USDA Women, Infants and Children Fund
105,689.9 115,689.9105,689.9105,689.982,241.3Community Mental Health Medicaid Trust Fund
2,368.5 2,368.52,368.52,368.52,368.5Tobacco Settlement Recovery Fund
22,453.4 22,453.422,453.422,453.420,164.5Local Initiative Fund
1,350.0 1,350.01,350.01,350.0625.0Rehabilitation Services Elementary and SecondaryEducation Act Fund
1,015.9 1,015.91,015.91,015.9825.3Domestic Violence Shelter and Service Fund
28,239.2 28,320.728,320.728,320.720,656.5Maternal and Child Health Services Block Grant Fund
1,555.0 1,500.01,555.01,555.0257.9Preventive Health and Health Services Block Grant Fund
18,627.3 18,630.518,668.618,668.616,075.6Community Mental Health Services Block Grant Fund
560.0 560.0560.0560.0430.0Youth Drug Abuse Prevention Fund
13,441.6 13,446.613,446.613,446.61,561.0Juvenile Justice Trust Fund
6,599.7 7,922.87,585.57,585.54,468.0DHS Recoveries Trust Fund
TOTAL ALL FUNDS 5,614,948.3 6,082,225.65,732,468.15,823,652.25,209,853.1
7 - 33
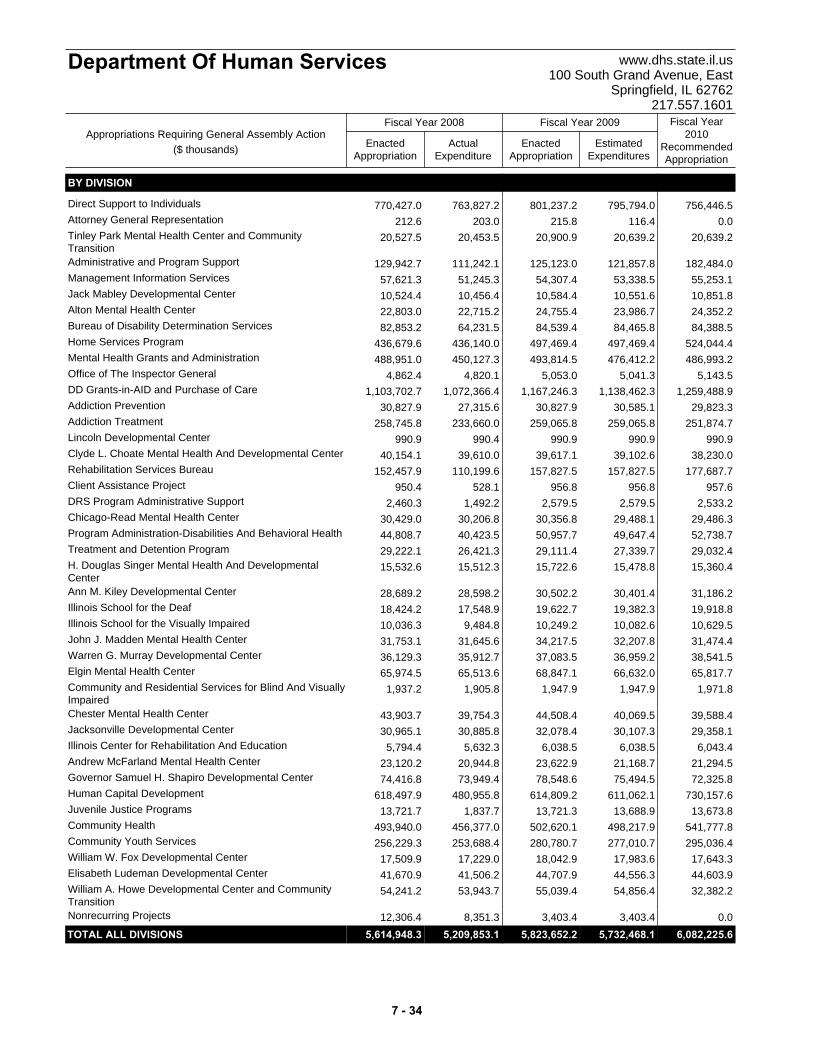
ActualExpenditure
EnactedAppropriation
EstimatedExpenditures
EnactedAppropriation
Fiscal Year2010
RecommendedAppropriation
Fiscal Year 2008 Fiscal Year 2009
Department Of Human Services www.dhs.state.il.us100 South Grand Avenue, East
Springfield, IL 62762217.557.1601
Appropriations Requiring General Assembly Action($ thousands)
BY DIVISION
770,427.0 756,446.5795,794.0801,237.2763,827.2Direct Support to Individuals
212.6 0.0116.4215.8203.0Attorney General Representation
20,527.5 20,639.220,639.220,900.920,453.5Tinley Park Mental Health Center and CommunityTransition
129,942.7 182,484.0121,857.8125,123.0111,242.1Administrative and Program Support
57,621.3 55,253.153,338.554,307.451,245.3Management Information Services
10,524.4 10,851.810,551.610,584.410,456.4Jack Mabley Developmental Center
22,803.0 24,352.223,986.724,755.422,715.2Alton Mental Health Center
82,853.2 84,388.584,465.884,539.464,231.5Bureau of Disability Determination Services
436,679.6 524,044.4497,469.4497,469.4436,140.0Home Services Program
488,951.0 486,993.2476,412.2493,814.5450,127.3Mental Health Grants and Administration
4,862.4 5,143.55,041.35,053.04,820.1Office of The Inspector General
1,103,702.7 1,259,488.91,138,462.31,167,246.31,072,366.4DD Grants-in-AID and Purchase of Care
30,827.9 29,823.330,585.130,827.927,315.6Addiction Prevention
258,745.8 251,874.7259,065.8259,065.8233,660.0Addiction Treatment
990.9 990.9990.9990.9990.4Lincoln Developmental Center
40,154.1 38,230.039,102.639,617.139,610.0Clyde L. Choate Mental Health And Developmental Center
152,457.9 177,687.7157,827.5157,827.5110,199.6Rehabilitation Services Bureau
950.4 957.6956.8956.8528.1Client Assistance Project
2,460.3 2,533.22,579.52,579.51,492.2DRS Program Administrative Support
30,429.0 29,486.329,488.130,356.830,206.8Chicago-Read Mental Health Center
44,808.7 52,738.749,647.450,957.740,423.5Program Administration-Disabilities And Behavioral Health
29,222.1 29,032.427,339.729,111.426,421.3Treatment and Detention Program
15,532.6 15,360.415,478.815,722.615,512.3H. Douglas Singer Mental Health And DevelopmentalCenter
28,689.2 31,186.230,401.430,502.228,598.2Ann M. Kiley Developmental Center
18,424.2 19,918.819,382.319,622.717,548.9Illinois School for the Deaf
10,036.3 10,629.510,082.610,249.29,484.8Illinois School for the Visually Impaired
31,753.1 31,474.432,207.834,217.531,645.6John J. Madden Mental Health Center
36,129.3 38,541.536,959.237,083.535,912.7Warren G. Murray Developmental Center
65,974.5 65,817.766,632.068,847.165,513.6Elgin Mental Health Center
1,937.2 1,971.81,947.91,947.91,905.8Community and Residential Services for Blind And VisuallyImpaired
43,903.7 39,588.440,069.544,508.439,754.3Chester Mental Health Center
30,965.1 29,358.130,107.332,078.430,885.8Jacksonville Developmental Center
5,794.4 6,043.46,038.56,038.55,632.3Illinois Center for Rehabilitation And Education
23,120.2 21,294.521,168.723,622.920,944.8Andrew McFarland Mental Health Center
74,416.8 72,325.875,494.578,548.673,949.4Governor Samuel H. Shapiro Developmental Center
618,497.9 730,157.6611,062.1614,809.2480,955.8Human Capital Development
13,721.7 13,673.813,688.913,721.31,837.7Juvenile Justice Programs
493,940.0 541,777.8498,217.9502,620.1456,377.0Community Health
256,229.3 295,036.4277,010.7280,780.7253,688.4Community Youth Services
17,509.9 17,643.317,983.618,042.917,229.0William W. Fox Developmental Center
41,670.9 44,603.944,556.344,707.941,506.2Elisabeth Ludeman Developmental Center
54,241.2 32,382.254,856.455,039.453,943.7William A. Howe Developmental Center and CommunityTransition
12,306.4 0.03,403.43,403.48,351.3Nonrecurring Projects
TOTAL ALL DIVISIONS 5,614,948.3 6,082,225.65,732,468.15,823,652.25,209,853.1
7 - 34
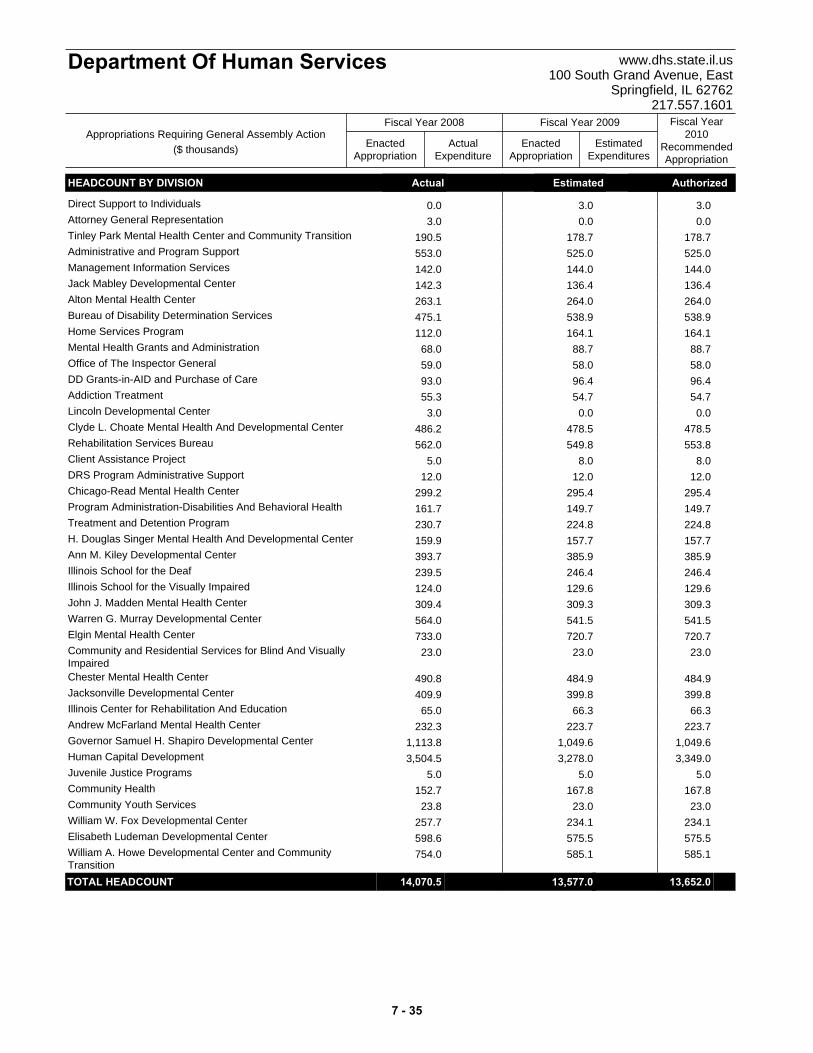
ActualExpenditure
EnactedAppropriation
EstimatedExpenditures
EnactedAppropriation
Fiscal Year2010
RecommendedAppropriation
Fiscal Year 2008 Fiscal Year 2009
Department Of Human Services www.dhs.state.il.us100 South Grand Avenue, East
Springfield, IL 62762217.557.1601
Appropriations Requiring General Assembly Action($ thousands)
HEADCOUNT BY DIVISION Actual Estimated Authorized
0.0 3.03.0Direct Support to Individuals
3.0 0.00.0Attorney General Representation
190.5 178.7178.7Tinley Park Mental Health Center and Community Transition
553.0 525.0525.0Administrative and Program Support
142.0 144.0144.0Management Information Services
142.3 136.4136.4Jack Mabley Developmental Center
263.1 264.0264.0Alton Mental Health Center
475.1 538.9538.9Bureau of Disability Determination Services
112.0 164.1164.1Home Services Program
68.0 88.788.7Mental Health Grants and Administration
59.0 58.058.0Office of The Inspector General
93.0 96.496.4DD Grants-in-AID and Purchase of Care
55.3 54.754.7Addiction Treatment
3.0 0.00.0Lincoln Developmental Center
486.2 478.5478.5Clyde L. Choate Mental Health And Developmental Center
562.0 553.8549.8Rehabilitation Services Bureau
5.0 8.08.0Client Assistance Project
12.0 12.012.0DRS Program Administrative Support
299.2 295.4295.4Chicago-Read Mental Health Center
161.7 149.7149.7Program Administration-Disabilities And Behavioral Health
230.7 224.8224.8Treatment and Detention Program
159.9 157.7157.7H. Douglas Singer Mental Health And Developmental Center
393.7 385.9385.9Ann M. Kiley Developmental Center
239.5 246.4246.4Illinois School for the Deaf
124.0 129.6129.6Illinois School for the Visually Impaired
309.4 309.3309.3John J. Madden Mental Health Center
564.0 541.5541.5Warren G. Murray Developmental Center
733.0 720.7720.7Elgin Mental Health Center
23.0 23.023.0Community and Residential Services for Blind And VisuallyImpaired
490.8 484.9484.9Chester Mental Health Center
409.9 399.8399.8Jacksonville Developmental Center
65.0 66.366.3Illinois Center for Rehabilitation And Education
232.3 223.7223.7Andrew McFarland Mental Health Center
1,113.8 1,049.61,049.6Governor Samuel H. Shapiro Developmental Center
3,504.5 3,349.03,278.0Human Capital Development
5.0 5.05.0Juvenile Justice Programs
152.7 167.8167.8Community Health
23.8 23.023.0Community Youth Services
257.7 234.1234.1William W. Fox Developmental Center
598.6 575.5575.5Elisabeth Ludeman Developmental Center
754.0 585.1585.1William A. Howe Developmental Center and CommunityTransitionTOTAL HEADCOUNT 14,070.5 13,652.013,577.0 t
7 - 35

Illinois Deaf And Hard Of Hearing Commission
www.idhhc.state.il.us 1630 South Sixth Street
Springfield, IL 62703 887.455.3323
OVERVIEW
Agency Mission To advance the interests of all Illinois citizens with a hearing loss by advocating for systemic improvements, promoting cooperation and coordination among entities serving people who are deaf and hard of hearing, and disseminating information to eliminate negative stereotypes surrounding hearing loss. Strategic Priorities • Improve access to state programs and services
for all deaf and hard of hearing citizens. • Monitor and evaluate programs receiving state
funds to ensure communication access for deaf and hard of hearing citizens.
• Increase public awareness of the Interpreter for the Deaf Licensure Act.
Summary of Agency Operations The Illinois Deaf and Hard of Hearing Commission (IDHHC) represents the interests of the deaf and hard of hearing population by advocating for the improvement and coordination of services to ensure full communication access. This includes monitoring state-funded programs and providing technical assistance to public and private entities to decrease communication barriers. IDHHC administers the Interpreters for the Deaf Licensure Act of 2007. The commission educates and informs consumers about licensure requirements and further protects consumers by evaluating the safety, soundness and professional integrity of licensed interpreters. Additionally, the commission investigates consumer complaints when warranted relating to violations of professional standards of practice. Upon request the commission provides training and presentations regarding hearing loss, the use of sign language interpreters, and the rights of deaf and hard of hearing consumers.
Further, IDHHC maintains a list of directories specifically for services to deaf and hard of hearing consumers, a lending library with materials related to hearing loss, and distributes a resource manual for parents of newly diagnosed infants with hearing loss.
Agency Resources Employed
FY 2008 FY 2009 FY 2010Actual Enacted Recommended
General Funds 703.9 788.8 744.3Other State Funds 0.0 100.0 135.0
Federal Funds 0.0 0.0 0.0Total 703.9 888.8 879.3
Actual Estimated RecommendedHeadcount (FTE) 6.0 7.0 8.0
Appropriations ($ thousands)Fund Category
MAJOR ACCOMPLISHMENTS • IDHHC in partnership with the State Board of
Education and the Department of Human Services, Bureau of Early Intervention have submitted the report from the Joint Task Force on Deaf and Hard of Hearing Education Options.
• Collaborated with Central Management
Services in reviewing and enhancing the communication access policy during testing in the civil service exam.
• Collaborated with the Department of Human
Services Division of Rehabilitation (DHS/DRS) in reviewing the manual communication bi-lingual program and the assessment that is used to determine the communication skills of future employees hired by DHS.
KEY BUDGET INITIATIVES • Implement the Interpreter for the Deaf
Licensure Act and refine procedures to assure an efficient operation.
PERFORMANCE MEASURES
Estimated ProjectedFY 2006 FY 2007 FY 2008 FY 2009 FY 2010
Public inquiries addressed 12,000 12,000 17,000 15,000 15,000Library materials loaned 300 300 200 200 100Promotional items and materials distributed 20,000 20,000 10,000 10,000 7,500Interpreter registry 950 950 1,000 1,000 600Workshops presented 50 50 60 60 30
ActualPerformance Metric
7 - 36

GENERAL FUNDS
Total 496.3 546.2545.6570.0494.5Personal Services and Fringe Benefits
Total 95.2 91.594.994.994.3Contractual Services
Total 75.6 69.887.187.168.4Other Operations and Refunds
Designated Purposes36.8 36.836.836.830.7Expenses Related to the Operation of the Commission
Total 36.8 36.836.836.830.7Designated Purposes
TOTAL GENERAL FUNDS 703.9 744.3764.4788.8687.8
OTHER STATE FUNDS
Designated Purposes0.0 135.0100.0100.00.0Interpreter for the Deaf Licensure
Total 0.0 135.0100.0100.00.0Designated Purposes
TOTAL OTHER STATE FUNDS 0.0 135.0100.0100.00.0
TOTAL ALL FUNDS 703.9 879.3864.4888.8687.8
BY FUND
703.9 744.3764.4788.8687.8General Revenue Fund
0.0 135.0100.0100.00.0Interpreters for the Deaf Fund
TOTAL ALL FUNDS 703.9 879.3864.4888.8687.8
BY DIVISION
703.9 879.3864.4888.8687.8General Office
TOTAL ALL DIVISIONS 703.9 879.3864.4888.8687.8
HEADCOUNT BY DIVISION Actual Estimated Authorized
5.0 8.07.0General Office
1.0 0.00.0Shared Services
TOTAL HEADCOUNT 6.0 8.07.0 t
ActualExpenditure
EnactedAppropriation
EstimatedExpenditures
EnactedAppropriation
Fiscal Year2010
RecommendedAppropriation
Fiscal Year 2008 Fiscal Year 2009
Illinois Deaf And Hard OfHearing Commission
www.idhhc.state.il.us1630 South Sixth Street
Springfield, IL 62703887.455.3323
Appropriations Requiring General Assembly Action($ thousands)
7 - 37
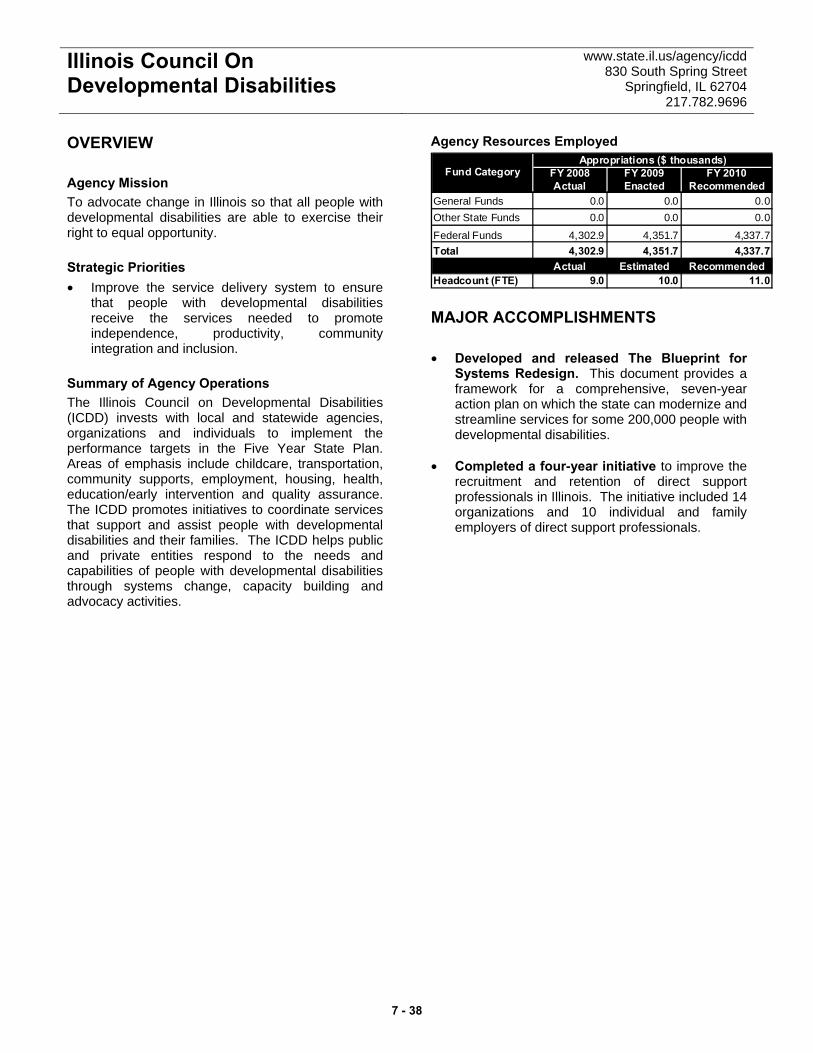
Illinois Council On Developmental Disabilities
www.state.il.us/agency/icdd 830 South Spring Street
Springfield, IL 62704 217.782.9696
OVERVIEW Agency Mission To advocate change in Illinois so that all people with developmental disabilities are able to exercise their right to equal opportunity. Strategic Priorities • Improve the service delivery system to ensure
that people with developmental disabilities receive the services needed to promote independence, productivity, community integration and inclusion.
Summary of Agency Operations The Illinois Council on Developmental Disabilities (ICDD) invests with local and statewide agencies, organizations and individuals to implement the performance targets in the Five Year State Plan. Areas of emphasis include childcare, transportation, community supports, employment, housing, health, education/early intervention and quality assurance. The ICDD promotes initiatives to coordinate services that support and assist people with developmental disabilities and their families. The ICDD helps public and private entities respond to the needs and capabilities of people with developmental disabilities through systems change, capacity building and advocacy activities.
Agency Resources Employed
FY 2008 FY 2009 FY 2010Actual Enacted Recommended
General Funds 0.0 0.0 0.0Other State Funds 0.0 0.0 0.0
Federal Funds 4,302.9 4,351.7 4,337.7Total 4,302.9 4,351.7 4,337.7
Actual Estimated RecommendedHeadcount (FTE) 9.0 10.0 11.0
Appropriations ($ thousands)Fund Category
MAJOR ACCOMPLISHMENTS • Developed and released The Blueprint for
Systems Redesign. This document provides a framework for a comprehensive, seven-year action plan on which the state can modernize and streamline services for some 200,000 people with developmental disabilities.
• Completed a four-year initiative to improve the
recruitment and retention of direct support professionals in Illinois. The initiative included 14 organizations and 10 individual and family employers of direct support professionals.
7 - 38
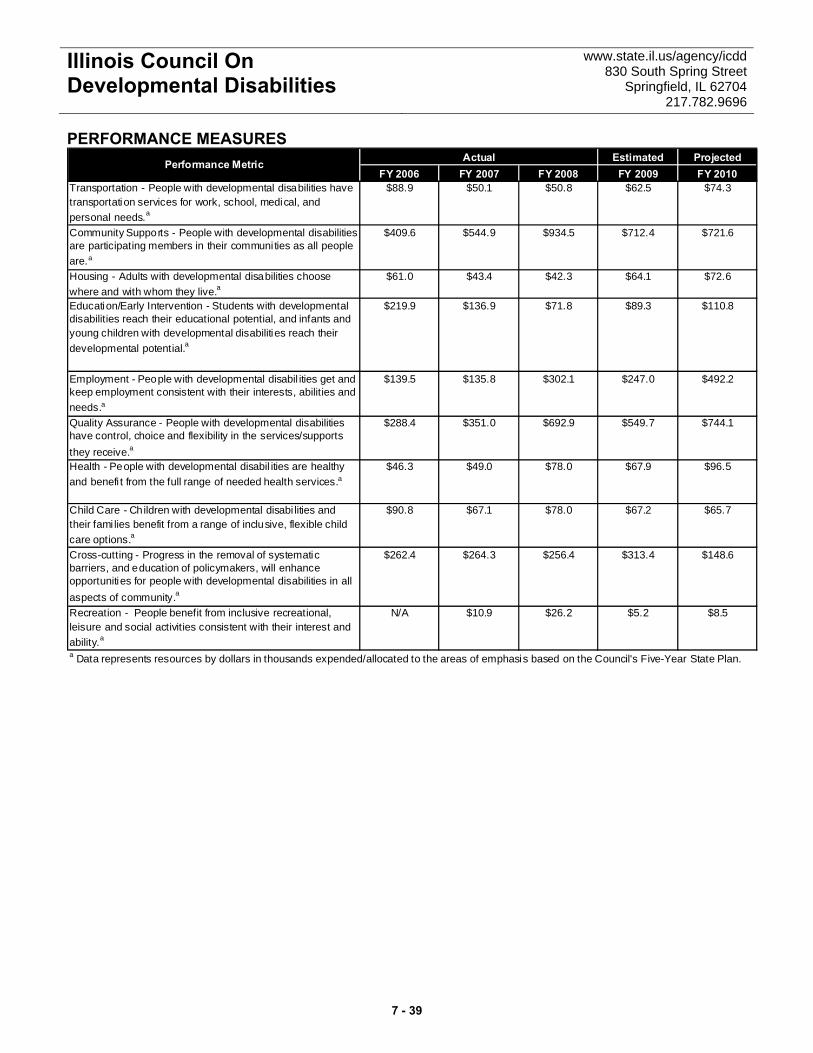
Illinois Council On Developmental Disabilities
www.state.il.us/agency/icdd 830 South Spring Street
Springfield, IL 62704 217.782.9696
PERFORMANCE MEASURES Estimated Projected
FY 2006 FY 2007 FY 2008 FY 2009 FY 2010Transportation - People with developmental disabilities have transportation services for work, school, medical, and personal needs.a
$88.9 $50.1 $50.8 $62.5 $74.3
Community Supports - People with developmental disabilities are participating members in their communi ties as all people are.a
$409.6 $544.9 $934.5 $712.4 $721.6
Housing - Adults with developmental disabilities choose where and with whom they live.a
$61.0 $43.4 $42.3 $64.1 $72.6
Education/Early Intervention - Students with developmental disabilities reach their educational potential, and infants and young children with developmental disabilities reach their developmental potential.a
$219.9 $136.9 $71.8 $89.3 $110.8
Employment - People with developmental disabil ities get and keep employment consistent with their interests, abilities and needs.a
$139.5 $135.8 $302.1 $247.0 $492.2
Quality Assurance - People with developmental disabilities have control, choice and flexibility in the services/supports they receive.a
$288.4 $351.0 $692.9 $549.7 $744.1
Health - People with developmental disabil ities are healthy and benefi t from the full range of needed health services.a
$46.3 $49.0 $78.0 $67.9 $96.5
Child Care - Children with developmental disabi lities and their fami lies benefit from a range of inclusive, flexible child care options.a
$90.8 $67.1 $78.0 $67.2 $65.7
Cross-cutting - Progress in the removal of systematic barriers, and education of policymakers, will enhance opportunities for people with developmental disabilities in all aspects of community.a
$262.4 $264.3 $256.4 $313.4 $148.6
Recreation - People benefit from inclusive recreational, leisure and social activities consistent with their interest and ability.a
N/A $10.9 $26.2 $5.2 $8.5
ActualPerformance Metric
a Data represents resources by dollars in thousands expended/allocated to the areas of emphasis based on the Council's Five-Year State Plan.
7 - 39
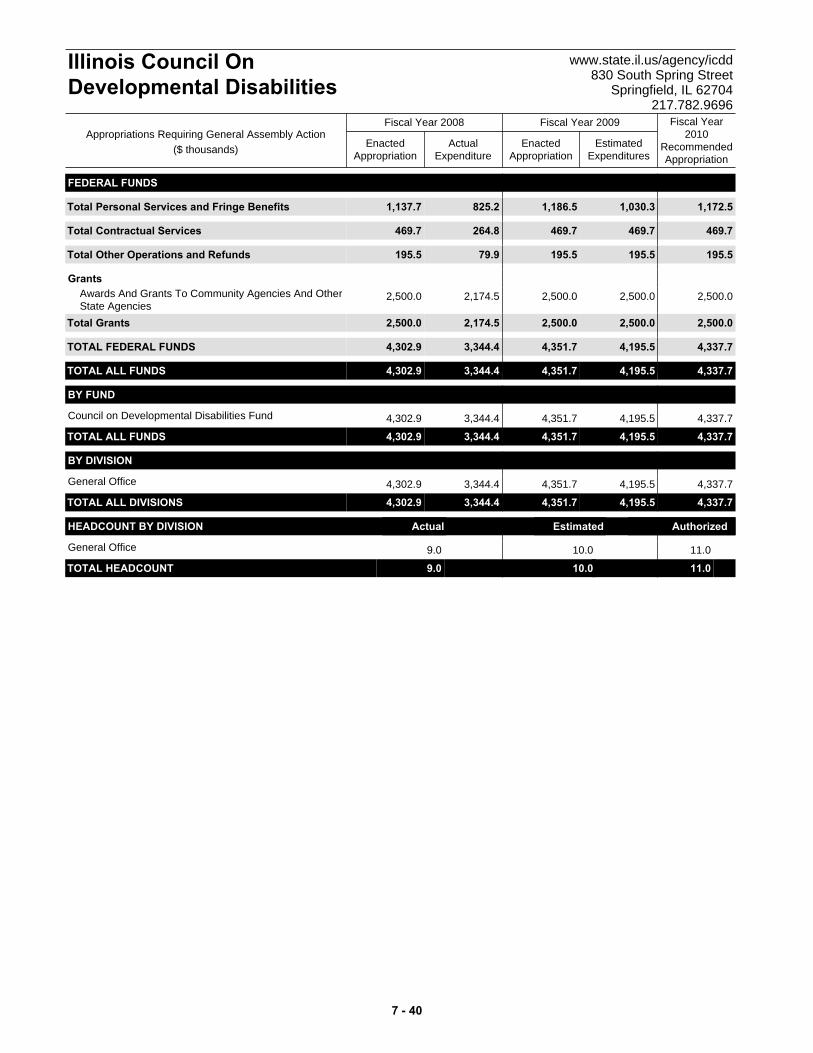
FEDERAL FUNDS
Total 1,137.7 1,172.51,030.31,186.5825.2Personal Services and Fringe Benefits
Total 469.7 469.7469.7469.7264.8Contractual Services
Total 195.5 195.5195.5195.579.9Other Operations and Refunds
Grants2,500.0 2,500.02,500.02,500.02,174.5Awards And Grants To Community Agencies And Other
State AgenciesTotal 2,500.0 2,500.02,500.02,500.02,174.5Grants
TOTAL FEDERAL FUNDS 4,302.9 4,337.74,195.54,351.73,344.4
TOTAL ALL FUNDS 4,302.9 4,337.74,195.54,351.73,344.4
BY FUND
4,302.9 4,337.74,195.54,351.73,344.4Council on Developmental Disabilities Fund
TOTAL ALL FUNDS 4,302.9 4,337.74,195.54,351.73,344.4
BY DIVISION
4,302.9 4,337.74,195.54,351.73,344.4General Office
TOTAL ALL DIVISIONS 4,302.9 4,337.74,195.54,351.73,344.4
HEADCOUNT BY DIVISION Actual Estimated Authorized
9.0 11.010.0General Office
TOTAL HEADCOUNT 9.0 11.010.0 t
ActualExpenditure
EnactedAppropriation
EstimatedExpenditures
EnactedAppropriation
Fiscal Year2010
RecommendedAppropriation
Fiscal Year 2008 Fiscal Year 2009
Illinois Council OnDevelopmental Disabilities
www.state.il.us/agency/icdd830 South Spring Street
Springfield, IL 62704217.782.9696
Appropriations Requiring General Assembly Action($ thousands)
7 - 40
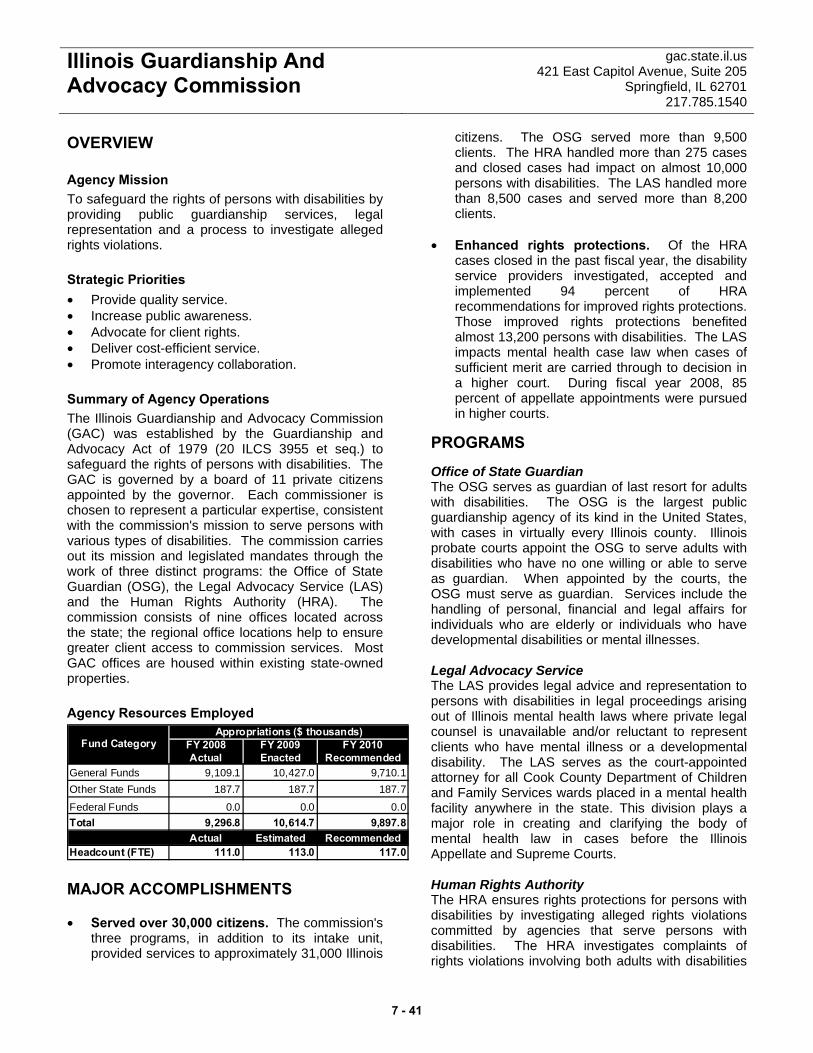
Illinois Guardianship And Advocacy Commission
gac.state.il.us 421 East Capitol Avenue, Suite 205
Springfield, IL 62701 217.785.1540
OVERVIEW
Agency Mission To safeguard the rights of persons with disabilities by providing public guardianship services, legal representation and a process to investigate alleged rights violations. Strategic Priorities • Provide quality service. • Increase public awareness. • Advocate for client rights. • Deliver cost-efficient service. • Promote interagency collaboration. Summary of Agency Operations The Illinois Guardianship and Advocacy Commission (GAC) was established by the Guardianship and Advocacy Act of 1979 (20 ILCS 3955 et seq.) to safeguard the rights of persons with disabilities. The GAC is governed by a board of 11 private citizens appointed by the governor. Each commissioner is chosen to represent a particular expertise, consistent with the commission's mission to serve persons with various types of disabilities. The commission carries out its mission and legislated mandates through the work of three distinct programs: the Office of State Guardian (OSG), the Legal Advocacy Service (LAS) and the Human Rights Authority (HRA). The commission consists of nine offices located across the state; the regional office locations help to ensure greater client access to commission services. Most GAC offices are housed within existing state-owned properties. Agency Resources Employed
FY 2008 FY 2009 FY 2010Actual Enacted Recommended
General Funds 9,109.1 10,427.0 9,710.1Other State Funds 187.7 187.7 187.7
Federal Funds 0.0 0.0 0.0Total 9,296.8 10,614.7 9,897.8
Actual Estimated RecommendedHeadcount (FTE) 111.0 113.0 117.0
Appropriations ($ thousands)Fund Category
MAJOR ACCOMPLISHMENTS • Served over 30,000 citizens. The commission's
three programs, in addition to its intake unit, provided services to approximately 31,000 Illinois
citizens. The OSG served more than 9,500 clients. The HRA handled more than 275 cases and closed cases had impact on almost 10,000 persons with disabilities. The LAS handled more than 8,500 cases and served more than 8,200 clients.
• Enhanced rights protections. Of the HRA
cases closed in the past fiscal year, the disability service providers investigated, accepted and implemented 94 percent of HRA recommendations for improved rights protections. Those improved rights protections benefited almost 13,200 persons with disabilities. The LAS impacts mental health case law when cases of sufficient merit are carried through to decision in a higher court. During fiscal year 2008, 85 percent of appellate appointments were pursued in higher courts.
PROGRAMS Office of State Guardian The OSG serves as guardian of last resort for adults with disabilities. The OSG is the largest public guardianship agency of its kind in the United States, with cases in virtually every Illinois county. Illinois probate courts appoint the OSG to serve adults with disabilities who have no one willing or able to serve as guardian. When appointed by the courts, the OSG must serve as guardian. Services include the handling of personal, financial and legal affairs for individuals who are elderly or individuals who have developmental disabilities or mental illnesses. Legal Advocacy Service The LAS provides legal advice and representation to persons with disabilities in legal proceedings arising out of Illinois mental health laws where private legal counsel is unavailable and/or reluctant to represent clients who have mental illness or a developmental disability. The LAS serves as the court-appointed attorney for all Cook County Department of Children and Family Services wards placed in a mental health facility anywhere in the state. This division plays a major role in creating and clarifying the body of mental health law in cases before the Illinois Appellate and Supreme Courts. Human Rights Authority The HRA ensures rights protections for persons with disabilities by investigating alleged rights violations committed by agencies that serve persons with disabilities. The HRA investigates complaints of rights violations involving both adults with disabilities
7 - 41
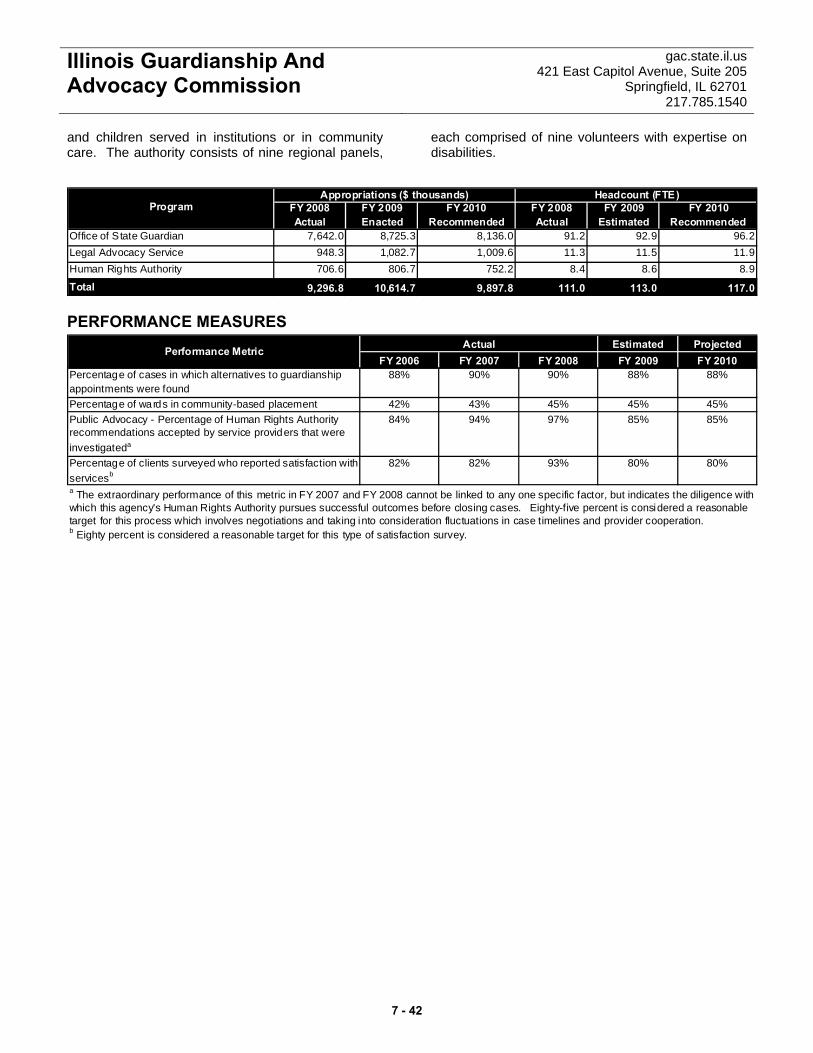
Illinois Guardianship And Advocacy Commission
gac.state.il.us 421 East Capitol Avenue, Suite 205
Springfield, IL 62701 217.785.1540
and children served in institutions or in community care. The authority consists of nine regional panels,
each comprised of nine volunteers with expertise on disabilities.
Program FY 2008 FY 2009 FY 2010 FY 2008 FY 2009 FY 2010Actual Enacted Recommended Actual Estimated Recommended
Office of State Guardian 7,642.0 8,725.3 8,136.0 91.2 92.9 96.2Legal Advocacy Service 948.3 1,082.7 1,009.6 11.3 11.5 11.9Human Rights Authority 706.6 806.7 752.2 8.4 8.6 8.9
Total 9,296.8 10,614.7 9,897.8 111.0 113.0 117.0
Appropriations ($ thousands) Headcount (FTE)
PERFORMANCE MEASURES Estimated Projected
FY 2006 FY 2007 FY 2008 FY 2009 FY 2010Percentage of cases in which alternatives to guardianship appointments were found
88% 90% 90% 88% 88%
Percentage of wards in community-based placement 42% 43% 45% 45% 45%Public Advocacy - Percentage of Human Rights Authority recommendations accepted by service providers that were investigateda
84% 94% 97% 85% 85%
Percentage of clients surveyed who reported satisfaction with servicesb
82% 82% 93% 80% 80%
ActualPerformance Metric
a The extraordinary performance of this metric in FY 2007 and FY 2008 cannot be linked to any one specific factor, but indicates the diligence with which this agency's Human Rights Authority pursues successful outcomes before closing cases. Eighty-five percent is considered a reasonable target for this process which involves negotiations and taking into consideration fluctuations in case timelines and provider cooperation.b Eighty percent is considered a reasonable target for this type of satisfaction survey.
7 - 42

GENERAL FUNDS
Total 8,459.0 8,792.19,542.79,542.78,458.7Personal Services and Fringe Benefits
Total 241.9 354.2320.5320.5241.9Contractual Services
Total 408.2 563.8563.8563.8407.5Other Operations and Refunds
TOTAL GENERAL FUNDS 9,109.1 9,710.110,427.010,427.09,108.1
OTHER STATE FUNDS
Designated Purposes187.7 187.7187.7187.7110.2For services pursuant to Section 5 of Guardianship and
Advocacy ActTotal 187.7 187.7187.7187.7110.2Designated Purposes
TOTAL OTHER STATE FUNDS 187.7 187.7187.7187.7110.2
TOTAL ALL FUNDS 9,296.8 9,897.810,614.710,614.79,218.4
BY FUND
9,109.1 9,710.110,427.010,427.09,108.1General Revenue Fund
187.7 187.7187.7187.7110.2Guardianship and Advocacy Fund
TOTAL ALL FUNDS 9,296.8 9,897.810,614.710,614.79,218.4
BY DIVISION
9,296.8 9,897.810,614.710,614.79,218.4General Office
TOTAL ALL DIVISIONS 9,296.8 9,897.810,614.710,614.79,218.4
HEADCOUNT BY DIVISION Actual Estimated Authorized
111.0 117.0113.0General Office
TOTAL HEADCOUNT 111.0 117.0113.0 t
ActualExpenditure
EnactedAppropriation
EstimatedExpenditures
EnactedAppropriation
Fiscal Year2010
RecommendedAppropriation
Fiscal Year 2008 Fiscal Year 2009
Illinois Guardianship AndAdvocacy Commission
gac.state.il.us421 East Capitol Avenue, Suite 205
Springfield, IL 62701217.785.1540
Appropriations Requiring General Assembly Action($ thousands)
7 - 43

Illinois Violence Prevention Authority
www.ivpa.org 100 West Randolph, Room 6-600
Chicago, IL 60601 312.814.2796
OVERVIEW Agency Mission To plan, coordinate, fund, assist and evaluate local and statewide violence prevention programs in the state. Strategic Priorities • Promote systemic approaches to violence
prevention in health, education, law enforcement and community systems.
• Target resources/programs to high-risk groups, such as young children exposed to violence.
• Coordinate and collaborate with other state agencies to implement the Safety Net Works Initiative and other violence prevention efforts.
• Promote the leadership and involvement of youth in violence prevention efforts.
• Assist in the development of additional violence prevention programs through technical assistance and program development.
• Promote effective evaluations of violence prevention programs.
Summary of Agency Operations The Illinois Violence Prevention Authority (IVPA) takes a public health and public safety approach to preventing all forms of interpersonal violence, including family violence, youth/gang violence, sexual violence and hate violence. The primary responsibility of IVPA is to provide funding through grants to support community and statewide violence prevention programs and initiatives, including the Illinois Family Violence Coordinating Council (IFVCC) program. IVPA provides program monitoring as well as development and technical assistance activities to increase the number of effective programs. Agency Resources Employed
FY 2008 FY 2009 FY 2010Actual Enacted Recommended
General Funds 4,013.6 3,513.6 3,408.2Other State Funds 2,036.1 2,042.5 1,994.1
Federal Funds 0.0 0.0 0.0Total 6,049.7 5,556.1 5,402.3
Actual Estimated RecommendedHeadcount (FTE) 12.0 12.0 12.0
Appropriations ($ thousands)Fund Category
MAJOR ACCOMPLISHMENTS • Served as fiscal administrator of Safety Net
Works grants. The Illinois Violence Prevention Authority was the fiscal administrator for 17 sites in Illinois in collaboration with the Governor's Office, Department of Human Services, Department of Children and Family Services, Criminal Justice Information Authority, Department of Public Health, Department of Corrections and other state agencies.
• Supported Family Violence Coordinating
Councils. The Illinois Violence Prevention Authority provided support to councils in all of the judicial circuits in Illinois.
• Provided funding and program development
assistance. IVPA provides assistance to Safe from the Start and Illinois Health Care grantees.
• Provided grants to support youth led violence
prevention work. IVPA supports violence prevention work in 25 communities across Illinois, including implementation of the Choose Respect awareness program in collaboration with the Centers for Disease Control.
• Provided leadership and funding support for
the Illinois Children's Mental Health Partnership (ICMHP). ICMHP represents families, child advocates, education, early childhood, health, mental health, child welfare, juvenile justice, substance abuse, violence prevention and other advocates.
• Developed strategic five-year goals. These
goals emerged from a year-long planning process and engaged three new partners to help lead task forces that will develop and implement action plans for each of the strategic goals.
7 - 44
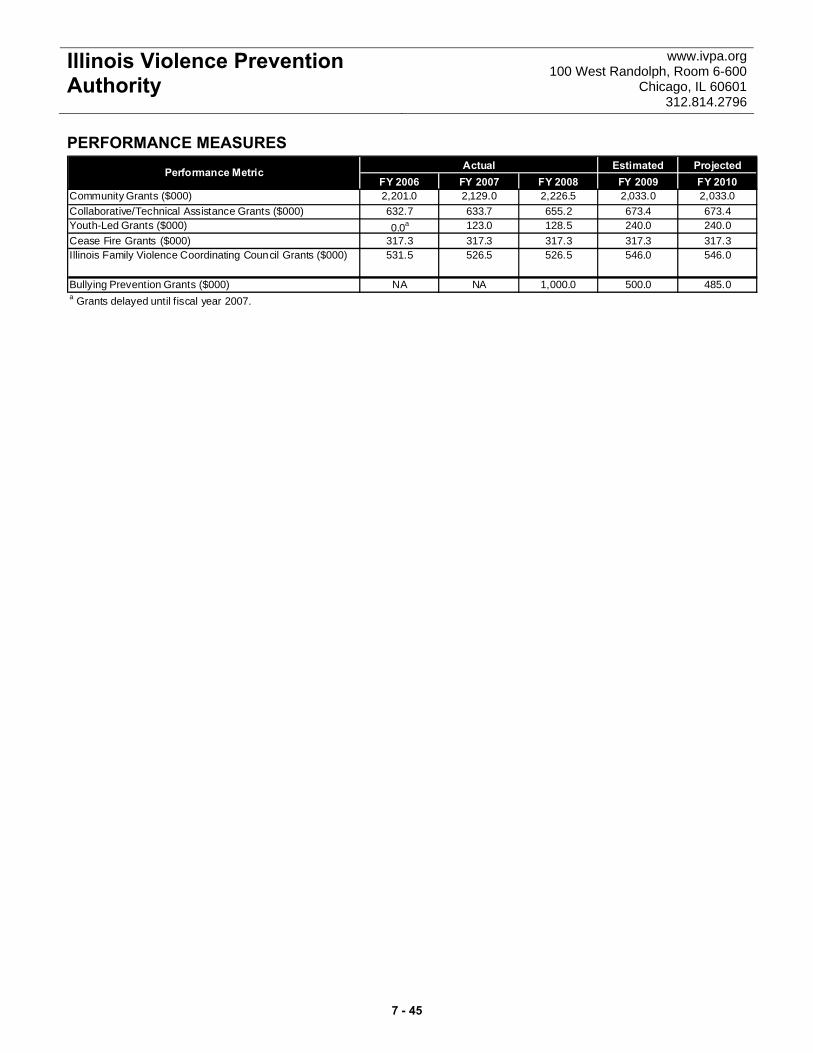
Illinois Violence Prevention Authority
www.ivpa.org 100 West Randolph, Room 6-600
Chicago, IL 60601 312.814.2796
PERFORMANCE MEASURES Estimated Projected
FY 2006 FY 2007 FY 2008 FY 2009 FY 2010Community Grants ($000) 2,201.0 2,129.0 2,226.5 2,033.0 2,033.0Collaborative/Technical Assistance Grants ($000) 632.7 633.7 655.2 673.4 673.4Youth-Led Grants ($000) 0.0a 123.0 128.5 240.0 240.0Cease Fire Grants ($000) 317.3 317.3 317.3 317.3 317.3Illinois Family Violence Coordinating Council Grants ($000) 531.5 526.5 526.5 546.0 546.0
Bullying Prevention Grants ($000) NA NA 1,000.0 500.0 485.0
ActualPerformance Metric
a Grants delayed until fiscal year 2007.
7 - 45
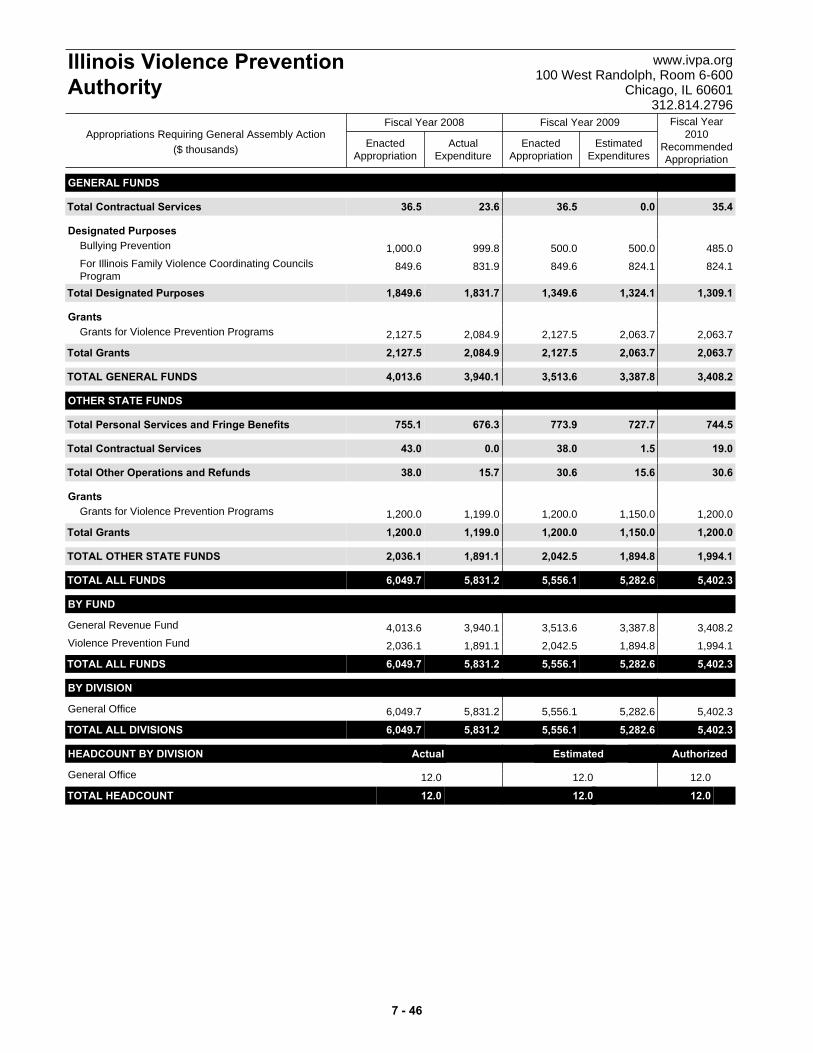
GENERAL FUNDS
Total 36.5 35.40.036.523.6Contractual Services
Designated Purposes1,000.0 485.0500.0500.0999.8Bullying Prevention
849.6 824.1824.1849.6831.9For Illinois Family Violence Coordinating CouncilsProgram
Total 1,849.6 1,309.11,324.11,349.61,831.7Designated Purposes
Grants2,127.5 2,063.72,063.72,127.52,084.9Grants for Violence Prevention Programs
Total 2,127.5 2,063.72,063.72,127.52,084.9Grants
TOTAL GENERAL FUNDS 4,013.6 3,408.23,387.83,513.63,940.1
OTHER STATE FUNDS
Total 755.1 744.5727.7773.9676.3Personal Services and Fringe Benefits
Total 43.0 19.01.538.00.0Contractual Services
Total 38.0 30.615.630.615.7Other Operations and Refunds
Grants1,200.0 1,200.01,150.01,200.01,199.0Grants for Violence Prevention Programs
Total 1,200.0 1,200.01,150.01,200.01,199.0Grants
TOTAL OTHER STATE FUNDS 2,036.1 1,994.11,894.82,042.51,891.1
TOTAL ALL FUNDS 6,049.7 5,402.35,282.65,556.15,831.2
BY FUND
4,013.6 3,408.23,387.83,513.63,940.1General Revenue Fund
2,036.1 1,994.11,894.82,042.51,891.1Violence Prevention Fund
TOTAL ALL FUNDS 6,049.7 5,402.35,282.65,556.15,831.2
BY DIVISION
6,049.7 5,402.35,282.65,556.15,831.2General Office
TOTAL ALL DIVISIONS 6,049.7 5,402.35,282.65,556.15,831.2
HEADCOUNT BY DIVISION Actual Estimated Authorized
12.0 12.012.0General Office
TOTAL HEADCOUNT 12.0 12.012.0 t
ActualExpenditure
EnactedAppropriation
EstimatedExpenditures
EnactedAppropriation
Fiscal Year2010
RecommendedAppropriation
Fiscal Year 2008 Fiscal Year 2009
Illinois Violence PreventionAuthority
www.ivpa.org100 West Randolph, Room 6-600
Chicago, IL 60601312.814.2796
Appropriations Requiring General Assembly Action($ thousands)
7 - 46

Department Of Juvenile Justice www.idjj.state.il.us 707 North 15th Street Springfield, IL 62702
217.558.2200
OVERVIEW Agency Mission To provide treatment and services through a comprehensive continuum of individualized educational, vocational, social, emotional and basic life skills that will enable youth to avoid delinquent futures and become productive, fulfilled citizens. Strategic Priorities • Develop and implement performance-based
standards that are consistent with contemporary practices in the field of juvenile justice.
• Implement a new Aftercare system that is designed to enhance the chances for success upon a youth’s re-entry into the community.
• Increase the number of educators throughout the system to meet the department's mandates to provide adequate educational services for all youth.
• Hire and train new Juvenile Justice Specialist personnel.
Summary of Agency Operations The Department of Juvenile Justice (DJJ) continues to develop a structural framework and foundation necessary to deliver services to youth. The partnership with the Public Safety Shared Services Center provides administrative and support services for DJJ, allowing the department to focus on its core mission of enabling youth to avoid delinquent futures. Agency Resources Employed
FY 2008 FY 2009 FY 2010Actual Enacted Recommended
General Funds 126,334.8 126,371.4 124,706.9Other State Funds 13,000.0 13,000.0 17,000.0
Federal Funds 0.0 0.0 0.0Total 139,334.8 139,371.4 141,706.9
Actual Estimated RecommendedHeadcount (FTE) 1,147.0 1,207.0 1,232.0
Appropriations ($ thousands)Fund Category
MAJOR ACCOMPLISHMENTS • Hired the first class of Juvenile Justice
Specialists and implemented specialized training geared toward juvenile justice best practices. Creation of this position was a major step in changing the culture of juvenile justice. These individuals will assist the department in providing
more individualized services while maintaining pubic safety.
• Appointed a new school district
superintendent to carry out and administer the department’s educational programs. The addition of the department’s superintendent is a major step forward in ensuring that the youth receive the necessary educational requirements.
• Provided new uniforms. Having staff dress in a
unique uniform designed for the Department of Juvenile Justice is yet another step toward transitioning away from a corrections oriented system to a juvenile justice system.
KEY BUDGET INITIATIVES • Federal recovery. DJJ will receive
approximately $4 million in funding to implement the department’s Aftercare system, which will expand community-based services for youth in an effort to reduce recidivism.
• Continue to recruit and train Juvenile Justice
Specialists. The new staff will enhance the department’s efforts to provide life skills to the institution’s youth, helping them avoid illegal behaviors.
• Consolidation of facilities for girls. The Pere
Marquette operations will be consolidated at the Warrenville Youth Center. Savings will be achieved by closing an underutilized facility and consolidating the care and treatment of girls at a single location.
PROGRAMS Youth Centers DJJ manages eight youth centers across the state and houses more than 1,400 juveniles. The educational programs, counseling and medical services provided at the youth centers are designed to improve the youths’ life chances. Aftercare The Department of Juvenile Justice's new Aftercare system will begin operation during fiscal year 2010. The Aftercare system, a key component of the department's continuum of care, will include dedicated, trained specialists and administrative staff responsible for coordinating, monitoring and
7 - 47

Department Of Juvenile Justice www.idjj.state.il.us 707 North 15th Street Springfield, IL 62702
217.558.2200
managing Aftercare services for more than 2,000 juveniles statewide. Education School District 428 is responsible for specialized curriculum development and classroom instruction tailored to DJJ's youth. In addition to ensuring that all youth receive their federal and state mandated classroom instruction, School District 428 also provides vocational training and post-secondary courses for youth who have their GED certificates or high school diplomas.
Administration The Department of Juvenile Justice's administration is responsible for the ongoing development of departmental policies and administrative directives. In addition, continued implementation of performance-based standards defines the core functions of the agency. Traditional administrative support such as human resources, timekeeping, payroll processing, accounting and budgeting are handled through the Public Safety Shared Services Center.
Program FY 2008 FY 2009 FY 2010 FY 2008 FY 2009 FY 2010Actual Enacted Recommended Actual Estimated Recommended
Youth Centers 112,560.0 114,644.5 115,271.5 1,039.0 1,075.0 1,082.0Aftercare 7,684.8 5,556.5 6,204.0 3.0 1.0 1.0Education 17,809.4 17,752.5 18,432.7 105.0 130.0 147.0Administration 1,280.6 1,417.9 1,798.7 0.0 1.0 2.0
Total 139,334.8 139,371.4 141,706.9 1,147.0 1,207.0 1,232.0
Appropriations ($ thousands) Headcount (FTE)
PERFORMANCE MEASURES Estimated Projected
FY 2006 FY 2007 FY 2008 FY 2009 FY 2010Percentage of juveniles returned to youth centers within three years of release
56.9% 55.4% 48.9% 45.9% 42.9%
Education spending per capita $6,499 $4,321 $6,121 $6,462 $8,301Aftercare services spending per capita $2,542 $1,438 $2,049 $1,057 $2,122
ActualPerformance Metric
7 - 48

ActualExpenditure
EnactedAppropriation
EstimatedExpenditures
EnactedAppropriation
Fiscal Year2010
RecommendedAppropriation
Fiscal Year 2008 Fiscal Year 2009
Department Of Juvenile Justice www.idjj.state.il.us707 North 15th StreetSpringfield, IL 62702
217.558.2200
Appropriations Requiring General Assembly Action($ thousands)
GENERAL FUNDS
Total 95,054.2 97,166.595,531.199,400.492,498.1Personal Services and Fringe Benefits
Total 23,473.8 21,432.420,721.520,657.422,025.3Contractual Services
Total 5,347.8 5,701.55,701.55,647.54,894.5Other Operations and Refunds
Designated Purposes489.8 80.2450.0489.846.3Statewide Hospitalization
1,606.9 0.00.00.00.0Additional Frontline Staff
Total 2,096.7 80.2450.0489.846.3Designated Purposes
Grants41.8 41.841.841.80.0Reimbursement to Counties for State's Share of
Assistant State's Attorneys' Salaries Per Ch. 53 of theIllinois Revised Statutes
37.5 37.537.537.50.0Sheriffs' Fees for Conveying Youth
47.0 47.047.047.00.0Tort Claims
Total 126.3 126.3126.3126.30.0Grants
Capital Improvements236.0 200.050.050.0185.2Repair and Maintenance
Total 236.0 200.050.050.0185.2Capital Improvements
TOTAL GENERAL FUNDS 126,334.8 124,706.9122,580.4126,371.4119,649.4
OTHER STATE FUNDS
Designated Purposes3,000.0 3,000.01,665.13,000.02,438.0Federal Programs
0.0 4,000.00.00.00.0Federal Recovery - Aftercare Programs
5,000.0 5,000.04,956.35,000.0360.8Miscellaneous Programs
5,000.0 5,000.02,009.45,000.02,540.8School District Programs
Total 13,000.0 17,000.08,630.813,000.05,339.7Designated Purposes
TOTAL OTHER STATE FUNDS 13,000.0 17,000.08,630.813,000.05,339.7
TOTAL ALL FUNDS 139,334.8 141,706.9131,211.2139,371.4124,989.1
BY FUND
126,334.8 124,706.9122,580.4126,371.4119,649.4General Revenue Fund
13,000.0 17,000.08,630.813,000.05,339.7Department of Corrections Reimbursement and EducationFundTOTAL ALL FUNDS 139,334.8 141,706.9131,211.2139,371.4124,989.1
BY DIVISION
16,313.3 18,378.910,354.514,657.76,150.3General Office
8,902.5 11,132.79,066.110,452.58,434.8School District
4,114.8 1,474.01,482.31,986.52,823.1Aftercare Services
8,367.4 8,824.08,529.08,722.68,117.8IYC - Chicago
21,306.2 20,514.220,790.422,086.120,560.5IYC - Harrisburg
17,508.8 18,993.817,687.817,228.617,364.1IYC - Joliet
18,082.7 19,165.818,782.518,358.118,013.9IYC - Kewanee
7 - 49
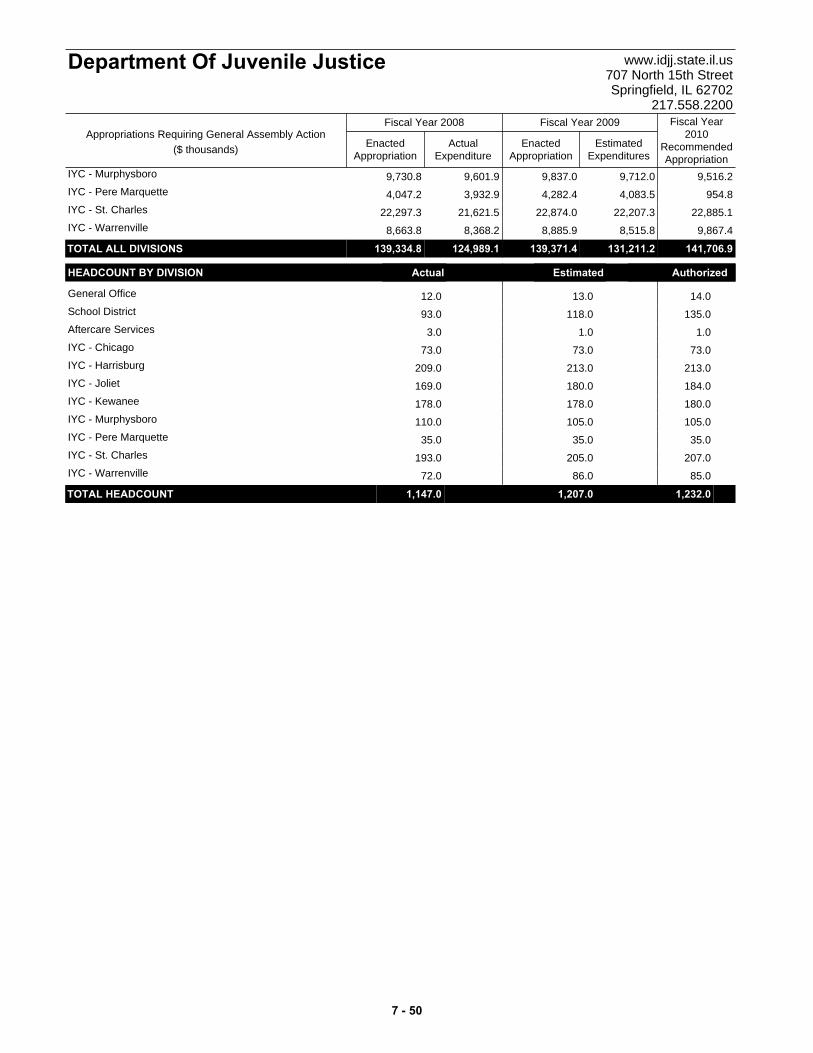
ActualExpenditure
EnactedAppropriation
EstimatedExpenditures
EnactedAppropriation
Fiscal Year2010
RecommendedAppropriation
Fiscal Year 2008 Fiscal Year 2009
Department Of Juvenile Justice www.idjj.state.il.us707 North 15th StreetSpringfield, IL 62702
217.558.2200
Appropriations Requiring General Assembly Action($ thousands)
9,730.8 9,516.29,712.09,837.09,601.9IYC - Murphysboro
4,047.2 954.84,083.54,282.43,932.9IYC - Pere Marquette
22,297.3 22,885.122,207.322,874.021,621.5IYC - St. Charles
8,663.8 9,867.48,515.88,885.98,368.2IYC - Warrenville
TOTAL ALL DIVISIONS 139,334.8 141,706.9131,211.2139,371.4124,989.1
HEADCOUNT BY DIVISION Actual Estimated Authorized
12.0 14.013.0General Office
93.0 135.0118.0School District
3.0 1.01.0Aftercare Services
73.0 73.073.0IYC - Chicago
209.0 213.0213.0IYC - Harrisburg
169.0 184.0180.0IYC - Joliet
178.0 180.0178.0IYC - Kewanee
110.0 105.0105.0IYC - Murphysboro
35.0 35.035.0IYC - Pere Marquette
193.0 207.0205.0IYC - St. Charles
72.0 85.086.0IYC - Warrenville
TOTAL HEADCOUNT 1,147.0 1,232.01,207.0 t
7 - 50

Department Of Public Health www.idph.state.il.us 535 West Jefferson Street
Springfield, IL 62762 217.782.4977
OVERVIEW Agency Mission To partner with the citizens and communities of Illinois to protect, promote and improve the health of all Illinoisans. Strategic Priorities • Strengthen bioterrorism and emergency
readiness and enhance the relationship with the Illinois Army National Guard.
• Reduce health care disparities. • Strengthen the public health infrastructure. • Promote patient safety. • Renew community engagement and collaboration
with other state agencies. Summary of Agency Operations The Illinois Department of Public Health (DPH) protects the state's 12.4 million residents, as well as visitors, through the prevention and control of disease and injury. With more than 200 programs organized in nine offices, the department provides and supports a broad range of services. Programs and services include: childhood immunization; food, water and drug testing; hospital and nursing home licensure to assure quality care; infectious diseases control; vital records; health statistics collection and evaluation to support prevention and regulatory programs; public policy development and analyses; newborn screenings for genetic disorders; women’s health promotion; and emergency preparedness. These programs touch virtually every age, aspect and cycle of life. Agency Resources Employed
FY 2008 FY 2009 FY 2010Actual Enacted Recommended
General Funds 159,623.9 160,421.7 150,295.5Other State Funds 83,530.5 96,155.9 102,815.9
Federal Funds 188,170.2 188,428.1 211,783.5Total 431,324.6 445,005.7 464,894.9
Actual Estimated RecommendedHeadcount (FTE) 1,103.0 1,157.0 1,177.0
Appropriations ($ thousands)Fund Category
MAJOR ACCOMPLISHMENTS • Expanded the Illinois Breast and Cervical
Cancer Program (IBCCP). The IBCCP received a funding increase of $5 million to serve an
additional 10,000 uninsured women. In fiscal year 2008, the program saw 28,500 women, a 31 percent increase from the previous year, and the goal is to see 36,000 women in fiscal year 2009. IBCCP provides women 35 years of age and older with free breast and cervical cancer screening and diagnostics. To encourage more women to participate, the program partnered with Walgreens to offer $25 gift cards to women who signed up for IBCCP and kept their appointment for a mammogram. In addition, a 250 percent of poverty cap for participation was eliminated in October 2007 so that all uninsured women, no matter their income, became eligible for the program.
• Implemented the Smoke-free Illinois Act. The
law is one of the most far-reaching anti-smoking laws in the country, and its enactment has been called one of the most significant landmarks in Illinois public health history. It prohibits smoking in public places, such as bars, restaurants and workplaces. During the past year, the department has handled more than 5,000 complaints concerning enforcement of the law, but most businesses are complying and the public has expressed overwhelming support.
• Increased the state’s capacity to deal with
bioterrorism and infectious disease outbreaks. The department added Biosafety Level 3 laboratories to its three laboratories in Chicago, Springfield and Carbondale to expand the state’s capabilities to deal with bioterrorism and infectious disease outbreaks. Level 3 laboratories have special engineering and design features necessary for trained personnel to work safely with indigenous or exotic agents that may cause serious or potentially lethal diseases.
• Implemented Cystic Fibrosis screening of
newborns, the 38th genetic or metabolic disorder for which Illinois newborns are screened. After sickle cell disease, cystic fibrosis is the most common life-shortening genetic disorder. The addition of this test brings Illinois to the forefront of newborn screening, which helps to ensure that all newborns are given the best opportunity to achieve the best possible health outcome.
• Completed the state’s new $10 million
Electronic Death Registration System. Local registrars, county clerks, funeral directors, coroners, medical examiners and physicians have begun electronically filing death records.
7 - 51
Department Of Public Health www.idph.state.il.us 535 West Jefferson Street
Springfield, IL 62762 217.782.4977
By compiling this information electronically, the department is further improving its efficiency and providing a quicker turnaround in producing death records.
• Launched a special vital records Web site in
Spanish. The Web site contains information about birth certificates, death certificates, marriage and divorce records, adoption, genealogy, international travel and surrogate parentage. The site explains who is eligible to request documents and how to apply, documentation needed to request a record, the fees associated with a records request and other frequently asked questions.
KEY BUDGET INITIATIVES • Federal recovery. Illinois will receive
approximately $9 million for the purchase of vaccines and for related operations from the federal Section 317 Immunization Program. Other funds will go toward prevention and wellness strategies that address chronic disease rates, as well as grants which will assist in implementing measures to reduce healthcare-associated infections. Also, funds will assist in the construction and operation of community health centers. This will help expand health care for uninsured and underserved populations in rural and urban areas. Finally, federal scholarships and loan repayment programs will help train and educate primary care providers, including physicians, dentists and nurses.
• Maintains funding at the fiscal year 2009 level
for The Illinois Breast and Cervical Cancer Program will maintain $11 million general revenue funds, which included a $5 million increase over fiscal year 2008. Uninsured women, regardless of their income, aged 35 and older are eligible for free breast and cervical cancer screening and diagnostics through the program.
• Maintains the fiscal year 2009 increase for The
AIDS Drug Assistance Program of $1.5 million to continue the expanded income eligibility from 400% to 500% of the federal poverty level.
PROGRAMS Health Policy, Planning and Statistics This office collects, analyzes and evaluates information on health status, health needs and disease occurrence in Illinois residents to conduct epidemiologic studies and support health assessments. It also focuses on identification of future needs for health care facilities, services and personnel. The program processes applications for health care facility construction, as well as modification and acquisition of medical equipment. Also administers grant and loan programs to enhance access to health care for rural and underserved areas. Lastly, in addition, this office also includes the division of Patient Safety. Public Health Preparedness Public Health Preparedness coordinates the department's response and recovery operations for statewide public health emergencies; develops emergency operating procedures for natural, bioterrorism and technological disaster response and recovery activities; serves as the department liaison in the State Emergency Operations Center (SEOC) during statewide emergency operations; and ensures essential health and medical services are available when local resources are overwhelmed as a result of an emergency situation. Program and Administrative Support The office preserves the state's vital records, establishes certification standards and provides technical assistance to Local Health Departments (LHDs), handles electronic distribution of critical health information to LHDs, and oversees the department's seven regional offices. Responsibilities also include administrative services ranging from budget operations and fiscal control to information technology, personnel, training, payroll, legal services and minority health. Health Promotion This office promotes healthy lifestyles for all Illinois citizens and includes child health programs, such as newborn screening for genetic disorders and vision and hearing screening. Programs include the prevention and control of tobacco use, comprehensive cancer control and cardiovascular disease risk reduction. Health Care Regulation Health Care Regulation performs licensing, inspections, and Medicare and Medicaid certifications of long term care facilities, hospitals and other health
7 - 52
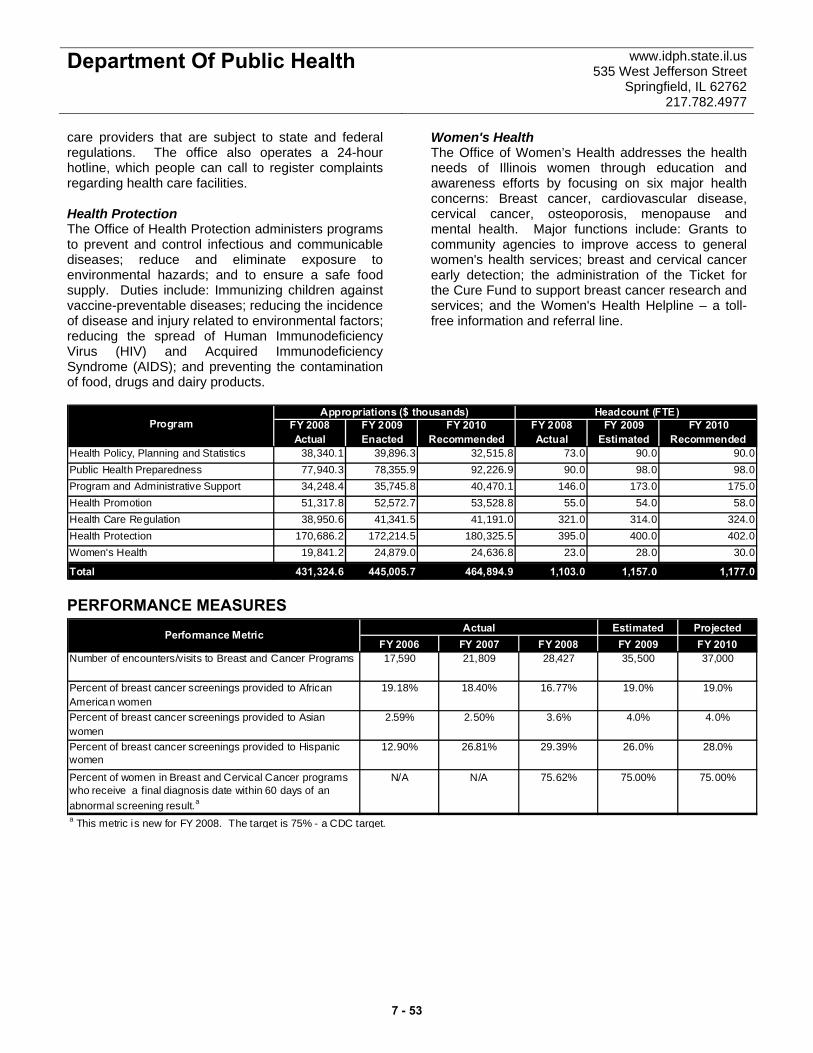
Department Of Public Health www.idph.state.il.us 535 West Jefferson Street
Springfield, IL 62762 217.782.4977
care providers that are subject to state and federal regulations. The office also operates a 24-hour hotline, which people can call to register complaints regarding health care facilities. Health Protection The Office of Health Protection administers programs to prevent and control infectious and communicable diseases; reduce and eliminate exposure to environmental hazards; and to ensure a safe food supply. Duties include: Immunizing children against vaccine-preventable diseases; reducing the incidence of disease and injury related to environmental factors; reducing the spread of Human Immunodeficiency Virus (HIV) and Acquired Immunodeficiency Syndrome (AIDS); and preventing the contamination of food, drugs and dairy products.
Women's Health The Office of Women’s Health addresses the health needs of Illinois women through education and awareness efforts by focusing on six major health concerns: Breast cancer, cardiovascular disease, cervical cancer, osteoporosis, menopause and mental health. Major functions include: Grants to community agencies to improve access to general women's health services; breast and cervical cancer early detection; the administration of the Ticket for the Cure Fund to support breast cancer research and services; and the Women's Health Helpline – a toll-free information and referral line.
Program FY 2008 FY 2009 FY 2010 FY 2008 FY 2009 FY 2010Actual Enacted Recommended Actual Estimated Recommended
Health Policy, Planning and Statistics 38,340.1 39,896.3 32,515.8 73.0 90.0 90.0Public Health Preparedness 77,940.3 78,355.9 92,226.9 90.0 98.0 98.0Program and Administrative Support 34,248.4 35,745.8 40,470.1 146.0 173.0 175.0Health Promotion 51,317.8 52,572.7 53,528.8 55.0 54.0 58.0Health Care Regulation 38,950.6 41,341.5 41,191.0 321.0 314.0 324.0Health Protection 170,686.2 172,214.5 180,325.5 395.0 400.0 402.0Women's Health 19,841.2 24,879.0 24,636.8 23.0 28.0 30.0
Total 431,324.6 445,005.7 464,894.9 1,103.0 1,157.0 1,177.0
Appropriations ($ thousands) Headcount (FTE)
PERFORMANCE MEASURES Estimated Projected
FY 2006 FY 2007 FY 2008 FY 2009 FY 2010Number of encounters/visits to Breast and Cancer Programs 17,590 21,809 28,427 35,500 37,000
Percent of breast cancer screenings provided to African American women
19.18% 18.40% 16.77% 19.0% 19.0%
Percent of breast cancer screenings provided to Asian women
2.59% 2.50% 3.6% 4.0% 4.0%
Percent of breast cancer screenings provided to Hispanic women
12.90% 26.81% 29.39% 26.0% 28.0%
Percent of women in Breast and Cervical Cancer programs who receive a final diagnosis date within 60 days of an abnormal screening result.a
N/A N/A 75.62% 75.00% 75.00%
ActualPerformance Metric
a This metric is new for FY 2008. The target is 75% - a CDC target.
7 - 53
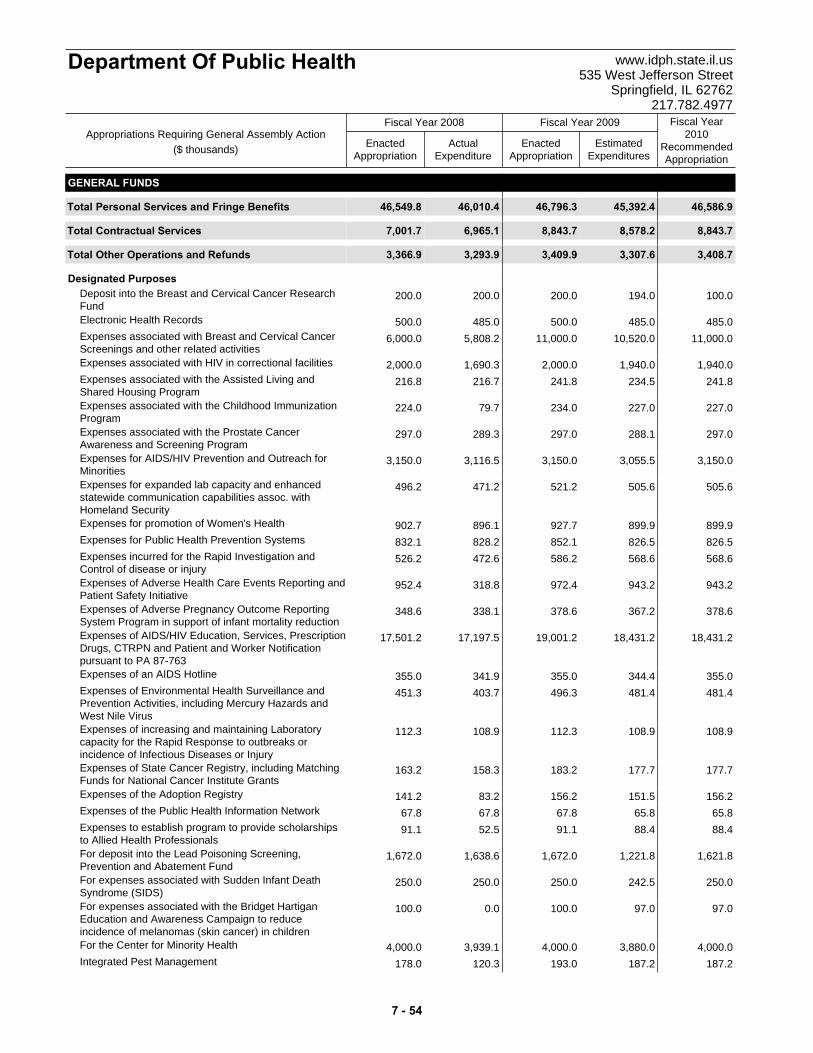
ActualExpenditure
EnactedAppropriation
EstimatedExpenditures
EnactedAppropriation
Fiscal Year2010
RecommendedAppropriation
Fiscal Year 2008 Fiscal Year 2009
Department Of Public Health www.idph.state.il.us535 West Jefferson Street
Springfield, IL 62762217.782.4977
Appropriations Requiring General Assembly Action($ thousands)
GENERAL FUNDS
Total 46,549.8 46,586.945,392.446,796.346,010.4Personal Services and Fringe Benefits
Total 7,001.7 8,843.78,578.28,843.76,965.1Contractual Services
Total 3,366.9 3,408.73,307.63,409.93,293.9Other Operations and Refunds
Designated Purposes200.0 100.0194.0200.0200.0Deposit into the Breast and Cervical Cancer Research
Fund500.0 485.0485.0500.0485.0Electronic Health Records
6,000.0 11,000.010,520.011,000.05,808.2Expenses associated with Breast and Cervical CancerScreenings and other related activities
2,000.0 1,940.01,940.02,000.01,690.3Expenses associated with HIV in correctional facilities
216.8 241.8234.5241.8216.7Expenses associated with the Assisted Living andShared Housing Program
224.0 227.0227.0234.079.7Expenses associated with the Childhood ImmunizationProgram
297.0 297.0288.1297.0289.3Expenses associated with the Prostate CancerAwareness and Screening Program
3,150.0 3,150.03,055.53,150.03,116.5Expenses for AIDS/HIV Prevention and Outreach forMinorities
496.2 505.6505.6521.2471.2Expenses for expanded lab capacity and enhancedstatewide communication capabilities assoc. withHomeland Security
902.7 899.9899.9927.7896.1Expenses for promotion of Women's Health
832.1 826.5826.5852.1828.2Expenses for Public Health Prevention Systems
526.2 568.6568.6586.2472.6Expenses incurred for the Rapid Investigation andControl of disease or injury
952.4 943.2943.2972.4318.8Expenses of Adverse Health Care Events Reporting andPatient Safety Initiative
348.6 378.6367.2378.6338.1Expenses of Adverse Pregnancy Outcome ReportingSystem Program in support of infant mortality reduction
17,501.2 18,431.218,431.219,001.217,197.5Expenses of AIDS/HIV Education, Services, PrescriptionDrugs, CTRPN and Patient and Worker Notificationpursuant to PA 87-763
355.0 355.0344.4355.0341.9Expenses of an AIDS Hotline
451.3 481.4481.4496.3403.7Expenses of Environmental Health Surveillance andPrevention Activities, including Mercury Hazards andWest Nile Virus
112.3 108.9108.9112.3108.9Expenses of increasing and maintaining Laboratorycapacity for the Rapid Response to outbreaks orincidence of Infectious Diseases or Injury
163.2 177.7177.7183.2158.3Expenses of State Cancer Registry, including MatchingFunds for National Cancer Institute Grants
141.2 156.2151.5156.283.2Expenses of the Adoption Registry
67.8 65.865.867.867.8Expenses of the Public Health Information Network
91.1 88.488.491.152.5Expenses to establish program to provide scholarshipsto Allied Health Professionals
1,672.0 1,621.81,221.81,672.01,638.6For deposit into the Lead Poisoning Screening,Prevention and Abatement Fund
250.0 250.0242.5250.0250.0For expenses associated with Sudden Infant DeathSyndrome (SIDS)
100.0 97.097.0100.00.0For expenses associated with the Bridget HartiganEducation and Awareness Campaign to reduceincidence of melanomas (skin cancer) in children
4,000.0 4,000.03,880.04,000.03,939.1For the Center for Minority Health
178.0 187.2187.2193.0120.3Integrated Pest Management
7 - 54
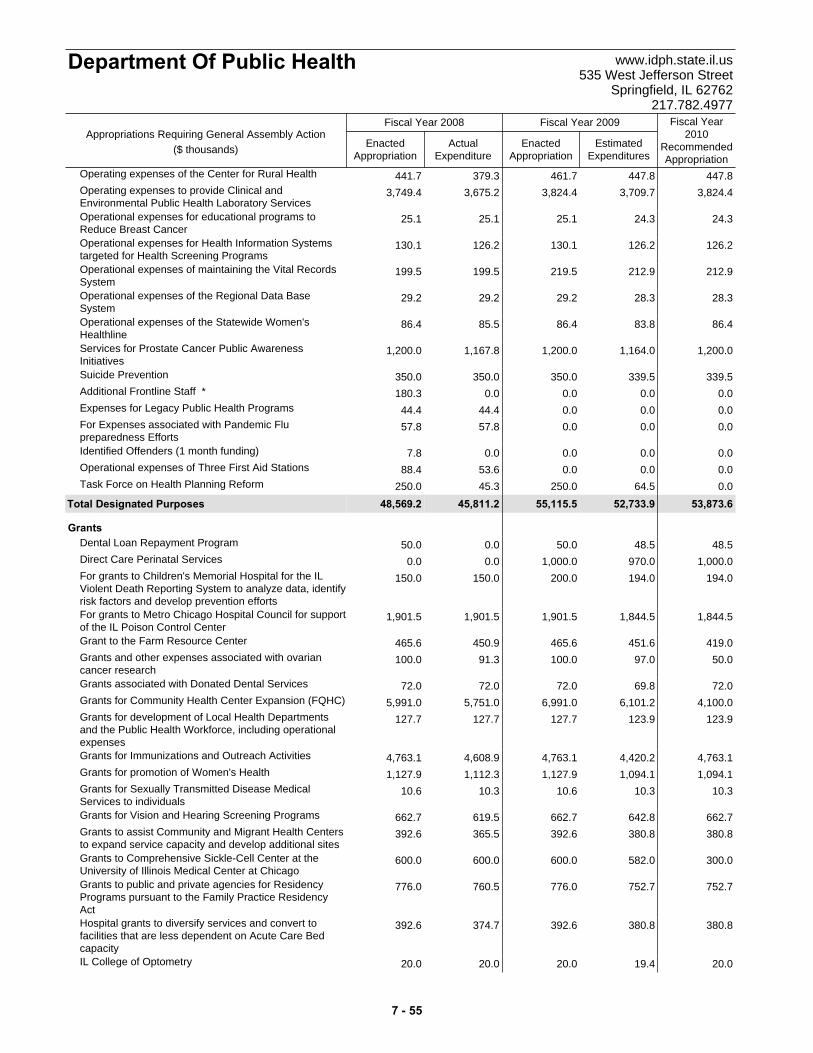
ActualExpenditure
EnactedAppropriation
EstimatedExpenditures
EnactedAppropriation
Fiscal Year2010
RecommendedAppropriation
Fiscal Year 2008 Fiscal Year 2009
Department Of Public Health www.idph.state.il.us535 West Jefferson Street
Springfield, IL 62762217.782.4977
Appropriations Requiring General Assembly Action($ thousands)
441.7 447.8447.8461.7379.3Operating expenses of the Center for Rural Health
3,749.4 3,824.43,709.73,824.43,675.2Operating expenses to provide Clinical andEnvironmental Public Health Laboratory Services
25.1 24.324.325.125.1Operational expenses for educational programs toReduce Breast Cancer
130.1 126.2126.2130.1126.2Operational expenses for Health Information Systemstargeted for Health Screening Programs
199.5 212.9212.9219.5199.5Operational expenses of maintaining the Vital RecordsSystem
29.2 28.328.329.229.2Operational expenses of the Regional Data BaseSystem
86.4 86.483.886.485.5Operational expenses of the Statewide Women'sHealthline
1,200.0 1,200.01,164.01,200.01,167.8Services for Prostate Cancer Public AwarenessInitiatives
350.0 339.5339.5350.0350.0Suicide Prevention
180.3 0.00.00.00.0Additional Frontline Staff *
44.4 0.00.00.044.4Expenses for Legacy Public Health Programs
57.8 0.00.00.057.8For Expenses associated with Pandemic Flupreparedness Efforts
7.8 0.00.00.00.0Identified Offenders (1 month funding)
88.4 0.00.00.053.6Operational expenses of Three First Aid Stations
250.0 0.064.5250.045.3Task Force on Health Planning Reform
Total 48,569.2 53,873.652,733.955,115.545,811.2Designated Purposes
Grants50.0 48.548.550.00.0Dental Loan Repayment Program
0.0 1,000.0970.01,000.00.0Direct Care Perinatal Services
150.0 194.0194.0200.0150.0For grants to Children's Memorial Hospital for the ILViolent Death Reporting System to analyze data, identifyrisk factors and develop prevention efforts
1,901.5 1,844.51,844.51,901.51,901.5For grants to Metro Chicago Hospital Council for supportof the IL Poison Control Center
465.6 419.0451.6465.6450.9Grant to the Farm Resource Center
100.0 50.097.0100.091.3Grants and other expenses associated with ovariancancer research
72.0 72.069.872.072.0Grants associated with Donated Dental Services
5,991.0 4,100.06,101.26,991.05,751.0Grants for Community Health Center Expansion (FQHC)
127.7 123.9123.9127.7127.7Grants for development of Local Health Departmentsand the Public Health Workforce, including operationalexpenses
4,763.1 4,763.14,420.24,763.14,608.9Grants for Immunizations and Outreach Activities
1,127.9 1,094.11,094.11,127.91,112.3Grants for promotion of Women's Health
10.6 10.310.310.610.3Grants for Sexually Transmitted Disease MedicalServices to individuals
662.7 662.7642.8662.7619.5Grants for Vision and Hearing Screening Programs
392.6 380.8380.8392.6365.5Grants to assist Community and Migrant Health Centersto expand service capacity and develop additional sites
600.0 300.0582.0600.0600.0Grants to Comprehensive Sickle-Cell Center at theUniversity of Illinois Medical Center at Chicago
776.0 752.7752.7776.0760.5Grants to public and private agencies for ResidencyPrograms pursuant to the Family Practice ResidencyAct
392.6 380.8380.8392.6374.7Hospital grants to diversify services and convert tofacilities that are less dependent on Acute Care Bedcapacity
20.0 20.019.420.020.0IL College of Optometry
7 - 55
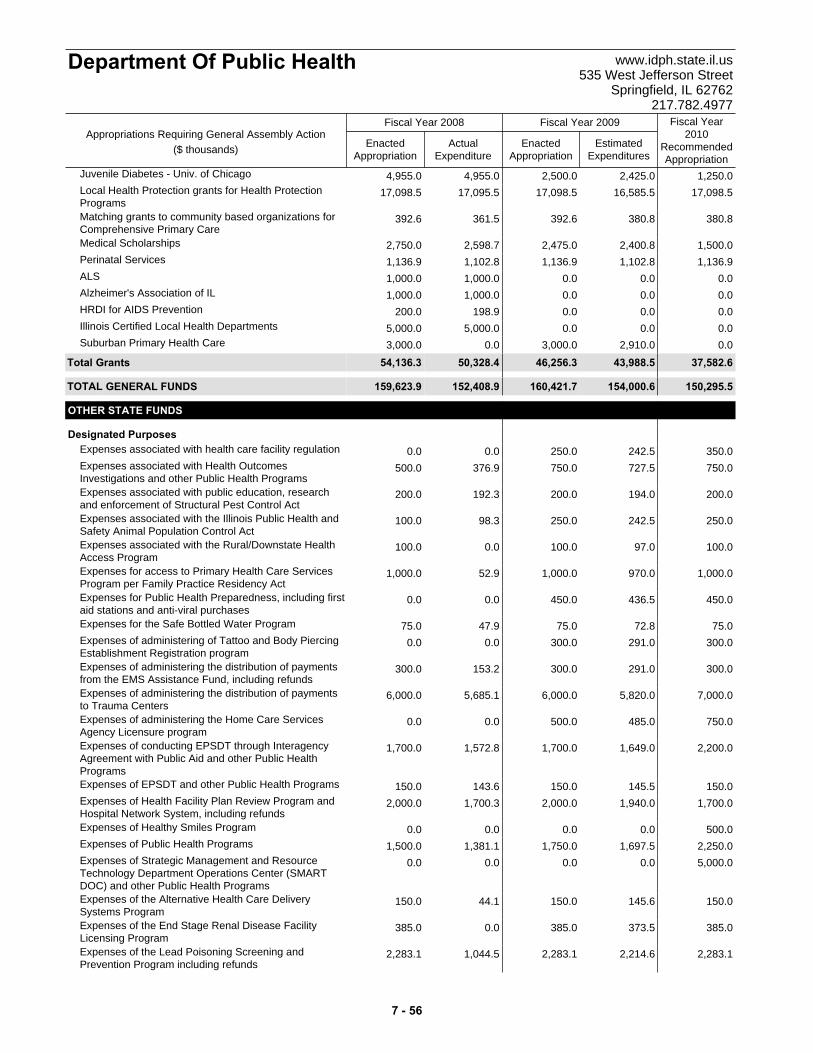
ActualExpenditure
EnactedAppropriation
EstimatedExpenditures
EnactedAppropriation
Fiscal Year2010
RecommendedAppropriation
Fiscal Year 2008 Fiscal Year 2009
Department Of Public Health www.idph.state.il.us535 West Jefferson Street
Springfield, IL 62762217.782.4977
Appropriations Requiring General Assembly Action($ thousands)
4,955.0 1,250.02,425.02,500.04,955.0Juvenile Diabetes - Univ. of Chicago
17,098.5 17,098.516,585.517,098.517,095.5Local Health Protection grants for Health ProtectionPrograms
392.6 380.8380.8392.6361.5Matching grants to community based organizations forComprehensive Primary Care
2,750.0 1,500.02,400.82,475.02,598.7Medical Scholarships
1,136.9 1,136.91,102.81,136.91,102.8Perinatal Services
1,000.0 0.00.00.01,000.0ALS
1,000.0 0.00.00.01,000.0Alzheimer's Association of IL
200.0 0.00.00.0198.9HRDI for AIDS Prevention
5,000.0 0.00.00.05,000.0Illinois Certified Local Health Departments
3,000.0 0.02,910.03,000.00.0Suburban Primary Health Care
Total 54,136.3 37,582.643,988.546,256.350,328.4Grants
TOTAL GENERAL FUNDS 159,623.9 150,295.5154,000.6160,421.7152,408.9
OTHER STATE FUNDS
Designated Purposes0.0 350.0242.5250.00.0Expenses associated with health care facility regulation
500.0 750.0727.5750.0376.9Expenses associated with Health OutcomesInvestigations and other Public Health Programs
200.0 200.0194.0200.0192.3Expenses associated with public education, researchand enforcement of Structural Pest Control Act
100.0 250.0242.5250.098.3Expenses associated with the Illinois Public Health andSafety Animal Population Control Act
100.0 100.097.0100.00.0Expenses associated with the Rural/Downstate HealthAccess Program
1,000.0 1,000.0970.01,000.052.9Expenses for access to Primary Health Care ServicesProgram per Family Practice Residency Act
0.0 450.0436.5450.00.0Expenses for Public Health Preparedness, including firstaid stations and anti-viral purchases
75.0 75.072.875.047.9Expenses for the Safe Bottled Water Program
0.0 300.0291.0300.00.0Expenses of administering of Tattoo and Body PiercingEstablishment Registration program
300.0 300.0291.0300.0153.2Expenses of administering the distribution of paymentsfrom the EMS Assistance Fund, including refunds
6,000.0 7,000.05,820.06,000.05,685.1Expenses of administering the distribution of paymentsto Trauma Centers
0.0 750.0485.0500.00.0Expenses of administering the Home Care ServicesAgency Licensure program
1,700.0 2,200.01,649.01,700.01,572.8Expenses of conducting EPSDT through InteragencyAgreement with Public Aid and other Public HealthPrograms
150.0 150.0145.5150.0143.6Expenses of EPSDT and other Public Health Programs
2,000.0 1,700.01,940.02,000.01,700.3Expenses of Health Facility Plan Review Program andHospital Network System, including refunds
0.0 500.00.00.00.0Expenses of Healthy Smiles Program
1,500.0 2,250.01,697.51,750.01,381.1Expenses of Public Health Programs
0.0 5,000.00.00.00.0Expenses of Strategic Management and ResourceTechnology Department Operations Center (SMARTDOC) and other Public Health Programs
150.0 150.0145.6150.044.1Expenses of the Alternative Health Care DeliverySystems Program
385.0 385.0373.5385.00.0Expenses of the End Stage Renal Disease FacilityLicensing Program
2,283.1 2,283.12,214.62,283.11,044.5Expenses of the Lead Poisoning Screening andPrevention Program including refunds
7 - 56
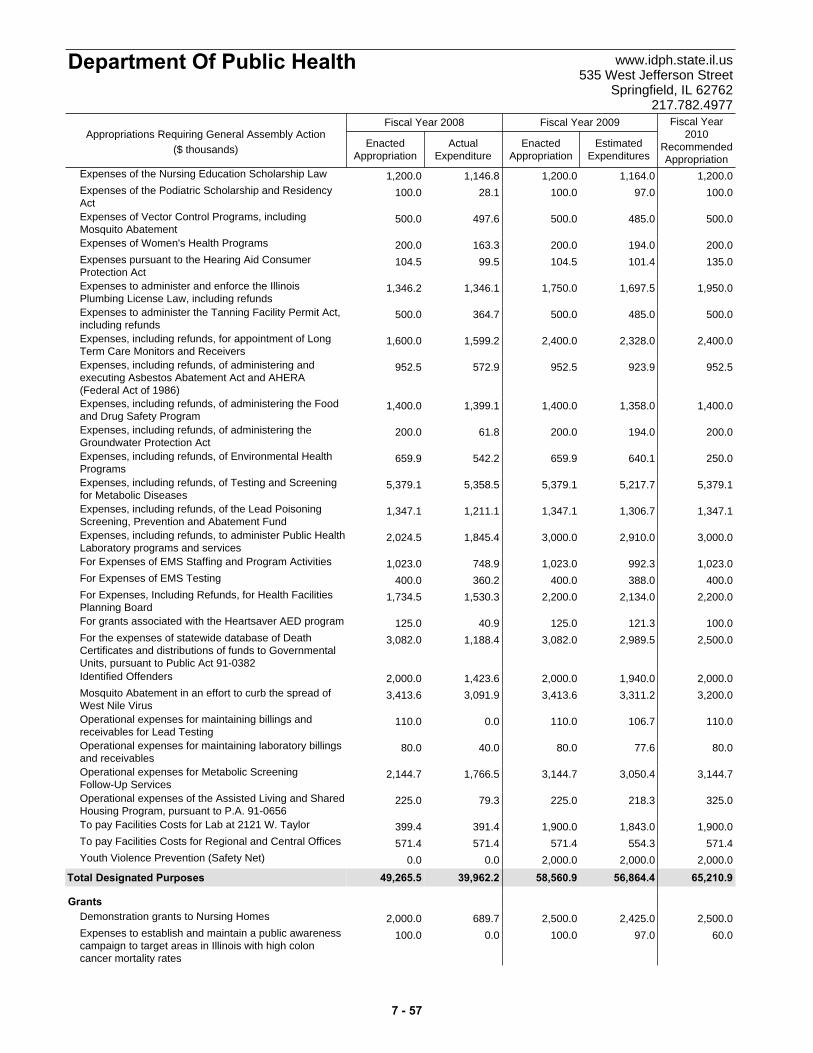
ActualExpenditure
EnactedAppropriation
EstimatedExpenditures
EnactedAppropriation
Fiscal Year2010
RecommendedAppropriation
Fiscal Year 2008 Fiscal Year 2009
Department Of Public Health www.idph.state.il.us535 West Jefferson Street
Springfield, IL 62762217.782.4977
Appropriations Requiring General Assembly Action($ thousands)
1,200.0 1,200.01,164.01,200.01,146.8Expenses of the Nursing Education Scholarship Law
100.0 100.097.0100.028.1Expenses of the Podiatric Scholarship and ResidencyAct
500.0 500.0485.0500.0497.6Expenses of Vector Control Programs, includingMosquito Abatement
200.0 200.0194.0200.0163.3Expenses of Women's Health Programs
104.5 135.0101.4104.599.5Expenses pursuant to the Hearing Aid ConsumerProtection Act
1,346.2 1,950.01,697.51,750.01,346.1Expenses to administer and enforce the IllinoisPlumbing License Law, including refunds
500.0 500.0485.0500.0364.7Expenses to administer the Tanning Facility Permit Act,including refunds
1,600.0 2,400.02,328.02,400.01,599.2Expenses, including refunds, for appointment of LongTerm Care Monitors and Receivers
952.5 952.5923.9952.5572.9Expenses, including refunds, of administering andexecuting Asbestos Abatement Act and AHERA(Federal Act of 1986)
1,400.0 1,400.01,358.01,400.01,399.1Expenses, including refunds, of administering the Foodand Drug Safety Program
200.0 200.0194.0200.061.8Expenses, including refunds, of administering theGroundwater Protection Act
659.9 250.0640.1659.9542.2Expenses, including refunds, of Environmental HealthPrograms
5,379.1 5,379.15,217.75,379.15,358.5Expenses, including refunds, of Testing and Screeningfor Metabolic Diseases
1,347.1 1,347.11,306.71,347.11,211.1Expenses, including refunds, of the Lead PoisoningScreening, Prevention and Abatement Fund
2,024.5 3,000.02,910.03,000.01,845.4Expenses, including refunds, to administer Public HealthLaboratory programs and services
1,023.0 1,023.0992.31,023.0748.9For Expenses of EMS Staffing and Program Activities
400.0 400.0388.0400.0360.2For Expenses of EMS Testing
1,734.5 2,200.02,134.02,200.01,530.3For Expenses, Including Refunds, for Health FacilitiesPlanning Board
125.0 100.0121.3125.040.9For grants associated with the Heartsaver AED program
3,082.0 2,500.02,989.53,082.01,188.4For the expenses of statewide database of DeathCertificates and distributions of funds to GovernmentalUnits, pursuant to Public Act 91-0382
2,000.0 2,000.01,940.02,000.01,423.6Identified Offenders
3,413.6 3,200.03,311.23,413.63,091.9Mosquito Abatement in an effort to curb the spread ofWest Nile Virus
110.0 110.0106.7110.00.0Operational expenses for maintaining billings andreceivables for Lead Testing
80.0 80.077.680.040.0Operational expenses for maintaining laboratory billingsand receivables
2,144.7 3,144.73,050.43,144.71,766.5Operational expenses for Metabolic ScreeningFollow-Up Services
225.0 325.0218.3225.079.3Operational expenses of the Assisted Living and SharedHousing Program, pursuant to P.A. 91-0656
399.4 1,900.01,843.01,900.0391.4To pay Facilities Costs for Lab at 2121 W. Taylor
571.4 571.4554.3571.4571.4To pay Facilities Costs for Regional and Central Offices
0.0 2,000.02,000.02,000.00.0Youth Violence Prevention (Safety Net)
Total 49,265.5 65,210.956,864.458,560.939,962.2Designated Purposes
Grants2,000.0 2,500.02,425.02,500.0689.7Demonstration grants to Nursing Homes
100.0 60.097.0100.00.0Expenses to establish and maintain a public awarenesscampaign to target areas in Illinois with high coloncancer mortality rates
7 - 57

ActualExpenditure
EnactedAppropriation
EstimatedExpenditures
EnactedAppropriation
Fiscal Year2010
RecommendedAppropriation
Fiscal Year 2008 Fiscal Year 2009
Department Of Public Health www.idph.state.il.us535 West Jefferson Street
Springfield, IL 62762217.782.4977
Appropriations Requiring General Assembly Action($ thousands)
0.0 1,400.01,358.01,400.00.0For grants HIV/AIDS Quality of Life programs andexpenses of HIV/AIDS prevention and education
3,000.0 3,000.02,910.03,000.01,875.0For prevention and treatment of HIV/AIDS
1,900.0 1,900.01,843.01,900.01,862.0Grant for the U of I for Sickle Cell Research
1,000.0 1,000.0970.01,000.01,000.0Grant to the American Lung Association for operationsof the Quitline
600.0 600.0582.0600.0589.8Grants for Breast and Cervical Cancer Research
50.0 30.048.550.00.0Grants for Epilepsy Treatment and Education Programs
1,370.0 2,000.01,697.51,750.01,370.0Grants for Free Distribution of Medical Preparations andFood Supplies
25.0 10.024.325.00.0Grants for hospice services as defined in the HospiceProgram Licensing Act
3,020.0 3,250.02,929.43,020.02,832.6Grants for Metabolic Screening Follow-Up Services
0.0 40.097.0100.00.0Grants for research for the treatment and cure ofautoimmune diseases
3,000.0 3,000.02,910.03,000.02,931.3Grants for the Community Health Center ExpansionProgram
1,500.0 1,500.01,455.01,500.01,017.3Grants for the Lead Poisoning Screening andPrevention Program
5,000.0 5,000.04,850.05,000.04,662.2Grants for the Tobacco Use Prevention Program,BASUAH Program, and Asthma Prevention Program
350.0 350.0339.5350.0314.6Grants pursuant to the Alzheimer's Disease ResearchAct
0.0 1,000.0970.01,000.00.0Grants to organizations in Illinois that conduct MultipleSclerosis research
0.0 60.097.0100.00.0Grants to public and private not for profit entities for lungcancer research
5,500.0 5,500.05,335.05,500.02,566.8Grants to public or private entities in Illinois for thepurpose of funding research concerning breast cancerand for funding services for breast cancer victims
100.0 5.097.0100.0100.0Grants to the Les Turner ALS Foundation for Researchon Amyotrophic Lateral Sclerosis (ALS)
5,000.0 5,000.04,850.05,000.04,891.8Local Health Protection Grants for Health Anti -SmokingPrograms
400.0 400.0388.0400.00.0Spinal Cord Injury Paralysis Research Trust Fund
200.0 0.0194.0200.077.0Grant to public and private entities in Illinois for ProstateCancer Research
50.0 0.00.00.00.6Grants for sarcoidosis research
50.0 0.00.00.00.8Grants to charitable or educational entities for theprevention of blindness and the providing of eyecare
50.0 0.00.00.01.1Grants to public and private entities for the purpose ofresearch dedicated to the elimination of brain tumors
Total 34,265.0 37,605.036,467.237,595.026,782.6Grants
TOTAL OTHER STATE FUNDS 83,530.5 102,815.993,331.696,155.966,744.8
7 - 58
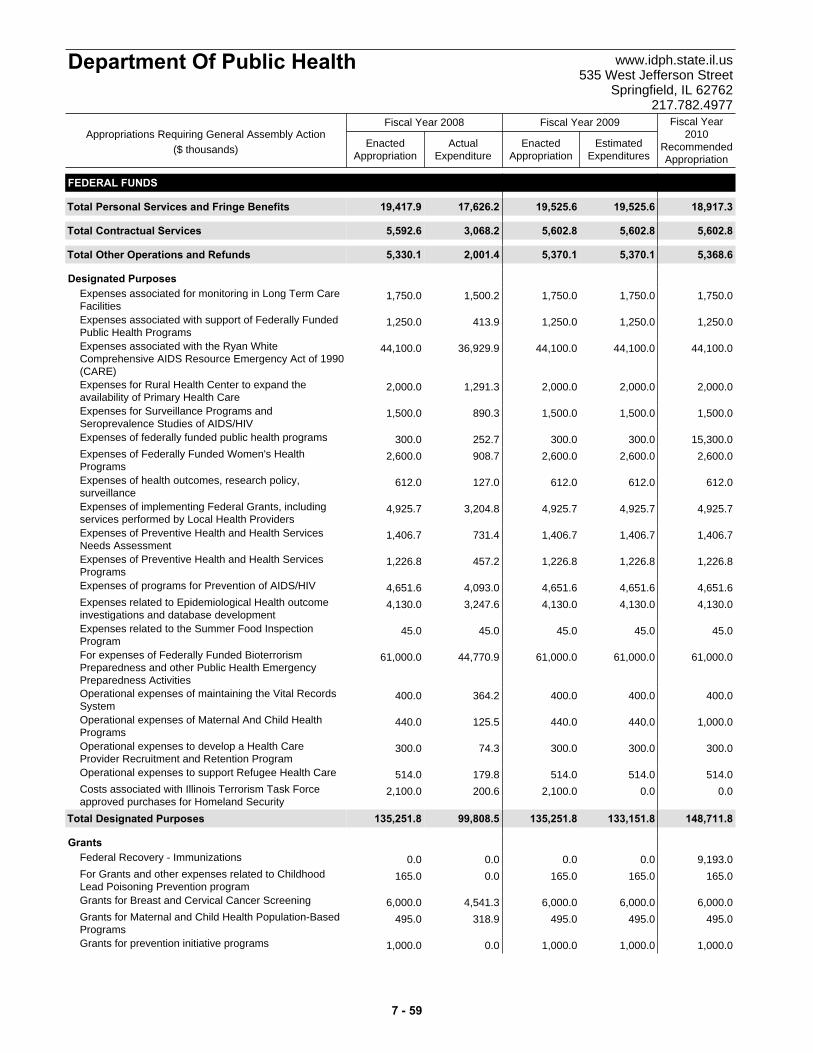
ActualExpenditure
EnactedAppropriation
EstimatedExpenditures
EnactedAppropriation
Fiscal Year2010
RecommendedAppropriation
Fiscal Year 2008 Fiscal Year 2009
Department Of Public Health www.idph.state.il.us535 West Jefferson Street
Springfield, IL 62762217.782.4977
Appropriations Requiring General Assembly Action($ thousands)
FEDERAL FUNDS
Total 19,417.9 18,917.319,525.619,525.617,626.2Personal Services and Fringe Benefits
Total 5,592.6 5,602.85,602.85,602.83,068.2Contractual Services
Total 5,330.1 5,368.65,370.15,370.12,001.4Other Operations and Refunds
Designated Purposes1,750.0 1,750.01,750.01,750.01,500.2Expenses associated for monitoring in Long Term Care
Facilities1,250.0 1,250.01,250.01,250.0413.9Expenses associated with support of Federally Funded
Public Health Programs44,100.0 44,100.044,100.044,100.036,929.9Expenses associated with the Ryan White
Comprehensive AIDS Resource Emergency Act of 1990(CARE)
2,000.0 2,000.02,000.02,000.01,291.3Expenses for Rural Health Center to expand theavailability of Primary Health Care
1,500.0 1,500.01,500.01,500.0890.3Expenses for Surveillance Programs andSeroprevalence Studies of AIDS/HIV
300.0 15,300.0300.0300.0252.7Expenses of federally funded public health programs
2,600.0 2,600.02,600.02,600.0908.7Expenses of Federally Funded Women's HealthPrograms
612.0 612.0612.0612.0127.0Expenses of health outcomes, research policy,surveillance
4,925.7 4,925.74,925.74,925.73,204.8Expenses of implementing Federal Grants, includingservices performed by Local Health Providers
1,406.7 1,406.71,406.71,406.7731.4Expenses of Preventive Health and Health ServicesNeeds Assessment
1,226.8 1,226.81,226.81,226.8457.2Expenses of Preventive Health and Health ServicesPrograms
4,651.6 4,651.64,651.64,651.64,093.0Expenses of programs for Prevention of AIDS/HIV
4,130.0 4,130.04,130.04,130.03,247.6Expenses related to Epidemiological Health outcomeinvestigations and database development
45.0 45.045.045.045.0Expenses related to the Summer Food InspectionProgram
61,000.0 61,000.061,000.061,000.044,770.9For expenses of Federally Funded BioterrorismPreparedness and other Public Health EmergencyPreparedness Activities
400.0 400.0400.0400.0364.2Operational expenses of maintaining the Vital RecordsSystem
440.0 1,000.0440.0440.0125.5Operational expenses of Maternal And Child HealthPrograms
300.0 300.0300.0300.074.3Operational expenses to develop a Health CareProvider Recruitment and Retention Program
514.0 514.0514.0514.0179.8Operational expenses to support Refugee Health Care
2,100.0 0.00.02,100.0200.6Costs associated with Illinois Terrorism Task Forceapproved purchases for Homeland Security
Total 135,251.8 148,711.8133,151.8135,251.899,808.5Designated Purposes
Grants0.0 9,193.00.00.00.0Federal Recovery - Immunizations
165.0 165.0165.0165.00.0For Grants and other expenses related to ChildhoodLead Poisoning Prevention program
6,000.0 6,000.06,000.06,000.04,541.3Grants for Breast and Cervical Cancer Screening
495.0 495.0495.0495.0318.9Grants for Maternal and Child Health Population-BasedPrograms
1,000.0 1,000.01,000.01,000.00.0Grants for prevention initiative programs
7 - 59

ActualExpenditure
EnactedAppropriation
EstimatedExpenditures
EnactedAppropriation
Fiscal Year2010
RecommendedAppropriation
Fiscal Year 2008 Fiscal Year 2009
Department Of Public Health www.idph.state.il.us535 West Jefferson Street
Springfield, IL 62762217.782.4977
Appropriations Requiring General Assembly Action($ thousands)
9,530.0 9,530.09,530.09,530.05,713.1Grants For Public Health Programs, includingOperations
1,636.0 1,950.01,736.01,736.01,514.5Grants for the development of Refugee Health Care
450.0 450.0450.0450.0168.9Grants to develop a Health Care Provider andRecruitment Program
900.0 900.0900.0900.0307.3Grants to develop a Health Professional EducationalLoan Repayment Program
2,401.8 3,500.02,401.82,401.82,052.0Maternal and Child Health Services
Total 22,577.8 33,183.022,677.822,677.814,616.0Grants
TOTAL FEDERAL FUNDS 188,170.2 211,783.5186,328.1188,428.1137,120.3
TOTAL ALL FUNDS 431,324.6 464,894.9433,660.3445,005.7356,274.1
BY FUND
159,623.9 150,295.5154,000.6160,421.7152,408.9General Revenue Fund
1,400.0 1,400.01,358.01,400.01,399.1Food and Drug Safety Fund
600.0 600.0582.0600.0589.8Penny Severns Breast, Cervical, and Ovarian CancerResearch Fund
1,423.0 1,423.01,380.31,423.01,109.2Fire Prevention Fund
100.0 100.097.0100.00.0Rural/Downstate Health Access Fund
350.0 350.0339.5350.0314.6Alzheimer's Disease Research Fund
100.0 5.097.0100.0100.0Lou Gehrig's Disease (ALS) Research Fund
178,477.9 202,533.0178,735.8178,735.8133,107.8Public Health Services Fund
1,000.0 1,000.0970.01,000.052.9Community Health Center Care Fund
75.0 75.072.875.047.9Safe Bottled Water Fund
659.9 250.0640.1659.9542.2Facility Licensing Fund
125.0 100.0121.3125.040.9Heartsaver AED Fund
952.5 952.5923.9952.5572.9Illinois School Asbestos Abatement Fund
50.0 30.048.550.00.0Epilepsy Treatment and Education Grants-in-Aid Fund
5,500.0 5,500.05,335.05,500.02,566.8Ticket For The Cure Fund
1,734.5 2,200.02,134.02,200.01,530.3Illinois Health Facilities Planning Fund
3,413.6 3,200.03,311.23,413.63,091.9Emergency Public Health Fund
50.0 0.00.00.00.8Blindness Prevention Fund
200.0 200.0194.0200.061.8Public Health Water Permit Fund
1,200.0 1,200.01,164.01,200.01,146.8Nursing Dedicated and Professional Fund
50.0 0.00.00.01.1Illinois Brain Tumor Research Fund
50.0 0.00.00.00.6Sarcoidosis Research Fund
100.0 60.097.0100.00.0Vince Demuzio Memorial Colon Cancer Fund
1,600.0 2,400.02,328.02,400.01,599.2Long Term Care Monitor/Receiver Fund
0.0 750.0485.0500.00.0Home Care Services Agency Licensure Fund
500.0 500.0485.0500.0497.6Used Tire Management Fund
3,000.0 3,000.02,910.03,000.01,875.0African-American HIV/AIDS Response Fund
0.0 300.0291.0300.00.0Tattoo and Body Piercing Establishment Registration Fund
2,024.5 3,000.02,910.03,000.01,845.4Public Health Laboratory Services Revolving Fund
2,000.0 2,000.01,940.02,000.01,423.6Long-Term Care Provider Fund
5,240.2 5,240.25,083.05,240.23,272.9Lead Poisoning Screening, Prevention, and AbatementFund
500.0 500.0485.0500.0364.7Tanning Facility Permit Fund
7 - 60

ActualExpenditure
EnactedAppropriation
EstimatedExpenditures
EnactedAppropriation
Fiscal Year2010
RecommendedAppropriation
Fiscal Year 2008 Fiscal Year 2009
Department Of Public Health www.idph.state.il.us535 West Jefferson Street
Springfield, IL 62762217.782.4977
Appropriations Requiring General Assembly Action($ thousands)
2,000.0 2,500.02,425.02,500.0689.7Innovations in Long-Term Care Quality DemonstrationGrants Fund
1,346.2 1,950.01,697.51,750.01,346.1Plumbing Licensure and Program Fund
385.0 385.0373.5385.00.0End Stage Renal Disease Facility Licensing Fund
150.0 150.0145.6150.044.1Regulatory Evaluation and Basic Enforcement Fund
6,000.0 7,000.05,820.06,000.05,685.1Trauma Center Fund
300.0 300.0291.0300.0153.2EMS Assistance Fund
0.0 1,000.0970.01,000.00.0Multiple Sclerosis Research Fund
0.0 1,400.01,358.01,400.00.0Quality of Life Endowment Fund
0.0 60.097.0100.00.0Lung Cancer Research Fund
0.0 40.097.0100.00.0Autoimmune Disease Research Fund
2,100.0 0.00.02,100.0200.6Federal Civil Preparedness Administrative Fund
2,000.0 1,700.01,940.02,000.01,700.3Health Facility Plan Review Fund
200.0 200.0194.0200.0192.3Pesticide Control Fund
25.0 10.024.325.00.0Hospice Fund
200.0 0.0194.0200.077.0Prostate Cancer Research Fund
3,082.0 2,500.02,989.53,082.01,188.4Death Certificate Surcharge Fund
0.0 500.00.00.00.0Healthy Smiles Fund
225.0 325.0218.3225.079.3Assisted Living and Shared Housing Regulatory Fund
400.0 400.0388.0400.00.0Spinal Cord Injury Paralysis Cure Research Trust Fund
15,900.0 17,900.017,423.017,900.015,347.3Tobacco Settlement Recovery Fund
100.0 250.0242.5250.098.3Pet Population Control Fund
612.0 612.0612.0612.0127.0Public Health Federal Projects Fund
3,341.8 5,000.03,341.83,341.82,496.4Maternal and Child Health Services Block Grant Fund
3,638.5 3,638.53,638.53,638.51,188.6Preventive Health and Health Services Block Grant Fund
5,020.8 13,821.47,489.87,721.44,600.6Public Health Special State Projects Fund
11,993.8 13,853.812,972.613,373.811,367.6Metabolic Screening and Treatment Fund
104.5 135.0101.4104.599.5Hearing Instrument Dispenser Examining and DisciplinaryFund
100.0 100.097.0100.028.1Illinois State Podiatric Disciplinary Fund
TOTAL ALL FUNDS 431,324.6 464,894.9433,660.3445,005.7356,274.1
BY DIVISION
12,724.0 16,749.912,115.412,411.111,719.8Director's Office18,385.2 17,841.917,891.818,390.114,842.0Finance And Administration
5,889.2 7,378.37,234.27,419.64,852.7Division Of Information Technology32,590.1 31,015.832,824.434,421.325,146.5Epidemiology And Health System Development53,717.8 53,228.853,922.654,972.740,138.2Office Of Health Promotion38,950.6 41,191.040,525.241,341.535,386.2Office Of Health Care Regulation72,743.3 77,496.966,765.568,938.065,069.4Office Of Health Protection77,007.1 79,064.478,837.479,721.466,878.6Office Of Health Protection: AIDS
1,632.2 1,641.21,600.51,650.01,629.7Springfield Laboratory394.6 425.0389.0401.1387.4Carbondale Laboratory
2,213.3 2,212.22,176.12,243.32,204.2Chicago Laboratory15,394.2 17,941.317,450.617,959.214,574.1Public Health Laboratories25,341.2 30,136.829,619.830,379.018,463.7Office Of Women's Health74,341.8 88,571.472,307.874,757.454,981.3Office of Public Health Preparedness
TOTAL ALL DIVISIONS 431,324.6 464,894.9433,660.3445,005.7356,274.1
7 - 61

ActualExpenditure
EnactedAppropriation
EstimatedExpenditures
EnactedAppropriation
Fiscal Year2010
RecommendedAppropriation
Fiscal Year 2008 Fiscal Year 2009
Department Of Public Health www.idph.state.il.us535 West Jefferson Street
Springfield, IL 62762217.782.4977
Appropriations Requiring General Assembly Action($ thousands)
HEADCOUNT BY DIVISION Actual Estimated Authorized
36.0 32.032.0Director's Office
88.0 120.0118.0Finance And Administration
22.0 23.023.0Division Of Information Technology
73.0 90.090.0Epidemiology And Health System Development
55.0 58.054.0Office Of Health Promotion
321.0 324.0314.0Office Of Health Care Regulation
241.0 232.0230.0Office Of Health Protection
40.0 40.040.0Office Of Health Protection: AIDS
21.0 20.020.0Springfield Laboratory
6.0 6.06.0Carbondale Laboratory
32.0 30.030.0Chicago Laboratory
55.0 74.074.0Public Health Laboratories
23.0 30.028.0Office Of Women's Health
90.0 98.098.0Office of Public Health Preparedness
TOTAL HEADCOUNT 1,103.0 1,177.01,157.0 t
7 - 62

Department Of Veterans' Affairs www.state.il.us/agency/dva 833 South Spring Street
Springfield, IL 62704 217.782.6641
OVERVIEW Agency Mission To assist veterans, their dependents and survivors in obtaining the benefits to which they are entitled; to evaluate and approve education and training programs available at colleges, universities and vocational training centers; to provide skilled nursing and domiciliary care for eligible veterans; and to administer state grants and benefits to Illinois veterans. Strategic Priorities • Ensure that Illinois veterans and their dependents
continue to receive the assistance they may need as Illinois anticipates the return of thousands of service members from the current conflicts in Iraq and Afghanistan.
• Continue outreach for the Illinois Warrior Assistance Program, a first-in-the-nation Traumatic Brain Injury (TBI) and Post Traumatic Stress Disorder (PTSD) Program for veterans.
• Continue the planning process to establish a Chicago Veterans’ Home to provide long-term care to more Illinois veterans.
• Reduce homelessness and unemployment among veterans.
Summary of Agency Operations The Illinois Department of Veterans' Affairs (IDVA) is organized into four major programs: Veterans' Homes, State Grants and Services, State Approving Agency and Veterans’ Field Services. Agency Resources Employed
FY 2008 FY 2009 FY 2010Actual Enacted Recommended
General Funds 54,674.4 72,146.5 66,325.9Other State Funds 49,739.6 52,860.6 52,913.4
Federal Funds 1,682.2 1,775.3 1,660.1Total 106,096.2 126,782.4 120,899.4
Actual Estimated RecommendedHeadcount (FTE) 1,047.0 1,181.5 1,261.5
Appropriations ($ thousands)Fund Category
MAJOR ACCOMPLISHMENTS • Hosted the second annual Veterans’ Adaptive
Activities Day, giving veterans with disabilities the opportunity to try a wide variety of sports
equipment with adaptive fitness specialists from across the region.
• Distributed $2.7 million in grants from the
Veterans’ Cash lottery proceeds to non-profit organizations across the state that help provide services to Illinois veterans including health care, PTSD treatment, disability benefits and housing assistance.
KEY BUDGET INITIATIVES • Expand LaSalle Veterans’ Home Alzheimer’s
Program. The fiscal year 2010 budget includes funding to operate and staff an additional 80 beds at the LaSalle Veterans' Home, 40 of which will be dedicated to serving veterans suffering with Alzheimer's disease or other forms of dementia, while the remaining 40 beds will be dedicated to regular skilled nursing beds.
• Provide increased funding for the Veterans’
Care Program. This program offers veterans across Illinois access to affordable, comprehensive healthcare and is the first of its kind in the nation. The governor’s budget provides $2 million in funding to ensure that veterans struggling to gain access to healthcare services are cared for.
• Illinois Jobs Now! Capital Plan. This plan
includes $15 million for the design and planning of a new 200 bed veterans’ home in the Chicago area. This funding provides state match for the federal funding portion of the construction of the new home.
PROGRAMS State Grants and Services The grants division administers Illinois permits and benefit payments such as compensation, education, burial, employment and real estate and permits. Veterans' Field Services Acting as the veterans' representative, the service officers provide counseling and assistance by presenting and prosecuting claims on behalf of the veterans and their dependents or survivors. These claims may include compensation, education, pensions, insurance, hospitalization and rehabilitation.
7 - 63
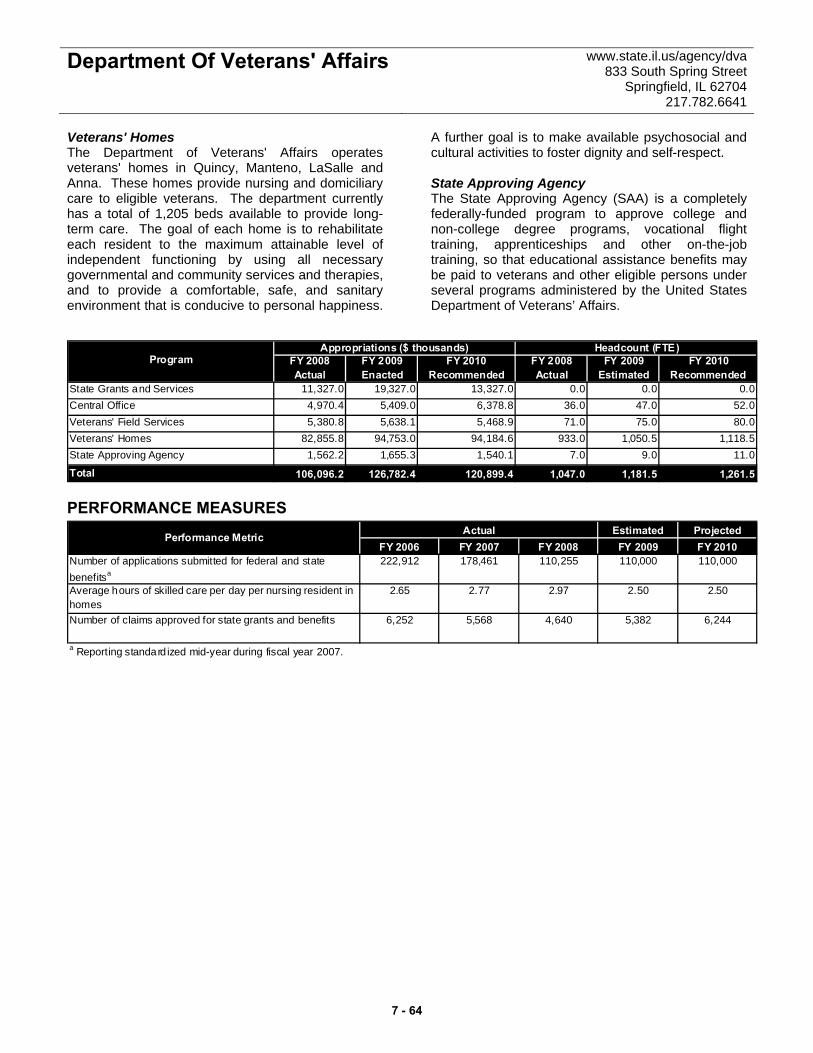
Department Of Veterans' Affairs www.state.il.us/agency/dva 833 South Spring Street
Springfield, IL 62704 217.782.6641
Veterans' Homes The Department of Veterans' Affairs operates veterans' homes in Quincy, Manteno, LaSalle and Anna. These homes provide nursing and domiciliary care to eligible veterans. The department currently has a total of 1,205 beds available to provide long-term care. The goal of each home is to rehabilitate each resident to the maximum attainable level of independent functioning by using all necessary governmental and community services and therapies, and to provide a comfortable, safe, and sanitary environment that is conducive to personal happiness.
A further goal is to make available psychosocial and cultural activities to foster dignity and self-respect. State Approving Agency The State Approving Agency (SAA) is a completely federally-funded program to approve college and non-college degree programs, vocational flight training, apprenticeships and other on-the-job training, so that educational assistance benefits may be paid to veterans and other eligible persons under several programs administered by the United States Department of Veterans’ Affairs.
Program FY 2008 FY 2009 FY 2010 FY 2008 FY 2009 FY 2010Actual Enacted Recommended Actual Estimated Recommended
State Grants and Services 11,327.0 19,327.0 13,327.0 0.0 0.0 0.0Central Office 4,970.4 5,409.0 6,378.8 36.0 47.0 52.0Veterans' Field Services 5,380.8 5,638.1 5,468.9 71.0 75.0 80.0Veterans' Homes 82,855.8 94,753.0 94,184.6 933.0 1,050.5 1,118.5State Approving Agency 1,562.2 1,655.3 1,540.1 7.0 9.0 11.0
Total 106,096.2 126,782.4 120,899.4 1,047.0 1,181.5 1,261.5
Appropriations ($ thousands) Headcount (FTE)
PERFORMANCE MEASURES Estimated Projected
FY 2006 FY 2007 FY 2008 FY 2009 FY 2010Number of applications submitted for federal and state benefitsa
222,912 178,461 110,255 110,000 110,000
Average hours of skilled care per day per nursing resident in homes
2.65 2.77 2.97 2.50 2.50
Number of claims approved for state grants and benefits 6,252 5,568 4,640 5,382 6,244
ActualPerformance Metric
a Reporting standard ized mid-year during fiscal year 2007.
7 - 64
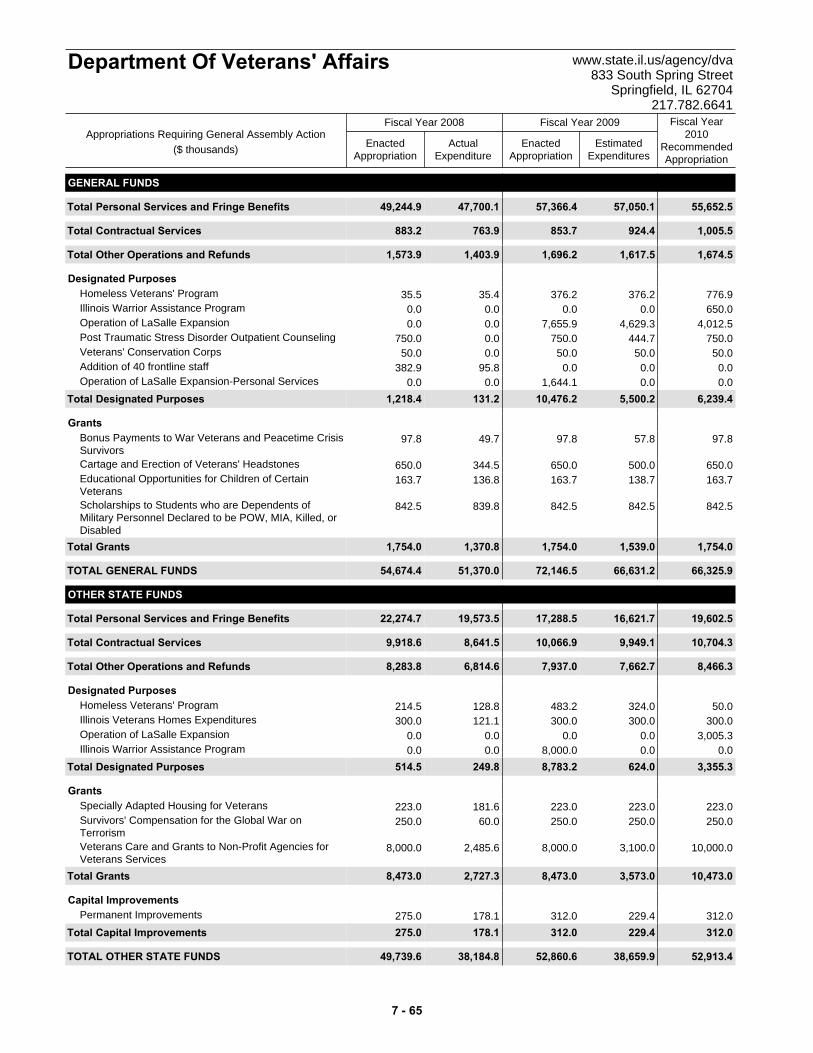
ActualExpenditure
EnactedAppropriation
EstimatedExpenditures
EnactedAppropriation
Fiscal Year2010
RecommendedAppropriation
Fiscal Year 2008 Fiscal Year 2009
Department Of Veterans' Affairs www.state.il.us/agency/dva833 South Spring Street
Springfield, IL 62704217.782.6641
Appropriations Requiring General Assembly Action($ thousands)
GENERAL FUNDS
Total 49,244.9 55,652.557,050.157,366.447,700.1Personal Services and Fringe Benefits
Total 883.2 1,005.5924.4853.7763.9Contractual Services
Total 1,573.9 1,674.51,617.51,696.21,403.9Other Operations and Refunds
Designated Purposes35.5 776.9376.2376.235.4Homeless Veterans' Program
0.0 650.00.00.00.0Illinois Warrior Assistance Program0.0 4,012.54,629.37,655.90.0Operation of LaSalle Expansion
750.0 750.0444.7750.00.0Post Traumatic Stress Disorder Outpatient Counseling50.0 50.050.050.00.0Veterans' Conservation Corps
382.9 0.00.00.095.8Addition of 40 frontline staff 0.0 0.00.01,644.10.0Operation of LaSalle Expansion-Personal Services
Total 1,218.4 6,239.45,500.210,476.2131.2Designated Purposes
Grants97.8 97.857.897.849.7Bonus Payments to War Veterans and Peacetime Crisis
Survivors650.0 650.0500.0650.0344.5Cartage and Erection of Veterans' Headstones163.7 163.7138.7163.7136.8Educational Opportunities for Children of Certain
Veterans842.5 842.5842.5842.5839.8Scholarships to Students who are Dependents of
Military Personnel Declared to be POW, MIA, Killed, orDisabled
Total 1,754.0 1,754.01,539.01,754.01,370.8Grants
TOTAL GENERAL FUNDS 54,674.4 66,325.966,631.272,146.551,370.0
OTHER STATE FUNDS
Total 22,274.7 19,602.516,621.717,288.519,573.5Personal Services and Fringe Benefits
Total 9,918.6 10,704.39,949.110,066.98,641.5Contractual Services
Total 8,283.8 8,466.37,662.77,937.06,814.6Other Operations and Refunds
Designated Purposes214.5 50.0324.0483.2128.8Homeless Veterans' Program300.0 300.0300.0300.0121.1Illinois Veterans Homes Expenditures
0.0 3,005.30.00.00.0Operation of LaSalle Expansion0.0 0.00.08,000.00.0Illinois Warrior Assistance Program
Total 514.5 3,355.3624.08,783.2249.8Designated Purposes
Grants223.0 223.0223.0223.0181.6Specially Adapted Housing for Veterans250.0 250.0250.0250.060.0Survivors' Compensation for the Global War on
Terrorism8,000.0 10,000.03,100.08,000.02,485.6Veterans Care and Grants to Non-Profit Agencies for
Veterans ServicesTotal 8,473.0 10,473.03,573.08,473.02,727.3Grants
Capital Improvements275.0 312.0229.4312.0178.1Permanent Improvements
Total 275.0 312.0229.4312.0178.1Capital Improvements
TOTAL OTHER STATE FUNDS 49,739.6 52,913.438,659.952,860.638,184.8
7 - 65

ActualExpenditure
EnactedAppropriation
EstimatedExpenditures
EnactedAppropriation
Fiscal Year2010
RecommendedAppropriation
Fiscal Year 2008 Fiscal Year 2009
Department Of Veterans' Affairs www.state.il.us/agency/dva833 South Spring Street
Springfield, IL 62704217.782.6641
Appropriations Requiring General Assembly Action($ thousands)
FEDERAL FUNDS
Total 794.6 856.2838.1887.7645.8Personal Services and Fringe Benefits
Total 112.3 87.160.8112.348.1Contractual Services
Total 405.3 346.8200.4405.3104.0Other Operations and Refunds
Designated Purposes120.0 120.089.3120.096.1Homeless Veterans' Program250.0 250.0250.0250.0146.9Troops to Teachers Program
Total 370.0 370.0339.3370.0243.0Designated Purposes
TOTAL FEDERAL FUNDS 1,682.2 1,660.11,438.61,775.31,040.8
TOTAL ALL FUNDS 106,096.2 120,899.4106,729.7126,782.490,595.6
BY FUND
54,674.4 66,325.966,631.272,146.551,370.0General Revenue Fund300.0 300.0300.0300.0121.1Illinois Veterans' Homes Fund
8,214.5 10,000.03,424.016,483.22,614.4Illinois Veterans Assistance Fund4,492.8 8,031.04,716.25,208.03,810.2LaSalle Veterans Home Fund2,043.1 2,350.52,491.22,529.91,943.6Anna Veterans Home Fund
223.0 223.0223.0223.0181.6Illinois Affordable Housing Trust Fund1,312.2 1,290.11,099.31,405.3797.8GI Education Fund
21,359.0 17,194.816,640.016,869.018,358.9Quincy Veterans Home Fund250.0 250.0250.0250.060.0Illinois Military Family Relief Fund370.0 370.0339.3370.0243.0Veterans' Affairs Federal Projects Fund
12,857.2 14,564.110,615.510,997.511,095.0Manteno Veterans Home Fund
TOTAL ALL FUNDS 106,096.2 120,899.4106,729.7126,782.490,595.6
BY DIVISION
16,297.4 19,705.811,196.224,736.08,746.8Central Office5,380.8 5,468.95,379.55,638.14,705.5Veterans' Field Services4,530.9 4,758.54,614.64,653.34,335.4Illinois Veterans' Home At Anna
40,829.1 41,864.640,527.040,702.237,419.2Illinois Veterans' Home At Quincy10,448.6 18,071.315,173.820,336.39,563.6Illinois Veterans' Home At LaSalle27,047.2 29,490.228,489.329,061.224,880.3Illinois Veterans' Home At Manteno
1,562.2 1,540.11,349.31,655.3944.8State Approving Agency
TOTAL ALL DIVISIONS 106,096.2 120,899.4106,729.7126,782.490,595.6
HEADCOUNT BY DIVISION Actual Estimated Authorized
36.0 52.047.0Central Office71.0 80.075.0Veterans' Field Services56.5 62.059.0Illinois Veterans' Home At Anna
487.0 525.0515.0Illinois Veterans' Home At Quincy109.5 206.5161.5Illinois Veterans' Home At LaSalle280.0 325.0315.0Illinois Veterans' Home At Manteno
7.0 11.09.0State Approving Agency
TOTAL HEADCOUNT 1,047.0 1,261.51,181.5 t
7 - 66

PUBLIC SAFETY
CODE DEPARTMENTS
Department of CorrectionsDepartment of Military Affairs
Department of State Police
OTHER AGENCIES, BOARDS and AUTHORITIES
Illinois Criminal Justice Information AuthorityIllinois Emergency Management Agency
Law Enforcement Training Standards BoardPrisoner Review Board
Office of the State Fire MarshalState Police Merit Board
www.state.il.us/budget
CHAPTER 8

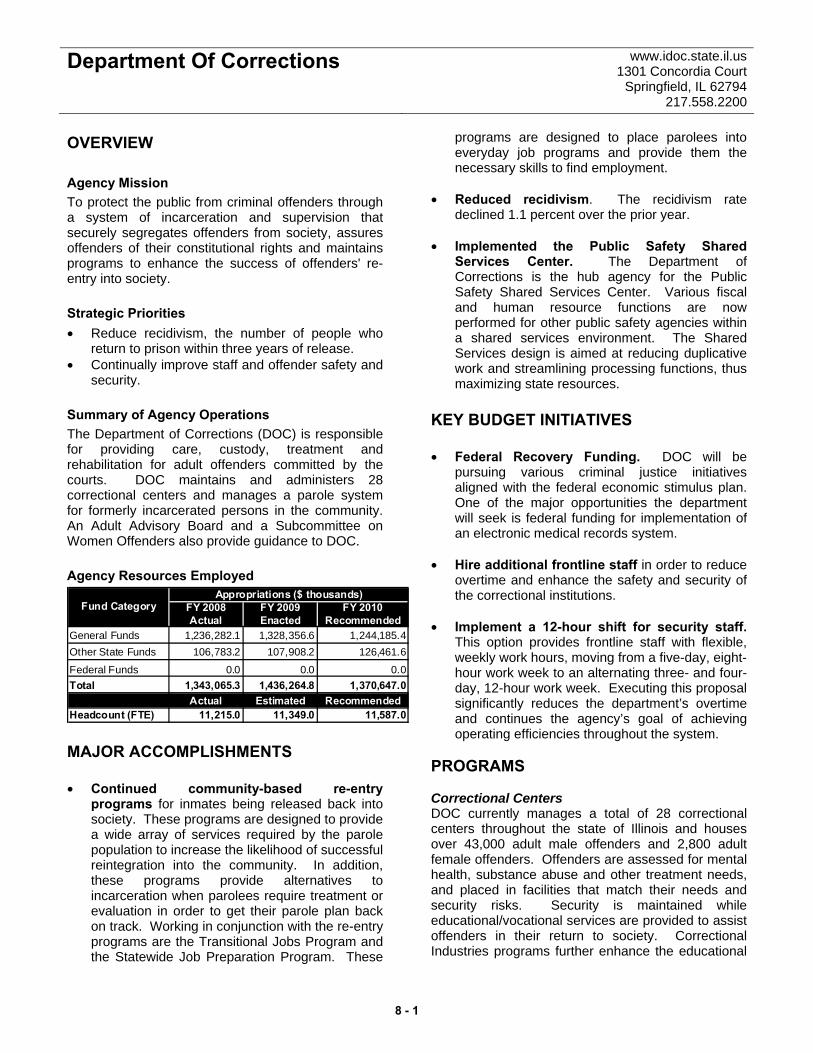
Department Of Corrections www.idoc.state.il.us 1301 Concordia Court
Springfield, IL 62794 217.558.2200
OVERVIEW Agency Mission To protect the public from criminal offenders through a system of incarceration and supervision that securely segregates offenders from society, assures offenders of their constitutional rights and maintains programs to enhance the success of offenders' re-entry into society. Strategic Priorities • Reduce recidivism, the number of people who
return to prison within three years of release. • Continually improve staff and offender safety and
security. Summary of Agency Operations The Department of Corrections (DOC) is responsible for providing care, custody, treatment and rehabilitation for adult offenders committed by the courts. DOC maintains and administers 28 correctional centers and manages a parole system for formerly incarcerated persons in the community. An Adult Advisory Board and a Subcommittee on Women Offenders also provide guidance to DOC. Agency Resources Employed
FY 2008 FY 2009 FY 2010Actual Enacted Recommended
General Funds 1,236,282.1 1,328,356.6 1,244,185.4Other State Funds 106,783.2 107,908.2 126,461.6
Federal Funds 0.0 0.0 0.0Total 1,343,065.3 1,436,264.8 1,370,647.0
Actual Estimated RecommendedHeadcount (FTE) 11,215.0 11,349.0 11,587.0
Appropriations ($ thousands)Fund Category
MAJOR ACCOMPLISHMENTS • Continued community-based re-entry
programs for inmates being released back into society. These programs are designed to provide a wide array of services required by the parole population to increase the likelihood of successful reintegration into the community. In addition, these programs provide alternatives to incarceration when parolees require treatment or evaluation in order to get their parole plan back on track. Working in conjunction with the re-entry programs are the Transitional Jobs Program and the Statewide Job Preparation Program. These
programs are designed to place parolees into everyday job programs and provide them the necessary skills to find employment.
• Reduced recidivism. The recidivism rate
declined 1.1 percent over the prior year. • Implemented the Public Safety Shared
Services Center. The Department of Corrections is the hub agency for the Public Safety Shared Services Center. Various fiscal and human resource functions are now performed for other public safety agencies within a shared services environment. The Shared Services design is aimed at reducing duplicative work and streamlining processing functions, thus maximizing state resources.
KEY BUDGET INITIATIVES • Federal Recovery Funding. DOC will be
pursuing various criminal justice initiatives aligned with the federal economic stimulus plan. One of the major opportunities the department will seek is federal funding for implementation of an electronic medical records system.
• Hire additional frontline staff in order to reduce
overtime and enhance the safety and security of the correctional institutions.
• Implement a 12-hour shift for security staff.
This option provides frontline staff with flexible, weekly work hours, moving from a five-day, eight-hour work week to an alternating three- and four-day, 12-hour work week. Executing this proposal significantly reduces the department’s overtime and continues the agency’s goal of achieving operating efficiencies throughout the system.
PROGRAMS Correctional Centers DOC currently manages a total of 28 correctional centers throughout the state of Illinois and houses over 43,000 adult male offenders and 2,800 adult female offenders. Offenders are assessed for mental health, substance abuse and other treatment needs, and placed in facilities that match their needs and security risks. Security is maintained while educational/vocational services are provided to assist offenders in their return to society. Correctional Industries programs further enhance the educational
8 - 1
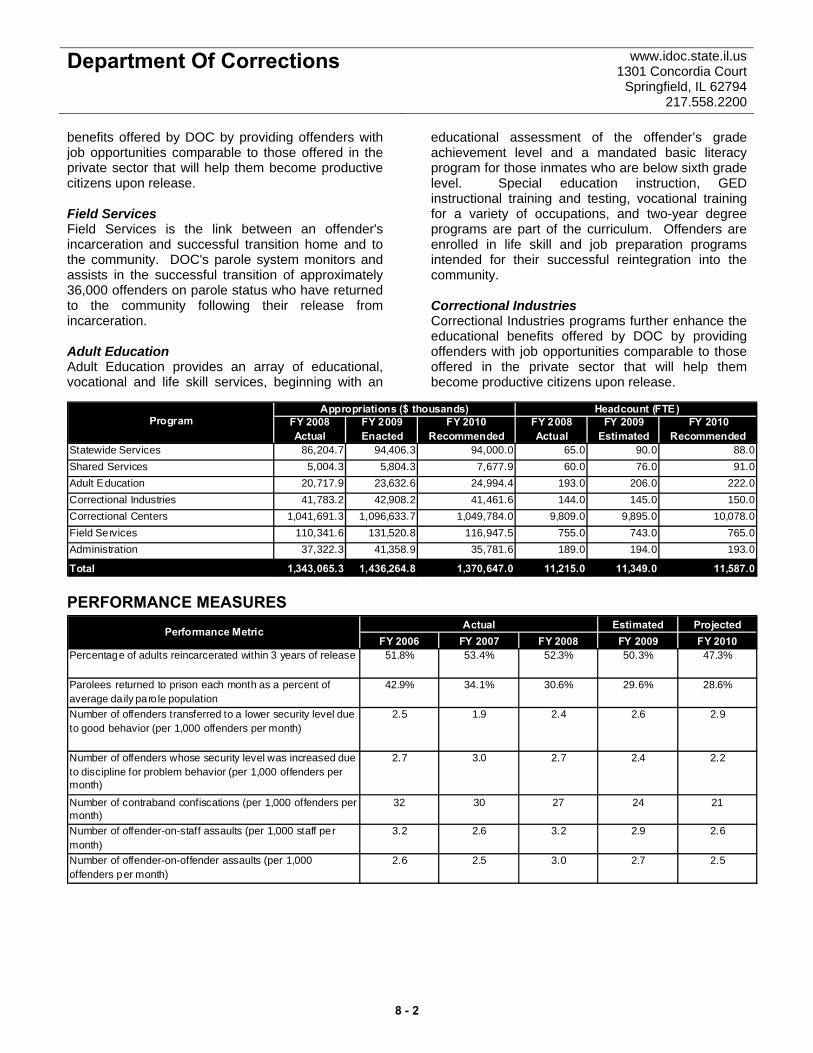
Department Of Corrections www.idoc.state.il.us 1301 Concordia Court
Springfield, IL 62794 217.558.2200
benefits offered by DOC by providing offenders with job opportunities comparable to those offered in the private sector that will help them become productive citizens upon release. Field Services Field Services is the link between an offender's incarceration and successful transition home and to the community. DOC's parole system monitors and assists in the successful transition of approximately 36,000 offenders on parole status who have returned to the community following their release from incarceration. Adult Education Adult Education provides an array of educational, vocational and life skill services, beginning with an
educational assessment of the offender’s grade achievement level and a mandated basic literacy program for those inmates who are below sixth grade level. Special education instruction, GED instructional training and testing, vocational training for a variety of occupations, and two-year degree programs are part of the curriculum. Offenders are enrolled in life skill and job preparation programs intended for their successful reintegration into the community. Correctional Industries Correctional Industries programs further enhance the educational benefits offered by DOC by providing offenders with job opportunities comparable to those offered in the private sector that will help them become productive citizens upon release.
Program FY 2008 FY 2009 FY 2010 FY 2008 FY 2009 FY 2010Actual Enacted Recommended Actual Estimated Recommended
Statewide Services 86,204.7 94,406.3 94,000.0 65.0 90.0 88.0Shared Services 5,004.3 5,804.3 7,677.9 60.0 76.0 91.0Adult Education 20,717.9 23,632.6 24,994.4 193.0 206.0 222.0Correctional Industries 41,783.2 42,908.2 41,461.6 144.0 145.0 150.0Correctional Centers 1,041,691.3 1,096,633.7 1,049,784.0 9,809.0 9,895.0 10,078.0Field Services 110,341.6 131,520.8 116,947.5 755.0 743.0 765.0Administration 37,322.3 41,358.9 35,781.6 189.0 194.0 193.0
Total 1,343,065.3 1,436,264.8 1,370,647.0 11,215.0 11,349.0 11,587.0
Appropriations ($ thousands) Headcount (FTE)
PERFORMANCE MEASURES Estimated Projected
FY 2006 FY 2007 FY 2008 FY 2009 FY 2010Percentage of adults reincarcerated within 3 years of release 51.8% 53.4% 52.3% 50.3% 47.3%
Parolees returned to prison each month as a percent of average da ily paro le population
42.9% 34.1% 30.6% 29.6% 28.6%
Number of offenders transferred to a lower security level due to good behavior (per 1,000 offenders per month)
2.5 1.9 2.4 2.6 2.9
Number of offenders whose security level was increased due to discipline for problem behavior (per 1,000 offenders per month)
2.7 3.0 2.7 2.4 2.2
Number of contraband confiscations (per 1,000 offenders per month)
32 30 27 24 21
Number of offender-on-staff assaults (per 1,000 staff per month)
3.2 2.6 3.2 2.9 2.6
Number of offender-on-offender assaults (per 1,000 offenders per month)
2.6 2.5 3.0 2.7 2.5
ActualPerformance Metric
8 - 2

ActualExpenditure
EnactedAppropriation
EstimatedExpenditures
EnactedAppropriation
Fiscal Year2010
RecommendedAppropriation
Fiscal Year 2008 Fiscal Year 2009
Department Of Corrections www.idoc.state.il.us1301 Concordia Court
Springfield, IL 62794217.558.2200
Appropriations Requiring General Assembly Action($ thousands)
GENERAL FUNDS
Total 901,734.7 881,723.0919,156.3936,495.7887,267.3Personal Services and Fringe Benefits
Total 214,415.8 249,513.4246,066.1248,022.5214,351.8Contractual Services
Total 81,154.5 93,991.193,701.491,097.881,009.6Other Operations and Refunds
Designated Purposes5,004.3 7,677.95,804.35,804.34,985.8For Costs Associated with the Shared Services Initiative
and Other Operational Expenses7,454.7 7,500.09,656.39,656.37,160.6For Statewide Hospitalization1,500.0 1,500.01,455.01,500.01,500.0Grant to Franklin County Juvenile Detention Center for
Methamphetamine Pilot Program12,000.0 0.010,926.712,000.00.0Additonal Frontline Staff
250.0 0.00.00.0177.3Halfway Back790.0 0.00.00.0399.5Re-Entry Programs
Total 26,999.0 16,677.927,842.328,960.614,223.2Designated Purposes
Grants337.4 337.4337.4337.4337.4Sheriffs' Fees for Conveying Prisoners376.4 376.4376.4376.4276.8State's Share of Assistant State's Attorneys' Salaries
Reimbursement to Counties per Ch. 53 of the IL Rev.Statutes
1,177.0 816.2816.2816.21,176.9Tort Claims0.0 0.06,062.56,250.00.0Anti-Violence Prevention
1,500.0 0.01,455.01,500.01,500.0Cook County Boot Camp7,500.0 0.07,275.07,500.07,500.0Cook County Juvenile Detention Center
0.0 0.06,062.56,250.00.0Grant to Operation CeasefireTotal 10,890.8 1,530.022,385.023,030.010,791.1Grants
Capital Improvements1,087.3 750.0750.0750.0830.9Repair, Maintenance and Other Capital Improvements
Total 1,087.3 750.0750.0750.0830.9Capital Improvements
TOTAL GENERAL FUNDS 1,236,282.1 1,244,185.41,309,901.11,328,356.61,208,473.9
OTHER STATE FUNDS
Total 17,364.0 15,396.116,067.817,854.316,491.3Personal Services and Fringe Benefits
Total 2,174.6 2,194.72,194.72,194.72,131.9Contractual Services
Total 22,097.6 23,723.822,712.222,712.221,558.5Other Operations and Refunds
Designated Purposes0.0 20,000.00.00.00.0Federal Recovery- For Payment of Expenses Related to
Law Enforcement and Other Programs28,000.0 27,000.02,480.627,000.014,518.5For Payment of Expenses: Federal Programs22,000.0 23,000.020,651.423,000.019,801.0For Payment of Expenses: Miscellaneous Programs15,000.0 15,000.03,360.215,000.06,622.5For Payment of Expenses: School District Programs
Total 65,000.0 85,000.026,492.265,000.040,942.0Designated Purposes
Capital Improvements147.0 147.0147.0147.00.0Repair, Maintenance and Other Capital Improvements
Total 147.0 147.0147.0147.00.0Capital Improvements
TOTAL OTHER STATE FUNDS 106,783.2 126,461.667,613.9107,908.281,123.8
TOTAL ALL FUNDS 1,343,065.3 1,370,647.01,377,515.01,436,264.81,289,597.7
8 - 3

ActualExpenditure
EnactedAppropriation
EstimatedExpenditures
EnactedAppropriation
Fiscal Year2010
RecommendedAppropriation
Fiscal Year 2008 Fiscal Year 2009
Department Of Corrections www.idoc.state.il.us1301 Concordia Court
Springfield, IL 62794217.558.2200
Appropriations Requiring General Assembly Action($ thousands)
BY FUND
1,236,282.1 1,244,185.41,309,901.11,328,356.61,208,473.9General Revenue Fund
41,783.2 41,461.641,121.742,908.240,181.8Working Capital Revolving Fund
65,000.0 85,000.026,492.265,000.040,942.0Department of Corrections Reimbursement and EducationFundTOTAL ALL FUNDS 1,343,065.3 1,370,647.01,377,515.01,436,264.81,289,597.7
BY DIVISION
20,717.9 24,994.423,152.223,632.618,864.8Education Services
123,875.7 118,198.9144,521.0150,887.0111,396.4Field Services
30,147.2 30,799.831,970.932,067.330,046.8Big Muddy River Correctional Center
32,870.5 31,730.535,037.634,137.832,724.2Centralia Correctional Center
30,917.7 31,003.431,497.532,776.130,795.7Danville Correctional Center
20,120.5 20,712.021,380.420,935.020,116.0Decatur Women's Correctional Center
53,257.3 56,525.356,710.457,144.653,253.4Dixon Correctional Center
40,035.5 40,656.640,708.041,421.438,700.2Dwight/Kankakee Correctional Centers
25,403.1 26,688.426,991.626,607.225,402.3East Moline Correctional Center
27,276.7 29,031.829,831.129,908.527,245.3Southwestern Illinois Correctional Center
37,735.8 39,381.138,594.740,070.437,715.6Graham Correctional Center
36,514.7 35,133.835,563.733,792.133,178.2Illinois River Correctional Center
30,132.5 31,905.632,685.631,875.729,393.3Hill Correctional Center
38,856.3 39,390.040,728.839,897.638,855.0Jacksonville Correctional Center
37,982.9 41,958.840,886.741,601.737,982.1Lawrence Correctional Center
22,667.2 23,472.123,283.824,137.222,666.5Lincoln Correctional Center
33,390.2 32,707.034,265.134,710.433,389.8Logan Correctional Center
72,417.4 70,606.076,613.774,909.671,871.3Menard Correctional Center
40,813.1 40,364.541,852.442,565.640,565.6Pinckneyville Correctional Center
55,212.0 54,293.756,093.558,871.053,245.9Pontiac Correctional Center
24,362.9 25,715.526,907.826,276.524,361.4Robinson Correctional Center
35,408.7 35,156.536,435.236,320.834,395.1Shawnee Correctional Center
41,779.7 45,316.844,658.547,511.541,121.3Sheridan Correctional Center
5,004.3 7,677.95,804.35,804.34,985.8Shared Services
28,880.8 26,968.228,118.529,431.427,698.0Tamms Correctional Center
109,782.0 103,780.8113,748.3114,543.9109,751.7Stateville Correctional Center
23,761.1 24,696.225,209.725,541.423,760.6Taylorville Correctional Center
34,327.4 33,411.833,692.835,420.834,326.8Vandalia Correctional Center
6,308.9 8,775.08,915.310,531.86,307.6Thomson Correctional Center
31,635.8 31,691.332,634.733,536.831,630.9Vienna Correctional Center
35,464.6 34,107.136,498.936,531.034,221.9Western Illinois Correctional Center
41,783.2 41,461.641,121.742,908.240,181.8Correctional Industries
114,221.7 132,334.681,400.8119,957.689,446.6General Office
TOTAL ALL DIVISIONS 1,343,065.3 1,370,647.01,377,515.01,436,264.81,289,597.7
8 - 4

ActualExpenditure
EnactedAppropriation
EstimatedExpenditures
EnactedAppropriation
Fiscal Year2010
RecommendedAppropriation
Fiscal Year 2008 Fiscal Year 2009
Department Of Corrections www.idoc.state.il.us1301 Concordia Court
Springfield, IL 62794217.558.2200
Appropriations Requiring General Assembly Action($ thousands)
HEADCOUNT BY DIVISION Actual Estimated Authorized
193.0 222.0206.0Education Services
755.0 765.0743.0Field Services
293.0 284.0289.0Big Muddy River Correctional Center
314.0 322.0307.0Centralia Correctional Center
303.0 292.0295.0Danville Correctional Center
219.0 215.0210.0Decatur Women's Correctional Center
453.0 500.0498.0Dixon Correctional Center
336.0 374.0371.0Dwight/Kankakee Correctional Centers
252.0 260.0258.0East Moline Correctional Center
228.0 214.0223.0Southwestern Illinois Correctional Center
371.0 399.0369.0Graham Correctional Center
329.0 333.0327.0Illinois River Correctional Center
280.0 300.0296.0Hill Correctional Center
447.0 430.0439.0Jacksonville Correctional Center
374.0 412.0387.0Lawrence Correctional Center
195.0 213.0210.0Lincoln Correctional Center
306.0 319.0319.0Logan Correctional Center
745.0 730.0726.0Menard Correctional Center
397.0 398.0397.0Pinckneyville Correctional Center
533.0 564.0515.0Pontiac Correctional Center
234.0 252.0230.0Robinson Correctional Center
338.0 348.0332.0Shawnee Correctional Center
279.0 304.0303.0Sheridan Correctional Center
60.0 91.076.0Shared Services
292.0 278.0273.0Tamms Correctional Center
958.0 1,020.01,015.0Stateville Correctional Center
227.0 238.0222.0Taylorville Correctional Center
346.0 356.0342.0Vandalia Correctional Center
76.0 75.075.0Thomson Correctional Center
345.0 327.0334.0Vienna Correctional Center
339.0 321.0333.0Western Illinois Correctional Center
144.0 150.0145.0Correctional Industries
254.0 281.0284.0General Office
TOTAL HEADCOUNT 11,215.0 11,587.011,349.0 t
8 - 5
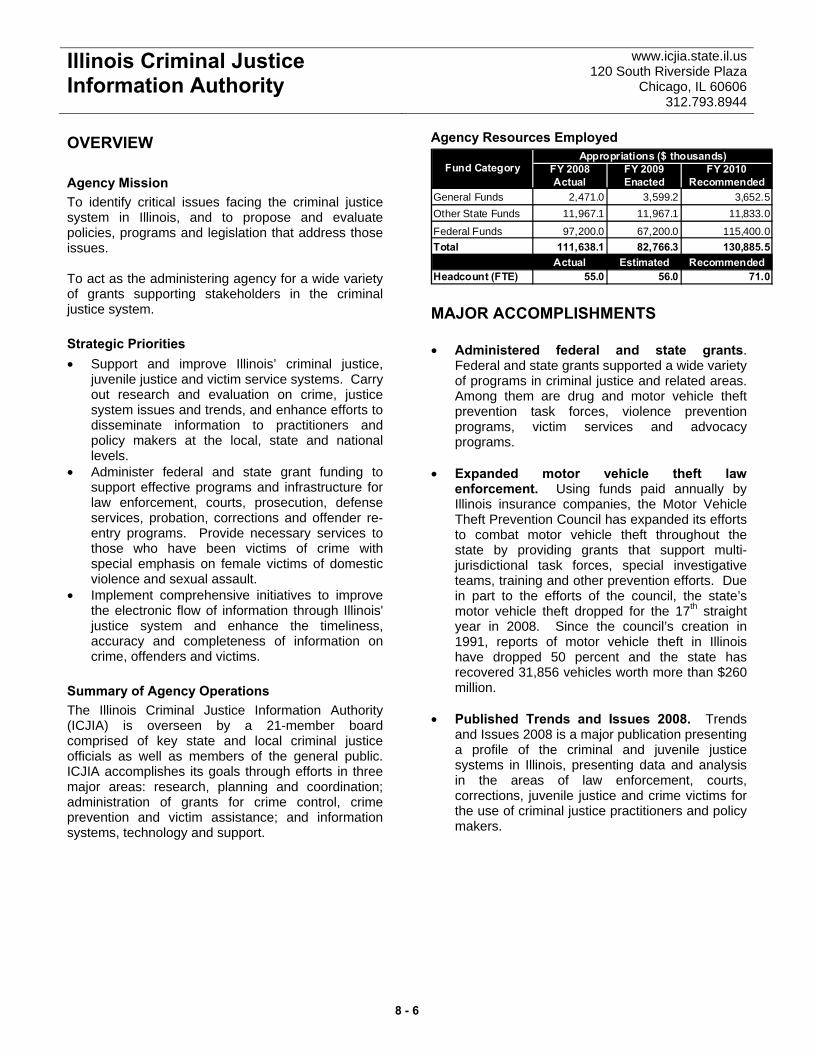
Illinois Criminal Justice Information Authority
www.icjia.state.il.us 120 South Riverside Plaza
Chicago, IL 60606 312.793.8944
OVERVIEW Agency Mission To identify critical issues facing the criminal justice system in Illinois, and to propose and evaluate policies, programs and legislation that address those issues. To act as the administering agency for a wide variety of grants supporting stakeholders in the criminal justice system. Strategic Priorities • Support and improve Illinois’ criminal justice,
juvenile justice and victim service systems. Carry out research and evaluation on crime, justice system issues and trends, and enhance efforts to disseminate information to practitioners and policy makers at the local, state and national levels.
• Administer federal and state grant funding to support effective programs and infrastructure for law enforcement, courts, prosecution, defense services, probation, corrections and offender re-entry programs. Provide necessary services to those who have been victims of crime with special emphasis on female victims of domestic violence and sexual assault.
• Implement comprehensive initiatives to improve the electronic flow of information through Illinois' justice system and enhance the timeliness, accuracy and completeness of information on crime, offenders and victims.
Summary of Agency Operations The Illinois Criminal Justice Information Authority (ICJIA) is overseen by a 21-member board comprised of key state and local criminal justice officials as well as members of the general public. ICJIA accomplishes its goals through efforts in three major areas: research, planning and coordination; administration of grants for crime control, crime prevention and victim assistance; and information systems, technology and support.
Agency Resources Employed
FY 2008 FY 2009 FY 2010Actual Enacted Recommended
General Funds 2,471.0 3,599.2 3,652.5Other State Funds 11,967.1 11,967.1 11,833.0
Federal Funds 97,200.0 67,200.0 115,400.0Total 111,638.1 82,766.3 130,885.5
Actual Estimated RecommendedHeadcount (FTE) 55.0 56.0 71.0
Appropriations ($ thousands)Fund Category
MAJOR ACCOMPLISHMENTS • Administered federal and state grants.
Federal and state grants supported a wide variety of programs in criminal justice and related areas. Among them are drug and motor vehicle theft prevention task forces, violence prevention programs, victim services and advocacy programs.
• Expanded motor vehicle theft law
enforcement. Using funds paid annually by Illinois insurance companies, the Motor Vehicle Theft Prevention Council has expanded its efforts to combat motor vehicle theft throughout the state by providing grants that support multi-jurisdictional task forces, special investigative teams, training and other prevention efforts. Due in part to the efforts of the council, the state’s motor vehicle theft dropped for the 17th straight year in 2008. Since the council’s creation in 1991, reports of motor vehicle theft in Illinois have dropped 50 percent and the state has recovered 31,856 vehicles worth more than $260 million.
• Published Trends and Issues 2008. Trends
and Issues 2008 is a major publication presenting a profile of the criminal and juvenile justice systems in Illinois, presenting data and analysis in the areas of law enforcement, courts, corrections, juvenile justice and crime victims for the use of criminal justice practitioners and policy makers.
8 - 6

Illinois Criminal Justice Information Authority
www.icjia.state.il.us 120 South Riverside Plaza
Chicago, IL 60606 312.793.8944
• Funded 20 Metropolitan Enforcement Groups (MEGS) and task forces for drug investigations. In 2008, ICJIA funded 20 Metropolitan Enforcement Groups (MEGS) and task forces for drug investigations with a proportional amount dedicated to methamphetamine, ecstasy, and other club drug investigations and drug trafficking enforcement. The number of investigations initiated increased by 17 percent (6,006), arrests for prosecution resulting in conviction increased by 73 percent, over $3.1 million in currency seized and over $2.4 million in property assets seized for over $5.5 million in total forfeitures.
• Selected along with the University of Illinois
Chicago to address crime for Go To 2040. Go to 2040 is a comprehensive planning program launched by the Chicago Metropolitan Agency for Planning to guide growth for the seven counties of the Chicago metropolitan area through the year 2040. The group will provide guidance in all major quality-of-life issue areas including: the natural environment, economic development, land use, transportation, housing, human services, education, health care and social services.
KEY BUDGET INITIATIVES • Federal recovery. Funds provided will go toward
the following grants: Justice Assistance Grants (JAG), VAWA, and Victims of Crime Act. These grants will protect the most vulnerable and victimized of our society by funding additional law enforcement personnel, violence prevention and education programs, drug treatment programs, and support services and advocacy groups for victims of crime and domestic violence.
• Provide support for Victims of Crime. Fifteen
million dollars was allocated in federal fiscal year 2008 to Illinois through the Victims of Crime Act (VOCA) and Violence Against Women Act (VAWA) to support grants for a multitude of victim services in Illinois, including providing victims with crisis intervention, counseling, emergency shelter and transportation, among other services.
• Implement Integrated Justice Information Systems. ICJIA will continue to facilitate and contribute to the implementation of the Illinois Integrated Justice Information System Strategic Plan through comprehensive initiatives to enable electronic flow of information through Illinois' justice system. Once complete, this will enhance the timeliness, accuracy and completeness of criminal justice information.
• Continued Support of the adult and juvenile
re-entry programs and juvenile violence prevention programs. ICJIA will continue to provide relevant research, funding and expertise to support the development of more effective policies and programs that are aimed at preparing offenders for their return to the community and reducing the cycle of re-offending behavior.
PROGRAMS Information Systems and Technology The authority promotes the accuracy of criminal history and other justice-related records while supporting the development of an integrated criminal justice information network in Illinois. The authority also operates InfoNet, a victim service database, and Clandestine Laboratory Reporting Information System (CLARIS). Systemic Research, Planning and Coordination The authority identifies and analyzes critical issues facing the justice system; proposes and evaluates policies, programs and legislation that address those issues; advises the governor, Illinois General Assembly, other state and local officials, and members of the general public on the implications of such research, evaluation and analysis; functions as a repository of research, data and other information; and disseminates information, develops tools and provides technical assistance that support state and local crime problem-solving. Crime Control, Crime Prevention and Crime Victim Assistance The authority develops, coordinates, administers, implements and evaluates programs designed to enhance and improve Illinois' criminal justice, juvenile justice and victim service systems through several major federal assistance and state grants.
8 - 7
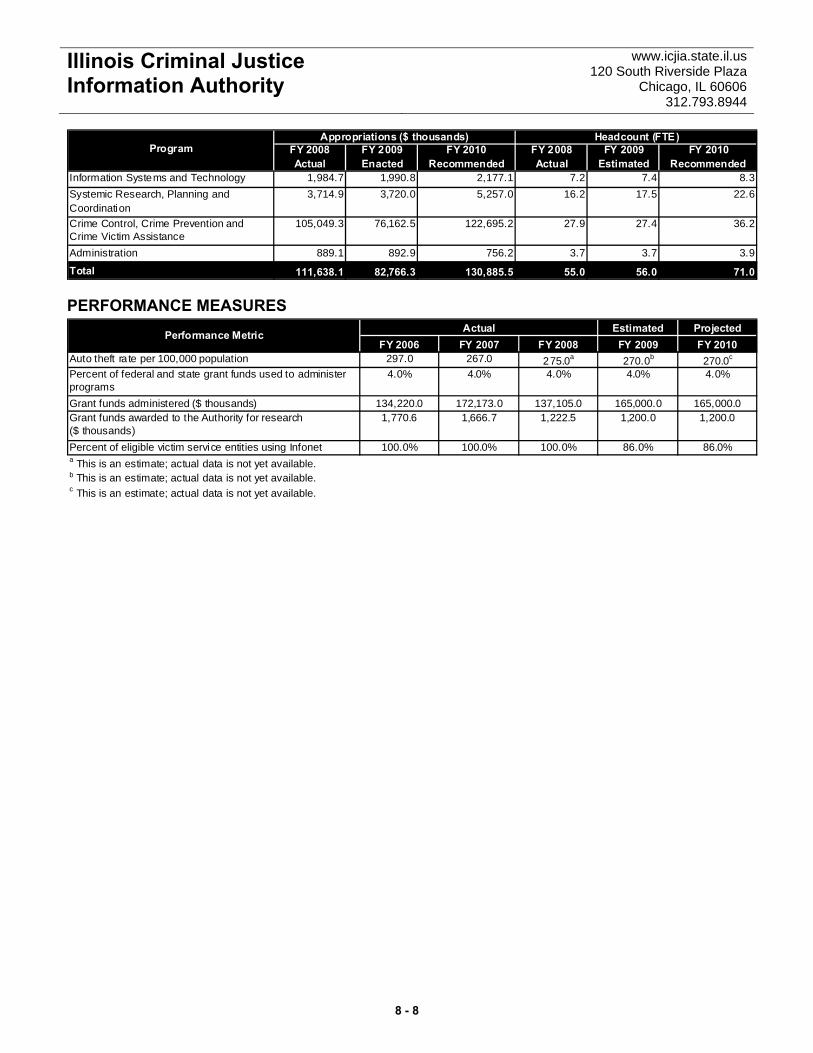
Illinois Criminal Justice Information Authority
www.icjia.state.il.us 120 South Riverside Plaza
Chicago, IL 60606 312.793.8944
Program FY 2008 FY 2009 FY 2010 FY 2008 FY 2009 FY 2010Actual Enacted Recommended Actual Estimated Recommended
Information Systems and Technology 1,984.7 1,990.8 2,177.1 7.2 7.4 8.3Systemic Research, Planning and Coordination
3,714.9 3,720.0 5,257.0 16.2 17.5 22.6
Crime Control, Crime Prevention and Crime Victim Assistance
105,049.3 76,162.5 122,695.2 27.9 27.4 36.2
Administration 889.1 892.9 756.2 3.7 3.7 3.9
Total 111,638.1 82,766.3 130,885.5 55.0 56.0 71.0
Appropriations ($ thousands) Headcount (FTE)
PERFORMANCE MEASURES Estimated Projected
FY 2006 FY 2007 FY 2008 FY 2009 FY 2010Auto theft ra te per 100,000 population 297.0 267.0 275.0a 270.0b 270.0c
Percent of federal and state grant funds used to administer programs
4.0% 4.0% 4.0% 4.0% 4.0%
Grant funds administered ($ thousands) 134,220.0 172,173.0 137,105.0 165,000.0 165,000.0Grant funds awarded to the Authority for research�($ thousands)
1,770.6 1,666.7 1,222.5 1,200.0 1,200.0
Percent of eligible victim service entities using Infonet 100.0% 100.0% 100.0% 86.0% 86.0%
ActualPerformance Metric
a This is an estimate; actual data is not yet available.b This is an estimate; actual data is not yet available.c This is an estimate; actual data is not yet available.
8 - 8

ActualExpenditure
EnactedAppropriation
EstimatedExpenditures
EnactedAppropriation
Fiscal Year2010
RecommendedAppropriation
Fiscal Year 2008 Fiscal Year 2009
Illinois Criminal JusticeInformation Authority
www.icjia.state.il.us120 South Riverside Plaza
Chicago, IL 60606312.793.8944
Appropriations Requiring General Assembly Action($ thousands)
GENERAL FUNDS
Total 1,699.1 1,725.61,505.21,715.51,515.6Personal Services and Fringe Benefits
Total 331.7 350.0365.4331.7194.0Contractual Services
Total 264.8 276.9244.3264.8187.9Other Operations and Refunds
Designated Purposes13.2 1,300.0950.01,000.013.2Activities in Support of Federal Assistance Programs
Administered by State and Local Governments andNonprofit Organizations
0.0 0.050.0125.00.0For Costs and Expenses Related to a CapitalPunishment Reform Study Committee
162.2 0.00.0162.20.0For Costs Associated with the Shared Services Initiativeand Other Operational Expenses
Total 175.4 1,300.01,000.01,287.213.2Designated Purposes
TOTAL GENERAL FUNDS 2,471.0 3,652.53,114.93,599.21,910.6
OTHER STATE FUNDS
Total 154.8 174.0154.8154.8149.8Personal Services and Fringe Benefits
Total 75.0 75.025.075.00.0Other Operations and Refunds
Designated Purposes400.0 400.025.0400.00.0Activities Undertaken in Support of Investigating Issues
in Criminal Justice157.4 184.0148.0157.4154.7Other Ordinary and Contingent Expenses
179.9 0.00.0179.90.0For Costs Associated with the Shared Services Initiativeand Other Operational Expenses
Total 737.3 584.0173.0737.3154.7Designated Purposes
Grants4,500.0 4,500.02,400.04,500.01,640.7Awards and Grants and Operational Costs in Support of
the Juvenile Accountability Incentive Block GrantProgram
6,500.0 6,500.06,200.06,500.06,121.6Awards and Grants and Operational Costs of the MotorVehicle Theft Prevention Act
Total 11,000.0 11,000.08,600.011,000.07,762.3Grants
TOTAL OTHER STATE FUNDS 11,967.1 11,833.08,952.811,967.18,066.7
FEDERAL FUNDS
Designated Purposes5,800.0 5,800.04,200.05,800.04,576.1Activities in Support of Federal Assistance Programs
Administered by State and Local Governments andNonprofit Organizations
1,700.0 1,700.0300.01,700.0160.9Activities Undertaken in Support of Investigating Issuesin Criminal Justice
0.0 4,500.00.00.00.0Federal Recovery - Activities in Support of FederalAssistance Programs Administered by State and LocalGovernments and Nonprofit Organizations
700.0 0.00.0700.00.0For Costs Associated with the Shared Services Initiativeand Other Operational Expenses
Total 8,200.0 12,000.04,500.08,200.04,737.0Designated Purposes
8 - 9

ActualExpenditure
EnactedAppropriation
EstimatedExpenditures
EnactedAppropriation
Fiscal Year2010
RecommendedAppropriation
Fiscal Year 2008 Fiscal Year 2009
Illinois Criminal JusticeInformation Authority
www.icjia.state.il.us120 South Riverside Plaza
Chicago, IL 60606312.793.8944
Appropriations Requiring General Assembly Action($ thousands)
Grants37,000.0 40,000.035,000.037,000.030,580.0Awards and Grants to Local Units of Government and
Nonprofit Organizations12,000.0 12,000.011,000.012,000.03,599.4Awards and Grants to State Agencies
0.0 23,000.00.00.00.0Federal Recovery - For Byrne/JAG Awards and Grantsto Local Units of Government and NonprofitOrganizations
0.0 23,000.00.00.00.0Federal Recovery - For Byrne/JAG Awards and Grantsto State Agencies
0.0 1,300.00.00.00.0Federal Recovery - For Crime Victim Assistance Awardsand Grants to State Agencies
0.0 100.00.00.00.0Federal Recovery - For Crime Victim Assitance Awardsand Grants to Local Units of Government and NonprofitOrganizations
0.0 3,000.00.00.00.0Federal Recovery - For Violence Against WomenAwards and Grants to Local Units of Government andNonprofit Organizations
0.0 1,000.00.00.00.0Federal Recovery - For Violence Against WomenAwards and Grants to State Agencies
40,000.0 0.00.010,000.017,184.9Awards and Grants to State Agencies and LocalGovernments in support of Federal Crime Bill Initiative
Total 89,000.0 103,400.046,000.059,000.051,364.2Grants
TOTAL FEDERAL FUNDS 97,200.0 115,400.050,500.067,200.056,101.2
TOTAL ALL FUNDS 111,638.1 130,885.562,567.782,766.366,078.5
BY FUND
2,471.0 3,652.53,114.93,599.21,910.6General Revenue Fund
6,967.1 6,933.06,527.86,967.16,426.1Motor Vehicle Theft Prevention Trust Fund
400.0 400.025.0400.00.0Criminal Justice Information Projects Fund
97,200.0 115,400.050,500.067,200.056,101.2Criminal Justice Trust Fund
4,600.0 4,500.02,400.04,600.01,640.7Juvenile Accountability Incentive Block Grant Fund
TOTAL ALL FUNDS 111,638.1 130,885.562,567.782,766.366,078.5
BY DIVISION
110,596.0 130,885.562,567.781,724.266,078.5Operations
1,042.1 0.00.01,042.10.0Shared Services
TOTAL ALL DIVISIONS 111,638.1 130,885.562,567.782,766.366,078.5
HEADCOUNT BY DIVISION Actual Estimated Authorized
55.0 71.056.0Operations
TOTAL HEADCOUNT 55.0 71.056.0 t
8 - 10
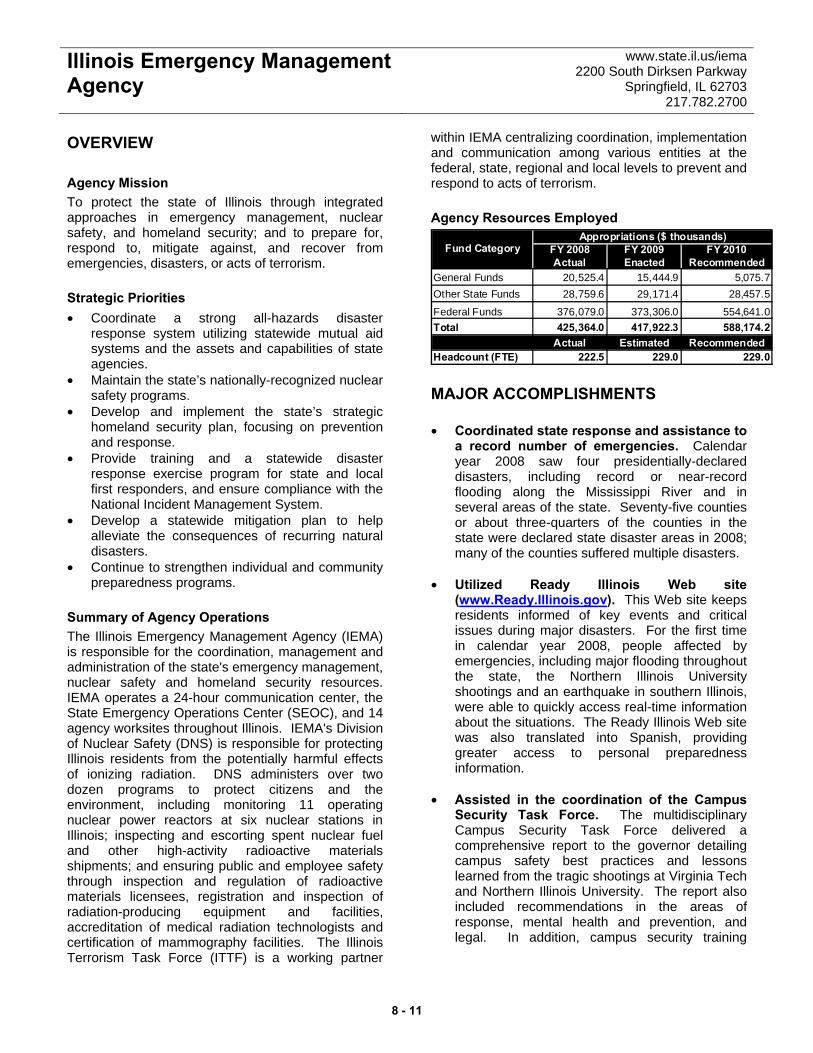
Illinois Emergency Management Agency
www.state.il.us/iema 2200 South Dirksen Parkway
Springfield, IL 62703 217.782.2700
OVERVIEW Agency Mission To protect the state of Illinois through integrated approaches in emergency management, nuclear safety, and homeland security; and to prepare for, respond to, mitigate against, and recover from emergencies, disasters, or acts of terrorism. Strategic Priorities • Coordinate a strong all-hazards disaster
response system utilizing statewide mutual aid systems and the assets and capabilities of state agencies.
• Maintain the state’s nationally-recognized nuclear safety programs.
• Develop and implement the state’s strategic homeland security plan, focusing on prevention and response.
• Provide training and a statewide disaster response exercise program for state and local first responders, and ensure compliance with the National Incident Management System.
• Develop a statewide mitigation plan to help alleviate the consequences of recurring natural disasters.
• Continue to strengthen individual and community preparedness programs.
Summary of Agency Operations The Illinois Emergency Management Agency (IEMA) is responsible for the coordination, management and administration of the state's emergency management, nuclear safety and homeland security resources. IEMA operates a 24-hour communication center, the State Emergency Operations Center (SEOC), and 14 agency worksites throughout Illinois. IEMA's Division of Nuclear Safety (DNS) is responsible for protecting Illinois residents from the potentially harmful effects of ionizing radiation. DNS administers over two dozen programs to protect citizens and the environment, including monitoring 11 operating nuclear power reactors at six nuclear stations in Illinois; inspecting and escorting spent nuclear fuel and other high-activity radioactive materials shipments; and ensuring public and employee safety through inspection and regulation of radioactive materials licensees, registration and inspection of radiation-producing equipment and facilities, accreditation of medical radiation technologists and certification of mammography facilities. The Illinois Terrorism Task Force (ITTF) is a working partner
within IEMA centralizing coordination, implementation and communication among various entities at the federal, state, regional and local levels to prevent and respond to acts of terrorism. Agency Resources Employed
FY 2008 FY 2009 FY 2010Actual Enacted Recommended
General Funds 20,525.4 15,444.9 5,075.7Other State Funds 28,759.6 29,171.4 28,457.5
Federal Funds 376,079.0 373,306.0 554,641.0Total 425,364.0 417,922.3 588,174.2
Actual Estimated RecommendedHeadcount (FTE) 222.5 229.0 229.0
Appropriations ($ thousands)Fund Category
MAJOR ACCOMPLISHMENTS • Coordinated state response and assistance to
a record number of emergencies. Calendar year 2008 saw four presidentially-declared disasters, including record or near-record flooding along the Mississippi River and in several areas of the state. Seventy-five counties or about three-quarters of the counties in the state were declared state disaster areas in 2008; many of the counties suffered multiple disasters.
• Utilized Ready Illinois Web site
(www.Ready.Illinois.gov). This Web site keeps residents informed of key events and critical issues during major disasters. For the first time in calendar year 2008, people affected by emergencies, including major flooding throughout the state, the Northern Illinois University shootings and an earthquake in southern Illinois, were able to quickly access real-time information about the situations. The Ready Illinois Web site was also translated into Spanish, providing greater access to personal preparedness information.
• Assisted in the coordination of the Campus
Security Task Force. The multidisciplinary Campus Security Task Force delivered a comprehensive report to the governor detailing campus safety best practices and lessons learned from the tragic shootings at Virginia Tech and Northern Illinois University. The report also included recommendations in the areas of response, mental health and prevention, and legal. In addition, campus security training
8 - 11

Illinois Emergency Management Agency
www.state.il.us/iema 2200 South Dirksen Parkway
Springfield, IL 62703 217.782.2700
sessions were provided to colleges throughout the state.
• Received federal approval of the Illinois
Statewide Communications Interoperability Plan. Illinois’ comprehensive plan for ensuring that first responders throughout the state can communicate with each other during emergencies was approved by the U.S. Department of Homeland Security (DHS). The plan sets out a statewide communications strategy that focuses on establishing a single platform so all public agencies can share emergency information during a local, regional or statewide disaster.
• Upgraded the Gamma Detection Network
(GDN). IEMA completed the first stage in an upgrade to the GDN around nuclear power plants in Illinois. The GDN monitors the environment around nuclear power plants 24 hours a day and 7 days a week, and feeds this information to the Radiological Emergency Assessment Center in Springfield. Information from the system would be used during an emergency to protect the public and emergency workers before and during a radiological release.
• Launched public outreach program for citizen
preparedness. Creative radio and TV spots that began airing in 2008 more than doubled the number of people seeking preparedness information on the Ready Illinois Website.
KEY BUDGET INITIATIVES • Implement Preventive Radiological and
Nuclear Detection (PRND) program. In 2009, Illinois will become the first state in the nation to implement a PRND program. This program, funded by the ITTF using federal homeland security funds, will provide nuclear detection units to police and fire vehicles throughout the state.
• Build upon the state’s communications
interoperability platform. To date, more than 3,000 Starcom21 radios have been provided to public safety agencies, and in fiscal year 2010 federal homeland security funding will be used to distribute more radios, including a second round of radios for colleges and universities to further enhance campus security.
• Enhance environmental testing around the six nuclear power plants in Illinois. IEMA will continue the GDN upgrade project that began in fiscal year 2009.
• Provide NOAA weather radios. In 2009 IEMA
will continue to provide weather radios to counties for placement in schools, hospitals, nursing homes, day care centers, mobile home parks and other strategic sites. These weather radios can provide timely, life-saving warnings about approaching dangerous weather and other emergencies in the area.
• Implement a new Disaster Planning Cell. This
new unit will be co-led by IEMA and the Illinois National Guard and will include full-time representatives from Illinois State Police, the Illinois Department of Transportation and the Illinois Department of Public Health. The planning cell will develop tactical Incident Action Plans and checklists for all catastrophic disaster scenarios for which Illinois is at risk.
• Improve local emergency response
capabilities. IEMA will offer almost $4 million in grants from federal homeland security funds for technological upgrades to county Emergency Operations Centers.
• Continue comprehensive training for local
first responders. In addition to several existing programs, IEMA will implement a new program to train campus safety assessment teams to assist colleges and universities with developing their campus safety plans.
• Enhance emergency communications. Using
federal homeland security funds, the agency will open up a data and information pipeline for state and local responders, enabling them to transmit streaming video from security cameras, digital photos, maps and other critical information.
PROGRAMS Operations IEMA Operations Bureau programs help to strengthen Illinois emergency management and homeland security preparedness efforts. Operations programs ensure that an integrated and coordinated tiered response mechanism (consisting of federal, state and local first responders, organizations and agencies) shares critical information and is prepared to respond to all hazards and any disaster that may
8 - 12

Illinois Emergency Management Agency
www.state.il.us/iema 2200 South Dirksen Parkway
Springfield, IL 62703 217.782.2700
occur. Operations programming aids in the operation of the SEOC 24-hour emergency communications center, the emergency alert system and the terrorism homeland security advisory system, as well as provides first responder training and disaster exercises. Disaster Assistance and Preparedness Disaster Assistance and Preparedness (DAP) programs assist individuals, state agencies and local governments with hazard mitigation, emergency response, and disaster recovery. The DAP Bureau administers state and federal grants to local governments statewide to enhance local emergency management operations. Federal disaster assistance grants are also administered by the DAP Bureau to help individuals and communities quickly recover from major disasters. DAP staff coordinates planning, training and exercising to ensure the ability of state and local officials to manage a nuclear power station accident. The bureau also implements programs that reduce the impact of future disasters on people and property as well as administer hazard mitigation grants to local governments. Management and Administrative Support IEMA is the lead agency responsible for all aspects of the state of Illinois' emergency management program and disaster response. Administrative program staff maintains the SEOC in a constant state of readiness so that the leaders of state government and first responders can operate in a coordinated and strategic manner. The SEOC serves as the state disaster communications and warning center for the six operating nuclear power stations, the emergency alert system and the terrorism homeland security advisory system. The ITTF serves as an advisory body to the governor and provides statutory recommendations and guidance on homeland security laws, policies, protocol and procedures. The ITTF also serves as the state homeland security strategic planning and policy body for the U.S. Department of Homeland Security grant programs. Administrative support to the ITTF is provided through IEMA. The task force represents more than 70 agencies, including federal, state, local, private sector and nongovernmental organizations.
Nuclear Facility Safety Nuclear Facility Safety (NFS) programs help to maintain safety and improve safeguards at nuclear stations licensed to generate electricity in Illinois. NFS programs reduce radiological hazards and risks to the public posed by the design, construction, installation, use, operation, modification and decommissioning of the 11 operating nuclear power reactors at six nuclear stations in Illinois, as well as two spent fuel pool facilities and dry cask spent fuel storage facilities. NFS program staff also helps to design and build equipment to monitor nuclear facility critical safety functions and maintains the country’s most comprehensive monitoring system for nuclear power reactors. Radiation Safety The Bureau of Radiation Safety programs increase public health and safety by licensing and inspecting more than 740 radioactive materials licensees and registering and inspecting over 32,500 radiation machines in 11,000 facilities. It also accredits more than 13,700 medical radiation technologists and certifies over 1,000 industrial radiographers. The bureau also inspects and certifies approximately 370 mammography facilities in the state to ensure the early and accurate diagnosis of breast cancer. The bureau's radon program provides radon information and assistance to citizens and administers a licensing program for radon measurement and mitigation contractors. Environmental Safety The Bureau of Environmental Safety (ES) programs ensure public health and safety by minimizing hazards posed by the presence of ionizing radiation in the environment. ES monitors environmental radiation at nuclear power stations, nuclear waste sites and other major nuclear facilities. The bureau’s Radiochemistry Laboratory analyzes over 4,000 environmental samples annually. The bureau coordinates and oversees proper cleanup of radioactive contamination, inspects and escorts spent nuclear fuel shipments and manages low-level radioactive waste produced in the state.
8 - 13
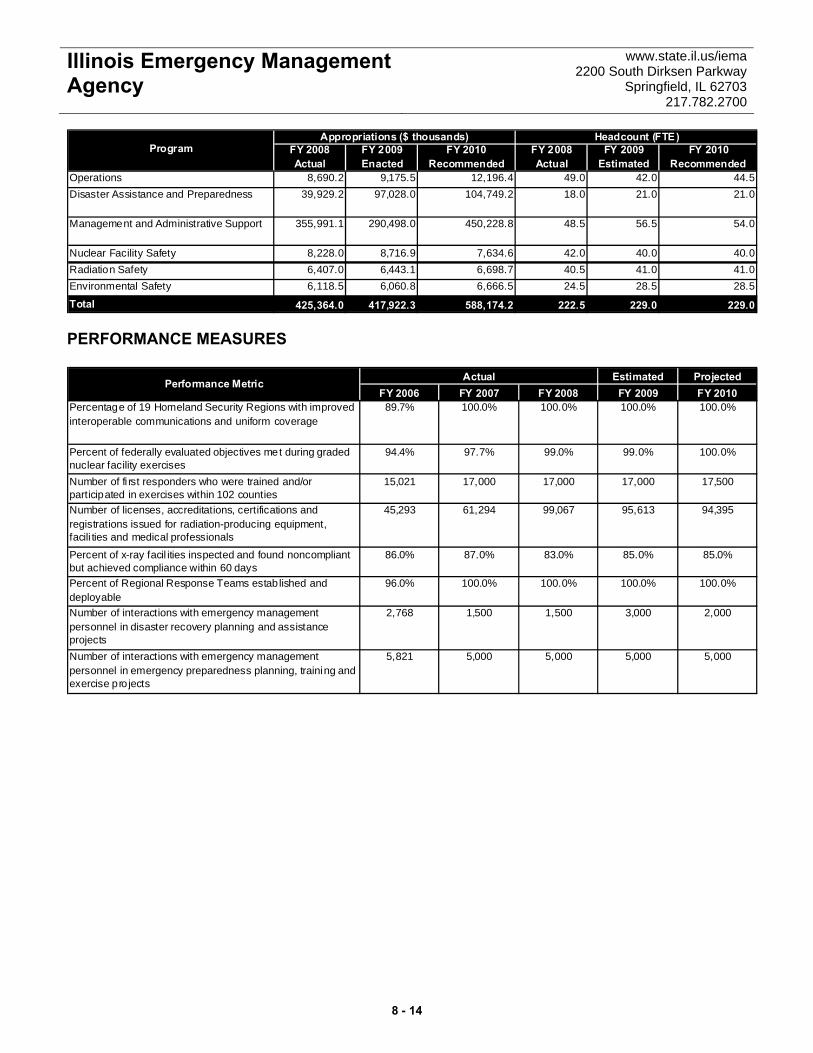
Illinois Emergency Management Agency
www.state.il.us/iema 2200 South Dirksen Parkway
Springfield, IL 62703 217.782.2700
Program FY 2008 FY 2009 FY 2010 FY 2008 FY 2009 FY 2010Actual Enacted Recommended Actual Estimated Recommended
Operations 8,690.2 9,175.5 12,196.4 49.0 42.0 44.5Disaster Assistance and Preparedness 39,929.2 97,028.0 104,749.2 18.0 21.0 21.0
Management and Administrative Support 355,991.1 290,498.0 450,228.8 48.5 56.5 54.0
Nuclear Facility Safety 8,228.0 8,716.9 7,634.6 42.0 40.0 40.0Radiation Safety 6,407.0 6,443.1 6,698.7 40.5 41.0 41.0Environmental Safety 6,118.5 6,060.8 6,666.5 24.5 28.5 28.5
Total 425,364.0 417,922.3 588,174.2 222.5 229.0 229.0
Appropriations ($ thousands) Headcount (FTE)
PERFORMANCE MEASURES
Estimated ProjectedFY 2006 FY 2007 FY 2008 FY 2009 FY 2010
Percentage of 19 Homeland Security Regions with improved interoperable communications and uniform coverage
89.7% 100.0% 100.0% 100.0% 100.0%
Percent of federally evaluated objectives met during graded nuclear facility exercises
94.4% 97.7% 99.0% 99.0% 100.0%
Number of fi rst responders who were trained and/or participated in exercises within 102 counties
15,021 17,000 17,000 17,000 17,500
Number of licenses, accreditations, certifications and registrations issued for radiation-producing equipment, facili ties and medical professionals
45,293 61,294 99,067 95,613 94,395
Percent of x-ray facil ities inspected and found noncompliant but achieved compliance within 60 days
86.0% 87.0% 83.0% 85.0% 85.0%
Percent of Regional Response Teams estab lished and deployable
96.0% 100.0% 100.0% 100.0% 100.0%
Number of interactions with emergency management personnel in disaster recovery planning and assistance projects
2,768 1,500 1,500 3,000 2,000
Number of interactions with emergency management personnel in emergency preparedness planning, training and exercise pro jects
5,821 5,000 5,000 5,000 5,000
ActualPerformance Metric
8 - 14

ActualExpenditure
EnactedAppropriation
EstimatedExpenditures
EnactedAppropriation
Fiscal Year2010
RecommendedAppropriation
Fiscal Year 2008 Fiscal Year 2009
Illinois Emergency ManagementAgency
www.state.il.us/iema2200 South Dirksen Parkway
Springfield, IL 62703217.782.2700
Appropriations Requiring General Assembly Action($ thousands)
GENERAL FUNDS
Total 2,437.8 2,525.02,316.42,329.02,215.5Personal Services and Fringe Benefits
Total 1,066.0 946.0987.11,021.3735.6Contractual Services
Total 453.0 422.3393.1401.1370.4Other Operations and Refunds
Designated Purposes15,500.0 485.010,500.010,500.05,204.8For the State Share of Public Disaster Relief for Costs in
Current and Prior Years207.0 98.9126.8150.0197.9For Training and Education
0.0 121.3125.0125.00.0ILEAS/MABAS Administration Costs
369.6 0.0413.7426.5352.3For Costs Associated with the Shared Services Initiativeand Other Operational Expenses
Total 16,076.6 705.211,165.511,201.55,755.1Designated Purposes
Grants492.0 477.2300.0492.0374.7For Federal Disaster Assistance State Match-Current
and Prior Years' CostsTotal 492.0 477.2300.0492.0374.7Grants
TOTAL GENERAL FUNDS 20,525.4 5,075.715,162.115,444.99,451.3
OTHER STATE FUNDS
Total 18,126.6 17,468.518,335.118,028.616,682.3Personal Services and Fringe Benefits
Total 2,234.0 2,633.52,658.52,634.22,056.9Contractual Services
Total 3,467.0 3,553.73,363.33,566.03,104.3Other Operations and Refunds
Designated Purposes100.0 97.00.0100.00.0For Activities Related to Inspecting and Escorting
Shipments of Spent Nuclear Fuel, High-LevelRadioactive Waste, and Transuranic Waste
150.0 145.50.0150.03.2For Activities Resulting from the Illinois EmergencyPlanning and Community Right to Know Act
1,119.0 738.41,100.01,104.6970.8For Costs Associated with the Shared Services Initiativeand Other Operational Expenses
561.0 316.2533.6561.0101.5For Costs Related to the Environmental Cleanup of theOttawa Radiation Areas Superfund Project underCooperative Agreements with the Federal Government
150.0 373.5145.5150.032.9For Expenses Related to Local Responder Training,Demonstrations, Research, Studies, and InvestigationsUnder Funding Agreements with the FederalGovernment
1,060.0 1,350.51,038.81,060.01,032.1For Licensing, Regulating, and Monitoring Facilitieswhere Radioactive Uranium and Thorium Mill Tailingsare Generated (Kerr McGee)
150.0 145.5145.5150.02.9For Recovery and Remediation
190.0 215.0208.6215.0141.6For the Care, Maintenance, Monitoring, Testing,Remediation, and Insurance of the Low-LevelRadioactive Waste Disposal Site Near Sheffield, Illinois
100.0 97.097.0100.075.9To Provide Grants to Victims of Terrorism or to LocalGovernments for Homeland Security Purposes
Total 3,580.0 3,478.53,268.93,590.62,360.9Designated Purposes
Grants100.0 89.389.3100.00.0For Reimbursement to Government Agencies for
Assistance in Radiological Emergencies
8 - 15
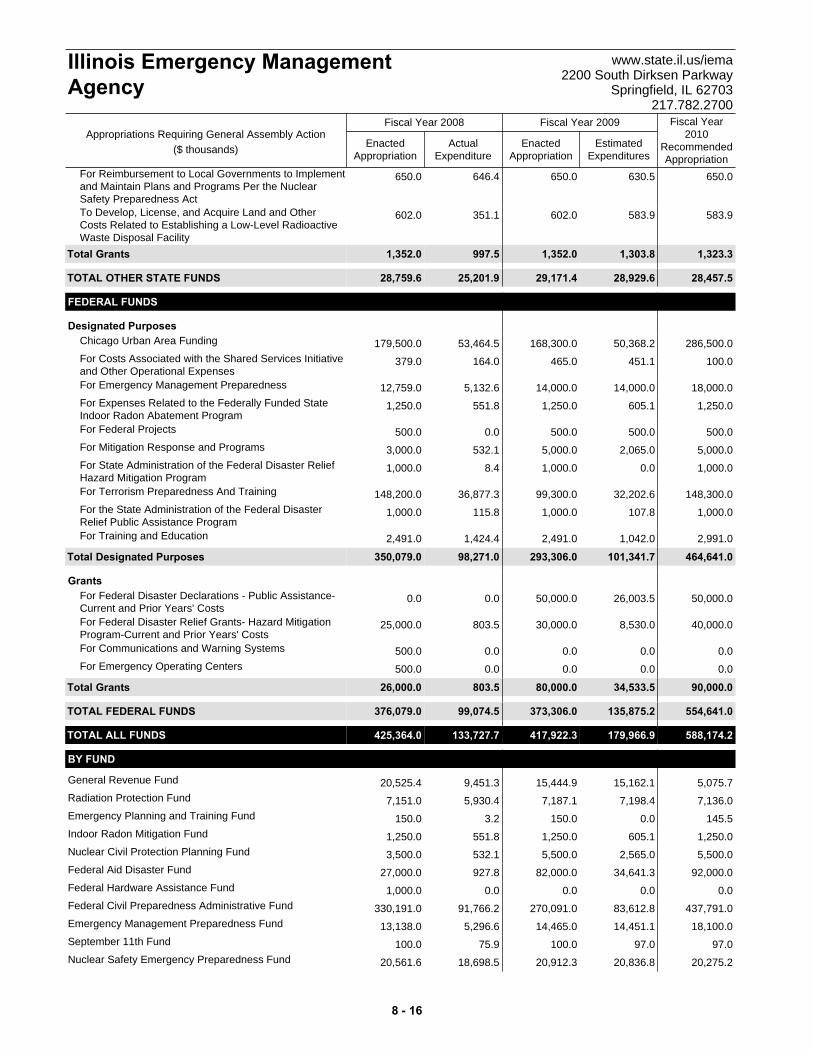
ActualExpenditure
EnactedAppropriation
EstimatedExpenditures
EnactedAppropriation
Fiscal Year2010
RecommendedAppropriation
Fiscal Year 2008 Fiscal Year 2009
Illinois Emergency ManagementAgency
www.state.il.us/iema2200 South Dirksen Parkway
Springfield, IL 62703217.782.2700
Appropriations Requiring General Assembly Action($ thousands)
650.0 650.0630.5650.0646.4For Reimbursement to Local Governments to Implementand Maintain Plans and Programs Per the NuclearSafety Preparedness Act
602.0 583.9583.9602.0351.1To Develop, License, and Acquire Land and OtherCosts Related to Establishing a Low-Level RadioactiveWaste Disposal Facility
Total 1,352.0 1,323.31,303.81,352.0997.5Grants
TOTAL OTHER STATE FUNDS 28,759.6 28,457.528,929.629,171.425,201.9
FEDERAL FUNDS
Designated Purposes179,500.0 286,500.050,368.2168,300.053,464.5Chicago Urban Area Funding
379.0 100.0451.1465.0164.0For Costs Associated with the Shared Services Initiativeand Other Operational Expenses
12,759.0 18,000.014,000.014,000.05,132.6For Emergency Management Preparedness
1,250.0 1,250.0605.11,250.0551.8For Expenses Related to the Federally Funded StateIndoor Radon Abatement Program
500.0 500.0500.0500.00.0For Federal Projects
3,000.0 5,000.02,065.05,000.0532.1For Mitigation Response and Programs
1,000.0 1,000.00.01,000.08.4For State Administration of the Federal Disaster ReliefHazard Mitigation Program
148,200.0 148,300.032,202.699,300.036,877.3For Terrorism Preparedness And Training
1,000.0 1,000.0107.81,000.0115.8For the State Administration of the Federal DisasterRelief Public Assistance Program
2,491.0 2,991.01,042.02,491.01,424.4For Training and Education
Total 350,079.0 464,641.0101,341.7293,306.098,271.0Designated Purposes
Grants0.0 50,000.026,003.550,000.00.0For Federal Disaster Declarations - Public Assistance-
Current and Prior Years' Costs25,000.0 40,000.08,530.030,000.0803.5For Federal Disaster Relief Grants- Hazard Mitigation
Program-Current and Prior Years' Costs500.0 0.00.00.00.0For Communications and Warning Systems
500.0 0.00.00.00.0For Emergency Operating Centers
Total 26,000.0 90,000.034,533.580,000.0803.5Grants
TOTAL FEDERAL FUNDS 376,079.0 554,641.0135,875.2373,306.099,074.5
TOTAL ALL FUNDS 425,364.0 588,174.2179,966.9417,922.3133,727.7
BY FUND
20,525.4 5,075.715,162.115,444.99,451.3General Revenue Fund
7,151.0 7,136.07,198.47,187.15,930.4Radiation Protection Fund
150.0 145.50.0150.03.2Emergency Planning and Training Fund
1,250.0 1,250.0605.11,250.0551.8Indoor Radon Mitigation Fund
3,500.0 5,500.02,565.05,500.0532.1Nuclear Civil Protection Planning Fund
27,000.0 92,000.034,641.382,000.0927.8Federal Aid Disaster Fund
1,000.0 0.00.00.00.0Federal Hardware Assistance Fund
330,191.0 437,791.083,612.8270,091.091,766.2Federal Civil Preparedness Administrative Fund
13,138.0 18,100.014,451.114,465.05,296.6Emergency Management Preparedness Fund
100.0 97.097.0100.075.9September 11th Fund
20,561.6 20,275.220,836.820,912.318,698.5Nuclear Safety Emergency Preparedness Fund
8 - 16
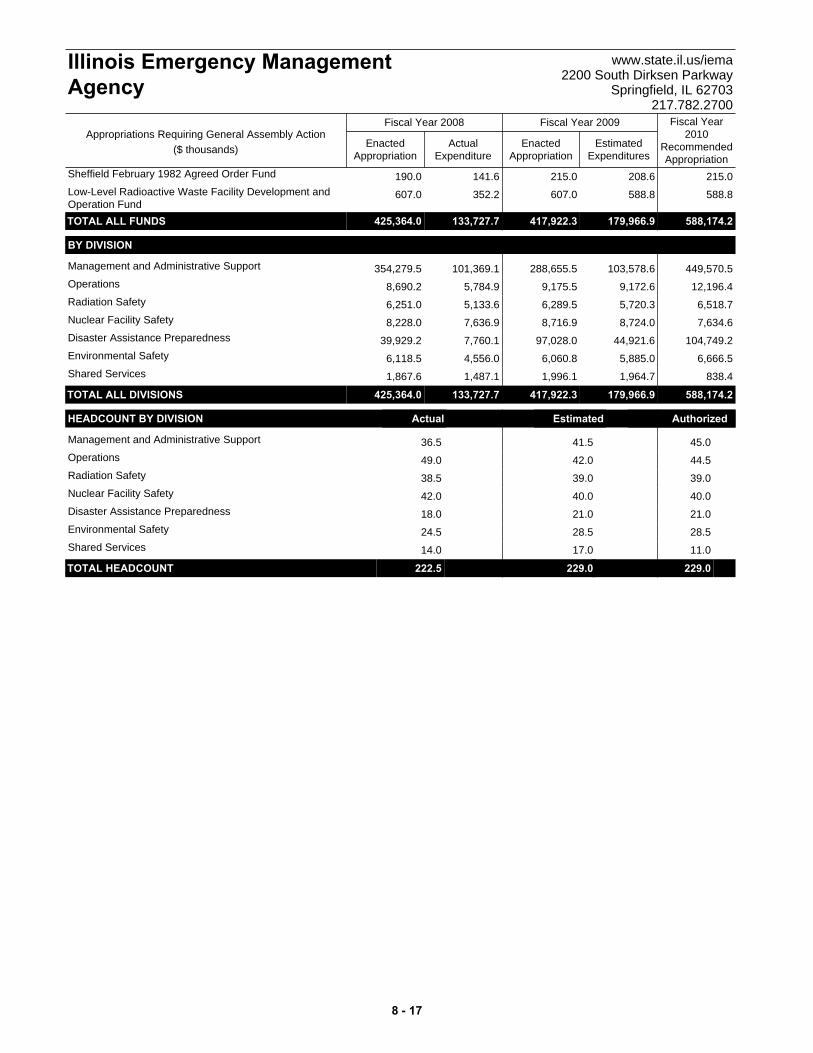
ActualExpenditure
EnactedAppropriation
EstimatedExpenditures
EnactedAppropriation
Fiscal Year2010
RecommendedAppropriation
Fiscal Year 2008 Fiscal Year 2009
Illinois Emergency ManagementAgency
www.state.il.us/iema2200 South Dirksen Parkway
Springfield, IL 62703217.782.2700
Appropriations Requiring General Assembly Action($ thousands)
190.0 215.0208.6215.0141.6Sheffield February 1982 Agreed Order Fund
607.0 588.8588.8607.0352.2Low-Level Radioactive Waste Facility Development andOperation FundTOTAL ALL FUNDS 425,364.0 588,174.2179,966.9417,922.3133,727.7
BY DIVISION
354,279.5 449,570.5103,578.6288,655.5101,369.1Management and Administrative Support
8,690.2 12,196.49,172.69,175.55,784.9Operations
6,251.0 6,518.75,720.36,289.55,133.6Radiation Safety
8,228.0 7,634.68,724.08,716.97,636.9Nuclear Facility Safety
39,929.2 104,749.244,921.697,028.07,760.1Disaster Assistance Preparedness
6,118.5 6,666.55,885.06,060.84,556.0Environmental Safety
1,867.6 838.41,964.71,996.11,487.1Shared Services
TOTAL ALL DIVISIONS 425,364.0 588,174.2179,966.9417,922.3133,727.7
HEADCOUNT BY DIVISION Actual Estimated Authorized
36.5 45.041.5Management and Administrative Support
49.0 44.542.0Operations
38.5 39.039.0Radiation Safety
42.0 40.040.0Nuclear Facility Safety
18.0 21.021.0Disaster Assistance Preparedness
24.5 28.528.5Environmental Safety
14.0 11.017.0Shared Services
TOTAL HEADCOUNT 222.5 229.0229.0 t
8 - 17

Illinois Law Enforcement Training And Standards Board
www.ptb.state.il.us 600 South Second Street, Suite #300
Springfield, IL 62704 217.782.4540
OVERVIEW Agency Mission To provide standards and training that enhance law enforcement's ability to readily adapt to a rapidly changing society, and that contribute to public recognition of law enforcement as a profession. Strategic Priorities • Establish, evaluate, and improve selection and
training standards for employees of law enforcement agencies.
• Establish, evaluate, and improve curricula and required objectives for instructors and training academies.
Summary of Agency Operations The Law Enforcement Training and Standards Board promulgates standards for the selection and training of employees of law enforcement agencies both at the entry and advanced level. The board improves the quality of employee training and performance, provides financial aid, and through stakeholder assessment surveys, provides funding and support to address emerging needs. Agency Resources Employed
FY 2008 FY 2009 FY 2010Actual Enacted Recommended
General Funds 0.0 0.0 0.0Other State Funds 14,216.8 14,233.8 13,659.3
Federal Funds 0.0 0.0 0.0Total 14,216.8 14,233.8 13,659.3
Actual Estimated RecommendedHeadcount (FTE) 20.0 20.5 21.0
Appropriations ($ thousands)Fund Category
MAJOR ACCOMPLISHMENTS • Funded death investigation training for
coroners. The board completed the fourth full year of funding training for deputy coroners, homicide investigators and support personnel, including mandated basic training for coroners newly elected in November 2008.
• Completed the second year of funding for the Law Enforcement Camera Grant Program. The board received 1,206 camera grant requests from 219 agencies statewide.
• Created and implemented cost-saving
training curriculum. The Law Enforcement Training Standards Board provided cost-saving training curriculum for current county corrections officers hired as law enforcement officers.
KEY BUDGET INITIATIVES • Survey law enforcement and county
corrections agencies to collect information on perception of adequacy of current mandated training programs.
• Continue implementation of Electronic Data
Interchange to permit local law enforcement agencies to submit required information electronically, utilizing the State of Illinois Public Key Infrastructure.
PROGRAMS Administration and Training Regulation This program includes all board activities conducted to provide training opportunities and facilities for mandated training, and staff activities to ensure compliance with relevant statutes. This program also provides funding for mandated, in-service and optional training reimbursements or direct training provisions. Law Enforcement Intern Program The intern program provides qualified individuals with the opportunity to pay for their own training as a law enforcement officer prior to being hired by a law enforcement agency. This program saves the employing agency the time and expense of training the new employee, and makes the qualified individual more attractive to prospective employers. Death Investigation Training This program provides funding to train coroners, deputy coroners and other public safety personnel in homicide investigations. Activities include actual training to meet specific needs.
8 - 18
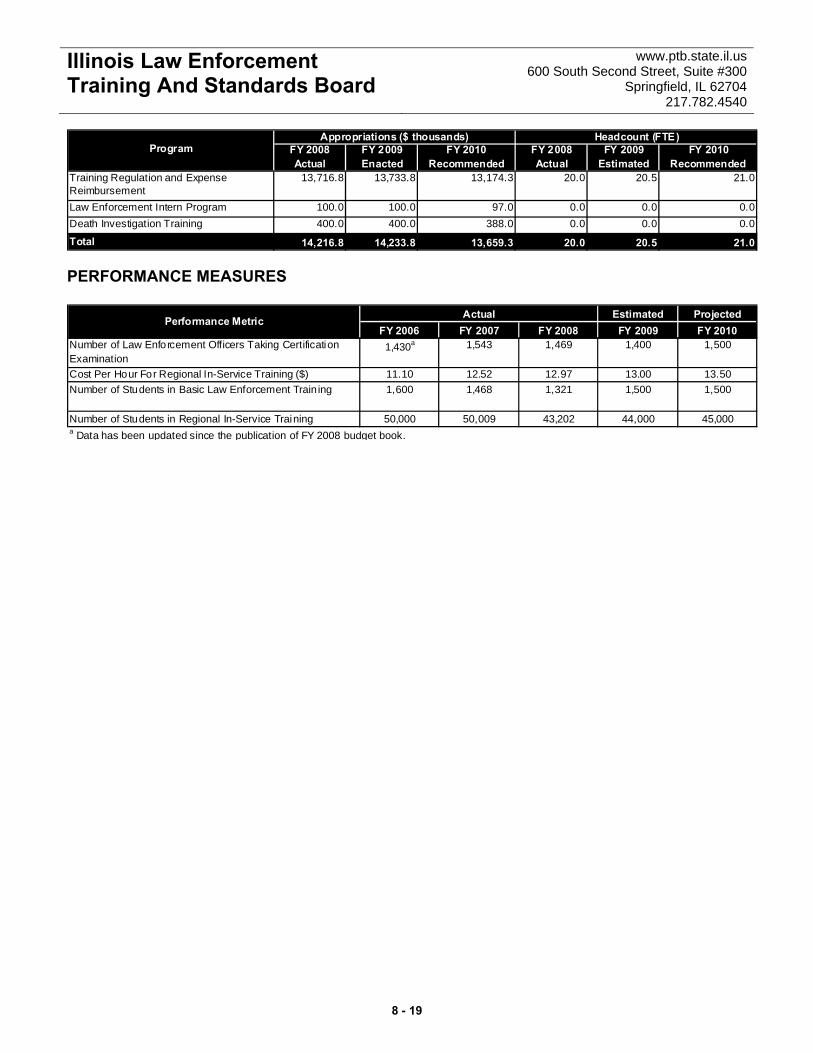
Illinois Law Enforcement Training And Standards Board
www.ptb.state.il.us 600 South Second Street, Suite #300
Springfield, IL 62704 217.782.4540
Program FY 2008 FY 2009 FY 2010 FY 2008 FY 2009 FY 2010Actual Enacted Recommended Actual Estimated Recommended
Training Regulation and Expense Reimbursement
13,716.8 13,733.8 13,174.3 20.0 20.5 21.0
Law Enforcement Intern Program 100.0 100.0 97.0 0.0 0.0 0.0Death Investigation Training 400.0 400.0 388.0 0.0 0.0 0.0
Total 14,216.8 14,233.8 13,659.3 20.0 20.5 21.0
Appropriations ($ thousands) Headcount (FTE)
PERFORMANCE MEASURES
Estimated ProjectedFY 2006 FY 2007 FY 2008 FY 2009 FY 2010
Number of Law Enforcement Officers Taking Certification Examination
1,430a 1,543 1,469 1,400 1,500
Cost Per Hour For Regional In-Service Training ($) 11.10 12.52 12.97 13.00 13.50Number of Students in Basic Law Enforcement Train ing 1,600 1,468 1,321 1,500 1,500
Number of Students in Regional In-Service Training 50,000 50,009 43,202 44,000 45,000
ActualPerformance Metric
a Data has been updated since the publication of FY 2008 budget book.
8 - 19

OTHER STATE FUNDS
Total 1,954.8 2,164.42,056.42,119.71,612.5Personal Services and Fringe Benefits
Total 307.5 325.5325.5325.5283.9Contractual Services
Total 212.7 194.7194.7194.7201.5Other Operations and Refunds
Designated Purposes100.0 97.097.0100.00.1Expenses Related To Intern Training Act, Including
Refunds10.0 5.00.010.00.0For the Administration of Public Act 93-0655
Investigations400.0 388.0388.0400.0400.0For Training of Death Investigation Personnel
Total 510.0 490.0485.0510.0400.1Designated Purposes
Grants100.0 97.097.0100.079.0Grants related to the Law Enforcement Camera Grant
Act11,131.8 10,387.710,648.210,983.911,108.7Training And Training Services
Total 11,231.8 10,484.710,745.211,083.911,187.7Grants
TOTAL OTHER STATE FUNDS 14,216.8 13,659.313,806.814,233.813,685.7
TOTAL ALL FUNDS 14,216.8 13,659.313,806.814,233.813,685.7
BY FUND
100.0 97.097.0100.079.0Law Enforcement Camera Grant Fund
100.0 97.097.0100.00.1Police Training Board Services Fund
400.0 388.0388.0400.0400.0Death Certificate Surcharge Fund
13,616.8 13,077.313,224.813,633.813,206.6Traffic and Criminal Conviction Surcharge Fund
TOTAL ALL FUNDS 14,216.8 13,659.313,806.814,233.813,685.7
BY DIVISION
14,216.8 13,659.313,806.814,233.813,685.7General Office
TOTAL ALL DIVISIONS 14,216.8 13,659.313,806.814,233.813,685.7
HEADCOUNT BY DIVISION Actual Estimated Authorized
20.0 21.020.5General Office
TOTAL HEADCOUNT 20.0 21.020.5 t
ActualExpenditure
EnactedAppropriation
EstimatedExpenditures
EnactedAppropriation
Fiscal Year2010
RecommendedAppropriation
Fiscal Year 2008 Fiscal Year 2009
Illinois Law EnforcementTraining And Standards Board
www.ptb.state.il.us600 South Second Street, Suite #300
Springfield, IL 62704217.782.4540
Appropriations Requiring General Assembly Action($ thousands)
8 - 20

Department Of Military Affairs www.il.ngb.army.mil 1301 North MacArthur Blvd
Springfield, IL 62702 217.761.3500
OVERVIEW Agency Mission To oversee and manage the daily operations of the Illinois National Guard (ILNG) and its related activities, and to function as the liaison between the federal and state government on all military affairs. To provide well-trained and well-equipped personnel and units that are continually ready to support national military strategy, state requirements and local community needs. Strategic Priorities • Provide well-trained, fully-equipped, joint war
fighting forces for use in national defense and state emergencies or defense.
• Maintain federal and state training facilities, armories and flying bases in a cost-effective manner.
• Maximize federal funds to support operations, training and homeland security functions.
• Support the families of service members and promote positive community relationships.
Summary of Agency Operations In addition to fulfilling the function described in its mission, the department also administers the Lincoln's ChalleNGe Academy, the Military Funeral Honors Program and the Illinois Military Family Relief Program. Agency Resources Employed
FY 2008 FY 2009 FY 2010Actual Enacted Recommended
General Funds 15,112.0 19,051.0 17,785.1Other State Funds 6,432.0 6,432.0 6,432.0
Federal Funds 27,297.6 27,150.6 27,959.0Total 48,841.6 52,633.6 52,176.1
Actual Estimated RecommendedHeadcount (FTE) 232.0 229.0 234.0
Appropriations ($ thousands)Fund Category
MAJOR ACCOMPLISHMENTS • Responded to Mississippi River flooding. The
ILNG responded to the Mississippi River flood by providing two standing Joint Task Forces (JTF), for the first time, for a single event. Over 1,700 National Guard soldiers and airmen mobilized to protect Illinois communities by supporting flood
response operations on a 200-mile stretch of the Mississippi River. The National Guard members provided much-needed equipment and manpower for the flood relief efforts.
• Mobilized soldiers in the largest federal
mobilization since World War II. The Army National Guard mobilized 3,400 soldiers, the majority of which belonged to the 33 Infantry Brigade Combat Team (IBCT). The 33 IBCT is the only National Guard Brigade Combat Team to depart a mobilization station above 110 percent strength. During this same period, the Air National Guard deployed over 800 members to various locations around the world.
• Continued Lincoln's ChalleNGe Academy.
Lincoln's ChalleNGe Academy (LCA) was one of the first ChalleNGe programs established in the United States. This program was established in 1993 by the Illinois National Guard in cooperation with the Department of Defense. It is located on the former Chanute Air Force Base in east central Illinois. During calendar year 2008, the program graduated over 650 students, with over 70 percent receiving the GED.
• Administered the Illinois Military Family Relief
Program. Over $1.5 million in grants has been processed since the beginning of fiscal year 2009 to over 3,100 eligible service members and families, increasing the total to nearly $8 million to over 14,000 eligible service members and families since the program's inception in fiscal year 2004.
• Participated in State Partnership for Peace
Program. The 183d Fighter Wing in Springfield deployed over 75 members to Poland for up to 120 days to assist the Polish Air Force with the acceptance of their F-16 jets and the setup of their maintenance shops. The agency continued to solidify a relationship with the Polish Armed Forces through numerous command visits by the adjutant general and other leaders. Army Guard members continue to deploy with and support Polish forces in both Afghanistan and Iraq.
KEY BUDGET INITIATIVE • Provide a well-trained, fully equipped guard.
The central priority of the agency is to continue to provide well-trained, fully equipped units and individuals as an integral part of the nation's
8 - 21
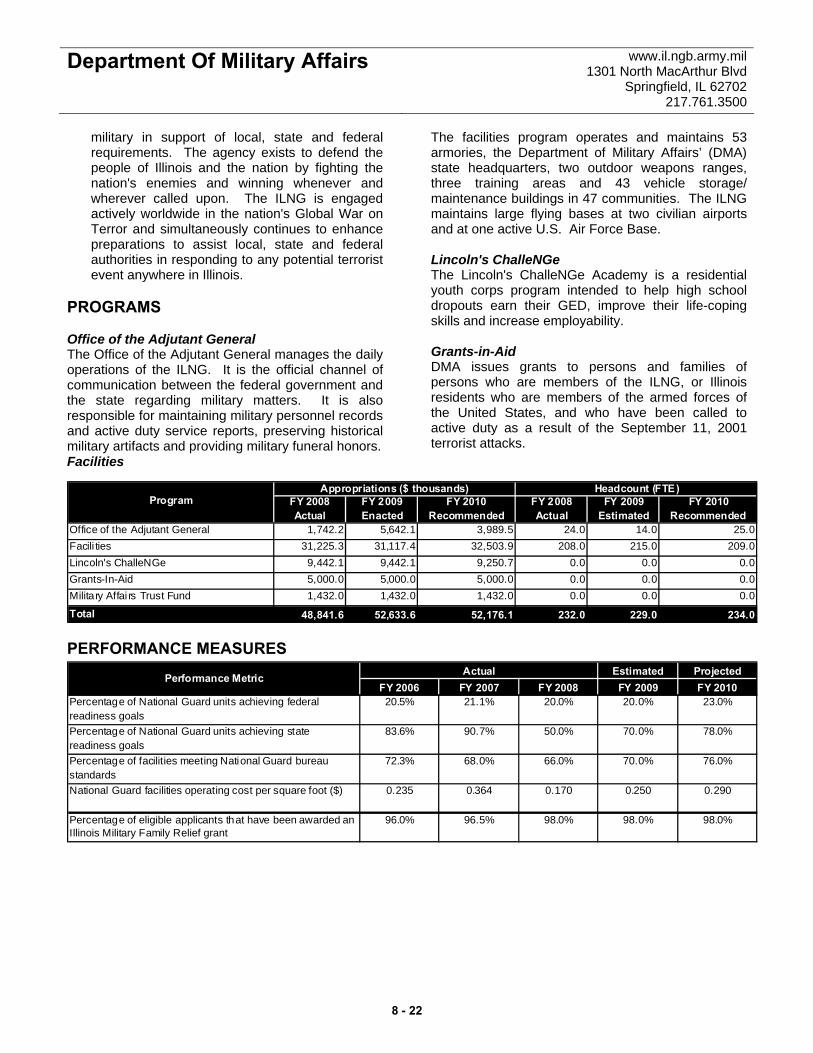
Department Of Military Affairs www.il.ngb.army.mil 1301 North MacArthur Blvd
Springfield, IL 62702 217.761.3500
military in support of local, state and federal requirements. The agency exists to defend the people of Illinois and the nation by fighting the nation's enemies and winning whenever and wherever called upon. The ILNG is engaged actively worldwide in the nation's Global War on Terror and simultaneously continues to enhance preparations to assist local, state and federal authorities in responding to any potential terrorist event anywhere in Illinois.
PROGRAMS Office of the Adjutant General The Office of the Adjutant General manages the daily operations of the ILNG. It is the official channel of communication between the federal government and the state regarding military matters. It is also responsible for maintaining military personnel records and active duty service reports, preserving historical military artifacts and providing military funeral honors. Facilities
The facilities program operates and maintains 53 armories, the Department of Military Affairs’ (DMA) state headquarters, two outdoor weapons ranges, three training areas and 43 vehicle storage/ maintenance buildings in 47 communities. The ILNG maintains large flying bases at two civilian airports and at one active U.S. Air Force Base. Lincoln's ChalleNGe The Lincoln's ChalleNGe Academy is a residential youth corps program intended to help high school dropouts earn their GED, improve their life-coping skills and increase employability. Grants-in-Aid DMA issues grants to persons and families of persons who are members of the ILNG, or Illinois residents who are members of the armed forces of the United States, and who have been called to active duty as a result of the September 11, 2001 terrorist attacks.
Program FY 2008 FY 2009 FY 2010 FY 2008 FY 2009 FY 2010Actual Enacted Recommended Actual Estimated Recommended
Office of the Adjutant General 1,742.2 5,642.1 3,989.5 24.0 14.0 25.0Facili ties 31,225.3 31,117.4 32,503.9 208.0 215.0 209.0Lincoln's ChalleNGe 9,442.1 9,442.1 9,250.7 0.0 0.0 0.0Grants-In-Aid 5,000.0 5,000.0 5,000.0 0.0 0.0 0.0Military Affai rs Trust Fund 1,432.0 1,432.0 1,432.0 0.0 0.0 0.0
Total 48,841.6 52,633.6 52,176.1 232.0 229.0 234.0
Appropriations ($ thousands) Headcount (FTE)
PERFORMANCE MEASURES Estimated Projected
FY 2006 FY 2007 FY 2008 FY 2009 FY 2010Percentage of National Guard units achieving federal readiness goals
20.5% 21.1% 20.0% 20.0% 23.0%
Percentage of National Guard units achieving state readiness goals
83.6% 90.7% 50.0% 70.0% 78.0%
Percentage of facilities meeting National Guard bureau standards
72.3% 68.0% 66.0% 70.0% 76.0%
National Guard facilities operating cost per square foot ($) 0.235 0.364 0.170 0.250 0.290
Percentage of eligible applicants that have been awarded an Illinois Military Family Relief grant
96.0% 96.5% 98.0% 98.0% 98.0%
ActualPerformance Metric
8 - 22

ActualExpenditure
EnactedAppropriation
EstimatedExpenditures
EnactedAppropriation
Fiscal Year2010
RecommendedAppropriation
Fiscal Year 2008 Fiscal Year 2009
Department Of Military Affairs www.il.ngb.army.mil1301 North MacArthur Blvd
Springfield, IL 62702217.761.3500
Appropriations Requiring General Assembly Action($ thousands)
GENERAL FUNDS
Total 8,284.9 7,927.58,231.58,499.07,387.4Personal Services and Fringe Benefits
Total 3,208.2 4,209.74,209.73,209.73,127.4Contractual Services
Total 215.4 228.8228.8228.8202.7Other Operations and Refunds
Designated Purposes7.4 7.47.47.47.1For Expenses Related to the Care and Preservation of
Historic Artifacts3,116.7 3,116.73,116.73,116.73,116.7For Lincoln's ChalleNGe
0.7 0.70.70.70.7For the State Officers' Candidate School0.0 2,250.03,640.43,753.00.0Transfer to the IL Military Family Relief Fund for Grants
to Persons or Families of Persons who are Members ofthe IL National Guard or IL Residents who are Membersof the Armed Forces
Total 3,124.8 5,374.86,765.26,877.83,124.5Designated Purposes
Grants235.7 44.344.3235.7235.0For Lincoln's ChalleNGe Allowances
Total 235.7 44.344.3235.7235.0Grants
Capital Improvements43.0 0.00.00.041.6Rehab and Minor Construction
Total 43.0 0.00.00.041.6Capital Improvements
TOTAL GENERAL FUNDS 15,112.0 17,785.119,479.519,051.014,118.6
OTHER STATE FUNDS
Designated Purposes1,432.0 1,432.01,432.01,432.0137.3For Support of Youth Programs
Total 1,432.0 1,432.01,432.01,432.0137.3Designated Purposes
Grants5,000.0 5,000.05,000.05,000.0993.5For Families of National Guard Members or Illinois
Residents Who Are Members of the US Armed Forces Total 5,000.0 5,000.05,000.05,000.0993.5Grants
TOTAL OTHER STATE FUNDS 6,432.0 6,432.06,432.06,432.01,130.8
FEDERAL FUNDS
Designated Purposes391.9 528.8415.0415.0370.9For Army National Guard Facilities Operations and
Maintenance at the Bartonville and Kankakee Armories9,316.0 9,840.59,145.99,145.97,102.7For Army/Air Reimbursable Positions
11,500.0 11,500.011,500.011,500.07,662.7For Expenses Related to Army National FacilitiesOperations and Maintenance
4,889.7 4,889.74,889.74,889.73,647.8For Lincoln's ChalleNGe
Total 26,097.6 26,759.025,950.625,950.618,784.1Designated Purposes
Grants1,200.0 1,200.01,200.01,200.0190.3For Lincoln's ChalleNGe Allowances
Total 1,200.0 1,200.01,200.01,200.0190.3Grants
TOTAL FEDERAL FUNDS 27,297.6 27,959.027,150.627,150.618,974.4
TOTAL ALL FUNDS 48,841.6 52,176.153,062.152,633.634,223.8
8 - 23

ActualExpenditure
EnactedAppropriation
EstimatedExpenditures
EnactedAppropriation
Fiscal Year2010
RecommendedAppropriation
Fiscal Year 2008 Fiscal Year 2009
Department Of Military Affairs www.il.ngb.army.mil1301 North MacArthur Blvd
Springfield, IL 62702217.761.3500
Appropriations Requiring General Assembly Action($ thousands)
BY FUND
15,112.0 17,785.119,479.519,051.014,118.6General Revenue Fund
1,432.0 1,432.01,432.01,432.0137.3Military Affairs Trust Fund
27,297.6 27,959.027,150.627,150.618,974.4Federal Support Agreement Revolving Fund
5,000.0 5,000.05,000.05,000.0993.5Illinois Military Family Relief Fund
TOTAL ALL FUNDS 48,841.6 52,176.153,062.152,633.634,223.8
BY DIVISION
17,616.3 19,672.221,147.921,516.29,898.8Office of the Adjutant General
31,225.3 32,503.931,914.231,117.424,325.0Facilities Operations
TOTAL ALL DIVISIONS 48,841.6 52,176.153,062.152,633.634,223.8
HEADCOUNT BY DIVISION Actual Estimated Authorized
18.0 25.014.0Office of the Adjutant General
208.0 209.0215.0Facilities Operations
6.0 0.00.0Shared Services
TOTAL HEADCOUNT 232.0 234.0229.0 t
8 - 24
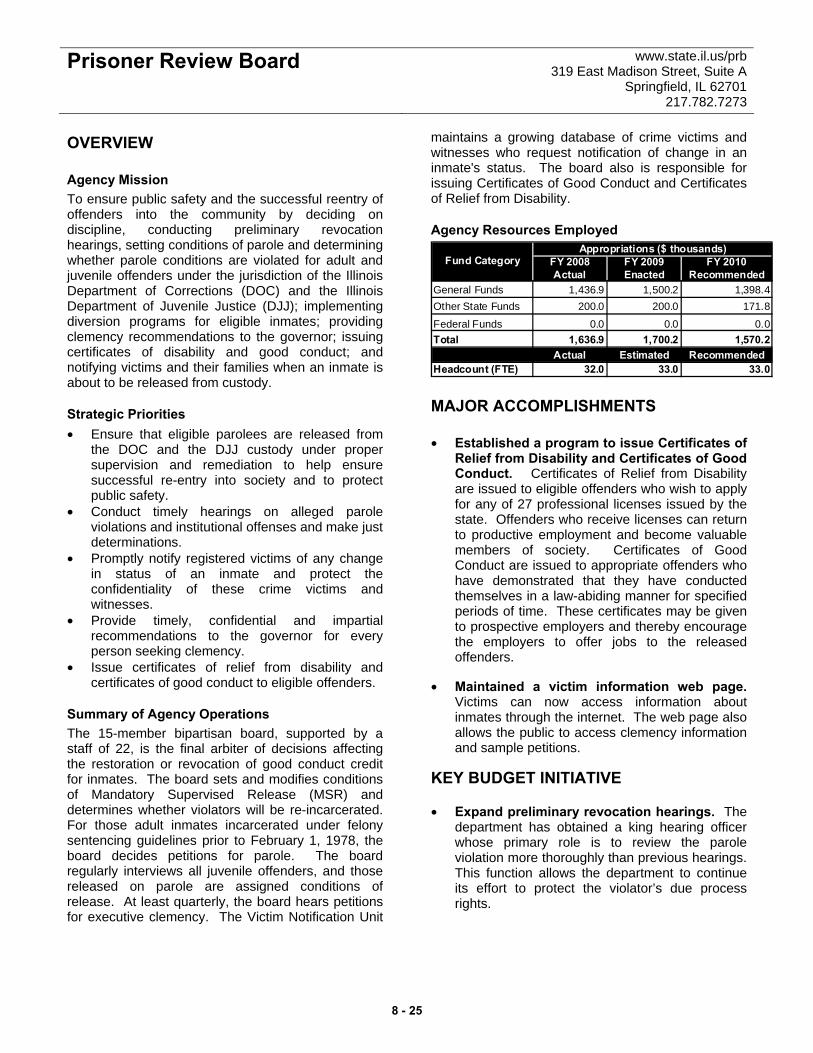
Prisoner Review Board www.state.il.us/prb 319 East Madison Street, Suite A
Springfield, IL 62701 217.782.7273
OVERVIEW
Agency Mission To ensure public safety and the successful reentry of offenders into the community by deciding on discipline, conducting preliminary revocation hearings, setting conditions of parole and determining whether parole conditions are violated for adult and juvenile offenders under the jurisdiction of the Illinois Department of Corrections (DOC) and the Illinois Department of Juvenile Justice (DJJ); implementing diversion programs for eligible inmates; providing clemency recommendations to the governor; issuing certificates of disability and good conduct; and notifying victims and their families when an inmate is about to be released from custody.
Strategic Priorities • Ensure that eligible parolees are released from
the DOC and the DJJ custody under proper supervision and remediation to help ensure successful re-entry into society and to protect public safety.
• Conduct timely hearings on alleged parole violations and institutional offenses and make just determinations.
• Promptly notify registered victims of any change in status of an inmate and protect the confidentiality of these crime victims and witnesses.
• Provide timely, confidential and impartial recommendations to the governor for every person seeking clemency.
• Issue certificates of relief from disability and certificates of good conduct to eligible offenders.
Summary of Agency Operations The 15-member bipartisan board, supported by a staff of 22, is the final arbiter of decisions affecting the restoration or revocation of good conduct credit for inmates. The board sets and modifies conditions of Mandatory Supervised Release (MSR) and determines whether violators will be re-incarcerated. For those adult inmates incarcerated under felony sentencing guidelines prior to February 1, 1978, the board decides petitions for parole. The board regularly interviews all juvenile offenders, and those released on parole are assigned conditions of release. At least quarterly, the board hears petitions for executive clemency. The Victim Notification Unit
maintains a growing database of crime victims and witnesses who request notification of change in an inmate's status. The board also is responsible for issuing Certificates of Good Conduct and Certificates of Relief from Disability.
Agency Resources Employed
FY 2008 FY 2009 FY 2010Actual Enacted Recommended
General Funds 1,436.9 1,500.2 1,398.4Other State Funds 200.0 200.0 171.8
Federal Funds 0.0 0.0 0.0Total 1,636.9 1,700.2 1,570.2
Actual Estimated RecommendedHeadcount (FTE) 32.0 33.0 33.0
Appropriations ($ thousands)Fund Category
MAJOR ACCOMPLISHMENTS • Established a program to issue Certificates of
Relief from Disability and Certificates of Good Conduct. Certificates of Relief from Disability are issued to eligible offenders who wish to apply for any of 27 professional licenses issued by the state. Offenders who receive licenses can return to productive employment and become valuable members of society. Certificates of Good Conduct are issued to appropriate offenders who have demonstrated that they have conducted themselves in a law-abiding manner for specified periods of time. These certificates may be given to prospective employers and thereby encourage the employers to offer jobs to the released offenders.
• Maintained a victim information web page. Victims can now access information about inmates through the internet. The web page also allows the public to access clemency information and sample petitions.
KEY BUDGET INITIATIVE • Expand preliminary revocation hearings. The
department has obtained a king hearing officer whose primary role is to review the parole violation more thoroughly than previous hearings. This function allows the department to continue its effort to protect the violator’s due process rights.
8 - 25
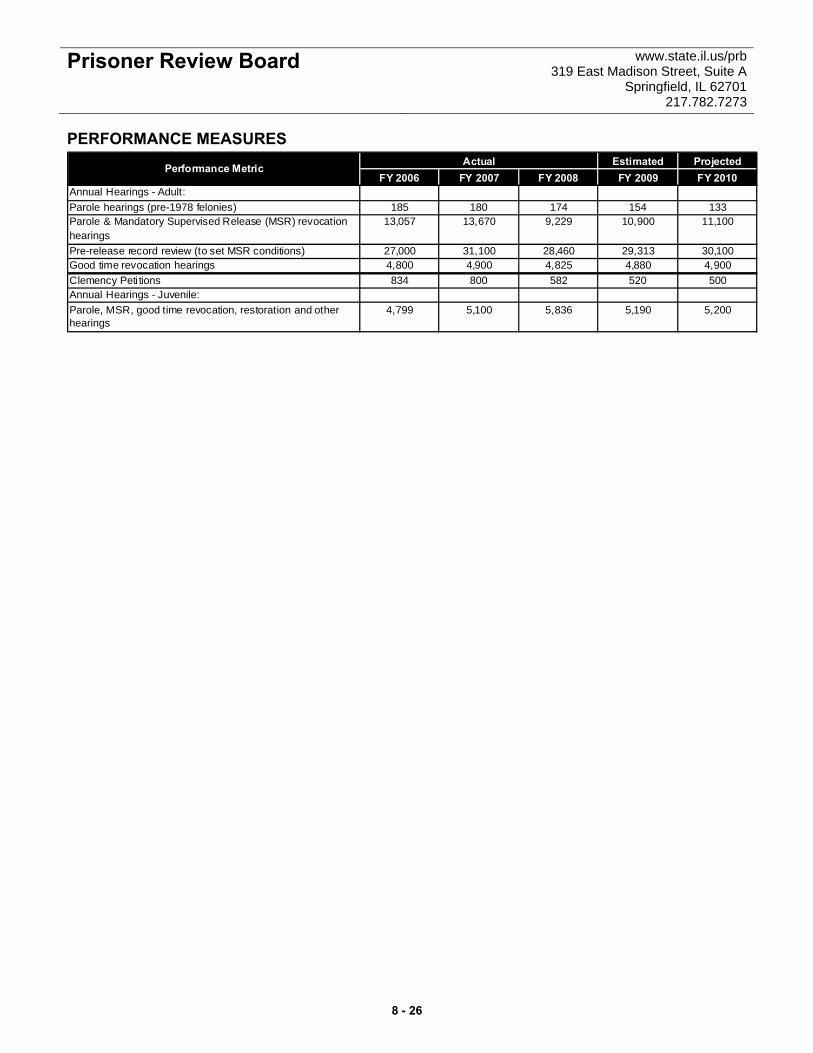
Prisoner Review Board www.state.il.us/prb 319 East Madison Street, Suite A
Springfield, IL 62701 217.782.7273
PERFORMANCE MEASURES Estimated Projected
FY 2006 FY 2007 FY 2008 FY 2009 FY 2010Annual Hearings - Adult:Parole hearings (pre-1978 felonies) 185 180 174 154 133Parole & Mandatory Supervised Release (MSR) revocation hearings
13,057 13,670 9,229 10,900 11,100
Pre-release record review (to set MSR conditions) 27,000 31,100 28,460 29,313 30,100Good time revocation hearings 4,800 4,900 4,825 4,880 4,900Clemency Peti tions 834 800 582 520 500Annual Hearings - Juvenile:Parole, MSR, good time revocation, restoration and other hearings
4,799 5,100 5,836 5,190 5,200
ActualPerformance Metric
8 - 26
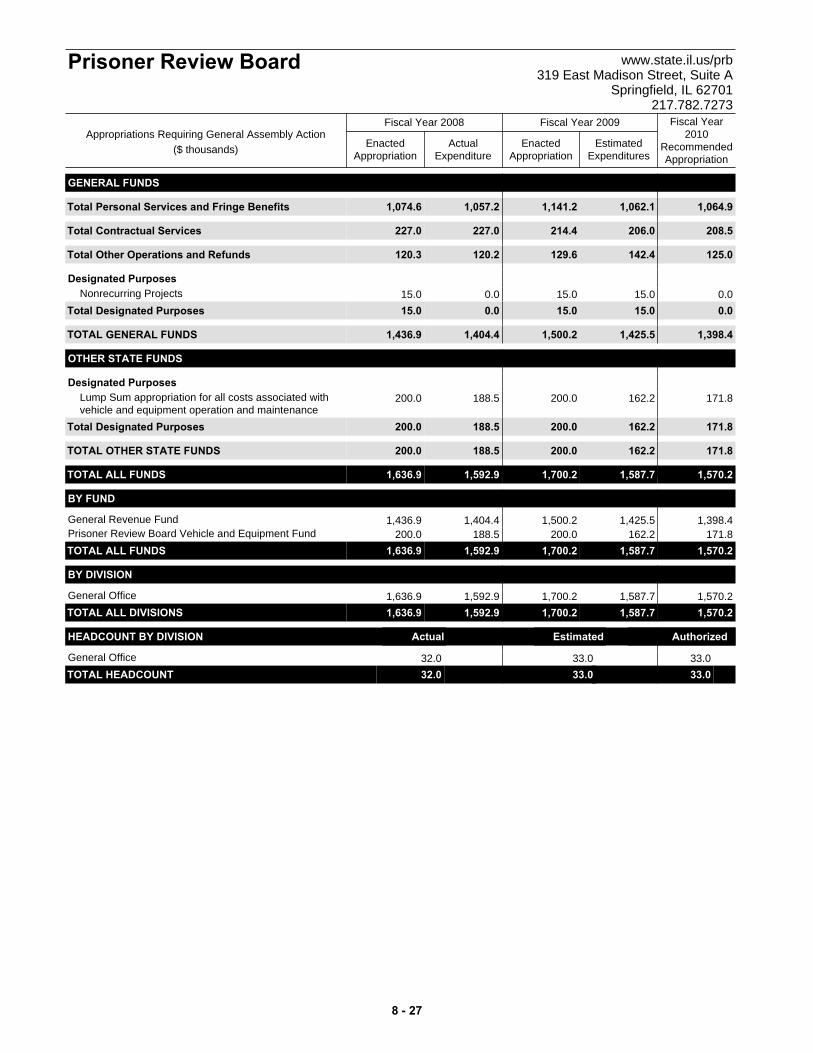
GENERAL FUNDS
Total 1,074.6 1,064.91,062.11,141.21,057.2Personal Services and Fringe Benefits
Total 227.0 208.5206.0214.4227.0Contractual Services
Total 120.3 125.0142.4129.6120.2Other Operations and Refunds
Designated Purposes15.0 0.015.015.00.0Nonrecurring Projects
Total 15.0 0.015.015.00.0Designated Purposes
TOTAL GENERAL FUNDS 1,436.9 1,398.41,425.51,500.21,404.4
OTHER STATE FUNDS
Designated Purposes200.0 171.8162.2200.0188.5Lump Sum appropriation for all costs associated with
vehicle and equipment operation and maintenanceTotal 200.0 171.8162.2200.0188.5Designated Purposes
TOTAL OTHER STATE FUNDS 200.0 171.8162.2200.0188.5
TOTAL ALL FUNDS 1,636.9 1,570.21,587.71,700.21,592.9
BY FUND
1,436.9 1,398.41,425.51,500.21,404.4General Revenue Fund200.0 171.8162.2200.0188.5Prisoner Review Board Vehicle and Equipment Fund
TOTAL ALL FUNDS 1,636.9 1,570.21,587.71,700.21,592.9
BY DIVISION
1,636.9 1,570.21,587.71,700.21,592.9General OfficeTOTAL ALL DIVISIONS 1,636.9 1,570.21,587.71,700.21,592.9
HEADCOUNT BY DIVISION Actual Estimated Authorized
32.0 33.033.0General OfficeTOTAL HEADCOUNT 32.0 33.033.0 t
ActualExpenditure
EnactedAppropriation
EstimatedExpenditures
EnactedAppropriation
Fiscal Year2010
RecommendedAppropriation
Fiscal Year 2008 Fiscal Year 2009
Prisoner Review Board www.state.il.us/prb319 East Madison Street, Suite A
Springfield, IL 62701217.782.7273
Appropriations Requiring General Assembly Action($ thousands)
8 - 27

Office Of The State Fire Marshal
www.state.il.us/osfm 1035 Stevenson Drive
Springfield, IL 62703 217.785.0969
OVERVIEW Agency Mission To reduce the risk of death, injury and property loss to Illinois citizens from fires, explosions and other hazards. Strategic Priorities • Provide financial support for firefighter training. • Promote community education programs that
enhance fire safety practices for Illinois citizens. • Increase and ensure public safety through
regulation and enforcement. • Improve firefighter protection equipment,
response vehicles and training to protect emergency responders.
Summary of Agency Operations The Office of the Illinois State Fire Marshal (OSFM) regulates and promotes public safety and security through investigation, inspection, licensing, certification, plan review, public education, curriculum standard-setting, incident response, and both technical and financial assistance. Agency Resources Employed
FY 2008 FY 2009 FY 2010Actual Enacted Recommended
General Funds 0.0 0.0 0.0Other State Funds 27,254.2 26,738.5 27,064.5
Federal Funds 257.7 400.0 700.0Total 27,511.9 27,138.5 27,764.5
Actual Estimated RecommendedHeadcount (FTE) 148.5 150.5 150.5
Appropriations ($ thousands)Fund Category
MAJOR ACCOMPLISHMENTS • Enhanced information technology. The
department developed and implemented an internet communications system for Illinois fire departments, which is used to send communications from OSFM, as well as provide them access to update their contact information personnel rosters, and complete requests for examinations and certifications.
• Developed and implemented computerized
reporting. OSFM developed and implemented computerized reporting of fire prevention
inspections and underground storage tank inspections.
• Provided citizen access via internet to
underground storage tanks information, leading to a reduction in Freedom of Information Act requests.
• Provided grants and loans. Last year, OSFM
disbursed $1 million in Small Equipment Grants to 54 fire departments and $1.9 million in zero-interest loans to fire departments for the purchase of fire engines/trucks, and funded the Ambulance Revolving Loan Program for the first time, offering $4 million in zero interest loans.
• Provided National Fire Incident Reporting
System (NFIRS) training. Training was provided to 297 departments on the proper reporting of fire incidents, and the agency distributed 291 computers in support of this program.
• Provided training. In conjunction with the
Illinois Fire Service Instructors Association, OSFM provided additional training to officers on proper record-keeping, Department of Labor mandates and training standards. To date, 387 training officers have taken this course. OSFM presented five classes, in conjunction with the Fire Chiefs Association, in various locations throughout the state to provide chief fire officers a better understanding of their duties and liabilities.
• Continued the Equipment Exchange Program.
Through the OSFM Fire Equipment Exchange Program, more than 500 pieces of fire equipment were available for donation to Illinois fire departments through the agency’s web site.
KEY BUDGET INITIATIVES • Improve information technology. The office
will continue to improve its information technology systems in order to meet contemporary standards in communication, operations, applications and record-keeping.
PROGRAMS Boiler and Pressure Vessel Safety The Division of Boiler Safety is responsible for regulating the safe and proper operation of 100,000 boilers and pressure vessels in the state (excluding Chicago).
8 - 28

Office Of The State Fire Marshal
www.state.il.us/osfm 1035 Stevenson Drive
Springfield, IL 62703 217.785.0969
Fire Prevention and Arson Investigation The Division of Fire Protection establishes and enforces the minimum fire prevention and safety standards in Illinois. The Division of Arson Investigation is responsible for investigating fires and explosions when requested by the fire service or local, state and federal law enforcement agencies. Petroleum and Chemical Safety The Division of Petroleum and Chemical Safety is responsible for regulating the safe and proper maintenance, storage, transportation, sale and use of gasoline and other volatile oils in the state.
General Services The Division of Technical Services provides engineering support to the department, primarily the divisions of Petroleum and Chemical Safety and Fire Prevention. Grants-in-Aid The agency administers several grant programs that address firefighter training expenses within municipalities and local governments. Additional grant programs subsidize storage tank regulation in Chicago, provide pass-through of arson fines to the local entity where the arson occurred, and provide fire-related equipment to needy communities.
Program FY 2008 FY 2009 FY 2010 FY 2008 FY 2009 FY 2010Actual Enacted Recommended Actual Estimated Recommended
Boiler and Pressure Vessel Safety 3,157.0 3,292.6 3,233.2 22.6 23.4 23.6Fire Prevention and Arson Investigation 9,401.3 9,174.0 8,947.0 56.5 57.4 56.9
Petroleum and Chemical Safety 3,799.6 3,646.7 3,811.9 28.0 28.0 28.0General Services 5,391.0 5,745.3 5,341.1 41.4 41.7 42.0Grants-in-Aid 5,763.2 5,279.8 6,431.3 0.0 0.0 0.0
Total 27,511.9 27,138.5 27,764.5 148.5 150.5 150.5
Appropriations ($ thousands) Headcount (FTE)
PERFORMANCE MEASURES Estimated Projected
FY 2006 FY 2007 FY 2008 FY 2009 FY 2010Average Number of Boiler and Pressure Vessel Inspections Per Inspector
1,400 1,294 1,280 1200 1280
Average Number of Fire Inspections Per Inspector 900 988 863 900 900Percent of Arson Investigation Requests Responded to Within Three Hours
73% 84% 82% 80% 82%
Percent of Fire Departments Reporting Through National Fire Incident Reporting System (NFIRS)
78%a 80% 85% 87% 91%
ActualPerformance Metric
a Estimated based on number of non-reporting entities to date; there may be a time lag in receipt of data.
8 - 29

ActualExpenditure
EnactedAppropriation
EstimatedExpenditures
EnactedAppropriation
Fiscal Year2010
RecommendedAppropriation
Fiscal Year 2008 Fiscal Year 2009
Office Of The State Fire Marshal www.state.il.us/osfm1035 Stevenson Drive
Springfield, IL 62703217.785.0969
Appropriations Requiring General Assembly Action($ thousands)
OTHER STATE FUNDS
Total 14,631.5 15,249.014,423.115,503.612,995.1Personal Services and Fringe Benefits
Total 1,300.9 1,354.41,254.41,254.41,097.9Contractual Services
Total 3,243.4 2,636.92,607.92,950.22,293.9Other Operations and Refunds
Designated Purposes1,000.0 475.0450.0450.0663.3Administrative Expenses of Elevator Safety Act
42.0 42.042.042.039.7Arson Seminars and Education80.0 80.080.080.080.0Expenses of Fire Prevention Awareness Program69.0 66.066.066.069.0Fire Prevention Training
185.0 185.0185.0185.095.9Firefighters' Memorial Located at the State Capitol627.9 780.9780.9780.9618.6For Costs Associated with the Shared Service Initiative
and Other Operational Expenses5.0 5.05.05.00.0Hazardous Material Emergency Response
Reimbursement20.0 20.020.020.020.0Life Safety Code Program
0.0 5.05.05.00.0Lump Sum for Safe Cigarette Act44.0 44.044.044.044.0New Fire Chiefs Training Program40.0 30.040.040.033.7Risk Watch/Remembering When Program75.0 0.075.075.075.0Hearing Officer Costs25.0 0.025.025.025.0Hearing Officers
Total 2,212.9 1,732.91,817.91,817.91,764.2Designated Purposes
Grants1,950.3 1,950.31,950.31,950.31,950.3Chicago Fire Department Training Program
25.0 15.015.015.03.0For Payment in Accordance with P.A. 93-01691.0 1.01.01.00.0Grants for Development of New Fire Districts
125.0 125.0125.0125.0125.0ILEAS/MABAS Administration Costs714.2 25.0203.2675.0590.7National Fire Incident Reporting System Information
Technology Enhancement (NITE) - Grants for DataCollection
1,000.0 950.0950.0950.01,000.0Payment to Local Government Agencies WhichParticipate in State Training Programs
500.0 475.0475.0475.0500.0Regional Training Grants0.0 2,000.00.00.00.0Small Equipment Grants
550.0 550.0522.5522.5550.0To Chicago for Administration Costs of the UndergroundStorage Tank Program
1,000.0 0.0498.5498.51,000.0Grants to Local Fire Districts - Needs Based GrantProgram
Total 5,865.5 6,091.34,740.55,212.35,719.0Grants
TOTAL OTHER STATE FUNDS 27,254.2 27,064.524,843.826,738.523,870.1
FEDERAL FUNDS
Designated Purposes257.7 700.0400.0400.0257.7Expenses of the United States Resource Conservation
Recovery Act Underground Storage Tank ProgramTotal 257.7 700.0400.0400.0257.7Designated Purposes
TOTAL FEDERAL FUNDS 257.7 700.0400.0400.0257.7
TOTAL ALL FUNDS 27,511.9 27,764.525,243.827,138.524,127.8
8 - 30
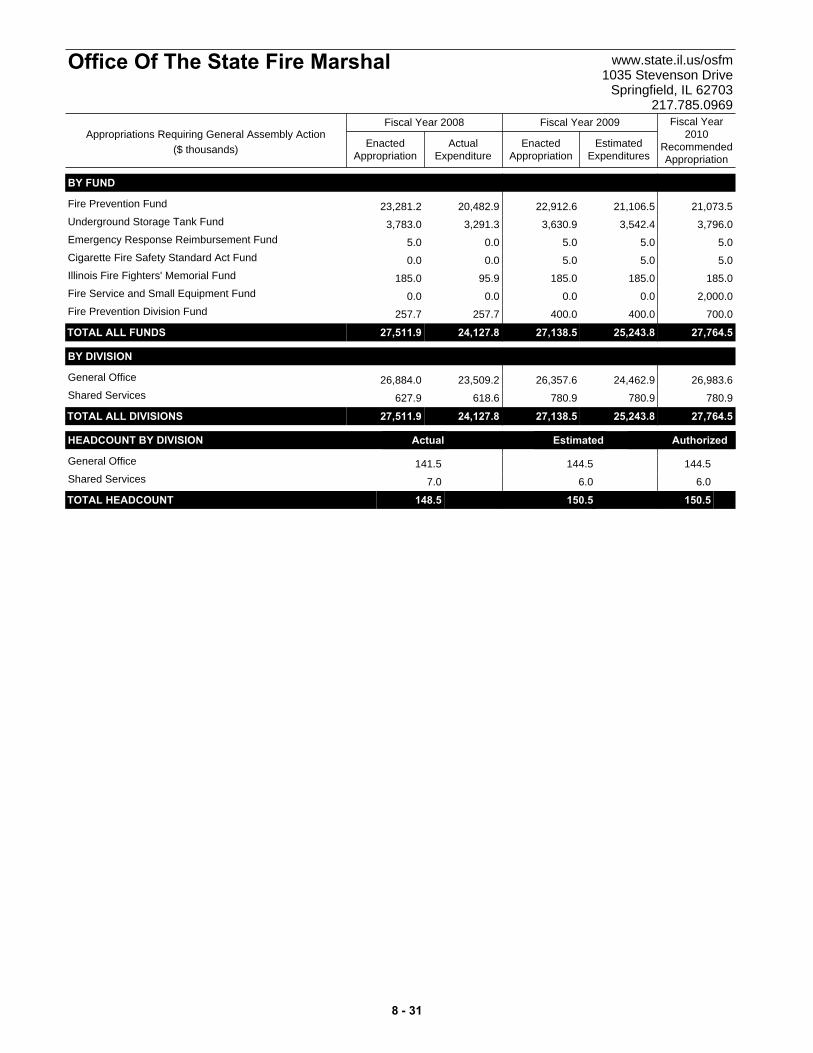
ActualExpenditure
EnactedAppropriation
EstimatedExpenditures
EnactedAppropriation
Fiscal Year2010
RecommendedAppropriation
Fiscal Year 2008 Fiscal Year 2009
Office Of The State Fire Marshal www.state.il.us/osfm1035 Stevenson Drive
Springfield, IL 62703217.785.0969
Appropriations Requiring General Assembly Action($ thousands)
BY FUND
23,281.2 21,073.521,106.522,912.620,482.9Fire Prevention Fund
3,783.0 3,796.03,542.43,630.93,291.3Underground Storage Tank Fund
5.0 5.05.05.00.0Emergency Response Reimbursement Fund
0.0 5.05.05.00.0Cigarette Fire Safety Standard Act Fund
185.0 185.0185.0185.095.9Illinois Fire Fighters' Memorial Fund
0.0 2,000.00.00.00.0Fire Service and Small Equipment Fund
257.7 700.0400.0400.0257.7Fire Prevention Division Fund
TOTAL ALL FUNDS 27,511.9 27,764.525,243.827,138.524,127.8
BY DIVISION
26,884.0 26,983.624,462.926,357.623,509.2General Office
627.9 780.9780.9780.9618.6Shared Services
TOTAL ALL DIVISIONS 27,511.9 27,764.525,243.827,138.524,127.8
HEADCOUNT BY DIVISION Actual Estimated Authorized
141.5 144.5144.5General Office
7.0 6.06.0Shared Services
TOTAL HEADCOUNT 148.5 150.5150.5 t
8 - 31

Department Of State Police www.isp.state.il.us 801 South Seventh Street; Suite 100-S
Springfield, IL 62794-9461 217.782.7263
OVERVIEW Agency Mission To promote public safety and improve the quality of life in Illinois. Strategic Priorities • Protect communities. • Enhance highway safety. • Support homeland security efforts. • Improve officer safety and information sharing. • Ensure integrity, accountability and efficiency. Summary of Agency Operations The Illinois State Police (ISP) promotes public safety to improve the quality of life in Illinois. ISP functions include protecting life and property, enforcing both criminal laws and motor vehicle safety laws, responding to emergencies and disasters, providing forensic services to local law enforcement statewide, and providing a myriad of diverse specialized services to both the public and the criminal justice communities. The department is organized into six major programs: Operations, Financial Fraud and Forgery, Forensic Services and Identification, Internal Investigation, Information Technology Command, and Administration. Agency Resources Employed
FY 2008 FY 2009 FY 2010Actual Enacted Recommended
General Funds 216,991.4 221,406.2 214,511.0Other State Funds 176,793.6 186,575.7 194,803.2
Federal Funds 22,900.0 20,000.0 40,000.0Total 416,685.0 427,981.9 449,314.2
Actual Estimated RecommendedHeadcount (FTE) 3,335.0 3,422.0 3,422.0
Appropriations ($ thousands)Fund Category
MAJOR ACCOMPLISHMENTS • Initiated police vehicle replacement. Senate
Bill 450, which was signed into law on December 15, 2008, provides additional funding for the replacement of the department’s aging police vehicles. This has been a collaborative effort with the General Assembly and the Governor’s Office, and will greatly increase state police officers’ safety.
• Solved crime through DNA analysis. The State Police is second in the nation in solving cases through the Combined DNA Index System (CODIS), producing 6,727 hits since the start of CODIS in Illinois. State law requires all convicted felons to submit a DNA sample, which is uploaded into the CODIS computer system.
• Implemented changes to the Firearm Owner’s
Identification Card (FOID) application process. In fiscal year 2008, legislation passed extending the FOID card expiration date from five years to 10 years. The fee increased from $5 to $10. The department implemented changes to automate and expedite the processing of applications with a focus towards reducing the backlog.
• Created Web site for cataloging and retrieving
school floor plans for emergency purposes. In 2008, the ISP created a Web site that allows each ISP district to catalog and retrieve floor plans for elementary and secondary schools residing in their jurisdiction. These floor plans will be used in the event of an unforeseen emergency. The program is over 80 percent populated. The goal for 2009 is to make this Web site more accessible to local police officers throughout the state.
KEY BUDGET INITIATIVES • Maintain front line service. The State Police is
planning to graduate 55 police officers in May 2009 and another 100 police officers in February 2010. These officers will enforce the traffic laws to ensure safety on Illinois highways, and investigate criminal activity including murders, drug crimes and fraud.
PROGRAMS Administration The Division of Administration is responsible for centralized supply, facility and fleet management resources. The division oversees the radio communications system accessed by police officers statewide, as well as manages the district call centers. The division is also responsible for training new state police cadets and provides training for local officers throughout Illinois.
8 - 32
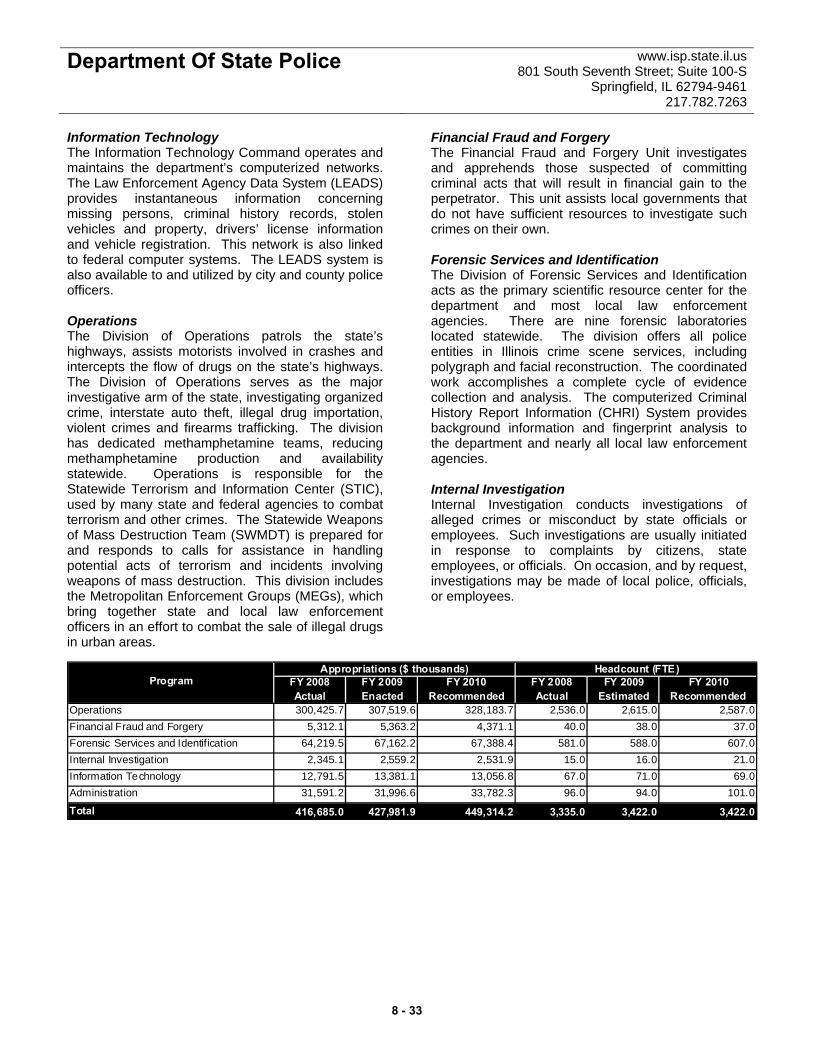
Department Of State Police www.isp.state.il.us 801 South Seventh Street; Suite 100-S
Springfield, IL 62794-9461 217.782.7263
Information Technology The Information Technology Command operates and maintains the department’s computerized networks. The Law Enforcement Agency Data System (LEADS) provides instantaneous information concerning missing persons, criminal history records, stolen vehicles and property, drivers’ license information and vehicle registration. This network is also linked to federal computer systems. The LEADS system is also available to and utilized by city and county police officers. Operations The Division of Operations patrols the state’s highways, assists motorists involved in crashes and intercepts the flow of drugs on the state’s highways. The Division of Operations serves as the major investigative arm of the state, investigating organized crime, interstate auto theft, illegal drug importation, violent crimes and firearms trafficking. The division has dedicated methamphetamine teams, reducing methamphetamine production and availability statewide. Operations is responsible for the Statewide Terrorism and Information Center (STIC), used by many state and federal agencies to combat terrorism and other crimes. The Statewide Weapons of Mass Destruction Team (SWMDT) is prepared for and responds to calls for assistance in handling potential acts of terrorism and incidents involving weapons of mass destruction. This division includes the Metropolitan Enforcement Groups (MEGs), which bring together state and local law enforcement officers in an effort to combat the sale of illegal drugs in urban areas.
Financial Fraud and Forgery The Financial Fraud and Forgery Unit investigates and apprehends those suspected of committing criminal acts that will result in financial gain to the perpetrator. This unit assists local governments that do not have sufficient resources to investigate such crimes on their own. Forensic Services and Identification The Division of Forensic Services and Identification acts as the primary scientific resource center for the department and most local law enforcement agencies. There are nine forensic laboratories located statewide. The division offers all police entities in Illinois crime scene services, including polygraph and facial reconstruction. The coordinated work accomplishes a complete cycle of evidence collection and analysis. The computerized Criminal History Report Information (CHRI) System provides background information and fingerprint analysis to the department and nearly all local law enforcement agencies. Internal Investigation Internal Investigation conducts investigations of alleged crimes or misconduct by state officials or employees. Such investigations are usually initiated in response to complaints by citizens, state employees, or officials. On occasion, and by request, investigations may be made of local police, officials, or employees.
Program FY 2008 FY 2009 FY 2010 FY 2008 FY 2009 FY 2010Actual Enacted Recommended Actual Estimated Recommended
Operations 300,425.7 307,519.6 328,183.7 2,536.0 2,615.0 2,587.0Financial Fraud and Forgery 5,312.1 5,363.2 4,371.1 40.0 38.0 37.0Forensic Services and Identification 64,219.5 67,162.2 67,388.4 581.0 588.0 607.0Internal Investigation 2,345.1 2,559.2 2,531.9 15.0 16.0 21.0Information Technology 12,791.5 13,381.1 13,056.8 67.0 71.0 69.0Administration 31,591.2 31,996.6 33,782.3 96.0 94.0 101.0
Total 416,685.0 427,981.9 449,314.2 3,335.0 3,422.0 3,422.0
Appropriations ($ thousands) Headcount (FTE)
8 - 33

Department Of State Police www.isp.state.il.us 801 South Seventh Street; Suite 100-S
Springfield, IL 62794-9461 217.782.7263
PERFORMANCE MEASURES
Estimated ProjectedFY 2006 FY 2007 FY 2008 FY 2009 FY 2010
DNA Case Backlog (Number of Cases, Not Including Offender Samples)
644 668 1,149a 400 400
Violent Crime Rate (Per 100,000 Population)b 561.6 547.1c 547.1 546.6 546.1Fatal Crash Rate on Interstates, U.S. Routes and State Highways (Per 100,000,000 Vehicle Miles Traveled)d
0.762 0.624 0.629 0.600 0.580
Percentage of Forensic Cases Worked Within 30 days 66.9% 65.7% 62.3% 62.0% 65.0%Alcohol-Related Fatal Crash Rate on Interstates, U.S. Routes and State Highways (Per 100,000,000 Vehicle Miles Traveled)e
0.238 0.211 0.175 0.169 0.165
Statewide Commercial Motor Vehicle Fatal Crash Rate (Per 100,000,000 Vehicle Miles Traveled)f
0.129 0.131 0.134 0.120 0.118
Statewide Teen Driver Caused Fatal Crash Rate (Per 100,000,000 Vehicle Miles Traveled)g
0.421 0.413 0.356 0.300 0.250
Statewide Percentage Observed Seat Belt Compliance 88.0% 90.1% 90.5% 90.0% 91.4%
Percentage of Convicted Sex Offenders in Compliance with Registration Requirements
92.8% 92.7% 92.5% 92.7% 92.9%
Percentage of Drug-Related Arrests that are ISP or ISP Assisted (Including Metropolitan Enforcement Groups and Task Forces)
55.5% 55.6% 57.9% 58.5% 60.0%
Percent of Law Enforcement Statewide Terrorism and Information Center Inquiries Handled within Twenty Minutes
93.0% 100% 100% 100% 100%
g Fatal crash rates for FY2006, FY2007, and FY2008 have been updated to reflect final crash data.
e Fatal crash rates for FY2006, FY2007, and FY2008 have been updated to reflect final crash data.f Fatal crash rates for FY2006, FY2007, and FY2008 have been updated to reflect final crash data.
ActualPerformance Metric
a Beginning with fiscal year 2008 data, the backlog figure includes both in-house and vendor backlogs.b Violent Crime Rate (VCR) as reported in the publication Crime in Illinois.c Calendar year 2008 VCR data will not be available until July 2009; therefore, 2008 is an estimate based on last known data.d Fatal crash rates for FY2006, FY2007, and FY2008 have been updated to reflect final crash data.
8 - 34
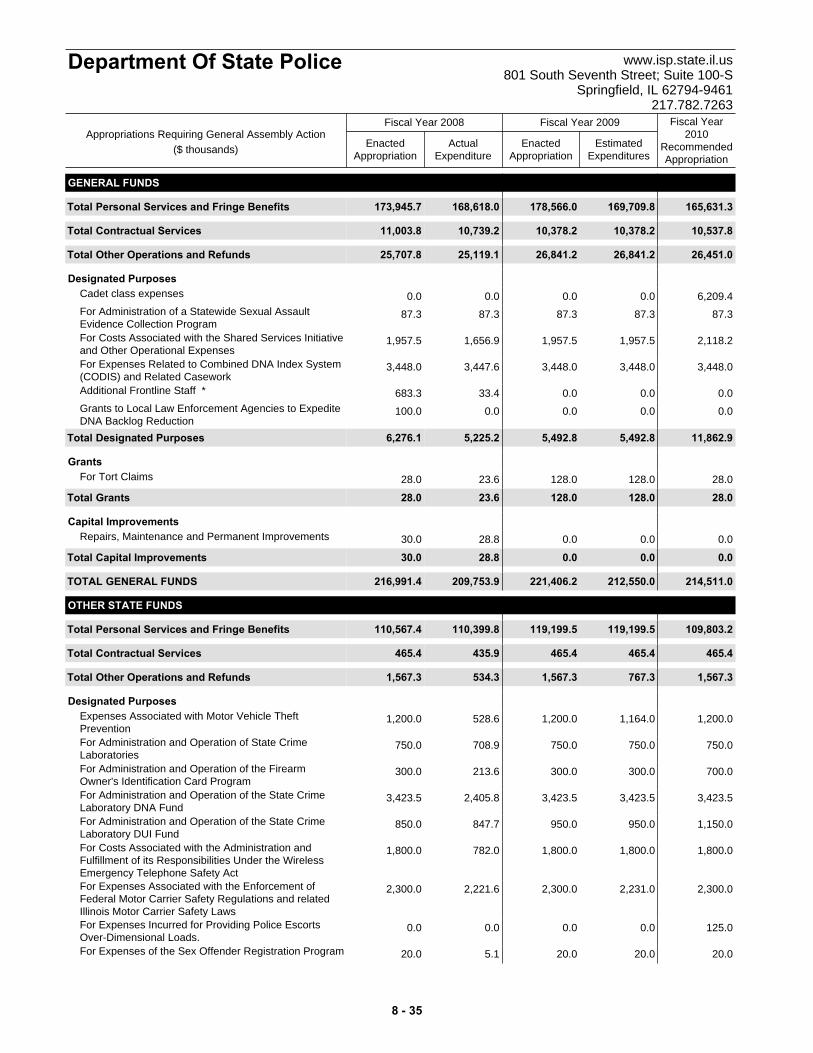
ActualExpenditure
EnactedAppropriation
EstimatedExpenditures
EnactedAppropriation
Fiscal Year2010
RecommendedAppropriation
Fiscal Year 2008 Fiscal Year 2009
Department Of State Police www.isp.state.il.us801 South Seventh Street; Suite 100-S
Springfield, IL 62794-9461217.782.7263
Appropriations Requiring General Assembly Action($ thousands)
GENERAL FUNDS
Total 173,945.7 165,631.3169,709.8178,566.0168,618.0Personal Services and Fringe Benefits
Total 11,003.8 10,537.810,378.210,378.210,739.2Contractual Services
Total 25,707.8 26,451.026,841.226,841.225,119.1Other Operations and Refunds
Designated Purposes0.0 6,209.40.00.00.0Cadet class expenses
87.3 87.387.387.387.3For Administration of a Statewide Sexual AssaultEvidence Collection Program
1,957.5 2,118.21,957.51,957.51,656.9For Costs Associated with the Shared Services Initiativeand Other Operational Expenses
3,448.0 3,448.03,448.03,448.03,447.6For Expenses Related to Combined DNA Index System(CODIS) and Related Casework
683.3 0.00.00.033.4Additional Frontline Staff *
100.0 0.00.00.00.0Grants to Local Law Enforcement Agencies to ExpediteDNA Backlog Reduction
Total 6,276.1 11,862.95,492.85,492.85,225.2Designated Purposes
Grants28.0 28.0128.0128.023.6For Tort Claims
Total 28.0 28.0128.0128.023.6Grants
Capital Improvements30.0 0.00.00.028.8Repairs, Maintenance and Permanent Improvements
Total 30.0 0.00.00.028.8Capital Improvements
TOTAL GENERAL FUNDS 216,991.4 214,511.0212,550.0221,406.2209,753.9
OTHER STATE FUNDS
Total 110,567.4 109,803.2119,199.5119,199.5110,399.8Personal Services and Fringe Benefits
Total 465.4 465.4465.4465.4435.9Contractual Services
Total 1,567.3 1,567.3767.31,567.3534.3Other Operations and Refunds
Designated Purposes1,200.0 1,200.01,164.01,200.0528.6Expenses Associated with Motor Vehicle Theft
Prevention750.0 750.0750.0750.0708.9For Administration and Operation of State Crime
Laboratories300.0 700.0300.0300.0213.6For Administration and Operation of the Firearm
Owner's Identification Card Program3,423.5 3,423.53,423.53,423.52,405.8For Administration and Operation of the State Crime
Laboratory DNA Fund850.0 1,150.0950.0950.0847.7For Administration and Operation of the State Crime
Laboratory DUI Fund1,800.0 1,800.01,800.01,800.0782.0For Costs Associated with the Administration and
Fulfillment of its Responsibilities Under the WirelessEmergency Telephone Safety Act
2,300.0 2,300.02,231.02,300.02,221.6For Expenses Associated with the Enforcement ofFederal Motor Carrier Safety Regulations and relatedIllinois Motor Carrier Safety Laws
0.0 125.00.00.00.0For Expenses Incurred for Providing Police EscortsOver-Dimensional Loads.
20.0 20.020.020.05.1For Expenses of the Sex Offender Registration Program
8 - 35

ActualExpenditure
EnactedAppropriation
EstimatedExpenditures
EnactedAppropriation
Fiscal Year2010
RecommendedAppropriation
Fiscal Year 2008 Fiscal Year 2009
Department Of State Police www.isp.state.il.us801 South Seventh Street; Suite 100-S
Springfield, IL 62794-9461217.782.7263
Appropriations Requiring General Assembly Action($ thousands)
1,750.0 17,148.82,250.02,250.01,566.3For Expenses Related to Law Enforcement
0.0 50.010.050.00.0For Expenses Related to Sex Offender Investigations
3,500.0 3,500.02,200.03,500.02,172.1For Expenses Related to the LEADS System
4,500.0 4,500.03,500.04,500.03,998.1For Payment of Expenditures as Outlined in the IllinoisDrug Asset Forfeiture Procedure Act, the CannabisControl Act, the Controlled Substances Act, andEnvironmental Safety Act
7,400.0 7,400.07,178.07,400.04,128.1For Payment of Expenses: Federal and IDOT Programs
19,000.0 19,000.018,430.019,000.011,953.7For Payment of Expenses: Fingerprint Program
4,300.0 4,300.04,171.04,300.02,635.7For Payment of Expenses: Miscellaneous Programs
1,200.0 1,200.01,164.01,200.0531.1For Payment of Expenses: Riverboat Gambling
10,000.0 12,000.03,400.010,000.01,053.1For Purchase of Vehicles and Accessories
250.0 250.0242.5250.05.3For the Detection, Investigation or Prosecution ofRecipient or Vendor Fraud
1,500.0 2,000.02,000.02,000.01,408.1Payment of expenditures in accordance with the FederalEquitable Sharing Guidelines
Total 64,043.5 82,817.355,184.065,193.537,164.9Designated Purposes
Grants150.0 150.0105.0150.0105.0Grants to Metropolitan Enforcement Groups
Total 150.0 150.0105.0150.0105.0Grants
TOTAL OTHER STATE FUNDS 176,793.6 194,803.2175,721.2186,575.7148,639.9
FEDERAL FUNDS
Designated Purposes0.0 20,000.00.00.00.0Federal Recovery - For Federally Funded Program
Expenses17,400.0 20,000.020,000.020,000.09,368.4For Federally Funded Program Expenses
5,500.0 0.00.00.00.0Terrorism Task Force Approved Purchases forHomeland Security
Total 22,900.0 40,000.020,000.020,000.09,368.4Designated Purposes
TOTAL FEDERAL FUNDS 22,900.0 40,000.020,000.020,000.09,368.4
TOTAL ALL FUNDS 416,685.0 449,314.2408,271.2427,981.9367,762.2
BY FUND
216,991.4 214,511.0212,550.0221,406.2209,753.9General Revenue Fund
106,085.7 105,584.5114,678.2114,678.2106,085.5Road Fund
300.0 700.0300.0300.0213.6Firearm Owner's Notification Fund
750.0 750.0750.0750.0708.9State Crime Laboratory Fund
850.0 1,150.0950.0950.0847.7State Police DUI Fund
250.0 250.0242.5250.05.3Medicaid Fraud and Abuse Prevention Fund
10,000.0 12,000.03,400.010,000.01,053.1State Police Vehicle Fund
1,000.0 1,000.0200.01,000.00.0State Police Vehicle Maintenance Fund
1,200.0 1,200.01,164.01,200.0528.6State Police Motor Vehicle Theft Prevention Trust Fund
0.0 50.010.050.00.0Sex Offender Investigation Fund
5,500.0 0.00.00.00.0Federal Civil Preparedness Administrative Fund
4,500.0 4,500.03,500.04,500.03,998.1State Asset Forfeiture Fund
1,500.0 2,000.02,000.02,000.01,408.1Federal Asset Forfeiture Fund
8 - 36

ActualExpenditure
EnactedAppropriation
EstimatedExpenditures
EnactedAppropriation
Fiscal Year2010
RecommendedAppropriation
Fiscal Year 2008 Fiscal Year 2009
Department Of State Police www.isp.state.il.us801 South Seventh Street; Suite 100-S
Springfield, IL 62794-9461217.782.7263
Appropriations Requiring General Assembly Action($ thousands)
20.0 20.020.020.05.1Sex Offender Registration Fund
3,500.0 3,500.02,200.03,500.02,172.1LEADS Maintenance Fund
3,423.5 3,423.53,423.53,423.52,405.8State Offender DNA Identification System Fund
1,800.0 1,800.01,800.01,800.0782.0State Police Wireless Service Emergency Fund
2,300.0 2,300.02,231.02,300.02,221.6Motor Carrier Safety Inspection Fund
0.0 125.00.00.00.0Over Dimensional Load Police Escort Fund
1,750.0 17,148.82,250.02,250.01,566.3State Police Whistleblower Reward and Protection Fund
150.0 150.0105.0150.0105.0Drug Traffic Prevention Fund
5,514.4 5,251.45,554.05,554.05,284.5Traffic and Criminal Conviction Surcharge Fund
17,400.0 40,000.020,000.020,000.09,368.4Illinois State Police Federal Projects Fund
31,900.0 31,900.030,943.031,900.019,248.6State Police Services Fund
TOTAL ALL FUNDS 416,685.0 449,314.2408,271.2427,981.9367,762.2
BY DIVISION
29,633.7 31,664.121,639.130,039.117,750.1Division Of Administration
12,791.5 13,056.811,931.113,381.111,266.9Bureau Of Information Services
300,425.7 328,183.7299,300.5307,519.6268,587.8Division Of Operations
5,312.1 4,371.14,546.25,363.24,697.3Financial Fraud And Forgery Unit
64,219.5 67,388.466,605.967,162.261,756.6Division Of Forensic Services And Identification
2,345.1 2,531.92,290.92,559.22,046.5Division Of Internal Investigation
1,957.5 2,118.21,957.51,957.51,656.9Shared Services
TOTAL ALL DIVISIONS 416,685.0 449,314.2408,271.2427,981.9367,762.2
HEADCOUNT BY DIVISION Actual Estimated Authorized
85.0 75.072.0Division Of Administration
67.0 69.071.0Bureau Of Information Services
2,536.0 2,587.02,615.0Division Of Operations
40.0 37.038.0Financial Fraud And Forgery Unit
581.0 607.0588.0Division Of Forensic Services And Identification
15.0 21.016.0Division Of Internal Investigation
11.0 26.022.0Shared Services
TOTAL HEADCOUNT 3,335.0 3,422.03,422.0 t
8 - 37
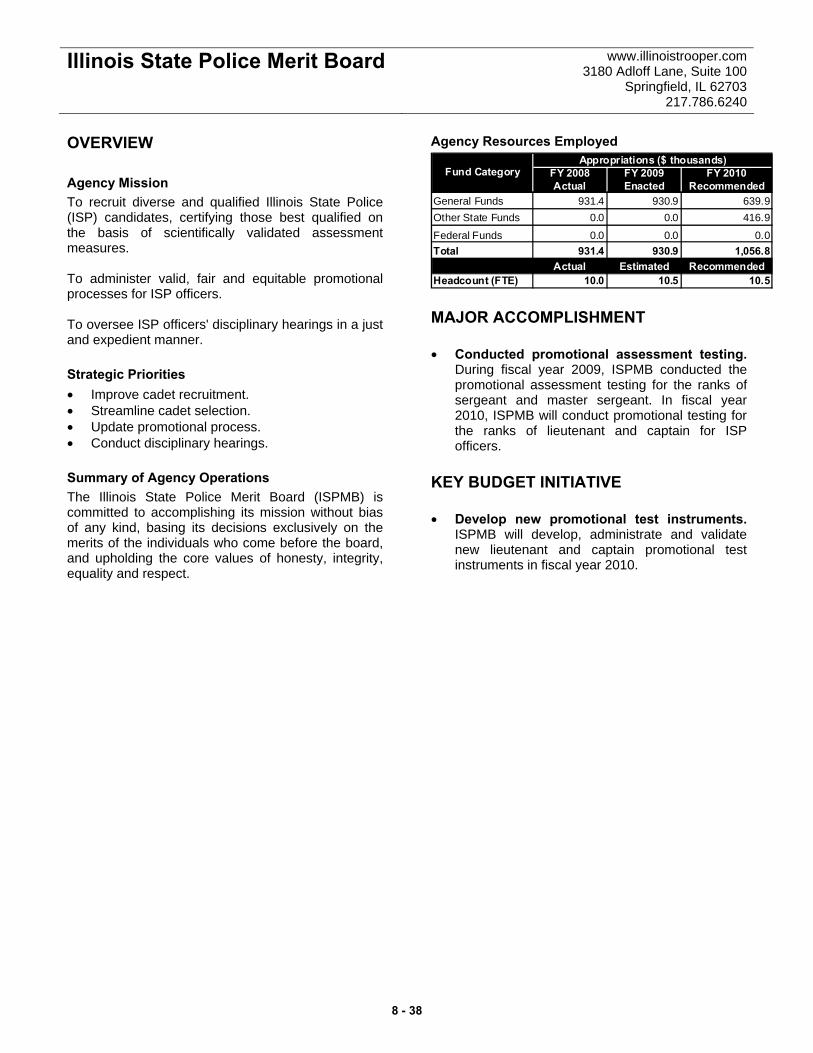
Illinois State Police Merit Board www.illinoistrooper.com 3180 Adloff Lane, Suite 100
Springfield, IL 62703 217.786.6240
OVERVIEW Agency Mission To recruit diverse and qualified Illinois State Police (ISP) candidates, certifying those best qualified on the basis of scientifically validated assessment measures. To administer valid, fair and equitable promotional processes for ISP officers. To oversee ISP officers' disciplinary hearings in a just and expedient manner. Strategic Priorities • Improve cadet recruitment. • Streamline cadet selection. • Update promotional process. • Conduct disciplinary hearings. Summary of Agency Operations The Illinois State Police Merit Board (ISPMB) is committed to accomplishing its mission without bias of any kind, basing its decisions exclusively on the merits of the individuals who come before the board, and upholding the core values of honesty, integrity, equality and respect.
Agency Resources Employed
FY 2008 FY 2009 FY 2010Actual Enacted Recommended
General Funds 931.4 930.9 639.9Other State Funds 0.0 0.0 416.9
Federal Funds 0.0 0.0 0.0Total 931.4 930.9 1,056.8
Actual Estimated RecommendedHeadcount (FTE) 10.0 10.5 10.5
Appropriations ($ thousands)Fund Category
MAJOR ACCOMPLISHMENT • Conducted promotional assessment testing.
During fiscal year 2009, ISPMB conducted the promotional assessment testing for the ranks of sergeant and master sergeant. In fiscal year 2010, ISPMB will conduct promotional testing for the ranks of lieutenant and captain for ISP officers.
KEY BUDGET INITIATIVE • Develop new promotional test instruments.
ISPMB will develop, administrate and validate new lieutenant and captain promotional test instruments in fiscal year 2010.
8 - 38

GENERAL FUNDS
Total 504.5 487.9497.5497.5504.5Personal Services and Fringe Benefits
Total 385.4 103.0379.4379.6385.3Contractual Services
Total 41.4 49.054.053.841.4Other Operations and Refunds
TOTAL GENERAL FUNDS 931.4 639.9930.9930.9931.3
OTHER STATE FUNDS
Total 0.0 416.90.00.00.0Contractual Services
TOTAL OTHER STATE FUNDS 0.0 416.90.00.00.0
TOTAL ALL FUNDS 931.4 1,056.8930.9930.9931.3
BY FUND
931.4 639.9930.9930.9931.3General Revenue Fund
0.0 416.90.00.00.0State Police Whistleblower Reward and Protection Fund
TOTAL ALL FUNDS 931.4 1,056.8930.9930.9931.3
BY DIVISION
931.4 1,056.8930.9930.9931.3General Office
TOTAL ALL DIVISIONS 931.4 1,056.8930.9930.9931.3
HEADCOUNT BY DIVISION Actual Estimated Authorized
10.0 10.510.5General Office
TOTAL HEADCOUNT 10.0 10.510.5 t
ActualExpenditure
EnactedAppropriation
EstimatedExpenditures
EnactedAppropriation
Fiscal Year2010
RecommendedAppropriation
Fiscal Year 2008 Fiscal Year 2009
Illinois State Police Merit Board www.illinoistrooper.com3180 Adloff Lane, Suite 100
Springfield, IL 62703217.786.6240
Appropriations Requiring General Assembly Action($ thousands)
8 - 39

8 - 40
ENVIRONMENT AND BUSINESS REGULATIONS
CODE DEPARTMENTS
Department of Financial and Professional RegulationDepartment of Human Rights
Department of InsuranceDepartment of Natural Resources
AGENCIES, COMMISSIONS AND BOARDS
Dry Cleaner Environmental Response Trust FundEnvironmental Protection Agency
Human Rights CommissionIllinois Commerce Commission
Illinois Workers’ Compensation Commission
www.state.il.us/budget
CHAPTER 9


Drycleaner Environmental Response Trust Fund Council
www.cleanupfund.org P.O. Box 7380
Bensenville, IL 60106 800.765.4041
OVERVIEW Agency Mission To assist Illinois drycleaner operators in the cleanup of soil and groundwater contamination caused by dry cleaning solvents. Strategic Priorities • Reduce and prevent pollution. • Operate as a communication and information
resource. • Maintain fund solvency. Summary of Agency Operations The Drycleaner Environmental Response Trust Fund Council manages the Drycleaner Environmental Response Trust Fund. Primary council responsibilities include: licensing retail drycleaners, providing environmental remediation liability insurance coverage, and assisting in the cleanup of soil and groundwater contaminated by dry cleaning solvents. Agency Resources Employed
FY 2008 FY 2009 FY 2010Actual Enacted Recommended
General Funds 0.0 0.0 0.0Other State Funds 6,860.0 6,860.0 5,360.0
Federal Funds 0.0 0.0 0.0Total 6,860.0 6,860.0 5,360.0
Actual Estimated RecommendedHeadcount (FTE) 0.0 0.0 0.0
Appropriations ($ thousands)Fund Category
MAJOR ACCOMPLISHMENTS • Oversaw contamination cleanup. Assisted in
the cleanup of soil and groundwater contamination at approximately 514 facilities.
• Assisted with compliance efforts. Assisted
208 drycleaners in attaining "No Further Remediation" letters from the Illinois Environmental Protection Agency, and assisted 100 drycleaners in determining their facilities were not contaminated.
• Functioned as an education outreach
resource. Inspected 61 dry cleaning facilities for compliance with pollution prevention requirements.
• Reduced pollution. Continued to enhance
pollution prevention education and compliance efforts.
• Provided license renewal services. Assisted
approximately 1,250 drycleaners with renewing their licenses.
• Provided insurance coverage assistance.
Assisted approximately 700 drycleaners with renewing their pollution liability insurance coverage.
KEY BUDGET INITIATIVES • Monitor fund solvency. Adjust license fees and
solvent taxes as necessary to ensure that adequate funding exists to carry out the council’s functions.
• Control Cleanup Costs. Require competitive
bidding of cleanup activities and evaluates new technologies.
PERFORMANCE MEASURES
Estimated ProjectedFY 2006 FY 2007 FY 2008 FY 2009 FY 2010
Eligible claims closed 88 151 254 300 325Insurance policies issued 784 712 674 650 600Licenses issued 1288 1239 1197 1250 1250New claims filed 96 170 203 0 0
ActualPerformance Metric
9 - 1

OTHER STATE FUNDS
Designated Purposes6,860.0 5,360.06,860.06,860.03,565.6Operations
Total 6,860.0 5,360.06,860.06,860.03,565.6Designated Purposes
TOTAL OTHER STATE FUNDS 6,860.0 5,360.06,860.06,860.03,565.6
TOTAL ALL FUNDS 6,860.0 5,360.06,860.06,860.03,565.6
BY FUND
6,860.0 5,360.06,860.06,860.03,565.6Drycleaner Environmental Response Trust Fund
TOTAL ALL FUNDS 6,860.0 5,360.06,860.06,860.03,565.6
BY DIVISION
6,860.0 5,360.06,860.06,860.03,565.6General Office
TOTAL ALL DIVISIONS 6,860.0 5,360.06,860.06,860.03,565.6
ActualExpenditure
EnactedAppropriation
EstimatedExpenditures
EnactedAppropriation
Fiscal Year2010
RecommendedAppropriation
Fiscal Year 2008 Fiscal Year 2009
Drycleaner EnvironmentalResponse Trust Fund Council
www.cleanupfund.orgP.O. Box 7380
Bensenville, IL 60106800.765.4041
Appropriations Requiring General Assembly Action($ thousands)
9 - 2

Illinois Environmental Protection Agency
www.epa.state.il.us 1021 North Grand Avenue East
Springfield, IL 62794 217.782.3397
OVERVIEW Agency Mission To protect, restore, and enhance the quality of the air, land and water resources to benefit current and future generations. Strategic Priorities • Enhance air quality. • Reduce contamination of the land through
prevention and cleanup. • Ensure clean and safe water resources. • Provide accurate information about
environmental conditions to educate the public and guide the use of resources.
• Develop innovative programs that promote economic development and benefit the environment.
Summary of Agency Operations The Illinois Environmental Protection Agency (IEPA) safeguards environmental quality to protect health, welfare, property and quality of life. The agency administers a regulatory system based on environmental monitoring, permits and performance standards, compliance inspections and enforcement. Agency Resources Employed
FY 2008 FY 2009 FY 2010Actual Enacted Recommended
General Funds 1,581.6 1,644.6 0.0Other State Funds 232,725.1 222,198.6 230,393.1
Federal Funds 56,542.6 63,473.2 79,195.1Total 290,849.3 287,316.4 309,588.2
Actual Estimated RecommendedHeadcount (FTE) 1,028.0 1,025.0 1,050.0
Appropriations ($ thousands)Fund Category
MAJOR ACCOMPLISHMENTS • Addressed climate change. The Illinois Climate
Change Advisory Group’s final report was published on the agency’s website, while climate change response efforts with the Midwest Governors Association, Climate Change Registry and other groups continued. Illinois Climate Change Initiative payments to farmers and other land owners who earn greenhouse gas emission credits when they use conservation tillage, plant grasses and trees, or capture methane with manure digesters exceeded $1 million.
• Reduced coal-fired power plant mercury emissions. In 2008, Illinois coal-fired power plants began to install and operate mercury emission controls to comply with the Illinois Mercury Rule adopted by the Illinois Pollution Control Board at the request of IEPA. Widely recognized as ground-breaking and one of the most stringent in the country, it requires pollution controls capable of achieving a 90 percent reduction in mercury emitted from power plants.
• Launched Medication Disposal Initiative.
IEPA conducted pilot pharmaceutical collections in 25 Illinois counties in partnership with local governments, pharmacies and others to prevent medications from getting into bodies of water. The agency also conducted one of the first drinking water sampling studies for pharmaceuticals and personal care products in six representative communities. IEPA also organized a “Summit Conference” attended by more than 100 representatives from a wide range of organizations to develop potential future partnerships. At the conference, the Medication Education Disposal Solutions Action Committee was launched.
• Cleaned up open dumps. The Illinois Removes
Illegal Dumps program continued to address long-festering open dumps around the state, ranging from remote rural locations to two urban parks in the City of Chicago with a total of more than 200 around the state addressed by the end of 2009.
• Expanded Greener Cleanups Initiative. IEPA
expanded this initiative in 2008 to maximize the environmental benefits of site remediation by incorporating more sustainable practices and materials, including a matrix document for site owners and consultants; a white paper on greener cleanups of pipeline releases; and green remediation training for project managers and other staff.
• Completed Joliet Army Ammunition Plant
cleanup. The former munitions complex, one of the largest cleanups in state history, was completed three years ahead of schedule in 2008, with nearly all of the more than 23,000 acres transferred for redevelopment or ecosystem restoration.
9 - 3

Illinois Environmental Protection Agency
www.epa.state.il.us 1021 North Grand Avenue East
Springfield, IL 62794 217.782.3397
• Passed Electronic Waste Disposal Law. One of the most comprehensive state electronic waste (e-waste) recycling laws in the nation was passed in 2008 with support from IEPA. IEPA will be the lead agency in implementing a system by which manufacturers of computers, televisions and printers will partner with local governments, recyclers, refurbishers and others to develop alternatives to landfill disposal.
KEY BUDGET INITIATIVES • Federal recovery. Illinois will receive
approximately $260 million to support the Drinking Water and Wastewater Infrastructure Revolving Loan Programs. These funds will be used for drinking water and wastewater treatment and sewer projects. Twenty percent of the new funds are reserved for “green action projects,” such as those that conserve water, encourage low impact development, and energy efficiency at drinking water and wastewater treatment facilities.
• Protecting our children through the Target
Toxic Toys for Tots program. As part of a proposed Child-Safe Chemicals Act, IEPA will seek the creation of a pilot program to evaluate the safety of chemicals in toys and other child-oriented products, as well as assess potential safer alternatives to such chemicals. The IEPA will work in partnership with the Illinois Department of Public Health and a proposed Child Health Advisory Panel.
• Reducing greenhouse gas emissions that are
impacting climate change. IEPA will continue to work with other government agencies and the private sector to reduce greenhouse gas emissions in the state that contribute to global warming and climate change. IEPA will work to implement recommendations of the Illinois Climate Change Task Force. These include increasing the use of renewable energy, expanding green building and operating practices, and encouraging agricultural practices that store carbon dioxide and reduce methane gas.
• Expanding financing for upgrading wastewater
treatment plants, sewage lines, drinking water treatment plants, water mains and storage facilities. IEPA will allocate appropriate resources to accelerate the processing of new
loans for those projects that are shovel ready for an anticipated release of federal economic stimulus funds in 2009.
• Continuing regulatory streamlining. Building
on its successful implementation of management efficiency techniques to reduce the average processing time for minor air pollution control construction permits, IEPA will expand streamlining to water pollution control permits.
• Expanding environmentally responsible
disposal of medications. IEPA will continue to work with a wide variety of partners, including healthcare providers, environmental and watershed advocates, pharmacists and pharmacies, drinking water and wastewater treatment plant operators, local governments, law enforcement and others. The goal is to form coalitions to expand public awareness of keeping pharmaceuticals out of our lakes and streams and creating additional drop-off and collection options for discarded medications.
• Seeking federal funding for biomass crop
research and applications. IEPA, in partnership with the University of Illinois, a recognized leader in the field of biomass research, will move to secure federal funds to conduct research and investigate means of large-scale production of biofuels in Illinois. The university is conducting promising research on a tall grass (miscanthus Giganteus), prairie cane, corn stover, corn cobs and other plants that readily convert to biofuel.
PROGRAMS Pollution Control Board The board promulgates pollution control standards and environmental regulations to protect the public health and environment. The board provides a public forum for hearing enforcement cases; requests for variances; appeals of final IEPA administrative decisions; underground storage tank reimbursement appeals; and reviews of local government decisions regarding the siting of new pollution control facilities. The board has original jurisdiction in cases alleging violations of environmental laws and regulations that are investigated by the IEPA and prosecuted by the Office of the Attorney General or other entities, as well as those filed by individuals.
9 - 4
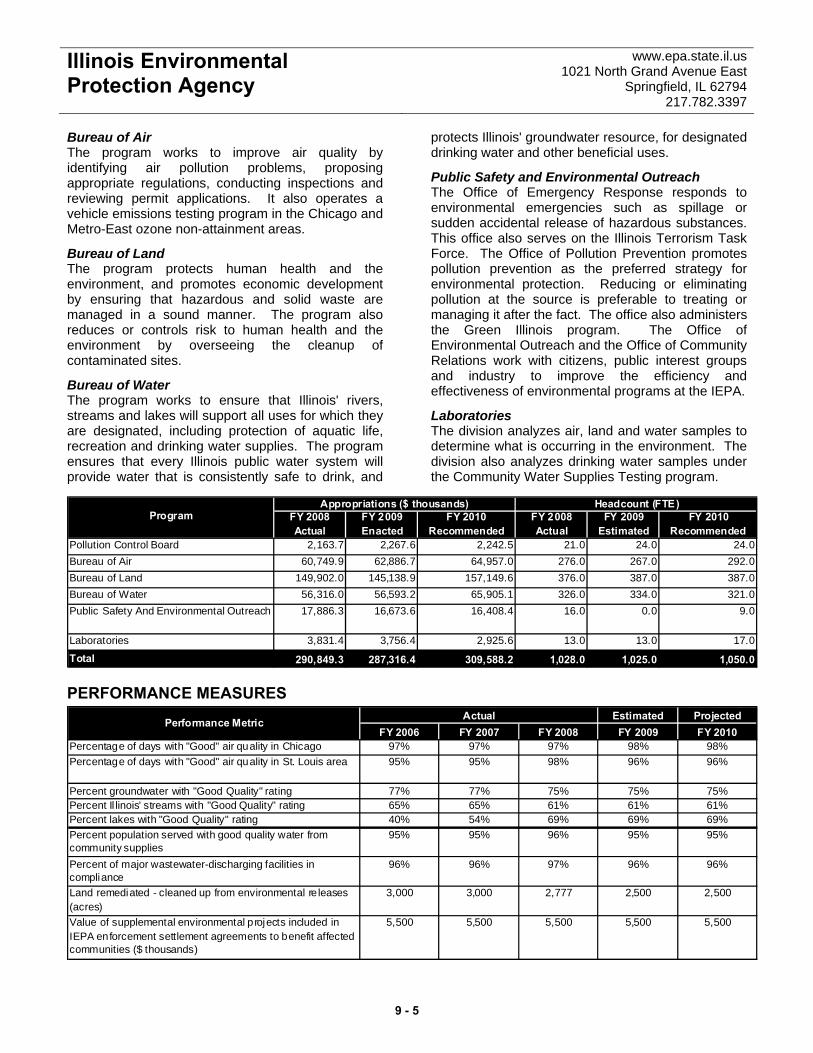
Illinois Environmental Protection Agency
www.epa.state.il.us 1021 North Grand Avenue East
Springfield, IL 62794 217.782.3397
Bureau of Air The program works to improve air quality by identifying air pollution problems, proposing appropriate regulations, conducting inspections and reviewing permit applications. It also operates a vehicle emissions testing program in the Chicago and Metro-East ozone non-attainment areas.
Bureau of Land The program protects human health and the environment, and promotes economic development by ensuring that hazardous and solid waste are managed in a sound manner. The program also reduces or controls risk to human health and the environment by overseeing the cleanup of contaminated sites.
Bureau of Water The program works to ensure that Illinois' rivers, streams and lakes will support all uses for which they are designated, including protection of aquatic life, recreation and drinking water supplies. The program ensures that every Illinois public water system will provide water that is consistently safe to drink, and
protects Illinois' groundwater resource, for designated drinking water and other beneficial uses.
Public Safety and Environmental Outreach The Office of Emergency Response responds to environmental emergencies such as spillage or sudden accidental release of hazardous substances. This office also serves on the Illinois Terrorism Task Force. The Office of Pollution Prevention promotes pollution prevention as the preferred strategy for environmental protection. Reducing or eliminating pollution at the source is preferable to treating or managing it after the fact. The office also administers the Green Illinois program. The Office of Environmental Outreach and the Office of Community Relations work with citizens, public interest groups and industry to improve the efficiency and effectiveness of environmental programs at the IEPA.
Laboratories The division analyzes air, land and water samples to determine what is occurring in the environment. The division also analyzes drinking water samples under the Community Water Supplies Testing program.
Program FY 2008 FY 2009 FY 2010 FY 2008 FY 2009 FY 2010Actual Enacted Recommended Actual Estimated Recommended
Pollution Control Board 2,163.7 2,267.6 2,242.5 21.0 24.0 24.0Bureau of Air 60,749.9 62,886.7 64,957.0 276.0 267.0 292.0Bureau of Land 149,902.0 145,138.9 157,149.6 376.0 387.0 387.0Bureau of Water 56,316.0 56,593.2 65,905.1 326.0 334.0 321.0Public Safety And Environmental Outreach 17,886.3 16,673.6 16,408.4 16.0 0.0 9.0
Laboratories 3,831.4 3,756.4 2,925.6 13.0 13.0 17.0
Total 290,849.3 287,316.4 309,588.2 1,028.0 1,025.0 1,050.0
Appropriations ($ thousands) Headcount (FTE)
PERFORMANCE MEASURES Estimated Projected
FY 2006 FY 2007 FY 2008 FY 2009 FY 2010Percentage of days with "Good" air quality in Chicago 97% 97% 97% 98% 98%Percentage of days with "Good" air quality in St. Louis area 95% 95% 98% 96% 96%
Percent groundwater with "Good Quality" rating 77% 77% 75% 75% 75%Percent Il linois' streams with "Good Quality" rating 65% 65% 61% 61% 61%Percent lakes with "Good Quality" rating 40% 54% 69% 69% 69%Percent population served with good quality water from community supplies
95% 95% 96% 95% 95%
Percent of major wastewater-discharging facilities in compliance
96% 96% 97% 96% 96%
Land remediated - cleaned up from environmental re leases (acres)
3,000 3,000 2,777 2,500 2,500
Value of supplemental environmental projects included in IEPA enforcement settlement agreements to benefit affected communities ($ thousands)
5,500 5,500 5,500 5,500 5,500
ActualPerformance Metric
9 - 5

ActualExpenditure
EnactedAppropriation
EstimatedExpenditures
EnactedAppropriation
Fiscal Year2010
RecommendedAppropriation
Fiscal Year 2008 Fiscal Year 2009
Illinois Environmental ProtectionAgency
www.epa.state.il.us1021 North Grand Avenue East
Springfield, IL 62794217.782.3397
Appropriations Requiring General Assembly Action($ thousands)
GENERAL FUNDS
Total 884.4 0.0927.3927.3884.2Personal Services and Fringe Benefits
Total 7.9 0.09.19.17.9Contractual Services
Total 52.6 0.071.871.852.5Other Operations and Refunds
Designated Purposes236.7 0.00.00.00.0Additional Frontline Staff*
0.0 0.0436.4436.40.0Laboratory Analyses of Samples Taken atEnvironmental Spills and Emergencies
Total 236.7 0.0436.4436.40.0Designated Purposes
Grants400.0 0.0200.0200.0332.8Addison Creek
Total 400.0 0.0200.0200.0332.8Grants
TOTAL GENERAL FUNDS 1,581.6 0.01,644.61,644.61,277.4
OTHER STATE FUNDS
Total 39,225.7 40,848.539,479.540,959.836,843.2Personal Services and Fringe Benefits
Total 53,414.7 42,254.646,174.553,762.244,275.9Contractual Services
Total 5,220.4 5,783.15,494.25,897.83,251.5Other Operations and Refunds
Designated Purposes5.0 5.04.65.00.0Administering the Industrial Hygiene Licensing Program
18.5 18.518.518.518.5Administration of Activities Relating to Used and WasteTires, 415 ILCS 5/55.6
1,063.0 1,063.01,063.01,063.0923.0Administrative costs for Brownfields Grant Program
16,201.8 16,720.815,965.616,201.814,266.9Clean Air Act Title V Activities in Accordance with theClean Air Act - Amendments of 1990
7,046.9 7,929.37,506.97,506.97,036.0Clean Water Program - NPDES Permit Program
450.0 250.0250.0450.0104.6Community cost-sharing for the Household HazardousWaste Program
0.0 2,000.00.00.00.0Contractual Services - Worthy Park Haz WasteRemediation
3,003.1 1,626.01,500.03,003.11,403.0Costs of lab testing of Community Water SupplySamples and Administration of Agency and CommunityWater Supply Testing Council
1,500.0 250.0250.0250.0301.1Diesel Retrofit Programs
1,245.0 1,289.21,245.01,245.0859.7Drinking Water Loan Administration
2,147.9 2,423.32,328.52,328.52,100.4Drinking Water Loan Program Support
150.0 150.0150.0150.0108.0Emissions Reduction Market System
0.0 500.00.00.00.0eWaste Recycling Program
150.0 75.0130.0150.082.3Expenses for Responding to Spills on Illinois Waterways
225.0 225.0225.0225.0207.4Expenses for the Alternate Fuels Program
150.0 75.025.075.04.5External Laboratory Analyses
0.0 10,000.00.00.00.0Federal Recovery - Brownfields and LUST Remediation
0.0 3,200.00.00.00.0Federal Recovery - Drinking Water Loan Program
0.0 7,200.00.00.00.0Federal Recovery - Water Pollution Control LoanProgram
9 - 6
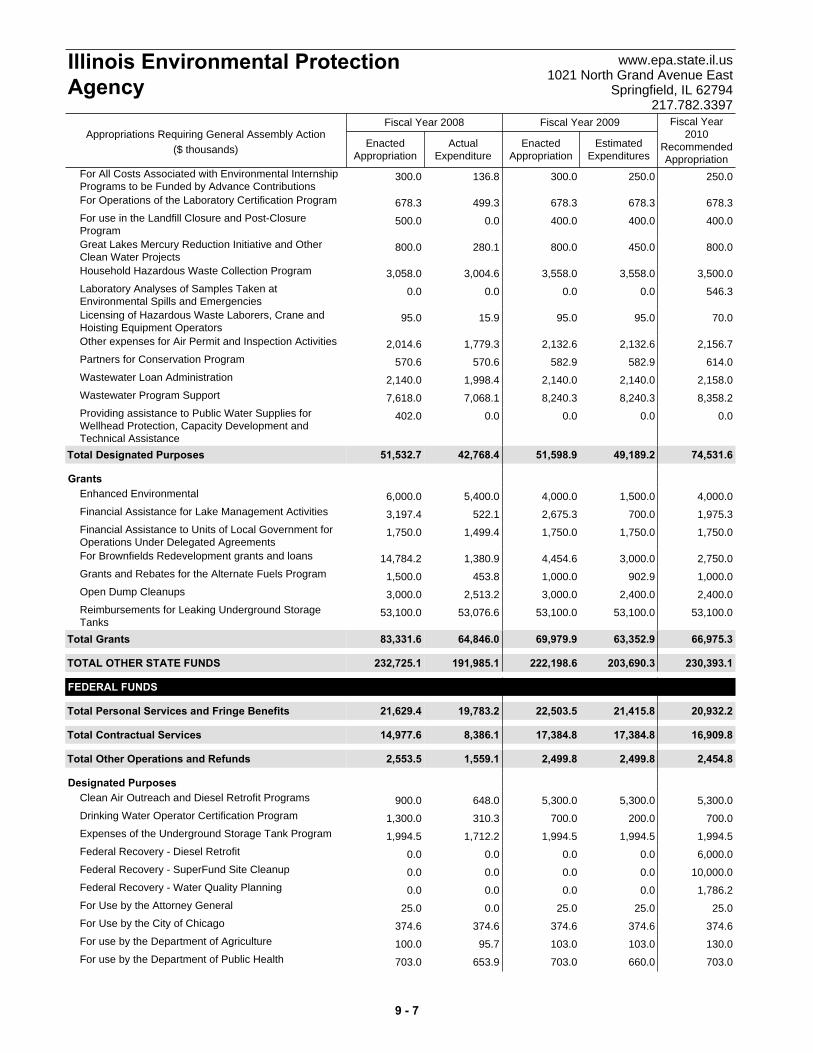
ActualExpenditure
EnactedAppropriation
EstimatedExpenditures
EnactedAppropriation
Fiscal Year2010
RecommendedAppropriation
Fiscal Year 2008 Fiscal Year 2009
Illinois Environmental ProtectionAgency
www.epa.state.il.us1021 North Grand Avenue East
Springfield, IL 62794217.782.3397
Appropriations Requiring General Assembly Action($ thousands)
300.0 250.0250.0300.0136.8For All Costs Associated with Environmental InternshipPrograms to be Funded by Advance Contributions
678.3 678.3678.3678.3499.3For Operations of the Laboratory Certification Program
500.0 400.0400.0400.00.0For use in the Landfill Closure and Post-ClosureProgram
800.0 800.0450.0800.0280.1Great Lakes Mercury Reduction Initiative and OtherClean Water Projects
3,058.0 3,500.03,558.03,558.03,004.6Household Hazardous Waste Collection Program
0.0 546.30.00.00.0Laboratory Analyses of Samples Taken atEnvironmental Spills and Emergencies
95.0 70.095.095.015.9Licensing of Hazardous Waste Laborers, Crane andHoisting Equipment Operators
2,014.6 2,156.72,132.62,132.61,779.3Other expenses for Air Permit and Inspection Activities
570.6 614.0582.9582.9570.6Partners for Conservation Program
2,140.0 2,158.02,140.02,140.01,998.4Wastewater Loan Administration
7,618.0 8,358.28,240.38,240.37,068.1Wastewater Program Support
402.0 0.00.00.00.0Providing assistance to Public Water Supplies forWellhead Protection, Capacity Development andTechnical Assistance
Total 51,532.7 74,531.649,189.251,598.942,768.4Designated Purposes
Grants6,000.0 4,000.01,500.04,000.05,400.0Enhanced Environmental
3,197.4 1,975.3700.02,675.3522.1Financial Assistance for Lake Management Activities
1,750.0 1,750.01,750.01,750.01,499.4Financial Assistance to Units of Local Government forOperations Under Delegated Agreements
14,784.2 2,750.03,000.04,454.61,380.9For Brownfields Redevelopment grants and loans
1,500.0 1,000.0902.91,000.0453.8Grants and Rebates for the Alternate Fuels Program
3,000.0 2,400.02,400.03,000.02,513.2Open Dump Cleanups
53,100.0 53,100.053,100.053,100.053,076.6Reimbursements for Leaking Underground StorageTanks
Total 83,331.6 66,975.363,352.969,979.964,846.0Grants
TOTAL OTHER STATE FUNDS 232,725.1 230,393.1203,690.3222,198.6191,985.1
FEDERAL FUNDS
Total 21,629.4 20,932.221,415.822,503.519,783.2Personal Services and Fringe Benefits
Total 14,977.6 16,909.817,384.817,384.88,386.1Contractual Services
Total 2,553.5 2,454.82,499.82,499.81,559.1Other Operations and Refunds
Designated Purposes900.0 5,300.05,300.05,300.0648.0Clean Air Outreach and Diesel Retrofit Programs
1,300.0 700.0200.0700.0310.3Drinking Water Operator Certification Program
1,994.5 1,994.51,994.51,994.51,712.2Expenses of the Underground Storage Tank Program
0.0 6,000.00.00.00.0Federal Recovery - Diesel Retrofit
0.0 10,000.00.00.00.0Federal Recovery - SuperFund Site Cleanup
0.0 1,786.20.00.00.0Federal Recovery - Water Quality Planning
25.0 25.025.025.00.0For Use by the Attorney General
374.6 374.6374.6374.6374.6For Use by the City of Chicago
100.0 130.0103.0103.095.7For use by the Department of Agriculture
703.0 703.0660.0703.0653.9For use by the Department of Public Health
9 - 7
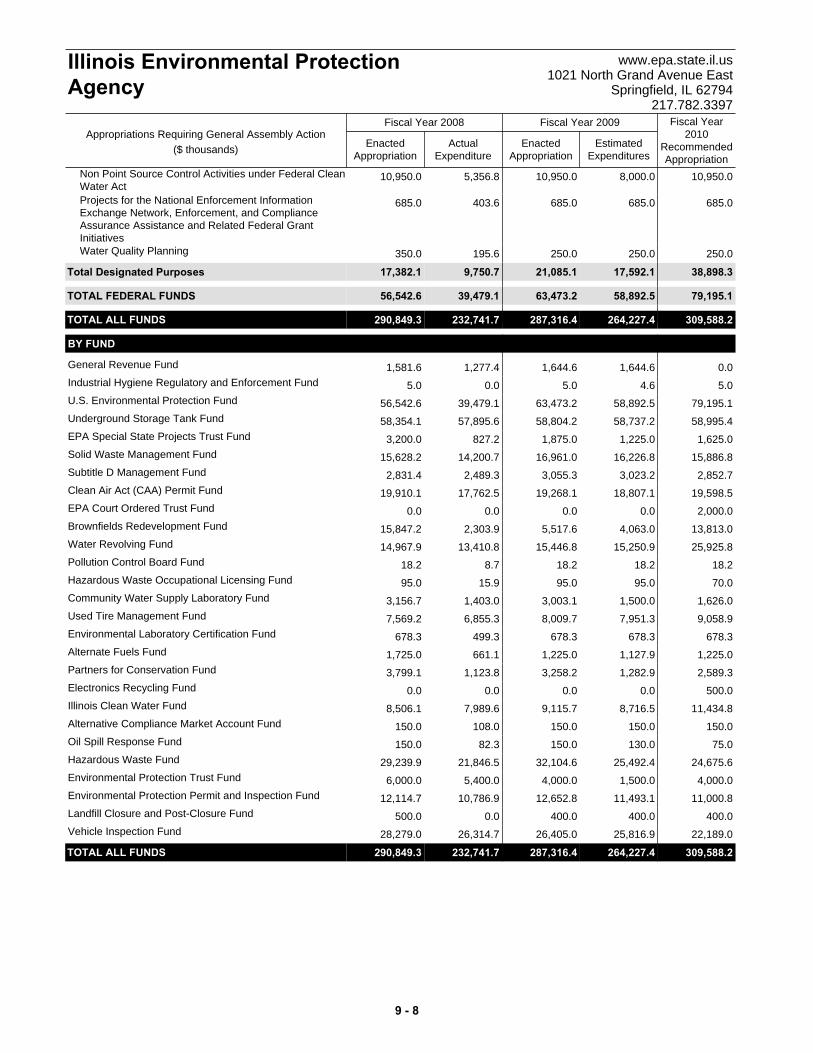
ActualExpenditure
EnactedAppropriation
EstimatedExpenditures
EnactedAppropriation
Fiscal Year2010
RecommendedAppropriation
Fiscal Year 2008 Fiscal Year 2009
Illinois Environmental ProtectionAgency
www.epa.state.il.us1021 North Grand Avenue East
Springfield, IL 62794217.782.3397
Appropriations Requiring General Assembly Action($ thousands)
10,950.0 10,950.08,000.010,950.05,356.8Non Point Source Control Activities under Federal CleanWater Act
685.0 685.0685.0685.0403.6Projects for the National Enforcement InformationExchange Network, Enforcement, and ComplianceAssurance Assistance and Related Federal GrantInitiatives
350.0 250.0250.0250.0195.6Water Quality Planning
Total 17,382.1 38,898.317,592.121,085.19,750.7Designated Purposes
TOTAL FEDERAL FUNDS 56,542.6 79,195.158,892.563,473.239,479.1
TOTAL ALL FUNDS 290,849.3 309,588.2264,227.4287,316.4232,741.7
BY FUND
1,581.6 0.01,644.61,644.61,277.4General Revenue Fund
5.0 5.04.65.00.0Industrial Hygiene Regulatory and Enforcement Fund
56,542.6 79,195.158,892.563,473.239,479.1U.S. Environmental Protection Fund
58,354.1 58,995.458,737.258,804.257,895.6Underground Storage Tank Fund
3,200.0 1,625.01,225.01,875.0827.2EPA Special State Projects Trust Fund
15,628.2 15,886.816,226.816,961.014,200.7Solid Waste Management Fund
2,831.4 2,852.73,023.23,055.32,489.3Subtitle D Management Fund
19,910.1 19,598.518,807.119,268.117,762.5Clean Air Act (CAA) Permit Fund
0.0 2,000.00.00.00.0EPA Court Ordered Trust Fund
15,847.2 13,813.04,063.05,517.62,303.9Brownfields Redevelopment Fund
14,967.9 25,925.815,250.915,446.813,410.8Water Revolving Fund
18.2 18.218.218.28.7Pollution Control Board Fund
95.0 70.095.095.015.9Hazardous Waste Occupational Licensing Fund
3,156.7 1,626.01,500.03,003.11,403.0Community Water Supply Laboratory Fund
7,569.2 9,058.97,951.38,009.76,855.3Used Tire Management Fund
678.3 678.3678.3678.3499.3Environmental Laboratory Certification Fund
1,725.0 1,225.01,127.91,225.0661.1Alternate Fuels Fund
3,799.1 2,589.31,282.93,258.21,123.8Partners for Conservation Fund
0.0 500.00.00.00.0Electronics Recycling Fund
8,506.1 11,434.88,716.59,115.77,989.6Illinois Clean Water Fund
150.0 150.0150.0150.0108.0Alternative Compliance Market Account Fund
150.0 75.0130.0150.082.3Oil Spill Response Fund
29,239.9 24,675.625,492.432,104.621,846.5Hazardous Waste Fund
6,000.0 4,000.01,500.04,000.05,400.0Environmental Protection Trust Fund
12,114.7 11,000.811,493.112,652.810,786.9Environmental Protection Permit and Inspection Fund
500.0 400.0400.0400.00.0Landfill Closure and Post-Closure Fund
28,279.0 22,189.025,816.926,405.026,314.7Vehicle Inspection Fund
TOTAL ALL FUNDS 290,849.3 309,588.2264,227.4287,316.4232,741.7
9 - 8
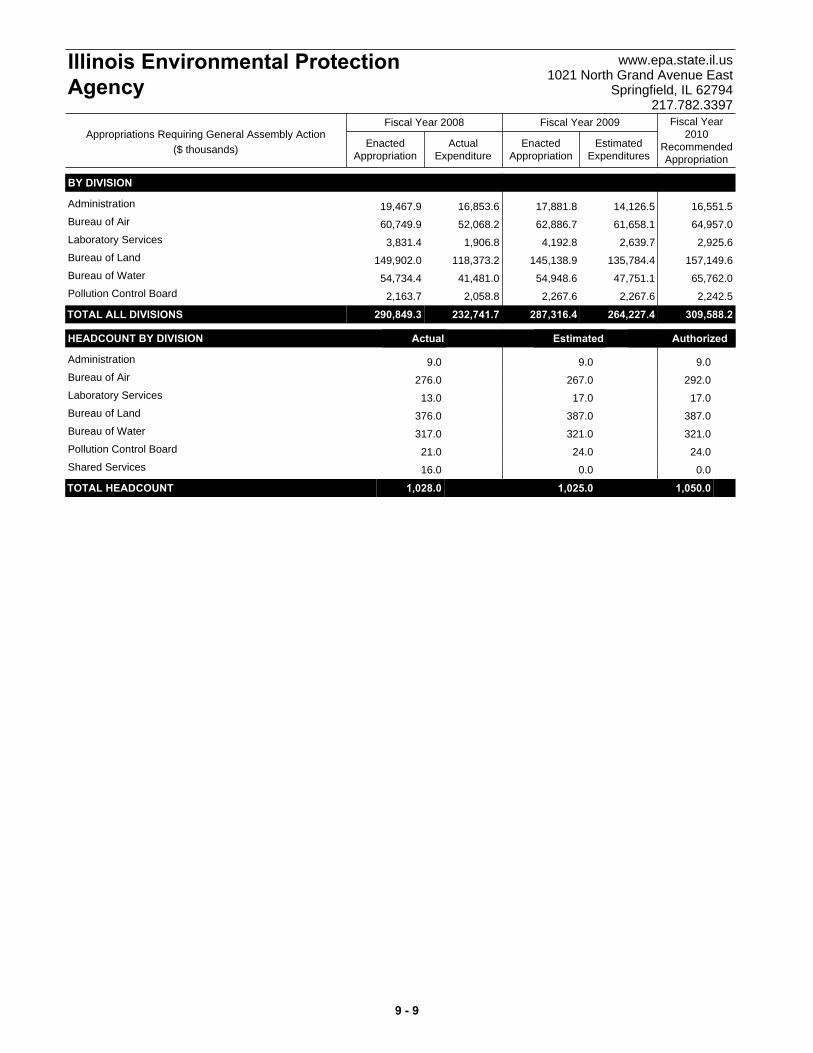
ActualExpenditure
EnactedAppropriation
EstimatedExpenditures
EnactedAppropriation
Fiscal Year2010
RecommendedAppropriation
Fiscal Year 2008 Fiscal Year 2009
Illinois Environmental ProtectionAgency
www.epa.state.il.us1021 North Grand Avenue East
Springfield, IL 62794217.782.3397
Appropriations Requiring General Assembly Action($ thousands)
BY DIVISION
19,467.9 16,551.514,126.517,881.816,853.6Administration
60,749.9 64,957.061,658.162,886.752,068.2Bureau of Air
3,831.4 2,925.62,639.74,192.81,906.8Laboratory Services
149,902.0 157,149.6135,784.4145,138.9118,373.2Bureau of Land
54,734.4 65,762.047,751.154,948.641,481.0Bureau of Water
2,163.7 2,242.52,267.62,267.62,058.8Pollution Control Board
TOTAL ALL DIVISIONS 290,849.3 309,588.2264,227.4287,316.4232,741.7
HEADCOUNT BY DIVISION Actual Estimated Authorized
9.0 9.09.0Administration
276.0 292.0267.0Bureau of Air
13.0 17.017.0Laboratory Services
376.0 387.0387.0Bureau of Land
317.0 321.0321.0Bureau of Water
21.0 24.024.0Pollution Control Board
16.0 0.00.0Shared Services
TOTAL HEADCOUNT 1,028.0 1,050.01,025.0 t
9 - 9

Department Of Financial And Professional Regulation
www.idfpr.com 320 West Washington Springfield, IL 62786
217.785.0822
OVERVIEW Agency Mission To protect consumers of financial and professional services by ensuring the integrity and standards of regulated industries and professionals through an efficiently consolidated supervisory and enforcement function. Strategic Priorities • Maintain safety and soundness of financial
services businesses. • Enhance responsiveness and consistency of
regulatory enforcement. • Improve efficiency and effectiveness of licensure
and enforcement functions. • Educate consumers and the public about legal
rights and remedies to enhance accountability of financial and professional services.
Summary of Agency Operations The Illinois Department of Financial and Professional Regulation (IDFPR) is comprised of three divisions: the Division of Banks (DOB), Division of Financial Institutions (DFI), and the Division of Professional Regulation (DPR). The IDFPR oversees the regulation and licensure of banks and financial institutions, real estate businesses and professionals, and scores of diverse licensed professions. The department ensures the application of consistent regulatory standards and procedures, enforces standards of professional practice and conducts and protects the rights of all Illinois residents in their transactions with regulated industries. Agency Resources Employed
FY 2008 FY 2009 FY 2010Actual Enacted Recommended
General Funds 0.0 0.0 0.0Other State Funds 84,552.3 85,532.3 78,758.7
Federal Funds 0.0 0.0 0.0Total 84,552.3 85,532.3 78,758.7
Actual Estimated RecommendedHeadcount (FTE) 517.0 562.0 572.0
Appropriations ($ thousands)Fund Category
MAJOR ACCOMPLISHMENTS • Expanded the Homeowner Assistance
Initiative. This initiative is the nation’s most comprehensive state approach to help struggling
homeowners avoid foreclosure. The Homeowner Assistance Initiative Refinancing Pool offers refinancing at a lower, fixed rate to homeowners in danger of default and foreclosure. The department identified nine financial institutions that are committed to working with eligible candidates to help borrowers secure loans that meet their needs.
• Implemented the Physician Profile feature.
This feature is part of the department’s efforts to improve Illinois families’ access to quality health care. The new feature is available to the public at IDFPR's Web site and allows health care consumers to review important professional and disciplinary data regarding the 44,000 physicians and surgeons licensed to practice medicine in Illinois.
• Implemented stringent new requirements for
medical profiling and increased medical malpractice regulation. IDFPR now reviews and holds hearings on rate and rule filings in accordance with the new requirements. Further, IDFPR trained companies on compliance with claims reporting software and is currently collecting data for an annual medical malpractice claims report that describes reporting elements and analyzes individual claims.
• Established a Center for Nursing. This center
is located within IDFPR, which is responsible for developing a strategic plan to increase nursing staff in Illinois, maintaining a database on nursing care provided and expanding nursing education in the state.
• Collaborated with the Illinois Department of
Public Health (DPH) to create the Dental Workforce Census Report. DPH cited the resolution of dental workforce issues as a major policy goal of its oral health plan. By identifying each county's dental workforce full-time equivalency from the census report, IDFPR took an important initial step in building an effective infrastructure to meet the oral health needs of all Illinoisans.
• Developed a new statewide database that
lenders must use to review an applicant's payday loan record. If a new loan application violates any provision of the Payday Loan Reform Act, a denial is automatically generated prohibiting the payday lender from authorizing the
9 - 10
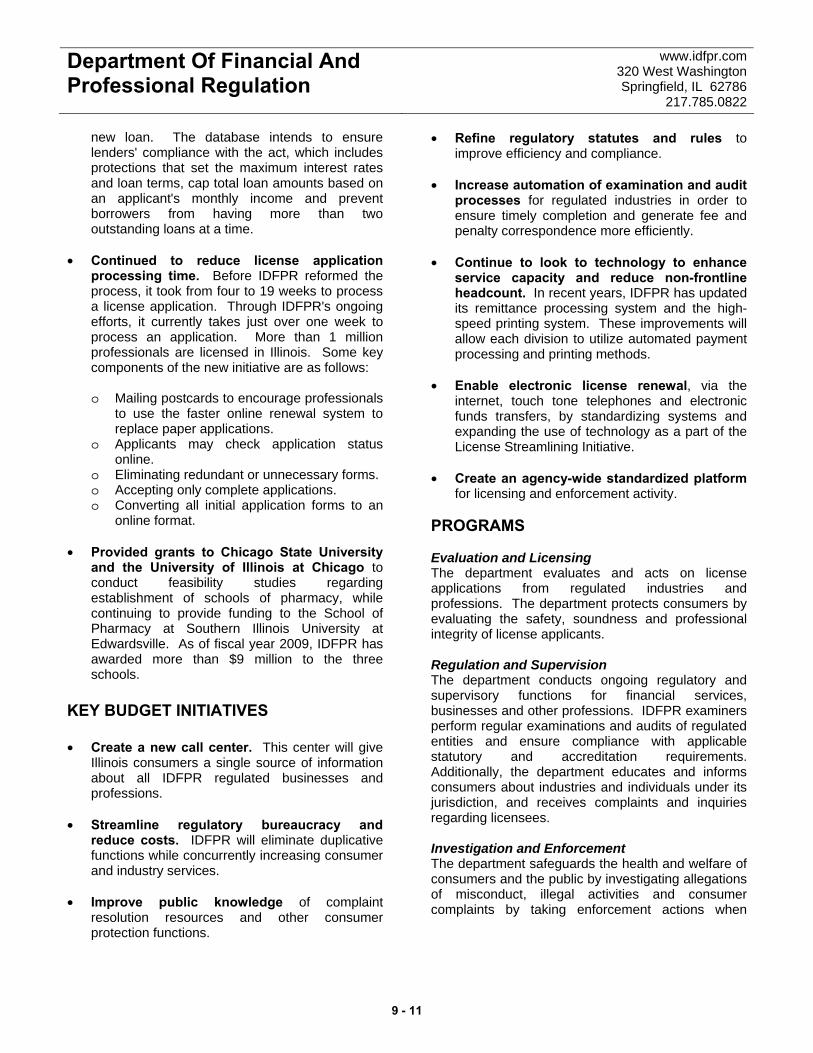
Department Of Financial And Professional Regulation
www.idfpr.com 320 West Washington Springfield, IL 62786
217.785.0822
new loan. The database intends to ensure lenders' compliance with the act, which includes protections that set the maximum interest rates and loan terms, cap total loan amounts based on an applicant's monthly income and prevent borrowers from having more than two outstanding loans at a time.
• Continued to reduce license application
processing time. Before IDFPR reformed the process, it took from four to 19 weeks to process a license application. Through IDFPR's ongoing efforts, it currently takes just over one week to process an application. More than 1 million professionals are licensed in Illinois. Some key components of the new initiative are as follows:
o Mailing postcards to encourage professionals
to use the faster online renewal system to replace paper applications.
o Applicants may check application status online.
o Eliminating redundant or unnecessary forms. o Accepting only complete applications. o Converting all initial application forms to an
online format. • Provided grants to Chicago State University
and the University of Illinois at Chicago to conduct feasibility studies regarding establishment of schools of pharmacy, while continuing to provide funding to the School of Pharmacy at Southern Illinois University at Edwardsville. As of fiscal year 2009, IDFPR has awarded more than $9 million to the three schools.
KEY BUDGET INITIATIVES • Create a new call center. This center will give
Illinois consumers a single source of information about all IDFPR regulated businesses and professions.
• Streamline regulatory bureaucracy and
reduce costs. IDFPR will eliminate duplicative functions while concurrently increasing consumer and industry services.
• Improve public knowledge of complaint
resolution resources and other consumer protection functions.
• Refine regulatory statutes and rules to improve efficiency and compliance.
• Increase automation of examination and audit
processes for regulated industries in order to ensure timely completion and generate fee and penalty correspondence more efficiently.
• Continue to look to technology to enhance
service capacity and reduce non-frontline headcount. In recent years, IDFPR has updated its remittance processing system and the high-speed printing system. These improvements will allow each division to utilize automated payment processing and printing methods.
• Enable electronic license renewal, via the
internet, touch tone telephones and electronic funds transfers, by standardizing systems and expanding the use of technology as a part of the License Streamlining Initiative.
• Create an agency-wide standardized platform
for licensing and enforcement activity. PROGRAMS Evaluation and Licensing The department evaluates and acts on license applications from regulated industries and professions. The department protects consumers by evaluating the safety, soundness and professional integrity of license applicants. Regulation and Supervision The department conducts ongoing regulatory and supervisory functions for financial services, businesses and other professions. IDFPR examiners perform regular examinations and audits of regulated entities and ensure compliance with applicable statutory and accreditation requirements. Additionally, the department educates and informs consumers about industries and individuals under its jurisdiction, and receives complaints and inquiries regarding licensees. Investigation and Enforcement The department safeguards the health and welfare of consumers and the public by investigating allegations of misconduct, illegal activities and consumer complaints by taking enforcement actions when
9 - 11
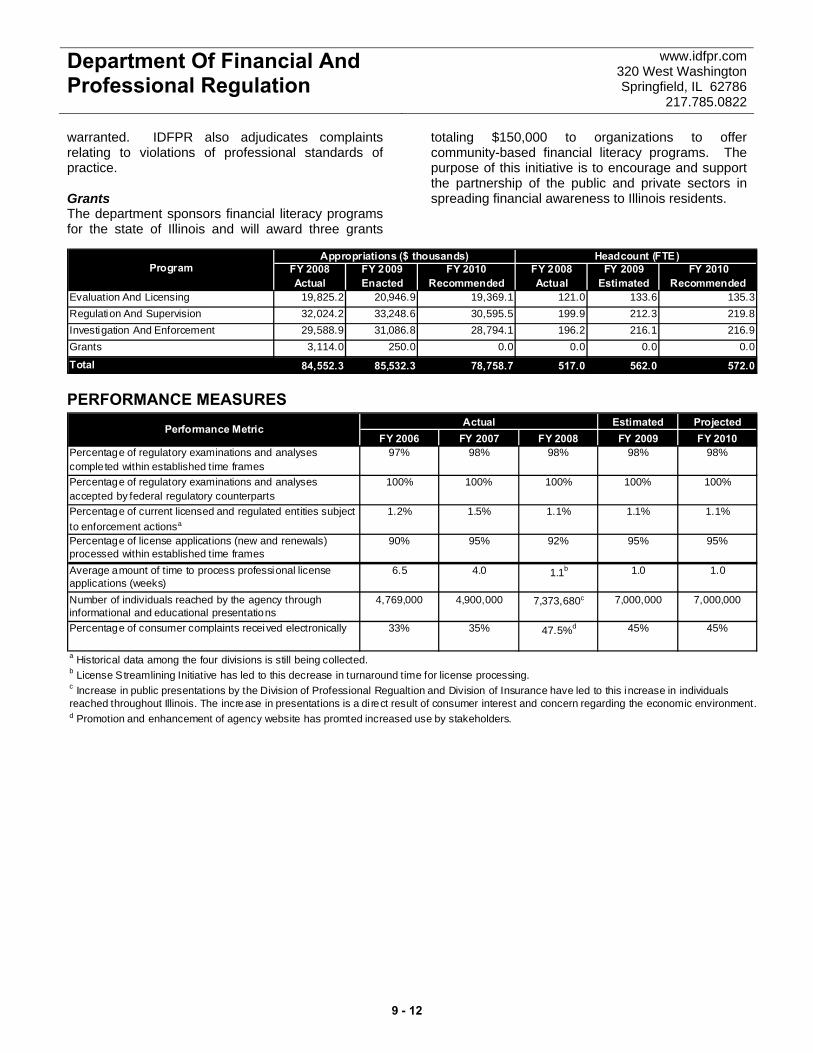
Department Of Financial And Professional Regulation
www.idfpr.com 320 West Washington Springfield, IL 62786
217.785.0822
warranted. IDFPR also adjudicates complaints relating to violations of professional standards of practice. Grants The department sponsors financial literacy programs for the state of Illinois and will award three grants
totaling $150,000 to organizations to offer community-based financial literacy programs. The purpose of this initiative is to encourage and support the partnership of the public and private sectors in spreading financial awareness to Illinois residents.
Program FY 2008 FY 2009 FY 2010 FY 2008 FY 2009 FY 2010Actual Enacted Recommended Actual Estimated Recommended
Evaluation And Licensing 19,825.2 20,946.9 19,369.1 121.0 133.6 135.3Regulation And Supervision 32,024.2 33,248.6 30,595.5 199.9 212.3 219.8Investigation And Enforcement 29,588.9 31,086.8 28,794.1 196.2 216.1 216.9Grants 3,114.0 250.0 0.0 0.0 0.0 0.0
Total 84,552.3 85,532.3 78,758.7 517.0 562.0 572.0
Appropriations ($ thousands) Headcount (FTE)
PERFORMANCE MEASURES Estimated Projected
FY 2006 FY 2007 FY 2008 FY 2009 FY 2010Percentage of regulatory examinations and analyses completed within established time frames
97% 98% 98% 98% 98%
Percentage of regulatory examinations and analyses accepted by federal regulatory counterparts
100% 100% 100% 100% 100%
Percentage of current licensed and regulated entities subject to enforcement actionsa
1.2% 1.5% 1.1% 1.1% 1.1%
Percentage of license applications (new and renewals) processed within established time frames
90% 95% 92% 95% 95%
Average amount of time to process professional license applications (weeks)
6.5 4.0 1.1b 1.0 1.0
Number of individuals reached by the agency through informational and educational presentations
4,769,000 4,900,000 7,373,680c 7,000,000 7,000,000
Percentage of consumer complaints received electronically 33% 35% 47.5%d 45% 45%
ActualPerformance Metric
a Historical data among the four divisions is still being collected.b License Streamlining Initiative has led to this decrease in turnaround time for license processing.c Increase in public presentations by the Division of Professional Regualtion and Division of Insurance have led to this increase in individuals reached throughout Illinois. The increase in presentations is a di rect result of consumer interest and concern regarding the economic environment.d Promotion and enhancement of agency website has promted increased use by stakeholders.
9 - 12
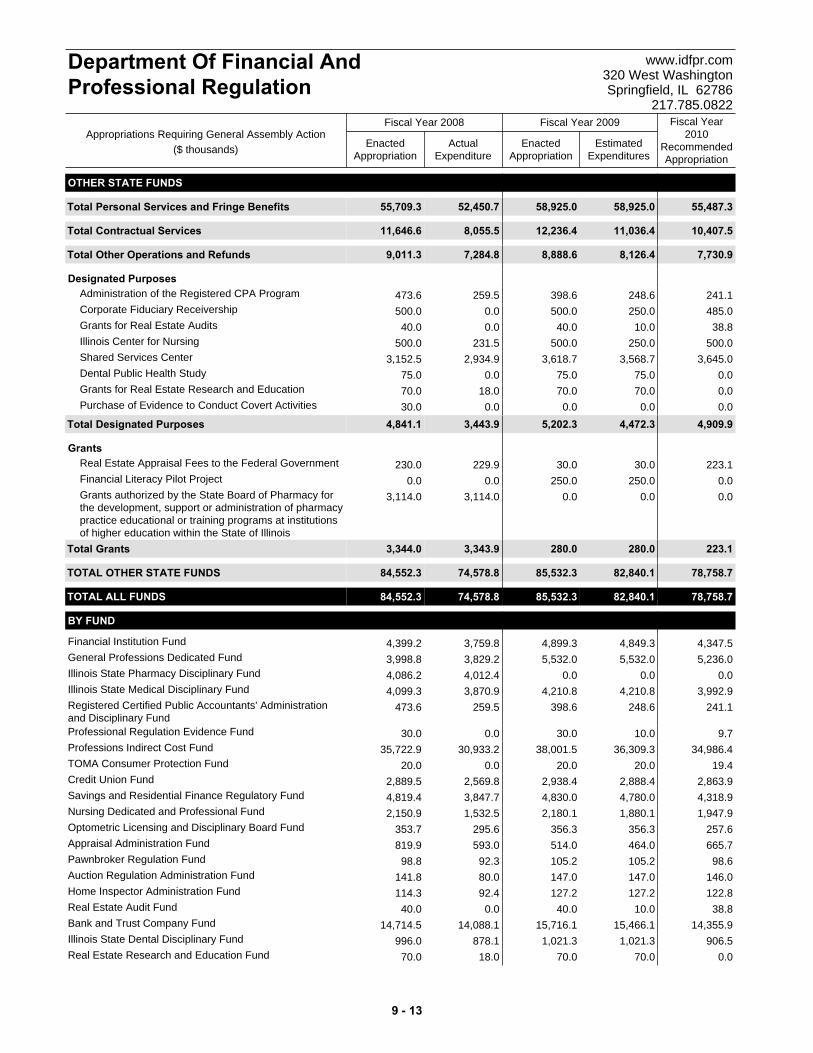
ActualExpenditure
EnactedAppropriation
EstimatedExpenditures
EnactedAppropriation
Fiscal Year2010
RecommendedAppropriation
Fiscal Year 2008 Fiscal Year 2009
Department Of Financial AndProfessional Regulation
www.idfpr.com320 West WashingtonSpringfield, IL 62786
217.785.0822
Appropriations Requiring General Assembly Action($ thousands)
OTHER STATE FUNDS
Total 55,709.3 55,487.358,925.058,925.052,450.7Personal Services and Fringe Benefits
Total 11,646.6 10,407.511,036.412,236.48,055.5Contractual Services
Total 9,011.3 7,730.98,126.48,888.67,284.8Other Operations and Refunds
Designated Purposes473.6 241.1248.6398.6259.5Administration of the Registered CPA Program
500.0 485.0250.0500.00.0Corporate Fiduciary Receivership
40.0 38.810.040.00.0Grants for Real Estate Audits
500.0 500.0250.0500.0231.5Illinois Center for Nursing
3,152.5 3,645.03,568.73,618.72,934.9Shared Services Center
75.0 0.075.075.00.0Dental Public Health Study
70.0 0.070.070.018.0Grants for Real Estate Research and Education
30.0 0.00.00.00.0Purchase of Evidence to Conduct Covert Activities
Total 4,841.1 4,909.94,472.35,202.33,443.9Designated Purposes
Grants230.0 223.130.030.0229.9Real Estate Appraisal Fees to the Federal Government
0.0 0.0250.0250.00.0Financial Literacy Pilot Project
3,114.0 0.00.00.03,114.0Grants authorized by the State Board of Pharmacy forthe development, support or administration of pharmacypractice educational or training programs at institutionsof higher education within the State of Illinois
Total 3,344.0 223.1280.0280.03,343.9Grants
TOTAL OTHER STATE FUNDS 84,552.3 78,758.782,840.185,532.374,578.8
TOTAL ALL FUNDS 84,552.3 78,758.782,840.185,532.374,578.8
BY FUND
4,399.2 4,347.54,849.34,899.33,759.8Financial Institution Fund
3,998.8 5,236.05,532.05,532.03,829.2General Professions Dedicated Fund
4,086.2 0.00.00.04,012.4Illinois State Pharmacy Disciplinary Fund
4,099.3 3,992.94,210.84,210.83,870.9Illinois State Medical Disciplinary Fund
473.6 241.1248.6398.6259.5Registered Certified Public Accountants' Administrationand Disciplinary Fund
30.0 9.710.030.00.0Professional Regulation Evidence Fund
35,722.9 34,986.436,309.338,001.530,933.2Professions Indirect Cost Fund
20.0 19.420.020.00.0TOMA Consumer Protection Fund
2,889.5 2,863.92,888.42,938.42,569.8Credit Union Fund
4,819.4 4,318.94,780.04,830.03,847.7Savings and Residential Finance Regulatory Fund
2,150.9 1,947.91,880.12,180.11,532.5Nursing Dedicated and Professional Fund
353.7 257.6356.3356.3295.6Optometric Licensing and Disciplinary Board Fund
819.9 665.7464.0514.0593.0Appraisal Administration Fund
98.8 98.6105.2105.292.3Pawnbroker Regulation Fund
141.8 146.0147.0147.080.0Auction Regulation Administration Fund
114.3 122.8127.2127.292.4Home Inspector Administration Fund
40.0 38.810.040.00.0Real Estate Audit Fund
14,714.5 14,355.915,466.115,716.114,088.1Bank and Trust Company Fund
996.0 906.51,021.31,021.3878.1Illinois State Dental Disciplinary Fund
70.0 0.070.070.018.0Real Estate Research and Education Fund
9 - 13
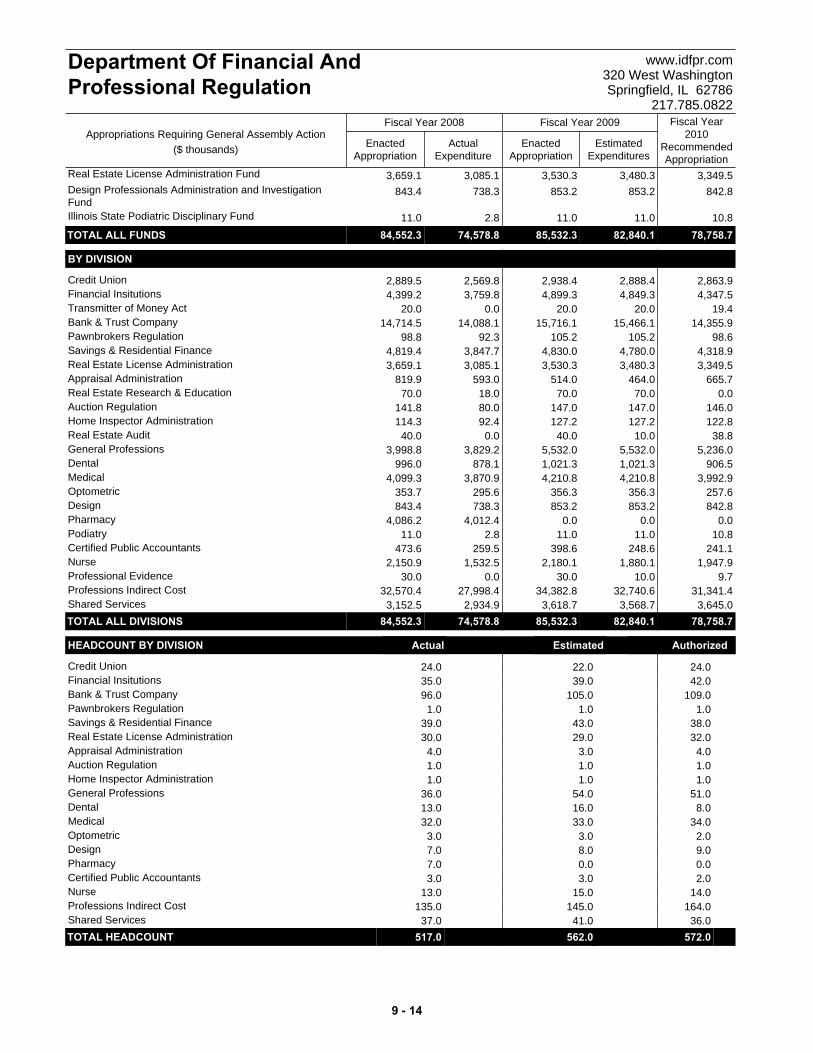
ActualExpenditure
EnactedAppropriation
EstimatedExpenditures
EnactedAppropriation
Fiscal Year2010
RecommendedAppropriation
Fiscal Year 2008 Fiscal Year 2009
Department Of Financial AndProfessional Regulation
www.idfpr.com320 West WashingtonSpringfield, IL 62786
217.785.0822
Appropriations Requiring General Assembly Action($ thousands)
3,659.1 3,349.53,480.33,530.33,085.1Real Estate License Administration Fund
843.4 842.8853.2853.2738.3Design Professionals Administration and InvestigationFund
11.0 10.811.011.02.8Illinois State Podiatric Disciplinary Fund
TOTAL ALL FUNDS 84,552.3 78,758.782,840.185,532.374,578.8
BY DIVISION
2,889.5 2,863.92,888.42,938.42,569.8Credit Union4,399.2 4,347.54,849.34,899.33,759.8Financial Insitutions
20.0 19.420.020.00.0Transmitter of Money Act14,714.5 14,355.915,466.115,716.114,088.1Bank & Trust Company
98.8 98.6105.2105.292.3Pawnbrokers Regulation4,819.4 4,318.94,780.04,830.03,847.7Savings & Residential Finance3,659.1 3,349.53,480.33,530.33,085.1Real Estate License Administration
819.9 665.7464.0514.0593.0Appraisal Administration70.0 0.070.070.018.0Real Estate Research & Education
141.8 146.0147.0147.080.0Auction Regulation114.3 122.8127.2127.292.4Home Inspector Administration
40.0 38.810.040.00.0Real Estate Audit3,998.8 5,236.05,532.05,532.03,829.2General Professions
996.0 906.51,021.31,021.3878.1Dental4,099.3 3,992.94,210.84,210.83,870.9Medical
353.7 257.6356.3356.3295.6Optometric843.4 842.8853.2853.2738.3Design
4,086.2 0.00.00.04,012.4Pharmacy11.0 10.811.011.02.8Podiatry
473.6 241.1248.6398.6259.5Certified Public Accountants2,150.9 1,947.91,880.12,180.11,532.5Nurse
30.0 9.710.030.00.0Professional Evidence32,570.4 31,341.432,740.634,382.827,998.4Professions Indirect Cost
3,152.5 3,645.03,568.73,618.72,934.9Shared ServicesTOTAL ALL DIVISIONS 84,552.3 78,758.782,840.185,532.374,578.8
HEADCOUNT BY DIVISION Actual Estimated Authorized
24.0 24.022.0Credit Union35.0 42.039.0Financial Insitutions96.0 109.0105.0Bank & Trust Company
1.0 1.01.0Pawnbrokers Regulation39.0 38.043.0Savings & Residential Finance30.0 32.029.0Real Estate License Administration
4.0 4.03.0Appraisal Administration1.0 1.01.0Auction Regulation1.0 1.01.0Home Inspector Administration
36.0 51.054.0General Professions13.0 8.016.0Dental32.0 34.033.0Medical
3.0 2.03.0Optometric7.0 9.08.0Design7.0 0.00.0Pharmacy3.0 2.03.0Certified Public Accountants
13.0 14.015.0Nurse135.0 164.0145.0Professions Indirect Cost
37.0 36.041.0Shared ServicesTOTAL HEADCOUNT 517.0 572.0562.0 t
9 - 14

Department Of Human Rights www.state.il.us/dhr 100 West Randolph, Suite 10-100
Chicago, IL 60601 312.814.6206
OVERVIEW Agency Mission To secure for all individuals within the state of Illinois freedom from unlawful discrimination; and to establish and promote equal opportunity and affirmative action as the policy of this state for all its residents. Strategic Priorities • Prohibit discrimination in employment, housing,
public accommodations, financial credit and sexual harassment in higher education.
• Enhance state agencies' compliance with equal employment opportunity (EEO) and affirmative action (AA) guidelines and public contractor and eligible bidder compliance with non-discrimination and affirmative action legal requirements.
• Perform public outreach, education and training regarding unlawful discrimination.
• Promote the mission of the Commission on Discrimination and Hate Crimes: to combat discrimination based on ethnicity, religion, skin color, gender, gender identification, disability or sexual orientation.
• Generate revenue to fund identified department programs.
Summary of Agency Operations The Illinois Department of Human Rights (IDHR) is an impartial investigative and regulatory agency charged with administering and enforcing the Illinois Human Rights Act. The department promotes civil rights and attempts to reduce discrimination in Illinois through policies and programs that encourage voluntary compliance with human rights laws. Agency Resources Employed
FY 2008 FY 2009 FY 2010Actual Enacted Recommended
General Funds 9,747.8 9,821.8 9,424.0Other State Funds 0.0 0.0 0.0
Federal Funds 2,755.2 2,775.4 2,667.0Total 12,503.0 12,597.2 12,091.0
Actual Estimated RecommendedHeadcount (FTE) 158.0 155.0 160.0
Appropriations ($ thousands)Fund Category
MAJOR ACCOMPLISHMENTS • Obtained federal funding by successfully
performing under contract to U.S. Equal Employment Opportunity Commission (EEOC).
• Successfully completed performance of
Housing and Urban Development (HUD) contract for investigation of claims of discrimination in housing.
• Succeeded in the Mediation Program. For the
first quarter of fiscal year 2009, the Mediation Unit has a success rate of 86 percent.
• Continued efforts to ensure equality in
housing. HUD awarded IDHR special-project funding to conduct race and disability testing and enforcement activities throughout the state to help ensure equitable treatment in housing in the state of Illinois.
• Monitored public contractors. In fiscal year
2008, the Public Contracts Unit received 4,038 eligible bidder registration requests and processed 4,403 contracts. They responded to 5,578 inquiries from the public concerning the public contracts program.
• Conducted training and development for both
public and private clients. The department trained over 3,000 individuals in fiscal year 2008 with a satisfaction rating of 95 percent.
• Renewed push for fair housing education and
outreach. IDHR, in coordination with other public and community-based organizations, continued its education and outreach efforts to provide fair housing and other IDHR-program information to Illinois residents.
• Resolved 685 requests for review during
fiscal year 2008. In order to ensure an appropriate resolution, IDHR will conduct a review of a dismissal order resulting from a lack of substantial evidence within a specified time frame at the complainant’s request.
• Continued to monitor state agencies’
compliance with the EEO/AA Laws. In fiscal year 2008, 74 percent of state agencies met the IDHR affirmative action performance standards.
9 - 15
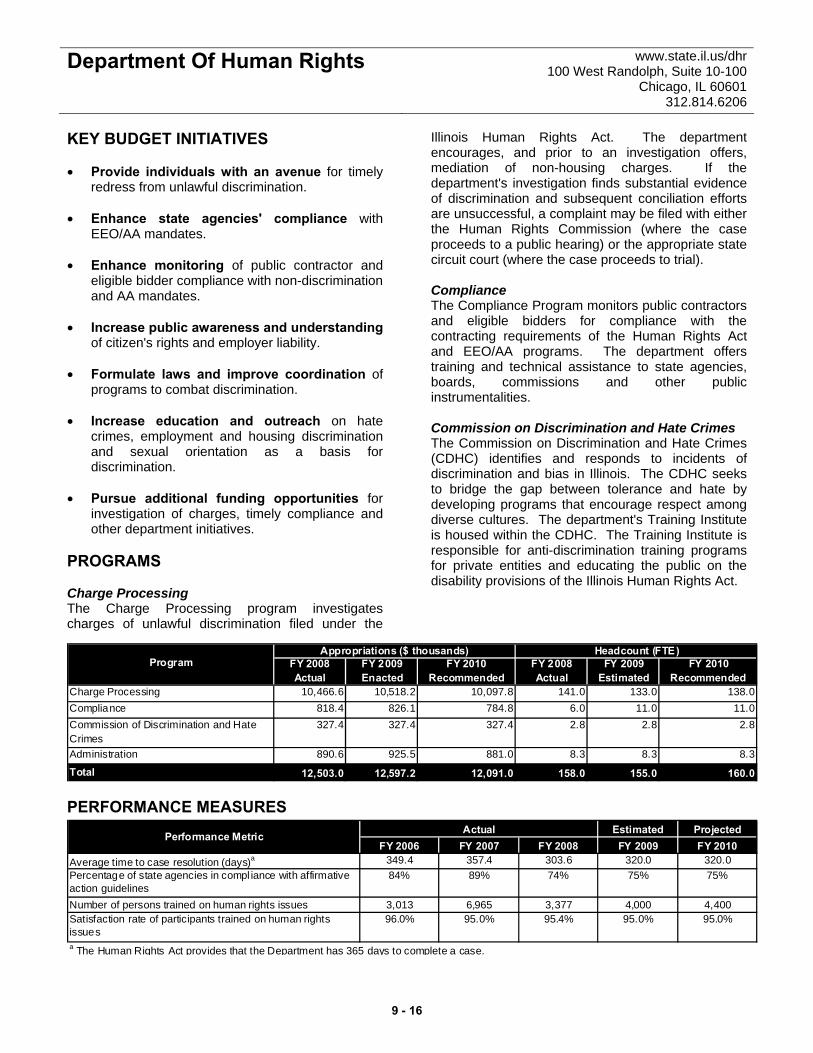
Department Of Human Rights www.state.il.us/dhr 100 West Randolph, Suite 10-100
Chicago, IL 60601 312.814.6206
KEY BUDGET INITIATIVES • Provide individuals with an avenue for timely
redress from unlawful discrimination. • Enhance state agencies' compliance with
EEO/AA mandates. • Enhance monitoring of public contractor and
eligible bidder compliance with non-discrimination and AA mandates.
• Increase public awareness and understanding
of citizen's rights and employer liability. • Formulate laws and improve coordination of
programs to combat discrimination. • Increase education and outreach on hate
crimes, employment and housing discrimination and sexual orientation as a basis for discrimination.
• Pursue additional funding opportunities for
investigation of charges, timely compliance and other department initiatives.
PROGRAMS Charge Processing The Charge Processing program investigates charges of unlawful discrimination filed under the
Illinois Human Rights Act. The department encourages, and prior to an investigation offers, mediation of non-housing charges. If the department's investigation finds substantial evidence of discrimination and subsequent conciliation efforts are unsuccessful, a complaint may be filed with either the Human Rights Commission (where the case proceeds to a public hearing) or the appropriate state circuit court (where the case proceeds to trial). Compliance The Compliance Program monitors public contractors and eligible bidders for compliance with the contracting requirements of the Human Rights Act and EEO/AA programs. The department offers training and technical assistance to state agencies, boards, commissions and other public instrumentalities. Commission on Discrimination and Hate Crimes The Commission on Discrimination and Hate Crimes (CDHC) identifies and responds to incidents of discrimination and bias in Illinois. The CDHC seeks to bridge the gap between tolerance and hate by developing programs that encourage respect among diverse cultures. The department's Training Institute is housed within the CDHC. The Training Institute is responsible for anti-discrimination training programs for private entities and educating the public on the disability provisions of the Illinois Human Rights Act.
Program FY 2008 FY 2009 FY 2010 FY 2008 FY 2009 FY 2010Actual Enacted Recommended Actual Estimated Recommended
Charge Processing 10,466.6 10,518.2 10,097.8 141.0 133.0 138.0Compliance 818.4 826.1 784.8 6.0 11.0 11.0Commission of Discrimination and Hate Crimes
327.4 327.4 327.4 2.8 2.8 2.8
Administration 890.6 925.5 881.0 8.3 8.3 8.3
Total 12,503.0 12,597.2 12,091.0 158.0 155.0 160.0
Appropriations ($ thousands) Headcount (FTE)
PERFORMANCE MEASURES Estimated Projected
FY 2006 FY 2007 FY 2008 FY 2009 FY 2010Average time to case resolution (days)a 349.4 357.4 303.6 320.0 320.0Percentage of state agencies in compl iance with affirmative action guidelines
84% 89% 74% 75% 75%
Number of persons trained on human rights issues 3,013 6,965 3,377 4,000 4,400Satisfaction rate of participants trained on human rights issues
96.0% 95.0% 95.4% 95.0% 95.0%
ActualPerformance Metric
a The Human Rights Act provides that the Department has 365 days to complete a case.
9 - 16

GENERAL FUNDS
Total 7,664.3 7,340.57,738.37,738.37,647.2Personal Services and Fringe Benefits
Total 228.4 186.8186.8186.8228.4Contractual Services
Total 179.8 221.4221.4221.4179.7Other Operations and Refunds
Designated Purposes155.0 155.00.0155.0155.0For Funding Expenses Associated with the Commission
on Discrimination and Hate Crimes1,520.3 1,520.31,380.61,520.31,520.3Reducing the Number of Open Equal Employment
Opportunity CasesTotal 1,675.3 1,675.31,380.61,675.31,675.3Designated Purposes
TOTAL GENERAL FUNDS 9,747.8 9,424.09,527.19,821.89,730.6
FEDERAL FUNDS
Total 2,502.5 2,414.32,522.72,522.71,773.0Personal Services and Fringe Benefits
Total 211.0 183.0183.0183.0200.1Contractual Services
Total 41.7 69.769.769.741.0Other Operations and Refunds
TOTAL FEDERAL FUNDS 2,755.2 2,667.02,775.42,775.42,014.1
TOTAL ALL FUNDS 12,503.0 12,091.012,302.512,597.211,744.7
BY FUND
9,747.8 9,424.09,527.19,821.89,730.6General Revenue Fund
2,755.2 2,667.02,775.42,775.42,014.1Special Projects Division Fund
TOTAL ALL FUNDS 12,503.0 12,091.012,302.512,597.211,744.7
BY DIVISION
1,218.0 1,208.41,097.91,252.91,216.7Administration
10,466.6 10,097.810,378.510,518.29,712.9Charge Processing
818.4 784.8826.1826.1815.2Compliance
TOTAL ALL DIVISIONS 12,503.0 12,091.012,302.512,597.211,744.7
HEADCOUNT BY DIVISION Actual Estimated Authorized
11.0 11.011.0Administration
141.0 138.0133.0Charge Processing
6.0 11.011.0Compliance
TOTAL HEADCOUNT 158.0 160.0155.0 t
ActualExpenditure
EnactedAppropriation
EstimatedExpenditures
EnactedAppropriation
Fiscal Year2010
RecommendedAppropriation
Fiscal Year 2008 Fiscal Year 2009
Department Of Human Rights www.state.il.us/dhr100 West Randolph, Suite 10-100
Chicago, IL 60601312.814.6206
Appropriations Requiring General Assembly Action($ thousands)
9 - 17

Human Rights Commission http://www.state.il.us/ihrc/ 100 W. Randolph Street, Suite 5-100
Chicago, IL 60601 312-814-6269
OVERVIEW Agency Mission To protect residents of Illinois from unlawful discrimination by enforcing the Illinois Human Rights Act and providing an impartial forum to resolve complaints. Strategic Priorities • Enforce the Illinois Human Rights Act. • Provide effective and efficient service to the
public. Summary of Agency Operations The primary responsibility of the Human Rights Commission (HRC) is to adjudicate complaints of unlawful discrimination filed under the Illinois Human Rights Act. HRC also rules on Requests for Review filed after dismissal or default orders are entered by the Illinois Department of Human Rights. Agency Resources Employed
FY 2008 FY 2009 FY 2010Actual Enacted Recommended
General Funds 1,694.4 2,405.1 2,242.7Other State Funds 0.0 0.0 0.0
Federal Funds 100.0 100.0 100.0Total 1,794.4 2,505.1 2,342.7
Actual Estimated RecommendedHeadcount (FTE) 33.0 35.0 38.0
Appropriations ($ thousands)Fund Category
MAJOR ACCOMPLISHMENTS • Increased public access to commission orders
and decisions by posting them on HRC's website on a quarterly basis.
• Continued success in the Governor Edward
Coles Memorial Fellowship for first and second year law students.
• Continued efficient coordination with the
Illinois Department of Human Rights. KEY BUDGET INITIATIVES • Successfully implement the Request for
Review process. • Increase emphasis on Alternative Dispute
Resolution. • Decrease the amount of active cases on docket. • Expedite public hearing schedules. • Enhance cross training of staff.
PERFORMANCE MEASURES Estimated Projected
FY 2006 FY 2007 FY 2008 FY 2009 FY 2010Total number of complaints and defaults 251 612a 794b 450 400c
Number of commission cases closed by Settlement or Commission Final Order
328 272 300 689 800
ActualPerformance Metric
a Funding in fiscal year 2009 has been increased to address this increase in caseload.b Funding in fiscal year 2009 has been increased to address this increase in caseload.c Funding is available to address this matter.
9 - 18
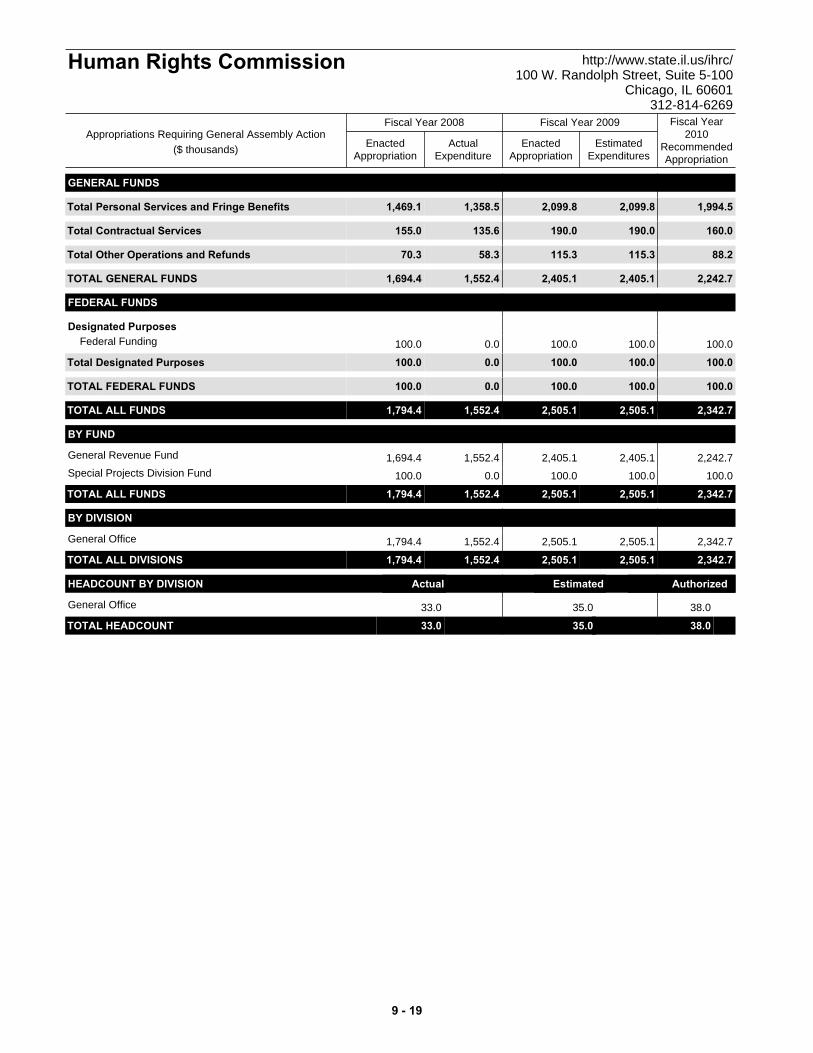
GENERAL FUNDS
Total 1,469.1 1,994.52,099.82,099.81,358.5Personal Services and Fringe Benefits
Total 155.0 160.0190.0190.0135.6Contractual Services
Total 70.3 88.2115.3115.358.3Other Operations and Refunds
TOTAL GENERAL FUNDS 1,694.4 2,242.72,405.12,405.11,552.4
FEDERAL FUNDS
Designated Purposes100.0 100.0100.0100.00.0Federal Funding
Total 100.0 100.0100.0100.00.0Designated Purposes
TOTAL FEDERAL FUNDS 100.0 100.0100.0100.00.0
TOTAL ALL FUNDS 1,794.4 2,342.72,505.12,505.11,552.4
BY FUND
1,694.4 2,242.72,405.12,405.11,552.4General Revenue Fund
100.0 100.0100.0100.00.0Special Projects Division Fund
TOTAL ALL FUNDS 1,794.4 2,342.72,505.12,505.11,552.4
BY DIVISION
1,794.4 2,342.72,505.12,505.11,552.4General Office
TOTAL ALL DIVISIONS 1,794.4 2,342.72,505.12,505.11,552.4
HEADCOUNT BY DIVISION Actual Estimated Authorized
33.0 38.035.0General Office
TOTAL HEADCOUNT 33.0 38.035.0 t
ActualExpenditure
EnactedAppropriation
EstimatedExpenditures
EnactedAppropriation
Fiscal Year2010
RecommendedAppropriation
Fiscal Year 2008 Fiscal Year 2009
Human Rights Commission http://www.state.il.us/ihrc/100 W. Randolph Street, Suite 5-100
Chicago, IL 60601312-814-6269
Appropriations Requiring General Assembly Action($ thousands)
9 - 19
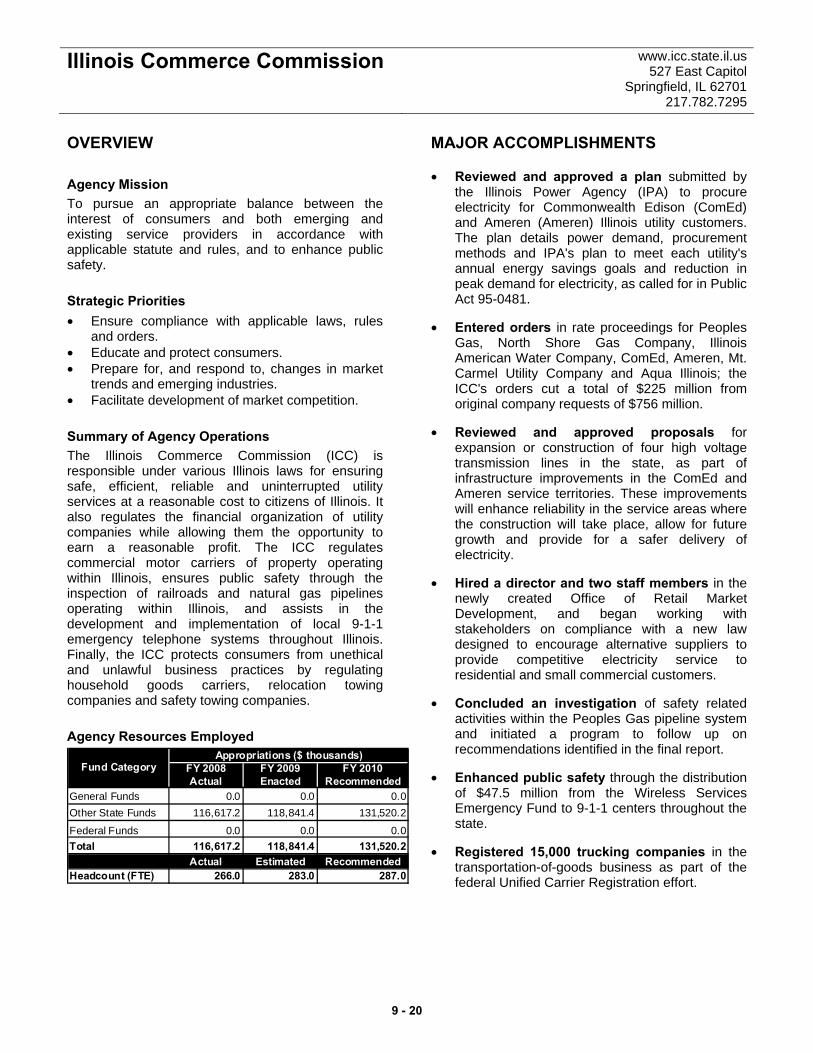
Illinois Commerce Commission www.icc.state.il.us 527 East Capitol
Springfield, IL 62701 217.782.7295
OVERVIEW Agency Mission To pursue an appropriate balance between the interest of consumers and both emerging and existing service providers in accordance with applicable statute and rules, and to enhance public safety. Strategic Priorities • Ensure compliance with applicable laws, rules
and orders. • Educate and protect consumers. • Prepare for, and respond to, changes in market
trends and emerging industries. • Facilitate development of market competition. Summary of Agency Operations The Illinois Commerce Commission (ICC) is responsible under various Illinois laws for ensuring safe, efficient, reliable and uninterrupted utility services at a reasonable cost to citizens of Illinois. It also regulates the financial organization of utility companies while allowing them the opportunity to earn a reasonable profit. The ICC regulates commercial motor carriers of property operating within Illinois, ensures public safety through the inspection of railroads and natural gas pipelines operating within Illinois, and assists in the development and implementation of local 9-1-1 emergency telephone systems throughout Illinois. Finally, the ICC protects consumers from unethical and unlawful business practices by regulating household goods carriers, relocation towing companies and safety towing companies. Agency Resources Employed
FY 2008 FY 2009 FY 2010Actual Enacted Recommended
General Funds 0.0 0.0 0.0Other State Funds 116,617.2 118,841.4 131,520.2
Federal Funds 0.0 0.0 0.0Total 116,617.2 118,841.4 131,520.2
Actual Estimated RecommendedHeadcount (FTE) 266.0 283.0 287.0
Appropriations ($ thousands)Fund Category
MAJOR ACCOMPLISHMENTS • Reviewed and approved a plan submitted by
the Illinois Power Agency (IPA) to procure electricity for Commonwealth Edison (ComEd) and Ameren (Ameren) Illinois utility customers. The plan details power demand, procurement methods and IPA's plan to meet each utility's annual energy savings goals and reduction in peak demand for electricity, as called for in Public Act 95-0481.
• Entered orders in rate proceedings for Peoples
Gas, North Shore Gas Company, Illinois American Water Company, ComEd, Ameren, Mt. Carmel Utility Company and Aqua Illinois; the ICC's orders cut a total of $225 million from original company requests of $756 million.
• Reviewed and approved proposals for
expansion or construction of four high voltage transmission lines in the state, as part of infrastructure improvements in the ComEd and Ameren service territories. These improvements will enhance reliability in the service areas where the construction will take place, allow for future growth and provide for a safer delivery of electricity.
• Hired a director and two staff members in the
newly created Office of Retail Market Development, and began working with stakeholders on compliance with a new law designed to encourage alternative suppliers to provide competitive electricity service to residential and small commercial customers.
• Concluded an investigation of safety related
activities within the Peoples Gas pipeline system and initiated a program to follow up on recommendations identified in the final report.
• Enhanced public safety through the distribution
of $47.5 million from the Wireless Services Emergency Fund to 9-1-1 centers throughout the state.
• Registered 15,000 trucking companies in the
transportation-of-goods business as part of the federal Unified Carrier Registration effort.
9 - 20
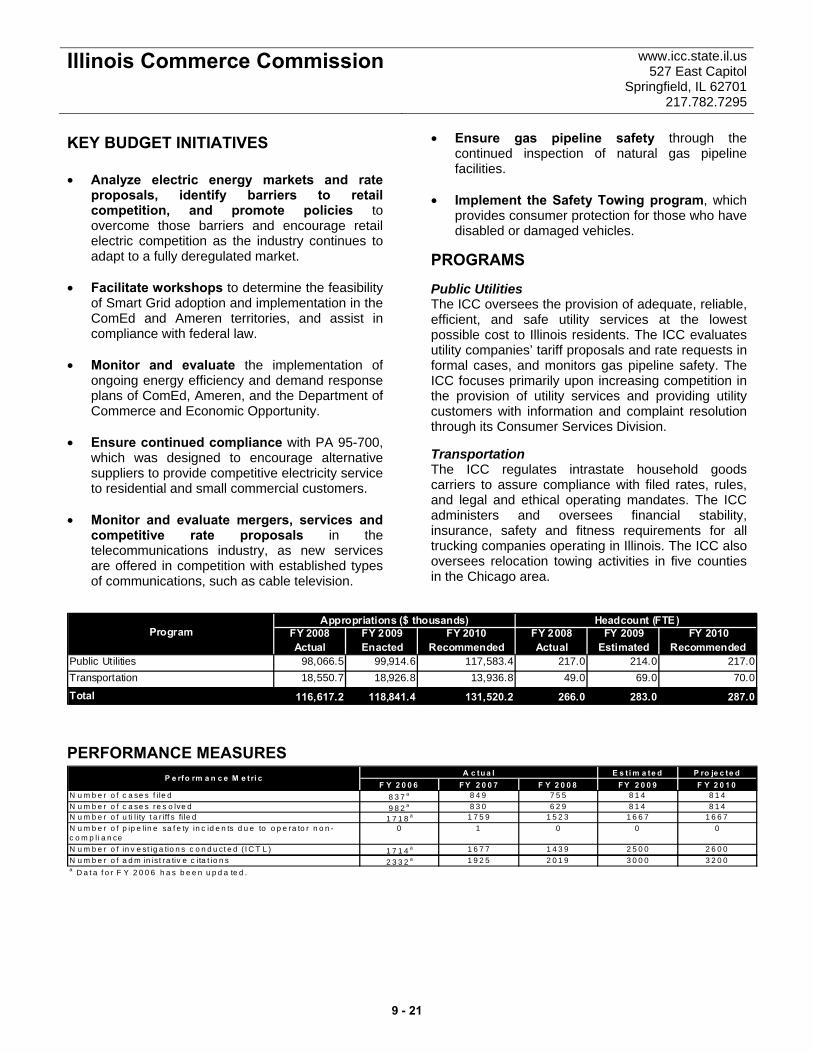
Illinois Commerce Commission www.icc.state.il.us 527 East Capitol
Springfield, IL 62701 217.782.7295
KEY BUDGET INITIATIVES • Analyze electric energy markets and rate
proposals, identify barriers to retail competition, and promote policies to overcome those barriers and encourage retail electric competition as the industry continues to adapt to a fully deregulated market.
• Facilitate workshops to determine the feasibility
of Smart Grid adoption and implementation in the ComEd and Ameren territories, and assist in compliance with federal law.
• Monitor and evaluate the implementation of
ongoing energy efficiency and demand response plans of ComEd, Ameren, and the Department of Commerce and Economic Opportunity.
• Ensure continued compliance with PA 95-700,
which was designed to encourage alternative suppliers to provide competitive electricity service to residential and small commercial customers.
• Monitor and evaluate mergers, services and
competitive rate proposals in the telecommunications industry, as new services are offered in competition with established types of communications, such as cable television.
• Ensure gas pipeline safety through the continued inspection of natural gas pipeline facilities.
• Implement the Safety Towing program, which
provides consumer protection for those who have disabled or damaged vehicles.
PROGRAMS Public Utilities The ICC oversees the provision of adequate, reliable, efficient, and safe utility services at the lowest possible cost to Illinois residents. The ICC evaluates utility companies’ tariff proposals and rate requests in formal cases, and monitors gas pipeline safety. The ICC focuses primarily upon increasing competition in the provision of utility services and providing utility customers with information and complaint resolution through its Consumer Services Division. Transportation The ICC regulates intrastate household goods carriers to assure compliance with filed rates, rules, and legal and ethical operating mandates. The ICC administers and oversees financial stability, insurance, safety and fitness requirements for all trucking companies operating in Illinois. The ICC also oversees relocation towing activities in five counties in the Chicago area.
Program FY 2008 FY 2009 FY 2010 FY 2008 FY 2009 FY 2010Actual Enacted Recommended Actual Estimated Recommended
Public Utilities 98,066.5 99,914.6 117,583.4 217.0 214.0 217.0Transportation 18,550.7 18,926.8 13,936.8 49.0 69.0 70.0
Total 116,617.2 118,841.4 131,520.2 266.0 283.0 287.0
Appropriations ($ thousands) Headcount (FTE)
PERFORMANCE MEASURES
E s ti m a te d P ro je c te dF Y 2 0 0 6 F Y 2 0 0 7 F Y 2 0 0 8 F Y 2 0 0 9 F Y 2 0 1 0
N u m b e r o f c a se s f ile d 8 3 7 a 8 4 9 7 5 5 8 1 4 8 1 4N u m b e r o f c a se s re s o lve d 9 8 2 a 8 3 0 6 2 9 8 1 4 8 1 4N u m b e r o f u ti l ity t a r iff s fi le d 1 7 1 8 a 1 7 5 9 1 5 2 3 1 6 6 7 1 6 6 7N u m b e r o f p ip e lin e sa f e ty in c id e n ts d u e to o p e ra to r n o n -c o m p li a n ce
0 1 0 0 0
N u m b e r o f in v e st ig a tio n s c o n d u ct e d ( I C T L ) 1 7 1 4 a 1 6 7 7 1 4 3 9 2 5 0 0 2 6 0 0N u m b e r o f a d m in ist ra tiv e c ita t io n s 2 3 3 2 a 1 9 2 5 2 0 1 9 3 0 0 0 3 2 0 0
A c tu a lP e rfo rm a n c e M e tri c
a D a t a f o r F Y 2 0 0 6 h a s b e e n u p d a te d .
9 - 21
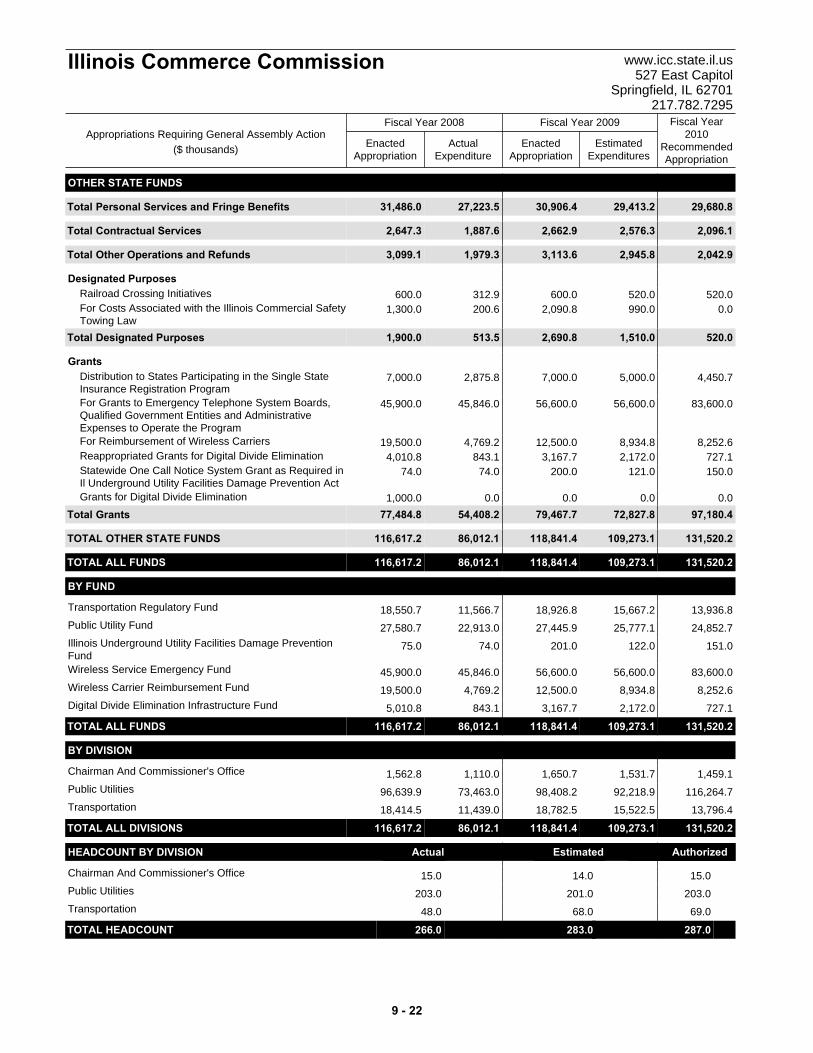
OTHER STATE FUNDS
Total 31,486.0 29,680.829,413.230,906.427,223.5Personal Services and Fringe Benefits
Total 2,647.3 2,096.12,576.32,662.91,887.6Contractual Services
Total 3,099.1 2,042.92,945.83,113.61,979.3Other Operations and Refunds
Designated Purposes600.0 520.0520.0600.0312.9Railroad Crossing Initiatives
1,300.0 0.0990.02,090.8200.6For Costs Associated with the Illinois Commercial SafetyTowing Law
Total 1,900.0 520.01,510.02,690.8513.5Designated Purposes
Grants7,000.0 4,450.75,000.07,000.02,875.8Distribution to States Participating in the Single State
Insurance Registration Program45,900.0 83,600.056,600.056,600.045,846.0For Grants to Emergency Telephone System Boards,
Qualified Government Entities and AdministrativeExpenses to Operate the Program
19,500.0 8,252.68,934.812,500.04,769.2For Reimbursement of Wireless Carriers 4,010.8 727.12,172.03,167.7843.1Reappropriated Grants for Digital Divide Elimination
74.0 150.0121.0200.074.0Statewide One Call Notice System Grant as Required inIl Underground Utility Facilities Damage Prevention Act
1,000.0 0.00.00.00.0Grants for Digital Divide Elimination
Total 77,484.8 97,180.472,827.879,467.754,408.2Grants
TOTAL OTHER STATE FUNDS 116,617.2 131,520.2109,273.1118,841.486,012.1
TOTAL ALL FUNDS 116,617.2 131,520.2109,273.1118,841.486,012.1
BY FUND
18,550.7 13,936.815,667.218,926.811,566.7Transportation Regulatory Fund
27,580.7 24,852.725,777.127,445.922,913.0Public Utility Fund
75.0 151.0122.0201.074.0Illinois Underground Utility Facilities Damage PreventionFund
45,900.0 83,600.056,600.056,600.045,846.0Wireless Service Emergency Fund
19,500.0 8,252.68,934.812,500.04,769.2Wireless Carrier Reimbursement Fund
5,010.8 727.12,172.03,167.7843.1Digital Divide Elimination Infrastructure Fund
TOTAL ALL FUNDS 116,617.2 131,520.2109,273.1118,841.486,012.1
BY DIVISION
1,562.8 1,459.11,531.71,650.71,110.0Chairman And Commissioner's Office
96,639.9 116,264.792,218.998,408.273,463.0Public Utilities
18,414.5 13,796.415,522.518,782.511,439.0Transportation
TOTAL ALL DIVISIONS 116,617.2 131,520.2109,273.1118,841.486,012.1
HEADCOUNT BY DIVISION Actual Estimated Authorized
15.0 15.014.0Chairman And Commissioner's Office
203.0 203.0201.0Public Utilities
48.0 69.068.0Transportation
TOTAL HEADCOUNT 266.0 287.0283.0 t
ActualExpenditure
EnactedAppropriation
EstimatedExpenditures
EnactedAppropriation
Fiscal Year2010
RecommendedAppropriation
Fiscal Year 2008 Fiscal Year 2009
Illinois Commerce Commission www.icc.state.il.us527 East Capitol
Springfield, IL 62701217.782.7295
Appropriations Requiring General Assembly Action($ thousands)
9 - 22
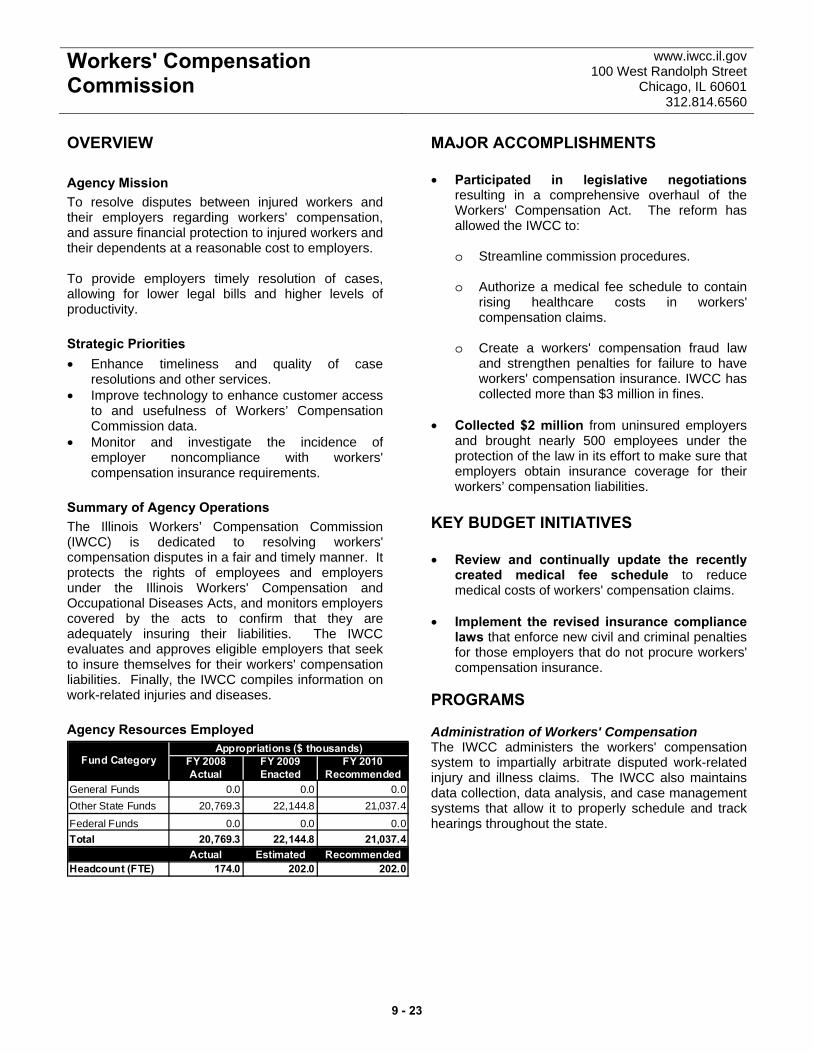
Workers' Compensation Commission
www.iwcc.il.gov 100 West Randolph Street
Chicago, IL 60601 312.814.6560
OVERVIEW Agency Mission To resolve disputes between injured workers and their employers regarding workers' compensation, and assure financial protection to injured workers and their dependents at a reasonable cost to employers. To provide employers timely resolution of cases, allowing for lower legal bills and higher levels of productivity. Strategic Priorities • Enhance timeliness and quality of case
resolutions and other services. • Improve technology to enhance customer access
to and usefulness of Workers’ Compensation Commission data.
• Monitor and investigate the incidence of employer noncompliance with workers' compensation insurance requirements.
Summary of Agency Operations The Illinois Workers’ Compensation Commission (IWCC) is dedicated to resolving workers' compensation disputes in a fair and timely manner. It protects the rights of employees and employers under the Illinois Workers' Compensation and Occupational Diseases Acts, and monitors employers covered by the acts to confirm that they are adequately insuring their liabilities. The IWCC evaluates and approves eligible employers that seek to insure themselves for their workers' compensation liabilities. Finally, the IWCC compiles information on work-related injuries and diseases. Agency Resources Employed
FY 2008 FY 2009 FY 2010Actual Enacted Recommended
General Funds 0.0 0.0 0.0Other State Funds 20,769.3 22,144.8 21,037.4
Federal Funds 0.0 0.0 0.0Total 20,769.3 22,144.8 21,037.4
Actual Estimated RecommendedHeadcount (FTE) 174.0 202.0 202.0
Appropriations ($ thousands)Fund Category
MAJOR ACCOMPLISHMENTS • Participated in legislative negotiations
resulting in a comprehensive overhaul of the Workers' Compensation Act. The reform has allowed the IWCC to:
o Streamline commission procedures. o Authorize a medical fee schedule to contain
rising healthcare costs in workers' compensation claims.
o Create a workers' compensation fraud law
and strengthen penalties for failure to have workers' compensation insurance. IWCC has collected more than $3 million in fines.
• Collected $2 million from uninsured employers
and brought nearly 500 employees under the protection of the law in its effort to make sure that employers obtain insurance coverage for their workers’ compensation liabilities.
KEY BUDGET INITIATIVES • Review and continually update the recently
created medical fee schedule to reduce medical costs of workers' compensation claims.
• Implement the revised insurance compliance
laws that enforce new civil and criminal penalties for those employers that do not procure workers' compensation insurance.
PROGRAMS Administration of Workers' Compensation The IWCC administers the workers' compensation system to impartially arbitrate disputed work-related injury and illness claims. The IWCC also maintains data collection, data analysis, and case management systems that allow it to properly schedule and track hearings throughout the state.
9 - 23

Workers' Compensation Commission
www.iwcc.il.gov 100 West Randolph Street
Chicago, IL 60601 312.814.6560
Education and Information The IWCC prints and distributes to employers and workers free information handbooks informing them of their rights and obligations under the Workers' Compensation Act. These publications are also available on the commission Web site.
Accident Reporting The IWCC collects, analyzes, and publishes aggregate statistics associated with work-related injuries and illnesses.
Program FY 2008 FY 2009 FY 2010 FY 2008 FY 2009 FY 2010Actual Enacted Recommended Actual Estimated Recommended
Administration of Workers' Compensation 19,243.4 20,621.8 19,514.4 168.0 187.0 187.0
Education and Information 118.0 118.0 118.0 0.0 0.0 0.0Accident Reporting 255.0 255.0 255.0 2.0 3.0 3.0Anti-Fraud Program 1,152.9 1,150.0 1,150.0 4.0 12.0 12.0
Total 20,769.3 22,144.8 21,037.4 174.0 202.0 202.0
Appropriations ($ thousands) Headcount (FTE)
PERFORMANCE MEASURES Estimated Projected
FY 2006 FY 2007 FY 2008 FY 2009 FY 2010Average time to resolve regular cases by arbitrators (months) 36 35 33 33 34
Average time to resolve emergency cases by arbitrators (months)
7 7 7 7 8
Percent case load reduction since fiscal year 2003 10.2% 11.7% 11.7% 11.7% 12.5%Number of cases filed more than 3 years agoa 16,500 16,000 16,000 16,000 16,000Number of Arbitrator decisions resulting from formal hearings 3,890 3,640 3,500 3,400 3,600
Number of Web site hits regarding case sta tus 707,701 800,000 850,000 900,000 900,000Amount of fines collected for Workers' Compensation Insurance Compliance ($000)
$100 $1,300 $2,000 $2,000 $1,000
ActualPerformance Metric
a This metric reports on progess in reducing backlog.
9 - 24
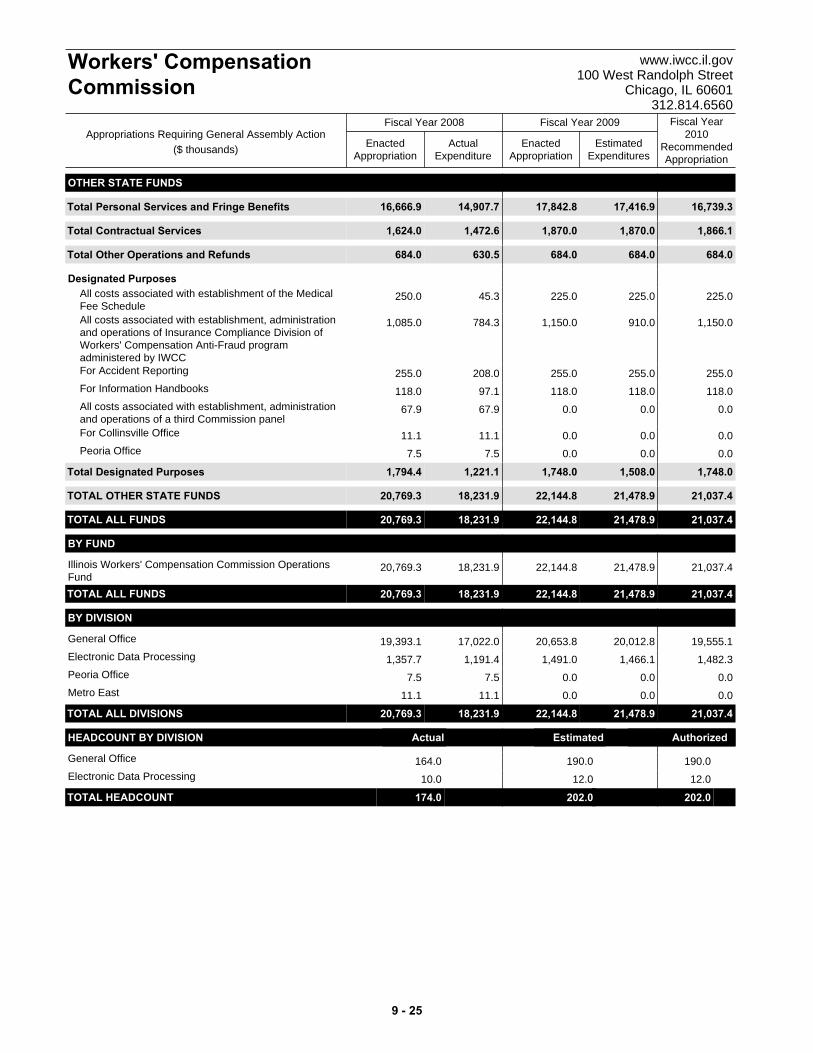
OTHER STATE FUNDS
Total 16,666.9 16,739.317,416.917,842.814,907.7Personal Services and Fringe Benefits
Total 1,624.0 1,866.11,870.01,870.01,472.6Contractual Services
Total 684.0 684.0684.0684.0630.5Other Operations and Refunds
Designated Purposes250.0 225.0225.0225.045.3All costs associated with establishment of the Medical
Fee Schedule1,085.0 1,150.0910.01,150.0784.3All costs associated with establishment, administration
and operations of Insurance Compliance Division ofWorkers' Compensation Anti-Fraud programadministered by IWCC
255.0 255.0255.0255.0208.0For Accident Reporting
118.0 118.0118.0118.097.1For Information Handbooks
67.9 0.00.00.067.9All costs associated with establishment, administrationand operations of a third Commission panel
11.1 0.00.00.011.1For Collinsville Office
7.5 0.00.00.07.5Peoria Office
Total 1,794.4 1,748.01,508.01,748.01,221.1Designated Purposes
TOTAL OTHER STATE FUNDS 20,769.3 21,037.421,478.922,144.818,231.9
TOTAL ALL FUNDS 20,769.3 21,037.421,478.922,144.818,231.9
BY FUND
20,769.3 21,037.421,478.922,144.818,231.9Illinois Workers' Compensation Commission OperationsFundTOTAL ALL FUNDS 20,769.3 21,037.421,478.922,144.818,231.9
BY DIVISION
19,393.1 19,555.120,012.820,653.817,022.0General Office
1,357.7 1,482.31,466.11,491.01,191.4Electronic Data Processing
7.5 0.00.00.07.5Peoria Office
11.1 0.00.00.011.1Metro East
TOTAL ALL DIVISIONS 20,769.3 21,037.421,478.922,144.818,231.9
HEADCOUNT BY DIVISION Actual Estimated Authorized
164.0 190.0190.0General Office
10.0 12.012.0Electronic Data Processing
TOTAL HEADCOUNT 174.0 202.0202.0 t
ActualExpenditure
EnactedAppropriation
EstimatedExpenditures
EnactedAppropriation
Fiscal Year2010
RecommendedAppropriation
Fiscal Year 2008 Fiscal Year 2009
Workers' CompensationCommission
www.iwcc.il.gov100 West Randolph Street
Chicago, IL 60601312.814.6560
Appropriations Requiring General Assembly Action($ thousands)
9 - 25

Department Of Insurance http://www.idfpr.com/DOI/default2.asp 320 W. Washington Street
Springfield, IL 62767 217-782-4515
OVERVIEW In March, 2009, Governor Quinn will re-establish the Department of Insurance from the Division of Insurance by Executive Order. Governor Quinn makes this change in recognition of the need to emphasize and raise the profile for important consumer protections. Re-establishing the department also recognizes the important economic role of the insurance industry domiciled in Illinois. Agency Mission To protect consumers by monitoring and ensuring the solvency of Illinois-based insurance companies; to make certain that insurance companies and producers adhere to state insurance laws and regulations; and work with insurance regulators from other states to maintain and enhance the efficiency of state-based insurance regulation. Strategic Priorities • Adapt resources and regulation to protect
consumers in an ever-changing insurance marketplace.
• Enhance institutional expertise so that the department can independently regulate insurer financial status and marketplace conduct.
• Collect, compile and report information to the General Assembly and the governor so that Illinois law adapts to the ever-changing insurance marketplace.
• Promote a competitive insurance marketplace. • Provide national leadership among state
insurance regulators through the National Association of Insurance Commissioners (NAIC).
Summary of Agency Operations The Department of Insurance (DOI) oversees the regulation and licensure of insurance companies and producers. DOI protects the rights of all Illinois residents in their transactions with the insurance industry, consistently applies regulatory standards and procedures, and enforces standards of professional practice and conduct.
Agency Resources Employed
FY 2008 FY 2009 FY 2010Actual Enacted Recommended
General Funds 0.0 0.0 0.0Other State Funds 21,487.5 21,406.1 19,944.5
Federal Funds 800.0 800.0 800.0Total 22,287.5 22,206.1 20,744.5
Actual Estimated RecommendedHeadcount (FTE) 228.0 228.0 228.0
Appropriations ($ thousands)Fund Category
MAJOR ACCOMPLISHMENTS • Aided tens of thousands of consumers with
health, home, life, auto and business-related insurance issues. Investigated insurers and recovered fines on behalf of policyholders.
• Aided the General Assembly drafting and
adopting health insurance reform legislation. Implemented law making Medicare supplement available to people with disabilities.
• Led state insurance regulators in an effort to
resist federal deregulation of the insurance industry.
KEY BUDGET INITIATIVES • Effectively perform consumer protection and
functional regulatory duties. Serve seniors by assisting with Medicare decision-making and the application process.
• Comply with new pension regulatory reform
law. Enhance technological capabilities to improve service capacity.
• Enhance examination capacities. PROGRAMS Financial/Corporate Regulation On behalf of and along side other states, DOI performs regular financial examinations and audits of Illinois’ 371 domestic insurance companies and other regulated entities, and ensures compliance with applicable statutory and accounting requirements. On behalf of Illinois consumers, DOI regularly examines company compliance with market conduct standards, i.e., whether an insurer treats a consumer fairly. DOI authorizes the formation, sales, and other transactions involving an insurance company.
9 - 26
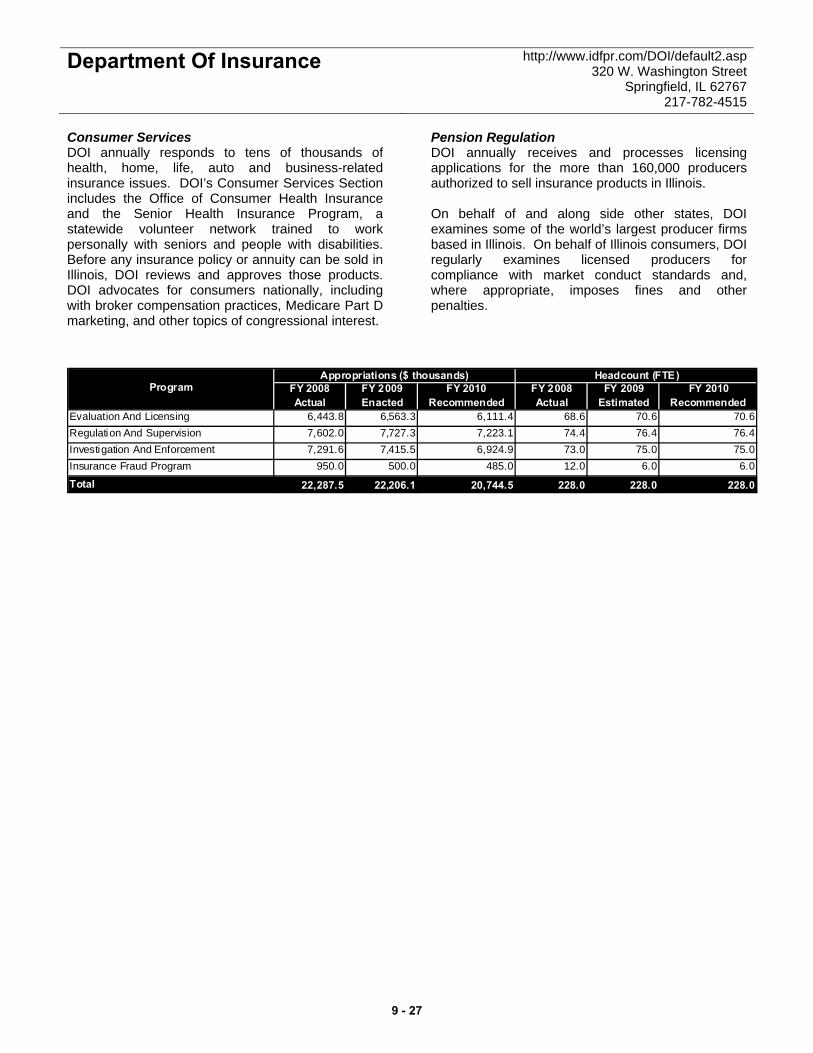
Department Of Insurance http://www.idfpr.com/DOI/default2.asp 320 W. Washington Street
Springfield, IL 62767 217-782-4515
Consumer Services DOI annually responds to tens of thousands of health, home, life, auto and business-related insurance issues. DOI’s Consumer Services Section includes the Office of Consumer Health Insurance and the Senior Health Insurance Program, a statewide volunteer network trained to work personally with seniors and people with disabilities. Before any insurance policy or annuity can be sold in Illinois, DOI reviews and approves those products. DOI advocates for consumers nationally, including with broker compensation practices, Medicare Part D marketing, and other topics of congressional interest.
Pension Regulation DOI annually receives and processes licensing applications for the more than 160,000 producers authorized to sell insurance products in Illinois. On behalf of and along side other states, DOI examines some of the world’s largest producer firms based in Illinois. On behalf of Illinois consumers, DOI regularly examines licensed producers for compliance with market conduct standards and, where appropriate, imposes fines and other penalties.
Program FY 2008 FY 2009 FY 2010 FY 2008 FY 2009 FY 2010Actual Enacted Recommended Actual Estimated Recommended
Evaluation And Licensing 6,443.8 6,563.3 6,111.4 68.6 70.6 70.6Regulation And Supervision 7,602.0 7,727.3 7,223.1 74.4 76.4 76.4Investigation And Enforcement 7,291.6 7,415.5 6,924.9 73.0 75.0 75.0Insurance Fraud Program 950.0 500.0 485.0 12.0 6.0 6.0
Total 22,287.5 22,206.1 20,744.5 228.0 228.0 228.0
Appropriations ($ thousands) Headcount (FTE)
9 - 27

OTHER STATE FUNDS
Total 19,150.5 18,322.619,544.119,544.117,261.8Personal Services and Fringe Benefits
Total 650.6 497.3512.6662.6341.7Contractual Services
Total 736.4 639.6659.4699.4330.3Other Operations and Refunds
Designated Purposes950.0 485.0350.0500.0271.6All Costs Associated with the Establishment,
Administration and Operations of the Insurance FraudDivision of the Workers' Compensation Anti-FraudProgram Administered by DFPR's Division of Insurance
Total 950.0 485.0350.0500.0271.6Designated Purposes
TOTAL OTHER STATE FUNDS 21,487.5 19,944.521,066.121,406.118,205.4
FEDERAL FUNDS
Designated Purposes800.0 800.0624.0800.0542.3Administration of the Senior Health Insurance Program
Total 800.0 800.0624.0800.0542.3Designated Purposes
TOTAL FEDERAL FUNDS 800.0 800.0624.0800.0542.3
TOTAL ALL FUNDS 22,287.5 20,744.521,690.122,206.118,747.7
BY FUND
800.0 800.0624.0800.0542.3Senior Health Insurance Program Fund
950.0 485.0350.0500.0271.6Illinois Workers' Compensation Commission OperationsFund
936.6 927.3971.5971.5863.8Public Pension Regulation Fund
8,264.9 7,922.48,379.38,429.37,063.3Insurance Producer Administration Fund
11,336.0 10,609.811,365.311,505.310,006.8Insurance Financial Regulation Fund
TOTAL ALL FUNDS 22,287.5 20,744.521,690.122,206.118,747.7
BY DIVISION
8,264.9 7,922.48,379.38,429.37,063.3Insurance Producer Administration
11,336.0 10,609.811,365.311,505.310,006.8Insurance Financial Regulation
800.0 800.0624.0800.0542.3Senior Health Insurance
936.6 927.3971.5971.5863.8Public Pension
950.0 485.0350.0500.0271.6Workers' Compensation Anti-Fraud
TOTAL ALL DIVISIONS 22,287.5 20,744.521,690.122,206.118,747.7
HEADCOUNT BY DIVISION Actual Estimated Authorized
92.0 96.094.0Insurance Producer Administration
114.0 116.0118.0Insurance Financial Regulation
1.0 0.00.0Senior Health Insurance
9.0 10.010.0Public Pension
12.0 6.06.0Workers' Compensation Anti-Fraud
TOTAL HEADCOUNT 228.0 228.0228.0 t
ActualExpenditure
EnactedAppropriation
EstimatedExpenditures
EnactedAppropriation
Fiscal Year2010
RecommendedAppropriation
Fiscal Year 2008 Fiscal Year 2009
Department Of Insurance http://www.idfpr.com/DOI/default2.asp320 W. Washington Street
Springfield, IL 62767217-782-4515
Appropriations Requiring General Assembly Action($ thousands)
9 - 28
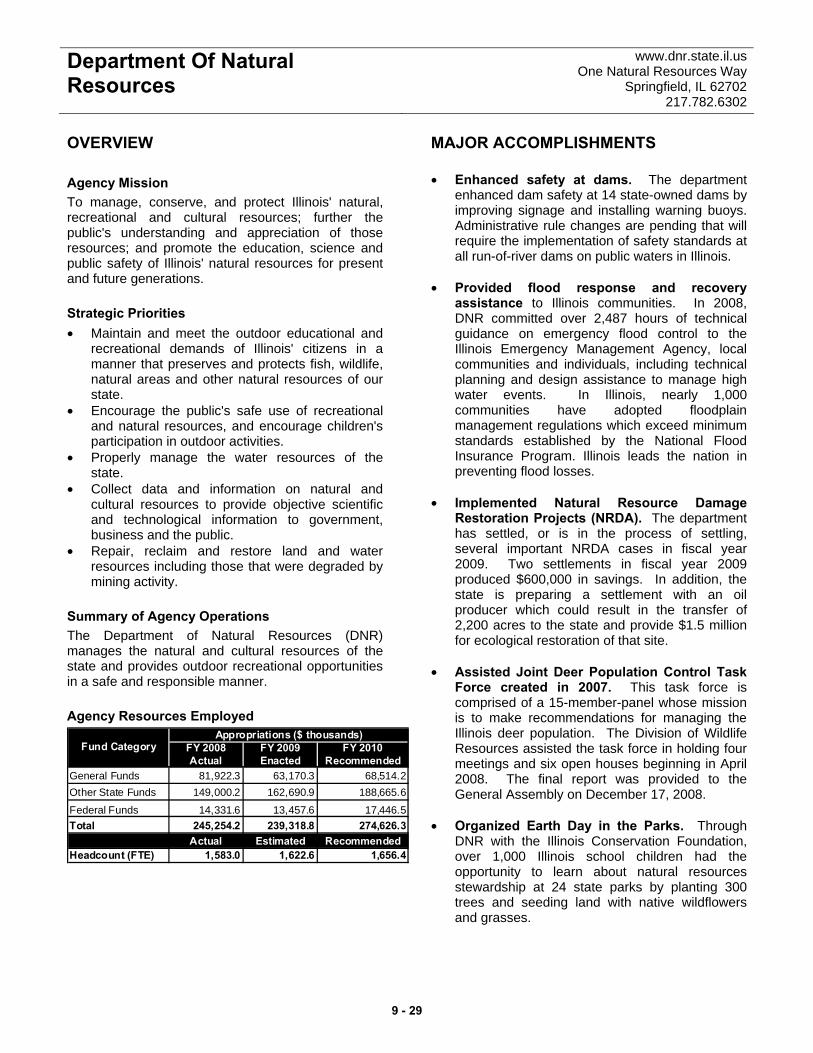
Department Of Natural Resources
www.dnr.state.il.us One Natural Resources Way
Springfield, IL 62702 217.782.6302
OVERVIEW Agency Mission To manage, conserve, and protect Illinois' natural, recreational and cultural resources; further the public's understanding and appreciation of those resources; and promote the education, science and public safety of Illinois' natural resources for present and future generations. Strategic Priorities • Maintain and meet the outdoor educational and
recreational demands of Illinois' citizens in a manner that preserves and protects fish, wildlife, natural areas and other natural resources of our state.
• Encourage the public's safe use of recreational and natural resources, and encourage children's participation in outdoor activities.
• Properly manage the water resources of the state.
• Collect data and information on natural and cultural resources to provide objective scientific and technological information to government, business and the public.
• Repair, reclaim and restore land and water resources including those that were degraded by mining activity.
Summary of Agency Operations The Department of Natural Resources (DNR) manages the natural and cultural resources of the state and provides outdoor recreational opportunities in a safe and responsible manner. Agency Resources Employed
FY 2008 FY 2009 FY 2010Actual Enacted Recommended
General Funds 81,922.3 63,170.3 68,514.2Other State Funds 149,000.2 162,690.9 188,665.6
Federal Funds 14,331.6 13,457.6 17,446.5Total 245,254.2 239,318.8 274,626.3
Actual Estimated RecommendedHeadcount (FTE) 1,583.0 1,622.6 1,656.4
Appropriations ($ thousands)Fund Category
MAJOR ACCOMPLISHMENTS • Enhanced safety at dams. The department
enhanced dam safety at 14 state-owned dams by improving signage and installing warning buoys. Administrative rule changes are pending that will require the implementation of safety standards at all run-of-river dams on public waters in Illinois.
• Provided flood response and recovery
assistance to Illinois communities. In 2008, DNR committed over 2,487 hours of technical guidance on emergency flood control to the Illinois Emergency Management Agency, local communities and individuals, including technical planning and design assistance to manage high water events. In Illinois, nearly 1,000 communities have adopted floodplain management regulations which exceed minimum standards established by the National Flood Insurance Program. Illinois leads the nation in preventing flood losses.
• Implemented Natural Resource Damage
Restoration Projects (NRDA). The department has settled, or is in the process of settling, several important NRDA cases in fiscal year 2009. Two settlements in fiscal year 2009 produced $600,000 in savings. In addition, the state is preparing a settlement with an oil producer which could result in the transfer of 2,200 acres to the state and provide $1.5 million for ecological restoration of that site.
• Assisted Joint Deer Population Control Task
Force created in 2007. This task force is comprised of a 15-member-panel whose mission is to make recommendations for managing the Illinois deer population. The Division of Wildlife Resources assisted the task force in holding four meetings and six open houses beginning in April 2008. The final report was provided to the General Assembly on December 17, 2008.
• Organized Earth Day in the Parks. Through
DNR with the Illinois Conservation Foundation, over 1,000 Illinois school children had the opportunity to learn about natural resources stewardship at 24 state parks by planting 300 trees and seeding land with native wildflowers and grasses.
9 - 29
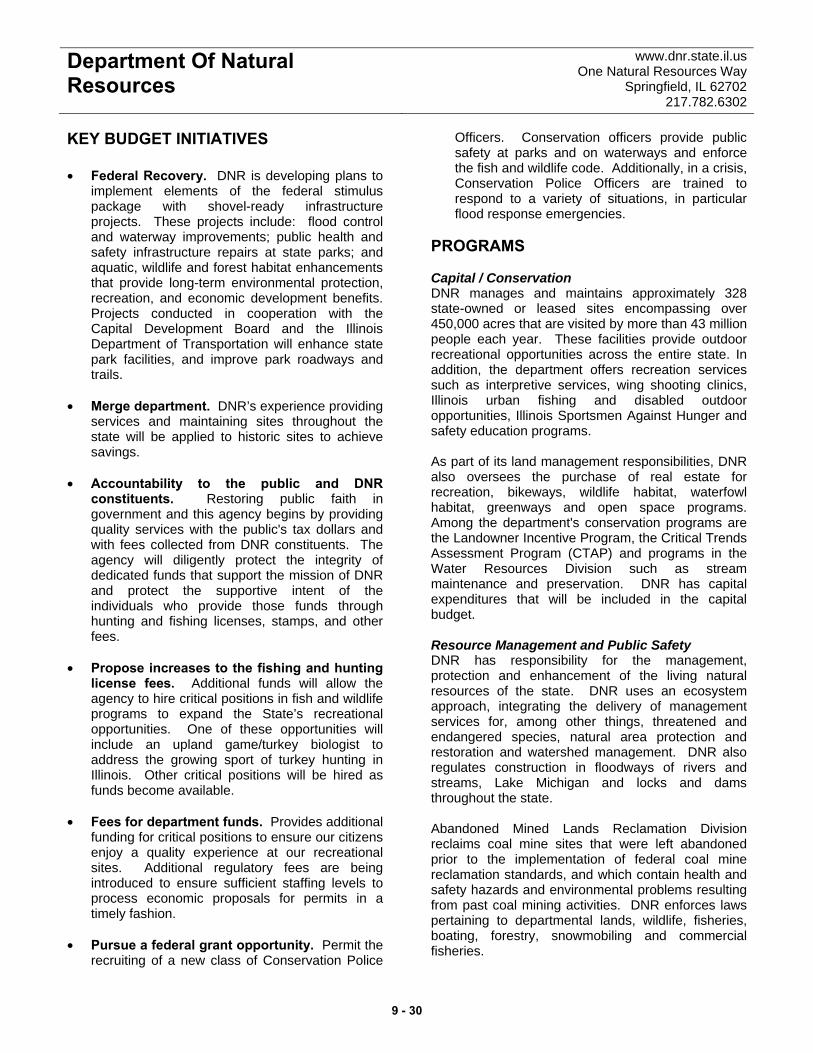
Department Of Natural Resources
www.dnr.state.il.us One Natural Resources Way
Springfield, IL 62702 217.782.6302
KEY BUDGET INITIATIVES • Federal Recovery. DNR is developing plans to
implement elements of the federal stimulus package with shovel-ready infrastructure projects. These projects include: flood control and waterway improvements; public health and safety infrastructure repairs at state parks; and aquatic, wildlife and forest habitat enhancements that provide long-term environmental protection, recreation, and economic development benefits. Projects conducted in cooperation with the Capital Development Board and the Illinois Department of Transportation will enhance state park facilities, and improve park roadways and trails.
• Merge department. DNR’s experience providing
services and maintaining sites throughout the state will be applied to historic sites to achieve savings.
• Accountability to the public and DNR
constituents. Restoring public faith in government and this agency begins by providing quality services with the public's tax dollars and with fees collected from DNR constituents. The agency will diligently protect the integrity of dedicated funds that support the mission of DNR and protect the supportive intent of the individuals who provide those funds through hunting and fishing licenses, stamps, and other fees.
• Propose increases to the fishing and hunting
license fees. Additional funds will allow the agency to hire critical positions in fish and wildlife programs to expand the State’s recreational opportunities. One of these opportunities will include an upland game/turkey biologist to address the growing sport of turkey hunting in Illinois. Other critical positions will be hired as funds become available.
• Fees for department funds. Provides additional
funding for critical positions to ensure our citizens enjoy a quality experience at our recreational sites. Additional regulatory fees are being introduced to ensure sufficient staffing levels to process economic proposals for permits in a timely fashion.
• Pursue a federal grant opportunity. Permit the
recruiting of a new class of Conservation Police
Officers. Conservation officers provide public safety at parks and on waterways and enforce the fish and wildlife code. Additionally, in a crisis, Conservation Police Officers are trained to respond to a variety of situations, in particular flood response emergencies.
PROGRAMS Capital / Conservation DNR manages and maintains approximately 328 state-owned or leased sites encompassing over 450,000 acres that are visited by more than 43 million people each year. These facilities provide outdoor recreational opportunities across the entire state. In addition, the department offers recreation services such as interpretive services, wing shooting clinics, Illinois urban fishing and disabled outdoor opportunities, Illinois Sportsmen Against Hunger and safety education programs. As part of its land management responsibilities, DNR also oversees the purchase of real estate for recreation, bikeways, wildlife habitat, waterfowl habitat, greenways and open space programs. Among the department's conservation programs are the Landowner Incentive Program, the Critical Trends Assessment Program (CTAP) and programs in the Water Resources Division such as stream maintenance and preservation. DNR has capital expenditures that will be included in the capital budget. Resource Management and Public Safety DNR has responsibility for the management, protection and enhancement of the living natural resources of the state. DNR uses an ecosystem approach, integrating the delivery of management services for, among other things, threatened and endangered species, natural area protection and restoration and watershed management. DNR also regulates construction in floodways of rivers and streams, Lake Michigan and locks and dams throughout the state. Abandoned Mined Lands Reclamation Division reclaims coal mine sites that were left abandoned prior to the implementation of federal coal mine reclamation standards, and which contain health and safety hazards and environmental problems resulting from past coal mining activities. DNR enforces laws pertaining to departmental lands, wildlife, fisheries, boating, forestry, snowmobiling and commercial fisheries.
9 - 30
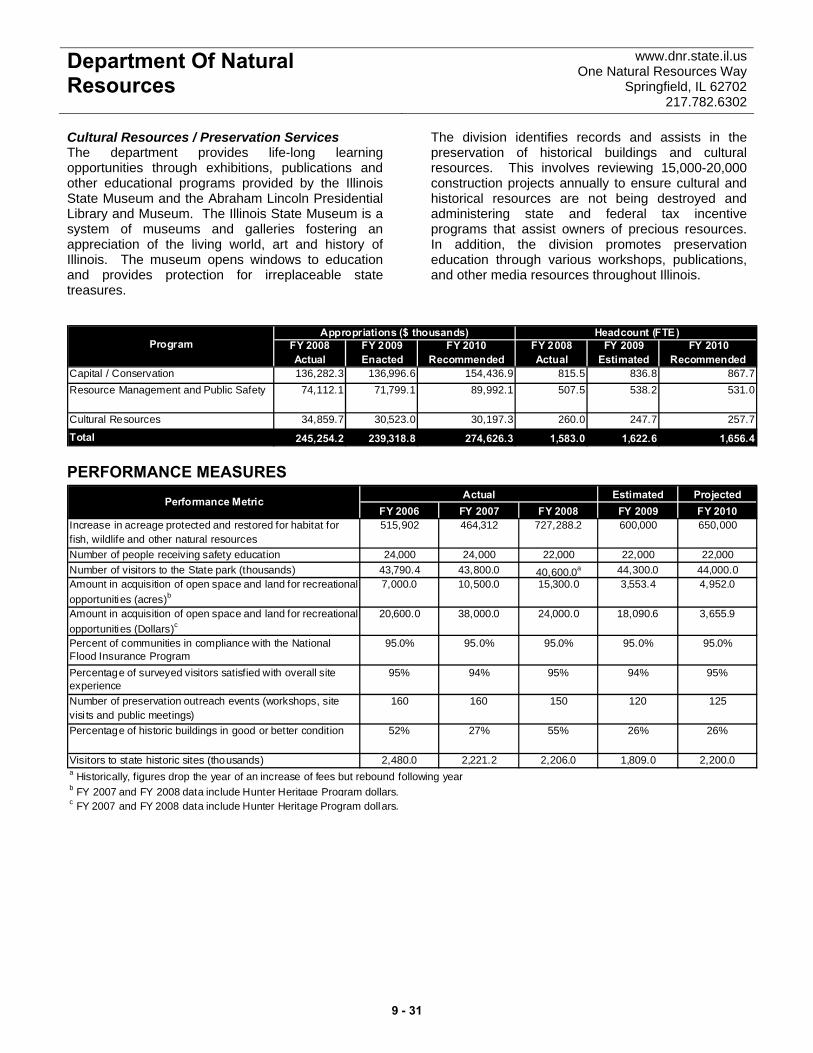
Department Of Natural Resources
www.dnr.state.il.us One Natural Resources Way
Springfield, IL 62702 217.782.6302
Cultural Resources / Preservation Services The department provides life-long learning opportunities through exhibitions, publications and other educational programs provided by the Illinois State Museum and the Abraham Lincoln Presidential Library and Museum. The Illinois State Museum is a system of museums and galleries fostering an appreciation of the living world, art and history of Illinois. The museum opens windows to education and provides protection for irreplaceable state treasures.
The division identifies records and assists in the preservation of historical buildings and cultural resources. This involves reviewing 15,000-20,000 construction projects annually to ensure cultural and historical resources are not being destroyed and administering state and federal tax incentive programs that assist owners of precious resources. In addition, the division promotes preservation education through various workshops, publications, and other media resources throughout Illinois.
Program FY 2008 FY 2009 FY 2010 FY 2008 FY 2009 FY 2010Actual Enacted Recommended Actual Estimated Recommended
Capital / Conservation 136,282.3 136,996.6 154,436.9 815.5 836.8 867.7Resource Management and Public Safety 74,112.1 71,799.1 89,992.1 507.5 538.2 531.0
Cultural Resources 34,859.7 30,523.0 30,197.3 260.0 247.7 257.7
Total 245,254.2 239,318.8 274,626.3 1,583.0 1,622.6 1,656.4
Appropriations ($ thousands) Headcount (FTE)
PERFORMANCE MEASURES Estimated Projected
FY 2006 FY 2007 FY 2008 FY 2009 FY 2010Increase in acreage protected and restored for habitat for fish, wildlife and other natural resources
515,902 464,312 727,288.2 600,000 650,000
Number of people receiving safety education 24,000 24,000 22,000 22,000 22,000Number of visitors to the State park (thousands) 43,790.4 43,800.0 40,600.0a 44,300.0 44,000.0Amount in acquisition of open space and land for recreational opportunities (acres)b
7,000.0 10,500.0 15,300.0 3,553.4 4,952.0
Amount in acquisition of open space and land for recreational opportunities (Dollars)c
20,600.0 38,000.0 24,000.0 18,090.6 3,655.9
Percent of communities in compliance with the National Flood Insurance Program
95.0% 95.0% 95.0% 95.0% 95.0%
Percentage of surveyed visitors satisfied with overall site experience
95% 94% 95% 94% 95%
Number of preservation outreach events (workshops, site visi ts and public meetings)
160 160 150 120 125
Percentage of historic buildings in good or better condition 52% 27% 55% 26% 26%
Visitors to state historic sites (thousands) 2,480.0 2,221.2 2,206.0 1,809.0 2,200.0
ActualPerformance Metric
a Historically, figures drop the year of an increase of fees but rebound following yearb FY 2007 and FY 2008 data include Hunter Heritage Program dollars.c FY 2007 and FY 2008 data include Hunter Heritage Program dollars.
9 - 31

ActualExpenditure
EnactedAppropriation
EstimatedExpenditures
EnactedAppropriation
Fiscal Year2010
RecommendedAppropriation
Fiscal Year 2008 Fiscal Year 2009
Department Of NaturalResources
www.dnr.state.il.usOne Natural Resources Way
Springfield, IL 62702217.782.6302
Appropriations Requiring General Assembly Action($ thousands)
GENERAL FUNDS
Total 61,483.6 51,067.447,240.947,240.959,558.2Personal Services and Fringe Benefits
Total 8,393.2 7,646.16,784.96,784.97,214.8Contractual Services
Total 5,662.1 6,378.64,969.44,969.44,942.7Other Operations and Refunds
Designated Purposes13.7 13.713.713.712.5Coordinating training and education programs for miners
143.4 160.4143.4143.493.3Dam Safety Program
0.0 25.00.00.00.0DUI/OUI Equipment
273.4 273.4273.4273.4263.8Environment and Nature Training Institute forConservation Education (E.N.T.I.C.E.)
300.0 200.0200.0300.03.2Expenses related to or in support of the AmistadCommission
24.6 230.024.624.624.6For costs associated with the Main Street Program
246.4 263.5246.4246.4243.5For operational expenses of the Lewis and ClarkHistoric Site in Madison County
72.8 80.072.872.870.4For the On-Line Computer Library Center
0.5 0.50.50.50.0Interest Penalty Escrow
0.0 50.0500.0500.0498.3Lincoln Bicentennial
0.0 235.30.00.00.0Tech Academy
900.3 1,100.31,100.31,100.3612.2Water Development Program
828.2 790.00.00.0828.2Wildlife Prairie Park operations and improvements
496.8 0.00.00.00.0Additional Frontline Staff
500.0 0.00.00.00.0Expenses related to or in support of the LincolnBicentennial
135.2 0.00.00.0135.2For Lincoln Legals
112.0 0.00.00.0112.0Operation and Maintenance of the Sparta WorldShooting and Recreational Complex
473.8 0.00.00.0473.7Water Quantity Study-Operations
Total 4,521.0 3,422.12,575.12,675.13,370.8Designated Purposes
Grants500.0 0.01,231.11,500.0499.0Expenses related to or in support of the Lincoln
BicentennialTotal 500.0 0.01,231.11,500.0499.0Grants
Capital Improvements196.3 0.00.00.090.1For permanent improvements at Historic Sites
1,166.1 0.00.00.0644.7Multiple Use Facilities
Total 1,362.4 0.00.00.0734.8Capital Improvements
TOTAL GENERAL FUNDS 81,922.3 68,514.262,801.463,170.376,320.2
9 - 32
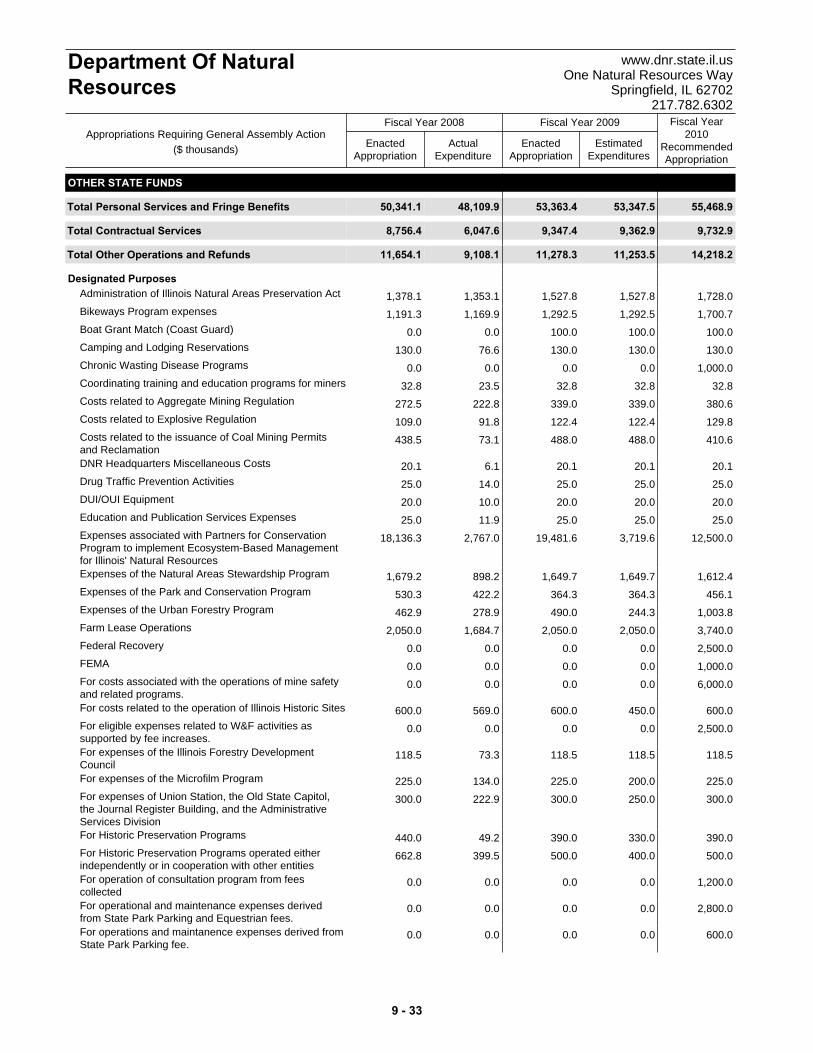
ActualExpenditure
EnactedAppropriation
EstimatedExpenditures
EnactedAppropriation
Fiscal Year2010
RecommendedAppropriation
Fiscal Year 2008 Fiscal Year 2009
Department Of NaturalResources
www.dnr.state.il.usOne Natural Resources Way
Springfield, IL 62702217.782.6302
Appropriations Requiring General Assembly Action($ thousands)
OTHER STATE FUNDS
Total 50,341.1 55,468.953,347.553,363.448,109.9Personal Services and Fringe Benefits
Total 8,756.4 9,732.99,362.99,347.46,047.6Contractual Services
Total 11,654.1 14,218.211,253.511,278.39,108.1Other Operations and Refunds
Designated Purposes1,378.1 1,728.01,527.81,527.81,353.1Administration of Illinois Natural Areas Preservation Act
1,191.3 1,700.71,292.51,292.51,169.9Bikeways Program expenses
0.0 100.0100.0100.00.0Boat Grant Match (Coast Guard)
130.0 130.0130.0130.076.6Camping and Lodging Reservations
0.0 1,000.00.00.00.0Chronic Wasting Disease Programs
32.8 32.832.832.823.5Coordinating training and education programs for miners
272.5 380.6339.0339.0222.8Costs related to Aggregate Mining Regulation
109.0 129.8122.4122.491.8Costs related to Explosive Regulation
438.5 410.6488.0488.073.1Costs related to the issuance of Coal Mining Permitsand Reclamation
20.1 20.120.120.16.1DNR Headquarters Miscellaneous Costs
25.0 25.025.025.014.0Drug Traffic Prevention Activities
20.0 20.020.020.010.0DUI/OUI Equipment
25.0 25.025.025.011.9Education and Publication Services Expenses
18,136.3 12,500.03,719.619,481.62,767.0Expenses associated with Partners for ConservationProgram to implement Ecosystem-Based Managementfor Illinois' Natural Resources
1,679.2 1,612.41,649.71,649.7898.2Expenses of the Natural Areas Stewardship Program
530.3 456.1364.3364.3422.2Expenses of the Park and Conservation Program
462.9 1,003.8244.3490.0278.9Expenses of the Urban Forestry Program
2,050.0 3,740.02,050.02,050.01,684.7Farm Lease Operations
0.0 2,500.00.00.00.0Federal Recovery
0.0 1,000.00.00.00.0FEMA
0.0 6,000.00.00.00.0For costs associated with the operations of mine safetyand related programs.
600.0 600.0450.0600.0569.0For costs related to the operation of Illinois Historic Sites
0.0 2,500.00.00.00.0For eligible expenses related to W&F activities assupported by fee increases.
118.5 118.5118.5118.573.3For expenses of the Illinois Forestry DevelopmentCouncil
225.0 225.0200.0225.0134.0For expenses of the Microfilm Program
300.0 300.0250.0300.0222.9For expenses of Union Station, the Old State Capitol,the Journal Register Building, and the AdministrativeServices Division
440.0 390.0330.0390.049.2For Historic Preservation Programs
662.8 500.0400.0500.0399.5For Historic Preservation Programs operated eitherindependently or in cooperation with other entities
0.0 1,200.00.00.00.0For operation of consultation program from feescollected
0.0 2,800.00.00.00.0For operational and maintenance expenses derivedfrom State Park Parking and Equestrian fees.
0.0 600.00.00.00.0For operations and maintanence expenses derived fromState Park Parking fee.
9 - 33

ActualExpenditure
EnactedAppropriation
EstimatedExpenditures
EnactedAppropriation
Fiscal Year2010
RecommendedAppropriation
Fiscal Year 2008 Fiscal Year 2009
Department Of NaturalResources
www.dnr.state.il.usOne Natural Resources Way
Springfield, IL 62702217.782.6302
Appropriations Requiring General Assembly Action($ thousands)
40.0 40.040.040.040.0For operations and maintenance and site improvementsat Pyramid State Park from lease revenues
50.0 50.050.050.00.0For operations and maintenance of training facility
25.0 125.0125.0125.00.0For payment of Timber Buyers Bond Forfeitures
200.0 200.00.0200.0167.4For research projects associated with Abraham Lincoln
12,858.0 12,535.811,765.112,265.110,831.7For the ordinary and contingent expenses of theAbraham Lincoln Presidential Library and Museum inSpringfield
135.0 135.075.0135.0134.7For the Papers of Abraham Lincoln
0.0 1,000.00.00.00.0For Water Resource Regulatory Operations from fees
11.4 11.411.411.42.9For workshops, training and other activities to improveadministration of Fish and Wildlife Program
970.7 989.6940.9940.9788.1Heavy Equipment Dredge Crew
118.0 118.0118.0118.0118.0Illinois - Michigan Canal
1,080.0 500.00.01,080.0721.0Illinois Beach Ecosystem
539.7 300.0333.0383.0406.7Illinois River Basin Conservation Reserve EnhancementProgram
0.0 250.0250.0250.00.0Imprest Account
742.7 840.9105.0945.937.7Inner City Urban Revitalization
0.5 0.50.00.50.0Interest Penalty Escrow
0.0 75.00.00.00.0Legal Services
245.1 280.8259.7259.7233.0Natural Areas Execution - Office of Realty andEnvironmental Planning
1,400.0 1,400.01,400.01,400.0187.2Natural Resources Trustee Program
674.0 200.0417.1674.082.2Nursery Reforestation Program
1,871.0 1,987.31,889.51,889.51,749.8Operating expenses of North Point Marina at WinthropHarbor
50.0 50.050.050.042.2Operation and maintenance of new sites and facilities -Sparta
0.0 1,920.11,821.11,821.10.0Operation and Maintenance of the Sparta WorldShooting and Recreational Complex
0.0 481.2500.0500.00.0Operation and Maintenance of the Sparta WorldShooting and Recreational Complex-revenue driven offsponsorships and donations
0.0 1,500.02,500.02,500.00.0Operational Expenses for Resource Conservation
370.1 318.4401.0401.0368.1Ordinary and Contigent Expenses - Special Events
2,397.8 2,579.02,509.12,509.12,216.8Ordinary and Contingent Expenses
477.7 566.0534.0534.0365.1Ordinary and Contingent Expenses - Bikeways Program
1,220.7 1,523.71,462.91,462.91,140.3Ordinary and Contingent Expenses - Office of Realtyand Environmental Planning
1,364.0 1,462.11,345.81,345.81,170.1Ordinary and Contingent Expenses - OSLAD Program
402.2 570.9495.4495.4303.2Ordinary and Contingent Expenses of Public Services
306.1 111.3103.1103.1278.7Ordinary and Contingent Expenses-Business Services
602.9 591.3591.3591.3354.3Outdoor Illinois and Marketing
4,573.1 7,631.55,143.45,143.44,247.3Park and Conservation Program
0.0 2,100.00.00.00.0Park Operations and Staffing
0.0 2,473.32,201.12,201.10.0Partners for Conservation operations
1,000.0 1,000.0100.01,000.094.1Plugging and restoration projects
3,000.0 3,000.03,000.03,000.02,481.1Point of Sale
1,064.0 1,136.51,116.41,116.4901.2Programs advancing forests and forestry
94.2 49.274.794.228.4Public Events and Promotions
9 - 34

ActualExpenditure
EnactedAppropriation
EstimatedExpenditures
EnactedAppropriation
Fiscal Year2010
RecommendedAppropriation
Fiscal Year 2008 Fiscal Year 2009
Department Of NaturalResources
www.dnr.state.il.usOne Natural Resources Way
Springfield, IL 62702217.782.6302
Appropriations Requiring General Assembly Action($ thousands)
1,879.2 2,175.0392.32,067.3311.9Purposes of the Illinois Non-Game Wildlife ProtectionAct
0.0 3,900.0100.02,000.00.0Reallocation of WF Grant Reimbursement
350.0 350.0350.0350.04.9Reclaiming Surface Mined Lands for which a bond hasbeen forfeited
53.9 53.953.953.913.5Repairs and modifications to facilities
125.0 125.0125.0125.00.0Sale of Advertising
79.8 79.879.879.870.1Snowmobile Programs
100.0 100.0100.0100.092.6Sportsman Against Hunger
0.0 132.00.00.00.0State Fair
200.0 200.0200.0200.0200.0Stream gauging on the Illinois River
0.0 2,900.0100.01,500.00.0Subgrantee Payments
2,132.5 2,044.40.02,044.41,072.4To continue the Natural Areas Inventory Assessment
5.0 5.05.05.00.7To remit donation check-off revenue to the IllinoisConservation Foundation
466.1 466.1466.1466.1428.8Union County, Horseshoe Lake, and MermetConservation Areas Farm Operation
247.8 275.9262.5262.5226.6Urban Fishing Program with the Chicago Park District toprovide fishing and resource management of lagoons
1,300.0 250.0250.0250.01,298.7Water Quantity Study
200.0 200.0200.0200.03.7Watercraft Titling
100.0 100.00.0100.00.0Wildlife Prairie Park operations and improvements
56.0 0.00.00.00.0Aquatic Resource
260.0 0.00.00.00.0Biologists
80.2 0.00.00.00.0Conservation of Wildlife Populations
196.9 0.00.00.00.0Endangered Species
75.0 0.00.00.072.9Environmental Planning
20.7 0.00.00.00.0Herpetologist for Federal Match- State Wildlife Grants
176.7 0.00.00.00.0Illinois Heritage Database
934.7 0.00.00.00.0Invasive Species Control
149.0 0.00.00.00.0Lost Mound Field Stadium
1,571.9 0.00.00.01,297.5Operation and maintenance of new sites
0.0 0.01,900.02,100.00.0Reopening closed parks
10.0 0.00.00.00.0Salmon Stamps and reprints
0.0 0.00.0308.00.0Stamp fund operations
227.0 0.00.00.00.0Tech Academy
Total 77,728.6 107,209.360,212.488,140.545,137.5Designated Purposes
Grants0.0 1,500.00.00.00.0Federal Recovery - Restoration of Natural Areas at
Illinois Beach.445.0 461.3175.0486.3108.7For awards and grants for Historic Preservation
Programs either independent or in cooperation withothers
Total 445.0 1,961.3175.0486.3108.7Grants
Capital Improvements75.0 75.050.075.06.6For Permanent Improvements
Total 75.0 75.050.075.06.6Capital Improvements
TOTAL OTHER STATE FUNDS 149,000.2 188,665.6134,401.3162,690.9108,518.3
9 - 35
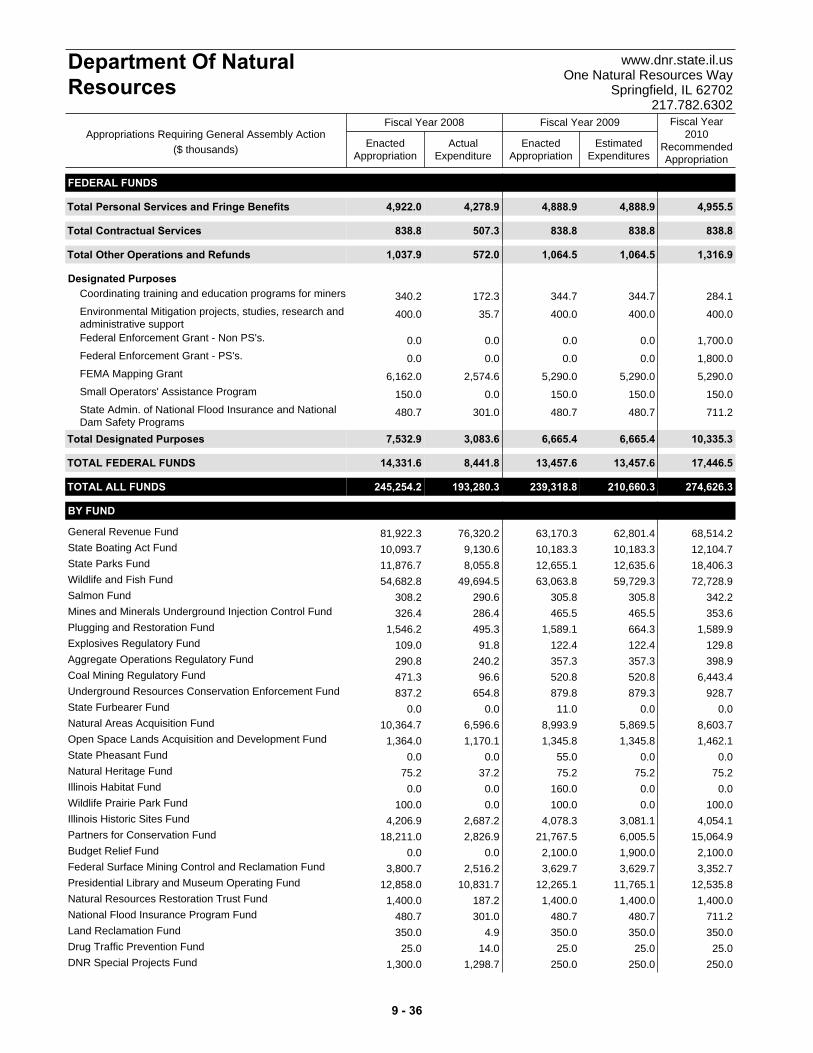
ActualExpenditure
EnactedAppropriation
EstimatedExpenditures
EnactedAppropriation
Fiscal Year2010
RecommendedAppropriation
Fiscal Year 2008 Fiscal Year 2009
Department Of NaturalResources
www.dnr.state.il.usOne Natural Resources Way
Springfield, IL 62702217.782.6302
Appropriations Requiring General Assembly Action($ thousands)
FEDERAL FUNDS
Total 4,922.0 4,955.54,888.94,888.94,278.9Personal Services and Fringe Benefits
Total 838.8 838.8838.8838.8507.3Contractual Services
Total 1,037.9 1,316.91,064.51,064.5572.0Other Operations and Refunds
Designated Purposes340.2 284.1344.7344.7172.3Coordinating training and education programs for miners
400.0 400.0400.0400.035.7Environmental Mitigation projects, studies, research andadministrative support
0.0 1,700.00.00.00.0Federal Enforcement Grant - Non PS's.
0.0 1,800.00.00.00.0Federal Enforcement Grant - PS's.
6,162.0 5,290.05,290.05,290.02,574.6FEMA Mapping Grant
150.0 150.0150.0150.00.0Small Operators' Assistance Program
480.7 711.2480.7480.7301.0State Admin. of National Flood Insurance and NationalDam Safety Programs
Total 7,532.9 10,335.36,665.46,665.43,083.6Designated Purposes
TOTAL FEDERAL FUNDS 14,331.6 17,446.513,457.613,457.68,441.8
TOTAL ALL FUNDS 245,254.2 274,626.3210,660.3239,318.8193,280.3
BY FUND
81,922.3 68,514.262,801.463,170.376,320.2General Revenue Fund
10,093.7 12,104.710,183.310,183.39,130.6State Boating Act Fund
11,876.7 18,406.312,635.612,655.18,055.8State Parks Fund
54,682.8 72,728.959,729.363,063.849,694.5Wildlife and Fish Fund
308.2 342.2305.8305.8290.6Salmon Fund
326.4 353.6465.5465.5286.4Mines and Minerals Underground Injection Control Fund
1,546.2 1,589.9664.31,589.1495.3Plugging and Restoration Fund
109.0 129.8122.4122.491.8Explosives Regulatory Fund
290.8 398.9357.3357.3240.2Aggregate Operations Regulatory Fund
471.3 6,443.4520.8520.896.6Coal Mining Regulatory Fund
837.2 928.7879.3879.8654.8Underground Resources Conservation Enforcement Fund
0.0 0.00.011.00.0State Furbearer Fund
10,364.7 8,603.75,869.58,993.96,596.6Natural Areas Acquisition Fund
1,364.0 1,462.11,345.81,345.81,170.1Open Space Lands Acquisition and Development Fund
0.0 0.00.055.00.0State Pheasant Fund
75.2 75.275.275.237.2Natural Heritage Fund
0.0 0.00.0160.00.0Illinois Habitat Fund
100.0 100.00.0100.00.0Wildlife Prairie Park Fund
4,206.9 4,054.13,081.14,078.32,687.2Illinois Historic Sites Fund
18,211.0 15,064.96,005.521,767.52,826.9Partners for Conservation Fund
0.0 2,100.01,900.02,100.00.0Budget Relief Fund
3,800.7 3,352.73,629.73,629.72,516.2Federal Surface Mining Control and Reclamation Fund
12,858.0 12,535.811,765.112,265.110,831.7Presidential Library and Museum Operating Fund
1,400.0 1,400.01,400.01,400.0187.2Natural Resources Restoration Trust Fund
480.7 711.2480.7480.7301.0National Flood Insurance Program Fund
350.0 350.0350.0350.04.9Land Reclamation Fund
25.0 25.025.025.014.0Drug Traffic Prevention Fund
1,300.0 250.0250.0250.01,298.7DNR Special Projects Fund
9 - 36
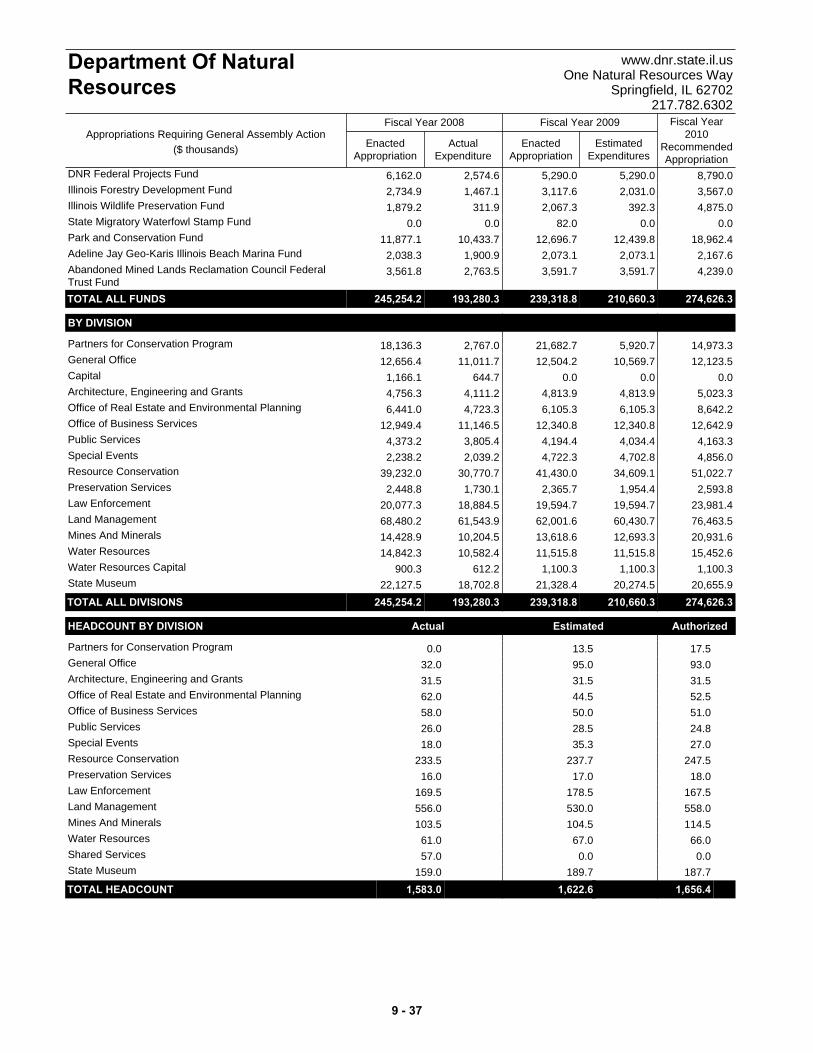
ActualExpenditure
EnactedAppropriation
EstimatedExpenditures
EnactedAppropriation
Fiscal Year2010
RecommendedAppropriation
Fiscal Year 2008 Fiscal Year 2009
Department Of NaturalResources
www.dnr.state.il.usOne Natural Resources Way
Springfield, IL 62702217.782.6302
Appropriations Requiring General Assembly Action($ thousands)
6,162.0 8,790.05,290.05,290.02,574.6DNR Federal Projects Fund
2,734.9 3,567.02,031.03,117.61,467.1Illinois Forestry Development Fund
1,879.2 4,875.0392.32,067.3311.9Illinois Wildlife Preservation Fund
0.0 0.00.082.00.0State Migratory Waterfowl Stamp Fund
11,877.1 18,962.412,439.812,696.710,433.7Park and Conservation Fund
2,038.3 2,167.62,073.12,073.11,900.9Adeline Jay Geo-Karis Illinois Beach Marina Fund
3,561.8 4,239.03,591.73,591.72,763.5Abandoned Mined Lands Reclamation Council FederalTrust FundTOTAL ALL FUNDS 245,254.2 274,626.3210,660.3239,318.8193,280.3
BY DIVISION
18,136.3 14,973.35,920.721,682.72,767.0Partners for Conservation Program
12,656.4 12,123.510,569.712,504.211,011.7General Office
1,166.1 0.00.00.0644.7Capital
4,756.3 5,023.34,813.94,813.94,111.2Architecture, Engineering and Grants
6,441.0 8,642.26,105.36,105.34,723.3Office of Real Estate and Environmental Planning
12,949.4 12,642.912,340.812,340.811,146.5Office of Business Services
4,373.2 4,163.34,034.44,194.43,805.4Public Services
2,238.2 4,856.04,702.84,722.32,039.2Special Events
39,232.0 51,022.734,609.141,430.030,770.7Resource Conservation
2,448.8 2,593.81,954.42,365.71,730.1Preservation Services
20,077.3 23,981.419,594.719,594.718,884.5Law Enforcement
68,480.2 76,463.560,430.762,001.661,543.9Land Management
14,428.9 20,931.612,693.313,618.610,204.5Mines And Minerals
14,842.3 15,452.611,515.811,515.810,582.4Water Resources
900.3 1,100.31,100.31,100.3612.2Water Resources Capital
22,127.5 20,655.920,274.521,328.418,702.8State Museum
TOTAL ALL DIVISIONS 245,254.2 274,626.3210,660.3239,318.8193,280.3
HEADCOUNT BY DIVISION Actual Estimated Authorized
0.0 17.513.5Partners for Conservation Program
32.0 93.095.0General Office
31.5 31.531.5Architecture, Engineering and Grants
62.0 52.544.5Office of Real Estate and Environmental Planning
58.0 51.050.0Office of Business Services
26.0 24.828.5Public Services
18.0 27.035.3Special Events
233.5 247.5237.7Resource Conservation
16.0 18.017.0Preservation Services
169.5 167.5178.5Law Enforcement
556.0 558.0530.0Land Management
103.5 114.5104.5Mines And Minerals
61.0 66.067.0Water Resources
57.0 0.00.0Shared Services
159.0 187.7189.7State Museum
TOTAL HEADCOUNT 1,583.0 1,656.41,622.6 t
9 - 37

9 - 38
ECONOMIC DEVELOPMENT AND INFRASTRUCTURE
CODE DEPARTMENTS
Department of AgricultureDepartment of Commerce and Economic Opportunity
Illinois Power AgencyDepartment of Employment Security
Department of LaborDepartment of Transportation
EXECUTIVE AGENCIES, COMMISSIONS AND BOARDS
East St. Louis Financial Advisory AuthorityIllinois Arts Council
Illinois Finance AuthorityIllinois Medical District Commission
Illinois Sports Facilities AuthorityMetropolitan Pier and Exposition Authority
Southwestern Illinois Development AuthorityIllinois State Toll Highway Authority
Upper Illinois River Valley Development Authority
www.state.il.us/budget
CHAPTER 10

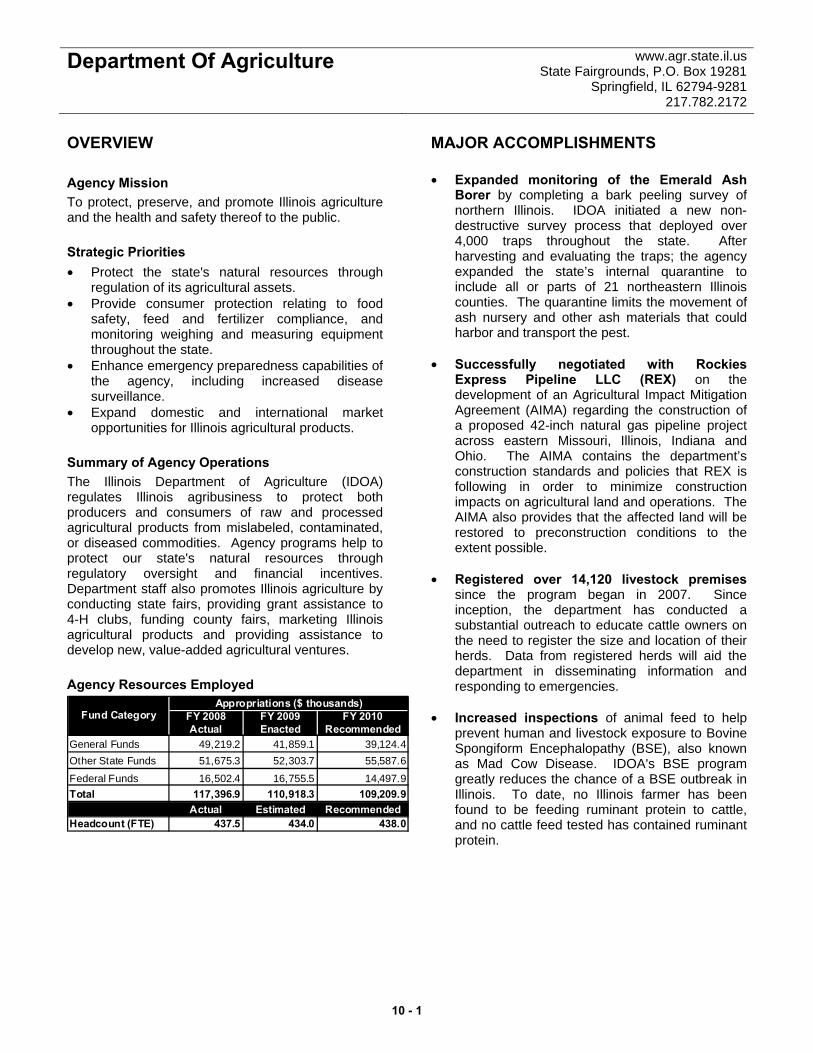
Department Of Agriculture www.agr.state.il.us State Fairgrounds, P.O. Box 19281
Springfield, IL 62794-9281 217.782.2172
OVERVIEW Agency Mission To protect, preserve, and promote Illinois agriculture and the health and safety thereof to the public. Strategic Priorities • Protect the state's natural resources through
regulation of its agricultural assets. • Provide consumer protection relating to food
safety, feed and fertilizer compliance, and monitoring weighing and measuring equipment throughout the state.
• Enhance emergency preparedness capabilities of the agency, including increased disease surveillance.
• Expand domestic and international market opportunities for Illinois agricultural products.
Summary of Agency Operations The Illinois Department of Agriculture (IDOA) regulates Illinois agribusiness to protect both producers and consumers of raw and processed agricultural products from mislabeled, contaminated, or diseased commodities. Agency programs help to protect our state's natural resources through regulatory oversight and financial incentives. Department staff also promotes Illinois agriculture by conducting state fairs, providing grant assistance to 4-H clubs, funding county fairs, marketing Illinois agricultural products and providing assistance to develop new, value-added agricultural ventures. Agency Resources Employed
FY 2008 FY 2009 FY 2010Actual Enacted Recommended
General Funds 49,219.2 41,859.1 39,124.4Other State Funds 51,675.3 52,303.7 55,587.6
Federal Funds 16,502.4 16,755.5 14,497.9Total 117,396.9 110,918.3 109,209.9
Actual Estimated RecommendedHeadcount (FTE) 437.5 434.0 438.0
Appropriations ($ thousands)Fund Category
MAJOR ACCOMPLISHMENTS • Expanded monitoring of the Emerald Ash
Borer by completing a bark peeling survey of northern Illinois. IDOA initiated a new non-destructive survey process that deployed over 4,000 traps throughout the state. After harvesting and evaluating the traps; the agency expanded the state’s internal quarantine to include all or parts of 21 northeastern Illinois counties. The quarantine limits the movement of ash nursery and other ash materials that could harbor and transport the pest.
• Successfully negotiated with Rockies
Express Pipeline LLC (REX) on the development of an Agricultural Impact Mitigation Agreement (AIMA) regarding the construction of a proposed 42-inch natural gas pipeline project across eastern Missouri, Illinois, Indiana and Ohio. The AIMA contains the department’s construction standards and policies that REX is following in order to minimize construction impacts on agricultural land and operations. The AIMA also provides that the affected land will be restored to preconstruction conditions to the extent possible.
• Registered over 14,120 livestock premises
since the program began in 2007. Since inception, the department has conducted a substantial outreach to educate cattle owners on the need to register the size and location of their herds. Data from registered herds will aid the department in disseminating information and responding to emergencies.
• Increased inspections of animal feed to help
prevent human and livestock exposure to Bovine Spongiform Encephalopathy (BSE), also known as Mad Cow Disease. IDOA's BSE program greatly reduces the chance of a BSE outbreak in Illinois. To date, no Illinois farmer has been found to be feeding ruminant protein to cattle, and no cattle feed tested has contained ruminant protein.
10 - 1
Department Of Agriculture www.agr.state.il.us State Fairgrounds, P.O. Box 19281
Springfield, IL 62794-9281 217.782.2172
• Inaugurated the Illinois Products Farmers Market on the Illinois State Fairgrounds. The market was open from June to October of 2008. The unique night-time market drew thousands of consumers and 30-40 vendors each week. The agency is working on plans for the 2009 Illinois Products Farmers Market.
• Increased market access opportunities for
Illinois food and agribusiness products. Through the second quarter of 2009, the department has participated in 41 trade shows, hosted two international buyer missions and facilitated 2,222 buyer-to-seller introductions. These efforts resulted in $18 million in actual sales for small and medium sized businesses.
KEY BUDGET INITIATIVES • Strengthen Homeland Security. The agency
will host an international homeland security training exercise in June 2009, sponsored by the U.S. Department of Agriculture (USDA). The event will include a two-day tabletop exercise that will simulate a Foot and Mouth Disease (FMD) outbreak, including deployment of the National Veterinary Stockpile. Participants will include the USDA, federal homeland security advisors, representatives from Canada, and representatives from the 13 states that comprise the Multi-State Partnership for Security in Agriculture. This exercise will encourage collaboration among the U.S. government, the Canadian government and the states.
PROGRAMS Animal Industries The Bureau of Animal Health and Welfare monitors, controls, and helps prevent the spread of animal diseases. It also licenses breeders and dealers, and ensures humane care and control of animals. The Bureau of Animal Laboratories conducts laboratory tests to detect animal diseases, performs necropsies, and analyzes samples to assist regulators, meat inspectors, veterinarians and citizens. The bureau includes a Bio-Safety Level III lab, which allows for foreign animal disease surveillance. Warehouse / Ag Product Inspection The bureau examines the operations of grain dealers, grain warehouses, and personal property warehouses; manages the Illinois Grain Insurance Fund; and administers the Grain Code and the
Personal Property Storage Act in order to protect the property of grain producers and residents of Illinois. The bureau also inspects feed, seed and fertilizer products and facilities in order to protect growers, livestock owners and the environment. The responsibilities of this bureau are to regulate, inspect, and license facilities, and to analyze products to ensure that consumers receive quality products. Weights and Measures The bureau ensures accurate measurement and delivery of wholesale and retail commodities, monitors the quality of bio-based motor fuel products sold within the state and maintains laboratories for metrology standards and grain moisture measurement. Administration / Computer Services Administrative Services provides direct support to the department's operating programs. These services include personnel, budget/fiscal, computer services, support services and related support functions, such as legal and legislative support. Buildings and Grounds The Bureau of Springfield Buildings and Grounds maintains the 366 acres and 170 buildings known as the Illinois State Fairgrounds and provides services for the fair and for non-fair events. The bureau also oversees non-fair events held on the fairgrounds. These events bring large numbers of people from out of state and are important to the state and local economy. County Fairs / Horse Racing The Bureau of County Fairs and Horse Racing regulate the standard-bred, thoroughbred and quarter-horse breeding programs in the state. It also provides premium reimbursement and rehabilitation grant dollars to county fairs, 4-H fairs, and Future Farmers of America section fairs. DuQuoin State Fair / Buildings and Grounds The DuQuoin State Fair is an annual event that promotes agriculture education and awareness, along with family activities, auto racing and entertainment. The event offers world-class harness racing, including the World Trotting Derby. The Bureau of the DuQuoin State Fair and Buildings and Grounds maintains the fairgrounds and oversees non-fair events. Environmental Programs The Bureau of Environmental Programs licenses, registers, permits, and inspects various
10 - 2

Department Of Agriculture www.agr.state.il.us State Fairgrounds, P.O. Box 19281
Springfield, IL 62794-9281 217.782.2172
agribusinesses and producers in an effort to protect the public and the state's natural resources. It administers programs regarding the use of pesticides; the containment of agrichemical storage and handling facilities and lawn care facilities; the detection and control of insect pests and plant diseases; the inspection of nurseries; and the location, design, construction and operation of livestock production facilities. Illinois State Fair Since 1853, the Illinois State Fair has been a showcase for Illinois agriculture. The annual fair features livestock, educational displays and a wide variety of family entertainment, as well as commodity, craft and talent competitions. Marketing and Promotion The Bureau of Market Services and Development assists small and medium-sized Illinois food and agribusiness companies in the development of both domestic and international markets for the benefit of the agricultural and food industries. IDOA assists companies by expanding markets for Illinois
products, providing consulting, research, marketing assistance and promotional activities. Meat and Poultry Inspection The bureau inspects meat and poultry slaughter and processing operations and the quality of eggs throughout the distribution chain in an effort to protect public health and ensure consumer confidence in Illinois meat, poultry and egg products. Land and Water Resources The Bureau of Land and Water Resources implements the department's soil and water conservation and farmland protection programs. It provides financial and technical assistance to Illinois' 98 local soil and water conservation districts, which assist landowners and agricultural producers with techniques to protect natural resources. The bureau also works with other state agencies to ensure their projects do not lead to unnecessary conversion of farmland to other uses, and assists local governments with the development of farmland protection programs.
Program FY 2008 FY 2009 FY 2010 FY 2008 FY 2009 FY 2010Actual Enacted Recommended Actual Estimated Recommended
Animal Industries 7,323.1 7,561.9 7,599.0 54.5 49.5 56.5Warehouse / Ag Product Inspection 5,821.3 5,704.7 5,418.2 48.5 46.5 43.5Weights and Measures 4,199.2 4,100.2 4,464.0 37.0 40.0 40.0Administration / Computer Services 27,133.5 26,469.4 25,738.8 27.0 33.0 33.5Buildings and Grounds 7,511.7 7,114.4 6,766.6 35.5 28.5 29.0County Fairs / Horse Racing 13,002.7 11,987.5 12,043.9 7.0 7.0 7.0DuQuoin State Fair / Buildings and Grounds
4,941.0 4,749.4 4,588.3 17.0 18.0 18.0
Nonrecurring Projects 260.6 0.0 0.0 0.0 0.0 0.0Environmental Programs 11,243.9 10,589.2 9,640.0 67.0 66.0 66.5Illinois State Fair 4,713.1 4,713.1 5,112.3 5.0 9.0 9.0Marketing and Promotion 4,367.0 4,126.3 4,211.1 19.0 25.5 25.5
Meat and Poultry Inspection 9,607.1 9,694.4 9,643.1 111.0 97.0 96.0Land and Water Resources 17,272.7 14,107.8 13,984.6 9.0 14.0 13.5
Total 117,396.9 110,918.3 109,209.9 437.5 434.0 438.0
Appropriations ($ thousands) Headcount (FTE)
10 - 3

Department Of Agriculture www.agr.state.il.us State Fairgrounds, P.O. Box 19281
Springfield, IL 62794-9281 217.782.2172
PERFORMANCE MEASURES Estimated Projected
FY 2006 FY 2007 FY 2008 FY 2009 FY 2010Percentage of meat and poultry facilities in compliance with Unites States Department of Agriculture inspection regulations
99.1% 99.1% 99.0% 99.0% 99.0%
Percentage of agricultural products in compliance with state of Illinois regulations
90.7% 90.9% 91.2% 90.0% 90.0%
Percentage of facilities in compliance with the state of Illinois' Grain Code
95.4% 97.3% 96.4% 95.0% 95.0%
Percentage of weights and measures devices inspected 73.7% 88.0% 100.0% 100.0% 100.0%
Percentage of agrichemical facilities in compliance with the state of Illinois' pesticide & fertilizer regulations
42.0% 55.6% 59.8% 55.0% 55.0%
Conservation Practice Cost-Share dollars spent per acre of land where soi l erosion was reduced to tolerable levels ($)a
$101.00 $204.27 $170.51 $200.00 $200.00
Number of non-fa ir event days at fairgrounds facilities 988 1,131 622 700 700Ratio of sales to marketing expense 165:1b 68:1 158:1 50:1 50:1
ActualPerformance Metric
a Conservation Practice Cost-Share Program is an incentive program that fosters the construction of conservation practices for reducing soil erosion to tolerable levels according to state guidelines.b Sales to marketing expense is a variable metric that is tied to global market conditions.
10 - 4

ActualExpenditure
EnactedAppropriation
EstimatedExpenditures
EnactedAppropriation
Fiscal Year2010
RecommendedAppropriation
Fiscal Year 2008 Fiscal Year 2009
Department Of Agriculture www.agr.state.il.usState Fairgrounds, P.O. Box 19281
Springfield, IL 62794-9281217.782.2172
Appropriations Requiring General Assembly Action($ thousands)
GENERAL FUNDS
Total 19,736.3 16,892.318,978.019,586.919,244.7Personal Services and Fringe Benefits
Total 4,706.7 4,736.64,596.04,738.14,504.4Contractual Services
Total 1,526.0 1,570.61,572.61,621.21,425.5Other Operations and Refunds
Designated Purposes5,055.0 5,000.05,199.25,360.05,055.0Cook County Extension
750.0 480.0132.2136.3708.8Exotic Pest Eradication
290.0 290.0281.3290.0274.9For Administration of the Livestock ManagementFacilities Act
16.8 15.515.516.016.0For Bovine Disease Research
0.0 715.40.00.00.0For Costs of Administrative Operations
0.0 1,713.91,813.91,870.00.0For Deposit Into the State Cooperative ExtensionService Trust Fund
433.2 366.5399.2411.5428.4For DuQuoin State Fair Entertainment, Including thePercentage Portion of Entertainment Contracts
23.7 22.521.822.522.5For Expenses of a Motor Fuel and Petroleum StandardsProgram
5.0 4.94.95.00.0For Implementation of an Agriculture Assembly
35.4 32.632.633.633.6For Swine Disease Research
368.2 0.00.00.0367.8For Preparation and Set-Up for the National High SchoolFinals Rodeo
Total 6,977.3 8,641.37,900.68,144.96,907.0Designated Purposes
Grants196.0 184.3184.3190.0190.0AgrAbility
130.9 130.9127.0130.9123.4Awards and Premiums at DuQuoin State Fair
279.4 271.0271.0279.4279.4Awards and Premiums at the Illinois State Fair
129.9 126.0126.0129.9123.4Awards and Premiums for Grand Circuit Horse Racingat the Illinois State Fairgrounds
151.0 116.2146.5151.0148.5Awards to Livestock Breeders
4,410.0 2,206.82,206.82,275.04,500.0Distribution of Agricultural Research Grants to PublicUniversities, Including Administrative Costs
29.4 28.528.529.430.0For the Agricultural Leadership Foundation
7,421.8 3,804.13,804.13,921.87,421.8Grants to Soil and Water Conservation Districts
27.8 27.827.027.827.2Harness Racing at the DuQuoin State Fair
400.0 388.0388.0400.0400.0Soil Surveys in Mapping Illinois Soil
1,400.0 0.00.00.00.0Conservation Practices Cost-Sharing Program
626.6 0.00.00.0595.3Distribution to County Fair and Exposition Authorities
0.0 0.00.00.033.9For Deposit into the State Cooperative ExtensionService Trust Fund
564.5 0.00.00.034.9For the Illinois AgriFIRST Program
0.0 0.00.00.0132.1Grants to Soil and Water Conservation Districts Grantsto Soil and Water Conservation Districts for Salaries,Education and Promotion Assistance
245.0 0.0225.8232.8232.8Grants, Contracts and Administrative ExpensesAssociated With the Development of the Illinois Grapeand Wine Council
260.6 0.00.00.00.0Nonrecurring Projects
Total 16,272.9 7,283.67,535.07,768.014,272.6Grants
TOTAL GENERAL FUNDS 49,219.2 39,124.440,582.241,859.146,354.2
10 - 5

ActualExpenditure
EnactedAppropriation
EstimatedExpenditures
EnactedAppropriation
Fiscal Year2010
RecommendedAppropriation
Fiscal Year 2008 Fiscal Year 2009
Department Of Agriculture www.agr.state.il.usState Fairgrounds, P.O. Box 19281
Springfield, IL 62794-9281217.782.2172
Appropriations Requiring General Assembly Action($ thousands)
OTHER STATE FUNDS
Total 4,313.2 5,031.44,079.74,102.53,971.0Personal Services and Fringe Benefits
Total 592.2 659.4550.7563.5491.3Contractual Services
Total 935.6 1,054.5879.1905.9601.6Other Operations and Refunds
Designated Purposes3,075.0 4,400.02,982.83,075.02,966.4Administer Pesticide Act
700.0 850.0679.0700.0699.3Expenses Authorized by the Animal DiseaseLaboratories Act
1,956.0 1,956.01,917.31,956.01,488.7Expenses Connected with Promotion and Marketing ofIllinois Agriculture and Agricultural Exports
150.0 142.5138.2142.5147.0Expenses Related to Viticulturist and EnologistContractual Staff
1,100.0 1,500.01,067.01,100.01,007.1Expenses Relating to Feed Control Program
455.2 455.2441.5455.2446.1Financial Assistance for the DuQuoin State Fair
30.0 30.029.130.026.2For Administration of the Livestock ManagementFacilities Act
12,800.0 12,160.011,795.212,160.012,800.0For Deposit into the State Cooperative ExtensionService Trust Fund
5.0 5.04.95.00.0For Illinois' Part in Administration of the FederalBankhead-Jones Farm Tenant Act
140.0 100.00.0100.0140.0For Implementation of Programs and Activities toPromote, Develop and Enhance the BiotechnologyIndustry in Illinois
540.0 540.0515.0540.0510.7For Inspection of Agricultural Products
600.0 545.0528.7545.0551.0For Non-Fair Activities at the DuQuoin StateFairgrounds
1,500.0 1,500.01,200.01,500.01,052.6For Non-Fair Activities at the Illinois State Fairgrounds
4,000.0 4,300.03,900.04,000.03,896.0For Operation of the Illinois State Fair, IncludingEntertainment and the Percentage Portion ofEntertainment Contracts
25.0 50.024.325.024.5For the Regulation of Motor Fuel Quality
0.0 4.00.00.00.0Investigate Animal Abuse and Neglect
2.0 2.01.02.00.9Natural Resources Advisory Board
Total 27,078.2 28,539.725,224.026,335.725,756.4Designated Purposes
Grants250.0 250.0200.0250.00.0AgriFirst/Value Added
200.1 250.0194.1200.1191.9Awards and Premiums at the Illinois State Fair
54.9 70.053.354.953.8Awards and Premiums for Grand Circuit Horseracing atthe Illinois State Fairgrounds
48.8 95.347.348.841.3Awards to Livestock Breeders
0.0 3,500.03,395.03,500.00.0Budget Relief Act - Soil and Water
1,357.4 1,357.41,316.71,357.41,289.5Distribution to County Fair and Exposition Authorities
2,276.1 2,182.32,116.82,182.32,230.6Distribution to Encourage and Aid County Fairs andOther Agricultural Societies
500.0 500.0550.0705.0488.6For Fertilizer Research
20.0 20.019.420.020.0For Illinois' Part in Administration of the FederalBankhead-Jones Farm Tenant Act
40.0 40.038.840.039.2For Mosquito Control
71.2 71.216.871.240.6For Promotion of the Illinois Horseracing and BreedingIndustry
413.0 413.0400.6413.0404.7Grants and Other Purposes for County Fair and StateFair Horseracing
10 - 6
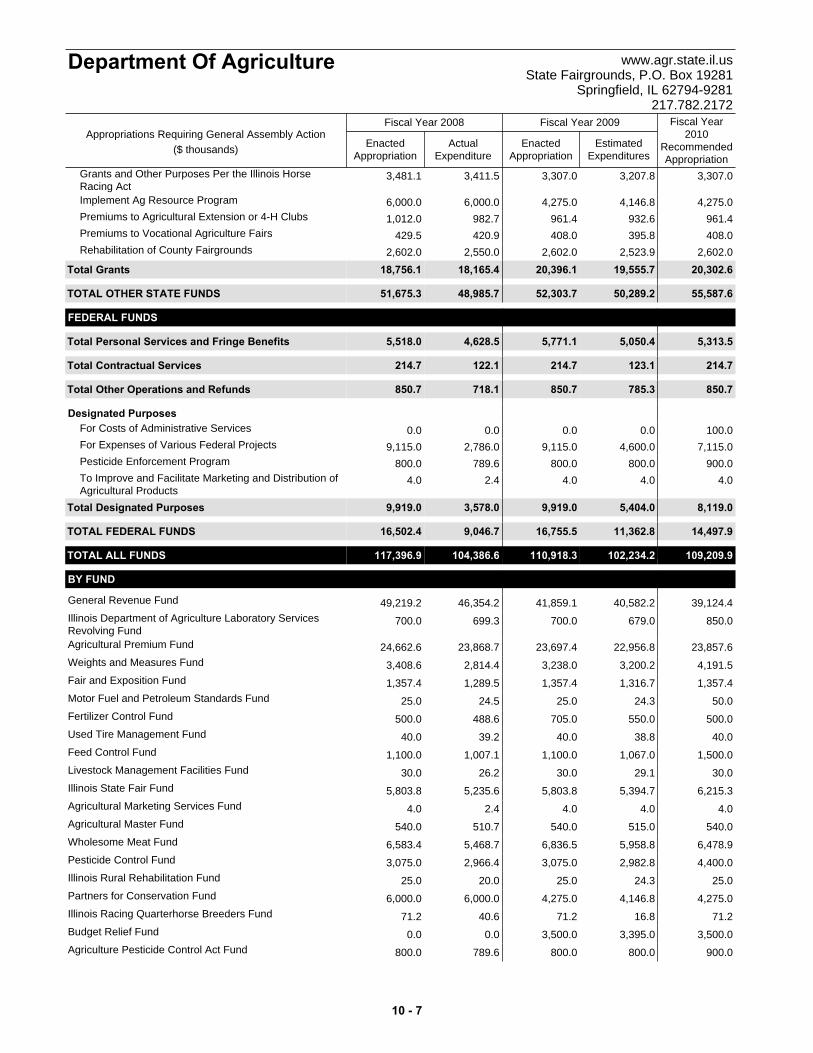
ActualExpenditure
EnactedAppropriation
EstimatedExpenditures
EnactedAppropriation
Fiscal Year2010
RecommendedAppropriation
Fiscal Year 2008 Fiscal Year 2009
Department Of Agriculture www.agr.state.il.usState Fairgrounds, P.O. Box 19281
Springfield, IL 62794-9281217.782.2172
Appropriations Requiring General Assembly Action($ thousands)
3,481.1 3,307.03,207.83,307.03,411.5Grants and Other Purposes Per the Illinois HorseRacing Act
6,000.0 4,275.04,146.84,275.06,000.0Implement Ag Resource Program
1,012.0 961.4932.6961.4982.7Premiums to Agricultural Extension or 4-H Clubs
429.5 408.0395.8408.0420.9Premiums to Vocational Agriculture Fairs
2,602.0 2,602.02,523.92,602.02,550.0Rehabilitation of County Fairgrounds
Total 18,756.1 20,302.619,555.720,396.118,165.4Grants
TOTAL OTHER STATE FUNDS 51,675.3 55,587.650,289.252,303.748,985.7
FEDERAL FUNDS
Total 5,518.0 5,313.55,050.45,771.14,628.5Personal Services and Fringe Benefits
Total 214.7 214.7123.1214.7122.1Contractual Services
Total 850.7 850.7785.3850.7718.1Other Operations and Refunds
Designated Purposes0.0 100.00.00.00.0For Costs of Administrative Services
9,115.0 7,115.04,600.09,115.02,786.0For Expenses of Various Federal Projects
800.0 900.0800.0800.0789.6Pesticide Enforcement Program
4.0 4.04.04.02.4To Improve and Facilitate Marketing and Distribution ofAgricultural Products
Total 9,919.0 8,119.05,404.09,919.03,578.0Designated Purposes
TOTAL FEDERAL FUNDS 16,502.4 14,497.911,362.816,755.59,046.7
TOTAL ALL FUNDS 117,396.9 109,209.9102,234.2110,918.3104,386.6
BY FUND
49,219.2 39,124.440,582.241,859.146,354.2General Revenue Fund
700.0 850.0679.0700.0699.3Illinois Department of Agriculture Laboratory ServicesRevolving Fund
24,662.6 23,857.622,956.823,697.423,868.7Agricultural Premium Fund
3,408.6 4,191.53,200.23,238.02,814.4Weights and Measures Fund
1,357.4 1,357.41,316.71,357.41,289.5Fair and Exposition Fund
25.0 50.024.325.024.5Motor Fuel and Petroleum Standards Fund
500.0 500.0550.0705.0488.6Fertilizer Control Fund
40.0 40.038.840.039.2Used Tire Management Fund
1,100.0 1,500.01,067.01,100.01,007.1Feed Control Fund
30.0 30.029.130.026.2Livestock Management Facilities Fund
5,803.8 6,215.35,394.75,803.85,235.6Illinois State Fair Fund
4.0 4.04.04.02.4Agricultural Marketing Services Fund
540.0 540.0515.0540.0510.7Agricultural Master Fund
6,583.4 6,478.95,958.86,836.55,468.7Wholesome Meat Fund
3,075.0 4,400.02,982.83,075.02,966.4Pesticide Control Fund
25.0 25.024.325.020.0Illinois Rural Rehabilitation Fund
6,000.0 4,275.04,146.84,275.06,000.0Partners for Conservation Fund
71.2 71.216.871.240.6Illinois Racing Quarterhorse Breeders Fund
0.0 3,500.03,395.03,500.00.0Budget Relief Fund
800.0 900.0800.0800.0789.6Agriculture Pesticide Control Act Fund
10 - 7

ActualExpenditure
EnactedAppropriation
EstimatedExpenditures
EnactedAppropriation
Fiscal Year2010
RecommendedAppropriation
Fiscal Year 2008 Fiscal Year 2009
Department Of Agriculture www.agr.state.il.usState Fairgrounds, P.O. Box 19281
Springfield, IL 62794-9281217.782.2172
Appropriations Requiring General Assembly Action($ thousands)
1,609.6 1,582.71,480.51,526.41,554.5Illinois Standardbred Breeders Fund
2,477.1 2,347.92,271.42,344.52,400.2Illinois Thoroughbred Breeders Fund
0.0 4.00.00.00.0Illinois Animal Abuse Fund
250.0 250.0200.0250.00.0Illinois AgriFIRST Program Fund
9,115.0 7,115.04,600.09,115.02,786.0Agriculture Federal Projects Fund
TOTAL ALL FUNDS 117,396.9 109,209.9102,234.2110,918.3104,386.6
BY DIVISION
25,461.3 24,179.923,476.624,815.224,989.5Administrative Services
1,427.2 1,558.91,389.01,421.41,364.3Computer Services
5,821.3 5,418.25,190.25,704.75,365.0Agriculture Regulation
4,612.0 4,211.13,681.44,359.12,787.0Marketing
4,199.2 4,464.04,021.44,100.23,519.5Weights and Measures
7,323.1 7,599.06,680.27,561.96,312.0Animal Industries
9,607.1 9,643.19,316.59,694.48,937.2Meat and Poultry Inspection
17,272.7 13,984.613,098.914,107.815,342.2Land and Water Resources
11,243.9 9,640.07,960.610,589.26,871.3Environmental Programs
12,224.8 11,878.911,237.711,827.511,516.5State Fair/Buildings and Grounds
2,926.3 2,706.02,716.52,800.62,823.8DuQuoin Buildings and Grounds
2,014.7 1,882.31,890.41,948.81,980.5DuQuoin State Fair
13,002.7 12,043.911,574.811,987.512,577.7County Fairs and Horseracing
260.6 0.00.00.00.0Nonrecurring Programs
TOTAL ALL DIVISIONS 117,396.9 109,209.9102,234.2110,918.3104,386.6
HEADCOUNT BY DIVISION Actual Estimated Authorized
16.0 26.522.0Administrative Services
7.0 7.07.0Computer Services
48.5 43.546.5Agriculture Regulation
19.0 25.525.5Marketing
37.0 40.040.0Weights and Measures
54.5 56.549.5Animal Industries
111.0 96.097.0Meat and Poultry Inspection
9.0 13.514.0Land and Water Resources
67.0 66.566.0Environmental Programs
40.5 38.037.5State Fair/Buildings and Grounds
14.0 15.015.0DuQuoin Buildings and Grounds
3.0 3.03.0DuQuoin State Fair
7.0 7.07.0County Fairs and Horseracing
4.0 0.04.0Shared Services
TOTAL HEADCOUNT 437.5 438.0434.0 t
10 - 8

Department Of Commerce And Economic Opportunity
www.illinoisbiz.biz 620 East Adams Street
Springfield, IL 62701 217.782.7500
OVERVIEW Agency Mission To improve Illinois' competitiveness in the global economy by administering a wide range of economic and workforce development programs, services and initiatives designed to create and retain high quality jobs and build strong communities. The agency leads the Illinois economic development process in partnership with businesses, local governments, workers and families. Strategic Priorities
• Create and retain Illinois jobs. • Invest in the Illinois workforce. • Develop strong Illinois communities and a
better quality of life. • Build a statewide culture of innovation and
entrepreneurship. • Promote energy independence. • Catalyze growth in the industries of
tomorrow. Summary of Agency Operations The Department of Commerce and Economic Opportunity (DCEO) enhances Illinois' competitiveness by providing technical and financial assistance to businesses, local governments, workers and families. As the state's lead economic development agency, DCEO works to capitalize on Illinois' strengths as a center of transportation, manufacturing and technology development. DCEO administers a wide range of programs and services in the areas of business, workforce and community development, small business, technology, international trade, tourism, energy, recycling, coal development, homeland security and film production. Agency Resources Employed
FY 2008 FY 2009 FY 2010Actual Enacted Recommended
General Funds 123,406.8 62,667.4 55,217.3Other State Funds 246,930.9 259,621.9 253,850.7
Federal Funds 766,987.3 787,694.8 2,147,921.9Total 1,137,324.9 1,109,984.1 2,456,989.9
Actual Estimated RecommendedHeadcount (FTE) 448.0 477.0 526.0
Appropriations ($ thousands)Fund Category
MAJOR ACCOMPLISHMENTS • Led efforts to develop clean coal in Illinois. A
site in Mattoon, Illinois was selected from a national field in December 2007 to host FutureGen, the $1.8 billion near-zero emissions coal power demonstration plant. The state of Illinois and other partners have invested $7 million to purchase the plant site and continue development work. DCEO continues to support advanced technology for carbon capture and sequestration, and is supporting efforts to capitalize on burgeoning export markets. DCEO has also invested in several new and proposed coal mines with more than 15 million tons of production capacity, including a mine at the mouth of the $3 billion Prairie State Energy Campus, a 1,600 megawatt power facility under construction in Washington County.
• Initiated trade and investment. DCEO's foreign
trade missions have hosted more than 285 participants and have included high-profile trade missions to China and India, as well as missions to Australia, Canada, Chile, Germany, Israel, Japan, Mexico, Poland, Spain and South Africa.
• Promoted energy independence. DCEO
continues to support the production and development of biofuels, such as ethanol and biodiesel, and other alternative renewable energy resources, such as solar and wind. In 2008, Illinois ranked first in wind power projects under development. DCEO also facilitated legislation to create the Renewable Portfolio Standard (25 percent statewide renewable energy use by 2025). The Energy Efficiency Portfolio Standard was created to reduce statewide electric usage by 2 percent by 2015. In June 2008, in conjunction with ComEd and Ameren, DCEO began implementing the new Energy Efficiency Portfolio Programs which will result in substantial electric savings for units of local government, businesses and families.
• Continued support for the Illinois
Entrepreneurship Network. All of the state's small business services have been combined into an integrated system, known as the Illinois Entrepreneurship Network (IEN). This network is
10 - 9
Department Of Commerce And Economic Opportunity
www.illinoisbiz.biz 620 East Adams Street
Springfield, IL 62701 217.782.7500
designed to strengthen the state's capacity to develop small businesses into market successes and to help entrepreneurship become a more dynamic engine of growth. IEN partners include Entrepreneurship Centers, Small Business Development Centers, Procurement Technical Assistance Centers, International Trade Centers, North American Free Trade Opportunity Centers, Manufacturing Extension Centers and Illinois Technology Enterprise Centers.
• Increased Illinois tourism. In the current fiscal
year, domestic and international travelers directly spent more than $29.9 billion in Illinois, a 5.8 percent increase. Hotel tax revenues were more than $220 million, a 7.6 percent increase over receipts. Tourist spending generated more than $5.4 billion in tax revenues for federal, state and local governments, a 4.1 percent increase. These visitor expenditures directly generated 305,460 jobs within Illinois, an increase of 3,940 new jobs. DCEO's Tourism Bureau won two Mercury Awards from the Travel Industry Association of America, one for best TV broadcasting campaign and one for best overall marketing program of all 50 states. DCEO also implemented several other key tourism initiatives, including; Lincoln Bicentennial marketing, African-American Travel Guide, Hispanic Tourism website, and Chicago Access Guide for travelers with disabilities.
• Continued support of business development.
Despite the deepening national recession and global economic slowdown, companies are still choosing to locate in Illinois, continuing the state’s reputation as a business leader. In March 2008, Illinois finished second in Site Selection magazine’s prestigious Governor’s Cup competition, with 362 new plant projects for the year. The Governor’s Cup goes to the state with the most new or expanded capital projects from the previous year as tracked by Site Selection publisher Conway Data Inc.’s New Plant Database.
KEY BUDGET INITIATIVES • Federal Recovery. The department will receive
more than $1 billion in federal stimulus funds to support a variety of economic development programs. The focus of the department with regard to the federal stimulus bill will be programs promoting renewable energy, energy efficiency, clean coal technology, broadband
deployment, job re-training, community development, electric grid expansion, and science and technology research.
• Implement Weatherization Program. In March of 2009, Governor Pat Quinn signed an executive order transferring the Home Weatherization Assistance Program (IHWAP) and Low Income Home Energy Assistance Program (LIHEAP) from the Department of Healthcare and Family Services to DCEO. In the coming fiscal year, DCEO will administer these two energy assistance programs by providing home weatherization assistance to low-income house-holds. The IHWAP program is designed to help low income residents save fuel and money, while increasing the comfort of their homes. The LIHEAP program is designed to assist eligible low-income households pay for winter energy services. The transfer and consolidation of these programs offers the opportunity to improve accessibility and accountability, provide more efficient use of specialized expertise and facilities, and realize a savings in administrative costs.
• Continue to market and develop Illinois tourism. The Bureau of Tourism will support additional domestic and international market development and promotion activities as it continues to increase Illinois' market share of tourists. Illinois needs to reach those markets that demonstrate the greatest potential to provide high-value visitors to the state. The 2008 spring-summer campaign generated a 10:1 investment. By increasing and expanding marketing efforts, Illinois can realize a greater market share and increase the tax benefits to the state, which directly support jobs.
• Promote technology and workforce
development. DCEO will continue to work toward enhancing technology development and workforce training in order to ensure that Illinois businesses and workers remain competitive. DCEO will continue multi-agency efforts to develop the Illinois 21st Century Workforce Pipeline. DCEO also supports the return of the Biotechnology Industry Association (BIO) international convention in Chicago in 2010. The annual BIO convention is the industry's largest gathering of researchers, major international and domestic biotechnology corporations, start-ups, regulators and investors. As home to some of the world's most highly-regarded medical,
10 - 10

Department Of Commerce And Economic Opportunity
www.illinoisbiz.biz 620 East Adams Street
Springfield, IL 62701 217.782.7500
agricultural and industrial research institutions, Illinois will provide an exciting setting for the BIO 2010 International Convention.
• Promote energy efficiency. DCEO will provide
programs designed to facilitate major new energy efficiency provisions. The agency will continue to look for ways to expand the use of alternative energy sources such as wind and solar and through recycling programs.
• Continue to build an entrepreneurial culture.
DCEO will continue to provide the resources to help Illinois’ small businesses and entrepreneurs succeed, including continued support for IEN. Entrepreneurship Centers are the hallmark of the IEN. Regional offices specialize in assisting companies with high growth potential, and accelerate entrepreneurial ventures by helping businesses connect with resources and funding, patents and products, and money and markets. The centers also provide customized marketing strategies that drive product growth.
PROGRAMS Tourism DCEO’s Bureau of Tourism offers programs and services designed to market Illinois as a tourism destination in order to increase domestic and international visitation to the state. The bureau manages statewide tourism industry efforts that result in sustainable and significant economic and quality-of-life benefits for Illinois citizens. This bureau is the state's chief tourism promoter, working to position Illinois as the top location for visitors throughout the country. Tourism is a major industry in this state, contributing over $5.2 billion in tax revenue to state, local and federal governments, and supporting over 300,000 jobs. Through targeted marketing efforts and partnerships with local and regional tourism bureaus and travel professionals, DCEO helps to keep the Illinois travel industry strong and growing. Films The Illinois Film Office helps to bring Hollywood to the heartland by working with the Illinois film production industry to promote and facilitate film production in Illinois. The Illinois Film Office seeks to increase economic growth by increasing the number of productions filmed in Illinois, promoting the state as a center for film, television, commercials, cable and multimedia production. Film office staff target their efforts toward decision-makers involved in the
production of feature films, television series, special movies, commercials, corporate and industrial films, documentaries, music videos, and still photography. Staff also provides valuable technical assistance to film and television production companies by scouting locations, finding production and backup services, and working with local governments, community groups and individuals. Fostering cooperation among these different groups is crucial to increasing Illinois’ share of the film industry's investment in the state. Technology and Industrial Competitiveness DCEO's Bureau of Technology and Industrial Competitiveness offers programs and services to help position Illinois businesses and workers for continued success by supporting the commercialization of new technologies, providing access to modernizing technologies and business practices, developing workforce skills, and promoting safe and healthy workplaces. These programs and services ensure that, as technologies change, the skills of Illinois workers remain on the cutting edge. In addition, the bureau works to ensure that Illinois companies benefit from technological advancements, adopting new technologies to improve productivity and competitiveness. Bureau programs also encourage young people to pursue careers in technology-related fields, help people in underserved areas access technologies that can assist them in advancing their careers, and provide training and assistance to Illinois companies to promote the operation of safe, healthy workplace environments. The bureau also promotes the recruitment, training and employment of targeted populations in the building and construction trades. Business Development DCEO's Bureau of Business Development administers a wide range of programs and services designed to help new and existing Illinois businesses thrive and create jobs. The bureau offers assistance for business retention, expansion, relocation, job training and access to capital in support of economic growth including retaining existing jobs, creating new jobs and making productive investments in Illinois communities. The expert business assistance staff is committed to forging partnerships with the private sector in an effort to build upon Illinois' reputation as a world-class center of commerce. Business Development program offerings include: technical assistance in starting a new business; development of the homeland security industry in Illinois; tax credit programs, and infrastructure assistance that helps large businesses locate or expand in Illinois.
10 - 11
Department Of Commerce And Economic Opportunity
www.illinoisbiz.biz 620 East Adams Street
Springfield, IL 62701 217.782.7500
Coal Development and Marketing DCEO's Office of Coal Development and Marketing works to preserve and strengthen Illinois’ coal production and coal-related industries by providing technical and financial support programs for coal infrastructure, education, research and development, and commercial-scale demonstration of promising clean coal technologies. These programs help encourage the use of Illinois coal in an environmentally-friendly manner and educate consumers about the importance of coal in both the Illinois economy and in supplying the nation's energy needs. Office of Trade and Investment Recognizing the importance of global trade, the DCEO Office of Trade and Investment assists businesses through a multi-level infrastructure of staff located throughout the world, offering programs and services designed to create jobs and commerce in Illinois by helping Illinois firms export their products and attract new foreign direct investment to Illinois. This infrastructure includes the headquarters in Chicago and additional offices in nine key international markets. Through these offices, experienced staff work to help Illinois companies, large and small, explore opportunities around the globe, as well as promote Illinois as a positive venue for foreign investment. Community Development DCEO’s Bureau of Community Development administers programs designed to improve the physical and social infrastructure of Illinois communities by providing financial assistance, technical assistance and other programs to support the development of Illinois community infrastructure. The bureau administers numerous programs designed to improve the quality of life for Illinoisans, including the Community Development Assistance Program (CDAP) and Community Services Block Grant Program (CSBG). Bureau staff works closely with units of local government and a statewide network of Community Action Agencies, not-for-profit organizations and businesses to provide services ranging from job seeking assistance, funding of homeless shelters, health and nutrition support, income management support, and infrastructure improvements needed to attract or retain businesses and jobs.
Energy and Recycling Through a variety of programs and services, DCEO demonstrates the economic development benefits, including job creation, of energy efficiency, renewable energy and recycling. These programs reinforce the interdependence of economic development, sustainable energy, recycling practices and environmental protection. DCEO also promotes leadership by example through the state of Illinois' own energy and recycling policies and practices at state offices and facilities. Individually tailored programs are available to assist Illinois’ citizens, communities, schools, non-profit organizations, businesses, industry and other government agencies that support the bureau's mission. Workforce Development DCEO’s Bureau of Workforce Development works to cultivate a well-trained Illinois workforce by expanding employment and training opportunities to Illinois’ citizens, helping them to achieve financial independence and a better quality of life. The bureau administers the Workforce Investment Act (WIA), the federal government’s hallmark national job training program. WIA encourages statewide economic development by providing job training and employment assistance to youth, adults and dislocated workers in identified high-growth employment sectors. The WIA program establishes applicant eligibility, assesses employability skills and provides training. The bureau provides follow-up services leading to employment retention in high-wage and high-skilled job training and additional support services. The bureau also administers the federal Trade Adjustment Assistance (TAA) Program to provide comprehensive assistance, including unemployment compensation to those workers dislocated from their job because of competition from foreign trade. Incumbent worker training programs administered through this bureau include job training and placement for currently employed low-wage and low-skilled workers and unemployed disadvantaged individuals through a network of partnerships among community-based organizations, economic development organizations and employers throughout the state.
10 - 12

Department Of Commerce And Economic Opportunity
www.illinoisbiz.biz 620 East Adams Street
Springfield, IL 62701 217.782.7500
Program FY 2008 FY 2009 FY 2010 FY 2008 FY 2009 FY 2010Actual Enacted Recommended Actual Estimated Recommended
General Administration 20,754.8 19,692.5 21,886.6 96.0 120.0 118.0Tourism 50,600.8 50,770.2 51,502.2 19.0 19.0 19.0Films 1,077.2 1,169.7 1,085.1 8.0 8.0 8.0Technology and Industrial Competitiveness*
33,180.2 25,368.0 118,078.1 49.0 29.0 34.0
Business Development 43,693.0 41,225.6 42,419.4 52.0 55.0 55.0Coal Development and Marketing 23,856.1 23,856.1 23,856.1 12.0 12.0 12.0Office Of Trade and Investment 5,931.5 9,835.5 6,183.5 17.0 20.0 20.0Community Development* 584,083.4 583,874.5 1,066,921.5 62.0 76.0 94.0Energy and Recycling* 48,784.5 69,284.5 679,000.0 41.0 42.0 50.0Workforce Development* 283,411.4 282,019.4 443,411.4 69.0 70.0 90.0Regional Economic Development 2,916.5 2,888.1 2,646.0 23.0 26.0 26.0
Nonrecurring Projects 39,035.5 0.0 0.0 0.0 0.0 0.0
Total 1,137,324.9 1,109,984.1 2,456,989.9 448.0 477.0 526.0
Appropriations ($ thousands) Headcount (FTE)
*The increase in the FY10 Recommended column for “Technology and Industrial Competitiveness”, “Community Development” and “Workforce Development” are based on funding from the American Recovery and Reinvestment Act.
PERFORMANCE MEASURES
Estimated ProjectedFY 2006 FY 2007 FY 2008 FY 2009 FY 2010
Projected private sector jobs created and retaineda 61,088 30,628 37,272 32,000 32,000b
Workers trained through the Employer Training Investment Program (ETIP)
74,070 84,837 41,447c 30,000 30,000
State of Il linois employment rate 94.8% 94.5% 93.8% 92.6%d 92.1%d
Adult employment retention ratee 82.7% 83.7% 83.7% 84.0% 84.0%Dislocated worker retention rate 90.3% 91.2% 88.8% 90.0% 91.0%
e Includes participants of the portions of the Federal Workforce Investment Act Program administered by DCEO. Measures adults exiting training that are still employed 9 months later. Starting in fiscal year 2006, the measure reflects negotiations with the US Department of Labor to serve clients with a greater range of needs.
ActualPerformance Metric
a Includes jobs projected to be created and retained by Business Development, Smal l Business and Entrepreneurship programs. The number of workers trained through the Employer Training Investment Program is reported separately.b This projection does not include any increases that may occur due to Illinois Works.c Decrease due to reduction in funding.d Source: Global Insight
10 - 13

ActualExpenditure
EnactedAppropriation
EstimatedExpenditures
EnactedAppropriation
Fiscal Year2010
RecommendedAppropriation
Fiscal Year 2008 Fiscal Year 2009
Department Of Commerce AndEconomic Opportunity
www.illinoisbiz.biz620 East Adams Street
Springfield, IL 62701217.782.7500
Appropriations Requiring General Assembly Action($ thousands)
GENERAL FUNDS
Total 13,485.2 12,343.113,245.114,126.312,313.3Personal Services and Fringe Benefits
Total 5,675.7 4,382.14,382.14,517.25,564.8Contractual Services
Total 1,767.9 1,485.21,485.21,532.01,706.1Other Operations and Refunds
Designated Purposes1,722.9 1,500.00.00.01,585.5For costs associated with new and expanding
international markets for Illinois Business and Industries9.6 0.00.09.60.0For administrative and related expenses of the Illinois
Women's Business Ownership Council480.0 0.00.00.0458.7For advertising and promotion
0.0 0.01,455.01,500.00.0Illinois Global Partnership
Total 2,212.5 1,500.01,455.01,509.62,044.2Designated Purposes
Grants0.0 750.00.00.00.0Administration, grant, and investment expenses of
technology initiatives0.0 250.0242.5250.00.0For a grant to the Northeast DuPage Special Recreation
Association202.1 181.9196.0202.1198.1For grants and administrative expenses of NAFTA
Opportunity Centers6,250.0 6,250.03,001.36,250.02,614.9For grants to the Employment Opportunity Grant
Program/ Minority Trades program250.0 250.0242.5250.00.0For grants, contracts, and administrative expenses
associated with the African American FamilyCommission
2,507.5 1,986.82,141.32,207.52,435.9For Small Business Development Centers
5,000.0 5,000.02,420.22,500.04,895.1Grants associated with Entrepreneurship Centers
682.0 613.8641.0682.0666.7Grants for local community development (training andtechnical assistance)
0.0 250.0242.5250.00.0Illinois Guaranteed Job Opportunity Act
1,392.9 1,392.0675.01,392.01,391.8Job Training and Economic Development GrantProgram (JTED)
500.0 500.00.0500.00.0Southern Illinois Economic Development Authority
3,500.0 3,500.03,395.03,500.03,500.0The Chicago State University for Chicagoland RegionalCollege Program
12,492.6 12,500.06,000.06,246.312,232.1The Employer Training Investment Program (ETIP)
942.2 877.2850.0877.2923.4The High Technology School-to-Work Act
435.8 435.8422.0435.8427.1The Illinois Technology Enterprise Corporation Program
769.4 769.4740.0769.4753.7The Veterans Outreach Program
524.0 0.00.00.0512.7Procurement Centers Grants
500.0 0.00.0500.00.0Central Illinois Economic Development Authority
750.0 0.00.00.0750.0Chicago Manufacturing Center
750.0 0.00.00.0735.0For a grant to the Illinois Coalition
1,581.5 0.00.00.01,550.2For grants associated with Homeland Security MarketDevelopment for Illinois Businesses
750.0 0.00.00.0750.0Grant to Illinois Manufacturing Association
150.0 0.00.00.0144.4Illinois Grape and Wine Industry
500.0 0.00.00.0490.0Illinois Manufacturing Extension Centers
59,835.5 0.013,744.914,170.045,643.5Nonrecurring Projects
Total 100,265.5 35,506.934,954.140,982.380,614.5Grants
TOTAL GENERAL FUNDS 123,406.8 55,217.355,521.662,667.4102,243.0
10 - 14

ActualExpenditure
EnactedAppropriation
EstimatedExpenditures
EnactedAppropriation
Fiscal Year2010
RecommendedAppropriation
Fiscal Year 2008 Fiscal Year 2009
Department Of Commerce AndEconomic Opportunity
www.illinoisbiz.biz620 East Adams Street
Springfield, IL 62701217.782.7500
Appropriations Requiring General Assembly Action($ thousands)
OTHER STATE FUNDS
Total 4,031.0 5,226.53,988.54,299.53,830.0Personal Services and Fringe Benefits
Total 1,841.4 2,870.21,760.01,814.41,657.8Contractual Services
Total 1,190.2 1,408.01,180.71,217.21,017.9Other Operations and Refunds
Designated Purposes12,578.7 12,578.712,578.712,578.712,463.9Advertising and Promotion of tourism throughout Illinois
230.0 230.079.1230.07.2Economic Research in the State of Illinois
133.2 133.2129.2133.2129.2For advertising and promotion, including grants,contracts, and administrative costs
500.0 1,200.0485.61,200.019.7Grants to promote international tourism
61.0 61.059.261.056.1Illinois State Fair Ethnic Village expenses
5,536.5 5,536.55,370.45,536.55,451.1Statewide Tourism Promotion and Development
2,740.5 2,740.52,740.42,740.52,663.9To advertise and promote Illinois tourism in internationalmarkets
148.7 0.00.00.0148.7Administrative costs pursuant to the Small BusinessDevelopment Act
0.0 0.02,351.03,506.20.0Illinois Global Partnership
Total 21,928.6 22,479.923,793.525,986.120,940.0Designated Purposes
Grants500.0 1,000.0485.0500.036.5Administration and grants associated with the Ethanol
Fuel Research Program350.0 425.0339.5350.0291.7Expenses of the Small Business Environmental
Assistance Program1,500.0 1,500.04,365.04,500.01,500.0For grants associated with companies relocating their
corporate headquarters to Illinois2,150.0 2,150.02,150.02,150.00.0Good Samaritan Energy Contributions
3,600.0 5,000.03,492.03,600.01,833.2Grant expenses relating to projects that promote EnergyEfficiency in the State of Illinois
0.0 4,000.02,000.04,000.00.0Grants and payments for the High Speed InternetServices and Information Technology Act
5,500.0 5,500.05,002.05,500.05,084.3Grants associated with eliminating technologicaldisparities in local communities
23,856.1 23,856.123,007.623,856.119,138.3Grants associated with the Illinois Coal TechnologyDevelopment Assistance Act
2,500.0 2,500.0500.02,500.0800.0Grants associated with the Small BusinessDevelopment Act
7,276.0 7,275.95,473.87,275.96,192.7Grants for International Tourism (Chicago andDownstate)
3,000.0 5,000.02,550.13,000.0349.6Grants for organizations related to Workforce andEconomic Development
98,184.8 110,685.9103,900.0103,900.090,333.7Grants on Behalf of Eligible Recipients Under theEnergy Assistance Act and Administrative Expenses
9,017.6 9,017.69,017.69,017.69,017.6Grants to Convention and Tourism Bureaus: Balance ofState
2,438.8 2,438.82,438.82,438.82,438.8Grants to Convention and Tourism Bureaus: ChicagoConvention and Visitors Bureau
2,072.3 2,072.32,072.32,072.32,072.3Grants to Convention and Tourism Bureaus: ChicagoTourism Council
792.0 792.0768.2792.0792.0Grants to Regional Tourism Development Organizations
10,500.0 10,500.04,419.010,500.03,308.3Grants, loans and investments pursuant to the SmallBusiness Development Act
2,900.0 2,900.0960.12,900.0187.6Grants, loans, investments, and administrativeexpenses in accordance with Article 8 of the BuildIllinois Act
10 - 15

ActualExpenditure
EnactedAppropriation
EstimatedExpenditures
EnactedAppropriation
Fiscal Year2010
RecommendedAppropriation
Fiscal Year 2008 Fiscal Year 2009
Department Of Commerce AndEconomic Opportunity
www.illinoisbiz.biz620 East Adams Street
Springfield, IL 62701217.782.7500
Appropriations Requiring General Assembly Action($ thousands)
0.0 485.00.00.00.0iBIO 2010
0.0 150.0145.5150.00.0Illinois Grape and Wine Industry Grants
660.0 660.0642.3660.0660.0Illinois Tourism Promotion
308.0 308.0294.7308.0267.1Local Tourism and Convention Bureau Program
9,607.2 10,500.08,969.09,607.28,446.1Solid Waste Planning and Recycling
3,000.0 2,500.01,000.02,500.0133.3The Build Illinois Act
20,077.3 6,500.010,471.320,077.33,374.9The Renewable Energy Resources Program
160.0 160.0155.2160.0156.8The Rural Affairs Institute at Western Illinois University
2,064.6 2,064.62,002.52,064.62,064.6Tourism Attraction Development Grant Program
721.6 721.6700.0721.6680.3Tourism Matching Grant Program: Counties over1,000,000
1,203.4 1,203.41,165.51,203.41,152.6Tourism Matching Grant Program: Counties under1,000,000
4,000.0 0.00.00.00.0Construction of facilities for high-speed Internet access
Total 217,939.6 221,866.1198,486.9226,304.7160,312.3Grants
TOTAL OTHER STATE FUNDS 246,930.9 253,850.7229,209.6259,621.9187,757.9
FEDERAL FUNDS
Total 11,606.2 12,062.110,751.811,740.09,491.4Personal Services and Fringe Benefits
Total 5,642.5 6,342.55,356.75,642.53,620.5Contractual Services
Total 4,800.6 4,979.33,067.04,874.31,105.9Other Operations and Refunds
Designated Purposes250.0 250.0250.0250.00.0Administration, Training, and Technical Assistance for
Weatherization Programs500.0 500.0311.7500.030.4Community Development Assistance Programs
1,037.0 1,037.01,037.01,037.0685.6Expenses Related to the Development and Maintenanceof the Low Income Home Energy Assistance Program(LIHEAP) System
451.0 451.0272.4451.022.8The Occupational Safety and Health AdministrationProgram
Total 2,238.0 2,238.01,871.12,238.0738.8Designated Purposes
Grants0.0 34,000.00.00.00.0Federal Recovery - Community Development Block
Grant0.0 48,000.00.00.00.0Federal Recovery - Community Services Block Grant
Act 0.0 250,000.00.00.00.0Federal Recovery - Grants and Technical Assistance
Services for Nonprofit Community Organizations andOther Operating and Administrative Costs
0.0 20,000.00.00.00.0Federal Recovery - Rural Utilities Service-Telemedicine,Distance Learning, and Broadband
0.0 300,000.00.00.00.0Federal Recovery - The Innovative Technology LoanGuarantee Program
0.0 308,000.00.00.00.0Federal Recovery - The State Energy Program
0.0 2,500.00.00.00.0Federal Recovery - The Workforce Investment Act (HighGrowth & Emerging Industry Sectors)
0.0 26,800.00.00.00.0Federal Recovery - The Workforce Investment Act (WIAAdult)
0.0 68,500.00.00.00.0Federal Recovery - The Workforce Investment Act (WIADislocated Worker)
0.0 62,200.00.00.00.0Federal Recovery - The Workforce Investment Act (WIAYouth)
10 - 16

ActualExpenditure
EnactedAppropriation
EstimatedExpenditures
EnactedAppropriation
Fiscal Year2010
RecommendedAppropriation
Fiscal Year 2008 Fiscal Year 2009
Department Of Commerce AndEconomic Opportunity
www.illinoisbiz.biz620 East Adams Street
Springfield, IL 62701217.782.7500
Appropriations Requiring General Assembly Action($ thousands)
0.0 65,000.00.00.00.0Federal Recovery - Wireless and Broadband
3,000.0 3,000.01,013.43,000.01,153.0For expenses and grants connected with EnergyPrograms (Petroleum), including prior year costs
3,000.0 3,000.01,209.43,000.01,171.6For expenses and grants connected with the StateEnergy Program, including prior year costs
4,000.0 42,000.020,288.024,500.01,766.6Grant expenses connected with DCEO EnergyPrograms
80,000.0 200,000.028,800.080,000.029,614.5Grant to Local Government or other per CommunityDevelopment Act for Cities under 50,000
17,500.0 26,100.017,500.017,500.011,613.7Grants and Technical Assistance Services for NonprofitCommunity Organizations
1,450.0 1,450.0584.01,450.0453.4Grants for Housing Assistance Payments, includingreimbursement of prior year costs
3,000.0 4,000.01,787.43,000.01,786.4Grants for Small Business Development Centers
302,000.0 302,000.0302,000.0302,000.0133,650.0Grants on Behalf of Eligible Recipients Under the LowIncome Home Energy Assistance Act
50,000.0 75,000.028,870.050,000.028,838.9Grants to recipients per Community Services BlockGrant Act
3,000.0 5,000.0774.23,000.099.2Small Business Development Management andTechnical Assistance Programs
500.0 750.0495.0500.0327.4The Procurement Technical Assistance Center Program
275,000.0 275,000.0156,321.2275,000.0160,504.8The Workforce Investment Act
250.0 0.00.0250.0152.3For the US Department of Defense ProcurementAssistance Program
Total 742,700.0 2,122,300.0559,642.6763,200.0371,131.8Grants
TOTAL FEDERAL FUNDS 766,987.3 2,147,921.9580,689.2787,694.8386,088.4
TOTAL ALL FUNDS 1,137,324.9 2,456,989.9865,420.31,109,984.1676,089.3
BY FUND
123,406.8 55,217.355,521.662,667.4102,243.0General Revenue Fund
230.0 230.079.1230.07.2Economic Research and Information Fund
160.0 160.0831.21,166.2156.8Agricultural Premium Fund
9,607.2 10,500.08,969.09,607.28,446.1Solid Waste Management Fund
350.0 425.0339.5350.0291.7Small Business Environmental Assistance Fund
250.0 0.00.0250.0152.3Urban Planning Assistance Fund
500.0 1,000.0485.0500.036.5Alternate Fuels Fund
0.0 4,000.02,000.04,000.00.0High Speed Internet Services and Information TechnologyFund
98,184.8 110,685.9103,900.0103,900.090,333.7Supplemental Low-Income Energy Assistance Fund
3,000.0 5,000.02,550.13,000.0349.6Workforce, Technology, and Economic Development Fund
2,150.0 2,150.02,150.02,150.00.0Good Samaritan Energy Trust Fund
20,077.3 6,500.010,471.320,077.33,374.9Renewable Energy Resources Trust Fund
3,600.0 5,000.03,492.03,600.01,833.2Energy Efficiency Trust Fund
7,276.0 7,275.97,148.89,775.96,192.7International Tourism Fund
8,125.7 11,323.34,343.48,193.93,274.7Commerce and Community Affairs Assistance Fund
2,741.3 2,680.31,782.12,754.01,423.2Federal Industrial Services Fund
18,755.6 277,422.318,779.518,779.511,947.0Energy Administration Fund
1,500.0 1,500.04,365.04,500.01,500.0Corporate Headquarters Relocation Assistance Fund
33,554.1 36,631.233,230.933,972.632,619.5Tourism Promotion Fund
5,500.0 5,500.05,002.05,500.05,084.3Digital Divide Elimination Fund
10 - 17
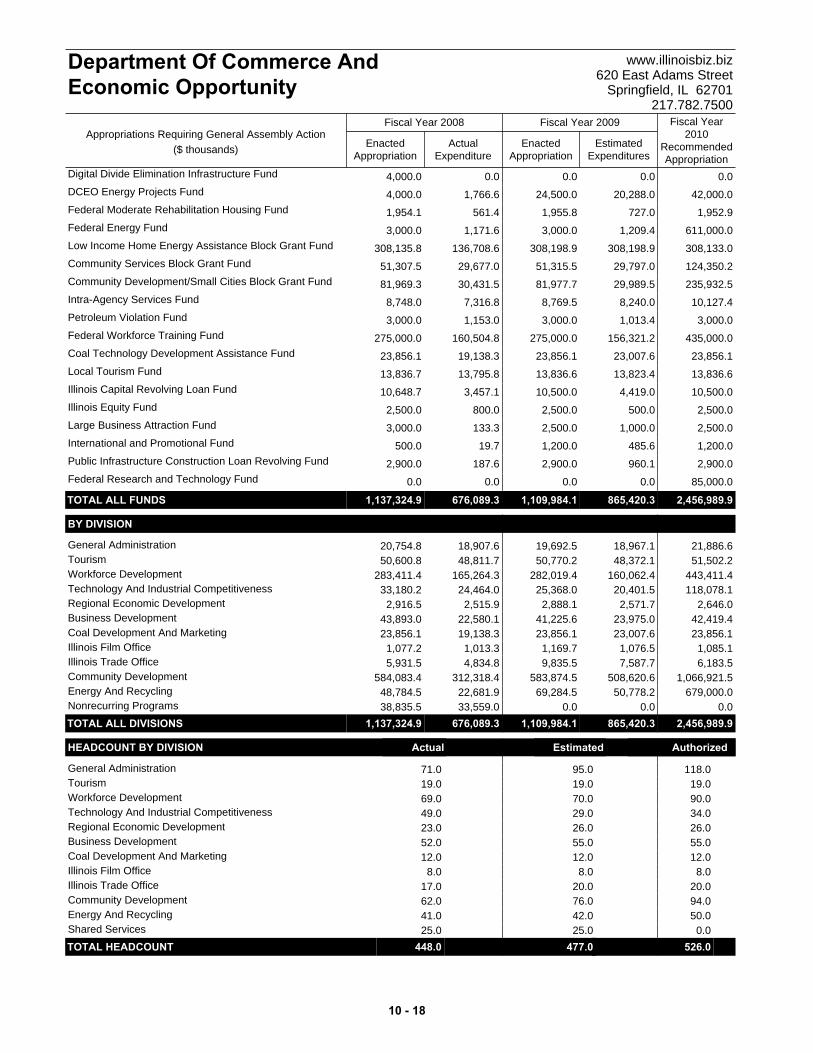
ActualExpenditure
EnactedAppropriation
EstimatedExpenditures
EnactedAppropriation
Fiscal Year2010
RecommendedAppropriation
Fiscal Year 2008 Fiscal Year 2009
Department Of Commerce AndEconomic Opportunity
www.illinoisbiz.biz620 East Adams Street
Springfield, IL 62701217.782.7500
Appropriations Requiring General Assembly Action($ thousands)
4,000.0 0.00.00.00.0Digital Divide Elimination Infrastructure Fund
4,000.0 42,000.020,288.024,500.01,766.6DCEO Energy Projects Fund
1,954.1 1,952.9727.01,955.8561.4Federal Moderate Rehabilitation Housing Fund
3,000.0 611,000.01,209.43,000.01,171.6Federal Energy Fund
308,135.8 308,133.0308,198.9308,198.9136,708.6Low Income Home Energy Assistance Block Grant Fund
51,307.5 124,350.229,797.051,315.529,677.0Community Services Block Grant Fund
81,969.3 235,932.529,989.581,977.730,431.5Community Development/Small Cities Block Grant Fund
8,748.0 10,127.48,240.08,769.57,316.8Intra-Agency Services Fund
3,000.0 3,000.01,013.43,000.01,153.0Petroleum Violation Fund
275,000.0 435,000.0156,321.2275,000.0160,504.8Federal Workforce Training Fund
23,856.1 23,856.123,007.623,856.119,138.3Coal Technology Development Assistance Fund
13,836.7 13,836.613,823.413,836.613,795.8Local Tourism Fund
10,648.7 10,500.04,419.010,500.03,457.1Illinois Capital Revolving Loan Fund
2,500.0 2,500.0500.02,500.0800.0Illinois Equity Fund
3,000.0 2,500.01,000.02,500.0133.3Large Business Attraction Fund
500.0 1,200.0485.61,200.019.7International and Promotional Fund
2,900.0 2,900.0960.12,900.0187.6Public Infrastructure Construction Loan Revolving Fund
0.0 85,000.00.00.00.0Federal Research and Technology Fund
TOTAL ALL FUNDS 1,137,324.9 2,456,989.9865,420.31,109,984.1676,089.3
BY DIVISION
20,754.8 21,886.618,967.119,692.518,907.6General Administration50,600.8 51,502.248,372.150,770.248,811.7Tourism
283,411.4 443,411.4160,062.4282,019.4165,264.3Workforce Development33,180.2 118,078.120,401.525,368.024,464.0Technology And Industrial Competitiveness
2,916.5 2,646.02,571.72,888.12,515.9Regional Economic Development43,893.0 42,419.423,975.041,225.622,580.1Business Development23,856.1 23,856.123,007.623,856.119,138.3Coal Development And Marketing
1,077.2 1,085.11,076.51,169.71,013.3Illinois Film Office5,931.5 6,183.57,587.79,835.54,834.8Illinois Trade Office
584,083.4 1,066,921.5508,620.6583,874.5312,318.4Community Development48,784.5 679,000.050,778.269,284.522,681.9Energy And Recycling38,835.5 0.00.00.033,559.0Nonrecurring Programs
TOTAL ALL DIVISIONS 1,137,324.9 2,456,989.9865,420.31,109,984.1676,089.3
HEADCOUNT BY DIVISION Actual Estimated Authorized
71.0 118.095.0General Administration19.0 19.019.0Tourism69.0 90.070.0Workforce Development49.0 34.029.0Technology And Industrial Competitiveness23.0 26.026.0Regional Economic Development52.0 55.055.0Business Development12.0 12.012.0Coal Development And Marketing
8.0 8.08.0Illinois Film Office17.0 20.020.0Illinois Trade Office62.0 94.076.0Community Development41.0 50.042.0Energy And Recycling25.0 0.025.0Shared Services
TOTAL HEADCOUNT 448.0 526.0477.0 t
10 - 18
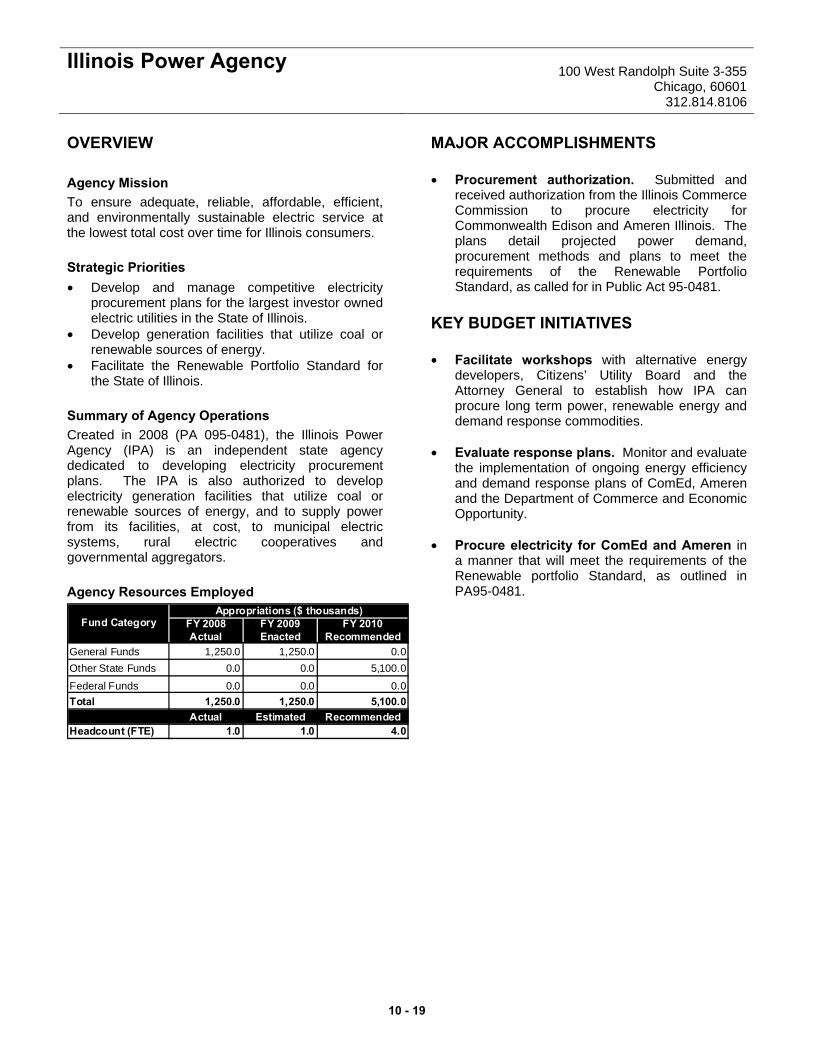
Illinois Power Agency
100 West Randolph Suite 3-355
Chicago, 60601 312.814.8106
OVERVIEW Agency Mission To ensure adequate, reliable, affordable, efficient, and environmentally sustainable electric service at the lowest total cost over time for Illinois consumers. Strategic Priorities • Develop and manage competitive electricity
procurement plans for the largest investor owned electric utilities in the State of Illinois.
• Develop generation facilities that utilize coal or renewable sources of energy.
• Facilitate the Renewable Portfolio Standard for the State of Illinois.
Summary of Agency Operations Created in 2008 (PA 095-0481), the Illinois Power Agency (IPA) is an independent state agency dedicated to developing electricity procurement plans. The IPA is also authorized to develop electricity generation facilities that utilize coal or renewable sources of energy, and to supply power from its facilities, at cost, to municipal electric systems, rural electric cooperatives and governmental aggregators. Agency Resources Employed
FY 2008 FY 2009 FY 2010Actual Enacted Recommended
General Funds 1,250.0 1,250.0 0.0Other State Funds 0.0 0.0 5,100.0
Federal Funds 0.0 0.0 0.0Total 1,250.0 1,250.0 5,100.0
Actual Estimated RecommendedHeadcount (FTE) 1.0 1.0 4.0
Appropriations ($ thousands)Fund Category
MAJOR ACCOMPLISHMENTS • Procurement authorization. Submitted and
received authorization from the Illinois Commerce Commission to procure electricity for Commonwealth Edison and Ameren Illinois. The plans detail projected power demand, procurement methods and plans to meet the requirements of the Renewable Portfolio Standard, as called for in Public Act 95-0481.
KEY BUDGET INITIATIVES • Facilitate workshops with alternative energy
developers, Citizens’ Utility Board and the Attorney General to establish how IPA can procure long term power, renewable energy and demand response commodities.
• Evaluate response plans. Monitor and evaluate
the implementation of ongoing energy efficiency and demand response plans of ComEd, Ameren and the Department of Commerce and Economic Opportunity.
• Procure electricity for ComEd and Ameren in
a manner that will meet the requirements of the Renewable portfolio Standard, as outlined in PA95-0481.
10 - 19

GENERAL FUNDS
Designated Purposes1,250.0 0.00.01,250.00.0For Ordinary and Contingent Expenses of the Illinois
Power Agency.Total 1,250.0 0.00.01,250.00.0Designated Purposes
TOTAL GENERAL FUNDS 1,250.0 0.00.01,250.00.0
OTHER STATE FUNDS
Designated Purposes0.0 550.00.00.00.0For Deposit into the Illinois Power Agency Operations
Fund Pursuant to Subsection (c) of Section 6z-75 of theState Finance Act.
0.0 3,300.00.00.00.0For Ordinary and Contingent Expenses Incurred by theIllinois Power Agency.
0.0 1,250.00.00.00.0For Repayment to GRF for Expenses Related to FiscalYear 2008 and Fiscal Year 2009 Operating Expenses.
Total 0.0 5,100.00.00.00.0Designated Purposes
TOTAL OTHER STATE FUNDS 0.0 5,100.00.00.00.0
TOTAL ALL FUNDS 1,250.0 5,100.00.01,250.00.0
BY FUND
1,250.0 0.00.01,250.00.0General Revenue Fund
0.0 1,800.00.00.00.0Illinois Power Agency Trust Fund
0.0 3,300.00.00.00.0Illinois Power Agency Operations Fund
TOTAL ALL FUNDS 1,250.0 5,100.00.01,250.00.0
BY DIVISION
1,250.0 5,100.00.01,250.00.0General Office
TOTAL ALL DIVISIONS 1,250.0 5,100.00.01,250.00.0
HEADCOUNT BY DIVISION Actual Estimated Authorized
1.0 4.01.0General Office
TOTAL HEADCOUNT 1.0 4.01.0 t
ActualExpenditure
EnactedAppropriation
EstimatedExpenditures
EnactedAppropriation
Fiscal Year2010
RecommendedAppropriation
Fiscal Year 2008 Fiscal Year 2009
Illinois Power Agency100 West Randolph Suite 3-355
Chicago, 60601312.814.8106
Appropriations Requiring General Assembly Action($ thousands)
10 - 20
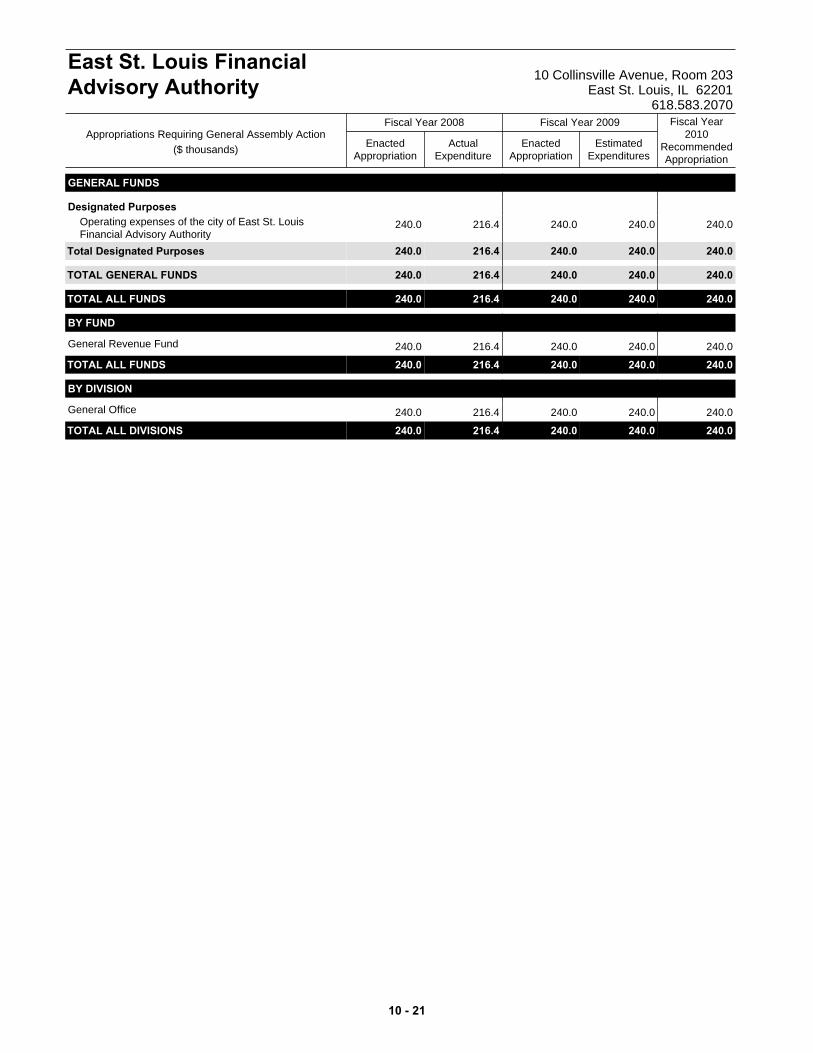
GENERAL FUNDS
Designated Purposes240.0 240.0240.0240.0216.4Operating expenses of the city of East St. Louis
Financial Advisory AuthorityTotal 240.0 240.0240.0240.0216.4Designated Purposes
TOTAL GENERAL FUNDS 240.0 240.0240.0240.0216.4
TOTAL ALL FUNDS 240.0 240.0240.0240.0216.4
BY FUND
240.0 240.0240.0240.0216.4General Revenue Fund
TOTAL ALL FUNDS 240.0 240.0240.0240.0216.4
BY DIVISION
240.0 240.0240.0240.0216.4General Office
TOTAL ALL DIVISIONS 240.0 240.0240.0240.0216.4
ActualExpenditure
EnactedAppropriation
EstimatedExpenditures
EnactedAppropriation
Fiscal Year2010
RecommendedAppropriation
Fiscal Year 2008 Fiscal Year 2009
East St. Louis FinancialAdvisory Authority 10 Collinsville Avenue, Room 203
East St. Louis, IL 62201618.583.2070
Appropriations Requiring General Assembly Action($ thousands)
10 - 21
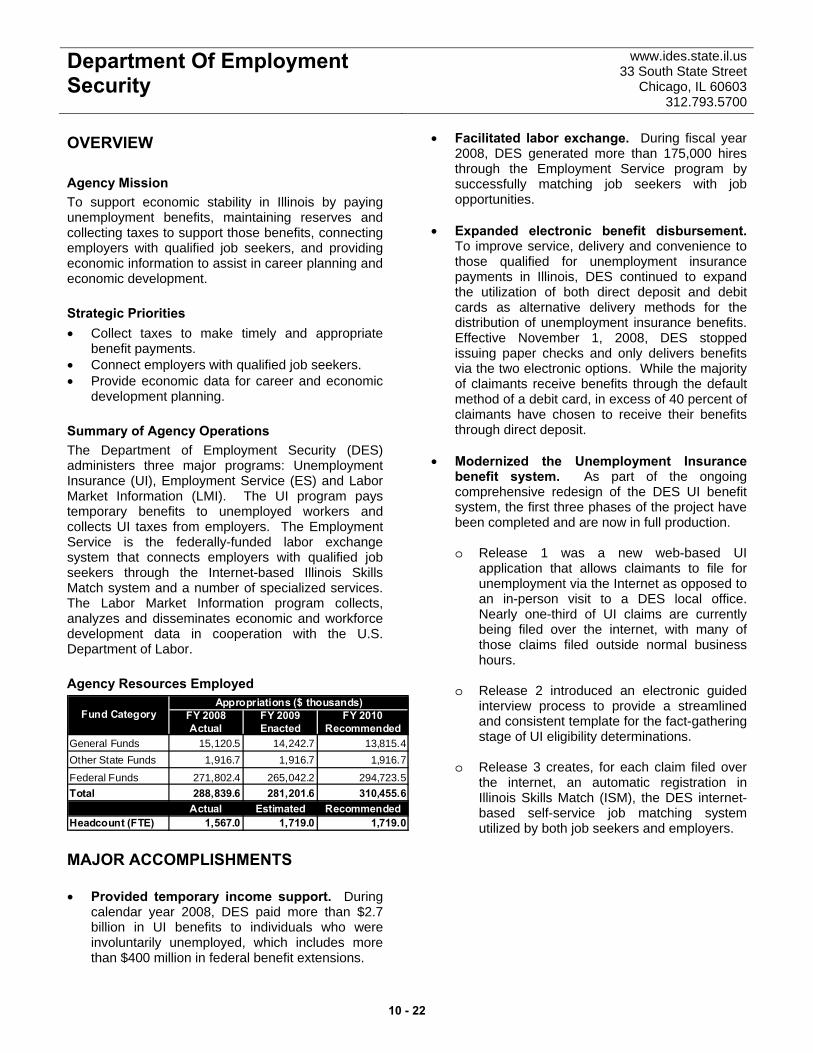
Department Of Employment Security
www.ides.state.il.us 33 South State Street
Chicago, IL 60603 312.793.5700
OVERVIEW Agency Mission To support economic stability in Illinois by paying unemployment benefits, maintaining reserves and collecting taxes to support those benefits, connecting employers with qualified job seekers, and providing economic information to assist in career planning and economic development. Strategic Priorities • Collect taxes to make timely and appropriate
benefit payments. • Connect employers with qualified job seekers. • Provide economic data for career and economic
development planning. Summary of Agency Operations The Department of Employment Security (DES) administers three major programs: Unemployment Insurance (UI), Employment Service (ES) and Labor Market Information (LMI). The UI program pays temporary benefits to unemployed workers and collects UI taxes from employers. The Employment Service is the federally-funded labor exchange system that connects employers with qualified job seekers through the Internet-based Illinois Skills Match system and a number of specialized services. The Labor Market Information program collects, analyzes and disseminates economic and workforce development data in cooperation with the U.S. Department of Labor. Agency Resources Employed
FY 2008 FY 2009 FY 2010Actual Enacted Recommended
General Funds 15,120.5 14,242.7 13,815.4Other State Funds 1,916.7 1,916.7 1,916.7
Federal Funds 271,802.4 265,042.2 294,723.5Total 288,839.6 281,201.6 310,455.6
Actual Estimated RecommendedHeadcount (FTE) 1,567.0 1,719.0 1,719.0
Appropriations ($ thousands)Fund Category
MAJOR ACCOMPLISHMENTS • Provided temporary income support. During
calendar year 2008, DES paid more than $2.7 billion in UI benefits to individuals who were involuntarily unemployed, which includes more than $400 million in federal benefit extensions.
• Facilitated labor exchange. During fiscal year 2008, DES generated more than 175,000 hires through the Employment Service program by successfully matching job seekers with job opportunities.
• Expanded electronic benefit disbursement.
To improve service, delivery and convenience to those qualified for unemployment insurance payments in Illinois, DES continued to expand the utilization of both direct deposit and debit cards as alternative delivery methods for the distribution of unemployment insurance benefits. Effective November 1, 2008, DES stopped issuing paper checks and only delivers benefits via the two electronic options. While the majority of claimants receive benefits through the default method of a debit card, in excess of 40 percent of claimants have chosen to receive their benefits through direct deposit.
• Modernized the Unemployment Insurance
benefit system. As part of the ongoing comprehensive redesign of the DES UI benefit system, the first three phases of the project have been completed and are now in full production.
o Release 1 was a new web-based UI
application that allows claimants to file for unemployment via the Internet as opposed to an in-person visit to a DES local office. Nearly one-third of UI claims are currently being filed over the internet, with many of those claims filed outside normal business hours.
o Release 2 introduced an electronic guided
interview process to provide a streamlined and consistent template for the fact-gathering stage of UI eligibility determinations.
o Release 3 creates, for each claim filed over
the internet, an automatic registration in Illinois Skills Match (ISM), the DES internet-based self-service job matching system utilized by both job seekers and employers.
10 - 22

Department Of Employment Security
www.ides.state.il.us 33 South State Street
Chicago, IL 60603 312.793.5700
KEY BUDGET INITIATIVES • Federal recovery. The agency will receive
approximately $13 million in funding to expand services through the Employment Service Program. This program helps employers fill their vacancies and places job-seekers in the best available jobs, with an emphasis on returning unemployment claimants to work. The agency will also receive an additional $17.5 million to improve the efficiency of Unemployment Insurance administration.
• Upgrade the system that will replace an
unemployment benefit system that is three decades old. The redesign effort is now in its fifth year and is proceeding on a schedule for implementation in the fall of 2009. The custom-built system will streamline the management of the UI program in Illinois to improve customer service, reduce the cost of delivering services and increase the effectiveness of these services. This initiative will be covered by an explicit fiscal year 2010 appropriation request of $15 million from Title III federal funds.
• Reduction of recidivism via the Re-entry
Employment Service Program (RESP). In keeping with the department’s goal of reducing recidivism, DES will continue to offer specialized RESP services to job seekers and employers. RESP prepares formerly incarcerated people for work and helps them transition into their new jobs. Re-entry liaisons are available at DES's Employment and Training Centers and local offices throughout Illinois to help match employers with qualified formerly incarcerated job seekers. The RESP liaisons also develop jobs through outreach to employers to address any concerns or misconceptions and to educate them about the benefits of and incentives for hiring ex-offenders.
• Expand veteran employment initiatives:
o Local Veterans Employment Representatives (LVER) increase outreach to employers and engage in advocacy efforts with hiring executives to further employment opportunities for veterans, encourage the hiring of veterans with disabilities and generally assist veterans to gain and retain employment. LVER staff conducts seminars for employers and job search workshops for
veterans seeking employment. In addition, LVER staff works to ensure veterans priority of service regarding all services in the employment service delivery system.
o The Disabled Veterans Outreach Program
(DVOP) specializes in providing more intensive services to meet the employment needs of veterans with disabilities and other eligible veterans, with the maximum emphasis directed toward serving those who are economically or educationally disadvantaged, homeless or have other barriers to employment.
o The Transition Assistance Program (TAP)
meets the changing needs of service members during their period of transition into civilian life by offering job-search assistance and related services. TAP consists of comprehensive three-day workshops at selected military installations where attendees learn about job searches, career decision-making, current occupational and labor market conditions, resume and cover letter preparation and interviewing techniques. Participants also are provided with an evaluation of their employability relative to the job market and information on the most current veterans' benefits.
PROGRAMS Unemployment Insurance The UI program pays temporary benefits to unemployed workers and collects UI taxes from employers. Individuals visit offices located throughout the state to file initial UI claims and if eligible, can claim additional weeks of UI benefits via Teleserve, an automated telephone certification system. DES also has an internet initial claims filing option as an alternative to in-person claims filing. The agency also collects taxes on a quarterly basis from employers and collaborates with the Illinois Department of Revenue on TaxNet, a system that allows employers to file tax reports and payments over the internet. Employment Service The Employment Service is Illinois' federally-funded labor exchange system serving employers and job seekers by filling employers' job vacancies with qualified workers and placing job seekers in the best available jobs, including services designed specifically to meet the needs of veterans. The
10 - 23

Department Of Employment Security
www.ides.state.il.us 33 South State Street
Chicago, IL 60603 312.793.5700
service also administers a number of smaller, specialized services and apprenticeship program information and referrals. In addition, the program administers tax credits, such as the Work Opportunity Tax Credit and assists employers with the Foreign Labor Certification program. Labor Market Information DES collects, analyzes and distributes information on employment statistics, job forecasts, wages and
demographic characteristics, and other economic and workforce development data in cooperation with the U.S. Department of Labor. The program's customers range from job seekers, employers and the general public to state and local policymakers. The agency also uses its data to provide career information, via the internet, to primary and secondary school students, guidance counselors and adults.
Program FY 2008 FY 2009 FY 2010 FY 2008 FY 2009 FY 2010Actual Enacted Recommended Actual Estimated Recommended
Unemployment Insurance 226,326.5 223,592.5 246,275.2 1,210.7 1,328.4 1,328.4Employment Service 43,821.7 41,106.7 46,957.6 307.8 334.8 334.8Labor Market Information 18,691.4 16,502.4 17,222.8 48.5 55.9 55.9
Total 288,839.6 281,201.6 310,455.6 1,567.0 1,719.0 1,719.0
Appropriations ($ thousands) Headcount (FTE)
PERFORMANCE MEASURES Estimated Projected
FY 2006 FY 2007 FY 2008 FY 2009 FY 2010Percent of First Time Payments Made Within 14 Days of First Compensable Week
89.8% 89.0% 89.2% 90.0% 90.0%
Percent of Appeals Decisions Made Within 30 Days 81.6% 80.6% 84.5% 84.5% 84.5%Percent of Employers Submitting Tax Payments Within 30 Days of Due Date
98.6% 98.3% 98.2% 98.6% 98.6%
Percent of Employer Liability Determinations Made Within 180 Days of Liability Occurrence
86.8% 91.4% 91.6% 91.6% 91.6%
Cost Per Employer Report Processed ($) 17.44 18.91 18.54 18.54 18.54Percentage of Unemployment Insurance Recipients Exhausting Maximum Benefits
41.5% 35.6% 36.7% 36.7% 36.7%
Number of Customer Interactions Via Internet for Economic Analysis Information
385,657 384,170 445,152 450,000 450,000
ActualPerformance Metric
10 - 24
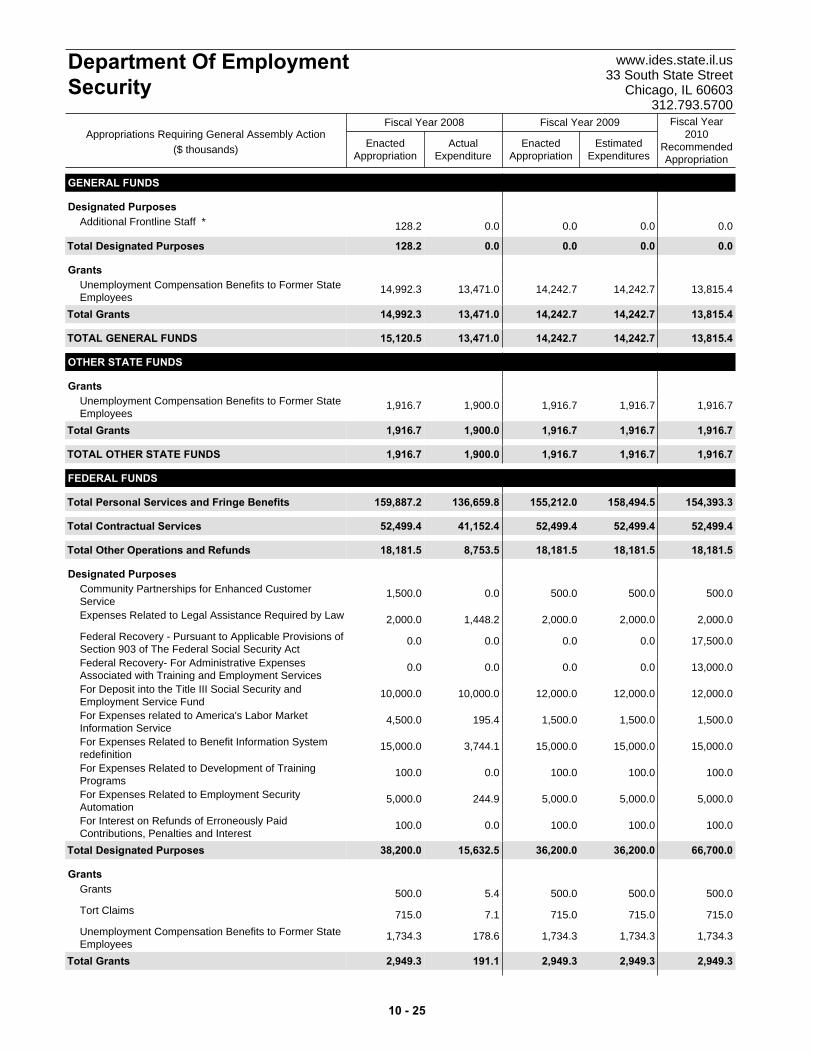
ActualExpenditure
EnactedAppropriation
EstimatedExpenditures
EnactedAppropriation
Fiscal Year2010
RecommendedAppropriation
Fiscal Year 2008 Fiscal Year 2009
Department Of EmploymentSecurity
www.ides.state.il.us33 South State Street
Chicago, IL 60603312.793.5700
Appropriations Requiring General Assembly Action($ thousands)
GENERAL FUNDS
Designated Purposes
128.2 0.00.00.00.0Additional Frontline Staff *
Total 128.2 0.00.00.00.0Designated Purposes
Grants
14,992.3 13,815.414,242.714,242.713,471.0Unemployment Compensation Benefits to Former StateEmployees
Total 14,992.3 13,815.414,242.714,242.713,471.0Grants
TOTAL GENERAL FUNDS 15,120.5 13,815.414,242.714,242.713,471.0
OTHER STATE FUNDS
Grants
1,916.7 1,916.71,916.71,916.71,900.0Unemployment Compensation Benefits to Former StateEmployees
Total 1,916.7 1,916.71,916.71,916.71,900.0Grants
TOTAL OTHER STATE FUNDS 1,916.7 1,916.71,916.71,916.71,900.0
FEDERAL FUNDS
Total 159,887.2 154,393.3158,494.5155,212.0136,659.8Personal Services and Fringe Benefits
Total 52,499.4 52,499.452,499.452,499.441,152.4Contractual Services
Total 18,181.5 18,181.518,181.518,181.58,753.5Other Operations and Refunds
Designated Purposes
1,500.0 500.0500.0500.00.0Community Partnerships for Enhanced CustomerService
2,000.0 2,000.02,000.02,000.01,448.2Expenses Related to Legal Assistance Required by Law
0.0 17,500.00.00.00.0Federal Recovery - Pursuant to Applicable Provisions ofSection 903 of The Federal Social Security Act
0.0 13,000.00.00.00.0Federal Recovery- For Administrative ExpensesAssociated with Training and Employment Services
10,000.0 12,000.012,000.012,000.010,000.0For Deposit into the Title III Social Security andEmployment Service Fund
4,500.0 1,500.01,500.01,500.0195.4For Expenses related to America's Labor MarketInformation Service
15,000.0 15,000.015,000.015,000.03,744.1For Expenses Related to Benefit Information Systemredefinition
100.0 100.0100.0100.00.0For Expenses Related to Development of TrainingPrograms
5,000.0 5,000.05,000.05,000.0244.9For Expenses Related to Employment SecurityAutomation
100.0 100.0100.0100.00.0For Interest on Refunds of Erroneously PaidContributions, Penalties and Interest
Total 38,200.0 66,700.036,200.036,200.015,632.5Designated Purposes
Grants
500.0 500.0500.0500.05.4Grants
715.0 715.0715.0715.07.1Tort Claims
1,734.3 1,734.31,734.31,734.3178.6Unemployment Compensation Benefits to Former StateEmployees
Total 2,949.3 2,949.32,949.32,949.3191.1Grants
10 - 25

ActualExpenditure
EnactedAppropriation
EstimatedExpenditures
EnactedAppropriation
Fiscal Year2010
RecommendedAppropriation
Fiscal Year 2008 Fiscal Year 2009
Department Of EmploymentSecurity
www.ides.state.il.us33 South State Street
Chicago, IL 60603312.793.5700
Appropriations Requiring General Assembly Action($ thousands)
Capital Improvements
85.0 0.00.00.00.0P.A. 87-1178
Total 85.0 0.00.00.00.0Capital Improvements
TOTAL FEDERAL FUNDS 271,802.4 294,723.5268,324.7265,042.2202,389.4
TOTAL ALL FUNDS 288,839.6 310,455.6284,484.1281,201.6217,760.4
BY FUND
15,120.5 13,815.414,242.714,242.713,471.0General Revenue Fund
1,900.0 1,900.01,900.01,900.01,900.0Road Fund
259,702.4 280,623.5254,224.7250,942.2190,941.2Title III Social Security and Employment Fund
12,100.0 14,100.014,100.014,100.011,448.2Unemployment Compensation Special Administration Fund
16.7 16.716.716.70.0IMSA Income Fund
TOTAL ALL FUNDS 288,839.6 310,455.6284,484.1281,201.6217,760.4
BY DIVISION
11,085.4 11,544.311,673.311,446.49,540.5Offices of The Director
88,429.4 89,646.490,411.489,779.669,565.4Finance and Administration
18,643.3 17,466.417,893.717,893.715,549.6Trust Fund Unit
170,681.5 191,798.5164,505.7162,081.9123,104.9Workforce Development
TOTAL ALL DIVISIONS 288,839.6 310,455.6284,484.1281,201.6217,760.4
HEADCOUNT BY DIVISION Actual Estimated Authorized
109.0 119.5119.5Offices of The Director
264.0 305.0305.0Finance and Administration
1,194.0 1,294.51,294.5Workforce Development
TOTAL HEADCOUNT 1,567.0 1,719.01,719.0 t
10 - 26
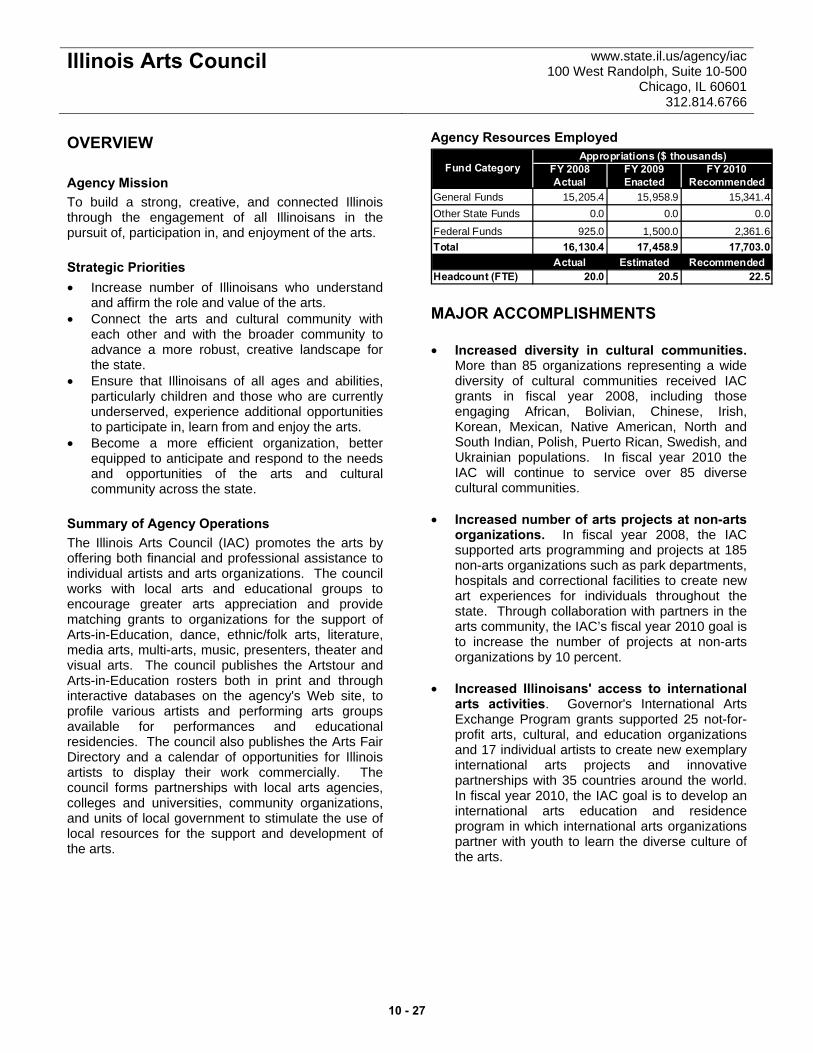
Illinois Arts Council www.state.il.us/agency/iac 100 West Randolph, Suite 10-500
Chicago, IL 60601 312.814.6766
OVERVIEW Agency Mission To build a strong, creative, and connected Illinois through the engagement of all Illinoisans in the pursuit of, participation in, and enjoyment of the arts. Strategic Priorities • Increase number of Illinoisans who understand
and affirm the role and value of the arts. • Connect the arts and cultural community with
each other and with the broader community to advance a more robust, creative landscape for the state.
• Ensure that Illinoisans of all ages and abilities, particularly children and those who are currently underserved, experience additional opportunities to participate in, learn from and enjoy the arts.
• Become a more efficient organization, better equipped to anticipate and respond to the needs and opportunities of the arts and cultural community across the state.
Summary of Agency Operations The Illinois Arts Council (IAC) promotes the arts by offering both financial and professional assistance to individual artists and arts organizations. The council works with local arts and educational groups to encourage greater arts appreciation and provide matching grants to organizations for the support of Arts-in-Education, dance, ethnic/folk arts, literature, media arts, multi-arts, music, presenters, theater and visual arts. The council publishes the Artstour and Arts-in-Education rosters both in print and through interactive databases on the agency's Web site, to profile various artists and performing arts groups available for performances and educational residencies. The council also publishes the Arts Fair Directory and a calendar of opportunities for Illinois artists to display their work commercially. The council forms partnerships with local arts agencies, colleges and universities, community organizations, and units of local government to stimulate the use of local resources for the support and development of the arts.
Agency Resources Employed
FY 2008 FY 2009 FY 2010Actual Enacted Recommended
General Funds 15,205.4 15,958.9 15,341.4Other State Funds 0.0 0.0 0.0
Federal Funds 925.0 1,500.0 2,361.6Total 16,130.4 17,458.9 17,703.0
Actual Estimated RecommendedHeadcount (FTE) 20.0 20.5 22.5
Appropriations ($ thousands)Fund Category
MAJOR ACCOMPLISHMENTS • Increased diversity in cultural communities.
More than 85 organizations representing a wide diversity of cultural communities received IAC grants in fiscal year 2008, including those engaging African, Bolivian, Chinese, Irish, Korean, Mexican, Native American, North and South Indian, Polish, Puerto Rican, Swedish, and Ukrainian populations. In fiscal year 2010 the IAC will continue to service over 85 diverse cultural communities.
• Increased number of arts projects at non-arts
organizations. In fiscal year 2008, the IAC supported arts programming and projects at 185 non-arts organizations such as park departments, hospitals and correctional facilities to create new art experiences for individuals throughout the state. Through collaboration with partners in the arts community, the IAC’s fiscal year 2010 goal is to increase the number of projects at non-arts organizations by 10 percent.
• Increased Illinoisans' access to international
arts activities. Governor's International Arts Exchange Program grants supported 25 not-for-profit arts, cultural, and education organizations and 17 individual artists to create new exemplary international arts projects and innovative partnerships with 35 countries around the world. In fiscal year 2010, the IAC goal is to develop an international arts education and residence program in which international arts organizations partner with youth to learn the diverse culture of the arts.
10 - 27
Illinois Arts Council www.state.il.us/agency/iac 100 West Randolph, Suite 10-500
Chicago, IL 60601 312.814.6766
• Increased services to the field. In fiscal year 2008, IAC grants supported 22 Community Arts Access Program agencies, 38 local arts agencies and 19 service organizations assisting targeted populations with unimpeded access to the arts and providing outreach and communication initiatives directed toward the arts community and general public.
KEY BUDGET INITIATIVES • Federal Recovery. The department will receive
approximately $362,000 for the National Endowment for the Arts to aid artists and arts organizations.
• Develop interagency partnerships. Through a
unique partnership, the Illinois State Board of Education and the IAC will continue to provide grants to school districts and other eligible applicants for purposes of supporting arts and foreign language education in schools.
• Implement new high school poetry and dance
programs. The council secured an additional $500,000 in federal funding to implement a new regional poetry recitation program in Illinois’ high schools and a dance program featuring the presentation of the works of dance masters in communities throughout the state.
• Support the Education Leaders Institute. This
institute brings together school leaders, legislators, policy makers, educators, consultants and scholars from up to five states to conferences to discuss and meet a shared arts education challenge.
• Increase visibility of the Governor’s
International Arts Exchange Program. This program works with Illinois presenters on the expansion and development of downstate venues for international artists and companies.
PROGRAMS Arts Education The council provides support ranging from two weeks to six months to not-for-profit organizations for professional artist residencies. These grants support residencies sponsored by libraries, park districts, churches, schools, colleges, local arts agencies,
municipalities, hospitals, community centers, youth organizations and senior centers. Arts Organizations The Arts Organizations Grant Program encourages and supports arts programming of outstanding merit and quality in a variety of disciplines by providing grants to nonprofit organizations, community organizations and educational institutions throughout the state. Targeted Constituencies Through the Targeted Constituencies Program, IAC provides grants to assist Illinoisans in gaining access to the arts and provides outreach and communication initiatives targeting the arts community and the general public. Some of the grants included in this category are literary awards, fellowships, artist residency programs and the Artstour Program, which provides support for Illinois performing groups and artists. Illinois Humanities Council The Illinois Humanities Council (IHC) is an educational, nonprofit organization that promotes greater understanding of, appreciation for, and involvement in the humanities of Illinois through its programs and services. IHC provides leadership and financial support in the development of programs including discussions, lectures, performances, exhibitions, written materials and more. Public Radio and Television The council encourages the growth and development of public radio and television stations throughout the state by providing them with operating support grants. According to legislative mandate, two types of grants, basic and operating, are issued each year. General Administration The General Administration segment of the agency provides a wide range of support to maximize the efficiency of agency programs, such as day to day operations of the agency, information technology assistance and property management. International Grant Awards The Governor’s International Arts Exchange Program was created by IAC to promote the increased understanding of diverse cultures worldwide through international arts exchanges, with emphasis on education. These exchanges are coordinated by IAC with other state agencies, corporations, foundations, local and overseas arts organizations and academic institutions.
10 - 28
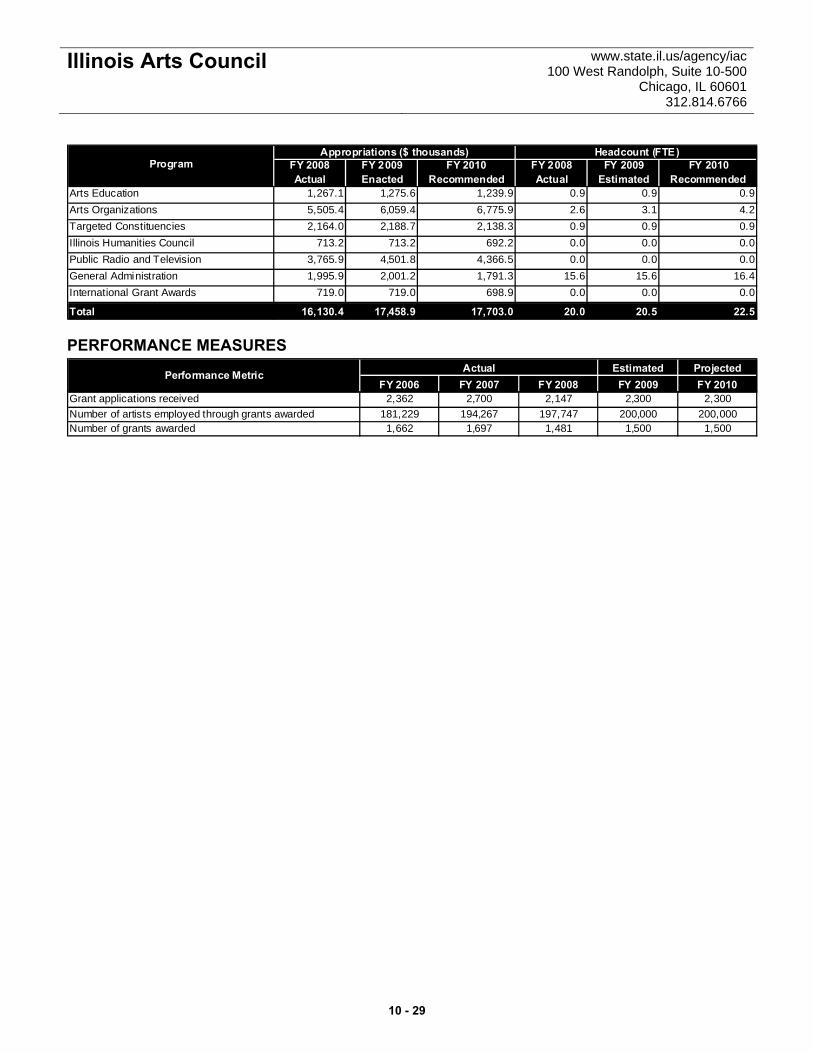
Illinois Arts Council www.state.il.us/agency/iac 100 West Randolph, Suite 10-500
Chicago, IL 60601 312.814.6766
Program FY 2008 FY 2009 FY 2010 FY 2008 FY 2009 FY 2010Actual Enacted Recommended Actual Estimated Recommended
Arts Education 1,267.1 1,275.6 1,239.9 0.9 0.9 0.9Arts Organizations 5,505.4 6,059.4 6,775.9 2.6 3.1 4.2Targeted Constituencies 2,164.0 2,188.7 2,138.3 0.9 0.9 0.9Illinois Humanities Council 713.2 713.2 692.2 0.0 0.0 0.0Public Radio and Television 3,765.9 4,501.8 4,366.5 0.0 0.0 0.0General Administration 1,995.9 2,001.2 1,791.3 15.6 15.6 16.4International Grant Awards 719.0 719.0 698.9 0.0 0.0 0.0
Total 16,130.4 17,458.9 17,703.0 20.0 20.5 22.5
Appropriations ($ thousands) Headcount (FTE)
PERFORMANCE MEASURES Estimated Projected
FY 2006 FY 2007 FY 2008 FY 2009 FY 2010Grant applications received 2,362 2,700 2,147 2,300 2,300Number of artists employed through grants awarded 181,229 194,267 197,747 200,000 200,000Number of grants awarded 1,662 1,697 1,481 1,500 1,500
ActualPerformance Metric
10 - 29
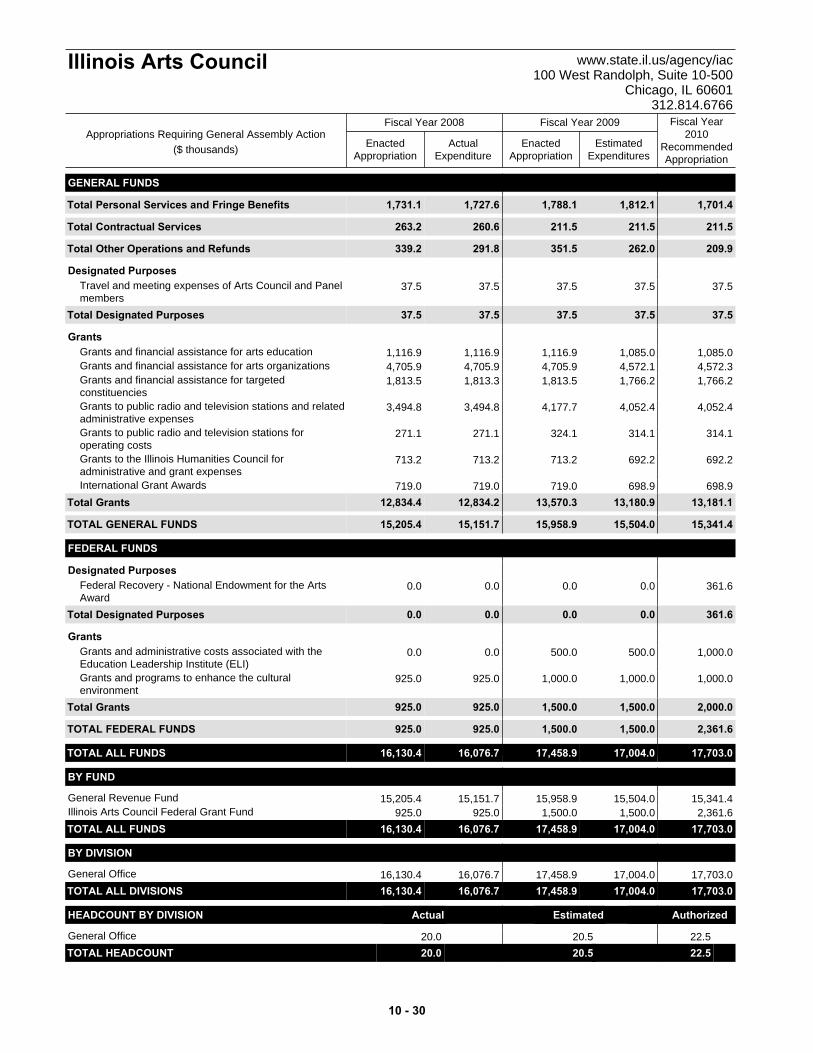
GENERAL FUNDS
Total 1,731.1 1,701.41,812.11,788.11,727.6Personal Services and Fringe Benefits
Total 263.2 211.5211.5211.5260.6Contractual Services
Total 339.2 209.9262.0351.5291.8Other Operations and Refunds
Designated Purposes37.5 37.537.537.537.5Travel and meeting expenses of Arts Council and Panel
membersTotal 37.5 37.537.537.537.5Designated Purposes
Grants1,116.9 1,085.01,085.01,116.91,116.9Grants and financial assistance for arts education4,705.9 4,572.34,572.14,705.94,705.9Grants and financial assistance for arts organizations1,813.5 1,766.21,766.21,813.51,813.3Grants and financial assistance for targeted
constituencies3,494.8 4,052.44,052.44,177.73,494.8Grants to public radio and television stations and related
administrative expenses271.1 314.1314.1324.1271.1Grants to public radio and television stations for
operating costs713.2 692.2692.2713.2713.2Grants to the Illinois Humanities Council for
administrative and grant expenses719.0 698.9698.9719.0719.0International Grant Awards
Total 12,834.4 13,181.113,180.913,570.312,834.2Grants
TOTAL GENERAL FUNDS 15,205.4 15,341.415,504.015,958.915,151.7
FEDERAL FUNDS
Designated Purposes0.0 361.60.00.00.0Federal Recovery - National Endowment for the Arts
AwardTotal 0.0 361.60.00.00.0Designated Purposes
Grants0.0 1,000.0500.0500.00.0Grants and administrative costs associated with the
Education Leadership Institute (ELI) 925.0 1,000.01,000.01,000.0925.0Grants and programs to enhance the cultural
environmentTotal 925.0 2,000.01,500.01,500.0925.0Grants
TOTAL FEDERAL FUNDS 925.0 2,361.61,500.01,500.0925.0
TOTAL ALL FUNDS 16,130.4 17,703.017,004.017,458.916,076.7
BY FUND
15,205.4 15,341.415,504.015,958.915,151.7General Revenue Fund925.0 2,361.61,500.01,500.0925.0Illinois Arts Council Federal Grant Fund
TOTAL ALL FUNDS 16,130.4 17,703.017,004.017,458.916,076.7
BY DIVISION
16,130.4 17,703.017,004.017,458.916,076.7General OfficeTOTAL ALL DIVISIONS 16,130.4 17,703.017,004.017,458.916,076.7
HEADCOUNT BY DIVISION Actual Estimated Authorized
20.0 22.520.5General OfficeTOTAL HEADCOUNT 20.0 22.520.5 t
ActualExpenditure
EnactedAppropriation
EstimatedExpenditures
EnactedAppropriation
Fiscal Year2010
RecommendedAppropriation
Fiscal Year 2008 Fiscal Year 2009
Illinois Arts Council www.state.il.us/agency/iac100 West Randolph, Suite 10-500
Chicago, IL 60601312.814.6766
Appropriations Requiring General Assembly Action($ thousands)
10 - 30
Illinois Finance Authority www.il-fa.com 180 N. Stetson, Suite 2555
Chicago, IL 60601 312.651.1300
OVERVIEW Agency Mission To foster economic development, create and retain jobs and improve the quality of life in Illinois by providing access to capital to public and private entities throughout our state. Strategic Priorities • Reduce the cost of Illinois capital projects by
issuing federally tax-exempt debt on behalf of qualifying entities.
• Increase access to affordable capital and spur private investment in new or underserved markets by participating in loans, providing loan guarantees and low-interest loans, as well as other financial structures approved by the authority’s board of directors.
• Assist local industries and communities to create jobs and improve quality of life.
Summary of Agency Operations The Illinois Finance Authority (IFA) is a self-financed statewide issuer of municipal bonds for capital projects that support non-profit 501(c)(3) corporations, including healthcare, education, cultural and social service entities. The IFA aims to spur economic development throughout Illinois by reducing the cost of capital and creating and retaining jobs in the manufacturing, energy and agricultural sectors. The IFA also helps units of local government and rural communities throughout Illinois to obtain lower cost financing. The IFA acts primarily as a conduit issuer of revenue bonds. Borrowers with qualified projects can obtain lower, federally tax-exempt interest rates that greatly reduce their borrowing costs, leading to the retention and creation of Illinois jobs. Conduit revenue bonds issued by the IFA are obligations of the borrower, not the state of Illinois or the IFA. In addition to bonds, IFA makes loans and invests capital as part of its efforts to foster economic growth. The IFA is a self-financed agency. With the exception of specific, limited programs, IFA receives no state General Revenue funds to support its operations; IFA supports its operations through fees charged to borrowers that obtain IFA financing.
MAJOR ACCOMPLISHMENTS • Financed more than 780 projects and funded
$15.3 billion in capital projects in Illinois since IFA’s inception in 2004. In 2008, IFA ranked among the top 20 municipal issuers nationwide, and second largest issuer in the Midwest.
• Supported Illinois energy development by
financing Blackhawk Biofuels, a biodiesel facility in Danville; Illinois River Energy, an ethanol facility in Rochelle; and Agriwind, a wind turbine installation in Tiskilwa.
• Increased support to farms and businesses
related to agriculture through loan guarantees, federally tax-exempt beginning farmer bonds, and participation loans. In 2008, 70 projects or 38 percent of IFA’s total number of transactions directly supported the Illinois agricultural economy.
• Helped more than 25 hospitals and healthcare
systems manage the auction rate crisis by facilitating the efficient conversion and refunding of bonds, resulting in millions of dollars in interest rate cost savings to Illinois hospitals and healthcare systems over the life of their bonds.
• Expanded the Commercial Paper Revenue
Notes program utilized by higher education and other nonprofits to provide short-term financing for facility upgrades, especially in support of the Sustainable University Compact (green facilities).
KEY BUDGET INITIATIVES • Partner with stakeholders to effectively
leverage Illinois energy resources in support of clean, efficient American energy.
• Expand IFA healthcare initiative to include
small, rural and urban hospitals, including safety-net hospitals and community providers of behavioral care.
• Update agriculture programs to reflect
contemporary economic development needs in rural communities, as well as to expand markets for Illinois agricultural exporters and producers of Illinois biofuel feedstocks.
• Partner with the Office of the State Fire
Marshall to administer both the Fire Truck and the Ambulance Revolving Loan Funds.
10 - 31
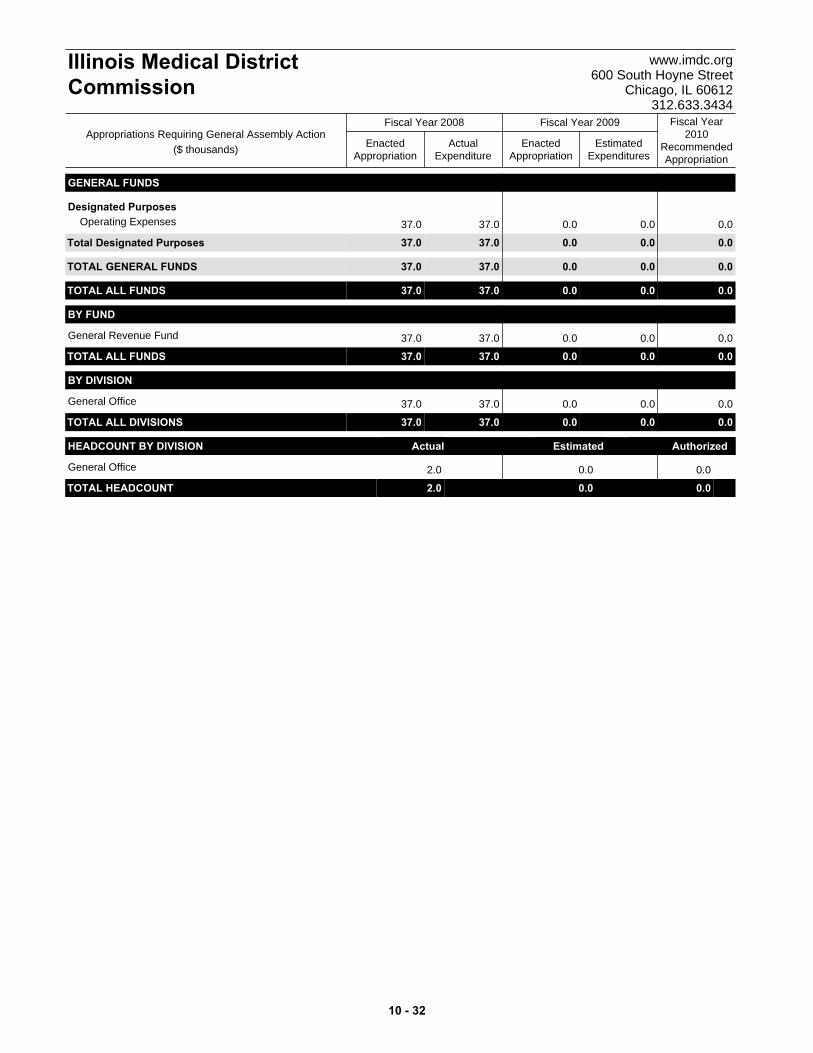
GENERAL FUNDS
Designated Purposes37.0 0.00.00.037.0Operating Expenses
Total 37.0 0.00.00.037.0Designated Purposes
TOTAL GENERAL FUNDS 37.0 0.00.00.037.0
TOTAL ALL FUNDS 37.0 0.00.00.037.0
BY FUND
37.0 0.00.00.037.0General Revenue Fund
TOTAL ALL FUNDS 37.0 0.00.00.037.0
BY DIVISION
37.0 0.00.00.037.0General Office
TOTAL ALL DIVISIONS 37.0 0.00.00.037.0
HEADCOUNT BY DIVISION Actual Estimated Authorized
2.0 0.00.0General Office
TOTAL HEADCOUNT 2.0 0.00.0 t
ActualExpenditure
EnactedAppropriation
EstimatedExpenditures
EnactedAppropriation
Fiscal Year2010
RecommendedAppropriation
Fiscal Year 2008 Fiscal Year 2009
Illinois Medical DistrictCommission
www.imdc.org600 South Hoyne Street
Chicago, IL 60612312.633.3434
Appropriations Requiring General Assembly Action($ thousands)
10 - 32
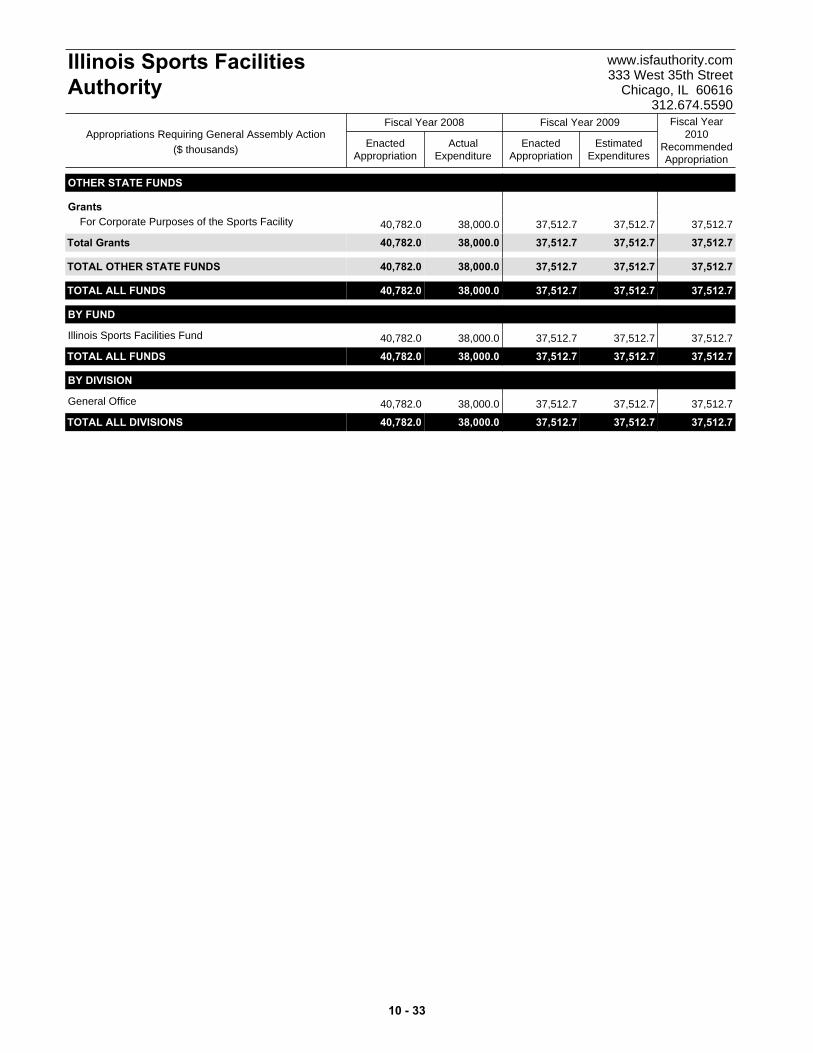
OTHER STATE FUNDS
Grants40,782.0 37,512.737,512.737,512.738,000.0For Corporate Purposes of the Sports Facility
Total 40,782.0 37,512.737,512.737,512.738,000.0Grants
TOTAL OTHER STATE FUNDS 40,782.0 37,512.737,512.737,512.738,000.0
TOTAL ALL FUNDS 40,782.0 37,512.737,512.737,512.738,000.0
BY FUND
40,782.0 37,512.737,512.737,512.738,000.0Illinois Sports Facilities Fund
TOTAL ALL FUNDS 40,782.0 37,512.737,512.737,512.738,000.0
BY DIVISION
40,782.0 37,512.737,512.737,512.738,000.0General Office
TOTAL ALL DIVISIONS 40,782.0 37,512.737,512.737,512.738,000.0
ActualExpenditure
EnactedAppropriation
EstimatedExpenditures
EnactedAppropriation
Fiscal Year2010
RecommendedAppropriation
Fiscal Year 2008 Fiscal Year 2009
Illinois Sports FacilitiesAuthority
www.isfauthority.com333 West 35th Street
Chicago, IL 60616312.674.5590
Appropriations Requiring General Assembly Action($ thousands)
10 - 33
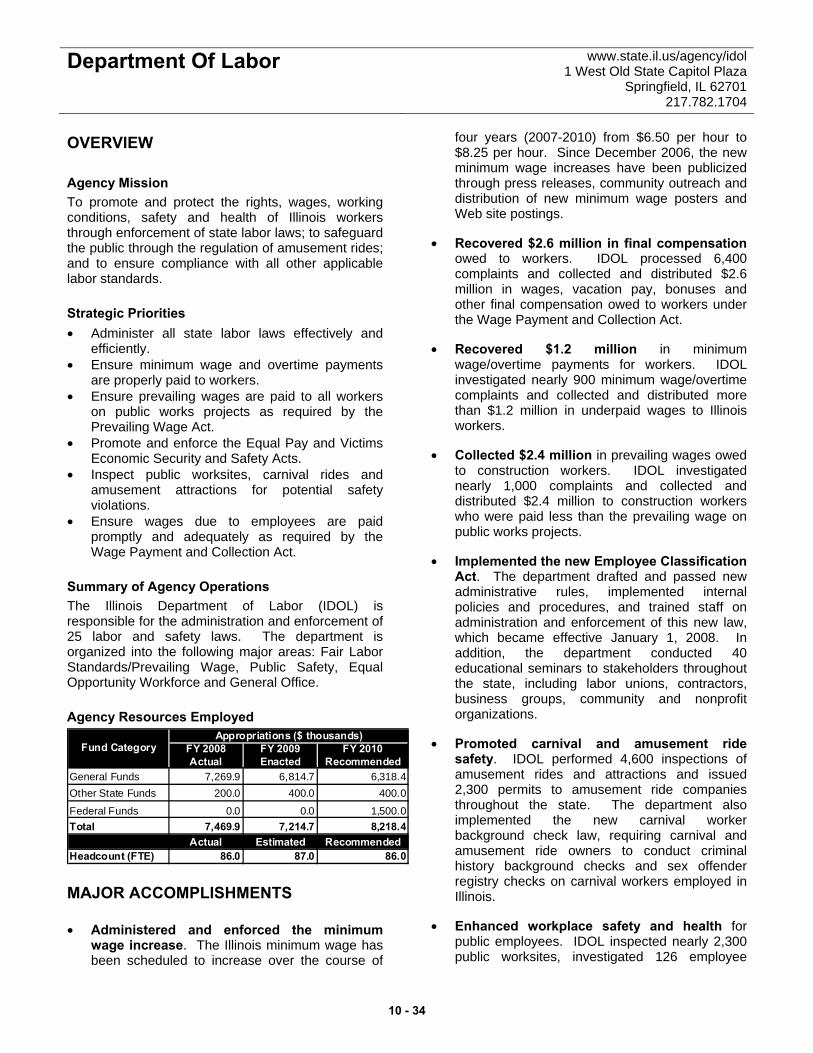
Department Of Labor www.state.il.us/agency/idol 1 West Old State Capitol Plaza
Springfield, IL 62701 217.782.1704
OVERVIEW Agency Mission To promote and protect the rights, wages, working conditions, safety and health of Illinois workers through enforcement of state labor laws; to safeguard the public through the regulation of amusement rides; and to ensure compliance with all other applicable labor standards. Strategic Priorities • Administer all state labor laws effectively and
efficiently. • Ensure minimum wage and overtime payments
are properly paid to workers. • Ensure prevailing wages are paid to all workers
on public works projects as required by the Prevailing Wage Act.
• Promote and enforce the Equal Pay and Victims Economic Security and Safety Acts.
• Inspect public worksites, carnival rides and amusement attractions for potential safety violations.
• Ensure wages due to employees are paid promptly and adequately as required by the Wage Payment and Collection Act.
Summary of Agency Operations The Illinois Department of Labor (IDOL) is responsible for the administration and enforcement of 25 labor and safety laws. The department is organized into the following major areas: Fair Labor Standards/Prevailing Wage, Public Safety, Equal Opportunity Workforce and General Office. Agency Resources Employed
FY 2008 FY 2009 FY 2010Actual Enacted Recommended
General Funds 7,269.9 6,814.7 6,318.4Other State Funds 200.0 400.0 400.0
Federal Funds 0.0 0.0 1,500.0Total 7,469.9 7,214.7 8,218.4
Actual Estimated RecommendedHeadcount (FTE) 86.0 87.0 86.0
Appropriations ($ thousands)Fund Category
MAJOR ACCOMPLISHMENTS • Administered and enforced the minimum
wage increase. The Illinois minimum wage has been scheduled to increase over the course of
four years (2007-2010) from $6.50 per hour to $8.25 per hour. Since December 2006, the new minimum wage increases have been publicized through press releases, community outreach and distribution of new minimum wage posters and Web site postings.
• Recovered $2.6 million in final compensation owed to workers. IDOL processed 6,400 complaints and collected and distributed $2.6 million in wages, vacation pay, bonuses and other final compensation owed to workers under the Wage Payment and Collection Act.
• Recovered $1.2 million in minimum wage/overtime payments for workers. IDOL investigated nearly 900 minimum wage/overtime complaints and collected and distributed more than $1.2 million in underpaid wages to Illinois workers.
• Collected $2.4 million in prevailing wages owed to construction workers. IDOL investigated nearly 1,000 complaints and collected and distributed $2.4 million to construction workers who were paid less than the prevailing wage on public works projects.
• Implemented the new Employee Classification Act. The department drafted and passed new administrative rules, implemented internal policies and procedures, and trained staff on administration and enforcement of this new law, which became effective January 1, 2008. In addition, the department conducted 40 educational seminars to stakeholders throughout the state, including labor unions, contractors, business groups, community and nonprofit organizations.
• Promoted carnival and amusement ride safety. IDOL performed 4,600 inspections of amusement rides and attractions and issued 2,300 permits to amusement ride companies throughout the state. The department also implemented the new carnival worker background check law, requiring carnival and amusement ride owners to conduct criminal history background checks and sex offender registry checks on carnival workers employed in Illinois.
• Enhanced workplace safety and health for public employees. IDOL inspected nearly 2,300 public worksites, investigated 126 employee
10 - 34
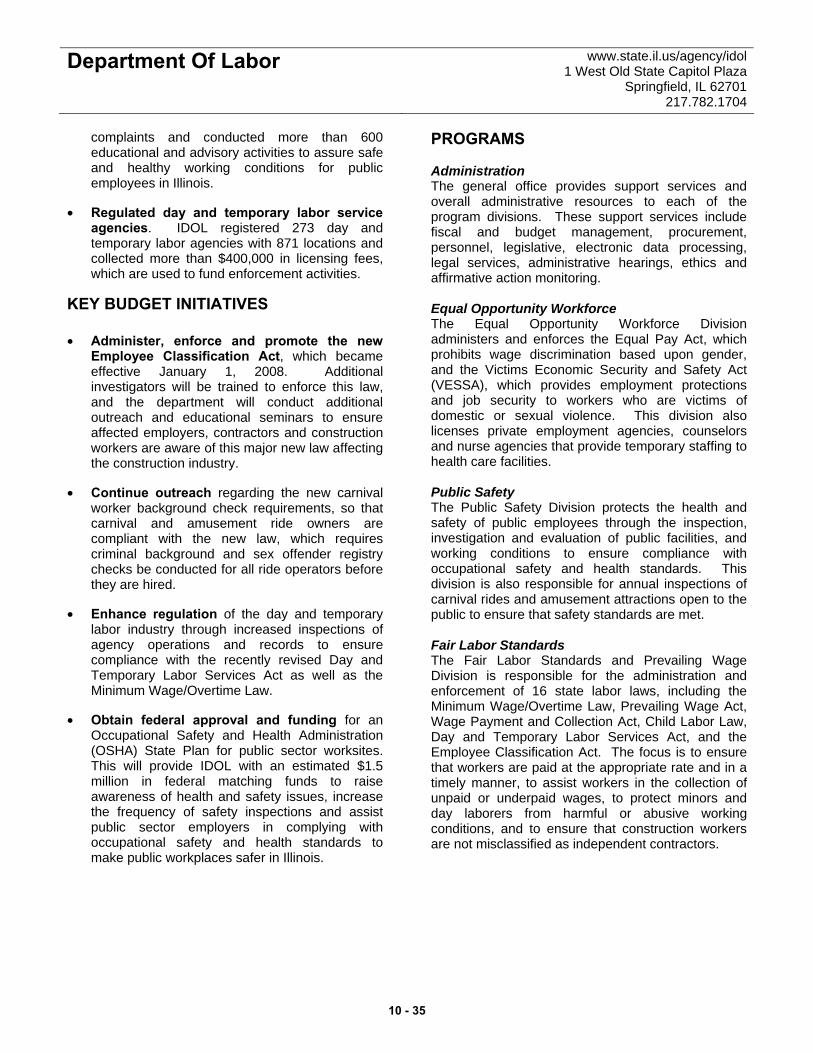
Department Of Labor www.state.il.us/agency/idol 1 West Old State Capitol Plaza
Springfield, IL 62701 217.782.1704
complaints and conducted more than 600 educational and advisory activities to assure safe and healthy working conditions for public employees in Illinois.
• Regulated day and temporary labor service agencies. IDOL registered 273 day and temporary labor agencies with 871 locations and collected more than $400,000 in licensing fees, which are used to fund enforcement activities.
KEY BUDGET INITIATIVES • Administer, enforce and promote the new
Employee Classification Act, which became effective January 1, 2008. Additional investigators will be trained to enforce this law, and the department will conduct additional outreach and educational seminars to ensure affected employers, contractors and construction workers are aware of this major new law affecting the construction industry.
• Continue outreach regarding the new carnival worker background check requirements, so that carnival and amusement ride owners are compliant with the new law, which requires criminal background and sex offender registry checks be conducted for all ride operators before they are hired.
• Enhance regulation of the day and temporary labor industry through increased inspections of agency operations and records to ensure compliance with the recently revised Day and Temporary Labor Services Act as well as the Minimum Wage/Overtime Law.
• Obtain federal approval and funding for an Occupational Safety and Health Administration (OSHA) State Plan for public sector worksites. This will provide IDOL with an estimated $1.5 million in federal matching funds to raise awareness of health and safety issues, increase the frequency of safety inspections and assist public sector employers in complying with occupational safety and health standards to make public workplaces safer in Illinois.
PROGRAMS Administration The general office provides support services and overall administrative resources to each of the program divisions. These support services include fiscal and budget management, procurement, personnel, legislative, electronic data processing, legal services, administrative hearings, ethics and affirmative action monitoring. Equal Opportunity Workforce The Equal Opportunity Workforce Division administers and enforces the Equal Pay Act, which prohibits wage discrimination based upon gender, and the Victims Economic Security and Safety Act (VESSA), which provides employment protections and job security to workers who are victims of domestic or sexual violence. This division also licenses private employment agencies, counselors and nurse agencies that provide temporary staffing to health care facilities. Public Safety The Public Safety Division protects the health and safety of public employees through the inspection, investigation and evaluation of public facilities, and working conditions to ensure compliance with occupational safety and health standards. This division is also responsible for annual inspections of carnival rides and amusement attractions open to the public to ensure that safety standards are met. Fair Labor Standards The Fair Labor Standards and Prevailing Wage Division is responsible for the administration and enforcement of 16 state labor laws, including the Minimum Wage/Overtime Law, Prevailing Wage Act, Wage Payment and Collection Act, Child Labor Law, Day and Temporary Labor Services Act, and the Employee Classification Act. The focus is to ensure that workers are paid at the appropriate rate and in a timely manner, to assist workers in the collection of unpaid or underpaid wages, to protect minors and day laborers from harmful or abusive working conditions, and to ensure that construction workers are not misclassified as independent contractors.
10 - 35

Department Of Labor www.state.il.us/agency/idol 1 West Old State Capitol Plaza
Springfield, IL 62701 217.782.1704
Program FY 2008 FY 2009 FY 2010 FY 2008 FY 2009 FY 2010Actual Enacted Recommended Actual Estimated Recommended
Administration 1,758.8 1,724.2 1,990.7 14.0 21.0 21.0Equal Opportunity Workforce 671.3 50.0 0.0 1.0 0.0 0.0Public Safety 1,292.6 1,450.4 2,776.5 21.0 18.0 17.0Fair Labor Standards 3,747.2 3,990.1 3,451.2 50.0 48.0 48.0
Total 7,469.9 7,214.7 8,218.4 86.0 87.0 86.0
Appropriations ($ thousands) Headcount (FTE)
PERFORMANCE MEASURES Estimated Projected
FY 2006 FY 2007 FY 2008 FY 2009 FY 2010Average time to complete an Equal Pay claim case (days) 70 70 112 110 90
Average time to complete a minimum wage and overtime claim case (days)
325 290 345 350 300
Average time to complete a prevailing wage claim case (days)
135 90 145 150 150
Average time to collect and distribute wages and penalties under the Prevailing Wage Act (days)
29 30 39 30 30
Percentage of Equal Opportunity Work Place participants entering workforce with jobs paying above minimum wage
66.7% 70.0% 110.0% n/aa n/a
ActualPerformance Metric
a Funding for this program was eliminated in the FY 2009 budget.
10 - 36
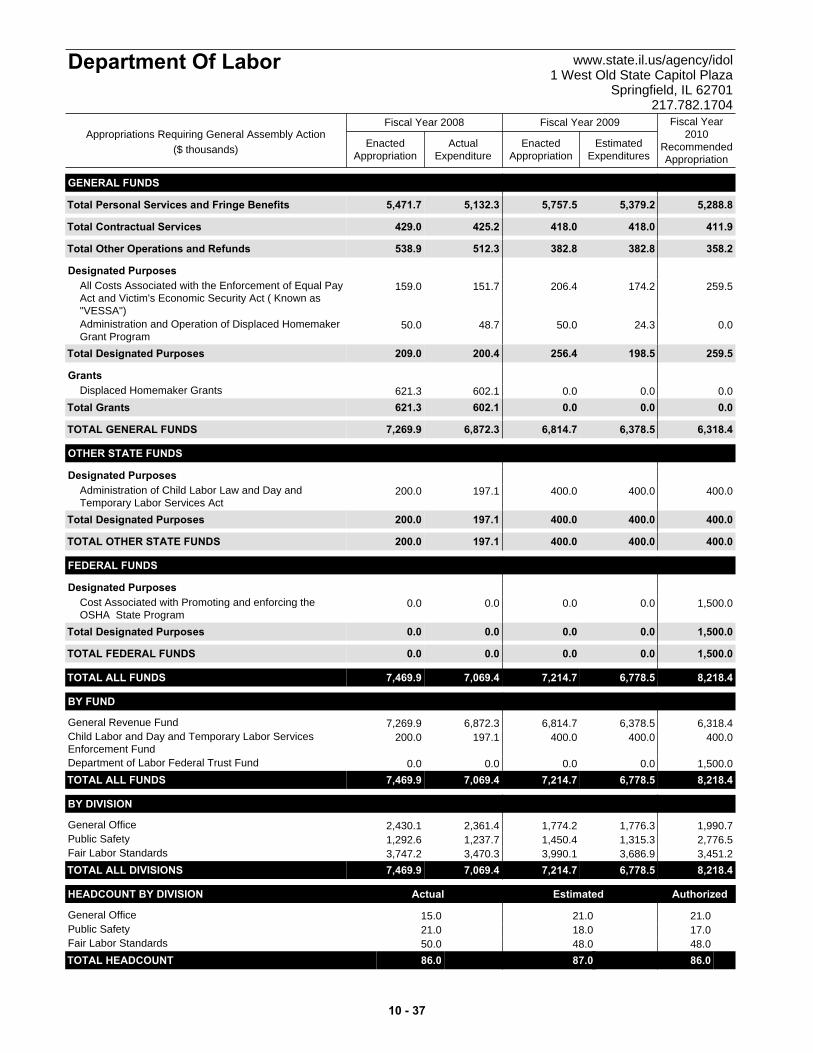
GENERAL FUNDS
Total 5,471.7 5,288.85,379.25,757.55,132.3Personal Services and Fringe Benefits
Total 429.0 411.9418.0418.0425.2Contractual Services
Total 538.9 358.2382.8382.8512.3Other Operations and Refunds
Designated Purposes159.0 259.5174.2206.4151.7All Costs Associated with the Enforcement of Equal Pay
Act and Victim's Economic Security Act ( Known as"VESSA")
50.0 0.024.350.048.7Administration and Operation of Displaced HomemakerGrant Program
Total 209.0 259.5198.5256.4200.4Designated Purposes
Grants621.3 0.00.00.0602.1Displaced Homemaker Grants
Total 621.3 0.00.00.0602.1Grants
TOTAL GENERAL FUNDS 7,269.9 6,318.46,378.56,814.76,872.3
OTHER STATE FUNDS
Designated Purposes200.0 400.0400.0400.0197.1Administration of Child Labor Law and Day and
Temporary Labor Services ActTotal 200.0 400.0400.0400.0197.1Designated Purposes
TOTAL OTHER STATE FUNDS 200.0 400.0400.0400.0197.1
FEDERAL FUNDS
Designated Purposes0.0 1,500.00.00.00.0Cost Associated with Promoting and enforcing the
OSHA State ProgramTotal 0.0 1,500.00.00.00.0Designated Purposes
TOTAL FEDERAL FUNDS 0.0 1,500.00.00.00.0
TOTAL ALL FUNDS 7,469.9 8,218.46,778.57,214.77,069.4
BY FUND
7,269.9 6,318.46,378.56,814.76,872.3General Revenue Fund200.0 400.0400.0400.0197.1Child Labor and Day and Temporary Labor Services
Enforcement Fund0.0 1,500.00.00.00.0Department of Labor Federal Trust Fund
TOTAL ALL FUNDS 7,469.9 8,218.46,778.57,214.77,069.4
BY DIVISION
2,430.1 1,990.71,776.31,774.22,361.4General Office1,292.6 2,776.51,315.31,450.41,237.7Public Safety3,747.2 3,451.23,686.93,990.13,470.3Fair Labor Standards
TOTAL ALL DIVISIONS 7,469.9 8,218.46,778.57,214.77,069.4
HEADCOUNT BY DIVISION Actual Estimated Authorized
15.0 21.021.0General Office21.0 17.018.0Public Safety50.0 48.048.0Fair Labor Standards
TOTAL HEADCOUNT 86.0 86.087.0 t
ActualExpenditure
EnactedAppropriation
EstimatedExpenditures
EnactedAppropriation
Fiscal Year2010
RecommendedAppropriation
Fiscal Year 2008 Fiscal Year 2009
Department Of Labor www.state.il.us/agency/idol1 West Old State Capitol Plaza
Springfield, IL 62701217.782.1704
Appropriations Requiring General Assembly Action($ thousands)
10 - 37

OTHER STATE FUNDS
Grants31,622.8 31,600.130,751.731,570.230,410.2Debt Service on the Authority's Dedicated State Tax
Revenue Bonds126,087.8 138,992.3130,969.9131,996.3125,481.4Debt Service on the Authority's McCormick Place
Expansion Project BondsTotal 157,710.6 170,592.4161,721.5163,566.5155,891.6Grants
TOTAL OTHER STATE FUNDS 157,710.6 170,592.4161,721.5163,566.5155,891.6
TOTAL ALL FUNDS 157,710.6 170,592.4161,721.5163,566.5155,891.6
BY FUND
126,087.8 138,992.3130,969.9131,996.3125,481.4McCormick Place Expansion Project Fund
31,622.8 31,600.130,751.731,570.230,410.2Metropolitan Fair and Exposition Authority ImprovementBond FundTOTAL ALL FUNDS 157,710.6 170,592.4161,721.5163,566.5155,891.6
BY DIVISION
157,710.6 170,592.4161,721.5163,566.5155,891.6General Office
TOTAL ALL DIVISIONS 157,710.6 170,592.4161,721.5163,566.5155,891.6
ActualExpenditure
EnactedAppropriation
EstimatedExpenditures
EnactedAppropriation
Fiscal Year2010
RecommendedAppropriation
Fiscal Year 2008 Fiscal Year 2009
Metropolitan Pier AndExposition Authority
www.mpea.com301 East Cermak Road
Chicago, IL 60616312.791.6288
Appropriations Requiring General Assembly Action($ thousands)
10 - 38
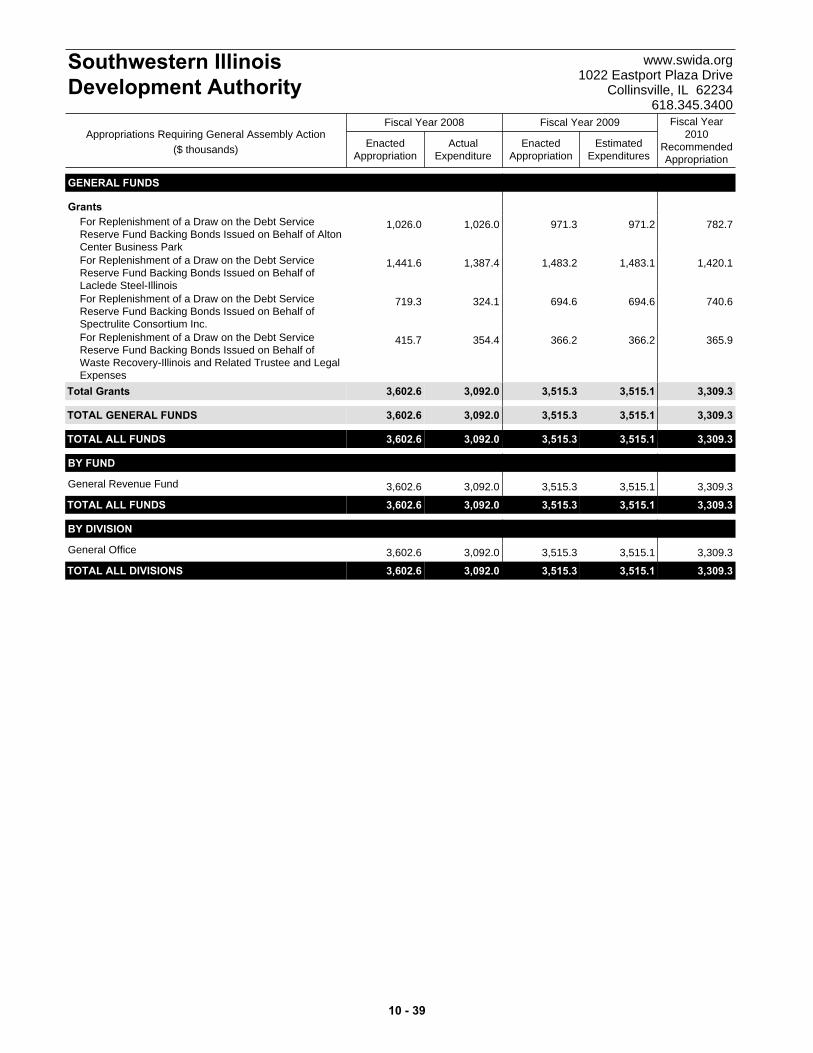
GENERAL FUNDS
Grants1,026.0 782.7971.2971.31,026.0For Replenishment of a Draw on the Debt Service
Reserve Fund Backing Bonds Issued on Behalf of AltonCenter Business Park
1,441.6 1,420.11,483.11,483.21,387.4For Replenishment of a Draw on the Debt ServiceReserve Fund Backing Bonds Issued on Behalf ofLaclede Steel-Illinois
719.3 740.6694.6694.6324.1For Replenishment of a Draw on the Debt ServiceReserve Fund Backing Bonds Issued on Behalf ofSpectrulite Consortium Inc.
415.7 365.9366.2366.2354.4For Replenishment of a Draw on the Debt ServiceReserve Fund Backing Bonds Issued on Behalf ofWaste Recovery-Illinois and Related Trustee and LegalExpenses
Total 3,602.6 3,309.33,515.13,515.33,092.0Grants
TOTAL GENERAL FUNDS 3,602.6 3,309.33,515.13,515.33,092.0
TOTAL ALL FUNDS 3,602.6 3,309.33,515.13,515.33,092.0
BY FUND
3,602.6 3,309.33,515.13,515.33,092.0General Revenue Fund
TOTAL ALL FUNDS 3,602.6 3,309.33,515.13,515.33,092.0
BY DIVISION
3,602.6 3,309.33,515.13,515.33,092.0General Office
TOTAL ALL DIVISIONS 3,602.6 3,309.33,515.13,515.33,092.0
ActualExpenditure
EnactedAppropriation
EstimatedExpenditures
EnactedAppropriation
Fiscal Year2010
RecommendedAppropriation
Fiscal Year 2008 Fiscal Year 2009
Southwestern IllinoisDevelopment Authority
www.swida.org1022 Eastport Plaza Drive
Collinsville, IL 62234618.345.3400
Appropriations Requiring General Assembly Action($ thousands)
10 - 39
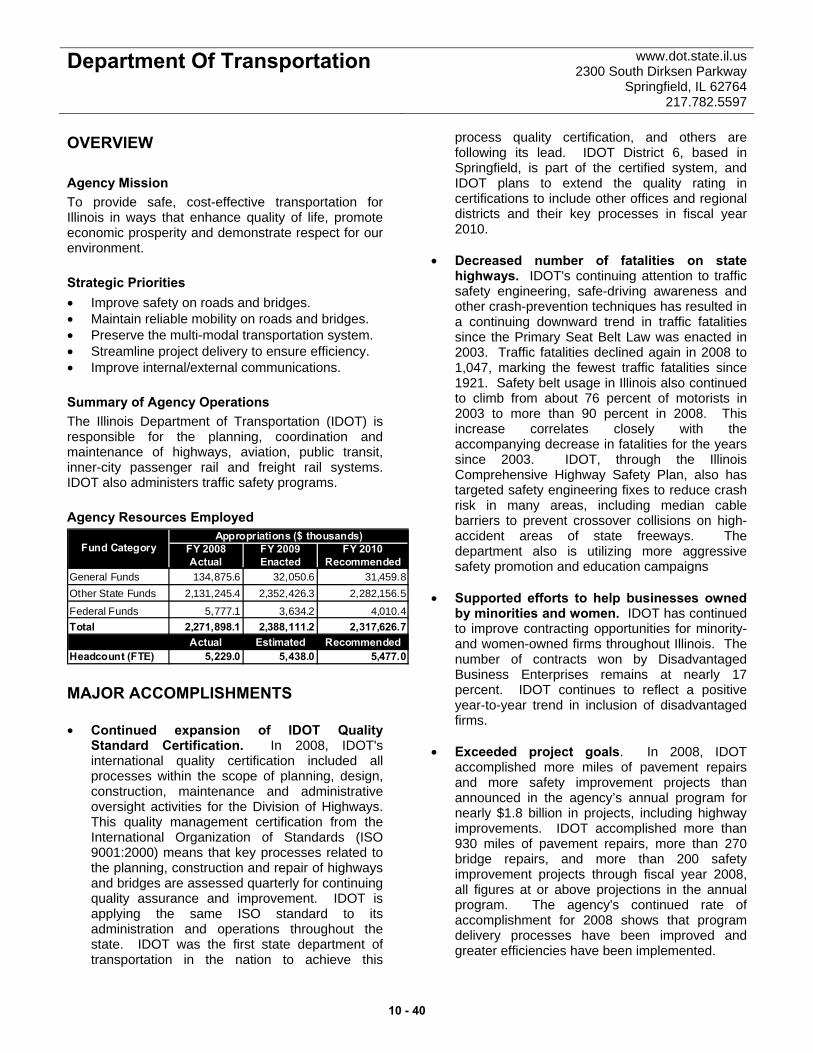
Department Of Transportation www.dot.state.il.us 2300 South Dirksen Parkway
Springfield, IL 62764 217.782.5597
OVERVIEW Agency Mission To provide safe, cost-effective transportation for Illinois in ways that enhance quality of life, promote economic prosperity and demonstrate respect for our environment. Strategic Priorities • Improve safety on roads and bridges. • Maintain reliable mobility on roads and bridges. • Preserve the multi-modal transportation system. • Streamline project delivery to ensure efficiency. • Improve internal/external communications. Summary of Agency Operations The Illinois Department of Transportation (IDOT) is responsible for the planning, coordination and maintenance of highways, aviation, public transit, inner-city passenger rail and freight rail systems. IDOT also administers traffic safety programs. Agency Resources Employed
FY 2008 FY 2009 FY 2010Actual Enacted Recommended
General Funds 134,875.6 32,050.6 31,459.8Other State Funds 2,131,245.4 2,352,426.3 2,282,156.5
Federal Funds 5,777.1 3,634.2 4,010.4Total 2,271,898.1 2,388,111.2 2,317,626.7
Actual Estimated RecommendedHeadcount (FTE) 5,229.0 5,438.0 5,477.0
Appropriations ($ thousands)Fund Category
MAJOR ACCOMPLISHMENTS • Continued expansion of IDOT Quality
Standard Certification. In 2008, IDOT's international quality certification included all processes within the scope of planning, design, construction, maintenance and administrative oversight activities for the Division of Highways. This quality management certification from the International Organization of Standards (ISO 9001:2000) means that key processes related to the planning, construction and repair of highways and bridges are assessed quarterly for continuing quality assurance and improvement. IDOT is applying the same ISO standard to its administration and operations throughout the state. IDOT was the first state department of transportation in the nation to achieve this
process quality certification, and others are following its lead. IDOT District 6, based in Springfield, is part of the certified system, and IDOT plans to extend the quality rating in certifications to include other offices and regional districts and their key processes in fiscal year 2010.
• Decreased number of fatalities on state
highways. IDOT's continuing attention to traffic safety engineering, safe-driving awareness and other crash-prevention techniques has resulted in a continuing downward trend in traffic fatalities since the Primary Seat Belt Law was enacted in 2003. Traffic fatalities declined again in 2008 to 1,047, marking the fewest traffic fatalities since 1921. Safety belt usage in Illinois also continued to climb from about 76 percent of motorists in 2003 to more than 90 percent in 2008. This increase correlates closely with the accompanying decrease in fatalities for the years since 2003. IDOT, through the Illinois Comprehensive Highway Safety Plan, also has targeted safety engineering fixes to reduce crash risk in many areas, including median cable barriers to prevent crossover collisions on high-accident areas of state freeways. The department also is utilizing more aggressive safety promotion and education campaigns
• Supported efforts to help businesses owned
by minorities and women. IDOT has continued to improve contracting opportunities for minority- and women-owned firms throughout Illinois. The number of contracts won by Disadvantaged Business Enterprises remains at nearly 17 percent. IDOT continues to reflect a positive year-to-year trend in inclusion of disadvantaged firms.
• Exceeded project goals. In 2008, IDOT
accomplished more miles of pavement repairs and more safety improvement projects than announced in the agency’s annual program for nearly $1.8 billion in projects, including highway improvements. IDOT accomplished more than 930 miles of pavement repairs, more than 270 bridge repairs, and more than 200 safety improvement projects through fiscal year 2008, all figures at or above projections in the annual program. The agency's continued rate of accomplishment for 2008 shows that program delivery processes have been improved and greater efficiencies have been implemented.
10 - 40
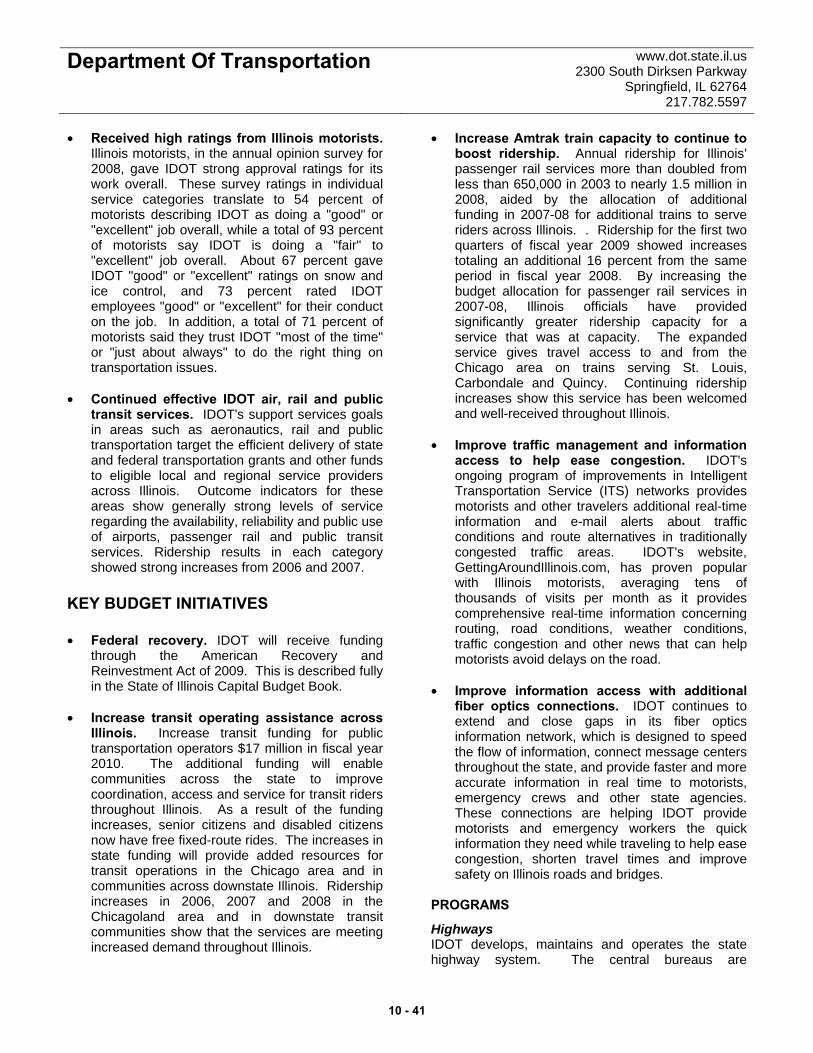
Department Of Transportation www.dot.state.il.us 2300 South Dirksen Parkway
Springfield, IL 62764 217.782.5597
• Received high ratings from Illinois motorists. Illinois motorists, in the annual opinion survey for 2008, gave IDOT strong approval ratings for its work overall. These survey ratings in individual service categories translate to 54 percent of motorists describing IDOT as doing a "good" or "excellent" job overall, while a total of 93 percent of motorists say IDOT is doing a "fair" to "excellent" job overall. About 67 percent gave IDOT "good" or "excellent" ratings on snow and ice control, and 73 percent rated IDOT employees "good" or "excellent" for their conduct on the job. In addition, a total of 71 percent of motorists said they trust IDOT "most of the time" or "just about always" to do the right thing on transportation issues.
• Continued effective IDOT air, rail and public
transit services. IDOT's support services goals in areas such as aeronautics, rail and public transportation target the efficient delivery of state and federal transportation grants and other funds to eligible local and regional service providers across Illinois. Outcome indicators for these areas show generally strong levels of service regarding the availability, reliability and public use of airports, passenger rail and public transit services. Ridership results in each category showed strong increases from 2006 and 2007.
KEY BUDGET INITIATIVES • Federal recovery. IDOT will receive funding
through the American Recovery and Reinvestment Act of 2009. This is described fully in the State of Illinois Capital Budget Book.
• Increase transit operating assistance across
Illinois. Increase transit funding for public transportation operators $17 million in fiscal year 2010. The additional funding will enable communities across the state to improve coordination, access and service for transit riders throughout Illinois. As a result of the funding increases, senior citizens and disabled citizens now have free fixed-route rides. The increases in state funding will provide added resources for transit operations in the Chicago area and in communities across downstate Illinois. Ridership increases in 2006, 2007 and 2008 in the Chicagoland area and in downstate transit communities show that the services are meeting increased demand throughout Illinois.
• Increase Amtrak train capacity to continue to boost ridership. Annual ridership for Illinois’ passenger rail services more than doubled from less than 650,000 in 2003 to nearly 1.5 million in 2008, aided by the allocation of additional funding in 2007-08 for additional trains to serve riders across Illinois. . Ridership for the first two quarters of fiscal year 2009 showed increases totaling an additional 16 percent from the same period in fiscal year 2008. By increasing the budget allocation for passenger rail services in 2007-08, Illinois officials have provided significantly greater ridership capacity for a service that was at capacity. The expanded service gives travel access to and from the Chicago area on trains serving St. Louis, Carbondale and Quincy. Continuing ridership increases show this service has been welcomed and well-received throughout Illinois.
• Improve traffic management and information
access to help ease congestion. IDOT's ongoing program of improvements in Intelligent Transportation Service (ITS) networks provides motorists and other travelers additional real-time information and e-mail alerts about traffic conditions and route alternatives in traditionally congested traffic areas. IDOT's website, GettingAroundIllinois.com, has proven popular with Illinois motorists, averaging tens of thousands of visits per month as it provides comprehensive real-time information concerning routing, road conditions, weather conditions, traffic congestion and other news that can help motorists avoid delays on the road.
• Improve information access with additional
fiber optics connections. IDOT continues to extend and close gaps in its fiber optics information network, which is designed to speed the flow of information, connect message centers throughout the state, and provide faster and more accurate information in real time to motorists, emergency crews and other state agencies. These connections are helping IDOT provide motorists and emergency workers the quick information they need while traveling to help ease congestion, shorten travel times and improve safety on Illinois roads and bridges.
PROGRAMS
Highways IDOT develops, maintains and operates the state highway system. The central bureaus are
10 - 41

Department Of Transportation www.dot.state.il.us 2300 South Dirksen Parkway
Springfield, IL 62764 217.782.5597
responsible for developing policies, procedures, standards and guidelines to accomplish IDOT's highway system improvement objectives. IDOT also monitors district programs to ensure statewide uniformity of policy interpretation and compliance, as well as program coordination with federal, state and local agencies.
Public Transportation IDOT provides significant operating, capital and technical assistance to 52 transit systems throughout Illinois, including the Regional Transportation Authority and its service boards, the Metro-East transit districts, and rural and small urban transit systems.
Rail IDOT's rail program consists of two major components. The rail freight improvement program focuses on preserving essential rail freight service for communities and shippers faced with congestion or potential loss of rail lines. The rail passenger program involves state sponsorship of supplemental intercity service on routes from Chicago to Quincy,
St. Louis and Carbondale in downstate Illinois, and Chicago to Milwaukee.
Aeronautics IDOT coordinates and implements programs concerning air safety, airport construction and other aeronautical-related areas. IDOT cooperates with local law enforcement and other agencies throughout the state to provide emergency or disaster-related air service as needed. Traffic Safety IDOT's Traffic Safety program provides Illinois' motorists, cyclists and pedestrians with the safest possible highway environment utilizing available resources. IDOT develops and implements regulations in crash reporting, hazardous materials transportation, vehicle inspection, motor carrier safety, school bus construction, safety responsibility and cycle rider training. IDOT allocates federal funds to other state and local agencies for programs aimed at reducing accidents, fatalities and injuries.
Program FY 2008 FY 2009 FY 2010 FY 2008 FY 2009 FY 2010Actual Enacted Recommended Actual Estimated Recommended
Highways 1,579,726.0 1,627,077.3 1,546,934.7 4,982.0 5,165.0 5,204.0Public Transportation 541,027.8 615,112.4 632,913.6 31.0 38.0 38.0Rail 28,000.0 28,000.0 28,000.0 0.0 0.0 0.0Aeronautics 17,393.8 15,250.7 14,499.4 64.0 66.0 66.0Nonrecurring Projects 10,299.2 0.0 0.0 0.0 0.0 0.0Traffic Safety 95,451.3 102,670.7 95,278.9 152.0 169.0 169.0
Total 2,271,898.1 2,388,111.2 2,317,626.7 5,229.0 5,438.0 5,477.0
Appropriations ($ thousands) Headcount (FTE)
PERFORMANCE MEASURES
Estimated ProjectedFY 2006 FY 2007 FY 2008 FY 2009 FY 2010
Percent of Illinois state highways in acceptable maintenance condition
87.0% 86.7% 85.6% 85.0% 85.0%
Percent of Illinois bridges in acceptable maintenance condition 91.0% 90.3% 90.6% 90.0% 90.0%
Percent of annual highway program accomplished 97.4% 91.8% 73.5% 95.0% 95.0%Percent difference between Programmed Project Cost and Awarded Project Cost
2.6% 0.6% -2.1% 0% 0%
Crash fatalities per 100 million vehicle miles traveled 1.26 1.17 1.16 1.12 1.12Roadway maintenance cost per lane mile of state highway ($) 3,095 3,543 4,431a 3,800 3,800
Amtrak ridership (thousands) 955.5 1,177.3b 1,474.8 1,500.0 1,600.0Air Passengers -- Commercial Enplanements (thousands) 48,400 47,000 49,100 49,500 50,000
Bus/Train Ridership for Northeastern Illinois (thousands) 575,900 582,700 601,400 610,000 615,000
ActualPerformance Metric
a Weather events and commodities costs drove increases in 2007 and 2008.b Due to increased demand, funding was put in place for eight additional downstate trains in fiscal year 2007.
10 - 42

ActualExpenditure
EnactedAppropriation
EstimatedExpenditures
EnactedAppropriation
Fiscal Year2010
RecommendedAppropriation
Fiscal Year 2008 Fiscal Year 2009
Department Of Transportation www.dot.state.il.us2300 South Dirksen Parkway
Springfield, IL 62764217.782.5597
Appropriations Requiring General Assembly Action($ thousands)
GENERAL FUNDS
Total 295.0 290.0252.5295.0228.2Other Operations and Refunds
Designated Purposes250.0 250.0225.0250.0169.1Administrative Expenses in Connection with Section 18
of the Federal Urban Mass Transportation Act300.0 225.0166.0300.0142.9Emissions Testing/Inspection Program for Diesel
Powered Vehicles in Selected Areas1,372.1 1,124.2310.01,334.2157.8Public Transportation Technical Studies- State share
278.4 0.00.80.8277.6Intertownship Program for Northwest Suburban CookCounty
Total 2,200.5 1,599.2701.81,885.0747.4Designated Purposes
Grants2,168.5 1,570.6400.01,870.6297.9For Purposes Described in Sections 31 and 34 of the
Illinois Aeronautics Act28,000.0 28,000.028,000.028,000.028,000.0State Share of Operating Deficit for Intercity Rail
Services - AMTRAK100.0 0.00.00.0100.0Non-recurring Projects
10,199.2 0.00.00.01,175.0Nonrecurring Projects
342.8 0.00.00.0342.8Reimbursement for Reduced Fares - Downstate
37,318.1 0.00.00.037,318.1Reimbursement for Reduced Fares - RTA ServiceBoards
54,251.6 0.00.00.054,251.6RTA/ADA Paratransit
Total 132,380.1 29,570.628,400.029,870.6121,485.3Grants
TOTAL GENERAL FUNDS 134,875.6 31,459.829,354.332,050.6122,460.9
OTHER STATE FUNDS
Total 496,231.2 499,629.4512,111.6499,470.4477,502.6Personal Services and Fringe Benefits
Total 87,317.6 90,862.285,407.187,777.580,386.4Contractual Services
Total 150,037.5 153,596.4170,536.2179,941.1118,377.8Other Operations and Refunds
Designated Purposes1,750.0 1,750.01,500.01,750.01,350.5Federal Reimbursement of Planning Activities per
SAFETEA-LU1,960.0 1,100.02,053.02,153.0807.0For Costs Associated with STARCOM
0.0 9.249.249.20.0For Costs Associated with the Technology TransferCenter
1,264.3 1,165.6177.71,093.3470.9Hazardous Materials Abatement
500.0 450.0300.0500.0350.0Highway Hire-back
0.0 4,700.01,725.03,425.00.0Homeland Security
23,685.5 21,543.54,875.824,419.32,766.3IDOT Intelligent Traffic Systems Priority Corridor -Federal share
20,043.9 17,028.44,111.617,990.05,203.9IDOT Intelligent Traffic Systems Priority Corridor - Stateshare
88,395.1 99,116.735,000.0101,116.729,278.4Metropolitan Planning and Research Purposes - Federaland Local share
9,146.7 9,563.01,700.010,263.0683.7Metropolitan Planning and Research Purposes - Stateshare
1,328.1 1,050.0925.21,075.2902.8Motorist Damage to State Vehicle and Equipment
2,825.5 3,111.9350.03,111.9213.6Planning, Research and Development Purposes
16,496.2 14,142.29,849.716,891.95,404.2Primary Seat Belt Incentive
10 - 43

ActualExpenditure
EnactedAppropriation
EstimatedExpenditures
EnactedAppropriation
Fiscal Year2010
RecommendedAppropriation
Fiscal Year 2008 Fiscal Year 2009
Department Of Transportation www.dot.state.il.us2300 South Dirksen Parkway
Springfield, IL 62764217.782.5597
Appropriations Requiring General Assembly Action($ thousands)
155.0 180.0155.0155.0155.0Railroad Crossing Safety Monitoring
100.0 100.090.8100.050.8Technology Transfer Center- Equipment, Media, andTraining
250.0 300.050.0350.046.9To Compensate Taxing Districts for Leasehold Taxesand Refunds
9.0 0.00.00.00.0Hanley Building Cafeteria
1,397.7 0.00.00.00.7Phase II of the ADVANCE Demonstration Project -Federal and Local share
1,729.2 0.00.00.015.4Phase II of the ADVANCE Demonstration Project - Stateshare
Total 171,036.1 175,310.562,913.1184,443.647,700.2Designated Purposes
Grants2,200.0 2,500.02,200.02,200.01,859.6Auto Liability Costs
10,000.0 10,000.06,100.010,000.05,822.0City, County, and Other Maintenance Agreements
250.0 250.0175.0250.09.0Claims for Civil Lawsuits
29,569.8 36,566.12,750.037,316.11,753.7Congestion, Mitigation, and Air Quality (CMAQ)Enhancement
2,721.3 3,081.12,836.82,836.82,721.3County Engineers Compensation Program
400.0 400.0400.0400.095.9Downstate Public Transportation Audit Adjustments
0.0 35,000.00.00.00.0Downstate transit capital grants
232,600.0 218,100.0213,300.0232,600.0221,160.6Grants to Local Governments- County Apportionment
326,300.0 305,950.0299,200.0326,300.0310,168.1Grants to Local Governments- MunicipalitiesApportionment
105,600.0 98,950.096,800.0105,600.0100,378.2Grants to Local Governments- Townships and RoadDistricts Apportionment
8,413.6 7,649.03,412.48,061.42,652.1Local Government 0.08 Incentive Grants
8,357.8 11,290.44,844.610,635.02,922.8Local Government Alcohol Safety Programs
14,532.1 14,805.811,000.016,005.87,826.3Local Government Highway Safety Project Grants
3,000.0 3,000.01,200.03,000.0764.9Local Traffic Signal Maintenance Agreements
26,338.5 18,372.713,500.026,172.76,579.0Local Traffic Signal/City, County and Other MaintenanceAgreements
3,745.0 5,355.44,868.54,868.53,745.0Public Transit Operating Assistance Grants -Bloomington
150.0 214.5195.0195.096.0Public Transit Operating Assistance Grants - BondCounty
215.5 446.8406.2280.2215.5Public Transit Operating Assistance Grants - BureauCounty
13,118.8 18,760.017,054.517,054.513,118.8Public Transit Operating Assistance Grants -Champaign
229.5 328.2298.4298.466.3Public Transit Operating Assistance Grants - ColesCounty
1,192.7 1,705.61,550.51,550.51,062.6Public Transit Operating Assistance Grants - Danville
3,279.2 4,689.34,263.04,263.03,197.7Public Transit Operating Assistance Grants - Decatur
1,540.0 2,202.22,002.02,002.01,540.0Public Transit Operating Assistance Grants - DeKalb
0.0 135.3123.0116.90.0Public Transit Operating Assistance Grants - EastCentral Illinois Mass Transit District (formerly EdgarCounty)
745.5 1,066.0969.1969.1619.3Public Transit Operating Assistance Grants - Galesburg
176.0 251.7228.8228.8122.4Public Transit Operating Assistance Grants - HenryCounty
161.1 290.7264.3209.4161.1Public Transit Operating Assistance Grants - JacksonCounty
241.0 344.6313.3313.3201.2Public Transit Operating Assistance Grants - Jo DaviessCounty
10 - 44

ActualExpenditure
EnactedAppropriation
EstimatedExpenditures
EnactedAppropriation
Fiscal Year2010
RecommendedAppropriation
Fiscal Year 2008 Fiscal Year 2009
Department Of Transportation www.dot.state.il.us2300 South Dirksen Parkway
Springfield, IL 62764217.782.5597
Appropriations Requiring General Assembly Action($ thousands)
0.0 448.31,235.01,235.00.0Public Transit Operating Assistance Grants - KankakeeCounty (formerly Kankakee/McLean)
750.0 1,072.5975.0975.039.9Public Transit Operating Assistance Grants - KendallCounty
877.4 1,471.71,337.91,140.6877.3Public Transit Operating Assistance Grants - Macomb
0.0 1,785.01,700.01,700.00.0Public Transit Operating Assistance Grants - MadisonCounty
0.0 13,915.012,650.012,650.00.0Public Transit Operating Assistance Grants - MadisonCounty Mass Transit District
423.5 605.7550.6550.6174.0Public Transit Operating Assistance Grants -Monroe/Randolph
218.5 312.5284.1284.178.1Public Transit Operating Assistance Grants - PeoriaCounty
9,666.9 14,527.612,567.012,567.09,666.9Public Transit Operating Assistance Grants - Peoria withservice to Pekin
210.0 300.3273.0273.0187.2Public Transit Operating Assistance Grants - PiattCounty
1,639.7 2,344.82,131.62,131.61,504.6Public Transit Operating Assistance Grants - Quincy
2,453.3 4,345.53,664.43,189.32,453.3Public Transit Operating Assistance Grants - RIDESMass Transitwith service to Williamson County
2,200.2 3,146.32,860.32,860.32,022.5Public Transit Operating Assistance Grants - RiverValley Metro Mass Transit District
8,271.9 11,828.910,753.510,753.58,271.9Public Transit Operating Assistance Grants - RockIsland
6,865.9 9,818.28,925.68,925.66,865.9Public Transit Operating Assistance Grants - Rockford
726.0 1,356.21,232.9943.8726.0Public Transit Operating Assistance Grants - ShawneeMass Transit District
348.0 497.6452.4452.4155.7Public Transit Operating Assistance Grants - ShelbyCounty
2,247.9 3,563.93,239.92,922.32,247.9Public Transit Operating Assistance Grants - SouthCentral Mass Transit
6,676.9 9,548.08,680.08,680.06,088.3Public Transit Operating Assistance Grants - SpringfieldMass Transit District
17,787.6 34,922.131,747.423,123.917,787.6Public Transit Operating Assistance Grants - St. ClairCounty Transit District
45.1 64.558.658.643.1Public Transit Operating Assistance Grants - StatelineMass Transit District (formerly South Beloit)
400.0 572.0520.0520.077.1Public Transit Operating Assistance Grants -Stephenson/Freeport
0.0 461.8604.1604.10.0Public Transit Operating Assistance Grants - TazewellCounty (formerly Tazewell/Woodford)
323.0 461.9419.9419.9183.3Public Transit Operating Assistance Grants - VermilionCounty
385.0 571.7519.7500.5385.0Public Transit Operating Assistance Grants - WestCentral Mass Transit District
0.0 495.70.00.00.0Public Transit Operating Assistance Lee-Ogle Counties
0.0 910.20.00.00.0Public Transit Operating Assistance- McLean County
0.0 202.70.00.00.0Public Transit Operating Assistance- Woodford County
135,300.0 125,300.0121,832.2135,300.0117,777.0R.T.A Debt Service Grants
205,000.0 270,000.0290,000.0302,200.0186,721.5R.T.A Operating Assistance Grants
0.0 37,318.10.037,318.10.0Reimburse RTA Service Board
6,889.1 7,593.64,000.07,593.63,295.6Reimbursement to State and Local Universities andColleges for Cycle Rider Safety Training Programs
750.0 750.0727.5750.0735.0Supports the operation of intercity passenger railservices in the state
500.0 540.3450.0540.3421.4Tort Claims
10 - 45

ActualExpenditure
EnactedAppropriation
EstimatedExpenditures
EnactedAppropriation
Fiscal Year2010
RecommendedAppropriation
Fiscal Year 2008 Fiscal Year 2009
Department Of Transportation www.dot.state.il.us2300 South Dirksen Parkway
Springfield, IL 62764217.782.5597
Appropriations Requiring General Assembly Action($ thousands)
5,000.0 0.04,850.05,000.05,000.0For Comprehensive Regional Planning Purposes
50.0 0.00.00.00.0Grants to municipalities for the purpose of equippingtheir ambulances with traffic control signal preemptiondevices
3,300.0 0.00.00.02,595.0I-FLY Program
89.9 0.00.00.089.9Public Transit Operating Assistance Grants - EdgarCounty
950.0 0.00.00.0294.2Public Transit Operating Assistance Grants -Kankakee/McLean
492.3 0.0639.9639.9310.6Public Transit Operating Assistance Grants - Pekin
464.7 0.00.00.0242.2Public Transit Operating Assistance Grants -Tazewell/Woodford
203.0 0.0286.1263.9203.0Public Transit Operating Assistance Grants - WilliamsonCounty
10,040.0 0.00.00.09,661.7Public Transit Operating Assistance Grants perDownstate Public Transportation Act - Metro East PublicTransportation
Total 1,226,623.0 1,362,757.91,220,423.81,400,793.81,076,042.2Grants
TOTAL OTHER STATE FUNDS 2,131,245.4 2,282,156.52,051,391.72,352,426.31,800,009.1
FEDERAL FUNDS
Designated Purposes3,205.8 4,010.4550.03,634.2444.8Public Transportation Technical Studies - Federal share
2,571.3 0.00.00.0879.9Illinois Terrorism Task Force Approved Purchases forHomeland Security
Total 5,777.1 4,010.4550.03,634.21,324.7Designated Purposes
TOTAL FEDERAL FUNDS 5,777.1 4,010.4550.03,634.21,324.7
TOTAL ALL FUNDS 2,271,898.1 2,317,626.72,081,296.12,388,111.21,923,794.7
BY FUND
134,875.6 31,459.829,354.332,050.6122,460.9General Revenue Fund
997,885.3 1,014,310.7867,378.61,055,753.6746,912.3Road Fund
10,555.5 10,720.310,437.310,623.28,979.7Motor Fuel Tax Fund
300.0 300.072.875.0117.9Aeronautics Fund
50.0 0.00.00.00.0Traffic Control Signal Preemption Devices for AmbulancesFund
750.0 750.0727.5750.0735.0Intercity Passenger Rail Fund
3,300.0 0.00.00.02,595.0I-FLY Fund
800.0 1,000.0875.01,000.0718.9Air Transportation Revolving Fund
250.0 300.050.0350.046.9Tax Recovery Fund
5,000.0 0.04,850.05,000.05,000.0Comprehensive Regional Planning Fund
232,600.0 218,100.0213,300.0232,600.0221,160.6Motor Fuel Tax Counties Fund
326,300.0 305,950.0299,200.0326,300.0310,168.1Motor Fuel Tax Municipalities Fund
105,600.0 98,950.096,800.0105,600.0100,378.2Motor Fuel Tax Townships and Road Districts Fund
2,571.3 0.00.00.0879.9Federal Civil Preparedness Administrative Fund
0.0 35,000.00.00.00.0Downstate Transit Improvement Fund
500.0 450.0300.0500.0350.0Transportation Safety Highway Hire-back Fund
340,300.0 395,300.0411,832.2437,500.0304,498.5Public Transportation Fund
89,910.8 155,740.9141,245.3131,114.185,217.4Downstate Public Transportation Fund
10 - 46

ActualExpenditure
EnactedAppropriation
EstimatedExpenditures
EnactedAppropriation
Fiscal Year2010
RecommendedAppropriation
Fiscal Year 2008 Fiscal Year 2009
Department Of Transportation www.dot.state.il.us2300 South Dirksen Parkway
Springfield, IL 62764217.782.5597
Appropriations Requiring General Assembly Action($ thousands)
0.0 37,318.10.037,318.10.0Budget Relief Fund
10,040.0 0.00.00.09,661.7Metro-East Public Transportation Fund
3,205.8 4,010.4550.03,634.2444.8Federal Mass Transit Trust Fund
7,103.9 7,966.54,323.17,942.43,468.8Cycle Rider Safety Training Fund
TOTAL ALL FUNDS 2,271,898.1 2,317,626.72,081,296.12,388,111.21,923,794.7
BY DIVISION
228,502.3 234,231.399,740.4246,217.986,948.7Central Administration and Planning
23,868.5 28,386.326,338.626,726.720,742.4Bureau Of Information Processing
92,413.5 87,120.973,830.093,659.261,176.1Central Offices, Division of Highways
33,749.0 32,068.023,971.034,761.317,850.6Division Of Traffic Safety
104.6 0.058.360.818.3Highway Safety Program - Illinois Liquor ControlCommission
206.4 377.3300.2309.7147.0Department of Natural Resources
8,998.3 8,577.29,149.79,425.78,056.7Day Labor
172,874.9 175,598.6185,626.2183,202.4161,677.7District 1, Schaumburg Office
53,920.3 54,840.957,386.056,666.349,978.4District 2, Dixon Office
49,687.8 49,687.852,096.052,499.747,217.5District 3, Ottawa
48,410.5 48,839.450,771.550,471.545,918.5District 4, Peoria
41,677.7 39,494.141,279.341,814.638,766.4District 5, Paris
47,803.0 49,002.649,059.748,976.645,487.2District 6, Springfield
39,479.6 39,514.341,766.241,895.936,319.6District 7, Effingham
62,563.9 62,460.464,307.964,564.859,415.1District 8, Collinsville
34,294.4 35,253.335,363.435,630.932,577.6District 9, Carbondale
10,299.2 0.00.00.01,275.0Construction (Grants)
17,393.8 14,499.412,951.015,250.713,267.9Aeronautics
40,932.2 44,208.329,175.144,979.119,904.4Highway Safety Program - Traffic Safety
907.6 894.81,044.71,063.2539.2Highway Safety Program - Secretary of State
87.1 258.7245.0252.686.9Highway Safety Program - Dept. of Public Health
19,335.4 17,392.220,504.121,090.711,534.0Highway Safety Program - Dept. of State Police
250.0 250.0291.1300.2211.5Highway Safety Program - Law Enforcement TrainingStandards Board
55.0 37.053.555.023.9Highway Safety Program - Administrative Office of theIllinois Courts
540,277.8 632,163.6557,522.3614,362.4495,232.7Division Of Public And Intermodal Transportation
28,750.0 28,750.028,727.528,750.028,735.0Rail Passenger And Rail Freight
675,055.5 633,720.3619,737.3675,123.2640,686.5Motor Fuel Tax Administration & Grants
TOTAL ALL DIVISIONS 2,271,898.1 2,317,626.72,081,296.12,388,111.21,923,794.7
HEADCOUNT BY DIVISION Actual Estimated Authorized
265.0 393.0277.0Central Administration and Planning
76.0 79.079.0Bureau Of Information Processing
406.0 440.0440.0Central Offices, Division of Highways
101.0 111.0111.0Division Of Traffic Safety
19.0 23.023.0Day Labor
1,135.0 1,196.01,196.0District 1, Schaumburg Office
382.0 391.0391.0District 2, Dixon Office
10 - 47

ActualExpenditure
EnactedAppropriation
EstimatedExpenditures
EnactedAppropriation
Fiscal Year2010
RecommendedAppropriation
Fiscal Year 2008 Fiscal Year 2009
Department Of Transportation www.dot.state.il.us2300 South Dirksen Parkway
Springfield, IL 62764217.782.5597
Appropriations Requiring General Assembly Action($ thousands)
357.0 368.0368.0District 3, Ottawa
355.0 356.0356.0District 4, Peoria
303.0 310.0310.0District 5, Paris
389.0 397.0397.0District 6, Springfield
323.0 328.0328.0District 7, Effingham
514.0 522.0522.0District 8, Collinsville
295.0 297.0297.0District 9, Carbondale
64.0 66.066.0Aeronautics
51.0 58.058.0Highway Safety Program - Traffic Safety
31.0 38.038.0Division Of Public And Intermodal Transportation
70.0 0.077.0Shared Services
93.0 104.0104.0Motor Fuel Tax Administration & Grants
TOTAL HEADCOUNT 5,229.0 5,477.05,438.0 t
10 - 48

Illinois State Toll Highway Authority
www.illinoistollway.com 2700 Ogden Ave.
Downers Grove, IL 60515 (630) 241-6800
OVERVIEW Agency Mission Provide and promote a safe and efficient system of toll-supported highways while ensuring the highest possible level of customer service. Strategic Priorities • Reduce traffic congestion. • Implement Congestion-Relief Program (12-year
Capital Construction Plan). • Improve operational efficiency and effectiveness. Summary of Agency Operations The Illinois Tollway, maintains and operates 286 miles of interstate tollways in 12 counties in Northern Illinois, including the Ronald Reagan Memorial Tollway (I-88), the Veterans Memorial Tollway (I-355), the Jane Addams Memorial Tollway (I-90) and the Tri-State Tollway (I-94, I-294, I-80). The Illinois Tollway is a pay-as-you-go system that receives no state or federal tax dollars for maintenance and operations. MAJOR ACCOMPLISHMENTS • Completed fourth year of $6.3 billion
Congestion-Relief Program. By the end of 2008, the Tollway awarded approximately $4.5 billion in construction and design contracts out of $6.3 billion for the Open Roads for a Faster Future program. The program is on schedule and within budget.
• Increased I-PASS participation. I-PASS
continued its steady growth with average usage at 81 percent of the Tollway’s 1.4 million daily vehicles. Active I-PASS transponders totals grew to more than 3.5 million units on more than 2.8 million accounts, and customers continued reporting time savings of at least 10 minutes each way on their daily commutes as a result of Open Road Tolling.
• Continued to build successful customer
outreach. Jewel-Osco continued as the Tollway’s primary I-PASS retail sales partner, with approximately 180 Jewel-Osco stores in the Chicago metropolitan area. In 2008, Jewel was responsible for the sale of 200,000 I-PASS transponders.
• Served approximately 390,000 customers in
2008. The Tollway’s five Customer Service Centers (CSC), located in Tollway Oases, facilitated sales and provided complete I-PASS services for missed toll payments, as well as violation processing services for traveling customers preferring face-to-face service closer to work or home.
• Continued to enhance e-commerce services,
allowing I-PASS customers to manage accounts online, purchase and activate transponders, as well as make online payment of violation notices. Online I-PASS sales exceeded 83,000 in 2008, and currently more than 63 percent of the 2.8 million I-PASS account holders manage their accounts online at www.getipass.com, 24 hours a day, 7 days a week.
• Awarded Government Finance Officers
Association (GFOA) Distinguished Budget Presentation Award for the 2008 budget. This marked the fifth consecutive year the Tollway has received the award. The Illinois Tollway budget was presented to the board and discussed during several public meetings, and posted on the Tollway’s Web site.
• Recognized with a 2008 Toll Excellence award
by the International Bridge, Tunnel and Turnpike Association. The Illinois Tollway’s e-commerce service was recognized with an award for outstanding and innovative customer service.
KEY BUDGET INITIATIVES • Continue Enterprise Resource Planning. The
Tollway will allocate $11 million in 2009 to continue implementation of an Enterprise Resource Planning system to more efficiently manage multiple business activities including: the purchase of equipment and supplies, I-PASS sales, finance management, accounting, inventory management and human resources management.
• Improve information technology systems.
This initiative will improve and maintain the Tollway’s information technology systems and facilities. The Tollway will provide $7.5 million in the 2009 budget for projects including: new disaster recovery data center; system-wide
10 - 49

Illinois State Toll Highway Authority
www.illinoistollway.com 2700 Ogden Ave.
Downers Grove, IL 60515 (630) 241-6800
computer infrastructure modernization; Tollway Web site maintenance and enhancement; Next Generation Network facilities integration; system-wide communication tower preservation; public safety radio upgrade and replacement; and I-PASS data storage expansion.
• Enhance electronic tolling systems.
Enhancements are ongoing to improve the Open Road Tolling System, toll collection and violation processing, and the user support network through the Customer Call Center, as well as funding for a Disaster Recovery/Business Continuity program. The 2009 budget will allocate $17.7 million to continue the Tollway’s efforts.
• Upgrade Intelligent Transportation Systems
(ITS). For 2009, approximately $10.8 million will be provided to enhance and upgrade the Tollway’s ITS to improve Tollway incident response time and monitor and detect traffic incidents.
• Implement system-wide signage upgrades.
This initiative will allocate $2.4 million to provide continuation of system-wide upgrades of all roadway signs including compliance with new federal toll collection signing requirements. Enhancement of signage will enable the Tollway to manage traffic through the extensive construction zones throughout the system, as well as communicate roadway and toll plaza information to customers.
• Extend Illinois State Police District 15 coverage. Funded by the Illinois Tollway, District 15 will provide extra coverage in system-wide construction zones and areas with high speed or crash percentages, and allow officers to work toll violation details to reduce the number of toll scofflaws. The 2009 budget will provide $2 million to equip troopers with modernized IT equipment such as: IWIN computers, digital in-car video cameras, LiveScan machines; as well as training for programs such as Firearms Animated Training System (FATS) and Firing Range Target Retrieval System.
PROGRAMS Open Roads for a Faster Future. By the end of 2009, more than 80 percent of the $6.3 billion Capital Program will be complete, including reconstruction and widening projects throughout a majority of the system. System-wide conversion to Open Road Tolling and construction of the 12.5 mile south extension of the Veteran’s Memorial Tollway were completed in 2006 and 2007 respectively. More than $1 billion in new construction is scheduled for 2009. The Capital Program is on schedule and on budget. The Tollway’s 2009 Maintenance and Operations Budget reflects congestion-relief priorities and the need to maintain operations in support of this extensive capital program.
PERFORMANCE MEASURES
Estimated ProjectedFY 2006 FY 2007 FY 2008 FY 2009 FY 2010
I-PASS transactions as % of total transactions 77% 79% 80% 80% 81%
Number of I-Pass express lanesa 85 91 91 91 91Total number of toll transactions per full-time equivalent 1,275 1,286 1,300 1,300 1,333
Operating expenditure per toll transaction ($) 0.32 0.27 0.27 0.27 0.30
ActualPerformance Metric
a Previously referred to as open road toll lanes.
10 - 50
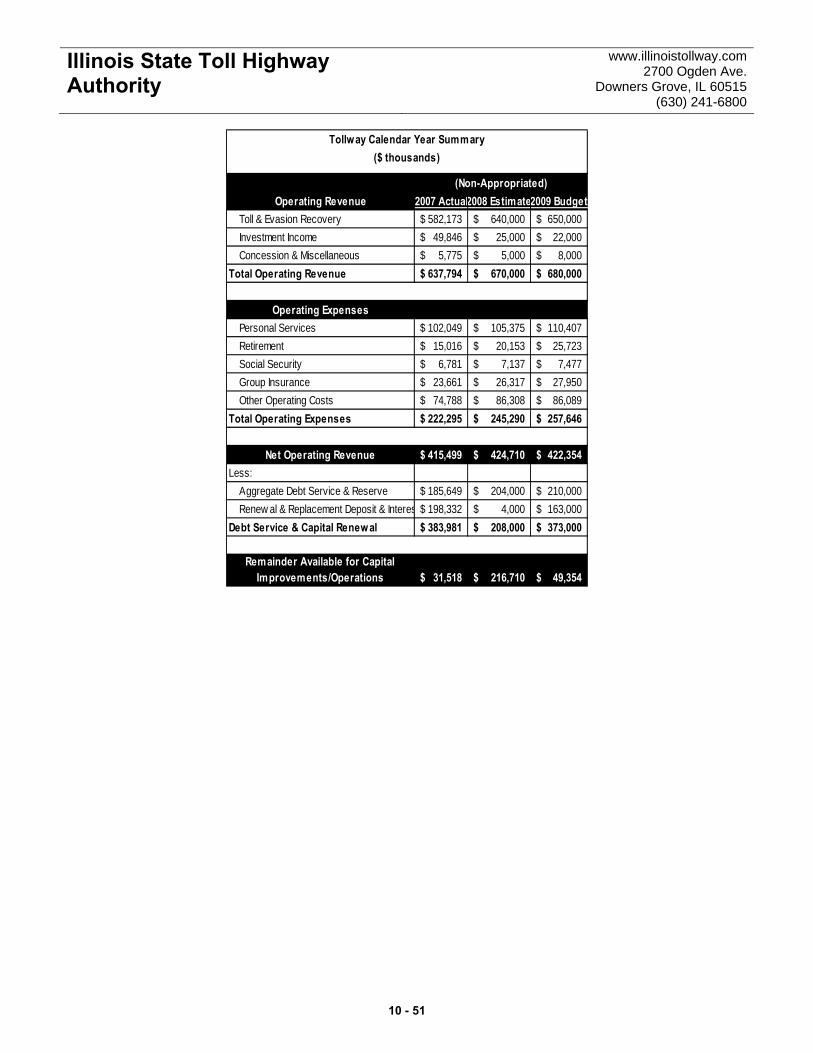
Illinois State Toll Highway Authority
www.illinoistollway.com 2700 Ogden Ave.
Downers Grove, IL 60515 (630) 241-6800
Operating Revenue 2007 Actual2008 Estimate2009 Budget
Toll & Evasion Recovery 582,173$ 640,000$ 650,000$ Investment Income 49,846$ 25,000$ 22,000$ Concession & Miscellaneous 5,775$ 5,000$ 8,000$
Total Operating Revenue 637,794$ 670,000$ 680,000$
Operating ExpensesPersonal Services 102,049$ 105,375$ 110,407$ Retirement 15,016$ 20,153$ 25,723$ Social Security 6,781$ 7,137$ 7,477$ Group Insurance 23,661$ 26,317$ 27,950$ Other Operating Costs 74,788$ 86,308$ 86,089$
Total Operating Expenses 222,295$ 245,290$ 257,646$
Net Operating Revenue 415,499$ 424,710$ 422,354$ Less:
Aggregate Debt Service & Reserve 185,649$ 204,000$ 210,000$ Renew al & Replacement Deposit & Interes 198,332$ 4,000$ 163,000$
Debt Service & Capital Renewal 383,981$ 208,000$ 373,000$
Remainder Available for Capital Improvements/Operations 31,518$ 216,710$ 49,354$
Tollway Calendar Year Summary($ thousands)
(Non-Appropriated)
10 - 51
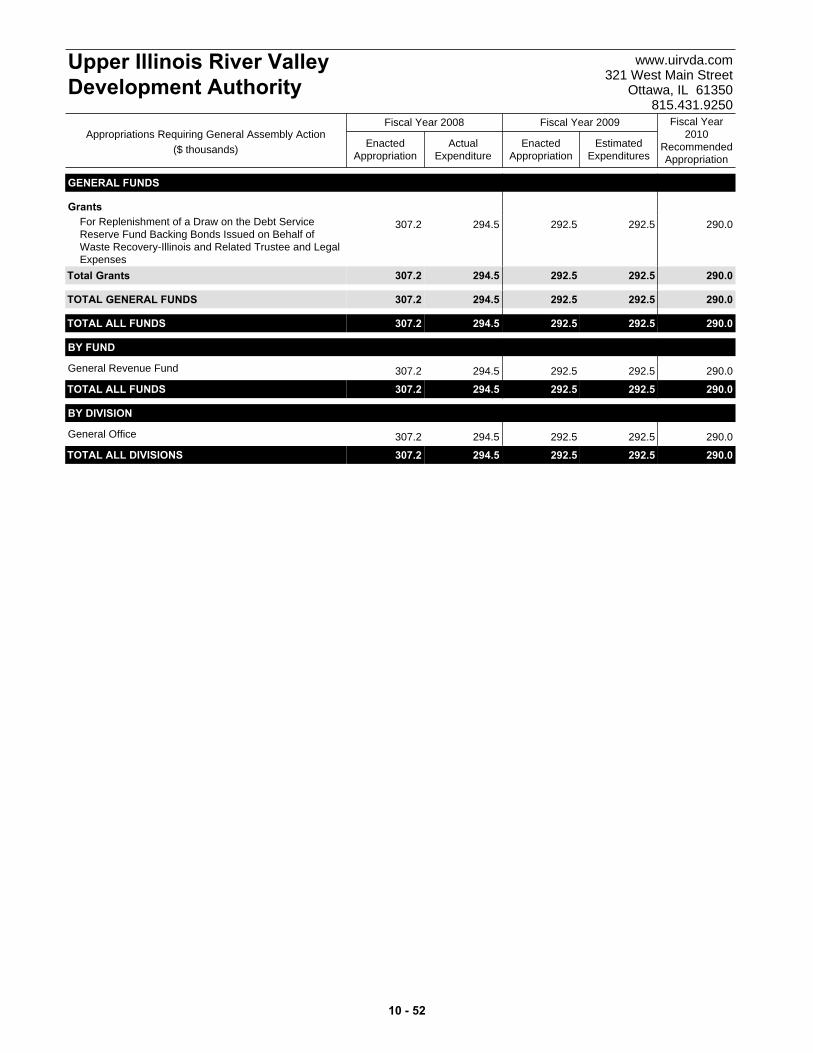
GENERAL FUNDS
Grants307.2 290.0292.5292.5294.5For Replenishment of a Draw on the Debt Service
Reserve Fund Backing Bonds Issued on Behalf ofWaste Recovery-Illinois and Related Trustee and LegalExpenses
Total 307.2 290.0292.5292.5294.5Grants
TOTAL GENERAL FUNDS 307.2 290.0292.5292.5294.5
TOTAL ALL FUNDS 307.2 290.0292.5292.5294.5
BY FUND
307.2 290.0292.5292.5294.5General Revenue Fund
TOTAL ALL FUNDS 307.2 290.0292.5292.5294.5
BY DIVISION
307.2 290.0292.5292.5294.5General Office
TOTAL ALL DIVISIONS 307.2 290.0292.5292.5294.5
ActualExpenditure
EnactedAppropriation
EstimatedExpenditures
EnactedAppropriation
Fiscal Year2010
RecommendedAppropriation
Fiscal Year 2008 Fiscal Year 2009
Upper Illinois River ValleyDevelopment Authority
www.uirvda.com321 West Main Street
Ottawa, IL 61350815.431.9250
Appropriations Requiring General Assembly Action($ thousands)
10 - 52

GOVERNMENT SERVICESCONSTITUTIONAL OFFICES
GovernorLieutenant Governor
Attorney GeneralSecretary of State
Comptroller Treasurer
LEGISLATIVE AGENCIES Office of the Auditor General
General AssemblyCommission on Government Forecasting
and AccountabilityJoint Committee on Administrative Rules
Legislative Audit CommissionLegislative Ethics CommissionLegislative Information SystemLegislative Inspector General
Legislative Printing UnitLegislative Reference Bureau
Legislative Research UnitOffice of the Architect of the Capitol
CODE DEPARTMENTSDepartment of Central Management Services
Department of Revenue
EXECUTIVE AGENCIES, COMMISSIONS AND BOARDS
Civil Service CommissionCourt of Claims
State Board of ElectionsExecutive Ethics CommissionIllinois Labor Relations Board
Procurement Policy BoardProperty Tax Appeal BoardExecutive Inspector General
Governor’s Office of Management and BudgetCapital Development Board JUDICIAL AGENCIES
Judicial Inquiry BoardOffice of the State Appellate Defender
Office of the States’ Attorney Appellate Prosecutor
Supreme CourtSupreme Court Historic Preservation
Commission
PUBLIC RETIREMENT SYSTEMSJudges’ Retirement System
General Assembly Retirement SystemState Employees Retirement System
www.state.il.us/budget
CHAPTER 11

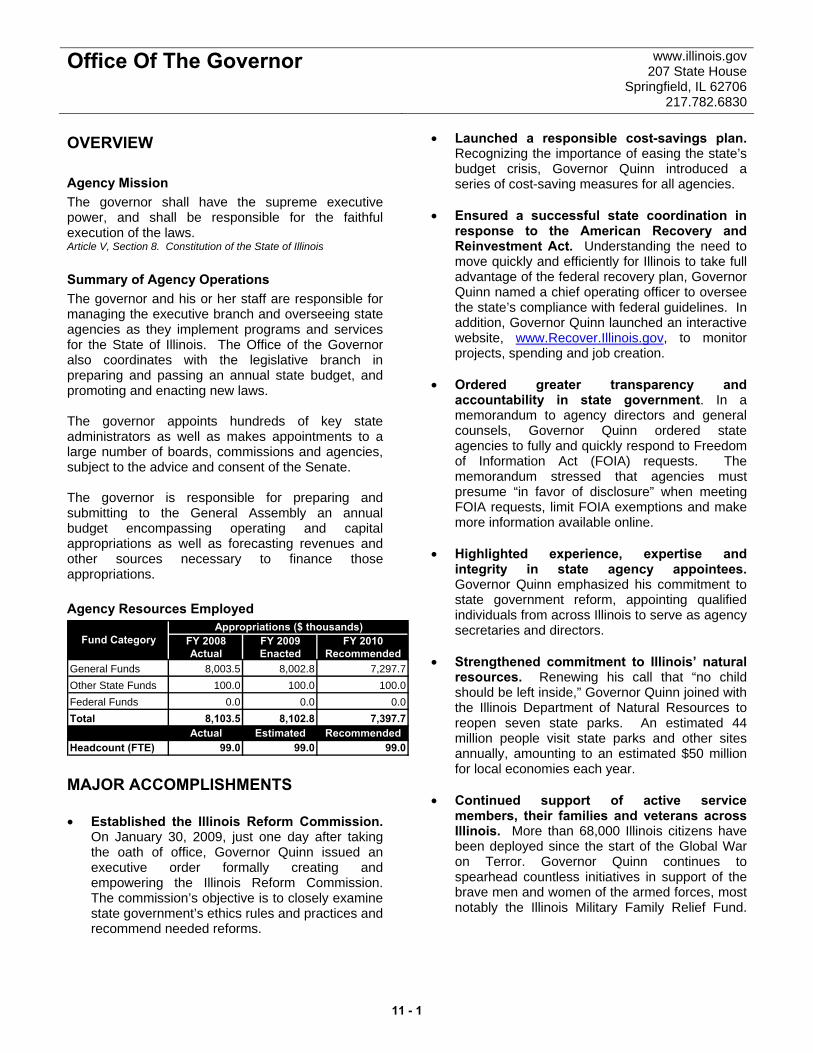
Office Of The Governor www.illinois.gov 207 State House
Springfield, IL 62706 217.782.6830
OVERVIEW Agency Mission The governor shall have the supreme executive power, and shall be responsible for the faithful execution of the laws. Article V, Section 8. Constitution of the State of Illinois Summary of Agency Operations The governor and his or her staff are responsible for managing the executive branch and overseeing state agencies as they implement programs and services for the State of Illinois. The Office of the Governor also coordinates with the legislative branch in preparing and passing an annual state budget, and promoting and enacting new laws. The governor appoints hundreds of key state administrators as well as makes appointments to a large number of boards, commissions and agencies, subject to the advice and consent of the Senate. The governor is responsible for preparing and submitting to the General Assembly an annual budget encompassing operating and capital appropriations as well as forecasting revenues and other sources necessary to finance those appropriations. Agency Resources Employed
FY 2008 FY 2009 FY 2010Actual Enacted Recommended
General Funds 8,003.5 8,002.8 7,297.7Other State Funds 100.0 100.0 100.0Federal Funds 0.0 0.0 0.0Total 8,103.5 8,102.8 7,397.7
Actual Estimated RecommendedHeadcount (FTE) 99.0 99.0 99.0
Appropriations ($ thousands)Fund Category
MAJOR ACCOMPLISHMENTS • Established the Illinois Reform Commission.
On January 30, 2009, just one day after taking the oath of office, Governor Quinn issued an executive order formally creating and empowering the Illinois Reform Commission. The commission’s objective is to closely examine state government’s ethics rules and practices and recommend needed reforms.
• Launched a responsible cost-savings plan. Recognizing the importance of easing the state’s budget crisis, Governor Quinn introduced a series of cost-saving measures for all agencies.
• Ensured a successful state coordination in
response to the American Recovery and Reinvestment Act. Understanding the need to move quickly and efficiently for Illinois to take full advantage of the federal recovery plan, Governor Quinn named a chief operating officer to oversee the state’s compliance with federal guidelines. In addition, Governor Quinn launched an interactive website, www.Recover.Illinois.gov, to monitor projects, spending and job creation.
• Ordered greater transparency and
accountability in state government. In a memorandum to agency directors and general counsels, Governor Quinn ordered state agencies to fully and quickly respond to Freedom of Information Act (FOIA) requests. The memorandum stressed that agencies must presume “in favor of disclosure” when meeting FOIA requests, limit FOIA exemptions and make more information available online.
• Highlighted experience, expertise and integrity in state agency appointees. Governor Quinn emphasized his commitment to state government reform, appointing qualified individuals from across Illinois to serve as agency secretaries and directors.
• Strengthened commitment to Illinois’ natural
resources. Renewing his call that “no child should be left inside,” Governor Quinn joined with the Illinois Department of Natural Resources to reopen seven state parks. An estimated 44 million people visit state parks and other sites annually, amounting to an estimated $50 million for local economies each year.
• Continued support of active service
members, their families and veterans across Illinois. More than 68,000 Illinois citizens have been deployed since the start of the Global War on Terror. Governor Quinn continues to spearhead countless initiatives in support of the brave men and women of the armed forces, most notably the Illinois Military Family Relief Fund.
11 - 1
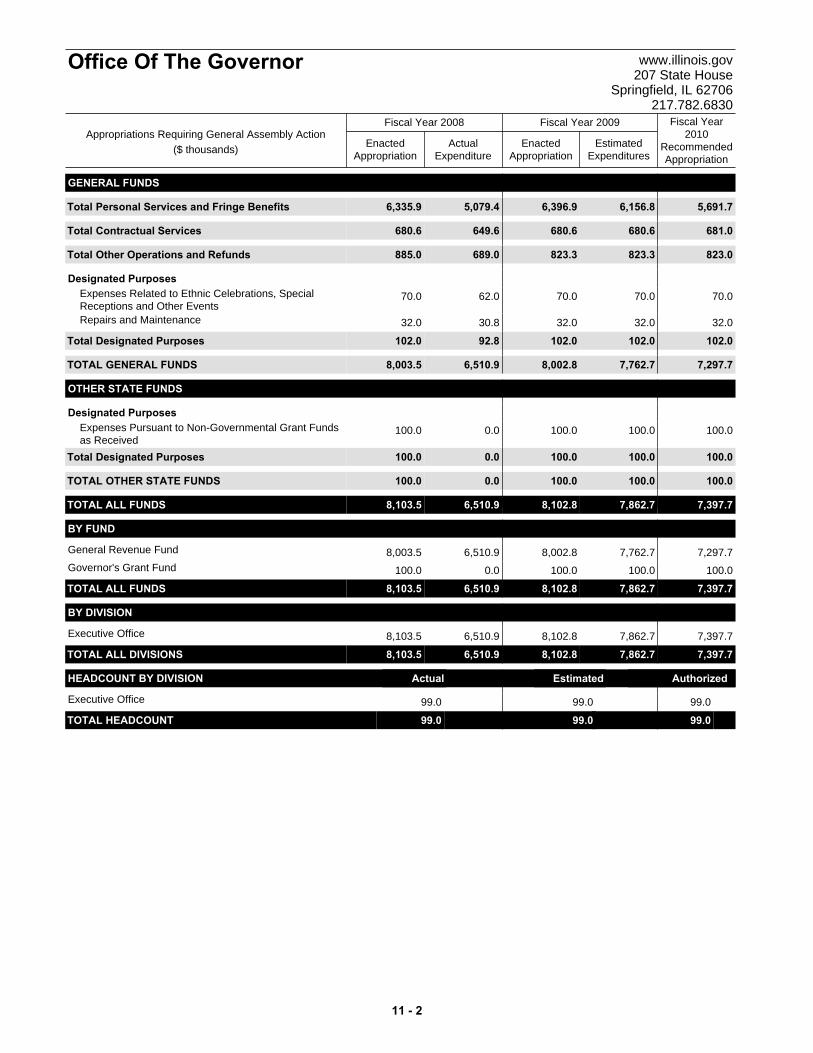
GENERAL FUNDS
Total 6,335.9 5,691.76,156.86,396.95,079.4Personal Services and Fringe Benefits
Total 680.6 681.0680.6680.6649.6Contractual Services
Total 885.0 823.0823.3823.3689.0Other Operations and Refunds
Designated Purposes70.0 70.070.070.062.0Expenses Related to Ethnic Celebrations, Special
Receptions and Other Events32.0 32.032.032.030.8Repairs and Maintenance
Total 102.0 102.0102.0102.092.8Designated Purposes
TOTAL GENERAL FUNDS 8,003.5 7,297.77,762.78,002.86,510.9
OTHER STATE FUNDS
Designated Purposes100.0 100.0100.0100.00.0Expenses Pursuant to Non-Governmental Grant Funds
as ReceivedTotal 100.0 100.0100.0100.00.0Designated Purposes
TOTAL OTHER STATE FUNDS 100.0 100.0100.0100.00.0
TOTAL ALL FUNDS 8,103.5 7,397.77,862.78,102.86,510.9
BY FUND
8,003.5 7,297.77,762.78,002.86,510.9General Revenue Fund
100.0 100.0100.0100.00.0Governor's Grant Fund
TOTAL ALL FUNDS 8,103.5 7,397.77,862.78,102.86,510.9
BY DIVISION
8,103.5 7,397.77,862.78,102.86,510.9Executive Office
TOTAL ALL DIVISIONS 8,103.5 7,397.77,862.78,102.86,510.9
HEADCOUNT BY DIVISION Actual Estimated Authorized
99.0 99.099.0Executive Office
TOTAL HEADCOUNT 99.0 99.099.0 t
ActualExpenditure
EnactedAppropriation
EstimatedExpenditures
EnactedAppropriation
Fiscal Year2010
RecommendedAppropriation
Fiscal Year 2008 Fiscal Year 2009
Office Of The Governor www.illinois.gov207 State House
Springfield, IL 62706217.782.6830
Appropriations Requiring General Assembly Action($ thousands)
11 - 2

Office Of The Lieutenant Governor
www.state.il.us/ltgov 214 State House
Springfield, IL 62706 217.782.7884
OVERVIEW Agency Mission To perform the duties and exercise the powers in the Executive Branch that may be delegated to him or her by the Governor and that may be prescribed by law. The Lieutenant Governor is first in line of succession should the Office of the Governor become vacant. Summary of Agency Operations The Lieutenant Governor chairs both the Illinois River Coordinating Council and the Mississippi River Coordinating Council, which implement the state's strategic plan for protecting and enhancing natural resources throughout Illinois watersheds. The Lieutenant Governor chairs the Rural Affairs Council, which works to expand opportunities and improve the quality of life for rural residents. The Lieutenant Governor chairs the Main Street Council which helps communities revitalize historic downtown districts, create business opportunities and jobs, and improve community life The Lieutenant Governor chairs the Broadband Deployment Council which is charged with advancing telecommunications services to provide Illinois citizens with universal, competitive and affordable Internet service.
The Lieutenant Governor chairs the Green Government Coordinating Council which reviews and approves the sustainability plan of every state agency, tracks the state's environmental progress and prepares an annual report on the state's sustainability practices. The Lieutenant Governor informs military families of the Illinois Military Family Relief Fund and encourages contributions to the fund from groups and individuals, including through use of a check-off box on Illinois income tax returns. The Lieutenant Governor promotes community health initiatives, including childhood dental care programs, fitness programs (Walk Across Illinois), the availability of heart-saving defibrillators (AED), and asthma prevention and treatment initiatives. Agency Resources Employed
FY 2008 FY 2009 FY 2010Actual Enacted Recommended
General Funds 2,343.3 2,001.3 1,354.0Other State Funds 150.0 150.0 0.0
Federal Funds 0.0 0.0 0.0Total 2,493.3 2,151.3 1,354.0
Actual Estimated RecommendedHeadcount (FTE) 29.0 29.0 12.0
Appropriations ($ thousands)Fund Category
11 - 3
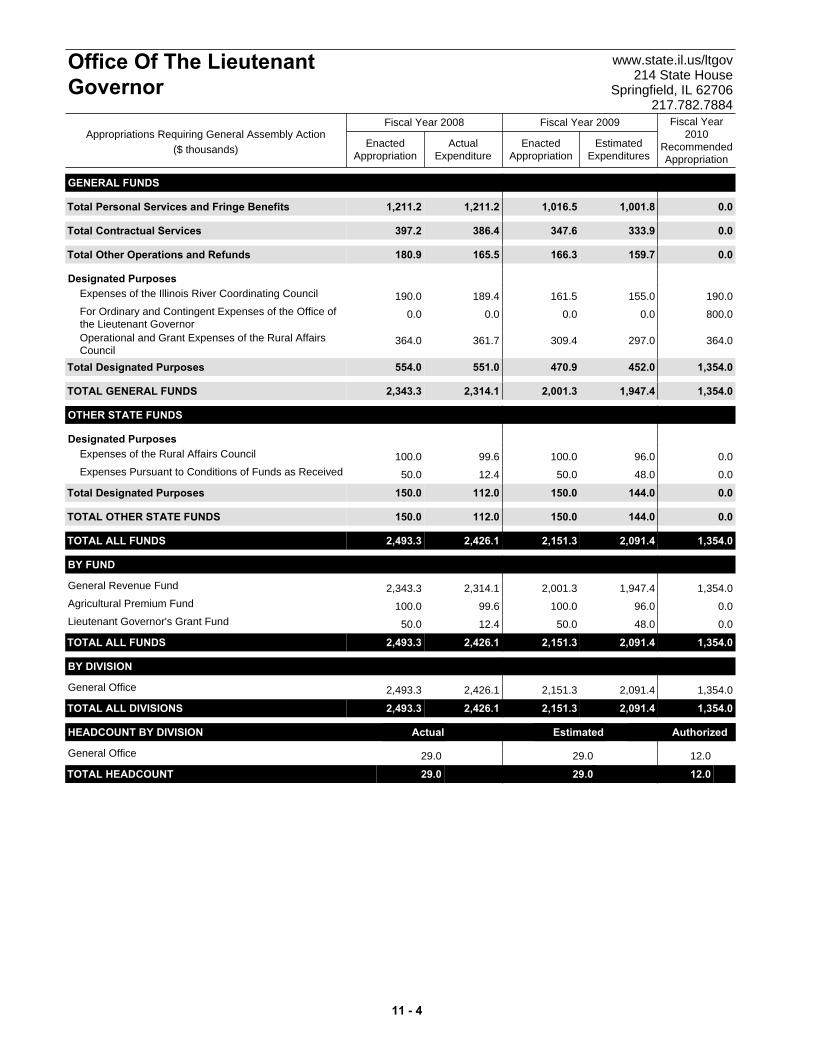
GENERAL FUNDS
Total 1,211.2 0.01,001.81,016.51,211.2Personal Services and Fringe Benefits
Total 397.2 0.0333.9347.6386.4Contractual Services
Total 180.9 0.0159.7166.3165.5Other Operations and Refunds
Designated Purposes190.0 190.0155.0161.5189.4Expenses of the Illinois River Coordinating Council
0.0 800.00.00.00.0For Ordinary and Contingent Expenses of the Office ofthe Lieutenant Governor
364.0 364.0297.0309.4361.7Operational and Grant Expenses of the Rural AffairsCouncil
Total 554.0 1,354.0452.0470.9551.0Designated Purposes
TOTAL GENERAL FUNDS 2,343.3 1,354.01,947.42,001.32,314.1
OTHER STATE FUNDS
Designated Purposes100.0 0.096.0100.099.6Expenses of the Rural Affairs Council
50.0 0.048.050.012.4Expenses Pursuant to Conditions of Funds as Received
Total 150.0 0.0144.0150.0112.0Designated Purposes
TOTAL OTHER STATE FUNDS 150.0 0.0144.0150.0112.0
TOTAL ALL FUNDS 2,493.3 1,354.02,091.42,151.32,426.1
BY FUND
2,343.3 1,354.01,947.42,001.32,314.1General Revenue Fund
100.0 0.096.0100.099.6Agricultural Premium Fund
50.0 0.048.050.012.4Lieutenant Governor's Grant Fund
TOTAL ALL FUNDS 2,493.3 1,354.02,091.42,151.32,426.1
BY DIVISION
2,493.3 1,354.02,091.42,151.32,426.1General Office
TOTAL ALL DIVISIONS 2,493.3 1,354.02,091.42,151.32,426.1
HEADCOUNT BY DIVISION Actual Estimated Authorized
29.0 12.029.0General Office
TOTAL HEADCOUNT 29.0 12.029.0 t
ActualExpenditure
EnactedAppropriation
EstimatedExpenditures
EnactedAppropriation
Fiscal Year2010
RecommendedAppropriation
Fiscal Year 2008 Fiscal Year 2009
Office Of The LieutenantGovernor
www.state.il.us/ltgov214 State House
Springfield, IL 62706217.782.7884
Appropriations Requiring General Assembly Action($ thousands)
11 - 4
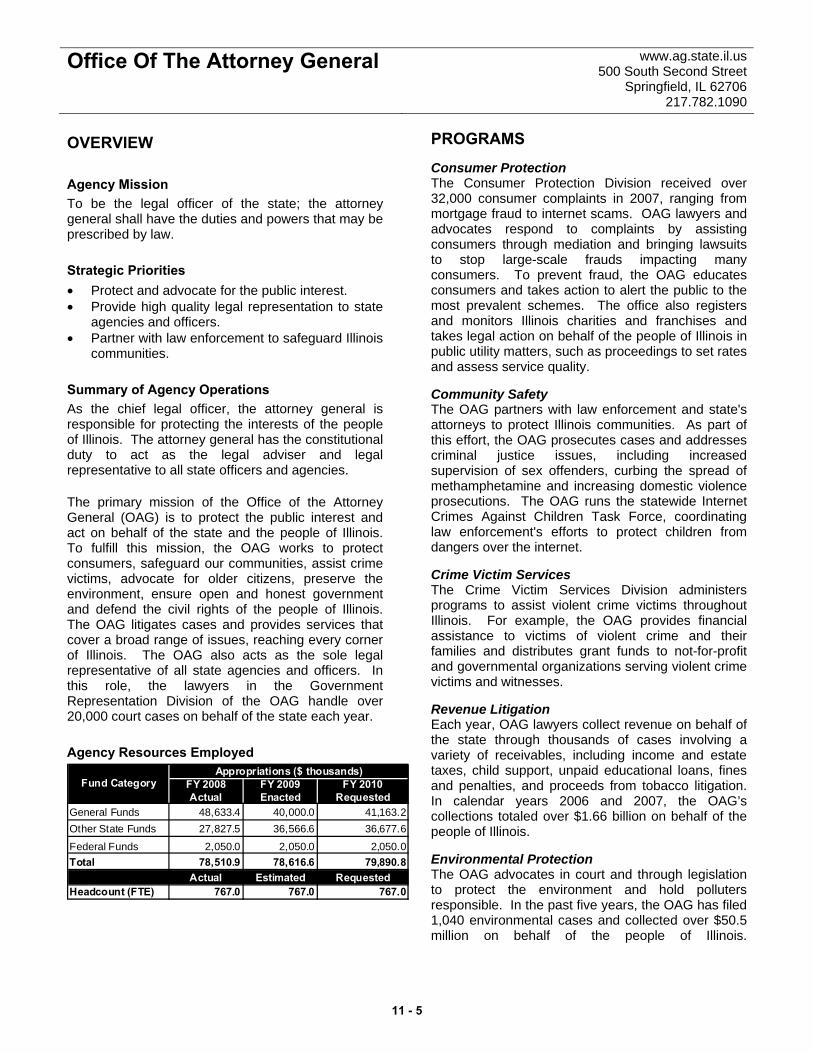
Office Of The Attorney General www.ag.state.il.us 500 South Second Street
Springfield, IL 62706 217.782.1090
OVERVIEW Agency Mission To be the legal officer of the state; the attorney general shall have the duties and powers that may be prescribed by law. Strategic Priorities • Protect and advocate for the public interest. • Provide high quality legal representation to state
agencies and officers. • Partner with law enforcement to safeguard Illinois
communities. Summary of Agency Operations As the chief legal officer, the attorney general is responsible for protecting the interests of the people of Illinois. The attorney general has the constitutional duty to act as the legal adviser and legal representative to all state officers and agencies. The primary mission of the Office of the Attorney General (OAG) is to protect the public interest and act on behalf of the state and the people of Illinois. To fulfill this mission, the OAG works to protect consumers, safeguard our communities, assist crime victims, advocate for older citizens, preserve the environment, ensure open and honest government and defend the civil rights of the people of Illinois. The OAG litigates cases and provides services that cover a broad range of issues, reaching every corner of Illinois. The OAG also acts as the sole legal representative of all state agencies and officers. In this role, the lawyers in the Government Representation Division of the OAG handle over 20,000 court cases on behalf of the state each year. Agency Resources Employed
FY 2008 FY 2009 FY 2010Actual Enacted Requested
General Funds 48,633.4 40,000.0 41,163.2Other State Funds 27,827.5 36,566.6 36,677.6
Federal Funds 2,050.0 2,050.0 2,050.0Total 78,510.9 78,616.6 79,890.8
Actual Estimated RequestedHeadcount (FTE) 767.0 767.0 767.0
Appropriations ($ thousands)Fund Category
PROGRAMS Consumer Protection The Consumer Protection Division received over 32,000 consumer complaints in 2007, ranging from mortgage fraud to internet scams. OAG lawyers and advocates respond to complaints by assisting consumers through mediation and bringing lawsuits to stop large-scale frauds impacting many consumers. To prevent fraud, the OAG educates consumers and takes action to alert the public to the most prevalent schemes. The office also registers and monitors Illinois charities and franchises and takes legal action on behalf of the people of Illinois in public utility matters, such as proceedings to set rates and assess service quality. Community Safety The OAG partners with law enforcement and state's attorneys to protect Illinois communities. As part of this effort, the OAG prosecutes cases and addresses criminal justice issues, including increased supervision of sex offenders, curbing the spread of methamphetamine and increasing domestic violence prosecutions. The OAG runs the statewide Internet Crimes Against Children Task Force, coordinating law enforcement's efforts to protect children from dangers over the internet. Crime Victim Services The Crime Victim Services Division administers programs to assist violent crime victims throughout Illinois. For example, the OAG provides financial assistance to victims of violent crime and their families and distributes grant funds to not-for-profit and governmental organizations serving violent crime victims and witnesses. Revenue Litigation Each year, OAG lawyers collect revenue on behalf of the state through thousands of cases involving a variety of receivables, including income and estate taxes, child support, unpaid educational loans, fines and penalties, and proceeds from tobacco litigation. In calendar years 2006 and 2007, the OAG’s collections totaled over $1.66 billion on behalf of the people of Illinois. Environmental Protection The OAG advocates in court and through legislation to protect the environment and hold polluters responsible. In the past five years, the OAG has filed 1,040 environmental cases and collected over $50.5 million on behalf of the people of Illinois.
11 - 5
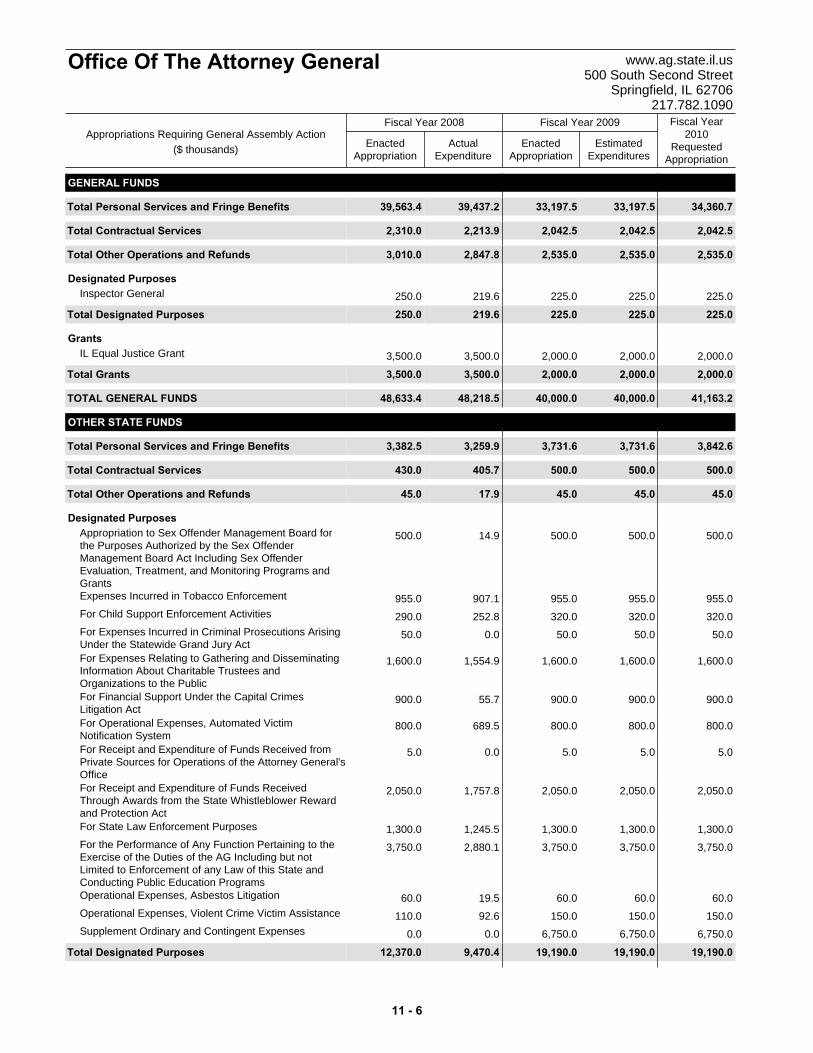
ActualExpenditure
EnactedAppropriation
EstimatedExpenditures
EnactedAppropriation
Fiscal Year2010
RequestedAppropriation
Fiscal Year 2008 Fiscal Year 2009
Office Of The Attorney General www.ag.state.il.us500 South Second Street
Springfield, IL 62706217.782.1090
Appropriations Requiring General Assembly Action($ thousands)
GENERAL FUNDS
Total 39,563.4 34,360.733,197.533,197.539,437.2Personal Services and Fringe Benefits
Total 2,310.0 2,042.52,042.52,042.52,213.9Contractual Services
Total 3,010.0 2,535.02,535.02,535.02,847.8Other Operations and Refunds
Designated Purposes250.0 225.0225.0225.0219.6Inspector General
Total 250.0 225.0225.0225.0219.6Designated Purposes
Grants3,500.0 2,000.02,000.02,000.03,500.0IL Equal Justice Grant
Total 3,500.0 2,000.02,000.02,000.03,500.0Grants
TOTAL GENERAL FUNDS 48,633.4 41,163.240,000.040,000.048,218.5
OTHER STATE FUNDS
Total 3,382.5 3,842.63,731.63,731.63,259.9Personal Services and Fringe Benefits
Total 430.0 500.0500.0500.0405.7Contractual Services
Total 45.0 45.045.045.017.9Other Operations and Refunds
Designated Purposes500.0 500.0500.0500.014.9Appropriation to Sex Offender Management Board for
the Purposes Authorized by the Sex OffenderManagement Board Act Including Sex OffenderEvaluation, Treatment, and Monitoring Programs andGrants
955.0 955.0955.0955.0907.1Expenses Incurred in Tobacco Enforcement
290.0 320.0320.0320.0252.8For Child Support Enforcement Activities
50.0 50.050.050.00.0For Expenses Incurred in Criminal Prosecutions ArisingUnder the Statewide Grand Jury Act
1,600.0 1,600.01,600.01,600.01,554.9For Expenses Relating to Gathering and DisseminatingInformation About Charitable Trustees andOrganizations to the Public
900.0 900.0900.0900.055.7For Financial Support Under the Capital CrimesLitigation Act
800.0 800.0800.0800.0689.5For Operational Expenses, Automated VictimNotification System
5.0 5.05.05.00.0For Receipt and Expenditure of Funds Received fromPrivate Sources for Operations of the Attorney General'sOffice
2,050.0 2,050.02,050.02,050.01,757.8For Receipt and Expenditure of Funds ReceivedThrough Awards from the State Whistleblower Rewardand Protection Act
1,300.0 1,300.01,300.01,300.01,245.5For State Law Enforcement Purposes
3,750.0 3,750.03,750.03,750.02,880.1For the Performance of Any Function Pertaining to theExercise of the Duties of the AG Including but notLimited to Enforcement of any Law of this State andConducting Public Education Programs
60.0 60.060.060.019.5Operational Expenses, Asbestos Litigation
110.0 150.0150.0150.092.6Operational Expenses, Violent Crime Victim Assistance
0.0 6,750.06,750.06,750.00.0Supplement Ordinary and Contingent Expenses
Total 12,370.0 19,190.019,190.019,190.09,470.4Designated Purposes
11 - 6

ActualExpenditure
EnactedAppropriation
EstimatedExpenditures
EnactedAppropriation
Fiscal Year2010
RequestedAppropriation
Fiscal Year 2008 Fiscal Year 2009
Office Of The Attorney General www.ag.state.il.us500 South Second Street
Springfield, IL 62706217.782.1090
Appropriations Requiring General Assembly Action($ thousands)
Grants8,000.0 8,000.08,000.08,000.07,778.2Awards and Grants to the Violent Crime Victims'
Assistance Act3,600.0 3,600.03,600.03,600.02,678.6For Receipt and Expenditure of Funds Received
Through Interagency Agreements, Multi-StateInvestigations and Court Orders for Distribution to ThirdParties
0.0 1,500.01,500.01,500.00.0IL Equal Justice Grant
Total 11,600.0 13,100.013,100.013,100.010,456.7Grants
TOTAL OTHER STATE FUNDS 27,827.5 36,677.636,566.636,566.623,610.7
FEDERAL FUNDS
Designated Purposes2,050.0 2,050.02,050.02,050.01,574.8For Receipt and Expenditure of Federal Funds
Total 2,050.0 2,050.02,050.02,050.01,574.8Designated Purposes
TOTAL FEDERAL FUNDS 2,050.0 2,050.02,050.02,050.01,574.8
TOTAL ALL FUNDS 78,510.9 79,890.878,616.678,616.673,404.0
BY FUND
48,633.4 41,163.240,000.040,000.048,218.5General Revenue Fund
1,300.0 1,300.01,300.01,300.01,245.5Illinois Gaming Law Enforcement Fund
2,599.3 2,807.82,743.02,743.02,431.1Asbestos Abatement Fund
50.0 50.050.050.00.0Statewide Grand Jury Prosecution Fund
500.0 500.0500.0500.014.9Sex Offender Management Board Fund
3,750.0 3,750.03,750.03,750.02,880.1Attorney General Court Ordered and VoluntaryCompliance Payment Projects Fund
1,600.0 1,600.01,600.01,600.01,554.9Illinois Charity Bureau Fund
2,050.0 2,050.02,050.02,050.01,757.8Attorney General Whistleblower Reward and ProtectionFund
900.0 900.0900.0900.055.7Capital Litigation Trust Fund
0.0 8,250.08,250.08,250.00.0Budget Relief Fund
955.0 955.0955.0955.0907.1Tobacco Settlement Recovery Fund
290.0 320.0320.0320.0252.8Child Support Administrative Fund
3,600.0 3,600.03,600.03,600.02,678.6Attorney General's State Projects and Court OrderedDistribution Fund
5.0 5.05.05.00.0Attorney General's Grant Fund
10,228.2 10,589.810,543.610,543.69,832.2Violent Crime Victims Assistance Fund
2,050.0 2,050.02,050.02,050.01,574.8Attorney General Federal Grant Fund
TOTAL ALL FUNDS 78,510.9 79,890.878,616.678,616.673,404.0
BY DIVISION
64,383.4 65,193.264,030.064,030.059,895.2General Office
1,300.0 1,300.01,300.01,300.01,245.5Enforcement
2,599.3 2,807.82,743.02,743.02,431.1Asbestos Litigation
10,228.2 10,589.810,543.610,543.69,832.2Crime Victims' Assistance
TOTAL ALL DIVISIONS 78,510.9 79,890.878,616.678,616.673,404.0
HEADCOUNT Actual Estimated Requested
TOTAL HEADCOUNT (Estimated) 767.0 767.0767.0 t
11 - 7
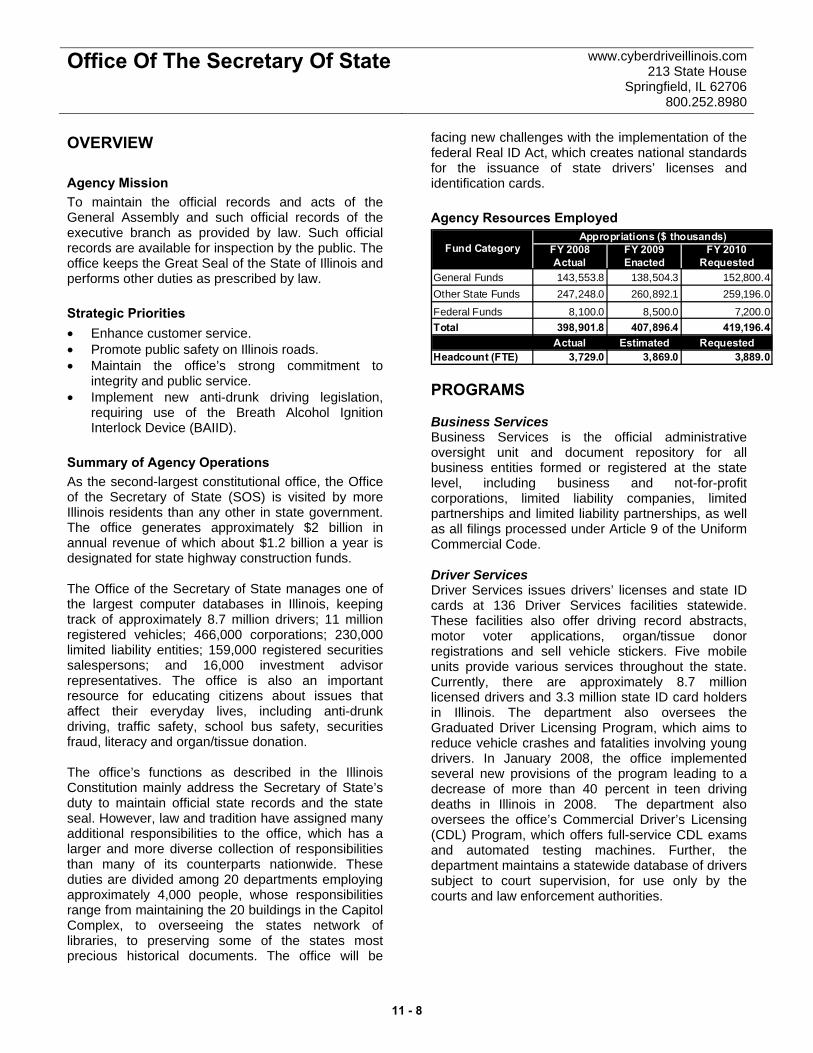
Office Of The Secretary Of State www.cyberdriveillinois.com 213 State House
Springfield, IL 62706 800.252.8980
OVERVIEW Agency Mission To maintain the official records and acts of the General Assembly and such official records of the executive branch as provided by law. Such official records are available for inspection by the public. The office keeps the Great Seal of the State of Illinois and performs other duties as prescribed by law. Strategic Priorities • Enhance customer service. • Promote public safety on Illinois roads. • Maintain the office’s strong commitment to
integrity and public service. • Implement new anti-drunk driving legislation,
requiring use of the Breath Alcohol Ignition Interlock Device (BAIID).
Summary of Agency Operations As the second-largest constitutional office, the Office of the Secretary of State (SOS) is visited by more Illinois residents than any other in state government. The office generates approximately $2 billion in annual revenue of which about $1.2 billion a year is designated for state highway construction funds. The Office of the Secretary of State manages one of the largest computer databases in Illinois, keeping track of approximately 8.7 million drivers; 11 million registered vehicles; 466,000 corporations; 230,000 limited liability entities; 159,000 registered securities salespersons; and 16,000 investment advisor representatives. The office is also an important resource for educating citizens about issues that affect their everyday lives, including anti-drunk driving, traffic safety, school bus safety, securities fraud, literacy and organ/tissue donation. The office’s functions as described in the Illinois Constitution mainly address the Secretary of State’s duty to maintain official state records and the state seal. However, law and tradition have assigned many additional responsibilities to the office, which has a larger and more diverse collection of responsibilities than many of its counterparts nationwide. These duties are divided among 20 departments employing approximately 4,000 people, whose responsibilities range from maintaining the 20 buildings in the Capitol Complex, to overseeing the states network of libraries, to preserving some of the states most precious historical documents. The office will be
facing new challenges with the implementation of the federal Real ID Act, which creates national standards for the issuance of state drivers’ licenses and identification cards. Agency Resources Employed
FY 2008 FY 2009 FY 2010Actual Enacted Requested
General Funds 143,553.8 138,504.3 152,800.4Other State Funds 247,248.0 260,892.1 259,196.0
Federal Funds 8,100.0 8,500.0 7,200.0Total 398,901.8 407,896.4 419,196.4
Actual Estimated RequestedHeadcount (FTE) 3,729.0 3,869.0 3,889.0
Appropriations ($ thousands)Fund Category
PROGRAMS Business Services Business Services is the official administrative oversight unit and document repository for all business entities formed or registered at the state level, including business and not-for-profit corporations, limited liability companies, limited partnerships and limited liability partnerships, as well as all filings processed under Article 9 of the Uniform Commercial Code. Driver Services Driver Services issues drivers’ licenses and state ID cards at 136 Driver Services facilities statewide. These facilities also offer driving record abstracts, motor voter applications, organ/tissue donor registrations and sell vehicle stickers. Five mobile units provide various services throughout the state. Currently, there are approximately 8.7 million licensed drivers and 3.3 million state ID card holders in Illinois. The department also oversees the Graduated Driver Licensing Program, which aims to reduce vehicle crashes and fatalities involving young drivers. In January 2008, the office implemented several new provisions of the program leading to a decrease of more than 40 percent in teen driving deaths in Illinois in 2008. The department also oversees the office’s Commercial Driver’s Licensing (CDL) Program, which offers full-service CDL exams and automated testing machines. Further, the department maintains a statewide database of drivers subject to court supervision, for use only by the courts and law enforcement authorities.
11 - 8

Office Of The Secretary Of State www.cyberdriveillinois.com 213 State House
Springfield, IL 62706 800.252.8980
Index Department In addition to serving as keeper of the Great Seal of Illinois, the Index Department is the official depository for numerous state documents, appoints notaries public and files census information on a biennial basis. Following each U.S. Census, the department assists in conducting a lottery to determine the length of General Assembly members’ terms. The department also is responsible for convening the Illinois Electoral College following presidential elections. In calendar year 2008, the department reported more than 198,353 notaries public held commissions, issued 81,189 apostilles, 13,158 certificates of authority for notaries and 3,789 certificates of incumbency for county and circuit clerks. The department also registered over 2,000 lobbyists and maintains their biannual expenditure disclosure reports. The Administrative Code Division maintains a complete library of all state agency rules and regulations dating back to the 1930s and publishes proposed, adopted, emergency and other rulemaking activities weekly in the Illinois Register. In 2008, approximately 20,000 pages were produced and more than 230 filings were accepted. The Illinois Register also contains all gubernatorial executive orders and proclamations. Public Records staff, in addition to filing legislation and preparing the annual Laws of Illinois, sent out approximately 30,000 Statements of Economic Interest in 2008.
Secretary of State Police The Secretary of State Department of Police is a statewide law enforcement agency. The department employs sworn investigators, uniformed Capitol police officers, uniformed security guards and civilian support personnel. The department regulates the automotive industry; enforces all laws and administrative regulations pertaining to the Secretary of State’s office; provides training to other law enforcement and government agencies; and provides security for the Capitol Complex. Securities The Securities Department regulates the offer and sale of securities pursuant to the Illinois Securities Law of 1953. The department registers securities offerings, broker-dealers, investment advisers and their salespersons and representatives, loan brokers, business brokers and those who offer and sell business opportunities. The department also is active in investor education and financial literacy programs, conducting seminars for investors and providing financial literacy teaching guides to Illinois schools. State Archives The State Archives Department maintains more than 76,000 cubic feet of state records of permanent, legal, administrative or historical value dating back to 1734. Important documents that have deteriorated are restored and repaired in the restoration laboratory, which treats more than 60,000 documents annually. The department also handles more than 16.5 million reference requests annually, including more than 25,000 requests for information from other state agencies.
11 - 9

ActualExpenditure
EnactedAppropriation
EstimatedExpenditures
EnactedAppropriation
Fiscal Year2010
RequestedAppropriation
Fiscal Year 2008 Fiscal Year 2009
Office Of The Secretary Of State www.cyberdriveillinois.com213 State House
Springfield, IL 62706800.252.8980
Appropriations Requiring General Assembly Action($ thousands)
GENERAL FUNDS
Total 90,443.9 95,240.183,321.483,321.490,174.3Personal Services and Fringe Benefits
Total 15,533.4 17,636.116,325.616,325.615,383.0Contractual Services
Total 6,566.0 8,588.75,271.85,271.86,244.5Other Operations and Refunds
Designated Purposes0.0 0.04,000.04,000.00.0For Costs Associated with the Constitutional Convention
Total 0.0 0.04,000.04,000.00.0Designated Purposes
Grants16,668.4 16,993.416,668.416,668.416,666.8Annual Equalization Grants, Per Capita and Area
Grants, and Per Capita Grants to Public Libraries644.9 644.9644.9644.9639.9Annual Library Technology Grants and Purchase of
Equipment and Services375.0 375.0375.0375.0375.0Annual Per Capita Grants to all School Districts to
Establish and Operate Qualified School Libraries250.0 250.0250.0250.0247.3For the Penny Severns Summer Family Literacy
325.0 325.0325.0325.0325.0Illinois Libraries for Project Next Generation
2,427.2 2,427.22,427.22,427.22,425.1Library Services for the Blind and PhysicallyHandicapped
4,650.0 4,650.04,650.04,650.04,649.2Literacy Programs
1,700.0 1,700.01,700.01,700.01,700.0The Chicago Public Library
45.0 45.045.045.044.9Tuition and Fees for Illinois Archival Depository SystemsInterns
Total 27,085.5 27,410.527,085.527,085.527,073.3Grants
Capital Improvements3,500.0 3,500.02,500.02,500.03,491.2Capitol Complex Security
425.0 425.00.00.0424.8Repairs, Maintenance and Permanent Improvements toVarious Buildings Under Jurisdiction of the Secretary ofState
Total 3,925.0 3,925.02,500.02,500.03,916.0Capital Improvements
TOTAL GENERAL FUNDS 143,553.8 152,800.4138,504.3138,504.3142,791.2
OTHER STATE FUNDS
Total 130,001.3 134,678.4134,684.2134,684.2127,777.1Personal Services and Fringe Benefits
Total 18,754.1 17,193.416,711.416,711.416,952.1Contractual Services
Total 21,959.3 18,103.919,066.319,066.319,697.3Other Operations and Refunds
Designated Purposes225.0 225.0225.0225.0223.4Alternative Fuels Fund
17,000.0 17,000.017,000.017,000.011,934.8Costs to Provide New or Replacement License Platesfor Motor Vehicles
1,333.5 1,333.51,333.51,333.5246.6Expenses for Promotion of Dangers of Security Fraud
700.0 500.0700.0700.0219.6Expenses in Accordance with Grant Agreements
0.0 3,000.02,000.02,000.00.0For All Secretary of State Costs Associated withAdministering Monitoring Device Driving Permits PerPublic Act 95-0400
100.0 60.0100.0100.055.1For SOS Police services
12.0 12.012.012.011.7For State Library Fund
11 - 10
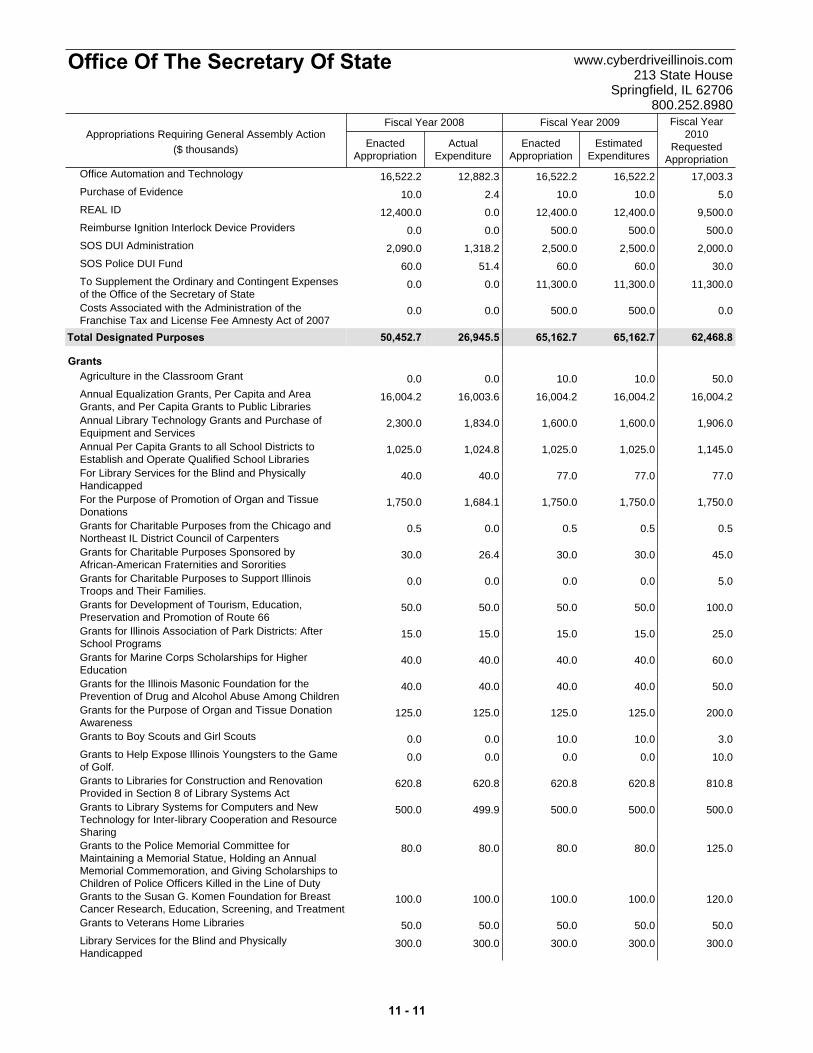
ActualExpenditure
EnactedAppropriation
EstimatedExpenditures
EnactedAppropriation
Fiscal Year2010
RequestedAppropriation
Fiscal Year 2008 Fiscal Year 2009
Office Of The Secretary Of State www.cyberdriveillinois.com213 State House
Springfield, IL 62706800.252.8980
Appropriations Requiring General Assembly Action($ thousands)
16,522.2 17,003.316,522.216,522.212,882.3Office Automation and Technology
10.0 5.010.010.02.4Purchase of Evidence
12,400.0 9,500.012,400.012,400.00.0REAL ID
0.0 500.0500.0500.00.0Reimburse Ignition Interlock Device Providers
2,090.0 2,000.02,500.02,500.01,318.2SOS DUI Administration
60.0 30.060.060.051.4SOS Police DUI Fund
0.0 11,300.011,300.011,300.00.0To Supplement the Ordinary and Contingent Expensesof the Office of the Secretary of State
0.0 0.0500.0500.00.0Costs Associated with the Administration of theFranchise Tax and License Fee Amnesty Act of 2007
Total 50,452.7 62,468.865,162.765,162.726,945.5Designated Purposes
Grants0.0 50.010.010.00.0Agriculture in the Classroom Grant
16,004.2 16,004.216,004.216,004.216,003.6Annual Equalization Grants, Per Capita and AreaGrants, and Per Capita Grants to Public Libraries
2,300.0 1,906.01,600.01,600.01,834.0Annual Library Technology Grants and Purchase ofEquipment and Services
1,025.0 1,145.01,025.01,025.01,024.8Annual Per Capita Grants to all School Districts toEstablish and Operate Qualified School Libraries
40.0 77.077.077.040.0For Library Services for the Blind and PhysicallyHandicapped
1,750.0 1,750.01,750.01,750.01,684.1For the Purpose of Promotion of Organ and TissueDonations
0.5 0.50.50.50.0Grants for Charitable Purposes from the Chicago andNortheast IL District Council of Carpenters
30.0 45.030.030.026.4Grants for Charitable Purposes Sponsored byAfrican-American Fraternities and Sororities
0.0 5.00.00.00.0Grants for Charitable Purposes to Support IllinoisTroops and Their Families.
50.0 100.050.050.050.0Grants for Development of Tourism, Education,Preservation and Promotion of Route 66
15.0 25.015.015.015.0Grants for Illinois Association of Park Districts: AfterSchool Programs
40.0 60.040.040.040.0Grants for Marine Corps Scholarships for HigherEducation
40.0 50.040.040.040.0Grants for the Illinois Masonic Foundation for thePrevention of Drug and Alcohol Abuse Among Children
125.0 200.0125.0125.0125.0Grants for the Purpose of Organ and Tissue DonationAwareness
0.0 3.010.010.00.0Grants to Boy Scouts and Girl Scouts
0.0 10.00.00.00.0Grants to Help Expose Illinois Youngsters to the Gameof Golf.
620.8 810.8620.8620.8620.8Grants to Libraries for Construction and RenovationProvided in Section 8 of Library Systems Act
500.0 500.0500.0500.0499.9Grants to Library Systems for Computers and NewTechnology for Inter-library Cooperation and ResourceSharing
80.0 125.080.080.080.0Grants to the Police Memorial Committee forMaintaining a Memorial Statue, Holding an AnnualMemorial Commemoration, and Giving Scholarships toChildren of Police Officers Killed in the Line of Duty
100.0 120.0100.0100.0100.0Grants to the Susan G. Komen Foundation for BreastCancer Research, Education, Screening, and Treatment
50.0 50.050.050.050.0Grants to Veterans Home Libraries
300.0 300.0300.0300.0300.0Library Services for the Blind and PhysicallyHandicapped
11 - 11

ActualExpenditure
EnactedAppropriation
EstimatedExpenditures
EnactedAppropriation
Fiscal Year2010
RequestedAppropriation
Fiscal Year 2008 Fiscal Year 2009
Office Of The Secretary Of State www.cyberdriveillinois.com213 State House
Springfield, IL 62706800.252.8980
Appropriations Requiring General Assembly Action($ thousands)
1,300.0 1,300.01,300.01,300.01,300.0Literacy Programs
500.0 500.0500.0500.0500.0Support and Expand Literacy Program
50.0 0.00.00.050.0For the Chicago Public Library, Brainerd Branch
10.0 0.00.00.010.0For the Chicago Public Library, South Shore Branch
10.0 0.00.00.010.0For the Chicago Public Schools, Black Stone Branch
100.0 0.00.00.0100.0Public Library - Chicago - Grant for Planning a NewLibrary for Grand Crossing
Total 25,040.5 25,136.524,227.524,227.524,503.6Grants
Capital Improvements40.0 40.040.040.040.0For the Operations of Maintenance of State Parking
Facilities1,000.0 575.00.01,000.0996.1New Construction and Alterations, Rehabilitation and
Maintenance for Chicago West Facility, Roger McAuliffeFacility, Charles Chew Jr. Facility, and Capitol ComplexBuildings
0.0 1,000.00.00.00.0Reappropriation New Construction and Alterations,Rehabilitation and Maintenance for Chicago WestFacility, Roger McAuliffe Facility, Charles Chew Jr.Facility, and Capital Complex Buildings
Total 1,040.0 1,615.040.01,040.01,036.1Capital Improvements
TOTAL OTHER STATE FUNDS 247,248.0 259,196.0259,892.1260,892.1216,911.7
FEDERAL FUNDS
Designated Purposes100.0 200.0500.0500.016.2Federal Projects
Total 100.0 200.0500.0500.016.2Designated Purposes
Grants7,000.0 7,000.07,000.07,000.06,607.3Library Services, Title IA
1,000.0 0.01,000.01,000.00.0Literacy Programs
Total 8,000.0 7,000.08,000.08,000.06,607.3Grants
TOTAL FEDERAL FUNDS 8,100.0 7,200.08,500.08,500.06,623.5
TOTAL ALL FUNDS 398,901.8 419,196.4406,896.4407,896.4366,326.4
BY FUND
143,553.8 152,800.4138,504.3138,504.3142,791.2General Revenue Fund
130,500.0 130,500.0130,500.0130,500.0129,670.2Road Fund
1,200.0 1,300.01,200.01,200.01,200.0Motor Fuel Tax Fund
21,244.0 21,090.020,474.020,474.021,162.0Live and Learn Fund
587.9 607.6607.6607.6446.4Lobbyist Registration Administration Fund
40.0 77.077.077.040.0Accessible Electronic Information Service Fund
1,063.8 1,063.81,063.81,063.81,061.5CDLIS/AAMVAnet Trust Fund
1,100.0 1,575.00.01,000.01,096.1Capital Development Fund
136.2 132.1131.6131.6118.0Division of Corporations Registered Limited LiabilityPartnership Fund
100.0 200.0500.0500.016.2Secretary of State Federal Projects Fund
7,658.3 7,000.07,658.37,658.35,919.7Secretary of State Special License Plate Fund
1,333.5 1,333.51,333.51,333.5246.6Securities Investors Education Fund
11 - 12
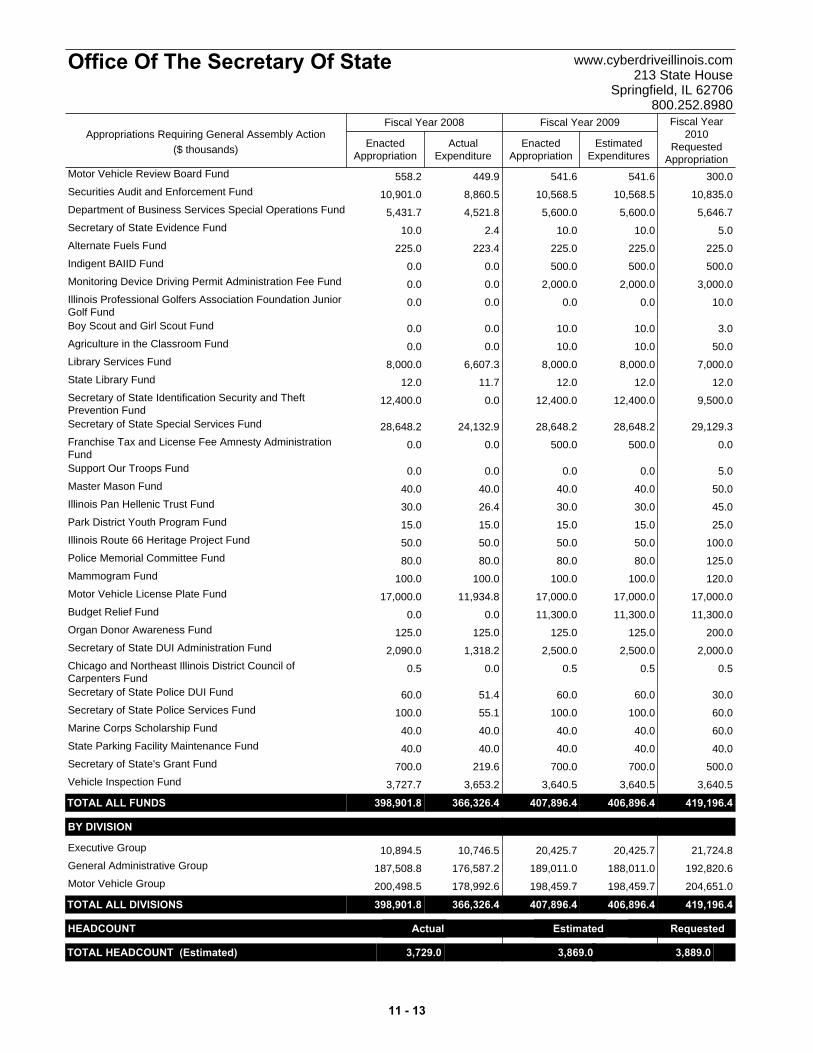
ActualExpenditure
EnactedAppropriation
EstimatedExpenditures
EnactedAppropriation
Fiscal Year2010
RequestedAppropriation
Fiscal Year 2008 Fiscal Year 2009
Office Of The Secretary Of State www.cyberdriveillinois.com213 State House
Springfield, IL 62706800.252.8980
Appropriations Requiring General Assembly Action($ thousands)
558.2 300.0541.6541.6449.9Motor Vehicle Review Board Fund
10,901.0 10,835.010,568.510,568.58,860.5Securities Audit and Enforcement Fund
5,431.7 5,646.75,600.05,600.04,521.8Department of Business Services Special Operations Fund
10.0 5.010.010.02.4Secretary of State Evidence Fund
225.0 225.0225.0225.0223.4Alternate Fuels Fund
0.0 500.0500.0500.00.0Indigent BAIID Fund
0.0 3,000.02,000.02,000.00.0Monitoring Device Driving Permit Administration Fee Fund
0.0 10.00.00.00.0Illinois Professional Golfers Association Foundation JuniorGolf Fund
0.0 3.010.010.00.0Boy Scout and Girl Scout Fund
0.0 50.010.010.00.0Agriculture in the Classroom Fund
8,000.0 7,000.08,000.08,000.06,607.3Library Services Fund
12.0 12.012.012.011.7State Library Fund
12,400.0 9,500.012,400.012,400.00.0Secretary of State Identification Security and TheftPrevention Fund
28,648.2 29,129.328,648.228,648.224,132.9Secretary of State Special Services Fund
0.0 0.0500.0500.00.0Franchise Tax and License Fee Amnesty AdministrationFund
0.0 5.00.00.00.0Support Our Troops Fund
40.0 50.040.040.040.0Master Mason Fund
30.0 45.030.030.026.4Illinois Pan Hellenic Trust Fund
15.0 25.015.015.015.0Park District Youth Program Fund
50.0 100.050.050.050.0Illinois Route 66 Heritage Project Fund
80.0 125.080.080.080.0Police Memorial Committee Fund
100.0 120.0100.0100.0100.0Mammogram Fund
17,000.0 17,000.017,000.017,000.011,934.8Motor Vehicle License Plate Fund
0.0 11,300.011,300.011,300.00.0Budget Relief Fund
125.0 200.0125.0125.0125.0Organ Donor Awareness Fund
2,090.0 2,000.02,500.02,500.01,318.2Secretary of State DUI Administration Fund
0.5 0.50.50.50.0Chicago and Northeast Illinois District Council ofCarpenters Fund
60.0 30.060.060.051.4Secretary of State Police DUI Fund
100.0 60.0100.0100.055.1Secretary of State Police Services Fund
40.0 60.040.040.040.0Marine Corps Scholarship Fund
40.0 40.040.040.040.0State Parking Facility Maintenance Fund
700.0 500.0700.0700.0219.6Secretary of State's Grant Fund
3,727.7 3,640.53,640.53,640.53,653.2Vehicle Inspection Fund
TOTAL ALL FUNDS 398,901.8 419,196.4406,896.4407,896.4366,326.4
BY DIVISION
10,894.5 21,724.820,425.720,425.710,746.5Executive Group
187,508.8 192,820.6188,011.0189,011.0176,587.2General Administrative Group
200,498.5 204,651.0198,459.7198,459.7178,992.6Motor Vehicle Group
TOTAL ALL DIVISIONS 398,901.8 419,196.4406,896.4407,896.4366,326.4
HEADCOUNT Actual Estimated Requested
TOTAL HEADCOUNT (Estimated) 3,729.0 3,889.03,869.0 t
11 - 13
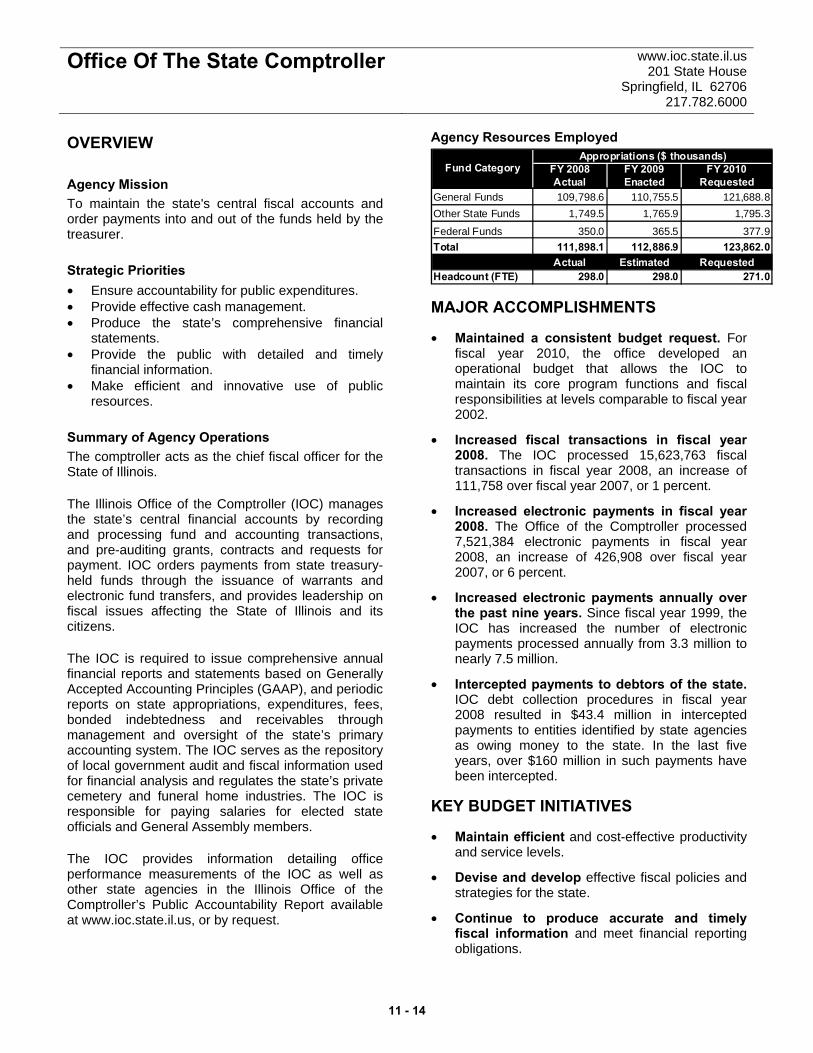
Office Of The State Comptroller www.ioc.state.il.us 201 State House
Springfield, IL 62706 217.782.6000
OVERVIEW Agency Mission To maintain the state's central fiscal accounts and order payments into and out of the funds held by the treasurer. Strategic Priorities • Ensure accountability for public expenditures. • Provide effective cash management. • Produce the state’s comprehensive financial
statements. • Provide the public with detailed and timely
financial information. • Make efficient and innovative use of public
resources. Summary of Agency Operations The comptroller acts as the chief fiscal officer for the State of Illinois. The Illinois Office of the Comptroller (IOC) manages the state’s central financial accounts by recording and processing fund and accounting transactions, and pre-auditing grants, contracts and requests for payment. IOC orders payments from state treasury-held funds through the issuance of warrants and electronic fund transfers, and provides leadership on fiscal issues affecting the State of Illinois and its citizens. The IOC is required to issue comprehensive annual financial reports and statements based on Generally Accepted Accounting Principles (GAAP), and periodic reports on state appropriations, expenditures, fees, bonded indebtedness and receivables through management and oversight of the state’s primary accounting system. The IOC serves as the repository of local government audit and fiscal information used for financial analysis and regulates the state’s private cemetery and funeral home industries. The IOC is responsible for paying salaries for elected state officials and General Assembly members. The IOC provides information detailing office performance measurements of the IOC as well as other state agencies in the Illinois Office of the Comptroller’s Public Accountability Report available at www.ioc.state.il.us, or by request.
Agency Resources Employed
FY 2008 FY 2009 FY 2010Actual Enacted Requested
General Funds 109,798.6 110,755.5 121,688.8Other State Funds 1,749.5 1,765.9 1,795.3
Federal Funds 350.0 365.5 377.9Total 111,898.1 112,886.9 123,862.0
Actual Estimated RequestedHeadcount (FTE) 298.0 298.0 271.0
Appropriations ($ thousands)Fund Category
MAJOR ACCOMPLISHMENTS
• Maintained a consistent budget request. For fiscal year 2010, the office developed an operational budget that allows the IOC to maintain its core program functions and fiscal responsibilities at levels comparable to fiscal year 2002.
• Increased fiscal transactions in fiscal year 2008. The IOC processed 15,623,763 fiscal transactions in fiscal year 2008, an increase of 111,758 over fiscal year 2007, or 1 percent.
• Increased electronic payments in fiscal year 2008. The Office of the Comptroller processed 7,521,384 electronic payments in fiscal year 2008, an increase of 426,908 over fiscal year 2007, or 6 percent.
• Increased electronic payments annually over the past nine years. Since fiscal year 1999, the IOC has increased the number of electronic payments processed annually from 3.3 million to nearly 7.5 million.
• Intercepted payments to debtors of the state. IOC debt collection procedures in fiscal year 2008 resulted in $43.4 million in intercepted payments to entities identified by state agencies as owing money to the state. In the last five years, over $160 million in such payments have been intercepted.
KEY BUDGET INITIATIVES
• Maintain efficient and cost-effective productivity and service levels.
• Devise and develop effective fiscal policies and strategies for the state.
• Continue to produce accurate and timely fiscal information and meet financial reporting obligations.
11 - 14
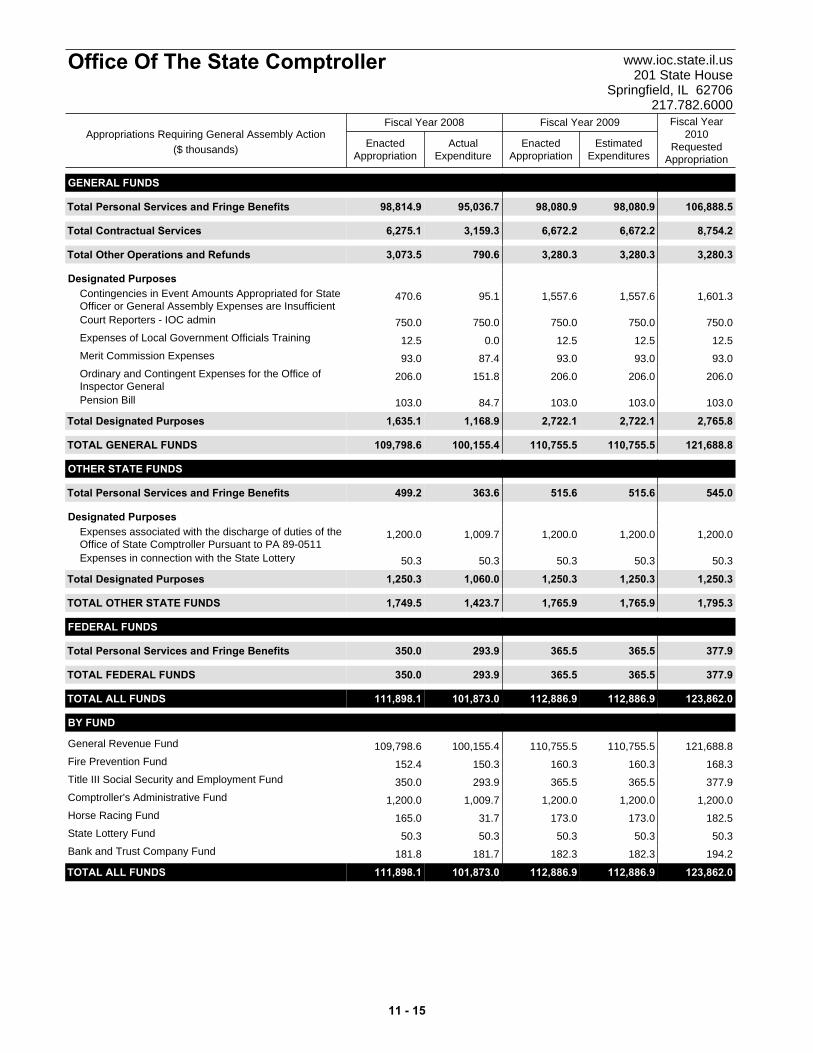
ActualExpenditure
EnactedAppropriation
EstimatedExpenditures
EnactedAppropriation
Fiscal Year2010
RequestedAppropriation
Fiscal Year 2008 Fiscal Year 2009
Office Of The State Comptroller www.ioc.state.il.us201 State House
Springfield, IL 62706217.782.6000
Appropriations Requiring General Assembly Action($ thousands)
GENERAL FUNDS
Total 98,814.9 106,888.598,080.998,080.995,036.7Personal Services and Fringe Benefits
Total 6,275.1 8,754.26,672.26,672.23,159.3Contractual Services
Total 3,073.5 3,280.33,280.33,280.3790.6Other Operations and Refunds
Designated Purposes470.6 1,601.31,557.61,557.695.1Contingencies in Event Amounts Appropriated for State
Officer or General Assembly Expenses are Insufficient750.0 750.0750.0750.0750.0Court Reporters - IOC admin
12.5 12.512.512.50.0Expenses of Local Government Officials Training
93.0 93.093.093.087.4Merit Commission Expenses
206.0 206.0206.0206.0151.8Ordinary and Contingent Expenses for the Office ofInspector General
103.0 103.0103.0103.084.7Pension Bill
Total 1,635.1 2,765.82,722.12,722.11,168.9Designated Purposes
TOTAL GENERAL FUNDS 109,798.6 121,688.8110,755.5110,755.5100,155.4
OTHER STATE FUNDS
Total 499.2 545.0515.6515.6363.6Personal Services and Fringe Benefits
Designated Purposes1,200.0 1,200.01,200.01,200.01,009.7Expenses associated with the discharge of duties of the
Office of State Comptroller Pursuant to PA 89-051150.3 50.350.350.350.3Expenses in connection with the State Lottery
Total 1,250.3 1,250.31,250.31,250.31,060.0Designated Purposes
TOTAL OTHER STATE FUNDS 1,749.5 1,795.31,765.91,765.91,423.7
FEDERAL FUNDS
Total 350.0 377.9365.5365.5293.9Personal Services and Fringe Benefits
TOTAL FEDERAL FUNDS 350.0 377.9365.5365.5293.9
TOTAL ALL FUNDS 111,898.1 123,862.0112,886.9112,886.9101,873.0
BY FUND
109,798.6 121,688.8110,755.5110,755.5100,155.4General Revenue Fund
152.4 168.3160.3160.3150.3Fire Prevention Fund
350.0 377.9365.5365.5293.9Title III Social Security and Employment Fund
1,200.0 1,200.01,200.01,200.01,009.7Comptroller's Administrative Fund
165.0 182.5173.0173.031.7Horse Racing Fund
50.3 50.350.350.350.3State Lottery Fund
181.8 194.2182.3182.3181.7Bank and Trust Company Fund
TOTAL ALL FUNDS 111,898.1 123,862.0112,886.9112,886.9101,873.0
11 - 15
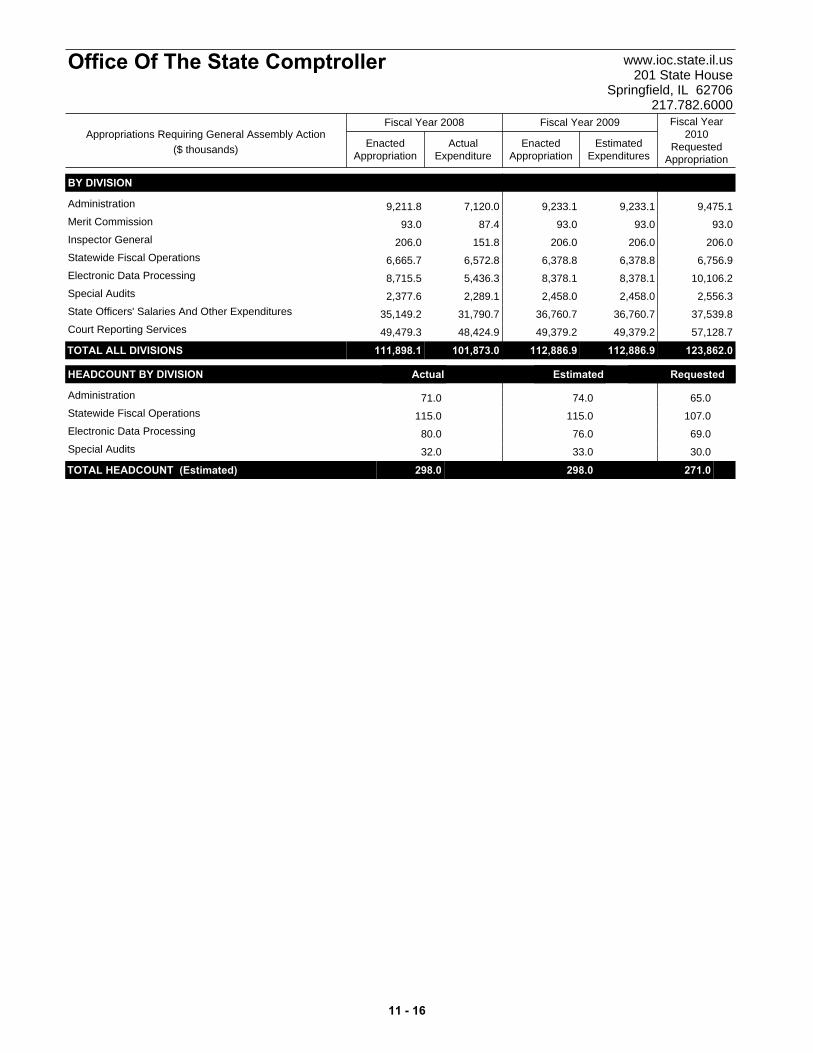
ActualExpenditure
EnactedAppropriation
EstimatedExpenditures
EnactedAppropriation
Fiscal Year2010
RequestedAppropriation
Fiscal Year 2008 Fiscal Year 2009
Office Of The State Comptroller www.ioc.state.il.us201 State House
Springfield, IL 62706217.782.6000
Appropriations Requiring General Assembly Action($ thousands)
BY DIVISION
9,211.8 9,475.19,233.19,233.17,120.0Administration
93.0 93.093.093.087.4Merit Commission
206.0 206.0206.0206.0151.8Inspector General
6,665.7 6,756.96,378.86,378.86,572.8Statewide Fiscal Operations
8,715.5 10,106.28,378.18,378.15,436.3Electronic Data Processing
2,377.6 2,556.32,458.02,458.02,289.1Special Audits
35,149.2 37,539.836,760.736,760.731,790.7State Officers' Salaries And Other Expenditures
49,479.3 57,128.749,379.249,379.248,424.9Court Reporting Services
TOTAL ALL DIVISIONS 111,898.1 123,862.0112,886.9112,886.9101,873.0
HEADCOUNT BY DIVISION Actual Estimated Requested
71.0 65.074.0Administration
115.0 107.0115.0Statewide Fiscal Operations
80.0 69.076.0Electronic Data Processing
32.0 30.033.0Special Audits
TOTAL HEADCOUNT (Estimated) 298.0 271.0298.0 t
11 - 16

State Officers' Salaries
GENERAL ASSEMBLY, OFFICERS AND MEMBERS: FY08 FY09 FY10 15
$7,842,400 $8,140,400 $8,368,3003,986,600 4,138,100 4,253,900
Speaker of the House, President of the Senate and Minority Leaders of Both Chambers
105,900 110,000 113,000
Majority Leader of the House 22,400 23,300 23,900Assistant Majority (6) and Minority (5) Leaders in the Senate 218,900 227,200 233,600Assistant Majority (6) and Minority (6) Leaders in the House 208,900 216,900 222,900Majority and Minority Caucus Chairmen in the Senate 39,800 41,300 42,500Majority and Minority Conference Chairmen in the House 34,900 36,200 37,200Deputy Majority (2) and Deputy Minority (2) Leaders in the House 76,300 79,200 81,400Chairmen and Minority Spokesmen of Standing Committees in the Senate Except the Rules Committee, the Committee on Committees and the Committee on the
Assignment of Bills 2
497,500 516,400 637,000
Chairmen and Minority Spokesmen of Standing and Selected Committees in the
House 31,074,500 1,115,300 1,146,500
$14,108,100 $14,644,300 $15,160,200
OFFICE OF THE AUDITOR GENERALFor the Auditor General 127,700 139,800 143,700
For Two Deputy Auditors General 237,400 246,400 253,300
DEPARTMENTS UNDER THE GOVERNOR: 1
DEPARTMENT ON AGINGFor the Director 111,400 115,700 118,900
DEPARTMENT OF AGRICULTUREFor the Director 128,400 133,300 137,100For the Assistant Director 109,000 113,200 116,300
DEPARTMENT OF CENTRAL MANAGEMENT SERVICESFor the Director 137,200 142,400 146,400For Two Assistant Directors 233,200 242,100 248,900
DEPARTMENT OF CHILDREN & FAMILY SERVICESFor the Director 144,800 150,300 154,500
DEPARTMENT OF COMMERCE & ECONOMIC OPPORTUNITY 4
For the Director 137,200 142,400 146,400For the Assistant Director 116,600 121,100 124,500
DEPARTMENT OF CORRECTIONS 5
For the Director 144,800 150,300 154,500For One Assistant Director 123,100 127,800 131,400
EMERGENCY MANAGEMENT AGENCYFor the Director 111,400 129,000 132,600
For the Assistant Director 6 111,400 115,700 118,900
DEPARTMENT OF FINANCIAL AND PROFESSIONAL REGULATION 7
For the Secretary 130,200 135,100 138,900For the Director - Financial Insitutions 111,400 115,700 118,900For the Director - Insurance 128,400 133,300 137,100For the Director - Professional Regulation 119,600 124,100 127,600
DEPARTMENT OF HEALTHCARE AND FAMILY SERVICESFor the Director 137,200 142,400 146,400For the Assistant Director 116,600 121,100 124,500
DEPARTMENT OF HUMAN RIGHTSFor the Director 111,400 115,700 118,900
TOTAL, GENERAL ASSEMBLY
Salaries, 118 Members, House of RepresentativesSalaries, 59 Members, The SenateAdditional Amounts, as Prescribed by Law for Party Leaders in Both Chambers:
11 - 17
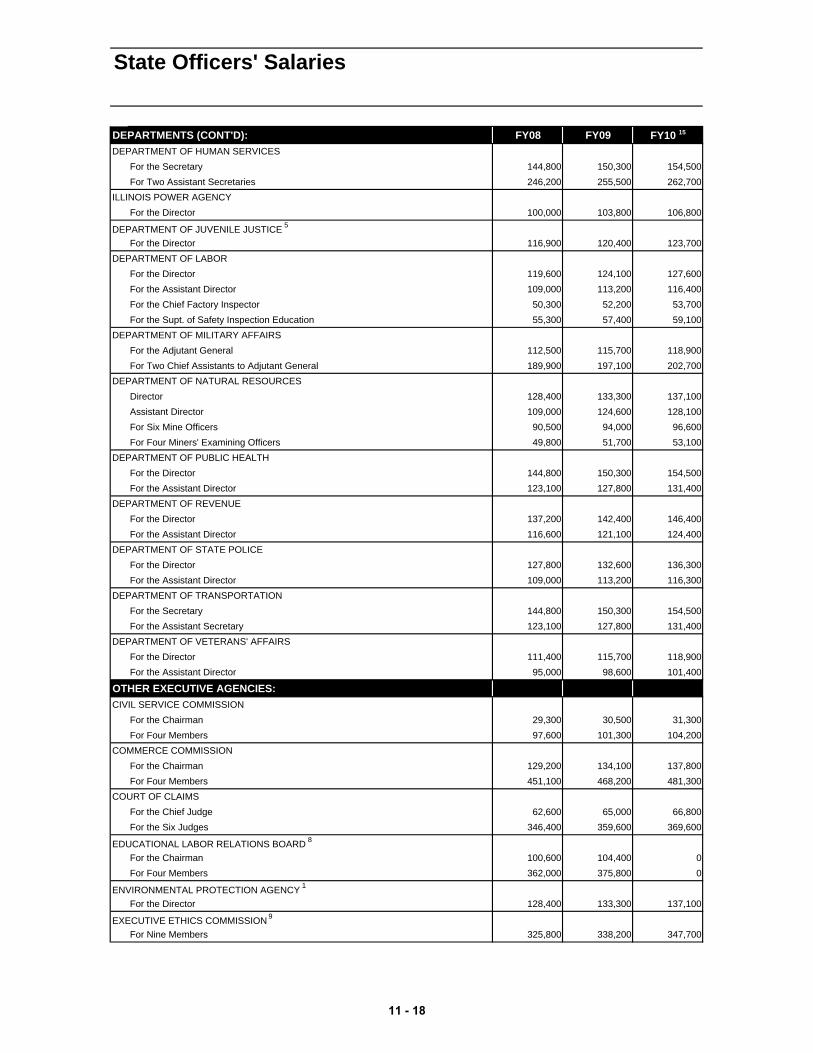
State Officers' Salaries
DEPARTMENTS (CONT'D): FY08 FY09 FY10 15
DEPARTMENT OF HUMAN SERVICESFor the Secretary 144,800 150,300 154,500For Two Assistant Secretaries 246,200 255,500 262,700
ILLINOIS POWER AGENCYFor the Director 100,000 103,800 106,800
DEPARTMENT OF JUVENILE JUSTICE 5
For the Director 116,900 120,400 123,700DEPARTMENT OF LABOR
For the Director 119,600 124,100 127,600For the Assistant Director 109,000 113,200 116,400For the Chief Factory Inspector 50,300 52,200 53,700For the Supt. of Safety Inspection Education 55,300 57,400 59,100
DEPARTMENT OF MILITARY AFFAIRSFor the Adjutant General 112,500 115,700 118,900For Two Chief Assistants to Adjutant General 189,900 197,100 202,700
DEPARTMENT OF NATURAL RESOURCESDirector 128,400 133,300 137,100Assistant Director 109,000 124,600 128,100For Six Mine Officers 90,500 94,000 96,600For Four Miners' Examining Officers 49,800 51,700 53,100
DEPARTMENT OF PUBLIC HEALTHFor the Director 144,800 150,300 154,500For the Assistant Director 123,100 127,800 131,400
DEPARTMENT OF REVENUEFor the Director 137,200 142,400 146,400For the Assistant Director 116,600 121,100 124,400
DEPARTMENT OF STATE POLICEFor the Director 127,800 132,600 136,300For the Assistant Director 109,000 113,200 116,300
DEPARTMENT OF TRANSPORTATIONFor the Secretary 144,800 150,300 154,500For the Assistant Secretary 123,100 127,800 131,400
DEPARTMENT OF VETERANS' AFFAIRSFor the Director 111,400 115,700 118,900For the Assistant Director 95,000 98,600 101,400
OTHER EXECUTIVE AGENCIES:CIVIL SERVICE COMMISSION
For the Chairman 29,300 30,500 31,300For Four Members 97,600 101,300 104,200
COMMERCE COMMISSIONFor the Chairman 129,200 134,100 137,800For Four Members 451,100 468,200 481,300
COURT OF CLAIMSFor the Chief Judge 62,600 65,000 66,800For the Six Judges 346,400 359,600 369,600
EDUCATIONAL LABOR RELATIONS BOARD 8
For the Chairman 100,600 104,400 0For Four Members 362,000 375,800 0
ENVIRONMENTAL PROTECTION AGENCY 1
For the Director 128,400 133,300 137,100
EXECUTIVE ETHICS COMMISSION 9
For Nine Members 325,800 338,200 347,700
11 - 18

State Officers' Salaries
OTHER EXECUTIVE AGENCIES (CONT'D): FY08 FY09 FY10 15
HUMAN RIGHTS COMMISSIONFor the Chairman 50,300 52,200 53,700For Twelve Members 543,000 563,600 579,300
LABOR RELATIONS BOARD 10
For the Chairman 100,600 104,400 107,300For Four State Panel Members 362,000 375,800 386,300For Two Local Panel Members 181,000 187,900 193,200
LIQUOR CONTROL COMMISSIONFor the Chairman 37,500 39,000 40,100For Six Members 196,900 204,400 210,100For the Secretary 36,200 37,600 38,700For the Chairman and One Member for Work on a License Appeal Commission (by law, $200 per diem) 55,000 55,000 55,000
POLLUTION CONTROL BOARD 11
For the Chairman 116,700 121,100 124,500For Four Members 451,100 468,200 481,300
PRISONER REVIEW BOARD For the Chairman 92,400 95,900 98,600For Fourteen Members 1,158,400 1,202,500 1,236,100
PROPERTY TAX APPEAL BOARD For the Chairman 62,400 64,800 66,600For Four Members 201,100 208,800 214,600
STATE BOARD OF ELECTIONS For the Chairman 56,400 58,500 60,100For the Vice Chairman 46,300 48,100 49,400For Six Members 217,200 225,500 231,800
SECRETARY OF STATE MERIT COMMISSION For the Chairman 16,600 17,300 17,700For Four Members 49,800 51,700 53,100
STATE POLICE MERIT BOARD
For Five Members (per diem) 12 114,400 118,400 121,500
WORKERS' COMPENSATION COMMISSION 13
For the Chairman 120,700 125,300 128,800For Nine Members 1,039,100 1,078,600 1,108,800
APPOINTED STATE OFFICERS, FUNDS OTHER THAN GENERAL REVENUE:DEPARTMENT OF EMPLOYMENT SECURITY
For the Director 1 137,200 142,400 146,400For Five Members of the Board of Review 75,000 75,000 75,000
DEPARTMENT OF FINANCIAL AND PROFESSIONAL REGULATION 7
For the Director - Banks and Real Estate 1 131,300 136,300 140,100STATE FIRE MARSHAL (Fire Prevention Fund)
For the State Fire Marshal 1 111,400 115,700 118,900ILLINOIS RACING BOARD (Horse Racing Fund)
For Eleven Members (per diem) 14 132,800 137,800 141,700
ELECTED OFFICERS:For the Governor 171,000 177,500 182,400For the Lieutenant Governor 130,800 135,700 139,500For the Secretary of State 150,900 156,600 161,000For the Attorney General 150,900 156,600 161,000For the State Treasurer 130,800 135,700 139,500For the State Comptroller 130,800 135,700 139,500
TOTAL, ALL STATE OFFICERS' SALARIES: $28,582,500 $29,694,300 $30,133,800
11 - 19

State Officers’ Salaries – Footnotes
1. Pursuant to Public Act 91-25 and 91-798, the governor is allowed to set the salaries to amounts not to exceed 85 percent of the governor's salary.
2. Senate Committees: The 96th General Assembly increased their number of committees from 24 to 29.
3. House Committees: The number of committees for the 96th General Assembly remained at 54.
4. Effective February 2003, the name of the Department of Commerce and Community Affairs was changed to the Department of Commerce and Economic Opportunity.
5. Pursuant to Public Act 94-696, the Department of Juvenile Justice was created. The Assistant Director of Corrections - Juvenile was abolished and the Director of Juvenile Justice was created.
6. Pursuant to Executive Order 12, the Department of Nuclear Safety was abolished and all powers, duties, rights and responsibilities were transferred to the Illinois Emergency Management Agency, effective July 1, 2003. The Director of Nuclear Safety was transferred to the Illinois Emergency Management Agency and was made the Assistant Director of the Illinois Emergency Management Agency.
7. Pursuant to Executive Order 2004-6, the Department of Financial Institutions, the Department of Insurance, the Department of Professional Regulation and the Office of Banks and Real Estate were abolished and all powers, duties, rights and responsibilities were transferred to the Department of Financial and Professional Regulation effective July 1, 2004. The Department of Financial and Professional Regulation's lead officer will be known as the Secretary and there will be four Directors to oversee the respective functions of the consolidated agencies.
8. Illinois Educational Labor Relations Board: Pursuant to Public Act 93-509, the previous board was abolished and a new board was created. The board was reduced from seven members to five members. The chairman and the members received new terms.
9. Pursuant to Public Act 93-617, the Executive Ethic Commission was created. The commission consists of nine members.
10. Illinois Labor Relations Board: Pursuant to Public Act 93-509, the previous board was abolished and a new board was created. The board was reduced from eight members to seven members. The chairman and the members received new terms.
11. Pollution Control Board: Pursuant to Public Act 93-509, the previous board was abolished and a new board was created. The board was reduced from seven members to five members. The chairman and the members received new terms.
12. State Police Merit Board: Board members received $228 per diem in fiscal year 2008 and $237 per diem in fiscal year 2009. Board members will receive $243 per diem in fiscal year 2010, in accordance with the law.
13. Workers' Compensation Commission: Pursuant to Public Act 94-277, the Illinois Industrial Commission was abolished and the Illinois Workers' Compensation Commission was created. The new commission consists of ten members. The chairman and the members received new terms.
14. Illinois Racing Board: Board members received $300 per diem to a maximum of $12,068 for fiscal year 2008, $12,527 for fiscal year 2009, and $12,877 for fiscal year 2010 as prescribed by law.
15. Pursuant to the 1990 Report of the Compensation Review Board (Board) and the 1990 Senate Joint Resolution No. 192, all salaries reviewed by the Board receive an annual Cost of Living Adjustment (COLA), effective every July 1st. The COLA is based on a federal index for the calendar year preceding the scheduled increase known as the "Employment Cost Index, Wages and Salaries, By Occupation and Industry Groups: State and Local Government Workers: Public Administration, published by the U.S. Department of Labor, Bureau of Labor Statistics. Pursuant to this index, all salaries are scheduled to be increased by 2.8% effective July 1, 2009.
Note: The requested appropriation amounts for state officers’ salaries and other expenditures may be adjusted to reflect recommendations made by the state Compensation Review Board and/or appointment actions taken by the governor and General Assembly.
11 - 20
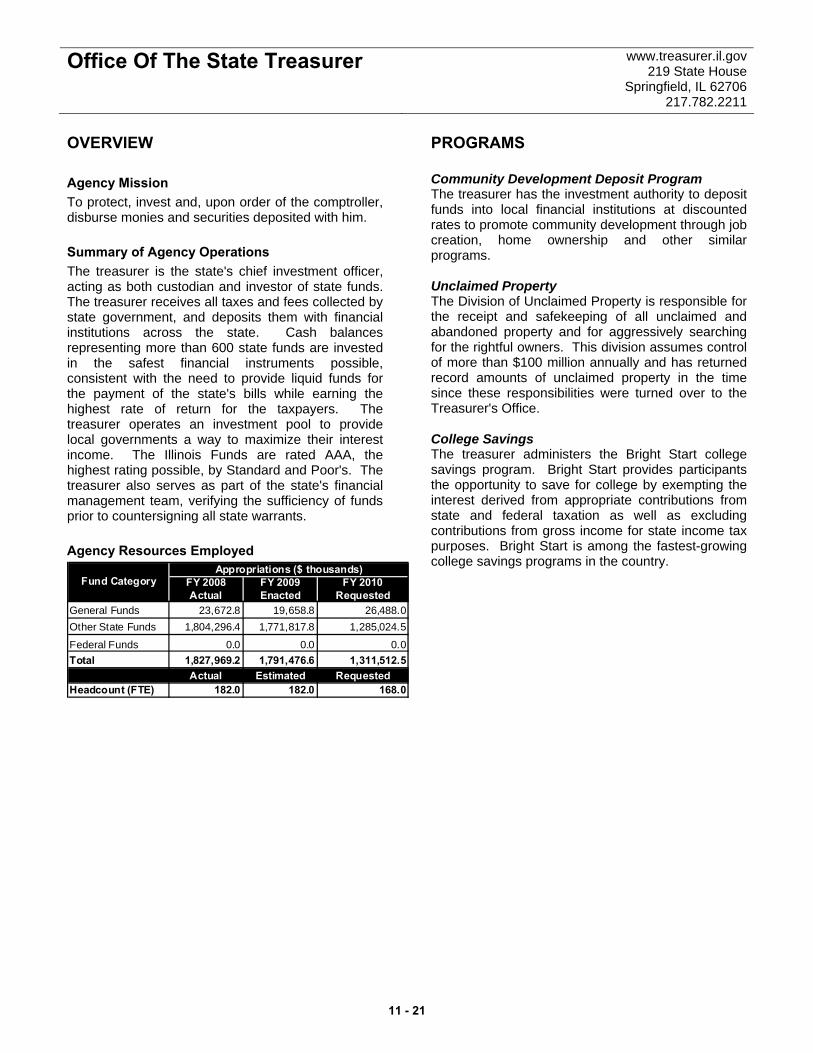
Office Of The State Treasurer www.treasurer.il.gov 219 State House
Springfield, IL 62706 217.782.2211
OVERVIEW Agency Mission To protect, invest and, upon order of the comptroller, disburse monies and securities deposited with him. Summary of Agency Operations The treasurer is the state's chief investment officer, acting as both custodian and investor of state funds. The treasurer receives all taxes and fees collected by state government, and deposits them with financial institutions across the state. Cash balances representing more than 600 state funds are invested in the safest financial instruments possible, consistent with the need to provide liquid funds for the payment of the state's bills while earning the highest rate of return for the taxpayers. The treasurer operates an investment pool to provide local governments a way to maximize their interest income. The Illinois Funds are rated AAA, the highest rating possible, by Standard and Poor's. The treasurer also serves as part of the state's financial management team, verifying the sufficiency of funds prior to countersigning all state warrants. Agency Resources Employed
FY 2008 FY 2009 FY 2010Actual Enacted Requested
General Funds 23,672.8 19,658.8 26,488.0Other State Funds 1,804,296.4 1,771,817.8 1,285,024.5
Federal Funds 0.0 0.0 0.0Total 1,827,969.2 1,791,476.6 1,311,512.5
Actual Estimated RequestedHeadcount (FTE) 182.0 182.0 168.0
Appropriations ($ thousands)Fund Category
PROGRAMS Community Development Deposit Program The treasurer has the investment authority to deposit funds into local financial institutions at discounted rates to promote community development through job creation, home ownership and other similar programs. Unclaimed Property The Division of Unclaimed Property is responsible for the receipt and safekeeping of all unclaimed and abandoned property and for aggressively searching for the rightful owners. This division assumes control of more than $100 million annually and has returned record amounts of unclaimed property in the time since these responsibilities were turned over to the Treasurer's Office. College Savings The treasurer administers the Bright Start college savings program. Bright Start provides participants the opportunity to save for college by exempting the interest derived from appropriate contributions from state and federal taxation as well as excluding contributions from gross income for state income tax purposes. Bright Start is among the fastest-growing college savings programs in the country.
11 - 21
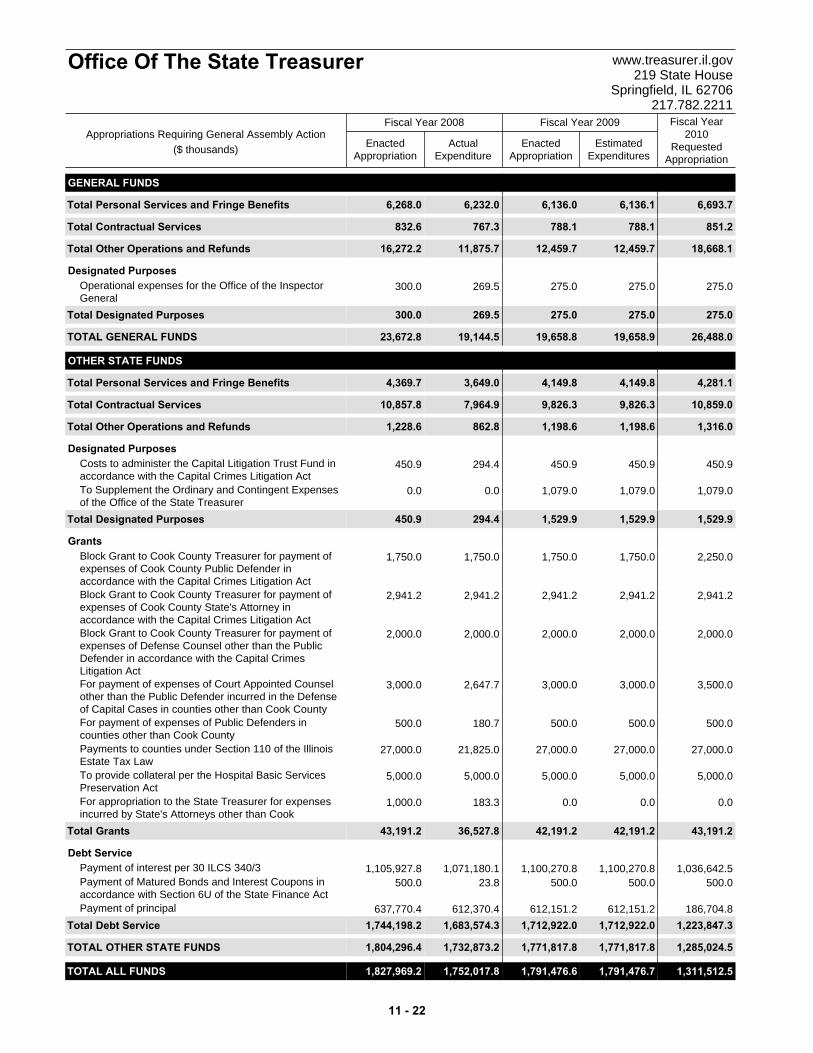
ActualExpenditure
EnactedAppropriation
EstimatedExpenditures
EnactedAppropriation
Fiscal Year2010
RequestedAppropriation
Fiscal Year 2008 Fiscal Year 2009
Office Of The State Treasurer www.treasurer.il.gov219 State House
Springfield, IL 62706217.782.2211
Appropriations Requiring General Assembly Action($ thousands)
GENERAL FUNDS
Total 6,268.0 6,693.76,136.16,136.06,232.0Personal Services and Fringe Benefits
Total 832.6 851.2788.1788.1767.3Contractual Services
Total 16,272.2 18,668.112,459.712,459.711,875.7Other Operations and Refunds
Designated Purposes300.0 275.0275.0275.0269.5Operational expenses for the Office of the Inspector
GeneralTotal 300.0 275.0275.0275.0269.5Designated Purposes
TOTAL GENERAL FUNDS 23,672.8 26,488.019,658.919,658.819,144.5
OTHER STATE FUNDS
Total 4,369.7 4,281.14,149.84,149.83,649.0Personal Services and Fringe Benefits
Total 10,857.8 10,859.09,826.39,826.37,964.9Contractual Services
Total 1,228.6 1,316.01,198.61,198.6862.8Other Operations and Refunds
Designated Purposes450.9 450.9450.9450.9294.4Costs to administer the Capital Litigation Trust Fund in
accordance with the Capital Crimes Litigation Act0.0 1,079.01,079.01,079.00.0To Supplement the Ordinary and Contingent Expenses
of the Office of the State TreasurerTotal 450.9 1,529.91,529.91,529.9294.4Designated Purposes
Grants1,750.0 2,250.01,750.01,750.01,750.0Block Grant to Cook County Treasurer for payment of
expenses of Cook County Public Defender inaccordance with the Capital Crimes Litigation Act
2,941.2 2,941.22,941.22,941.22,941.2Block Grant to Cook County Treasurer for payment ofexpenses of Cook County State's Attorney inaccordance with the Capital Crimes Litigation Act
2,000.0 2,000.02,000.02,000.02,000.0Block Grant to Cook County Treasurer for payment ofexpenses of Defense Counsel other than the PublicDefender in accordance with the Capital CrimesLitigation Act
3,000.0 3,500.03,000.03,000.02,647.7For payment of expenses of Court Appointed Counselother than the Public Defender incurred in the Defenseof Capital Cases in counties other than Cook County
500.0 500.0500.0500.0180.7For payment of expenses of Public Defenders incounties other than Cook County
27,000.0 27,000.027,000.027,000.021,825.0Payments to counties under Section 110 of the IllinoisEstate Tax Law
5,000.0 5,000.05,000.05,000.05,000.0To provide collateral per the Hospital Basic ServicesPreservation Act
1,000.0 0.00.00.0183.3For appropriation to the State Treasurer for expensesincurred by State's Attorneys other than Cook
Total 43,191.2 43,191.242,191.242,191.236,527.8Grants
Debt Service1,105,927.8 1,036,642.51,100,270.81,100,270.81,071,180.1Payment of interest per 30 ILCS 340/3
500.0 500.0500.0500.023.8Payment of Matured Bonds and Interest Coupons inaccordance with Section 6U of the State Finance Act
637,770.4 186,704.8612,151.2612,151.2612,370.4Payment of principalTotal 1,744,198.2 1,223,847.31,712,922.01,712,922.01,683,574.3Debt Service
TOTAL OTHER STATE FUNDS 1,804,296.4 1,285,024.51,771,817.81,771,817.81,732,873.2
TOTAL ALL FUNDS 1,827,969.2 1,311,512.51,791,476.71,791,476.61,752,017.8
11 - 22
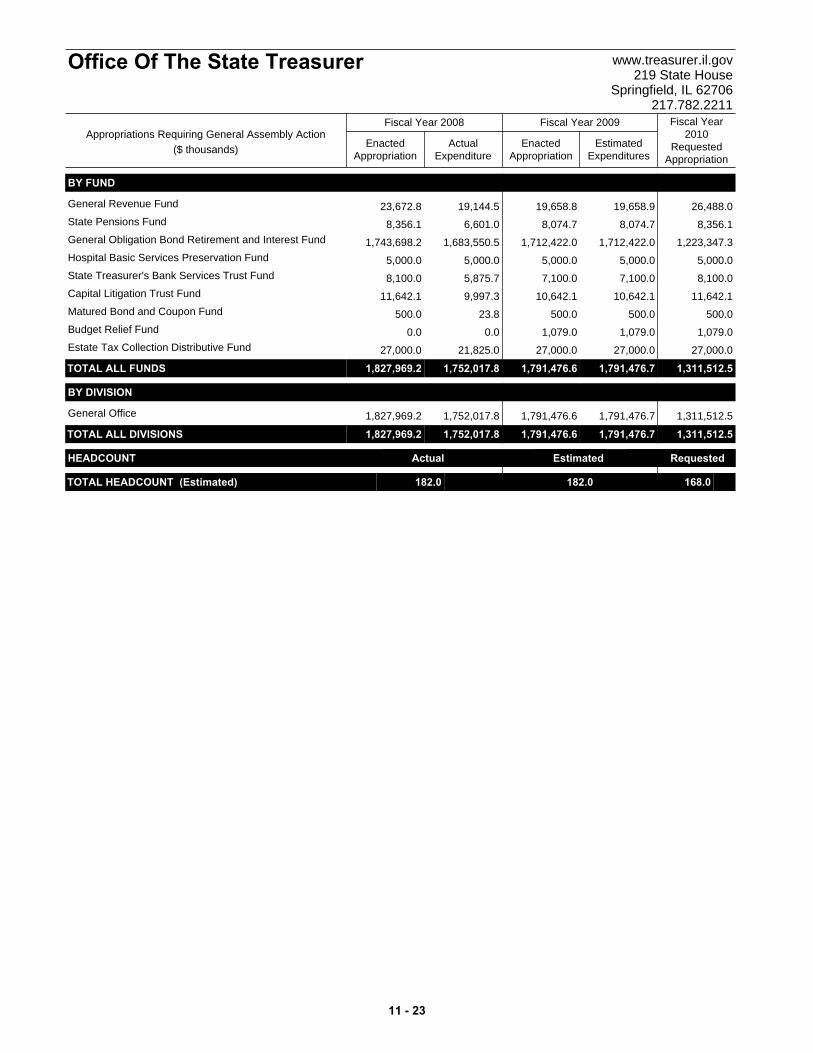
ActualExpenditure
EnactedAppropriation
EstimatedExpenditures
EnactedAppropriation
Fiscal Year2010
RequestedAppropriation
Fiscal Year 2008 Fiscal Year 2009
Office Of The State Treasurer www.treasurer.il.gov219 State House
Springfield, IL 62706217.782.2211
Appropriations Requiring General Assembly Action($ thousands)
BY FUND
23,672.8 26,488.019,658.919,658.819,144.5General Revenue Fund
8,356.1 8,356.18,074.78,074.76,601.0State Pensions Fund
1,743,698.2 1,223,347.31,712,422.01,712,422.01,683,550.5General Obligation Bond Retirement and Interest Fund
5,000.0 5,000.05,000.05,000.05,000.0Hospital Basic Services Preservation Fund
8,100.0 8,100.07,100.07,100.05,875.7State Treasurer's Bank Services Trust Fund
11,642.1 11,642.110,642.110,642.19,997.3Capital Litigation Trust Fund
500.0 500.0500.0500.023.8Matured Bond and Coupon Fund
0.0 1,079.01,079.01,079.00.0Budget Relief Fund
27,000.0 27,000.027,000.027,000.021,825.0Estate Tax Collection Distributive Fund
TOTAL ALL FUNDS 1,827,969.2 1,311,512.51,791,476.71,791,476.61,752,017.8
BY DIVISION
1,827,969.2 1,311,512.51,791,476.71,791,476.61,752,017.8General Office
TOTAL ALL DIVISIONS 1,827,969.2 1,311,512.51,791,476.71,791,476.61,752,017.8
HEADCOUNT Actual Estimated Requested
TOTAL HEADCOUNT (Estimated) 182.0 168.0182.0 t
11 - 23

GENERAL FUNDS
Total 46,872.5 37,925.051,931.051,931.046,872.5Personal Services and Fringe Benefits
TOTAL GENERAL FUNDS 46,872.5 37,925.051,931.051,931.046,872.5
TOTAL ALL FUNDS 46,872.5 37,925.051,931.051,931.046,872.5
BY FUND
46,872.5 37,925.051,931.051,931.046,872.5General Revenue Fund
TOTAL ALL FUNDS 46,872.5 37,925.051,931.051,931.046,872.5
BY DIVISION
46,872.5 37,925.051,931.051,931.046,872.5Operations
TOTAL ALL DIVISIONS 46,872.5 37,925.051,931.051,931.046,872.5
ActualExpenditure
EnactedAppropriation
EstimatedExpenditures
EnactedAppropriation
Fiscal Year2010
RequestedAppropriation
Fiscal Year 2008 Fiscal Year 2009
Judges' Retirement System www.state.il.us/srs2101 South Veterans Parkway
Springfield, IL 62704217-785-7444
Appropriations Requiring General Assembly Action($ thousands)
11 - 24
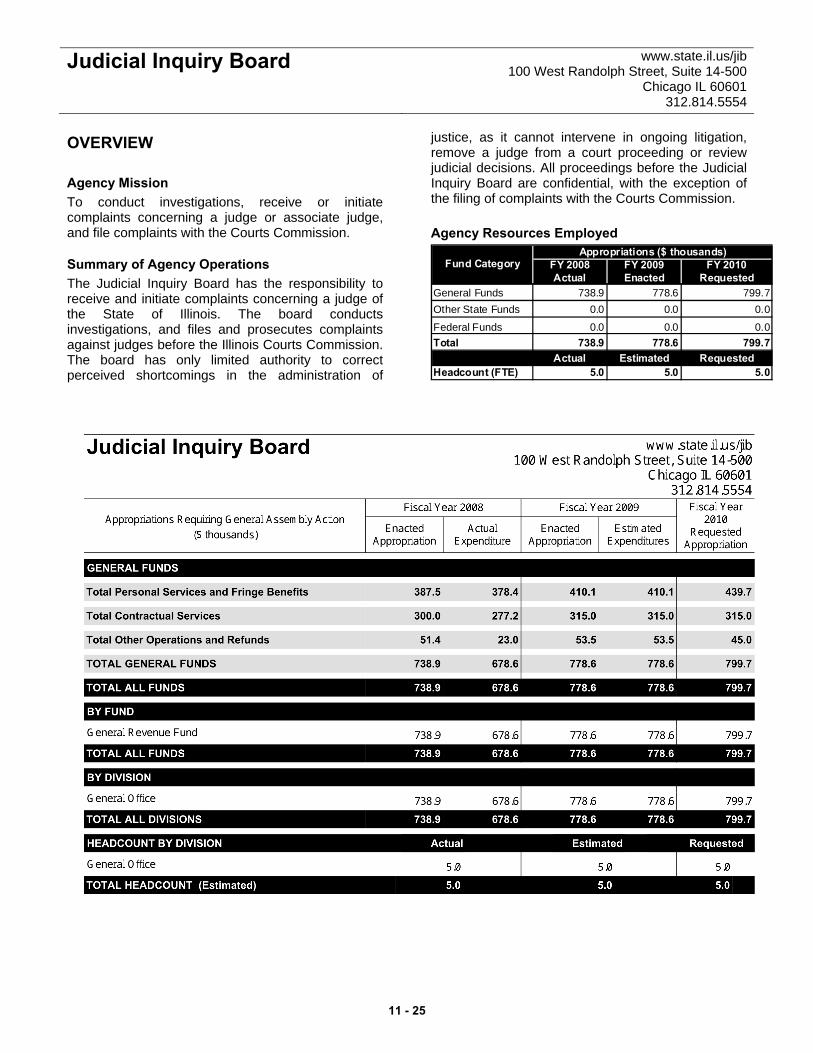
Judicial Inquiry Board www.state.il.us/jib 100 West Randolph Street, Suite 14-500
Chicago IL 60601 312.814.5554
OVERVIEW Agency Mission To conduct investigations, receive or initiate complaints concerning a judge or associate judge, and file complaints with the Courts Commission.
Summary of Agency Operations The Judicial Inquiry Board has the responsibility to receive and initiate complaints concerning a judge of the State of Illinois. The board conducts investigations, and files and prosecutes complaints against judges before the Illinois Courts Commission. The board has only limited authority to correct perceived shortcomings in the administration of
justice, as it cannot intervene in ongoing litigation, remove a judge from a court proceeding or review judicial decisions. All proceedings before the Judicial Inquiry Board are confidential, with the exception of the filing of complaints with the Courts Commission. Agency Resources Employed
FY 2008 FY 2009 FY 2010Actual Enacted Requested
General Funds 738.9 778.6 799.7Other State Funds 0.0 0.0 0.0
Federal Funds 0.0 0.0 0.0Total 738.9 778.6 799.7
Actual Estimated RequestedHeadcount (FTE) 5.0 5.0 5.0
Appropriations ($ thousands)Fund Category
11 - 25
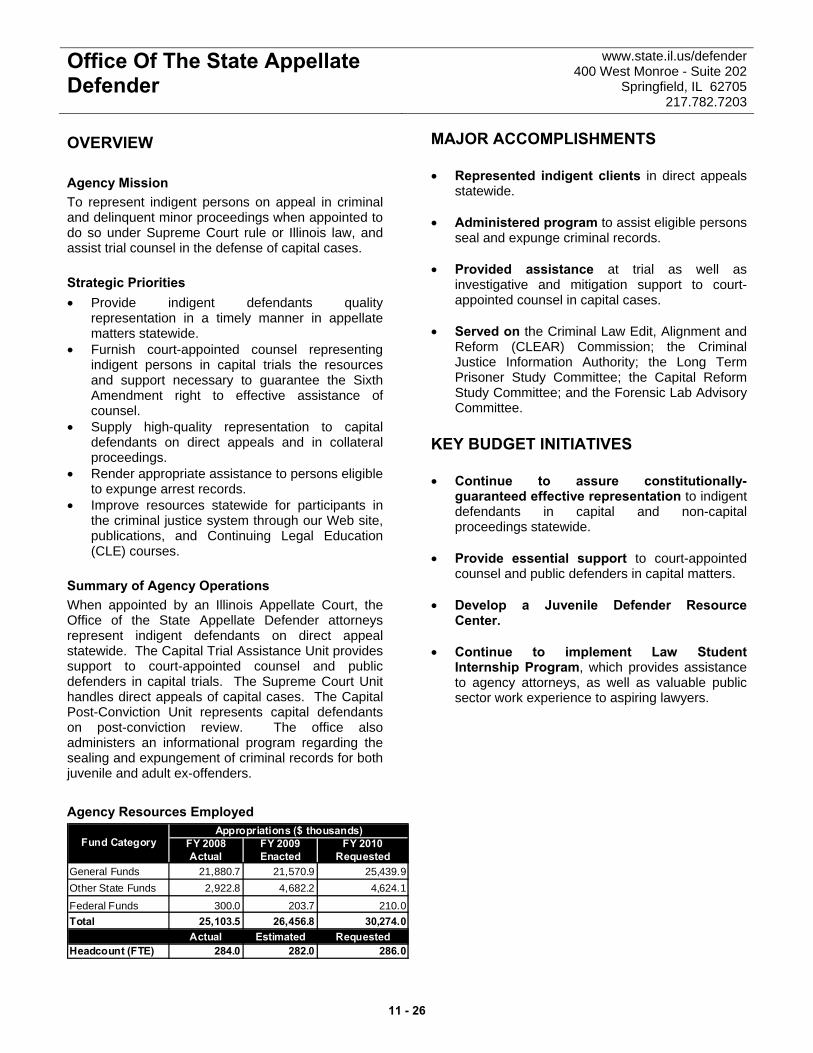
Office Of The State Appellate Defender
www.state.il.us/defender 400 West Monroe - Suite 202
Springfield, IL 62705 217.782.7203
OVERVIEW Agency Mission To represent indigent persons on appeal in criminal and delinquent minor proceedings when appointed to do so under Supreme Court rule or Illinois law, and assist trial counsel in the defense of capital cases. Strategic Priorities • Provide indigent defendants quality
representation in a timely manner in appellate matters statewide.
• Furnish court-appointed counsel representing indigent persons in capital trials the resources and support necessary to guarantee the Sixth Amendment right to effective assistance of counsel.
• Supply high-quality representation to capital defendants on direct appeals and in collateral proceedings.
• Render appropriate assistance to persons eligible to expunge arrest records.
• Improve resources statewide for participants in the criminal justice system through our Web site, publications, and Continuing Legal Education (CLE) courses.
Summary of Agency Operations When appointed by an Illinois Appellate Court, the Office of the State Appellate Defender attorneys represent indigent defendants on direct appeal statewide. The Capital Trial Assistance Unit provides support to court-appointed counsel and public defenders in capital trials. The Supreme Court Unit handles direct appeals of capital cases. The Capital Post-Conviction Unit represents capital defendants on post-conviction review. The office also administers an informational program regarding the sealing and expungement of criminal records for both juvenile and adult ex-offenders. Agency Resources Employed
FY 2008 FY 2009 FY 2010Actual Enacted Requested
General Funds 21,880.7 21,570.9 25,439.9Other State Funds 2,922.8 4,682.2 4,624.1
Federal Funds 300.0 203.7 210.0Total 25,103.5 26,456.8 30,274.0
Actual Estimated RequestedHeadcount (FTE) 284.0 282.0 286.0
Appropriations ($ thousands)Fund Category
MAJOR ACCOMPLISHMENTS • Represented indigent clients in direct appeals
statewide. • Administered program to assist eligible persons
seal and expunge criminal records. • Provided assistance at trial as well as
investigative and mitigation support to court-appointed counsel in capital cases.
• Served on the Criminal Law Edit, Alignment and
Reform (CLEAR) Commission; the Criminal Justice Information Authority; the Long Term Prisoner Study Committee; the Capital Reform Study Committee; and the Forensic Lab Advisory Committee.
KEY BUDGET INITIATIVES • Continue to assure constitutionally-
guaranteed effective representation to indigent defendants in capital and non-capital proceedings statewide.
• Provide essential support to court-appointed
counsel and public defenders in capital matters. • Develop a Juvenile Defender Resource
Center. • Continue to implement Law Student
Internship Program, which provides assistance to agency attorneys, as well as valuable public sector work experience to aspiring lawyers.
11 - 26
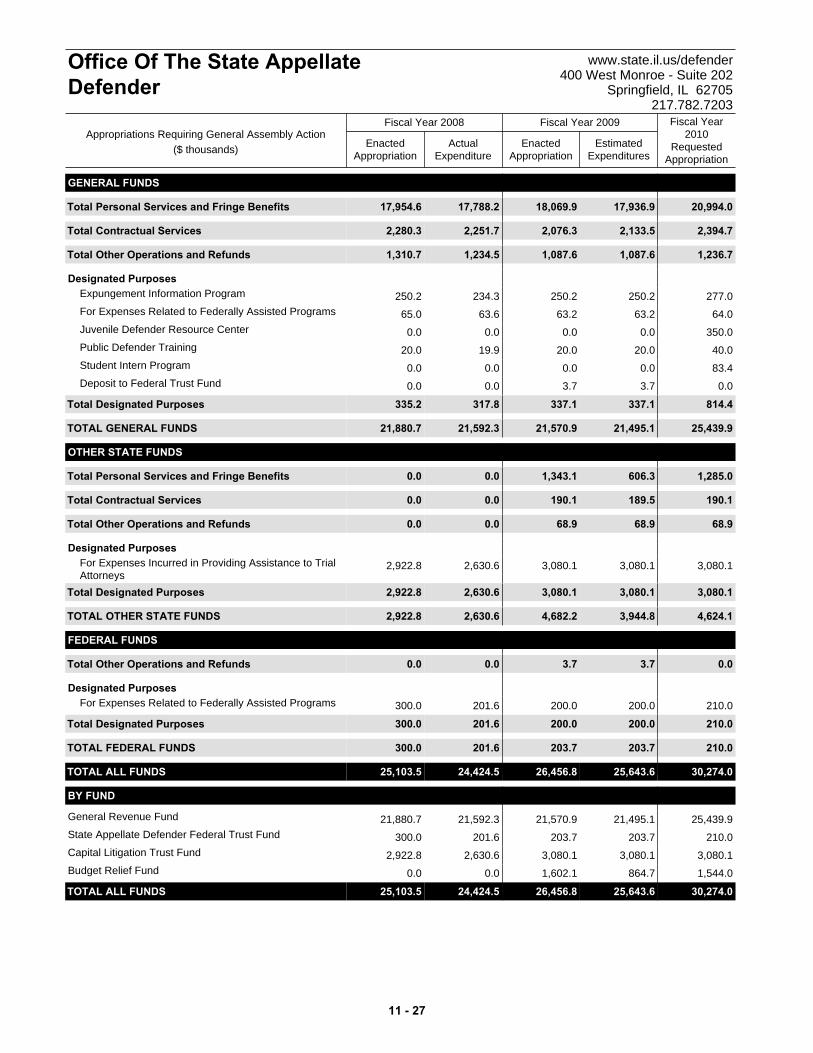
ActualExpenditure
EnactedAppropriation
EstimatedExpenditures
EnactedAppropriation
Fiscal Year2010
RequestedAppropriation
Fiscal Year 2008 Fiscal Year 2009
Office Of The State AppellateDefender
www.state.il.us/defender400 West Monroe - Suite 202
Springfield, IL 62705217.782.7203
Appropriations Requiring General Assembly Action($ thousands)
GENERAL FUNDS
Total 17,954.6 20,994.017,936.918,069.917,788.2Personal Services and Fringe Benefits
Total 2,280.3 2,394.72,133.52,076.32,251.7Contractual Services
Total 1,310.7 1,236.71,087.61,087.61,234.5Other Operations and Refunds
Designated Purposes250.2 277.0250.2250.2234.3Expungement Information Program
65.0 64.063.263.263.6For Expenses Related to Federally Assisted Programs
0.0 350.00.00.00.0Juvenile Defender Resource Center
20.0 40.020.020.019.9Public Defender Training
0.0 83.40.00.00.0Student Intern Program
0.0 0.03.73.70.0Deposit to Federal Trust Fund
Total 335.2 814.4337.1337.1317.8Designated Purposes
TOTAL GENERAL FUNDS 21,880.7 25,439.921,495.121,570.921,592.3
OTHER STATE FUNDS
Total 0.0 1,285.0606.31,343.10.0Personal Services and Fringe Benefits
Total 0.0 190.1189.5190.10.0Contractual Services
Total 0.0 68.968.968.90.0Other Operations and Refunds
Designated Purposes2,922.8 3,080.13,080.13,080.12,630.6For Expenses Incurred in Providing Assistance to Trial
AttorneysTotal 2,922.8 3,080.13,080.13,080.12,630.6Designated Purposes
TOTAL OTHER STATE FUNDS 2,922.8 4,624.13,944.84,682.22,630.6
FEDERAL FUNDS
Total 0.0 0.03.73.70.0Other Operations and Refunds
Designated Purposes300.0 210.0200.0200.0201.6For Expenses Related to Federally Assisted Programs
Total 300.0 210.0200.0200.0201.6Designated Purposes
TOTAL FEDERAL FUNDS 300.0 210.0203.7203.7201.6
TOTAL ALL FUNDS 25,103.5 30,274.025,643.626,456.824,424.5
BY FUND
21,880.7 25,439.921,495.121,570.921,592.3General Revenue Fund
300.0 210.0203.7203.7201.6State Appellate Defender Federal Trust Fund
2,922.8 3,080.13,080.13,080.12,630.6Capital Litigation Trust Fund
0.0 1,544.0864.71,602.10.0Budget Relief Fund
TOTAL ALL FUNDS 25,103.5 30,274.025,643.626,456.824,424.5
11 - 27

ActualExpenditure
EnactedAppropriation
EstimatedExpenditures
EnactedAppropriation
Fiscal Year2010
RequestedAppropriation
Fiscal Year 2008 Fiscal Year 2009
Office Of The State AppellateDefender
www.state.il.us/defender400 West Monroe - Suite 202
Springfield, IL 62705217.782.7203
Appropriations Requiring General Assembly Action($ thousands)
BY DIVISION
23,478.8 28,570.224,137.124,874.523,003.5General Operations
1,259.8 1,429.81,235.91,311.71,155.8Post Conviction Unit
365.0 274.0270.6270.6265.2Illinois Criminal Justice Information Grants
TOTAL ALL DIVISIONS 25,103.5 30,274.025,643.626,456.824,424.5
HEADCOUNT BY DIVISION Actual Estimated Requested
266.0 269.0265.0General Operations
14.0 14.014.0Post Conviction Unit
4.0 3.03.0Illinois Criminal Justice Information Grants
TOTAL HEADCOUNT (Estimated) 284.0 286.0282.0 t
11 - 28
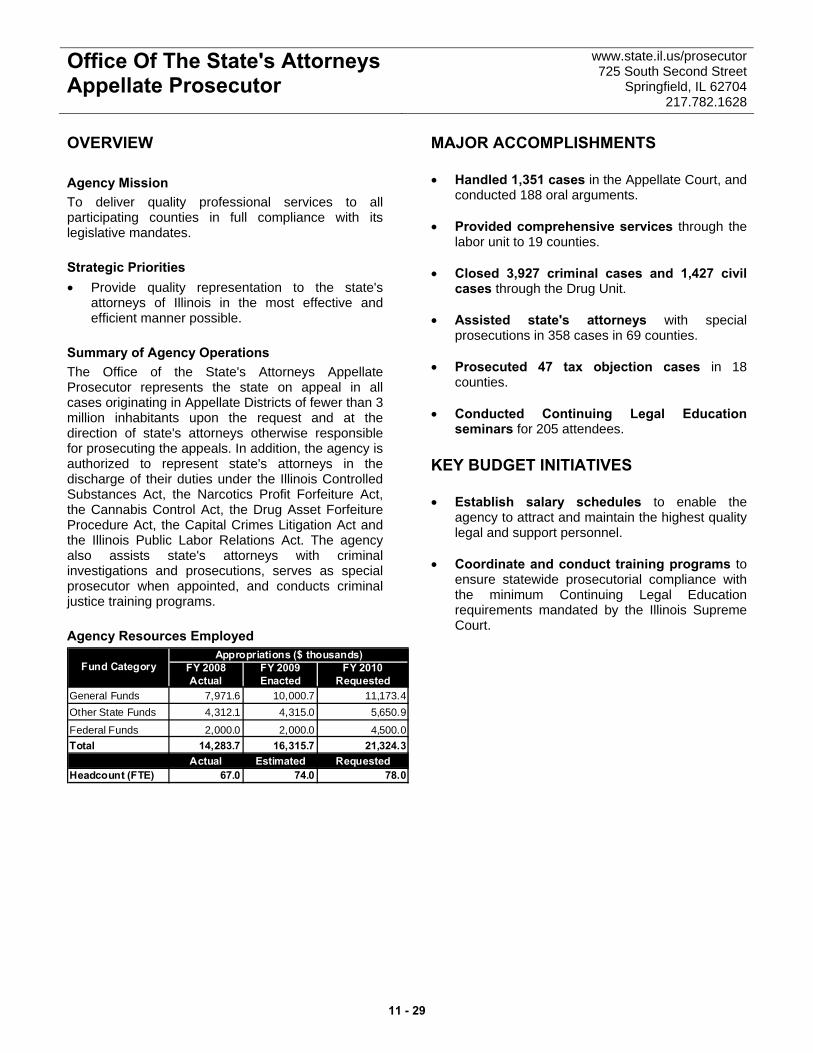
Office Of The State's Attorneys Appellate Prosecutor
www.state.il.us/prosecutor 725 South Second Street
Springfield, IL 62704 217.782.1628
OVERVIEW Agency Mission To deliver quality professional services to all participating counties in full compliance with its legislative mandates. Strategic Priorities • Provide quality representation to the state's
attorneys of Illinois in the most effective and efficient manner possible.
Summary of Agency Operations The Office of the State's Attorneys Appellate Prosecutor represents the state on appeal in all cases originating in Appellate Districts of fewer than 3 million inhabitants upon the request and at the direction of state's attorneys otherwise responsible for prosecuting the appeals. In addition, the agency is authorized to represent state's attorneys in the discharge of their duties under the Illinois Controlled Substances Act, the Narcotics Profit Forfeiture Act, the Cannabis Control Act, the Drug Asset Forfeiture Procedure Act, the Capital Crimes Litigation Act and the Illinois Public Labor Relations Act. The agency also assists state's attorneys with criminal investigations and prosecutions, serves as special prosecutor when appointed, and conducts criminal justice training programs. Agency Resources Employed
FY 2008 FY 2009 FY 2010Actual Enacted Requested
General Funds 7,971.6 10,000.7 11,173.4Other State Funds 4,312.1 4,315.0 5,650.9
Federal Funds 2,000.0 2,000.0 4,500.0Total 14,283.7 16,315.7 21,324.3
Actual Estimated RequestedHeadcount (FTE) 67.0 74.0 78.0
Appropriations ($ thousands)Fund Category
MAJOR ACCOMPLISHMENTS • Handled 1,351 cases in the Appellate Court, and
conducted 188 oral arguments. • Provided comprehensive services through the
labor unit to 19 counties. • Closed 3,927 criminal cases and 1,427 civil
cases through the Drug Unit. • Assisted state's attorneys with special
prosecutions in 358 cases in 69 counties. • Prosecuted 47 tax objection cases in 18
counties. • Conducted Continuing Legal Education
seminars for 205 attendees. KEY BUDGET INITIATIVES • Establish salary schedules to enable the
agency to attract and maintain the highest quality legal and support personnel.
• Coordinate and conduct training programs to
ensure statewide prosecutorial compliance with the minimum Continuing Legal Education requirements mandated by the Illinois Supreme Court.
11 - 29
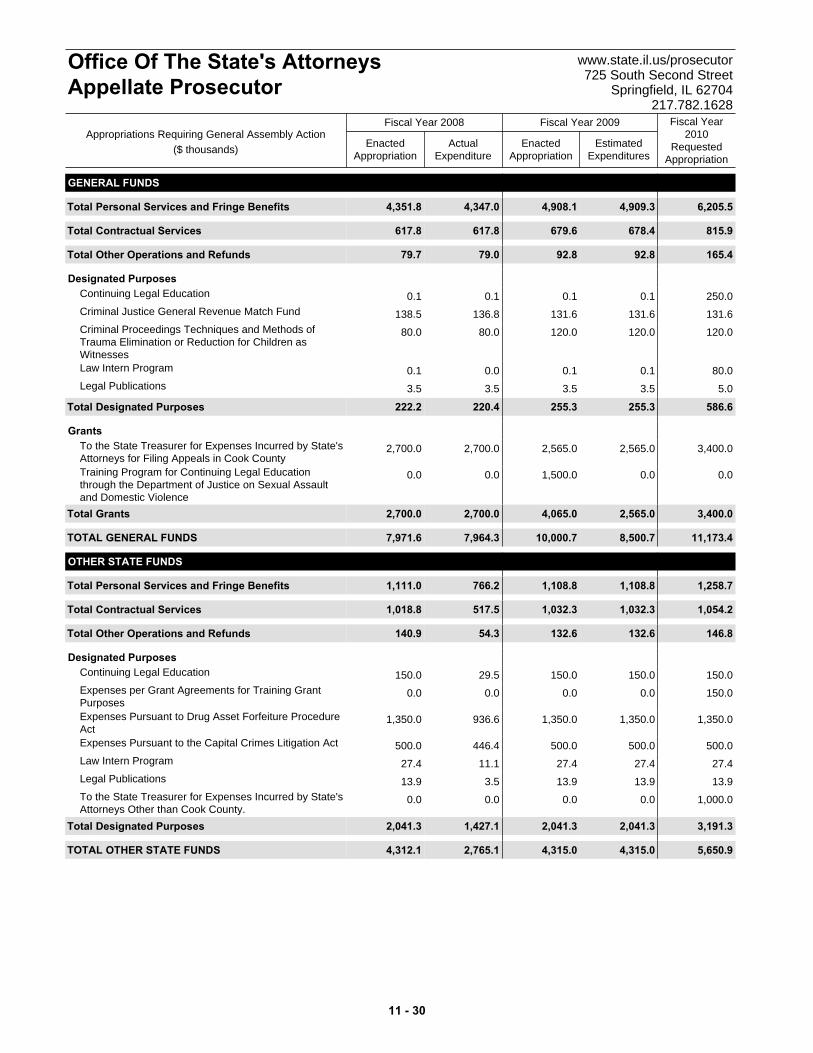
ActualExpenditure
EnactedAppropriation
EstimatedExpenditures
EnactedAppropriation
Fiscal Year2010
RequestedAppropriation
Fiscal Year 2008 Fiscal Year 2009
Office Of The State's AttorneysAppellate Prosecutor
www.state.il.us/prosecutor725 South Second Street
Springfield, IL 62704217.782.1628
Appropriations Requiring General Assembly Action($ thousands)
GENERAL FUNDS
Total 4,351.8 6,205.54,909.34,908.14,347.0Personal Services and Fringe Benefits
Total 617.8 815.9678.4679.6617.8Contractual Services
Total 79.7 165.492.892.879.0Other Operations and Refunds
Designated Purposes0.1 250.00.10.10.1Continuing Legal Education
138.5 131.6131.6131.6136.8Criminal Justice General Revenue Match Fund
80.0 120.0120.0120.080.0Criminal Proceedings Techniques and Methods ofTrauma Elimination or Reduction for Children asWitnesses
0.1 80.00.10.10.0Law Intern Program
3.5 5.03.53.53.5Legal Publications
Total 222.2 586.6255.3255.3220.4Designated Purposes
Grants2,700.0 3,400.02,565.02,565.02,700.0To the State Treasurer for Expenses Incurred by State's
Attorneys for Filing Appeals in Cook County0.0 0.00.01,500.00.0Training Program for Continuing Legal Education
through the Department of Justice on Sexual Assaultand Domestic Violence
Total 2,700.0 3,400.02,565.04,065.02,700.0Grants
TOTAL GENERAL FUNDS 7,971.6 11,173.48,500.710,000.77,964.3
OTHER STATE FUNDS
Total 1,111.0 1,258.71,108.81,108.8766.2Personal Services and Fringe Benefits
Total 1,018.8 1,054.21,032.31,032.3517.5Contractual Services
Total 140.9 146.8132.6132.654.3Other Operations and Refunds
Designated Purposes150.0 150.0150.0150.029.5Continuing Legal Education
0.0 150.00.00.00.0Expenses per Grant Agreements for Training GrantPurposes
1,350.0 1,350.01,350.01,350.0936.6Expenses Pursuant to Drug Asset Forfeiture ProcedureAct
500.0 500.0500.0500.0446.4Expenses Pursuant to the Capital Crimes Litigation Act
27.4 27.427.427.411.1Law Intern Program
13.9 13.913.913.93.5Legal Publications
0.0 1,000.00.00.00.0To the State Treasurer for Expenses Incurred by State'sAttorneys Other than Cook County.
Total 2,041.3 3,191.32,041.32,041.31,427.1Designated Purposes
TOTAL OTHER STATE FUNDS 4,312.1 5,650.94,315.04,315.02,765.1
11 - 30
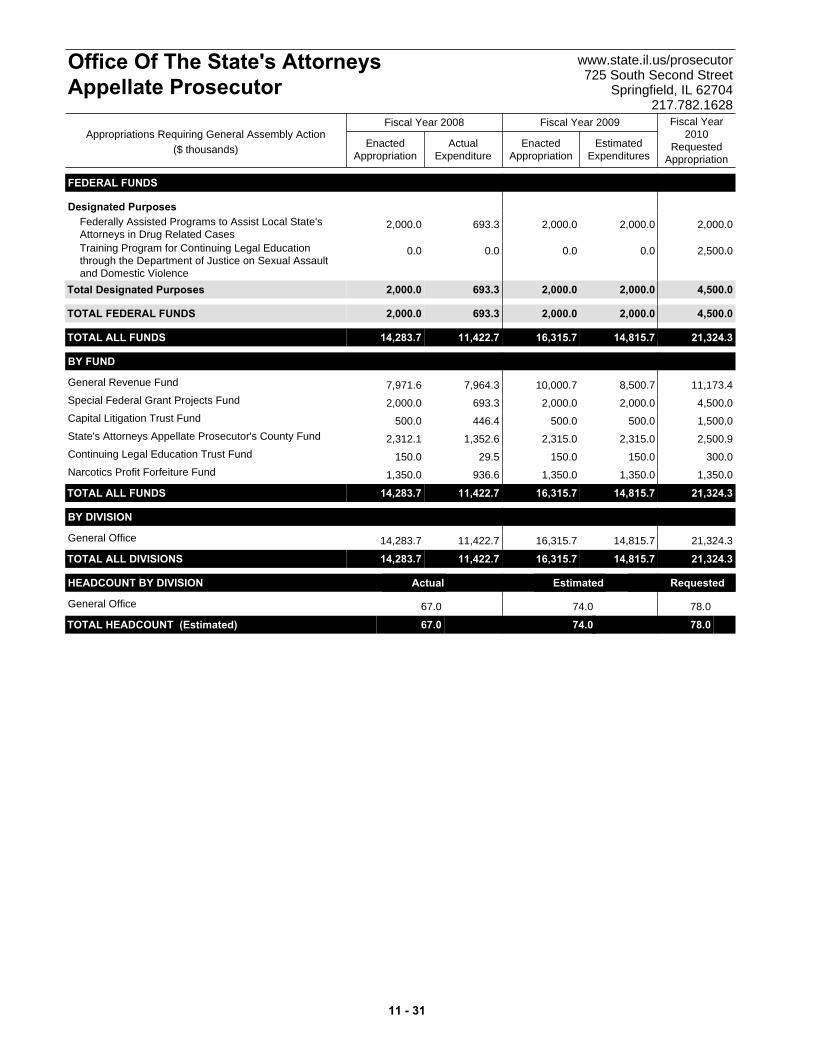
ActualExpenditure
EnactedAppropriation
EstimatedExpenditures
EnactedAppropriation
Fiscal Year2010
RequestedAppropriation
Fiscal Year 2008 Fiscal Year 2009
Office Of The State's AttorneysAppellate Prosecutor
www.state.il.us/prosecutor725 South Second Street
Springfield, IL 62704217.782.1628
Appropriations Requiring General Assembly Action($ thousands)
FEDERAL FUNDS
Designated Purposes2,000.0 2,000.02,000.02,000.0693.3Federally Assisted Programs to Assist Local State's
Attorneys in Drug Related Cases0.0 2,500.00.00.00.0Training Program for Continuing Legal Education
through the Department of Justice on Sexual Assaultand Domestic Violence
Total 2,000.0 4,500.02,000.02,000.0693.3Designated Purposes
TOTAL FEDERAL FUNDS 2,000.0 4,500.02,000.02,000.0693.3
TOTAL ALL FUNDS 14,283.7 21,324.314,815.716,315.711,422.7
BY FUND
7,971.6 11,173.48,500.710,000.77,964.3General Revenue Fund
2,000.0 4,500.02,000.02,000.0693.3Special Federal Grant Projects Fund
500.0 1,500.0500.0500.0446.4Capital Litigation Trust Fund
2,312.1 2,500.92,315.02,315.01,352.6State's Attorneys Appellate Prosecutor's County Fund
150.0 300.0150.0150.029.5Continuing Legal Education Trust Fund
1,350.0 1,350.01,350.01,350.0936.6Narcotics Profit Forfeiture Fund
TOTAL ALL FUNDS 14,283.7 21,324.314,815.716,315.711,422.7
BY DIVISION
14,283.7 21,324.314,815.716,315.711,422.7General Office
TOTAL ALL DIVISIONS 14,283.7 21,324.314,815.716,315.711,422.7
HEADCOUNT BY DIVISION Actual Estimated Requested
67.0 78.074.0General Office
TOTAL HEADCOUNT (Estimated) 67.0 78.074.0 t
11 - 31

Supreme Court www.state.il.us/court 200 E. Capitol
Springfield, IL 62701 217.782.7770
OVERVIEW Agency Mission The judicial power is vested in a Supreme Court, an Appellate Court and Circuit Courts. Summary of Agency Operations Illinois is divided into five judicial districts for the selection of Supreme and Appellate Court Judges. The First Judicial District consists of Cook County. The remainder of the state is divided by law into four judicial districts of substantially equal population, each of which is compact and composed of contiguous counties. The Supreme Court, the highest tribunal in Illinois, has general administrative and supervisory authority over all courts in the state. The Supreme Court hears appeals from the Circuit and Appellate Courts and may exercise original jurisdiction in cases relating to revenue, mandamus, prohibition and habeas corpus. The Supreme Court consists of seven judges. Three judges are selected from the First Judicial District and one from each of the other four districts. Four judges constitute a quorum and the concurrence of four is necessary for a decision. The judges select a chief justice from among themselves to serve for a term of three years. The Appellate Court hears appeals from administrative agencies and the Circuit Courts (the unified trial courts of Illinois). Illinois has five Appellate Court districts. Judges are elected for a term of 10 years. The First District meets in Chicago; the Second District meets in Elgin; the Third District meets in Ottawa; the Fourth District meets in Springfield, and the Fifth District meets in Mount Vernon.
The Circuit Court is comprised of circuit and associate judges. There are 22 judicial circuits in Illinois; each has one chief judge elected by the circuit judges. The chief judge has general administrative authority in the circuit, subject to the overall administrative authority of the Supreme Court. Circuit judges may hear any case assigned to them by the chief judge. Associate judges may not preside over felony cases unless authorized by the Supreme Court. Circuit judges are elected for six-year terms and appoint associate judges for four-year terms. As empowered by the Constitution of the State of Illinois, the Supreme Court appoints the director and staff of the Administrative Office of the Illinois Courts. This office assists the Chief Justice in his administrative responsibilities and supervisory duties over Illinois courts. The office's primary responsibilities include preparing the budget, organizing payrolls for judicial personnel and court reporters, assigning judges between circuits, collecting and publishing statistical information of case loads and case flow in the Unified Court System, and conducting in-service training for all judges. Agency Resources Employed
FY 2008 FY 2009 FY 2010Actual Enacted Requested
General Funds 282,475.8 291,343.4 316,414.4Other State Funds 15,293.6 16,138.4 15,951.5
Federal Funds 0.0 0.0 0.0Total 297,769.4 307,481.8 332,365.9
Actual Estimated RequestedHeadcount (FTE) 1,578.0 1,578.0 1,578.0
Appropriations ($ thousands)Fund Category
11 - 32
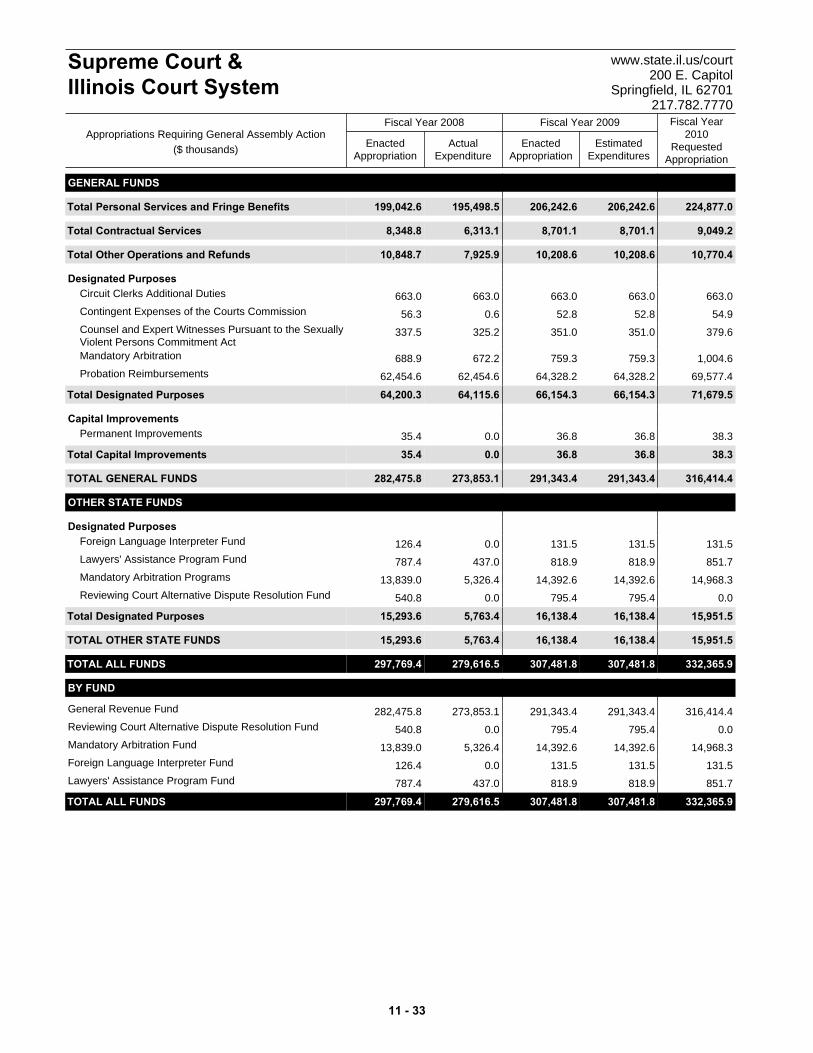
ActualExpenditure
EnactedAppropriation
EstimatedExpenditures
EnactedAppropriation
Fiscal Year2010
RequestedAppropriation
Fiscal Year 2008 Fiscal Year 2009
Supreme Court & Illinois Court System
www.state.il.us/court200 E. Capitol
Springfield, IL 62701217.782.7770
Appropriations Requiring General Assembly Action($ thousands)
GENERAL FUNDS
Total 199,042.6 224,877.0206,242.6206,242.6195,498.5Personal Services and Fringe Benefits
Total 8,348.8 9,049.28,701.18,701.16,313.1Contractual Services
Total 10,848.7 10,770.410,208.610,208.67,925.9Other Operations and Refunds
Designated Purposes663.0 663.0663.0663.0663.0Circuit Clerks Additional Duties
56.3 54.952.852.80.6Contingent Expenses of the Courts Commission
337.5 379.6351.0351.0325.2Counsel and Expert Witnesses Pursuant to the SexuallyViolent Persons Commitment Act
688.9 1,004.6759.3759.3672.2Mandatory Arbitration
62,454.6 69,577.464,328.264,328.262,454.6Probation Reimbursements
Total 64,200.3 71,679.566,154.366,154.364,115.6Designated Purposes
Capital Improvements35.4 38.336.836.80.0Permanent Improvements
Total 35.4 38.336.836.80.0Capital Improvements
TOTAL GENERAL FUNDS 282,475.8 316,414.4291,343.4291,343.4273,853.1
OTHER STATE FUNDS
Designated Purposes126.4 131.5131.5131.50.0Foreign Language Interpreter Fund
787.4 851.7818.9818.9437.0Lawyers' Assistance Program Fund
13,839.0 14,968.314,392.614,392.65,326.4Mandatory Arbitration Programs
540.8 0.0795.4795.40.0Reviewing Court Alternative Dispute Resolution Fund
Total 15,293.6 15,951.516,138.416,138.45,763.4Designated Purposes
TOTAL OTHER STATE FUNDS 15,293.6 15,951.516,138.416,138.45,763.4
TOTAL ALL FUNDS 297,769.4 332,365.9307,481.8307,481.8279,616.5
BY FUND
282,475.8 316,414.4291,343.4291,343.4273,853.1General Revenue Fund
540.8 0.0795.4795.40.0Reviewing Court Alternative Dispute Resolution Fund
13,839.0 14,968.314,392.614,392.65,326.4Mandatory Arbitration Fund
126.4 131.5131.5131.50.0Foreign Language Interpreter Fund
787.4 851.7818.9818.9437.0Lawyers' Assistance Program Fund
TOTAL ALL FUNDS 297,769.4 332,365.9307,481.8307,481.8279,616.5
11 - 33
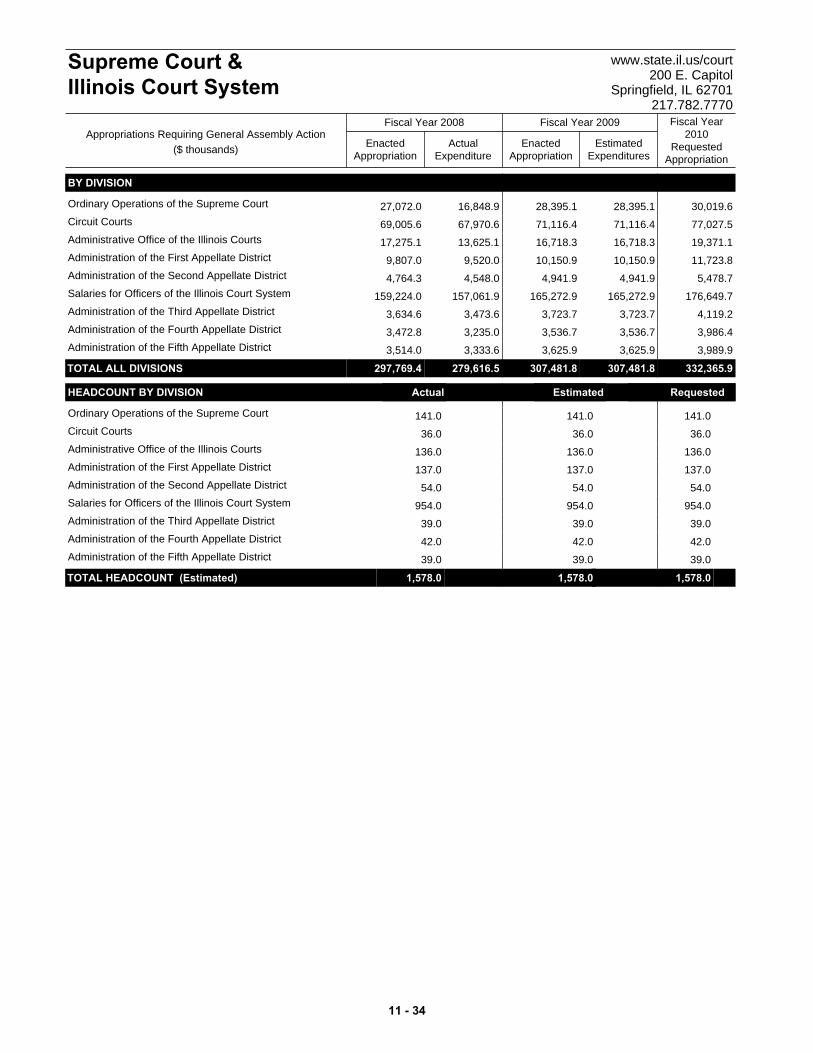
ActualExpenditure
EnactedAppropriation
EstimatedExpenditures
EnactedAppropriation
Fiscal Year2010
RequestedAppropriation
Fiscal Year 2008 Fiscal Year 2009
Supreme Court & Illinois Court System
www.state.il.us/court200 E. Capitol
Springfield, IL 62701217.782.7770
Appropriations Requiring General Assembly Action($ thousands)
BY DIVISION
27,072.0 30,019.628,395.128,395.116,848.9Ordinary Operations of the Supreme Court
69,005.6 77,027.571,116.471,116.467,970.6Circuit Courts
17,275.1 19,371.116,718.316,718.313,625.1Administrative Office of the Illinois Courts
9,807.0 11,723.810,150.910,150.99,520.0Administration of the First Appellate District
4,764.3 5,478.74,941.94,941.94,548.0Administration of the Second Appellate District
159,224.0 176,649.7165,272.9165,272.9157,061.9Salaries for Officers of the Illinois Court System
3,634.6 4,119.23,723.73,723.73,473.6Administration of the Third Appellate District
3,472.8 3,986.43,536.73,536.73,235.0Administration of the Fourth Appellate District
3,514.0 3,989.93,625.93,625.93,333.6Administration of the Fifth Appellate District
TOTAL ALL DIVISIONS 297,769.4 332,365.9307,481.8307,481.8279,616.5
HEADCOUNT BY DIVISION Actual Estimated Requested
141.0 141.0141.0Ordinary Operations of the Supreme Court
36.0 36.036.0Circuit Courts
136.0 136.0136.0Administrative Office of the Illinois Courts
137.0 137.0137.0Administration of the First Appellate District
54.0 54.054.0Administration of the Second Appellate District
954.0 954.0954.0Salaries for Officers of the Illinois Court System
39.0 39.039.0Administration of the Third Appellate District
42.0 42.042.0Administration of the Fourth Appellate District
39.0 39.039.0Administration of the Fifth Appellate District
TOTAL HEADCOUNT (Estimated) 1,578.0 1,578.01,578.0 t
11 - 34

OTHER STATE FUNDS
Designated Purposes0.0 10,000.01,000.010,000.00.0Supreme Court Historic Preservation Commission
Total 0.0 10,000.01,000.010,000.00.0Designated Purposes
TOTAL OTHER STATE FUNDS 0.0 10,000.01,000.010,000.00.0
TOTAL ALL FUNDS 0.0 10,000.01,000.010,000.00.0
BY FUND
0.0 10,000.01,000.010,000.00.0Supreme Court Historic Preservation Fund
TOTAL ALL FUNDS 0.0 10,000.01,000.010,000.00.0
BY DIVISION
0.0 10,000.01,000.010,000.00.0General Operations
TOTAL ALL DIVISIONS 0.0 10,000.01,000.010,000.00.0
ActualExpenditure
EnactedAppropriation
EstimatedExpenditures
EnactedAppropriation
Fiscal Year2010
RequestedAppropriation
Fiscal Year 2008 Fiscal Year 2009
Supreme Court HistoricPreservation Commission
Appropriations Requiring General Assembly Action($ thousands)
11 - 35

Office Of The Auditor General www.auditor.illinois.gov Iles Park Plaza, 740 East Ash
Springfield, IL 62703 217.782.6046
OVERVIEW Agency Mission To conduct audits of public funds of the state, undertake additional investigations and create supplemental reports as directed by the General Assembly. The Office of the Auditor General (OAG) reports findings and recommendations to the General Assembly and the governor. Summary of Agency Operations The Illinois Constitution and State Auditing Act charge the auditor general with the responsibility of auditing and reviewing the receipt, obligation and use of public funds. As a principal agent of legislative oversight and public disclosure, the auditor general conducts the Illinois Post Audit Program to strengthen control over government activity by providing accountability to the people and their elected representatives. The Illinois Constitution, the State Auditing Act and the Post Audit Program provide a system to help ensure the means to review expenditures and results, while allowing the OAG to conduct comprehensive audits and evaluations of state agency operations. The OAG performs several types of audits to review state agencies. • Financial Audits and Compliance Attestation
Examinations are mandated by law. These audits examine and report upon the obligation, expenditure, receipt and use of public funds. Compliance examinations test and evaluate agency compliance with state statutes, rules and regulations. The OAG also issues an opinion on the state's basic financial statements, issues a report on the state’s internal control over financial reporting and tests its compliance with certain provisions of laws, regulations, contracts and
grants. Further, the OAG performs the audit of the state's participation in federal grant programs as provided by the federal Single Audit Act Amendments of 1996 and U.S. Office of Management and Budget Circular A-133.
• Performance Audits are conducted at the request
of legislators to assist them in governmental oversight. State programs, functions and activities are reviewed according to the direction of the audit resolution or law directing the audit. The General Assembly uses the audit recommendations to develop legislation for the improvement of government.
• Information Systems Audits are performed on the
state's computer networks. These audits determine whether appropriate controls and recovery procedures exist to manage and protect the state's financial and confidential information.
Copies of all audits are made available to members of the General Assembly, the governor, agency management, media and the public and are available on the auditor general's Web site. Findings are issued in areas such as accounts receivable, contracts, expenditure control, leases, misappropriation of funds, personnel and payroll, property control, purchasing, reimbursements, computer security, telecommunications and travel. Agency Resources Employed
FY 2008 FY 2009 FY 2010Actual Enacted Requested
General Funds 7,704.7 7,636.3 8,225.7Other State Funds 17,513.9 19,563.3 22,339.1
Federal Funds 0.0 0.0 0.0Total 25,218.6 27,199.6 30,564.8
Actual Estimated RequestedHeadcount (FTE) 98.0 100.0 100.0
Appropriations ($ thousands)Fund Category
11 - 36
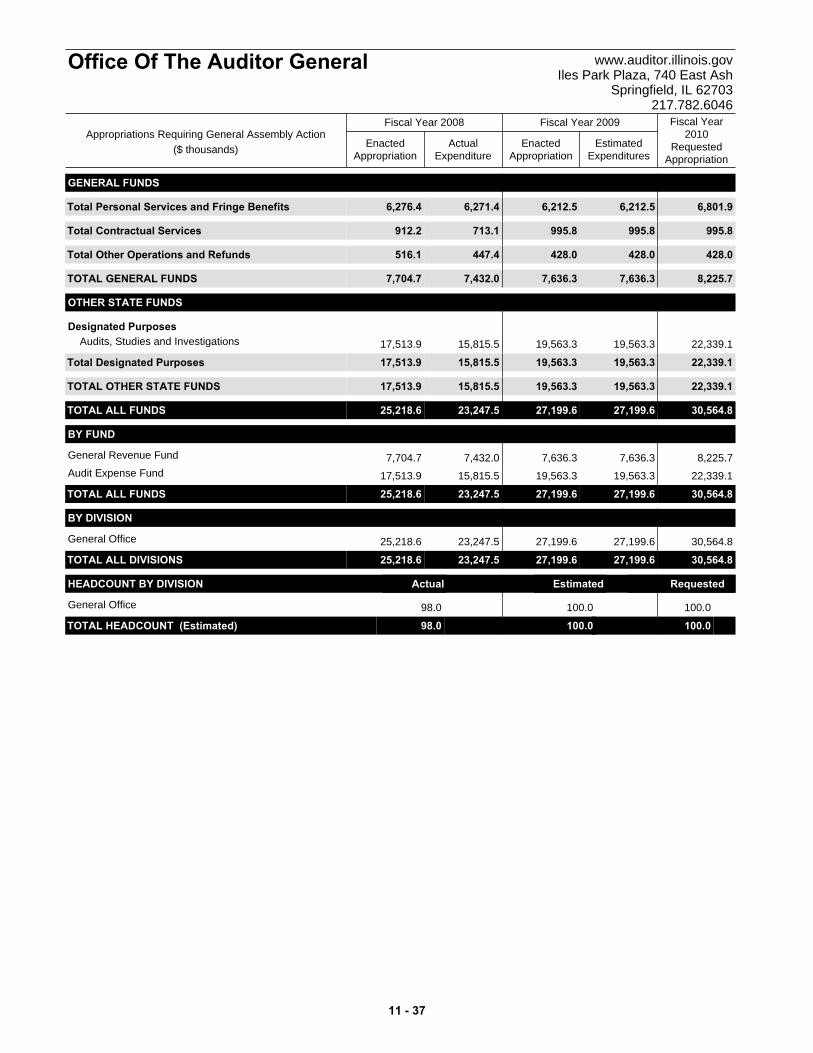
GENERAL FUNDS
Total 6,276.4 6,801.96,212.56,212.56,271.4Personal Services and Fringe Benefits
Total 912.2 995.8995.8995.8713.1Contractual Services
Total 516.1 428.0428.0428.0447.4Other Operations and Refunds
TOTAL GENERAL FUNDS 7,704.7 8,225.77,636.37,636.37,432.0
OTHER STATE FUNDS
Designated Purposes17,513.9 22,339.119,563.319,563.315,815.5Audits, Studies and Investigations
Total 17,513.9 22,339.119,563.319,563.315,815.5Designated Purposes
TOTAL OTHER STATE FUNDS 17,513.9 22,339.119,563.319,563.315,815.5
TOTAL ALL FUNDS 25,218.6 30,564.827,199.627,199.623,247.5
BY FUND
7,704.7 8,225.77,636.37,636.37,432.0General Revenue Fund
17,513.9 22,339.119,563.319,563.315,815.5Audit Expense Fund
TOTAL ALL FUNDS 25,218.6 30,564.827,199.627,199.623,247.5
BY DIVISION
25,218.6 30,564.827,199.627,199.623,247.5General Office
TOTAL ALL DIVISIONS 25,218.6 30,564.827,199.627,199.623,247.5
HEADCOUNT BY DIVISION Actual Estimated Requested
98.0 100.0100.0General Office
TOTAL HEADCOUNT (Estimated) 98.0 100.0100.0 t
ActualExpenditure
EnactedAppropriation
EstimatedExpenditures
EnactedAppropriation
Fiscal Year2010
RequestedAppropriation
Fiscal Year 2008 Fiscal Year 2009
Office Of The Auditor General www.auditor.illinois.govIles Park Plaza, 740 East Ash
Springfield, IL 62703217.782.6046
Appropriations Requiring General Assembly Action($ thousands)
11 - 37
General Assembly www.ilga.gov State House
Springfield, IL 62706 217.782.2099
OVERVIEW Agency Mission The legislative power is vested in a General Assembly consisting of a Senate and a House of Representatives elected by the electors from 59 Legislative Districts and 118 Representative Districts. Summary of Agency Operations The General Assembly enacts, amends, and/or repeals laws, passes resolutions, adopts appropriation bills, and conducts inquiries on proposed legislation. It also acts on amendments to the United States Constitution and proposes and submits amendments to the Illinois Constitution for consideration by voters. In addition to legislative responsibilities, the Senate is constitutionally delegated the responsibility of advising and consenting to most gubernatorial appointments to state offices, boards, and commissions. The General Assembly may also impeach and convict executive and judicial officeholders in the State of Illinois. The House of Representatives has the sole power of impeachment, while the Senate serves as adjudicator. Summary of Operations of the Legislative Agencies The General Assembly is empowered to create agencies, which support its legislative functions. The General Assembly Retirement System provides retirement annuities, survivors' annuities, and other benefits for members of the General Assembly, certain elected state officials and their beneficiaries. The Commission on Government Forecasting and Accountability, a bipartisan, joint legislative commission, provides the Illinois General Assembly with information relevant to the Illinois economy, taxes, and other sources of revenue and debt obligations of the state. The Joint Committee on Administrative Rules, a bipartisan legislative oversight committee, is authorized to conduct systematic reviews of administrative rules promulgated by state agencies. The committee conducts several integrated review programs, including a review program for proposed
emergency and peremptory rulemaking, a review of new public acts and a complaint review program. The Legislative Audit Commission is responsible for the oversight of the State Audit Program, review of the stewardship of public funds, and the monitoring action to correct weaknesses disclosed by the audits of state agencies. The Legislative Information System is the legislative support service agency responsible for providing the computer services and technical guidance required by the General Assembly and its committees, commissions and agencies. The Legislative Printing Unit provides printing services to members of the General Assembly, legislative committees and commissions, and other legislative agencies in accordance with the policies established by the Joint Committee on Legislative Support Services, and with reasonable rules promulgated by the Legislative Printing Unit. Created in 1913 as the first of the modern legislative service agencies in Illinois, the Legislative Reference Bureau carries out a wide range of functions relating to the legal and technical operation of the General Assembly. The bureau drafts and prepares legislation, which includes bills, amendments, resolutions and conference committee reports. Established in 1937, the Legislative Research Unit is the chief general research agency for the Illinois General Assembly. The unit's statutory duty is to collect information concerning the government and general welfare of the state, examine the effects of constitutional provisions and previously enacted statutes, consider important issues of public policy and questions of state wide interest, and perform research and provide information as may be requested by members of the General Assembly. The Office of the Architect of the Capitol provides facilities and meets space needs for the Illinois General Assembly and its supporting commissions and bureaus. The office's goal is to provide a more functional facility, with flexible and efficient space utilization, resulting in effective processes and procedures. The Office of the Architect of the Capitol has capital expenditures that will be included in the capital budget.
11 - 38

ActualExpenditure
EnactedAppropriation
EstimatedExpenditures
EnactedAppropriation
Fiscal Year2010
RecommendedAppropriation
Fiscal Year 2008 Fiscal Year 2009
General Assembly www.ilga.govState House
Springfield, IL 62706217.782.2099
Appropriations Requiring General Assembly Action($ thousands)
GENERAL FUNDS
Designated Purposes341.6 341.6341.6341.630.9All Costs Associated with the National Conference of
State Legislatures 83.5 83.583.583.560.0Allowances for Services of Officers of Senate: Minority
Leader 83.5 83.583.583.50.0Allowances for Services of Officers of Senate: President
113.7 113.7113.7113.747.9Construct/Reconstruct Senate Offices (to SenateOperations Commission)
148.1 148.1148.1148.162.5Expenses in Connection with Redistricting as Requiredby the Illinois Constitution for the Speaker --Reappropriation
2,382.2 2,382.22,382.22,382.22,358.6For House Standing Committees
2,100.9 2,100.82,100.82,100.8378.1For Standing Committees for Expert Witnesses,Technical Service and Other Research Assistance
162.2 0.00.00.0161.4Ordinary and Contingent Expenses of General Staff andOperations for the Minority Leader
5,290.2 5,295.15,295.15,295.14,989.9Ordinary and Contingent Expenses of LegislativeLeadership and Legislative Staff Assistants: MinorityLeader
5,290.2 5,295.15,295.15,295.14,037.0Ordinary and Contingent Expenses of LegislativeLeadership and Legislative Staff Assistants: President
4,751.6 4,903.64,903.64,903.64,715.7Ordinary and Contingent Expenses of LegislativeLeadership and Staff Assistants: Minority Leader
4,751.6 5,109.65,109.65,109.64,262.6Ordinary and Contingent Expenses of LegislativeLeadership and Staff Assistants: Speaker
452.7 95.095.095.0314.2Ordinary and Contingent Expenses, Including Purchaseon Contract Printing, Binding, Paper, and OfficeSupplies
4,036.0 4,036.04,036.04,036.02,708.9Ordinary and Incidental Expenses of Committees,General Staff and Operations, Transcribing and Printingof Senate Debates
5,346.1 5,346.15,346.15,346.14,664.0Ordinary and Incidental Expenses of General Staff,Operations and Standing Committees
214.2 214.2214.2214.2128.4Ordinary and Incidental Expenses of Senate, IncludingPurchase on Contract Printing, Binding, and OfficeSupplies
4,900.8 4,900.84,900.84,900.84,703.1President of the Senate
8,190.3 8,190.38,190.38,190.38,034.3Speaker of the House of Representatives
57.7 57.757.757.76.0Travel, Including Expenses to Springfield For OfficialBusiness When General Assembly is Not in Session
30.4 30.430.430.46.9Travel, Including Expenses to Springfield On OfficialBusiness When General Assembly is Not in Session
Total 48,727.3 48,727.348,727.348,727.341,670.3Designated Purposes
TOTAL GENERAL FUNDS 48,727.3 48,727.348,727.348,727.341,670.3
OTHER STATE FUNDS
Designated Purposes250.0 250.0250.0250.011.1Ordinary and Contingent Expenses of the House
250.0 250.0250.0250.052.6Ordinary and Contingent Expenses of the Senate
Total 500.0 500.0500.0500.063.7Designated Purposes
TOTAL OTHER STATE FUNDS 500.0 500.0500.0500.063.7
TOTAL ALL FUNDS 49,227.3 49,227.349,227.349,227.341,734.0
11 - 39
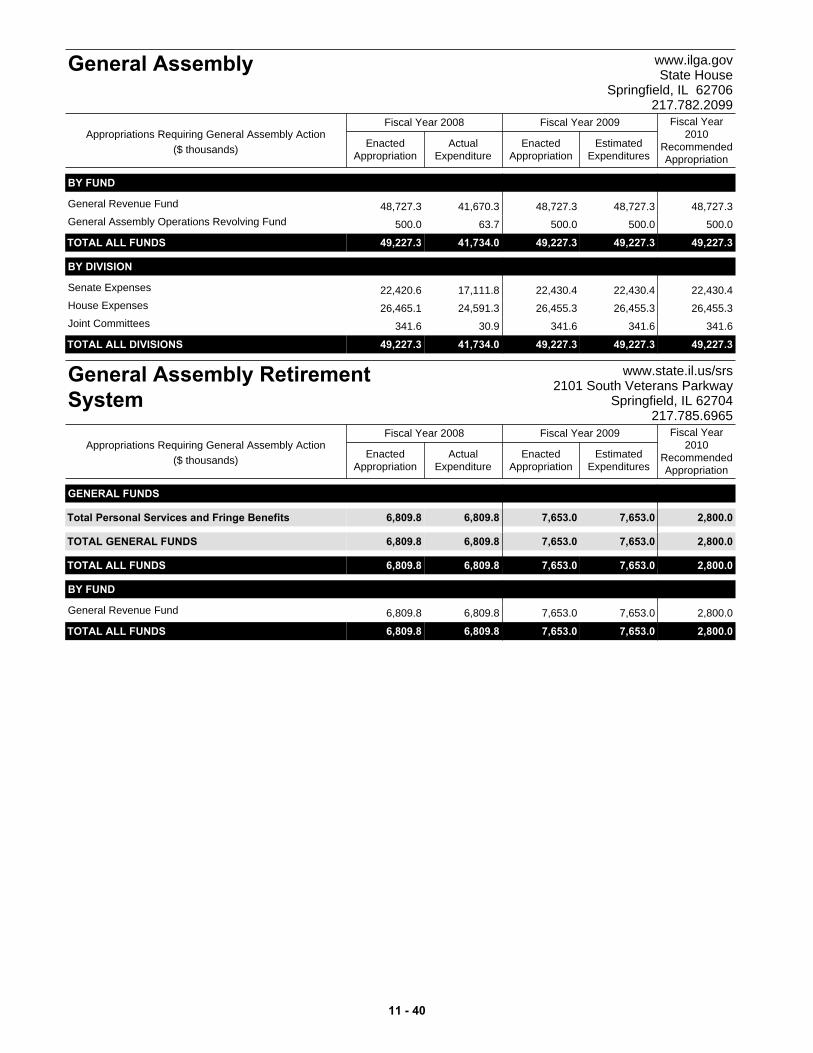
ActualExpenditure
EnactedAppropriation
EstimatedExpenditures
EnactedAppropriation
Fiscal Year2010
RecommendedAppropriation
Fiscal Year 2008 Fiscal Year 2009
General Assembly www.ilga.govState House
Springfield, IL 62706217.782.2099
Appropriations Requiring General Assembly Action($ thousands)
BY FUND
48,727.3 48,727.348,727.348,727.341,670.3General Revenue Fund
500.0 500.0500.0500.063.7General Assembly Operations Revolving Fund
TOTAL ALL FUNDS 49,227.3 49,227.349,227.349,227.341,734.0
BY DIVISION
22,420.6 22,430.422,430.422,430.417,111.8Senate Expenses
26,465.1 26,455.326,455.326,455.324,591.3House Expenses
341.6 341.6341.6341.630.9Joint Committees
TOTAL ALL DIVISIONS 49,227.3 49,227.349,227.349,227.341,734.0
ActualExpenditure
EnactedAppropriation
EstimatedExpenditures
EnactedAppropriation
Fiscal Year2010
RecommendedAppropriation
Fiscal Year 2008 Fiscal Year 2009
General Assembly RetirementSystem
www.state.il.us/srs2101 South Veterans Parkway
Springfield, IL 62704217.785.6965
Appropriations Requiring General Assembly Action($ thousands)
GENERAL FUNDS
Total 6,809.8 2,800.07,653.07,653.06,809.8Personal Services and Fringe Benefits
TOTAL GENERAL FUNDS 6,809.8 2,800.07,653.07,653.06,809.8
TOTAL ALL FUNDS 6,809.8 2,800.07,653.07,653.06,809.8
BY FUND
6,809.8 2,800.07,653.07,653.06,809.8General Revenue Fund
TOTAL ALL FUNDS 6,809.8 2,800.07,653.07,653.06,809.8
11 - 40

ActualExpenditure
EnactedAppropriation
EstimatedExpenditures
EnactedAppropriation
Fiscal Year2010
RecommendedAppropriation
Fiscal Year 2008 Fiscal Year 2009
Commission on GovernmentForecasting and Accountability
www.ilga.gov703 Stratton Office Building
Springfield, IL 62706217.782.5320
Appropriations Requiring General Assembly Action($ thousands)
GENERAL FUNDS
Total 7,075.4 6,721.76,721.76,721.75,077.5Personal Services and Fringe Benefits
Total 123.7 117.6117.6117.663.5Contractual Services
Total 27.7 26.326.326.324.8Other Operations and Refunds
Designated Purposes205.0 194.8194.8194.871.7Assumption of Duties from the Pension Law
Commission5.0 4.84.84.85.0Compensation Review Board Expenses
Total 210.0 199.5199.5199.576.7Designated Purposes
TOTAL GENERAL FUNDS 7,436.9 7,065.17,065.17,065.15,242.4
TOTAL ALL FUNDS 7,436.9 7,065.17,065.17,065.15,242.4
ActualExpenditure
EnactedAppropriation
EstimatedExpenditures
EnactedAppropriation
Fiscal Year2010
RecommendedAppropriation
Fiscal Year 2008 Fiscal Year 2009
Joint Committee On AdministrativeRules
www.ilga.gov700 Stratton BuildingSpringfield, IL 62706
217.785.2254
Appropriations Requiring General Assembly Action($ thousands)
GENERAL FUNDS
Total 1,096.4 1,041.61,041.61,041.61,047.5Personal Services and Fringe Benefits
Total 64.0 60.860.860.857.7Contractual Services
Total 76.8 73.073.073.045.9Other Operations and Refunds
TOTAL GENERAL FUNDS 1,237.2 1,175.31,175.31,175.31,151.2
TOTAL ALL FUNDS 1,237.2 1,175.31,175.31,175.31,151.2
ActualExpenditure
EnactedAppropriation
EstimatedExpenditures
EnactedAppropriation
Fiscal Year2010
RecommendedAppropriation
Fiscal Year 2008 Fiscal Year 2009
Legislative Audit Commission www.ilga.gov622 Stratton BuildingSpringfield, IL 62706
217.782.7097
Appropriations Requiring General Assembly Action($ thousands)
GENERAL FUNDS
Total 243.1 231.0231.0231.0242.6Personal Services and Fringe Benefits
Total 19.9 18.918.918.915.6Contractual Services
Total 14.1 13.413.413.44.0Other Operations and Refunds
TOTAL GENERAL FUNDS 277.1 263.3263.3263.3262.2
TOTAL ALL FUNDS 277.1 263.3263.3263.3262.2
11 - 41

ActualExpenditure
EnactedAppropriation
EstimatedExpenditures
EnactedAppropriation
Fiscal Year2010
RecommendedAppropriation
Fiscal Year 2008 Fiscal Year 2009
Legislative Ethics Commission www.ilga.govState House
Springfield, IL 62706217.558.1561
Appropriations Requiring General Assembly Action($ thousands)
GENERAL FUNDS
Designated Purposes328.9 312.5312.5312.583.2Ordinary and Contingent Expenses of the General
Assembly's Office of the Inspector General Total 328.9 312.5312.5312.583.2Designated Purposes
TOTAL GENERAL FUNDS 328.9 312.5312.5312.583.2
TOTAL ALL FUNDS 328.9 312.5312.5312.583.2
ActualExpenditure
EnactedAppropriation
EstimatedExpenditures
EnactedAppropriation
Fiscal Year2010
RecommendedAppropriation
Fiscal Year 2008 Fiscal Year 2009
Legislative Information System www.ilga.gov705 Stratton Office Building
Springfield, IL 62706217.782.3944
Appropriations Requiring General Assembly Action($ thousands)
GENERAL FUNDS
Total 3,212.4 3,051.43,051.43,051.43,050.6Personal Services and Fringe Benefits
Total 502.3 456.3456.3456.3501.8Contractual Services
Total 1,359.0 1,312.01,312.01,312.01,328.5Other Operations and Refunds
Designated Purposes782.0 742.0742.0742.0669.2General Assembly Electronic Data Processing
Equipment, and Any Other Operational Purposes of theGeneral Assembly
Total 782.0 742.0742.0742.0669.2Designated Purposes
TOTAL GENERAL FUNDS 5,855.7 5,561.75,561.75,561.75,550.1
OTHER STATE FUNDS
Designated Purposes1,600.0 1,600.01,600.01,600.024.5For Purchase, Maintenance, and Rental of General
Assembly Electronic Data Processing Equipment andfor Other Operational Purposes of the GeneralAssembly
Total 1,600.0 1,600.01,600.01,600.024.5Designated Purposes
TOTAL OTHER STATE FUNDS 1,600.0 1,600.01,600.01,600.024.5
TOTAL ALL FUNDS 7,455.7 7,161.77,161.77,161.75,574.6
11 - 42
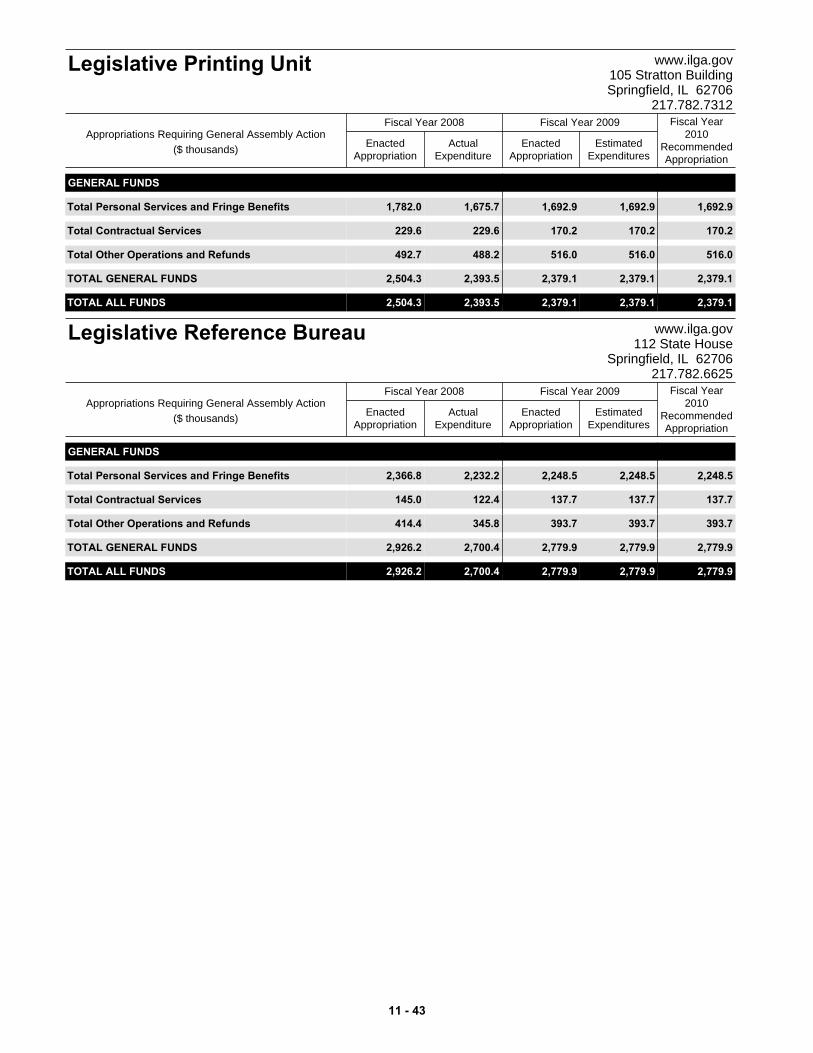
ActualExpenditure
EnactedAppropriation
EstimatedExpenditures
EnactedAppropriation
Fiscal Year2010
RecommendedAppropriation
Fiscal Year 2008 Fiscal Year 2009
Legislative Printing Unit www.ilga.gov105 Stratton BuildingSpringfield, IL 62706
217.782.7312
Appropriations Requiring General Assembly Action($ thousands)
GENERAL FUNDS
Total 1,782.0 1,692.91,692.91,692.91,675.7Personal Services and Fringe Benefits
Total 229.6 170.2170.2170.2229.6Contractual Services
Total 492.7 516.0516.0516.0488.2Other Operations and Refunds
TOTAL GENERAL FUNDS 2,504.3 2,379.12,379.12,379.12,393.5
TOTAL ALL FUNDS 2,504.3 2,379.12,379.12,379.12,393.5
ActualExpenditure
EnactedAppropriation
EstimatedExpenditures
EnactedAppropriation
Fiscal Year2010
RecommendedAppropriation
Fiscal Year 2008 Fiscal Year 2009
Legislative Reference Bureau www.ilga.gov112 State House
Springfield, IL 62706217.782.6625
Appropriations Requiring General Assembly Action($ thousands)
GENERAL FUNDS
Total 2,366.8 2,248.52,248.52,248.52,232.2Personal Services and Fringe Benefits
Total 145.0 137.7137.7137.7122.4Contractual Services
Total 414.4 393.7393.7393.7345.8Other Operations and Refunds
TOTAL GENERAL FUNDS 2,926.2 2,779.92,779.92,779.92,700.4
TOTAL ALL FUNDS 2,926.2 2,779.92,779.92,779.92,700.4
11 - 43
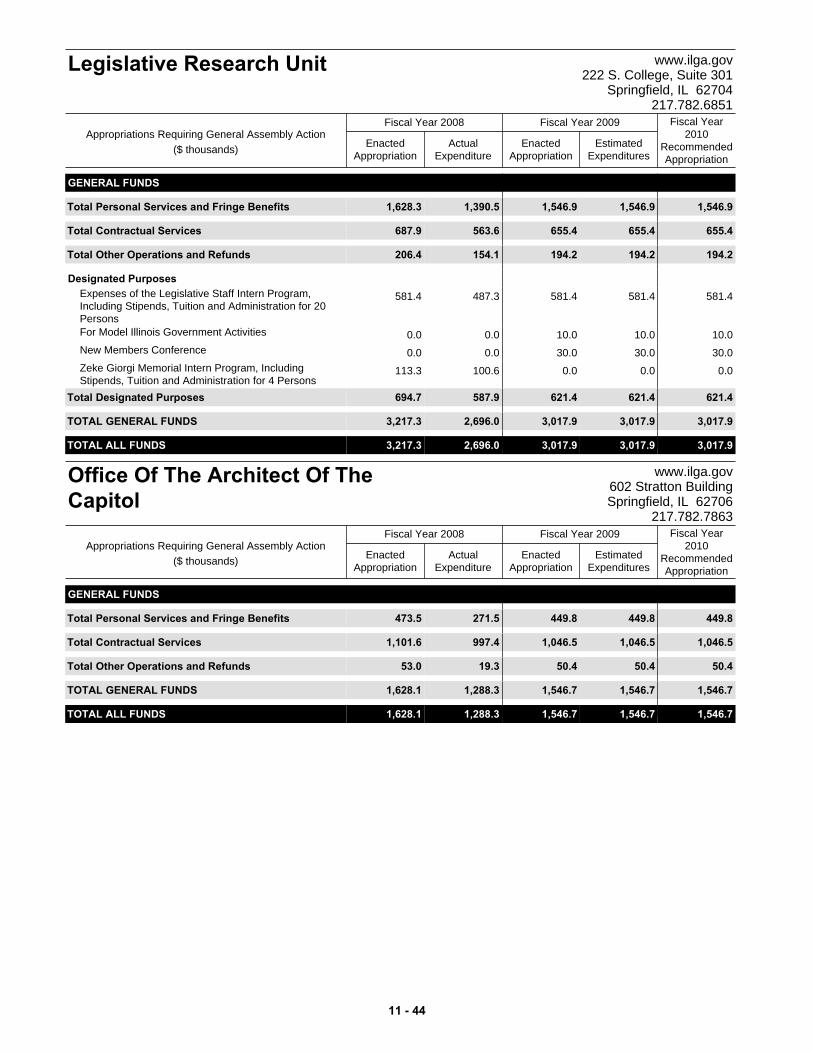
ActualExpenditure
EnactedAppropriation
EstimatedExpenditures
EnactedAppropriation
Fiscal Year2010
RecommendedAppropriation
Fiscal Year 2008 Fiscal Year 2009
Legislative Research Unit www.ilga.gov222 S. College, Suite 301
Springfield, IL 62704217.782.6851
Appropriations Requiring General Assembly Action($ thousands)
GENERAL FUNDS
Total 1,628.3 1,546.91,546.91,546.91,390.5Personal Services and Fringe Benefits
Total 687.9 655.4655.4655.4563.6Contractual Services
Total 206.4 194.2194.2194.2154.1Other Operations and Refunds
Designated Purposes581.4 581.4581.4581.4487.3Expenses of the Legislative Staff Intern Program,
Including Stipends, Tuition and Administration for 20Persons
0.0 10.010.010.00.0For Model Illinois Government Activities
0.0 30.030.030.00.0New Members Conference
113.3 0.00.00.0100.6Zeke Giorgi Memorial Intern Program, IncludingStipends, Tuition and Administration for 4 Persons
Total 694.7 621.4621.4621.4587.9Designated Purposes
TOTAL GENERAL FUNDS 3,217.3 3,017.93,017.93,017.92,696.0
TOTAL ALL FUNDS 3,217.3 3,017.93,017.93,017.92,696.0
ActualExpenditure
EnactedAppropriation
EstimatedExpenditures
EnactedAppropriation
Fiscal Year2010
RecommendedAppropriation
Fiscal Year 2008 Fiscal Year 2009
Office Of The Architect Of TheCapitol
www.ilga.gov602 Stratton BuildingSpringfield, IL 62706
217.782.7863
Appropriations Requiring General Assembly Action($ thousands)
GENERAL FUNDS
Total 473.5 449.8449.8449.8271.5Personal Services and Fringe Benefits
Total 1,101.6 1,046.51,046.51,046.5997.4Contractual Services
Total 53.0 50.450.450.419.3Other Operations and Refunds
TOTAL GENERAL FUNDS 1,628.1 1,546.71,546.71,546.71,288.3
TOTAL ALL FUNDS 1,628.1 1,546.71,546.71,546.71,288.3
11 - 44

Civil Service Commission www.icsc.il.gov 400 West Monroe Street, Ste. 306
Springfield, IL 62704 217.782.7373
OVERVIEW Agency Mission To apply merit principles to public employment in the state of Illinois within the powers and duties set forth in the Personnel Code. Strategic Priorities • Conduct investigations and/or hearings of
employee appeals and issue decisions in a timely manner.
• Determine Jurisdiction B exemptions and evaluate process and criteria.
• Review proposed amendments to Personnel Code or Rules and Position Classification Plan.
Summary of Agency Operations The Civil Service Commission (CSC) hears and determines employee appeals of discharges, suspensions, transfers, allocations, layoffs and demotions under the Personnel Code and Rules. The commission approves exemptions from Jurisdiction B of the Personnel Code for those positions that, in the judgment of the commission, involve either principal administrative responsibility for the determination of policy or the manner in which policies are implemented.
The commission has the authority to disapprove proposed additions or amendments to the Personnel Rules and must approve amendments to the Position Classification Plan. The commission also directs compliance with the requirements of the Personnel Code or Rules when violations are found. Agency Resources Employed
FY 2008 FY 2009 FY 2010Actual Enacted Recommended
General Funds 456.2 448.1 417.8Other State Funds 0.0 0.0 0.0
Federal Funds 0.0 0.0 0.0Total 456.2 448.1 417.8
Actual Estimated RecommendedHeadcount (FTE) 9.0 9.0 9.0
Appropriations ($ thousands)Fund Category
MAJOR ACCOMPLISHMENTS • Completed revision and restructuring of
commission rules. KEY BUDGET INITIATIVES • Initiate expansion of procedural information
available to litigants from the commission's Web site.
PERFORMANCE MEASURES Estimated Projected
FY 2006 FY 2007 FY 2008 FY 2009 FY 2010Number of appeals closed 84 49 46 48 52Number of technical actions acted on 119 78 166 140 80
ActualPerformance Metric
11 - 45

GENERAL FUNDS
Total 317.9 309.5323.9323.9316.3Personal Services and Fringe Benefits
Total 82.5 72.167.474.972.4Contractual Services
Total 55.8 36.240.049.333.0Other Operations and Refunds
TOTAL GENERAL FUNDS 456.2 417.8431.3448.1421.7
TOTAL ALL FUNDS 456.2 417.8431.3448.1421.7
BY FUND
456.2 417.8431.3448.1421.7General Revenue Fund
TOTAL ALL FUNDS 456.2 417.8431.3448.1421.7
BY DIVISION
456.2 417.8431.3448.1421.7General Office
TOTAL ALL DIVISIONS 456.2 417.8431.3448.1421.7
HEADCOUNT BY DIVISION Actual Estimated Authorized
9.0 9.09.0General Office
TOTAL HEADCOUNT 9.0 9.09.0 t
ActualExpenditure
EnactedAppropriation
EstimatedExpenditures
EnactedAppropriation
Fiscal Year2010
RecommendedAppropriation
Fiscal Year 2008 Fiscal Year 2009
Civil Service Commission www.icsc.il.gov400 West Monroe Street, Ste. 306
Springfield, IL 62704217.782.7373
Appropriations Requiring General Assembly Action($ thousands)
11 - 46
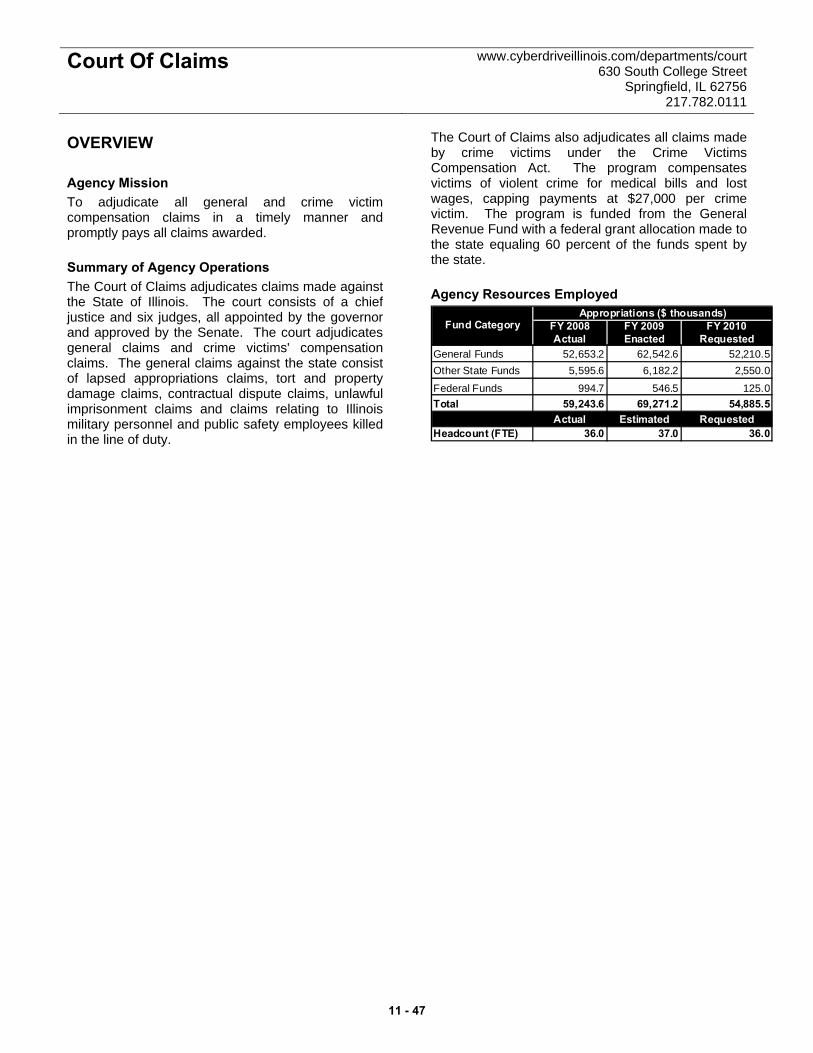
Court Of Claims www.cyberdriveillinois.com/departments/court 630 South College Street
Springfield, IL 62756 217.782.0111
OVERVIEW Agency Mission To adjudicate all general and crime victim compensation claims in a timely manner and promptly pays all claims awarded. Summary of Agency Operations The Court of Claims adjudicates claims made against the State of Illinois. The court consists of a chief justice and six judges, all appointed by the governor and approved by the Senate. The court adjudicates general claims and crime victims' compensation claims. The general claims against the state consist of lapsed appropriations claims, tort and property damage claims, contractual dispute claims, unlawful imprisonment claims and claims relating to Illinois military personnel and public safety employees killed in the line of duty.
The Court of Claims also adjudicates all claims made by crime victims under the Crime Victims Compensation Act. The program compensates victims of violent crime for medical bills and lost wages, capping payments at $27,000 per crime victim. The program is funded from the General Revenue Fund with a federal grant allocation made to the state equaling 60 percent of the funds spent by the state. Agency Resources Employed
FY 2008 FY 2009 FY 2010Actual Enacted Requested
General Funds 52,653.2 62,542.6 52,210.5Other State Funds 5,595.6 6,182.2 2,550.0
Federal Funds 994.7 546.5 125.0Total 59,243.6 69,271.2 54,885.5
Actual Estimated RequestedHeadcount (FTE) 36.0 37.0 36.0
Appropriations ($ thousands)Fund Category
11 - 47
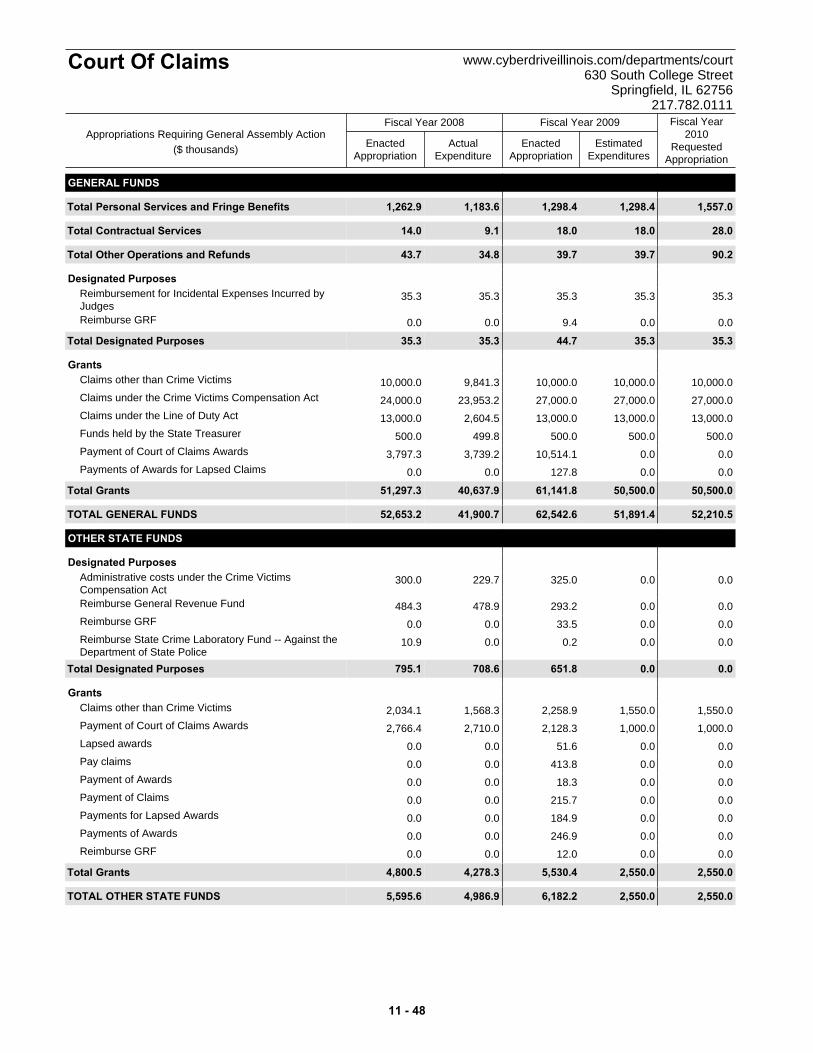
ActualExpenditure
EnactedAppropriation
EstimatedExpenditures
EnactedAppropriation
Fiscal Year2010
RequestedAppropriation
Fiscal Year 2008 Fiscal Year 2009
Court Of Claims www.cyberdriveillinois.com/departments/court630 South College Street
Springfield, IL 62756217.782.0111
Appropriations Requiring General Assembly Action($ thousands)
GENERAL FUNDS
Total 1,262.9 1,557.01,298.41,298.41,183.6Personal Services and Fringe Benefits
Total 14.0 28.018.018.09.1Contractual Services
Total 43.7 90.239.739.734.8Other Operations and Refunds
Designated Purposes35.3 35.335.335.335.3Reimbursement for Incidental Expenses Incurred by
Judges0.0 0.00.09.40.0Reimburse GRF
Total 35.3 35.335.344.735.3Designated Purposes
Grants10,000.0 10,000.010,000.010,000.09,841.3Claims other than Crime Victims
24,000.0 27,000.027,000.027,000.023,953.2Claims under the Crime Victims Compensation Act
13,000.0 13,000.013,000.013,000.02,604.5Claims under the Line of Duty Act
500.0 500.0500.0500.0499.8Funds held by the State Treasurer
3,797.3 0.00.010,514.13,739.2Payment of Court of Claims Awards
0.0 0.00.0127.80.0Payments of Awards for Lapsed Claims
Total 51,297.3 50,500.050,500.061,141.840,637.9Grants
TOTAL GENERAL FUNDS 52,653.2 52,210.551,891.462,542.641,900.7
OTHER STATE FUNDS
Designated Purposes300.0 0.00.0325.0229.7Administrative costs under the Crime Victims
Compensation Act484.3 0.00.0293.2478.9Reimburse General Revenue Fund
0.0 0.00.033.50.0Reimburse GRF
10.9 0.00.00.20.0Reimburse State Crime Laboratory Fund -- Against theDepartment of State Police
Total 795.1 0.00.0651.8708.6Designated Purposes
Grants2,034.1 1,550.01,550.02,258.91,568.3Claims other than Crime Victims
2,766.4 1,000.01,000.02,128.32,710.0Payment of Court of Claims Awards
0.0 0.00.051.60.0Lapsed awards
0.0 0.00.0413.80.0Pay claims
0.0 0.00.018.30.0Payment of Awards
0.0 0.00.0215.70.0Payment of Claims
0.0 0.00.0184.90.0Payments for Lapsed Awards
0.0 0.00.0246.90.0Payments of Awards
0.0 0.00.012.00.0Reimburse GRF
Total 4,800.5 2,550.02,550.05,530.44,278.3Grants
TOTAL OTHER STATE FUNDS 5,595.6 2,550.02,550.06,182.24,986.9
11 - 48
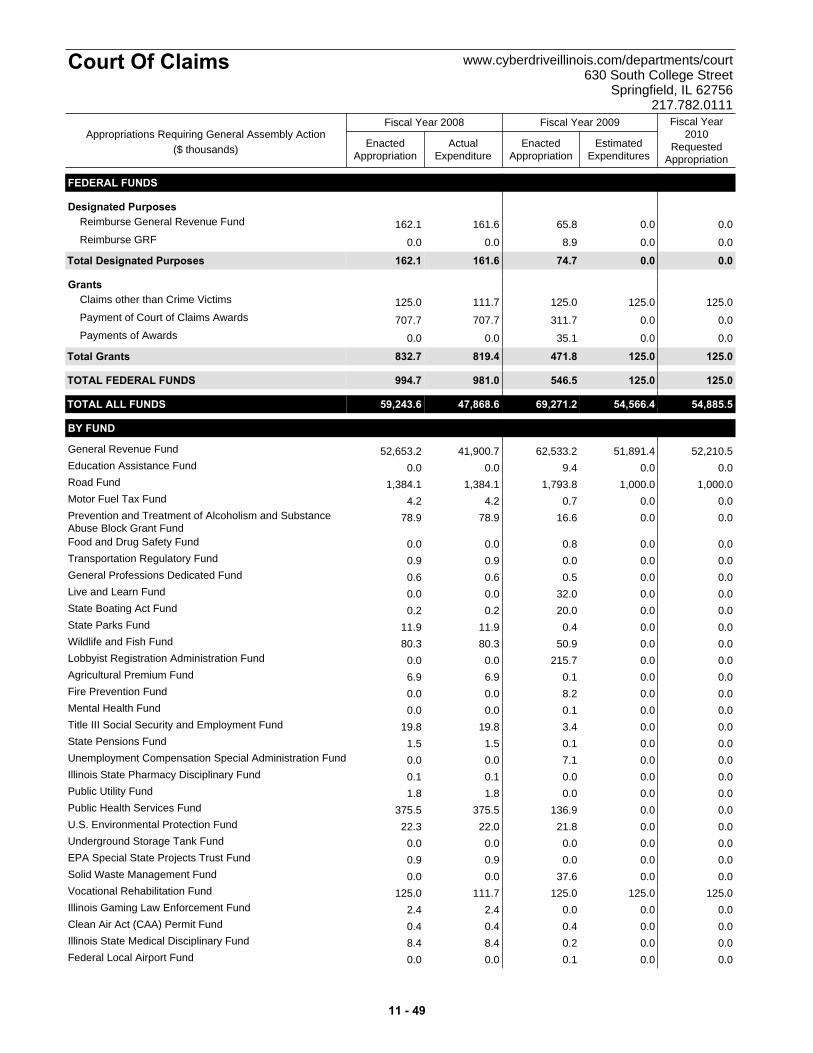
ActualExpenditure
EnactedAppropriation
EstimatedExpenditures
EnactedAppropriation
Fiscal Year2010
RequestedAppropriation
Fiscal Year 2008 Fiscal Year 2009
Court Of Claims www.cyberdriveillinois.com/departments/court630 South College Street
Springfield, IL 62756217.782.0111
Appropriations Requiring General Assembly Action($ thousands)
FEDERAL FUNDS
Designated Purposes162.1 0.00.065.8161.6Reimburse General Revenue Fund
0.0 0.00.08.90.0Reimburse GRF
Total 162.1 0.00.074.7161.6Designated Purposes
Grants125.0 125.0125.0125.0111.7Claims other than Crime Victims
707.7 0.00.0311.7707.7Payment of Court of Claims Awards
0.0 0.00.035.10.0Payments of Awards
Total 832.7 125.0125.0471.8819.4Grants
TOTAL FEDERAL FUNDS 994.7 125.0125.0546.5981.0
TOTAL ALL FUNDS 59,243.6 54,885.554,566.469,271.247,868.6
BY FUND
52,653.2 52,210.551,891.462,533.241,900.7General Revenue Fund
0.0 0.00.09.40.0Education Assistance Fund
1,384.1 1,000.01,000.01,793.81,384.1Road Fund
4.2 0.00.00.74.2Motor Fuel Tax Fund
78.9 0.00.016.678.9Prevention and Treatment of Alcoholism and SubstanceAbuse Block Grant Fund
0.0 0.00.00.80.0Food and Drug Safety Fund
0.9 0.00.00.00.9Transportation Regulatory Fund
0.6 0.00.00.50.6General Professions Dedicated Fund
0.0 0.00.032.00.0Live and Learn Fund
0.2 0.00.020.00.2State Boating Act Fund
11.9 0.00.00.411.9State Parks Fund
80.3 0.00.050.980.3Wildlife and Fish Fund
0.0 0.00.0215.70.0Lobbyist Registration Administration Fund
6.9 0.00.00.16.9Agricultural Premium Fund
0.0 0.00.08.20.0Fire Prevention Fund
0.0 0.00.00.10.0Mental Health Fund
19.8 0.00.03.419.8Title III Social Security and Employment Fund
1.5 0.00.00.11.5State Pensions Fund
0.0 0.00.07.10.0Unemployment Compensation Special Administration Fund
0.1 0.00.00.00.1Illinois State Pharmacy Disciplinary Fund
1.8 0.00.00.01.8Public Utility Fund
375.5 0.00.0136.9375.5Public Health Services Fund
22.3 0.00.021.822.0U.S. Environmental Protection Fund
0.0 0.00.00.00.0Underground Storage Tank Fund
0.9 0.00.00.00.9EPA Special State Projects Trust Fund
0.0 0.00.037.60.0Solid Waste Management Fund
125.0 125.0125.0125.0111.7Vocational Rehabilitation Fund
2.4 0.00.00.02.4Illinois Gaming Law Enforcement Fund
0.4 0.00.00.40.4Clean Air Act (CAA) Permit Fund
8.4 0.00.00.28.4Illinois State Medical Disciplinary Fund
0.0 0.00.00.10.0Federal Local Airport Fund
11 - 49
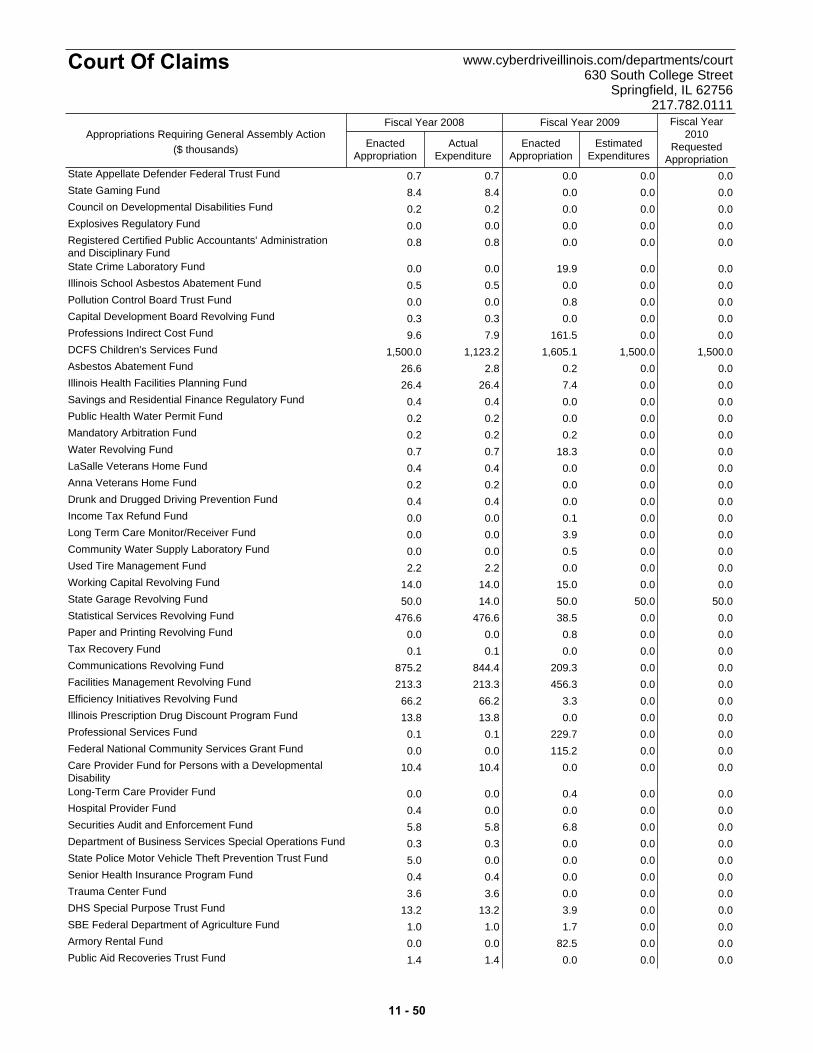
ActualExpenditure
EnactedAppropriation
EstimatedExpenditures
EnactedAppropriation
Fiscal Year2010
RequestedAppropriation
Fiscal Year 2008 Fiscal Year 2009
Court Of Claims www.cyberdriveillinois.com/departments/court630 South College Street
Springfield, IL 62756217.782.0111
Appropriations Requiring General Assembly Action($ thousands)
0.7 0.00.00.00.7State Appellate Defender Federal Trust Fund
8.4 0.00.00.08.4State Gaming Fund
0.2 0.00.00.00.2Council on Developmental Disabilities Fund
0.0 0.00.00.00.0Explosives Regulatory Fund
0.8 0.00.00.00.8Registered Certified Public Accountants' Administrationand Disciplinary Fund
0.0 0.00.019.90.0State Crime Laboratory Fund
0.5 0.00.00.00.5Illinois School Asbestos Abatement Fund
0.0 0.00.00.80.0Pollution Control Board Trust Fund
0.3 0.00.00.00.3Capital Development Board Revolving Fund
9.6 0.00.0161.57.9Professions Indirect Cost Fund
1,500.0 1,500.01,500.01,605.11,123.2DCFS Children's Services Fund
26.6 0.00.00.22.8Asbestos Abatement Fund
26.4 0.00.07.426.4Illinois Health Facilities Planning Fund
0.4 0.00.00.00.4Savings and Residential Finance Regulatory Fund
0.2 0.00.00.00.2Public Health Water Permit Fund
0.2 0.00.00.20.2Mandatory Arbitration Fund
0.7 0.00.018.30.7Water Revolving Fund
0.4 0.00.00.00.4LaSalle Veterans Home Fund
0.2 0.00.00.00.2Anna Veterans Home Fund
0.4 0.00.00.00.4Drunk and Drugged Driving Prevention Fund
0.0 0.00.00.10.0Income Tax Refund Fund
0.0 0.00.03.90.0Long Term Care Monitor/Receiver Fund
0.0 0.00.00.50.0Community Water Supply Laboratory Fund
2.2 0.00.00.02.2Used Tire Management Fund
14.0 0.00.015.014.0Working Capital Revolving Fund
50.0 50.050.050.014.0State Garage Revolving Fund
476.6 0.00.038.5476.6Statistical Services Revolving Fund
0.0 0.00.00.80.0Paper and Printing Revolving Fund
0.1 0.00.00.00.1Tax Recovery Fund
875.2 0.00.0209.3844.4Communications Revolving Fund
213.3 0.00.0456.3213.3Facilities Management Revolving Fund
66.2 0.00.03.366.2Efficiency Initiatives Revolving Fund
13.8 0.00.00.013.8Illinois Prescription Drug Discount Program Fund
0.1 0.00.0229.70.1Professional Services Fund
0.0 0.00.0115.20.0Federal National Community Services Grant Fund
10.4 0.00.00.010.4Care Provider Fund for Persons with a DevelopmentalDisability
0.0 0.00.00.40.0Long-Term Care Provider Fund
0.4 0.00.00.00.0Hospital Provider Fund
5.8 0.00.06.85.8Securities Audit and Enforcement Fund
0.3 0.00.00.00.3Department of Business Services Special Operations Fund
5.0 0.00.00.00.0State Police Motor Vehicle Theft Prevention Trust Fund
0.4 0.00.00.00.4Senior Health Insurance Program Fund
3.6 0.00.00.03.6Trauma Center Fund
13.2 0.00.03.913.2DHS Special Purpose Trust Fund
1.0 0.00.01.71.0SBE Federal Department of Agriculture Fund
0.0 0.00.082.50.0Armory Rental Fund
1.4 0.00.00.01.4Public Aid Recoveries Trust Fund
11 - 50
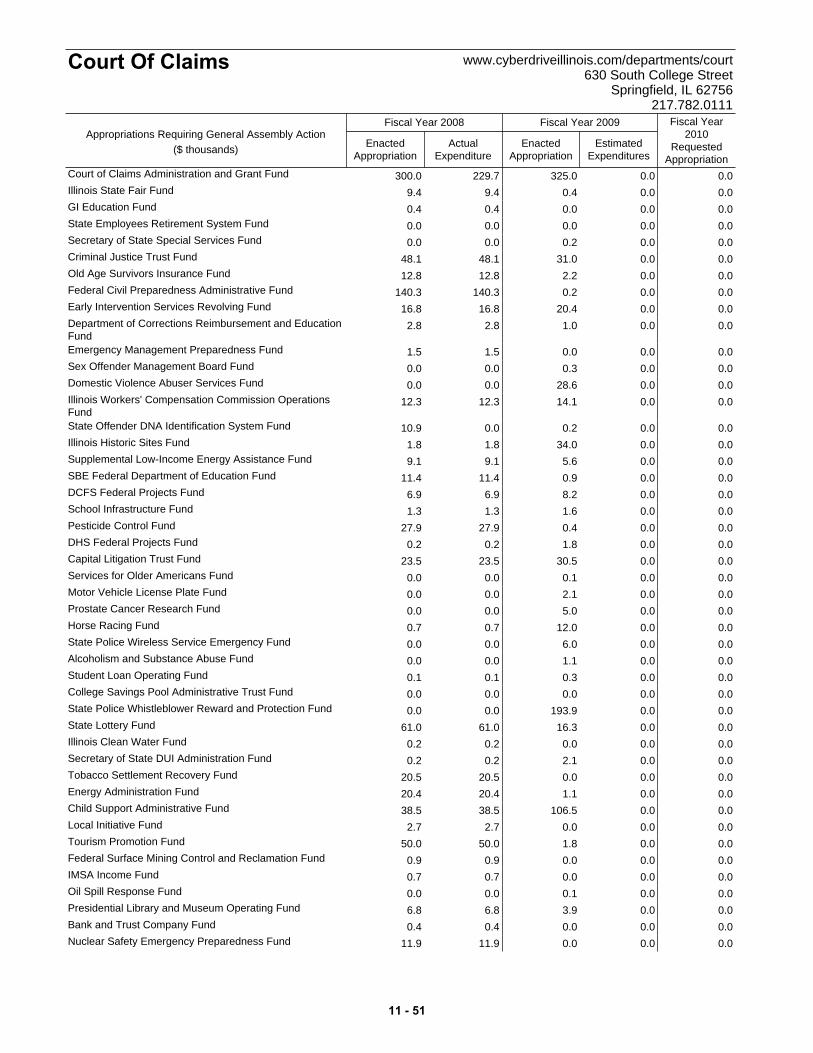
ActualExpenditure
EnactedAppropriation
EstimatedExpenditures
EnactedAppropriation
Fiscal Year2010
RequestedAppropriation
Fiscal Year 2008 Fiscal Year 2009
Court Of Claims www.cyberdriveillinois.com/departments/court630 South College Street
Springfield, IL 62756217.782.0111
Appropriations Requiring General Assembly Action($ thousands)
300.0 0.00.0325.0229.7Court of Claims Administration and Grant Fund
9.4 0.00.00.49.4Illinois State Fair Fund
0.4 0.00.00.00.4GI Education Fund
0.0 0.00.00.00.0State Employees Retirement System Fund
0.0 0.00.00.20.0Secretary of State Special Services Fund
48.1 0.00.031.048.1Criminal Justice Trust Fund
12.8 0.00.02.212.8Old Age Survivors Insurance Fund
140.3 0.00.00.2140.3Federal Civil Preparedness Administrative Fund
16.8 0.00.020.416.8Early Intervention Services Revolving Fund
2.8 0.00.01.02.8Department of Corrections Reimbursement and EducationFund
1.5 0.00.00.01.5Emergency Management Preparedness Fund
0.0 0.00.00.30.0Sex Offender Management Board Fund
0.0 0.00.028.60.0Domestic Violence Abuser Services Fund
12.3 0.00.014.112.3Illinois Workers' Compensation Commission OperationsFund
10.9 0.00.00.20.0State Offender DNA Identification System Fund
1.8 0.00.034.01.8Illinois Historic Sites Fund
9.1 0.00.05.69.1Supplemental Low-Income Energy Assistance Fund
11.4 0.00.00.911.4SBE Federal Department of Education Fund
6.9 0.00.08.26.9DCFS Federal Projects Fund
1.3 0.00.01.61.3School Infrastructure Fund
27.9 0.00.00.427.9Pesticide Control Fund
0.2 0.00.01.80.2DHS Federal Projects Fund
23.5 0.00.030.523.5Capital Litigation Trust Fund
0.0 0.00.00.10.0Services for Older Americans Fund
0.0 0.00.02.10.0Motor Vehicle License Plate Fund
0.0 0.00.05.00.0Prostate Cancer Research Fund
0.7 0.00.012.00.7Horse Racing Fund
0.0 0.00.06.00.0State Police Wireless Service Emergency Fund
0.0 0.00.01.10.0Alcoholism and Substance Abuse Fund
0.1 0.00.00.30.1Student Loan Operating Fund
0.0 0.00.00.00.0College Savings Pool Administrative Trust Fund
0.0 0.00.0193.90.0State Police Whistleblower Reward and Protection Fund
61.0 0.00.016.361.0State Lottery Fund
0.2 0.00.00.00.2Illinois Clean Water Fund
0.2 0.00.02.10.2Secretary of State DUI Administration Fund
20.5 0.00.00.020.5Tobacco Settlement Recovery Fund
20.4 0.00.01.120.4Energy Administration Fund
38.5 0.00.0106.538.5Child Support Administrative Fund
2.7 0.00.00.02.7Local Initiative Fund
50.0 0.00.01.850.0Tourism Promotion Fund
0.9 0.00.00.00.9Federal Surface Mining Control and Reclamation Fund
0.7 0.00.00.00.7IMSA Income Fund
0.0 0.00.00.10.0Oil Spill Response Fund
6.8 0.00.03.96.8Presidential Library and Museum Operating Fund
0.4 0.00.00.00.4Bank and Trust Company Fund
11.9 0.00.00.011.9Nuclear Safety Emergency Preparedness Fund
11 - 51
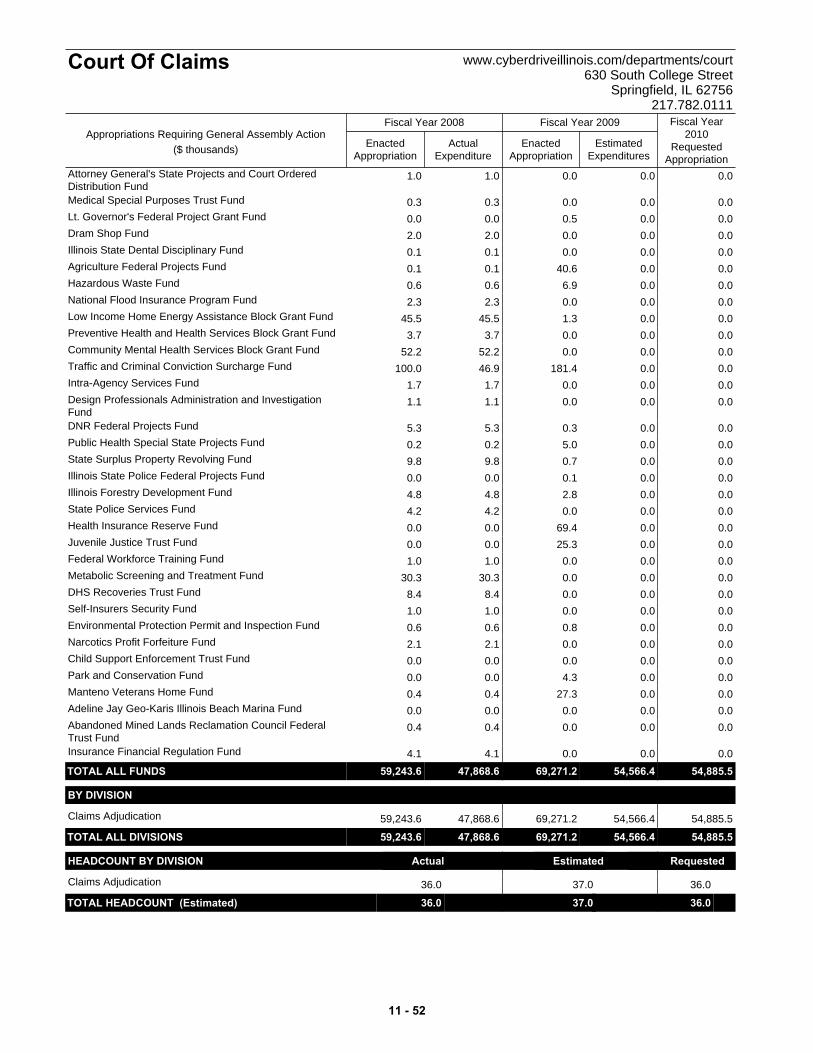
ActualExpenditure
EnactedAppropriation
EstimatedExpenditures
EnactedAppropriation
Fiscal Year2010
RequestedAppropriation
Fiscal Year 2008 Fiscal Year 2009
Court Of Claims www.cyberdriveillinois.com/departments/court630 South College Street
Springfield, IL 62756217.782.0111
Appropriations Requiring General Assembly Action($ thousands)
1.0 0.00.00.01.0Attorney General's State Projects and Court OrderedDistribution Fund
0.3 0.00.00.00.3Medical Special Purposes Trust Fund
0.0 0.00.00.50.0Lt. Governor's Federal Project Grant Fund
2.0 0.00.00.02.0Dram Shop Fund
0.1 0.00.00.00.1Illinois State Dental Disciplinary Fund
0.1 0.00.040.60.1Agriculture Federal Projects Fund
0.6 0.00.06.90.6Hazardous Waste Fund
2.3 0.00.00.02.3National Flood Insurance Program Fund
45.5 0.00.01.345.5Low Income Home Energy Assistance Block Grant Fund
3.7 0.00.00.03.7Preventive Health and Health Services Block Grant Fund
52.2 0.00.00.052.2Community Mental Health Services Block Grant Fund
100.0 0.00.0181.446.9Traffic and Criminal Conviction Surcharge Fund
1.7 0.00.00.01.7Intra-Agency Services Fund
1.1 0.00.00.01.1Design Professionals Administration and InvestigationFund
5.3 0.00.00.35.3DNR Federal Projects Fund
0.2 0.00.05.00.2Public Health Special State Projects Fund
9.8 0.00.00.79.8State Surplus Property Revolving Fund
0.0 0.00.00.10.0Illinois State Police Federal Projects Fund
4.8 0.00.02.84.8Illinois Forestry Development Fund
4.2 0.00.00.04.2State Police Services Fund
0.0 0.00.069.40.0Health Insurance Reserve Fund
0.0 0.00.025.30.0Juvenile Justice Trust Fund
1.0 0.00.00.01.0Federal Workforce Training Fund
30.3 0.00.00.030.3Metabolic Screening and Treatment Fund
8.4 0.00.00.08.4DHS Recoveries Trust Fund
1.0 0.00.00.01.0Self-Insurers Security Fund
0.6 0.00.00.80.6Environmental Protection Permit and Inspection Fund
2.1 0.00.00.02.1Narcotics Profit Forfeiture Fund
0.0 0.00.00.00.0Child Support Enforcement Trust Fund
0.0 0.00.04.30.0Park and Conservation Fund
0.4 0.00.027.30.4Manteno Veterans Home Fund
0.0 0.00.00.00.0Adeline Jay Geo-Karis Illinois Beach Marina Fund
0.4 0.00.00.00.4Abandoned Mined Lands Reclamation Council FederalTrust Fund
4.1 0.00.00.04.1Insurance Financial Regulation Fund
TOTAL ALL FUNDS 59,243.6 54,885.554,566.469,271.247,868.6
BY DIVISION
59,243.6 54,885.554,566.469,271.247,868.6Claims Adjudication
TOTAL ALL DIVISIONS 59,243.6 54,885.554,566.469,271.247,868.6
HEADCOUNT BY DIVISION Actual Estimated Requested
36.0 36.037.0Claims Adjudication
TOTAL HEADCOUNT (Estimated) 36.0 36.037.0 t
11 - 52

State Board Of Elections www.elections.state.il.us 1020 South Spring Street
Springfield, IL 62704 217.782.4141
OVERVIEW Agency Mission To provide general supervision over the voter registration process and election laws throughout the state. The General Assembly determines the size, manner of selection and compensation of the board. No political party has a majority of members on the board. Summary of Agency Operations The State Board of Elections (the Board) administers elections and election laws in Illinois. The Board disseminates information to and consults with election authorities concerning the conduct of elections and voter registration in accordance with the laws of Illinois and the United States. The Board receives nominating papers and certificates of nomination, determines the validity of the petitions and establishes the order in which names shall appear on the ballots of all 102 counties. The Board certifies the names of all candidates who have filed the necessary petitions for each county clerk. The Board oversees both primary and general election returns, and subsequently certifies all candidates who are nominated or elected in Illinois. The Board reports violations of election law to the appropriate state's attorney. The Board oversees the Illinois Campaign Finance Act through its Campaign Disclosure Division (the Division). The Division reviews required campaign disclosure reports submitted by campaign committees and related groups, administers corrective action to entities found to be in non-compliance, and reviews raffle applications from political committees and related entities for fund-raising purposes. A recent federal law, the "Help America Vote Act of 2002" (HAVA) (P.L. 107-252), made federal funds available to upgrade voting equipment used by voters and local election jurisdictions in the state. Currently, the federal funds, first received in fiscal year 2004, are used to reimburse local jurisdictions for costs associated with replacing existing voting equipment and technology. Other specified uses of the funds include increased training and awareness of local election officials, enhancement of voting facilities to make them more accessible to persons with
disabilities and development of an integrated statewide voter registration system to capture data from local jurisdictions and report data in a unified format. Agency Resources Employed
FY 2008 FY 2009 FY 2010Actual Enacted Requested
General Funds 8,389.7 18,899.1 19,107.7Other State Funds 58,800.0 32,925.7 29,925.7
Federal Funds 0.0 0.0 0.0Total 67,189.7 51,824.8 49,033.3
Actual Estimated RequestedHeadcount (FTE) 69.0 70.0 79.0
Appropriations ($ thousands)Fund Category
MAJOR ACCOMPLISHMENTS • Made significant progress in developing an
integrated statewide voter registration system. • Administered two highly successful elections
in calendar year 2008: the earliest primary election in Illinois history and the November statewide General Election. Illinois reported record numbers of registered voters, and almost 1 million voters cast their ballots at early voting locations.
• Managed and disbursed federal HAVA funds
to local election authorities to continue the upgrade of local voting and registration infrastructure.
KEY BUDGET INITIATIVES • Maintain and support the statewide Illinois
Voter Registration System (IVRS) to help local election jurisdictions maintain the essential flow of data between their databases and the IVRS.
• Subsidize local election jurisdiction costs,
including costs associated with payment of judges and other staff during fiscal year 2010 early voting periods and election days, by increasing compensation rates in accordance with the mandate outlined in PA 095-0699.
11 - 53
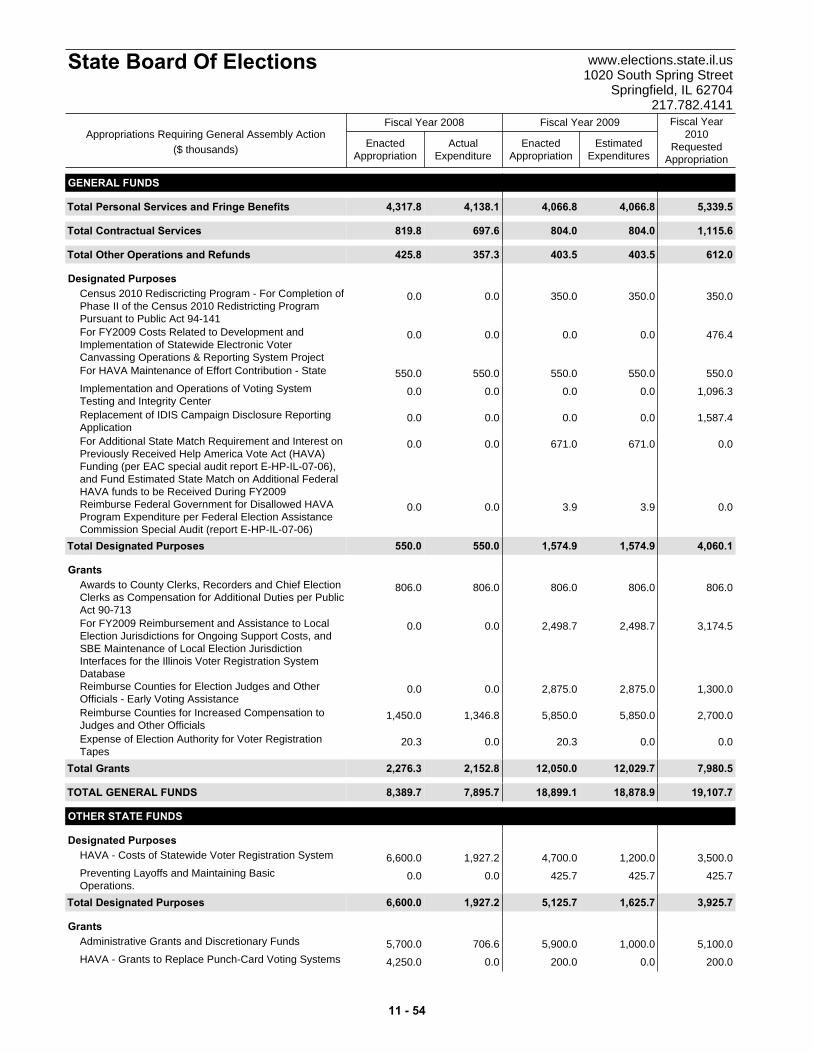
ActualExpenditure
EnactedAppropriation
EstimatedExpenditures
EnactedAppropriation
Fiscal Year2010
RequestedAppropriation
Fiscal Year 2008 Fiscal Year 2009
State Board Of Elections www.elections.state.il.us1020 South Spring Street
Springfield, IL 62704217.782.4141
Appropriations Requiring General Assembly Action($ thousands)
GENERAL FUNDS
Total 4,317.8 5,339.54,066.84,066.84,138.1Personal Services and Fringe Benefits
Total 819.8 1,115.6804.0804.0697.6Contractual Services
Total 425.8 612.0403.5403.5357.3Other Operations and Refunds
Designated Purposes0.0 350.0350.0350.00.0Census 2010 Rediscricting Program - For Completion of
Phase II of the Census 2010 Redistricting ProgramPursuant to Public Act 94-141
0.0 476.40.00.00.0For FY2009 Costs Related to Development andImplementation of Statewide Electronic VoterCanvassing Operations & Reporting System Project
550.0 550.0550.0550.0550.0For HAVA Maintenance of Effort Contribution - State
0.0 1,096.30.00.00.0Implementation and Operations of Voting SystemTesting and Integrity Center
0.0 1,587.40.00.00.0Replacement of IDIS Campaign Disclosure ReportingApplication
0.0 0.0671.0671.00.0For Additional State Match Requirement and Interest onPreviously Received Help America Vote Act (HAVA)Funding (per EAC special audit report E-HP-IL-07-06),and Fund Estimated State Match on Additional FederalHAVA funds to be Received During FY2009
0.0 0.03.93.90.0Reimburse Federal Government for Disallowed HAVAProgram Expenditure per Federal Election AssistanceCommission Special Audit (report E-HP-IL-07-06)
Total 550.0 4,060.11,574.91,574.9550.0Designated Purposes
Grants806.0 806.0806.0806.0806.0Awards to County Clerks, Recorders and Chief Election
Clerks as Compensation for Additional Duties per PublicAct 90-713
0.0 3,174.52,498.72,498.70.0For FY2009 Reimbursement and Assistance to LocalElection Jurisdictions for Ongoing Support Costs, andSBE Maintenance of Local Election JurisdictionInterfaces for the Illinois Voter Registration SystemDatabase
0.0 1,300.02,875.02,875.00.0Reimburse Counties for Election Judges and OtherOfficials - Early Voting Assistance
1,450.0 2,700.05,850.05,850.01,346.8Reimburse Counties for Increased Compensation toJudges and Other Officials
20.3 0.00.020.30.0Expense of Election Authority for Voter RegistrationTapes
Total 2,276.3 7,980.512,029.712,050.02,152.8Grants
TOTAL GENERAL FUNDS 8,389.7 19,107.718,878.918,899.17,895.7
OTHER STATE FUNDS
Designated Purposes6,600.0 3,500.01,200.04,700.01,927.2HAVA - Costs of Statewide Voter Registration System
0.0 425.7425.7425.70.0Preventing Layoffs and Maintaining BasicOperations.
Total 6,600.0 3,925.71,625.75,125.71,927.2Designated Purposes
Grants5,700.0 5,100.01,000.05,900.0706.6Administrative Grants and Discretionary Funds
4,250.0 200.00.0200.00.0HAVA - Grants to Replace Punch-Card Voting Systems
11 - 54

ActualExpenditure
EnactedAppropriation
EstimatedExpenditures
EnactedAppropriation
Fiscal Year2010
RequestedAppropriation
Fiscal Year 2008 Fiscal Year 2009
State Board Of Elections www.elections.state.il.us1020 South Spring Street
Springfield, IL 62704217.782.4141
Appropriations Requiring General Assembly Action($ thousands)
42,250.0 20,700.03,700.021,700.04,567.1HAVA - Requirements Money Grants for VotingEquipment
Total 52,200.0 26,000.04,700.027,800.05,273.7Grants
TOTAL OTHER STATE FUNDS 58,800.0 29,925.76,325.732,925.77,200.9
TOTAL ALL FUNDS 67,189.7 49,033.325,204.651,824.815,096.5
BY FUND
8,389.7 19,107.718,878.918,899.17,895.7General Revenue Fund
58,800.0 29,500.05,900.032,500.07,200.9Help Illinois Vote Fund
0.0 425.7425.7425.70.0Budget Relief Fund
TOTAL ALL FUNDS 67,189.7 49,033.325,204.651,824.815,096.5
BY DIVISION
38.6 40.936.736.729.3The Board
1,288.2 1,515.01,195.01,195.01,228.7Administration
63,557.1 44,282.621,764.648,384.811,661.5Elections Operations
420.8 474.2399.8399.8383.6General Counsel
946.9 1,102.4880.5880.5931.8Campaign Financing
938.1 1,618.2928.2928.2861.6Electronic Data Processing
TOTAL ALL DIVISIONS 67,189.7 49,033.325,204.651,824.815,096.5
HEADCOUNT BY DIVISION Actual Estimated Requested
11.0 12.010.0Administration
30.0 36.033.0Elections Operations
5.0 5.04.0General Counsel
16.0 17.016.0Campaign Financing
7.0 9.07.0Electronic Data Processing
TOTAL HEADCOUNT (Estimated) 69.0 79.070.0 t
11 - 55
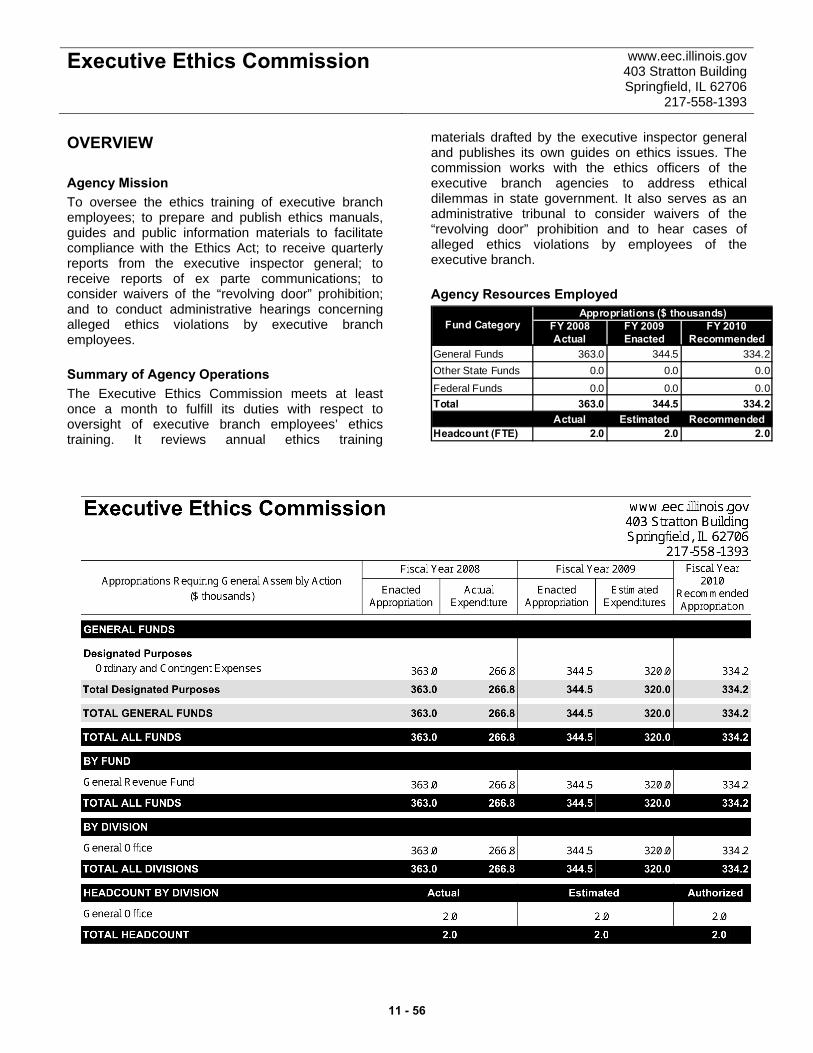
Executive Ethics Commission www.eec.illinois.gov 403 Stratton Building Springfield, IL 62706
217-558-1393
OVERVIEW Agency Mission To oversee the ethics training of executive branch employees; to prepare and publish ethics manuals, guides and public information materials to facilitate compliance with the Ethics Act; to receive quarterly reports from the executive inspector general; to receive reports of ex parte communications; to consider waivers of the “revolving door” prohibition; and to conduct administrative hearings concerning alleged ethics violations by executive branch employees. Summary of Agency Operations The Executive Ethics Commission meets at least once a month to fulfill its duties with respect to oversight of executive branch employees’ ethics training. It reviews annual ethics training
materials drafted by the executive inspector general and publishes its own guides on ethics issues. The commission works with the ethics officers of the executive branch agencies to address ethical dilemmas in state government. It also serves as an administrative tribunal to consider waivers of the “revolving door” prohibition and to hear cases of alleged ethics violations by employees of the executive branch. Agency Resources Employed
FY 2008 FY 2009 FY 2010Actual Enacted Recommended
General Funds 363.0 344.5 334.2Other State Funds 0.0 0.0 0.0
Federal Funds 0.0 0.0 0.0Total 363.0 344.5 334.2
Actual Estimated RecommendedHeadcount (FTE) 2.0 2.0 2.0
Appropriations ($ thousands)Fund Category
11 - 56
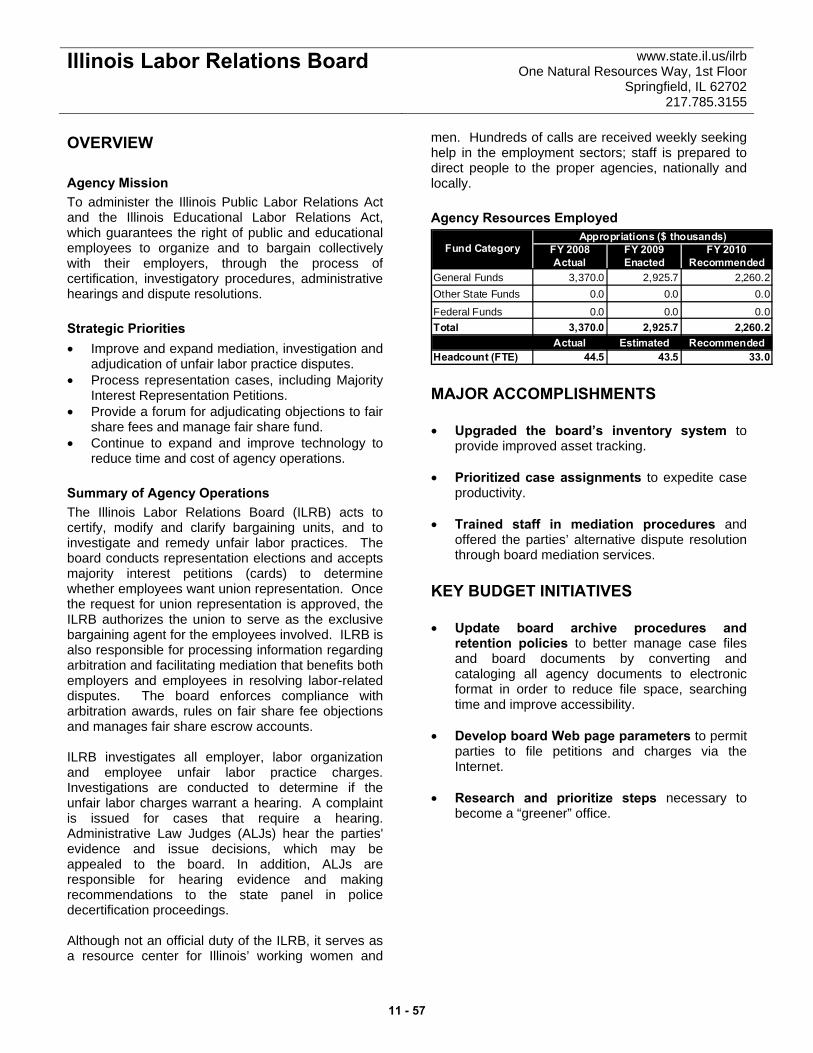
Illinois Labor Relations Board www.state.il.us/ilrb One Natural Resources Way, 1st Floor
Springfield, IL 62702 217.785.3155
OVERVIEW Agency Mission To administer the Illinois Public Labor Relations Act and the Illinois Educational Labor Relations Act, which guarantees the right of public and educational employees to organize and to bargain collectively with their employers, through the process of certification, investigatory procedures, administrative hearings and dispute resolutions. Strategic Priorities • Improve and expand mediation, investigation and
adjudication of unfair labor practice disputes. • Process representation cases, including Majority
Interest Representation Petitions. • Provide a forum for adjudicating objections to fair
share fees and manage fair share fund. • Continue to expand and improve technology to
reduce time and cost of agency operations. Summary of Agency Operations The Illinois Labor Relations Board (ILRB) acts to certify, modify and clarify bargaining units, and to investigate and remedy unfair labor practices. The board conducts representation elections and accepts majority interest petitions (cards) to determine whether employees want union representation. Once the request for union representation is approved, the ILRB authorizes the union to serve as the exclusive bargaining agent for the employees involved. ILRB is also responsible for processing information regarding arbitration and facilitating mediation that benefits both employers and employees in resolving labor-related disputes. The board enforces compliance with arbitration awards, rules on fair share fee objections and manages fair share escrow accounts. ILRB investigates all employer, labor organization and employee unfair labor practice charges. Investigations are conducted to determine if the unfair labor charges warrant a hearing. A complaint is issued for cases that require a hearing. Administrative Law Judges (ALJs) hear the parties' evidence and issue decisions, which may be appealed to the board. In addition, ALJs are responsible for hearing evidence and making recommendations to the state panel in police decertification proceedings. Although not an official duty of the ILRB, it serves as a resource center for Illinois’ working women and
men. Hundreds of calls are received weekly seeking help in the employment sectors; staff is prepared to direct people to the proper agencies, nationally and locally. Agency Resources Employed
FY 2008 FY 2009 FY 2010Actual Enacted Recommended
General Funds 3,370.0 2,925.7 2,260.2Other State Funds 0.0 0.0 0.0
Federal Funds 0.0 0.0 0.0Total 3,370.0 2,925.7 2,260.2
Actual Estimated RecommendedHeadcount (FTE) 44.5 43.5 33.0
Appropriations ($ thousands)Fund Category
MAJOR ACCOMPLISHMENTS • Upgraded the board’s inventory system to
provide improved asset tracking. • Prioritized case assignments to expedite case
productivity. • Trained staff in mediation procedures and
offered the parties’ alternative dispute resolution through board mediation services.
KEY BUDGET INITIATIVES • Update board archive procedures and
retention policies to better manage case files and board documents by converting and cataloging all agency documents to electronic format in order to reduce file space, searching time and improve accessibility.
• Develop board Web page parameters to permit
parties to file petitions and charges via the Internet.
• Research and prioritize steps necessary to
become a “greener” office.
11 - 57
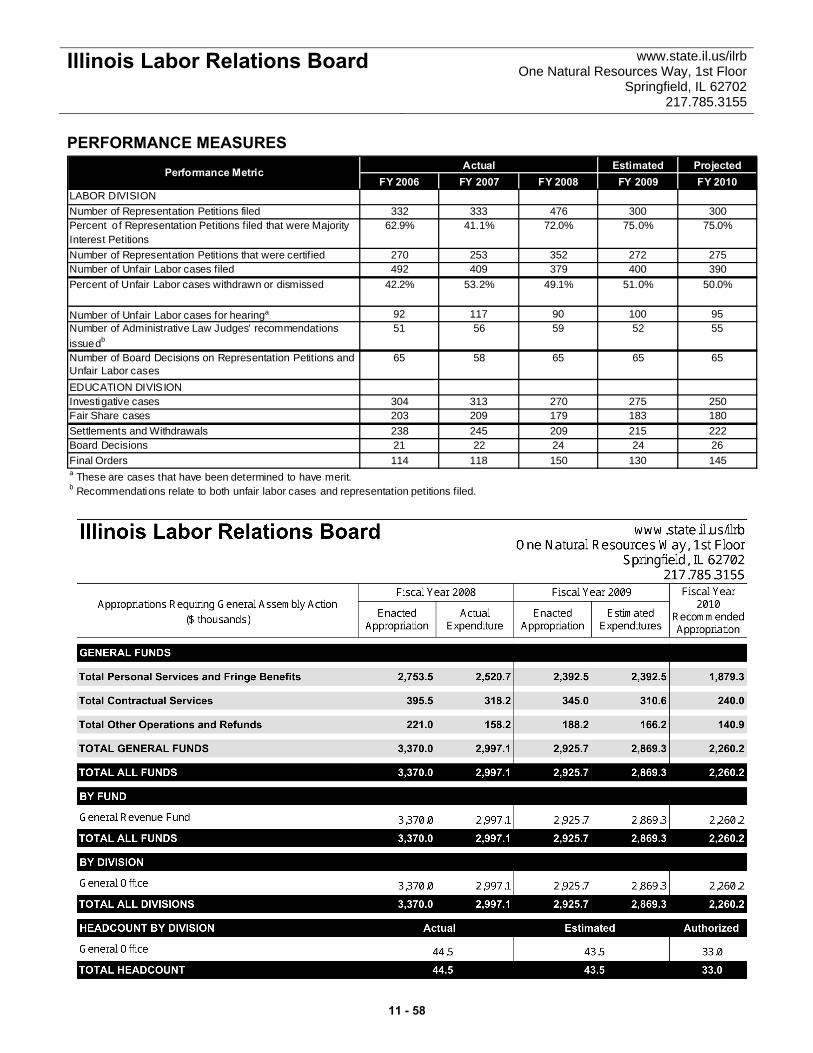
Illinois Labor Relations Board www.state.il.us/ilrb One Natural Resources Way, 1st Floor
Springfield, IL 62702 217.785.3155
PERFORMANCE MEASURES Estimated Projected
FY 2006 FY 2007 FY 2008 FY 2009 FY 2010LABOR DIVISIONNumber of Representation Petitions filed 332 333 476 300 300Percent of Representation Petitions filed that were Majority Interest Petitions
62.9% 41.1% 72.0% 75.0% 75.0%
Number of Representation Petitions that were certified 270 253 352 272 275Number of Unfair Labor cases filed 492 409 379 400 390Percent of Unfair Labor cases withdrawn or dismissed 42.2% 53.2% 49.1% 51.0% 50.0%
Number of Unfair Labor cases for hearinga 92 117 90 100 95Number of Administrative Law Judges' recommendations issuedb
51 56 59 52 55
Number of Board Decisions on Representation Petitions and Unfair Labor cases
65 58 65 65 65
EDUCATION DIVISIONInvestigative cases 304 313 270 275 250Fair Share cases 203 209 179 183 180Settlements and Withdrawals 238 245 209 215 222Board Decisions 21 22 24 24 26Final Orders 114 118 150 130 145
ActualPerformance Metric
a These are cases that have been determined to have merit.b Recommendations relate to both unfair labor cases and representation petitions filed.
11 - 58

Procurement Policy Board www.illinois.gov/PPB511 W. Capital
Springfield, IL 62704 217.785.3988
OVERVIEW Agency Mission To review, comment upon and recommend rules and practices governing the procurement, management, control and disposal of supplies, services, professional and artistic services, construction, and real property and capital improvement leases procured by the state. In particular, the Procurement Policy Board (PPB) is responsible for the approval of certain lease renewals and the review of most state contracts prior to execution. Summary of Agency Operations The PPB's single mandate is the facilitation of procurement policy for the State of Illinois. The board is in communication with the chief procurement officers, state purchasing officers, and their designees for the purposes of policy review and development. The board participates in training sessions for state procurement staff, and the board reviews proposed contracts and leases entered into by the state. The board works toward reducing the number of sole source transactions, assisting agencies in preventing actions that self-impose sole source or emergency procurements, and it works to improve procurement approaches that increase transparency, equivalency and employment of descriptive rather than restrictive specifications. Agency Resources Employed
FY 2008 FY 2009 FY 2010Actual Enacted Recommended
General Funds 313.0 298.0 289.1Other State Funds 0.0 0.0 0.0
Federal Funds 0.0 0.0 0.0Total 313.0 298.0 289.1
Actual Estimated RecommendedHeadcount (FTE) 4.0 4.0 4.0
Appropriations ($ thousands)Fund Category
MAJOR ACCOMPLISHMENTS • Reviewed over 7,000 proposed contracts and
leases. The board's review of proposed contracts has resulted in significant policy changes that govern competitive procurement processes. The net result is increased competition and/or reduced rates paid out in most areas of competitively awarded state contracts and leases.
• Saved $400,000 annually from renewing
contracts. Additional reductions are incurred each year the board reviews proposed contracts and leases. These direct reductions occur when the board perceives that proposed rates are higher than what markets should bear, or that the proposed terms exceed reasonable circumstances. In these circumstances, the board will request the contracting agency to seek a reduction in cost or terms. In most circumstances, the agency is successful in obtaining the requested reductions.
11 - 59

GENERAL FUNDS
Designated Purposes313.0 289.1298.0298.0281.9Ordinary and Contingent Expenses
Total 313.0 289.1298.0298.0281.9Designated Purposes
TOTAL GENERAL FUNDS 313.0 289.1298.0298.0281.9
TOTAL ALL FUNDS 313.0 289.1298.0298.0281.9
BY FUND
313.0 289.1298.0298.0281.9General Revenue Fund
TOTAL ALL FUNDS 313.0 289.1298.0298.0281.9
BY DIVISION
313.0 289.1298.0298.0281.9General Office
TOTAL ALL DIVISIONS 313.0 289.1298.0298.0281.9
HEADCOUNT BY DIVISION Actual Estimated Authorized
4.0 4.04.0General Office
TOTAL HEADCOUNT 4.0 4.04.0 t
ActualExpenditure
EnactedAppropriation
EstimatedExpenditures
EnactedAppropriation
Fiscal Year2010
RecommendedAppropriation
Fiscal Year 2008 Fiscal Year 2009
Procurement Policy Board www.illinois.gov/PPB511 W. Capital
Springfield, IL 62704217.785.3988
Appropriations Requiring General Assembly Action($ thousands)
11 - 60
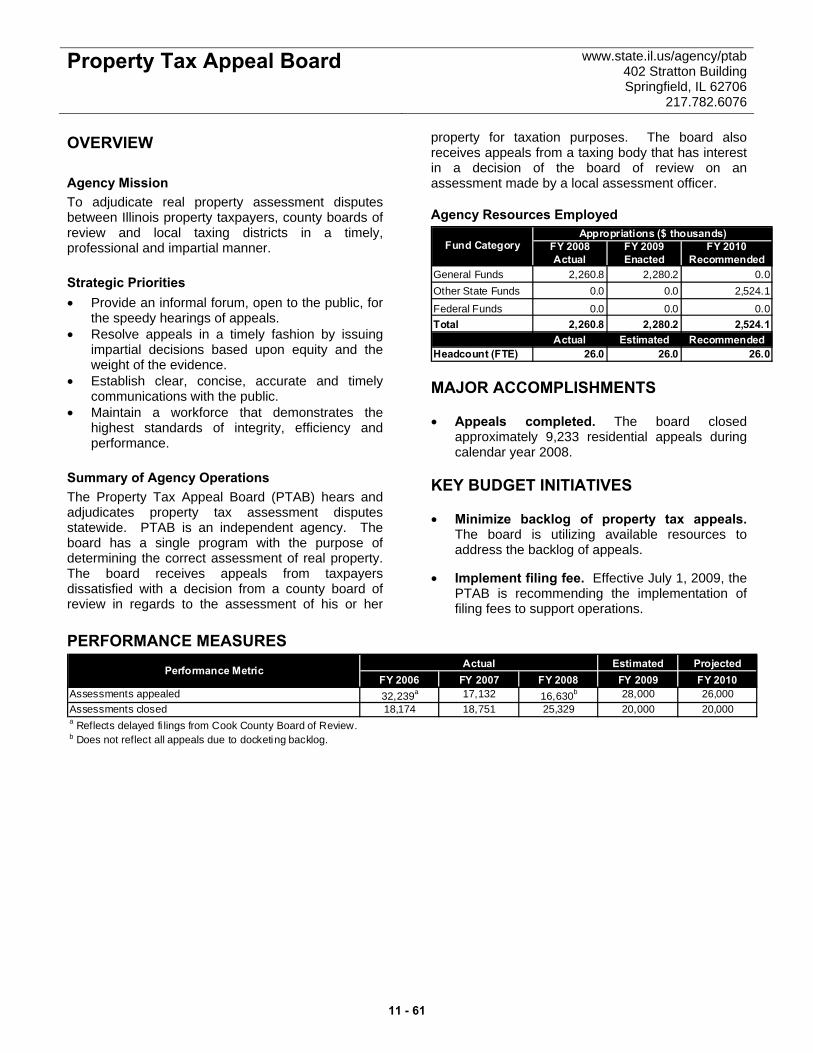
Property Tax Appeal Board www.state.il.us/agency/ptab 402 Stratton Building Springfield, IL 62706
217.782.6076
OVERVIEW Agency Mission To adjudicate real property assessment disputes between Illinois property taxpayers, county boards of review and local taxing districts in a timely, professional and impartial manner. Strategic Priorities • Provide an informal forum, open to the public, for
the speedy hearings of appeals. • Resolve appeals in a timely fashion by issuing
impartial decisions based upon equity and the weight of the evidence.
• Establish clear, concise, accurate and timely communications with the public.
• Maintain a workforce that demonstrates the highest standards of integrity, efficiency and performance.
Summary of Agency Operations The Property Tax Appeal Board (PTAB) hears and adjudicates property tax assessment disputes statewide. PTAB is an independent agency. The board has a single program with the purpose of determining the correct assessment of real property. The board receives appeals from taxpayers dissatisfied with a decision from a county board of review in regards to the assessment of his or her
property for taxation purposes. The board also receives appeals from a taxing body that has interest in a decision of the board of review on an assessment made by a local assessment officer.
Agency Resources Employed
FY 2008 FY 2009 FY 2010Actual Enacted Recommended
General Funds 2,260.8 2,280.2 0.0Other State Funds 0.0 0.0 2,524.1
Federal Funds 0.0 0.0 0.0Total 2,260.8 2,280.2 2,524.1
Actual Estimated RecommendedHeadcount (FTE) 26.0 26.0 26.0
Appropriations ($ thousands)Fund Category
MAJOR ACCOMPLISHMENTS • Appeals completed. The board closed
approximately 9,233 residential appeals during calendar year 2008.
KEY BUDGET INITIATIVES • Minimize backlog of property tax appeals.
The board is utilizing available resources to address the backlog of appeals.
• Implement filing fee. Effective July 1, 2009, the
PTAB is recommending the implementation of filing fees to support operations.
PERFORMANCE MEASURES
Estimated ProjectedFY 2006 FY 2007 FY 2008 FY 2009 FY 2010
Assessments appealed 32,239a 17,132 16,630b 28,000 26,000Assessments closed 18,174 18,751 25,329 20,000 20,000
ActualPerformance Metric
a Reflects delayed fi lings from Cook County Board of Review.b Does not reflect all appeals due to docketing backlog.
11 - 61
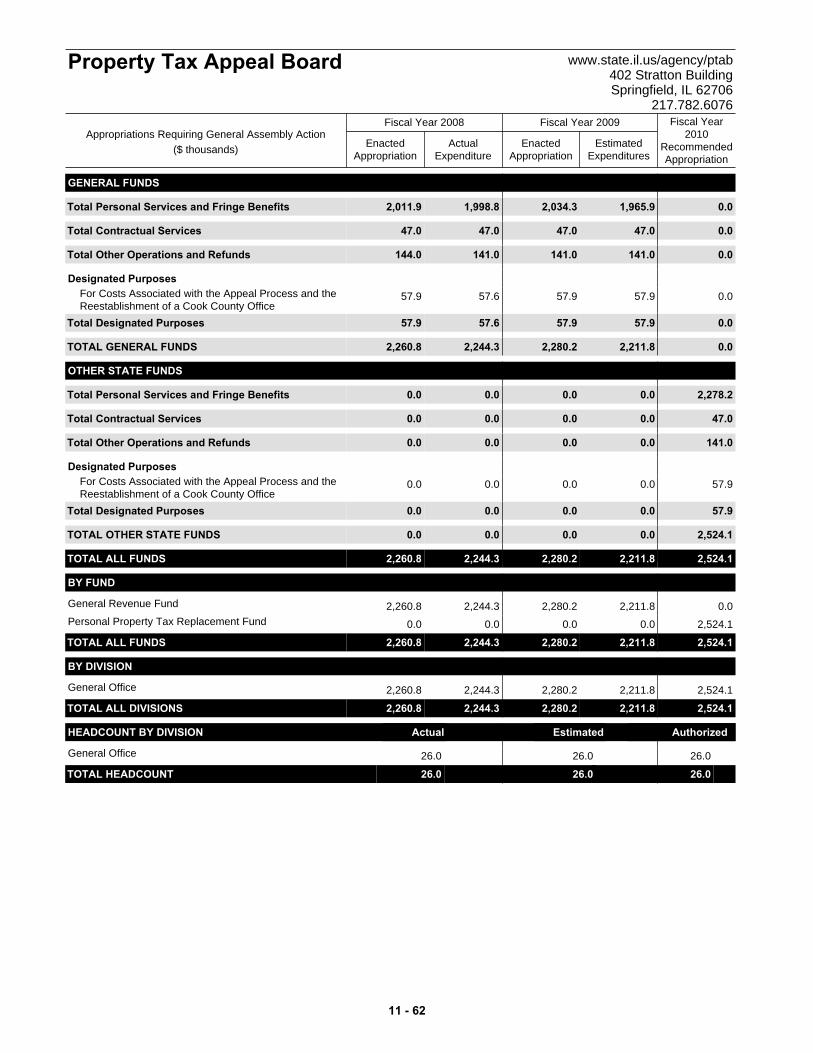
GENERAL FUNDS
Total 2,011.9 0.01,965.92,034.31,998.8Personal Services and Fringe Benefits
Total 47.0 0.047.047.047.0Contractual Services
Total 144.0 0.0141.0141.0141.0Other Operations and Refunds
Designated Purposes57.9 0.057.957.957.6For Costs Associated with the Appeal Process and the
Reestablishment of a Cook County OfficeTotal 57.9 0.057.957.957.6Designated Purposes
TOTAL GENERAL FUNDS 2,260.8 0.02,211.82,280.22,244.3
OTHER STATE FUNDS
Total 0.0 2,278.20.00.00.0Personal Services and Fringe Benefits
Total 0.0 47.00.00.00.0Contractual Services
Total 0.0 141.00.00.00.0Other Operations and Refunds
Designated Purposes0.0 57.90.00.00.0For Costs Associated with the Appeal Process and the
Reestablishment of a Cook County OfficeTotal 0.0 57.90.00.00.0Designated Purposes
TOTAL OTHER STATE FUNDS 0.0 2,524.10.00.00.0
TOTAL ALL FUNDS 2,260.8 2,524.12,211.82,280.22,244.3
BY FUND
2,260.8 0.02,211.82,280.22,244.3General Revenue Fund
0.0 2,524.10.00.00.0Personal Property Tax Replacement Fund
TOTAL ALL FUNDS 2,260.8 2,524.12,211.82,280.22,244.3
BY DIVISION
2,260.8 2,524.12,211.82,280.22,244.3General Office
TOTAL ALL DIVISIONS 2,260.8 2,524.12,211.82,280.22,244.3
HEADCOUNT BY DIVISION Actual Estimated Authorized
26.0 26.026.0General Office
TOTAL HEADCOUNT 26.0 26.026.0 t
ActualExpenditure
EnactedAppropriation
EstimatedExpenditures
EnactedAppropriation
Fiscal Year2010
RecommendedAppropriation
Fiscal Year 2008 Fiscal Year 2009
Property Tax Appeal Board www.state.il.us/agency/ptab402 Stratton BuildingSpringfield, IL 62706
217.782.6076
Appropriations Requiring General Assembly Action($ thousands)
11 - 62

Office Of Executive Inspector General
www.inspectorgeneral.il.gov 32 West Randolph, Suite 1300
Chicago, IL 60601 312.814.5600
OVERVIEW Agency Mission To ensure accountability in state government; receive and fairly investigate complaints of fraud, waste, abuse and misconduct; recommend corrective action, and promote and coordinate the State of Illinois' ethics initiatives for the agencies under its jurisdiction. Strategic Priorities • Investigate in an objective and timely manner all
allegations of waste, fraud, abuse, misconduct and corruption in the entities under its jurisdiction and those who conduct business with them.
• Provide employee ethics training, monitor training compliance, promote reporting of misconduct, and foster communication between employees and appropriate resources when those employees encounter a work-related ethics dilemma.
• Implement enhanced communication procedures to better assist agencies in the prevention of misconduct and ethical violations.
Summary of Agency Operations The Office of Executive Inspector General (OEIG) is an independent state agency established under the State Officials and Employees Ethics Act to investigate reports of alleged violations of laws, rules, regulations and policies on the part of state employees, appointees and officials, and those, such as contractors, who conduct business with the State of Illinois. The OEIG's jurisdiction includes the Office of the Governor, the Office of the Lieutenant Governor, the nine state public universities and all other state agencies, boards, commissions and authorities of the executive branch, except for those under the attorney general, the secretary of state, the comptroller and the treasurer. The OEIG performs rigorous investigations of the allegations it receives from within state government, as well as those received from the general public, in a manner consistent with applicable law, rules and policies. When appropriate, allegations received or evidence uncovered by the OEIG is referred to other investigative agencies; for example, local law enforcement or federal prosecutors.
Agency Resources Employed
FY 2008 FY 2009 FY 2010Actual Enacted Recommended
General Funds 6,931.3 6,931.3 6,931.3Other State Funds 0.0 0.0 0.0
Federal Funds 0.0 0.0 0.0Total 6,931.3 6,931.3 6,931.3
Actual Estimated RecommendedHeadcount (FTE) 61.0 63.0 65.0
Appropriations ($ thousands)Fund Category
MAJOR ACCOMPLISHMENTS • Received approximately 1,247 complaints, the
majority of which came from the public or state employees. During this period, the OEIG concluded 370 investigations of which 106 were founded; 100 were unfounded, and 94 were administratively closed. In each founded case, the OEIG issued a final summary report to the agency involved, to the ultimate jurisdictional authority, and in some cases to outside authorities. Where appropriate, the final report included directives for discipline, rule or policy creation, modifications at the agency level, or for other corrective actions. In addition to the investigations, there were 293 computer forensic exams performed. The OEIG also issued 29 agency recommendation letters aimed at preventing future occurrences of waste, fraud, abuse or misconduct.
• Oversaw the training of more than 166,000
participants from approximately 340 agencies in various ethics courses developed by and administered under the OEIG. Pursuant to the State Officials and Employees Ethics Act, ethics training is a mandatory requirement of all employees, officials and appointees under the jurisdiction of the OEIG, and the OEIG sets the standards and determines the hours and frequency of training necessary for each position or category of positions. Various forms of training are administered, including those delivered through the Internet, as well as paper-based course materials, and courses in Spanish-language and Braille formats. Employee compliance with this requirement currently exceeds 99.9 percent.
11 - 63
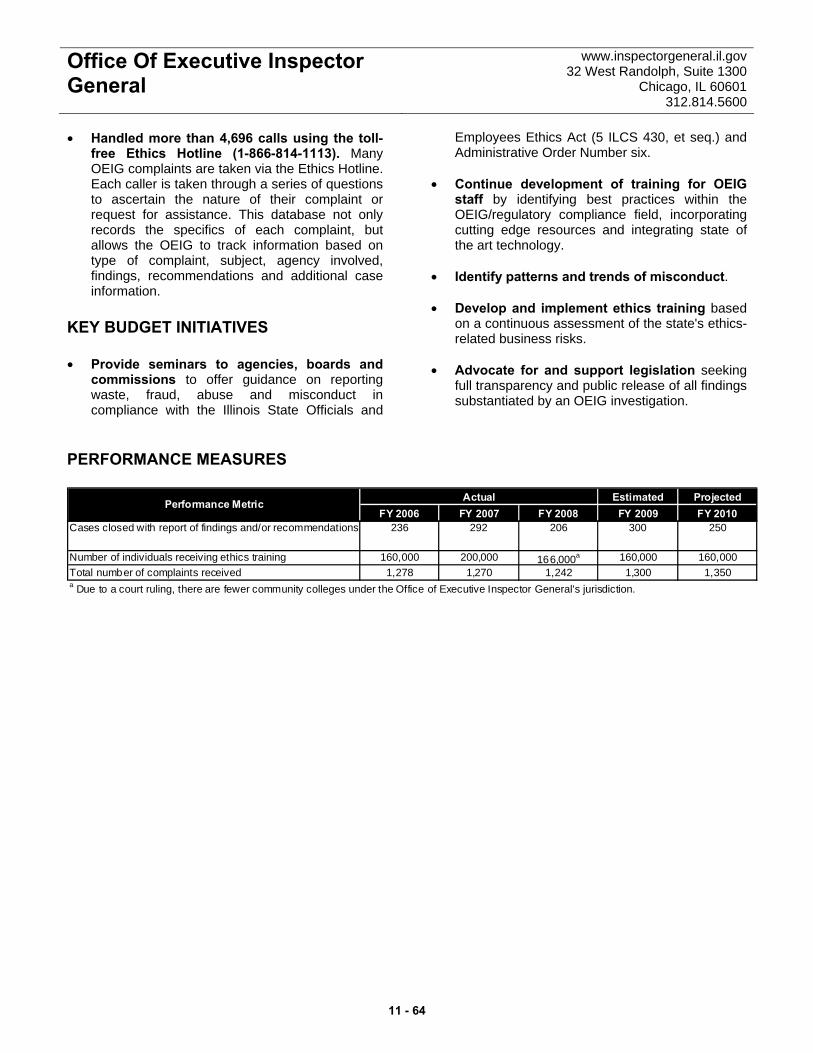
Office Of Executive Inspector General
www.inspectorgeneral.il.gov 32 West Randolph, Suite 1300
Chicago, IL 60601 312.814.5600
• Handled more than 4,696 calls using the toll-free Ethics Hotline (1-866-814-1113). Many OEIG complaints are taken via the Ethics Hotline. Each caller is taken through a series of questions to ascertain the nature of their complaint or request for assistance. This database not only records the specifics of each complaint, but allows the OEIG to track information based on type of complaint, subject, agency involved, findings, recommendations and additional case information.
KEY BUDGET INITIATIVES • Provide seminars to agencies, boards and
commissions to offer guidance on reporting waste, fraud, abuse and misconduct in compliance with the Illinois State Officials and
Employees Ethics Act (5 ILCS 430, et seq.) and Administrative Order Number six.
• Continue development of training for OEIG
staff by identifying best practices within the OEIG/regulatory compliance field, incorporating cutting edge resources and integrating state of the art technology.
• Identify patterns and trends of misconduct. • Develop and implement ethics training based
on a continuous assessment of the state's ethics-related business risks.
• Advocate for and support legislation seeking
full transparency and public release of all findings substantiated by an OEIG investigation.
PERFORMANCE MEASURES
Estimated ProjectedFY 2006 FY 2007 FY 2008 FY 2009 FY 2010
Cases closed with report of findings and/or recommendations 236 292 206 300 250
Number of individuals receiving ethics training 160,000 200,000 166,000a 160,000 160,000Total number of complaints received 1,278 1,270 1,242 1,300 1,350
ActualPerformance Metric
a Due to a court ruling, there are fewer community colleges under the Office of Executive Inspector General's jurisdiction.
11 - 64
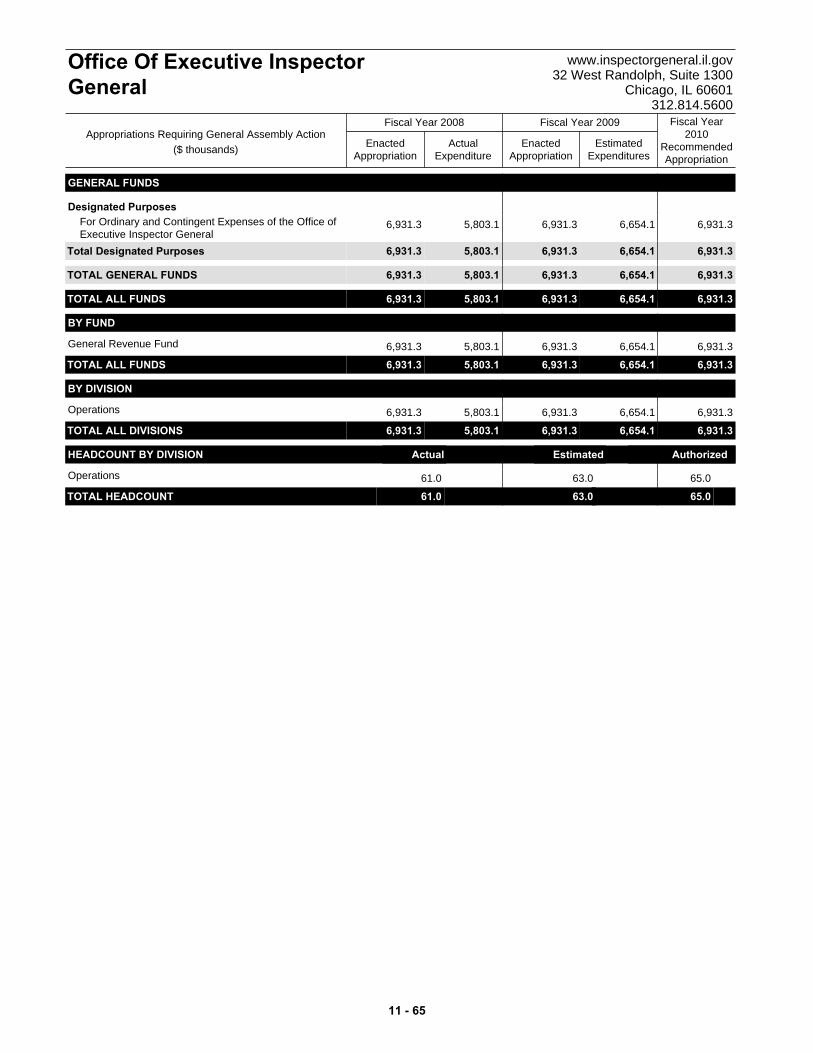
GENERAL FUNDS
Designated Purposes6,931.3 6,931.36,654.16,931.35,803.1For Ordinary and Contingent Expenses of the Office of
Executive Inspector GeneralTotal 6,931.3 6,931.36,654.16,931.35,803.1Designated Purposes
TOTAL GENERAL FUNDS 6,931.3 6,931.36,654.16,931.35,803.1
TOTAL ALL FUNDS 6,931.3 6,931.36,654.16,931.35,803.1
BY FUND
6,931.3 6,931.36,654.16,931.35,803.1General Revenue Fund
TOTAL ALL FUNDS 6,931.3 6,931.36,654.16,931.35,803.1
BY DIVISION
6,931.3 6,931.36,654.16,931.35,803.1Operations
TOTAL ALL DIVISIONS 6,931.3 6,931.36,654.16,931.35,803.1
HEADCOUNT BY DIVISION Actual Estimated Authorized
61.0 65.063.0Operations
TOTAL HEADCOUNT 61.0 65.063.0 t
ActualExpenditure
EnactedAppropriation
EstimatedExpenditures
EnactedAppropriation
Fiscal Year2010
RecommendedAppropriation
Fiscal Year 2008 Fiscal Year 2009
Office Of Executive InspectorGeneral
www.inspectorgeneral.il.gov32 West Randolph, Suite 1300
Chicago, IL 60601312.814.5600
Appropriations Requiring General Assembly Action($ thousands)
11 - 65
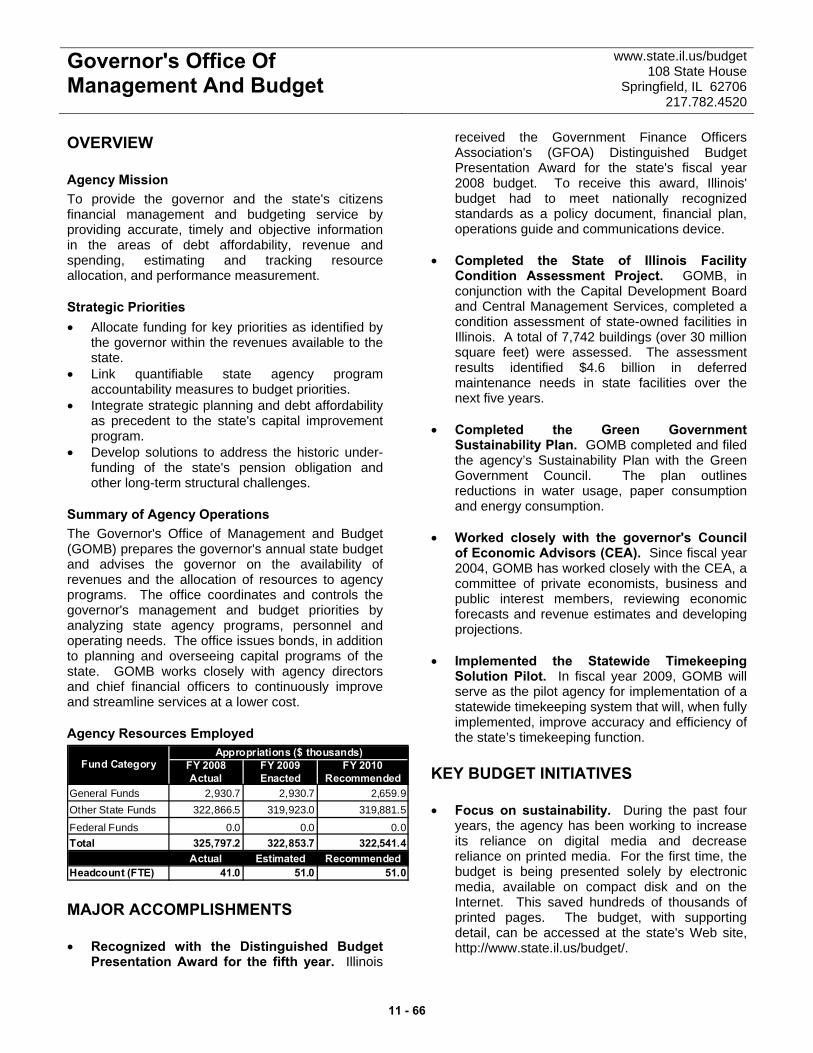
Governor's Office Of Management And Budget
www.state.il.us/budget 108 State House
Springfield, IL 62706 217.782.4520
OVERVIEW
Agency Mission To provide the governor and the state's citizens financial management and budgeting service by providing accurate, timely and objective information in the areas of debt affordability, revenue and spending, estimating and tracking resource allocation, and performance measurement.
Strategic Priorities • Allocate funding for key priorities as identified by
the governor within the revenues available to the state.
• Link quantifiable state agency program accountability measures to budget priorities.
• Integrate strategic planning and debt affordability as precedent to the state's capital improvement program.
• Develop solutions to address the historic under-funding of the state's pension obligation and other long-term structural challenges.
Summary of Agency Operations The Governor's Office of Management and Budget (GOMB) prepares the governor's annual state budget and advises the governor on the availability of revenues and the allocation of resources to agency programs. The office coordinates and controls the governor's management and budget priorities by analyzing state agency programs, personnel and operating needs. The office issues bonds, in addition to planning and overseeing capital programs of the state. GOMB works closely with agency directors and chief financial officers to continuously improve and streamline services at a lower cost.
Agency Resources Employed
FY 2008 FY 2009 FY 2010Actual Enacted Recommended
General Funds 2,930.7 2,930.7 2,659.9Other State Funds 322,866.5 319,923.0 319,881.5
Federal Funds 0.0 0.0 0.0Total 325,797.2 322,853.7 322,541.4
Actual Estimated RecommendedHeadcount (FTE) 41.0 51.0 51.0
Appropriations ($ thousands)Fund Category
MAJOR ACCOMPLISHMENTS • Recognized with the Distinguished Budget
Presentation Award for the fifth year. Illinois
received the Government Finance Officers Association's (GFOA) Distinguished Budget Presentation Award for the state's fiscal year 2008 budget. To receive this award, Illinois' budget had to meet nationally recognized standards as a policy document, financial plan, operations guide and communications device.
• Completed the State of Illinois Facility
Condition Assessment Project. GOMB, in conjunction with the Capital Development Board and Central Management Services, completed a condition assessment of state-owned facilities in Illinois. A total of 7,742 buildings (over 30 million square feet) were assessed. The assessment results identified $4.6 billion in deferred maintenance needs in state facilities over the next five years.
• Completed the Green Government
Sustainability Plan. GOMB completed and filed the agency’s Sustainability Plan with the Green Government Council. The plan outlines reductions in water usage, paper consumption and energy consumption.
• Worked closely with the governor's Council
of Economic Advisors (CEA). Since fiscal year 2004, GOMB has worked closely with the CEA, a committee of private economists, business and public interest members, reviewing economic forecasts and revenue estimates and developing projections.
• Implemented the Statewide Timekeeping
Solution Pilot. In fiscal year 2009, GOMB will serve as the pilot agency for implementation of a statewide timekeeping system that will, when fully implemented, improve accuracy and efficiency of the state’s timekeeping function.
KEY BUDGET INITIATIVES • Focus on sustainability. During the past four
years, the agency has been working to increase its reliance on digital media and decrease reliance on printed media. For the first time, the budget is being presented solely by electronic media, available on compact disk and on the Internet. This saved hundreds of thousands of printed pages. The budget, with supporting detail, can be accessed at the state's Web site, http://www.state.il.us/budget/.
11 - 66
Governor's Office Of Management And Budget
www.state.il.us/budget 108 State House
Springfield, IL 62706 217.782.4520
• Continue long-term planning focus in annual budgets. GOMB again relied on multi-year plans for investment in making annual budget recommendations. This ensures that investments and savings are not just calculated on a one-year basis, but in the context of multi-year policy goals.
• Improve data available for budget and policy
decision-making. GOMB has begun a project, in partnership with a major university, to make existing data about the state’s services available across agencies, greatly improving access to analytic tools that are critical in the decision-making process. In fiscal year 2010, GOMB will lead a pilot project with six state social service agencies to identify characteristics of families that use multiple state services. This will lead to better understanding of major cost drivers in
these programs and to improved service interventions.
• Improve pension funding. GOMB is committed
to developing alternative ways to reduce the state's pension liability, including several new initiatives adopted by the General Assembly, such as requiring that all new pension benefits be accompanied by an identified revenue source at inception.
• Updated and reformatted Capital Budget
Book. The fiscal year 2010 capital budget book has been completely re-done with an emphasis on increasing information available to users and improving the clarity of the presentation. The all-digital format is also more interactive, allowing the user to customize the information they wish to see.
11 - 67
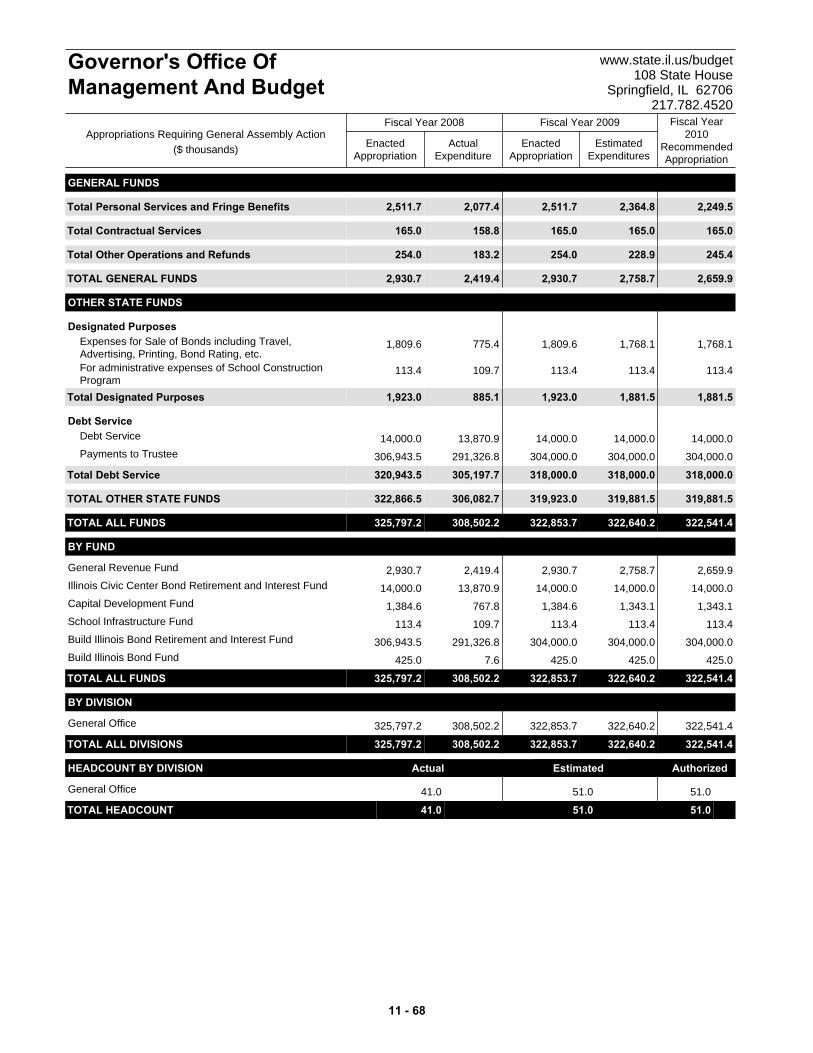
GENERAL FUNDS
Total 2,511.7 2,249.52,364.82,511.72,077.4Personal Services and Fringe Benefits
Total 165.0 165.0165.0165.0158.8Contractual Services
Total 254.0 245.4228.9254.0183.2Other Operations and Refunds
TOTAL GENERAL FUNDS 2,930.7 2,659.92,758.72,930.72,419.4
OTHER STATE FUNDS
Designated Purposes1,809.6 1,768.11,768.11,809.6775.4Expenses for Sale of Bonds including Travel,
Advertising, Printing, Bond Rating, etc.113.4 113.4113.4113.4109.7For administrative expenses of School Construction
ProgramTotal 1,923.0 1,881.51,881.51,923.0885.1Designated Purposes
Debt Service14,000.0 14,000.014,000.014,000.013,870.9Debt Service
306,943.5 304,000.0304,000.0304,000.0291,326.8Payments to Trustee
Total 320,943.5 318,000.0318,000.0318,000.0305,197.7Debt Service
TOTAL OTHER STATE FUNDS 322,866.5 319,881.5319,881.5319,923.0306,082.7
TOTAL ALL FUNDS 325,797.2 322,541.4322,640.2322,853.7308,502.2
BY FUND
2,930.7 2,659.92,758.72,930.72,419.4General Revenue Fund
14,000.0 14,000.014,000.014,000.013,870.9Illinois Civic Center Bond Retirement and Interest Fund
1,384.6 1,343.11,343.11,384.6767.8Capital Development Fund
113.4 113.4113.4113.4109.7School Infrastructure Fund
306,943.5 304,000.0304,000.0304,000.0291,326.8Build Illinois Bond Retirement and Interest Fund
425.0 425.0425.0425.07.6Build Illinois Bond Fund
TOTAL ALL FUNDS 325,797.2 322,541.4322,640.2322,853.7308,502.2
BY DIVISION
325,797.2 322,541.4322,640.2322,853.7308,502.2General Office
TOTAL ALL DIVISIONS 325,797.2 322,541.4322,640.2322,853.7308,502.2
HEADCOUNT BY DIVISION Actual Estimated Authorized
41.0 51.051.0General Office
TOTAL HEADCOUNT 41.0 51.051.0 t
ActualExpenditure
EnactedAppropriation
EstimatedExpenditures
EnactedAppropriation
Fiscal Year2010
RecommendedAppropriation
Fiscal Year 2008 Fiscal Year 2009
Governor's Office OfManagement And Budget
www.state.il.us/budget108 State House
Springfield, IL 62706217.782.4520
Appropriations Requiring General Assembly Action($ thousands)
11 - 68

Capital Development Board www.cdb.state.il.us Stratton Building, Third Floor
Springfield, IL 62706 217.782.2864
OVERVIEW Agency Mission To manage the design and construction of capital projects for the state in a timely, effective, and fiscally and environmentally responsible manner while spreading opportunities among qualified industry partners. To provide construction grants for schools and other entities. Strategic Priorities • Develop cost-saving initiatives, including
controlling contractor overhead and profit rates for change orders, providing value engineering on major projects, and establishing strong error and omission policies.
• Implement “green building” guidelines for all new construction and major renovation.
• Deliver projects on schedule through careful tracking and by requiring an analysis of projects delivered past the projected delivery date.
• Provide accountable project management by requiring complete designs before release for bidding.
• Provide work opportunities for varied industry partners by participating with the Departments of Transportation and Central Management Services in minority opportunity fairs, increasing the number of project labor agreements, providing additional outreach opportunities to promote more minority and female participation and participating in a disparity study.
• Support the state's economic development plan. Summary of Agency Operations As the construction management agency for state government, the Capital Development Board (CDB) oversees the construction of state facilities, such as prisons, universities, mental health hospitals and state parks. In addition, CDB is responsible for renovation and rehabilitation projects at 8,644 state-owned buildings, which contain more than 96 million square feet of floor space. The board also provides construction grants to elementary and secondary schools and other entities.
Agency Resources Employed
FY 2008 FY 2009 FY 2010Actual Enacted Recommended
General Funds 0.0 0.0 0.0Other State Funds 14,181.7 14,276.9 13,077.6
Federal Funds 0.0 0.0 0.0Total 14,181.7 14,276.9 13,077.6
Actual Estimated RecommendedHeadcount (FTE) 125.0 124.0 129.0
Appropriations ($ thousands)Fund Category
MAJOR ACCOMPLISHMENTS • Increased outreach and support to minority
and female businesses and labor. • Increased the installation of project labor
agreements on projects. • Finalized Green Building Guidelines for all new
construction and major renovation. • Compiled a statewide facilities condition
assessment covering nearly 8,000 agency buildings and sites.
• Received awards for the State Emergency
Operations Center, University of Illinois Microelectronics/Nanotechnology Laboratory, Senate chamber renovation and for Pullman Historic Site work.
• Continued work on technology/training centers
and performing arts centers at community colleges and state universities.
• Administered major projects including master
plan for the Stratton Building replacement, Heartland Community College workforce center (CDB's first Leadership in Energy and Environmental Design project), a new academy building at Camp Lincoln, a new armory at Galesburg was constructed to meet Spirit Gold, green standards, Kaskaskia College workforce development center and the Library Storage Facility at the University of Illinois (CDB's first design build project).
• Worked with the industry to complete the
development of rules for design build and implemented rules for design build construction delivery methods.
11 - 69
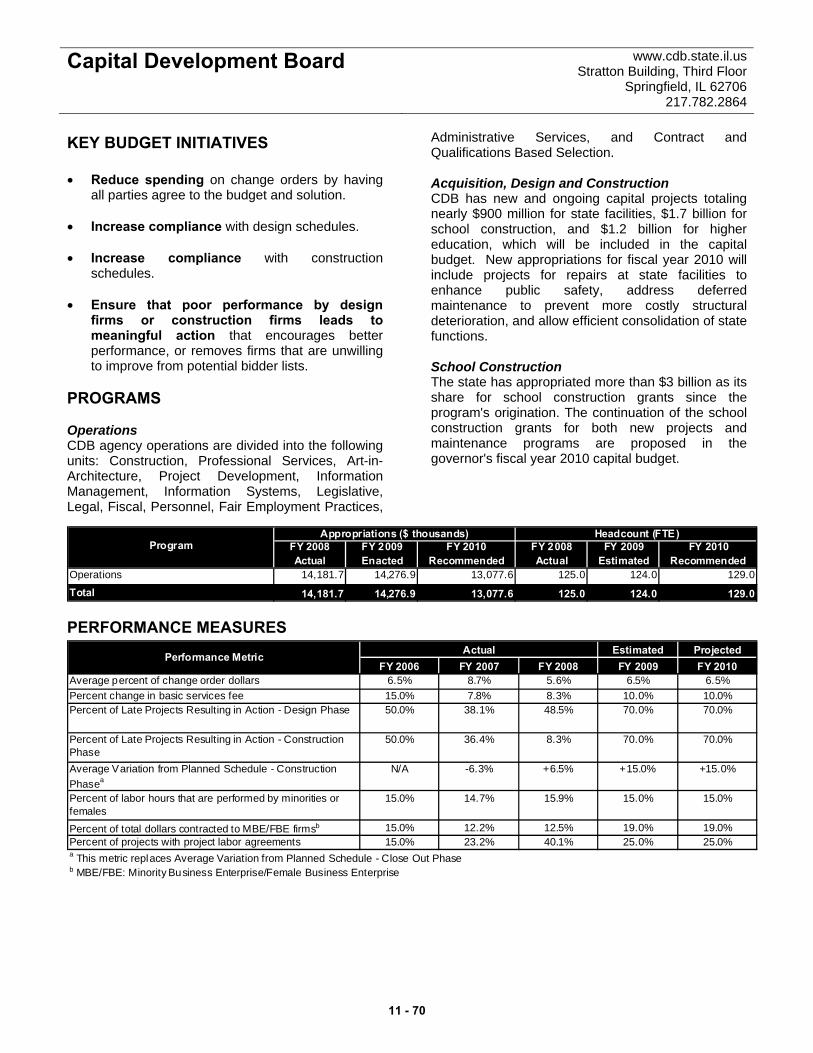
Capital Development Board www.cdb.state.il.us Stratton Building, Third Floor
Springfield, IL 62706 217.782.2864
KEY BUDGET INITIATIVES • Reduce spending on change orders by having
all parties agree to the budget and solution. • Increase compliance with design schedules. • Increase compliance with construction
schedules. • Ensure that poor performance by design
firms or construction firms leads to meaningful action that encourages better performance, or removes firms that are unwilling to improve from potential bidder lists.
PROGRAMS Operations CDB agency operations are divided into the following units: Construction, Professional Services, Art-in-Architecture, Project Development, Information Management, Information Systems, Legislative, Legal, Fiscal, Personnel, Fair Employment Practices,
Administrative Services, and Contract and Qualifications Based Selection. Acquisition, Design and Construction CDB has new and ongoing capital projects totaling nearly $900 million for state facilities, $1.7 billion for school construction, and $1.2 billion for higher education, which will be included in the capital budget. New appropriations for fiscal year 2010 will include projects for repairs at state facilities to enhance public safety, address deferred maintenance to prevent more costly structural deterioration, and allow efficient consolidation of state functions. School Construction The state has appropriated more than $3 billion as its share for school construction grants since the program's origination. The continuation of the school construction grants for both new projects and maintenance programs are proposed in the governor's fiscal year 2010 capital budget.
Program FY 2008 FY 2009 FY 2010 FY 2008 FY 2009 FY 2010Actual Enacted Recommended Actual Estimated Recommended
Operations 14,181.7 14,276.9 13,077.6 125.0 124.0 129.0
Total 14,181.7 14,276.9 13,077.6 125.0 124.0 129.0
Appropriations ($ thousands) Headcount (FTE)
PERFORMANCE MEASURES Estimated Projected
FY 2006 FY 2007 FY 2008 FY 2009 FY 2010Average percent of change order dollars 6.5% 8.7% 5.6% 6.5% 6.5%Percent change in basic services fee 15.0% 7.8% 8.3% 10.0% 10.0%Percent of Late Projects Resulting in Action - Design Phase 50.0% 38.1% 48.5% 70.0% 70.0%
Percent of Late Projects Resulting in Action - Construction Phase
50.0% 36.4% 8.3% 70.0% 70.0%
Average Variation from Planned Schedule - Construction Phasea
N/A -6.3% +6.5% +15.0% +15.0%
Percent of labor hours that are performed by minorities or females
15.0% 14.7% 15.9% 15.0% 15.0%
Percent of total dollars contracted to MBE/FBE firmsb 15.0% 12.2% 12.5% 19.0% 19.0%Percent of projects with project labor agreements 15.0% 23.2% 40.1% 25.0% 25.0%
ActualPerformance Metric
a This metric replaces Average Variation from Planned Schedule - Close Out Phaseb MBE/FBE: Minority Business Enterprise/Female Business Enterprise
11 - 70
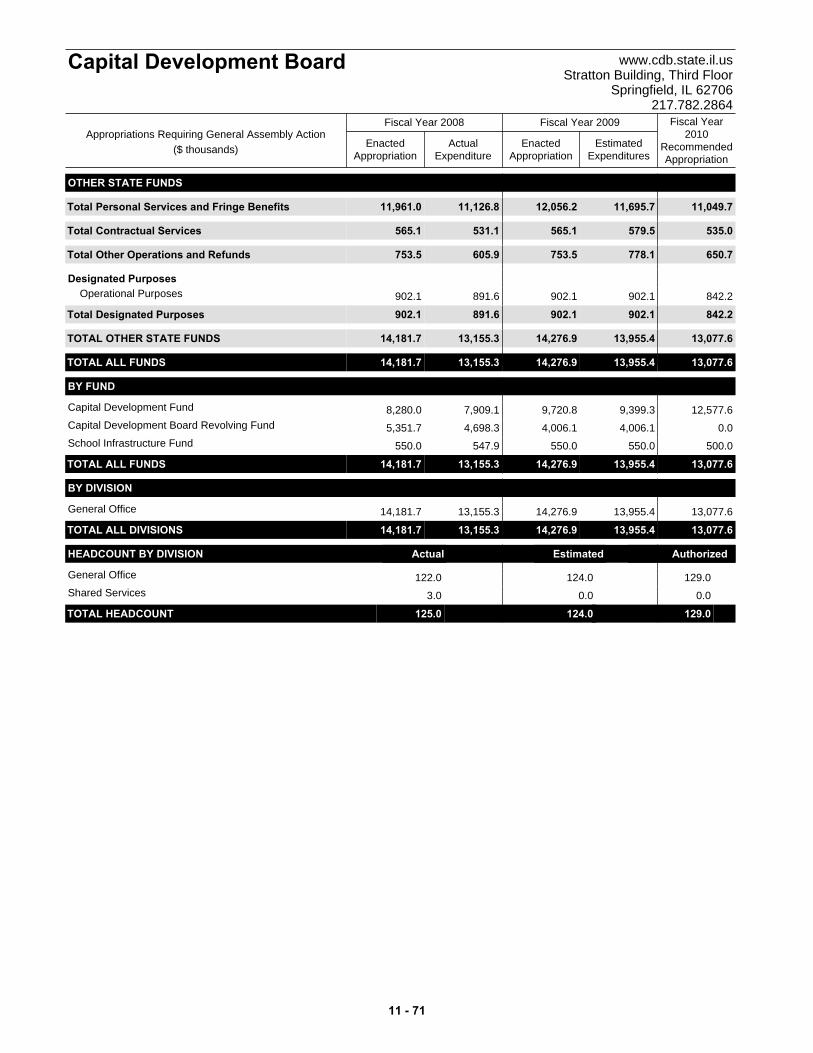
OTHER STATE FUNDS
Total 11,961.0 11,049.711,695.712,056.211,126.8Personal Services and Fringe Benefits
Total 565.1 535.0579.5565.1531.1Contractual Services
Total 753.5 650.7778.1753.5605.9Other Operations and Refunds
Designated Purposes902.1 842.2902.1902.1891.6Operational Purposes
Total 902.1 842.2902.1902.1891.6Designated Purposes
TOTAL OTHER STATE FUNDS 14,181.7 13,077.613,955.414,276.913,155.3
TOTAL ALL FUNDS 14,181.7 13,077.613,955.414,276.913,155.3
BY FUND
8,280.0 12,577.69,399.39,720.87,909.1Capital Development Fund
5,351.7 0.04,006.14,006.14,698.3Capital Development Board Revolving Fund
550.0 500.0550.0550.0547.9School Infrastructure Fund
TOTAL ALL FUNDS 14,181.7 13,077.613,955.414,276.913,155.3
BY DIVISION
14,181.7 13,077.613,955.414,276.913,155.3General Office
TOTAL ALL DIVISIONS 14,181.7 13,077.613,955.414,276.913,155.3
HEADCOUNT BY DIVISION Actual Estimated Authorized
122.0 129.0124.0General Office
3.0 0.00.0Shared Services
TOTAL HEADCOUNT 125.0 129.0124.0 t
ActualExpenditure
EnactedAppropriation
EstimatedExpenditures
EnactedAppropriation
Fiscal Year2010
RecommendedAppropriation
Fiscal Year 2008 Fiscal Year 2009
Capital Development Board www.cdb.state.il.usStratton Building, Third Floor
Springfield, IL 62706217.782.2864
Appropriations Requiring General Assembly Action($ thousands)
11 - 71

Department Of Central Management Services
www.state.il.us/cms 704 Stratton Office Building
Springfield, IL 62706 217.782.2141
OVERVIEW Agency Mission To assist Illinois state agencies and governmental entities with a broad range of administrative responsibilities so that they can focus their energies and resources on accomplishing their core missions. Strategic Priorities • Cost-Effectiveness - Eliminate waste and direct
resources to maximize value. • Accountability - Increase government accountability
and transparency to instill confidence in state government.
• Innovation - Implement advanced technologies and best practices to enhance decision making, improve operational efficiency and sustain the transformation of government.
• Outreach - Intensify efforts to improve access to state employment, increase supplier diversity and encourage economic development of Illinois small and diverse businesses.
• Customer Service - Provide valuable, consistent, and timely service to client and state agencies, the General Assembly and others to assist in the delivery of critical services to Illinois citizens.
Summary of Agency Operations The Department of Central Management Services (CMS) works with state agencies and the General Assembly to deliver critical services to Illinois taxpayers. By bringing private-sector discipline and best practices to its public-sector mission, CMS leads the cost-effective administration of functions including purchasing, real estate, information technology, telecommunications, internal audit and legal services for the state's executive agencies, personnel and benefits for employees and retirees, and the employee and vendor diversity programs. Through the use of sound business principles, CMS is transforming how the business of Illinois government is conducted, reducing waste and maximizing the value of taxpayer dollars.
Agency Resources Employed
FY 2008 FY 2009 FY 2010Actual Enacted Recommended
General Funds 83,920.3 75,652.7 75,039.7Other State Funds 876,200.0 859,858.0 877,867.1
Federal Funds 0.0 0.0 0.0Total 960,120.3 935,510.7 952,906.8
Actual Estimated RecommendedHeadcount (FTE) 1,641.0 1,700.0 1,700.0
Appropriations ($ thousands)Fund Category
MAJOR ACCOMPLISHMENTS • Increased contracting opportunities for small
and diverse businesses. The Sell2Illinois initiative has served to encourage small and diverse companies to become state vendors. Through the Business Enterprise Program (BEP) and Small Business Set-Aside (SBSA) program, CMS has helped small Illinois companies owned by women, minorities and persons with disabilities compete more effectively for state contracts. Since 2005, the number of companies in the SBSA program has increased to more than 5,000, and small firms received a record $81 million in set-aside contracts in fiscal year 2008, a 479 percent increase since the program's inception. CMS has set aside all state procurements valued up to $50,000 for small businesses, and integrated the special programs into the statewide procurement network. CMS now encourages agencies to involve BEP-certified firms in large procurements, which has generated more than $150 million in additional business for diverse companies.
• Increased number of Hispanic and bilingual
state employees. In the third full year of the State Hispanic Employment Plan (HEP), the number of Hispanic employees in state government has continued to increase and has now reached a new all-time high of 2,094 employees. Due to the State Services Assurance Act (effective January 11, 2008) requiring 11 state agencies to increase the number of bilingual frontline staff on-board by 260 positions over their June 30, 2007 levels, 103 Spanish-speaking positions were added. Many of the positions were resourced through the Hispanic Employment Program Coordinator and the coordinator’s staff at CMS. They have been successful in locating qualified Spanish-speaking personnel through job fairs, contacts with Hispanic organizations, and targeted recruitment.
11 - 72
Department Of Central Management Services
www.state.il.us/cms 704 Stratton Office Building
Springfield, IL 62706 217.782.2141
As a result of being required to complete a Hispanic Employment Plan annually and the State Services Assurance Act, state agencies are beginning to realize the importance of maintaining a diverse workforce and are reaching out for assistance when vacancies occur. As of December 15, 2008, 1,782 positions exist with a Spanish-speaking option, which represents an increase of 693 positions (63.3 percent) since the Hispanic Employment Plan requirement began on January 1, 2006.
• Improve information technology efficiency
and enhancements. In 2008, the first phase of the server virtualization and new storage area network projects was completed. CMS successfully migrated over 350 servers to virtualized servers, which reduced power consumption and overall cost along with enhancing performance and reliability of these systems. The agency also implemented a modernized storage area network that provides improved efficiency and reliability. In addition, CMS successfully converted over 5,000 users to a new e-mail platform. This transition lowered overall costs and provided enhanced reliability and performance for users at the Departments of Financial and Professional Regulation, Natural Resources, Public Health, Revenue and Environmental Protection Agency. Adding additional value and efficiencies for our users, CMS also completed the Help Desk and Work Tracking Consolidation. This was a multi-year effort to consolidate the IT work tracking methods of 12 agencies into a single enterprise: Remedy Help Desk & Work Tracking System. This single system provides the foundation for the development of consistent work processes, consistent tracking, and performance and activity reporting.
• Strengthened Homeland Security and local
law enforcement agencies. In fiscal year 2008, CMS obtained a record $7.35 million in surplus federal military equipment for police agencies throughout Illinois. As the statewide coordinator for the national Law Enforcement Support Office (LESO) program, CMS works to direct surplus federal equipment to match the logistical needs of hundreds of state, county and municipal police agencies. In 2008, CMS transferred more than $2.1 million dollars in equipment and property from its warehouse in Springfield to enable smaller police agencies to get vehicles, computers, furniture and other vital equipment
free of charge without making costly and time-consuming treks to federal surplus centers in distant states.
• Increased local government registrations for
the Web-based iBid auction system to enable local governments to sell their surplus equipment online. Since CMS enabled local governments to sell their surplus equipment using the state’s online auction system, more than 38 cities and counties have requested and joined iBid. In 2008, iBid eclipsed a new benchmark record, selling more than 9,250 items and generating more than $2 million in revenue for the state of Illinois.
KEY BUDGET INITIATIVES • Maximize effective leveraging of technology
across government. CMS will continue to implement its multi-year initiative to consolidate the state’s telecommunications and information technology infrastructure in order to combine and standardize IT and telecom services across state agencies, increase efficiencies, upgrade technologies, and reduce unnecessary duplication of hardware, software and personnel resources.
• Increase diversity and access to job
opportunities in state government. The department will continue to advance the Hispanic Employment Plan, increase Diversity Enrichment Program activities, and improve examining system automation to provide better access to job postings.
• Expand “green” initiatives in fleet
management and property management. The department will continue to grow the use of alternative fuels, flexible fueled vehicles and hybrid vehicles in the state’s fleet by double digits over the next several years. The department is also seeking opportunities to bring “green” building standards into construction and leasing programs by incorporating such standards into various facility and service contracts.
• Expand property management space planning
initiatives. The Bureau of Property Management continues to pursue efficiency initiatives designed to improve space utilization and reduce total occupancy cost in state-owned and leased facilities controlled by CMS. CMS has developed
11 - 73
Department Of Central Management Services
www.state.il.us/cms 704 Stratton Office Building
Springfield, IL 62706 217.782.2141
the first statewide, comprehensive consolidated space utilization planning tool, merging actual headcount for buildings with total cost of occupancy data to develop benchmark data, a lease consolidation strategy and a space utilization planning tool. In addition, CMS eliminated 15 leases in 2008 and reduced overall leased square footage by approximately 146,000 square feet or $2.5 million on average. In addition, 36 Chicago-area parking leases were eliminated and consolidated into two comprehensive parking agreements at a significant cost savings.
• Maximize effectiveness of the state's Light
Duty Program. The Risk Management Division, responsible for the Workers' Compensation Program, will be implementing the state's first universal light duty program in fiscal year 2010. This program will allow the state (as the employer) to work with employees and their respective agencies on light duty assignments with the goal of returning as many employees to work as soon as possible.
• Enhancing customer service through
technology improvements. The Bureau of Benefits will be implementing an automated direct pay system in 2009 for all programs within the bureau. This system will provide more user-friendly data entry and inquiry screens, and allow for a more timely billing process. It is estimated that these system improvements will reduce payment processing efforts by 70 percent, and after 6 months of utilization, reduce adjustments and corrections by 90 percent, and research and inquiries by 85 percent.
• Complete programmatic system expansion.
Scheduled for 2009 completion, the Bureau of Benefits will incorporate the state's Commuter Savings Program into the Flexible Spending Program system. This incorporation will allow for better program tracking, and enhanced customer service, and will significantly increase the efficiency and effectiveness of the Commuter Savings Program, making it equal in design and scope to that of the Flexible Spending Program.
PROGRAMS CMS Bureau of Benefits The bureau administers the state's four group insurance plans. While the Department of Healthcare
and Family Services has assumed the responsibilities for claims payment, contract administration and vendor-facing functions for the health, dental and vision benefits offered under these plans, CMS continues to maintain the administrative and member-facing benefit functions for these areas. CMS fully administers and contracts for the life insurance, long-term care, flexible spending and commuter savings programs offered by the state. In addition, the bureau administers the state's deferred compensation, workers' compensation, auto liability, insurance procurement and representation, and indemnification programs. Business Enterprise Program This program certifies businesses that are owned and operated by minorities, women and persons with disabilities, and assists those businesses in bidding for state contracts. Bureau of Communications and Computer Services The bureau manages the planning and delivery of statewide information technology and telecommunications services. It operates central computing facilities, maintains common computer applications and manages the Illinois Century Network, which provides broadband network connectivity to educational institutions and state government. Illinois Office of Communication and Information This office oversees public information officers, graphic design and other critical functions related to communications both within and external to state government. These functions include daily news feeds for radio stations, photography and video services, and a satellite uplink/downlink system for live audio and video feeds. This consolidation fosters better communication among agencies, enabling them to more effectively communicate state programs, services and opportunities to citizens. Illinois Office of Internal Audits This office conducts audits as required for agencies under the governor. The office plans and conducts audits based on a statewide risk assessment designed to assist the governor and his management team in accomplishing their missions and program objectives. Legal Services This program manages legal work related to personnel, procurement, contracts and labor
11 - 74
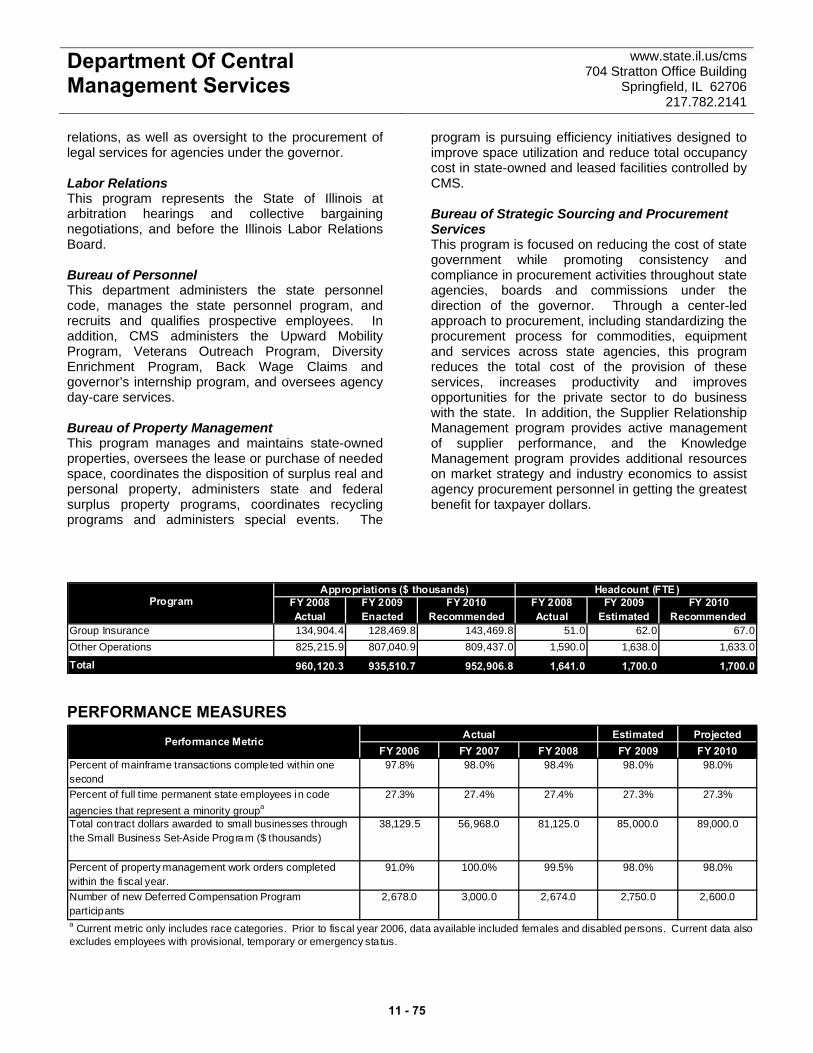
Department Of Central Management Services
www.state.il.us/cms 704 Stratton Office Building
Springfield, IL 62706 217.782.2141
relations, as well as oversight to the procurement of legal services for agencies under the governor. Labor Relations This program represents the State of Illinois at arbitration hearings and collective bargaining negotiations, and before the Illinois Labor Relations Board. Bureau of Personnel This department administers the state personnel code, manages the state personnel program, and recruits and qualifies prospective employees. In addition, CMS administers the Upward Mobility Program, Veterans Outreach Program, Diversity Enrichment Program, Back Wage Claims and governor’s internship program, and oversees agency day-care services. Bureau of Property Management This program manages and maintains state-owned properties, oversees the lease or purchase of needed space, coordinates the disposition of surplus real and personal property, administers state and federal surplus property programs, coordinates recycling programs and administers special events. The
program is pursuing efficiency initiatives designed to improve space utilization and reduce total occupancy cost in state-owned and leased facilities controlled by CMS. Bureau of Strategic Sourcing and Procurement Services This program is focused on reducing the cost of state government while promoting consistency and compliance in procurement activities throughout state agencies, boards and commissions under the direction of the governor. Through a center-led approach to procurement, including standardizing the procurement process for commodities, equipment and services across state agencies, this program reduces the total cost of the provision of these services, increases productivity and improves opportunities for the private sector to do business with the state. In addition, the Supplier Relationship Management program provides active management of supplier performance, and the Knowledge Management program provides additional resources on market strategy and industry economics to assist agency procurement personnel in getting the greatest benefit for taxpayer dollars.
Program FY 2008 FY 2009 FY 2010 FY 2008 FY 2009 FY 2010Actual Enacted Recommended Actual Estimated Recommended
Group Insurance 134,904.4 128,469.8 143,469.8 51.0 62.0 67.0Other Operations 825,215.9 807,040.9 809,437.0 1,590.0 1,638.0 1,633.0
Total 960,120.3 935,510.7 952,906.8 1,641.0 1,700.0 1,700.0
Appropriations ($ thousands) Headcount (FTE)
PERFORMANCE MEASURES Estimated Projected
FY 2006 FY 2007 FY 2008 FY 2009 FY 2010Percent of mainframe transactions completed within one second
97.8% 98.0% 98.4% 98.0% 98.0%
Percent of full time permanent state employees in code agencies that represent a minority groupa
27.3% 27.4% 27.4% 27.3% 27.3%
Total contract dollars awarded to small businesses through the Small Business Set-Aside Program ($ thousands)
38,129.5 56,968.0 81,125.0 85,000.0 89,000.0
Percent of property management work orders completed within the fiscal year.
91.0% 100.0% 99.5% 98.0% 98.0%
Number of new Deferred Compensation Program participants
2,678.0 3,000.0 2,674.0 2,750.0 2,600.0
ActualPerformance Metric
a Current metric only includes race categories. Prior to fiscal year 2006, data available included females and disabled persons. Current data also excludes employees with provisional, temporary or emergency status.
11 - 75
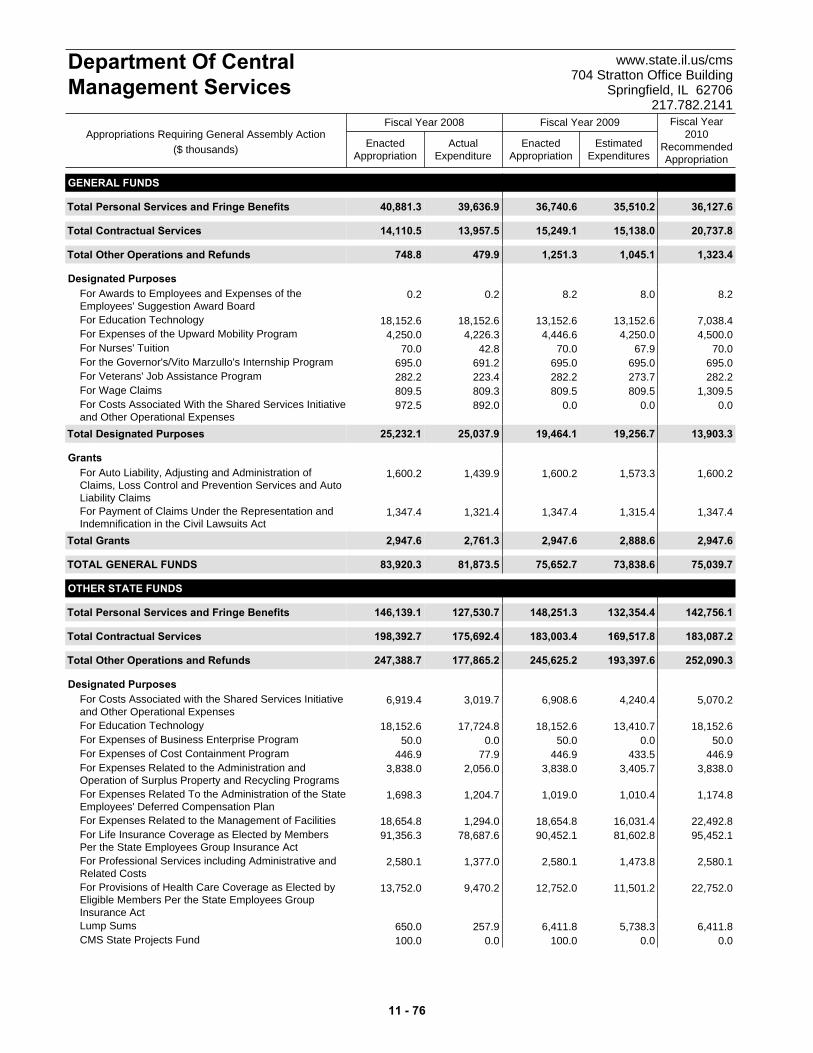
ActualExpenditure
EnactedAppropriation
EstimatedExpenditures
EnactedAppropriation
Fiscal Year2010
RecommendedAppropriation
Fiscal Year 2008 Fiscal Year 2009
Department Of CentralManagement Services
www.state.il.us/cms704 Stratton Office Building
Springfield, IL 62706217.782.2141
Appropriations Requiring General Assembly Action($ thousands)
GENERAL FUNDS
Total 40,881.3 36,127.635,510.236,740.639,636.9Personal Services and Fringe Benefits
Total 14,110.5 20,737.815,138.015,249.113,957.5Contractual Services
Total 748.8 1,323.41,045.11,251.3479.9Other Operations and Refunds
Designated Purposes0.2 8.28.08.20.2For Awards to Employees and Expenses of the
Employees' Suggestion Award Board18,152.6 7,038.413,152.613,152.618,152.6For Education Technology
4,250.0 4,500.04,250.04,446.64,226.3For Expenses of the Upward Mobility Program70.0 70.067.970.042.8For Nurses' Tuition
695.0 695.0695.0695.0691.2For the Governor's/Vito Marzullo's Internship Program282.2 282.2273.7282.2223.4For Veterans' Job Assistance Program809.5 1,309.5809.5809.5809.3For Wage Claims972.5 0.00.00.0892.0For Costs Associated With the Shared Services Initiative
and Other Operational ExpensesTotal 25,232.1 13,903.319,256.719,464.125,037.9Designated Purposes
Grants1,600.2 1,600.21,573.31,600.21,439.9For Auto Liability, Adjusting and Administration of
Claims, Loss Control and Prevention Services and AutoLiability Claims
1,347.4 1,347.41,315.41,347.41,321.4For Payment of Claims Under the Representation andIndemnification in the Civil Lawsuits Act
Total 2,947.6 2,947.62,888.62,947.62,761.3Grants
TOTAL GENERAL FUNDS 83,920.3 75,039.773,838.675,652.781,873.5
OTHER STATE FUNDS
Total 146,139.1 142,756.1132,354.4148,251.3127,530.7Personal Services and Fringe Benefits
Total 198,392.7 183,087.2169,517.8183,003.4175,692.4Contractual Services
Total 247,388.7 252,090.3193,397.6245,625.2177,865.2Other Operations and Refunds
Designated Purposes6,919.4 5,070.24,240.46,908.63,019.7For Costs Associated with the Shared Services Initiative
and Other Operational Expenses18,152.6 18,152.613,410.718,152.617,724.8For Education Technology
50.0 50.00.050.00.0For Expenses of Business Enterprise Program446.9 446.9433.5446.977.9For Expenses of Cost Containment Program
3,838.0 3,838.03,405.73,838.02,056.0For Expenses Related to the Administration andOperation of Surplus Property and Recycling Programs
1,698.3 1,174.81,010.41,019.01,204.7For Expenses Related To the Administration of the StateEmployees' Deferred Compensation Plan
18,654.8 22,492.816,031.418,654.81,294.0For Expenses Related to the Management of Facilities 91,356.3 95,452.181,602.890,452.178,687.6For Life Insurance Coverage as Elected by Members
Per the State Employees Group Insurance Act2,580.1 2,580.11,473.82,580.11,377.0For Professional Services including Administrative and
Related Costs13,752.0 22,752.011,501.212,752.09,470.2For Provisions of Health Care Coverage as Elected by
Eligible Members Per the State Employees GroupInsurance Act
650.0 6,411.85,738.36,411.8257.9Lump Sums100.0 0.00.0100.00.0CMS State Projects Fund
11 - 76
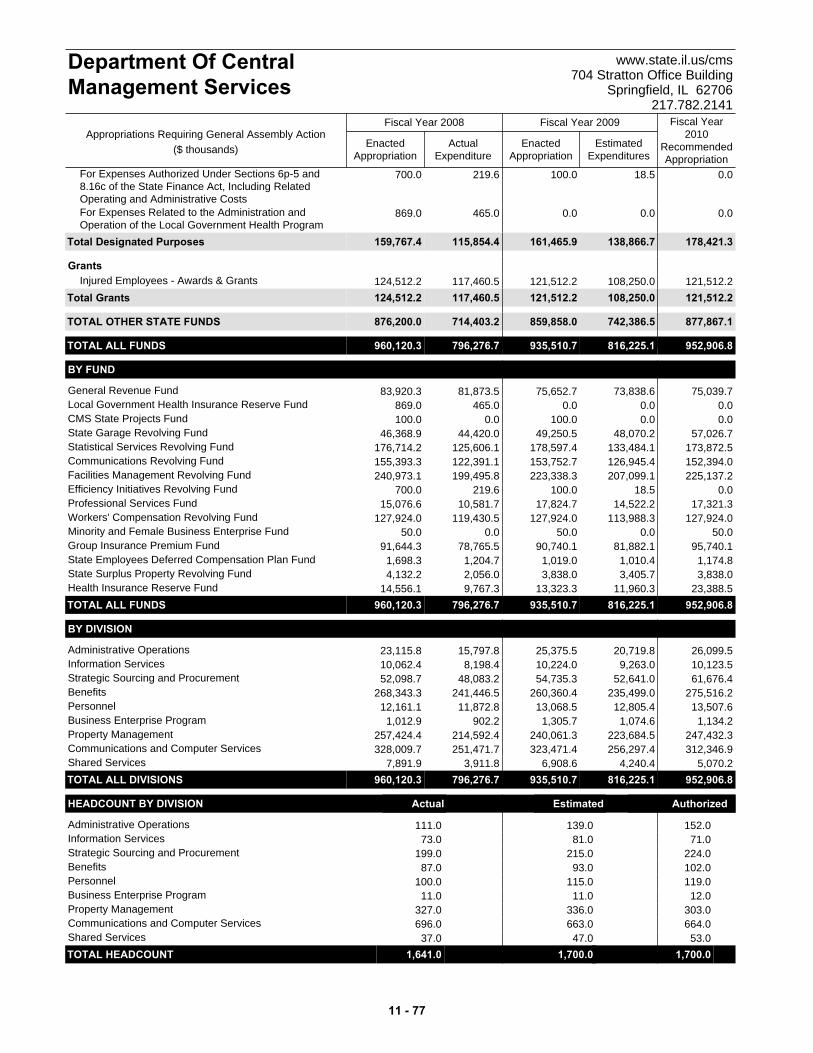
ActualExpenditure
EnactedAppropriation
EstimatedExpenditures
EnactedAppropriation
Fiscal Year2010
RecommendedAppropriation
Fiscal Year 2008 Fiscal Year 2009
Department Of CentralManagement Services
www.state.il.us/cms704 Stratton Office Building
Springfield, IL 62706217.782.2141
Appropriations Requiring General Assembly Action($ thousands)
700.0 0.018.5100.0219.6For Expenses Authorized Under Sections 6p-5 and8.16c of the State Finance Act, Including RelatedOperating and Administrative Costs
869.0 0.00.00.0465.0For Expenses Related to the Administration andOperation of the Local Government Health Program
Total 159,767.4 178,421.3138,866.7161,465.9115,854.4Designated Purposes
Grants124,512.2 121,512.2108,250.0121,512.2117,460.5Injured Employees - Awards & Grants
Total 124,512.2 121,512.2108,250.0121,512.2117,460.5Grants
TOTAL OTHER STATE FUNDS 876,200.0 877,867.1742,386.5859,858.0714,403.2
TOTAL ALL FUNDS 960,120.3 952,906.8816,225.1935,510.7796,276.7
BY FUND
83,920.3 75,039.773,838.675,652.781,873.5General Revenue Fund869.0 0.00.00.0465.0Local Government Health Insurance Reserve Fund100.0 0.00.0100.00.0CMS State Projects Fund
46,368.9 57,026.748,070.249,250.544,420.0State Garage Revolving Fund176,714.2 173,872.5133,484.1178,597.4125,606.1Statistical Services Revolving Fund155,393.3 152,394.0126,945.4153,752.7122,391.1Communications Revolving Fund240,973.1 225,137.2207,099.1223,338.3199,495.8Facilities Management Revolving Fund
700.0 0.018.5100.0219.6Efficiency Initiatives Revolving Fund15,076.6 17,321.314,522.217,824.710,581.7Professional Services Fund
127,924.0 127,924.0113,988.3127,924.0119,430.5Workers' Compensation Revolving Fund50.0 50.00.050.00.0Minority and Female Business Enterprise Fund
91,644.3 95,740.181,882.190,740.178,765.5Group Insurance Premium Fund1,698.3 1,174.81,010.41,019.01,204.7State Employees Deferred Compensation Plan Fund4,132.2 3,838.03,405.73,838.02,056.0State Surplus Property Revolving Fund
14,556.1 23,388.511,960.313,323.39,767.3Health Insurance Reserve FundTOTAL ALL FUNDS 960,120.3 952,906.8816,225.1935,510.7796,276.7
BY DIVISION
23,115.8 26,099.520,719.825,375.515,797.8Administrative Operations10,062.4 10,123.59,263.010,224.08,198.4Information Services52,098.7 61,676.452,641.054,735.348,083.2Strategic Sourcing and Procurement
268,343.3 275,516.2235,499.0260,360.4241,446.5Benefits12,161.1 13,507.612,805.413,068.511,872.8Personnel
1,012.9 1,134.21,074.61,305.7902.2Business Enterprise Program257,424.4 247,432.3223,684.5240,061.3214,592.4Property Management328,009.7 312,346.9256,297.4323,471.4251,471.7Communications and Computer Services
7,891.9 5,070.24,240.46,908.63,911.8Shared ServicesTOTAL ALL DIVISIONS 960,120.3 952,906.8816,225.1935,510.7796,276.7
HEADCOUNT BY DIVISION Actual Estimated Authorized
111.0 152.0139.0Administrative Operations73.0 71.081.0Information Services
199.0 224.0215.0Strategic Sourcing and Procurement87.0 102.093.0Benefits
100.0 119.0115.0Personnel11.0 12.011.0Business Enterprise Program
327.0 303.0336.0Property Management696.0 664.0663.0Communications and Computer Services
37.0 53.047.0Shared ServicesTOTAL HEADCOUNT 1,641.0 1,700.01,700.0 t
11 - 77

Department Of Revenue www.ILtax.com 101 West Jefferson
Springfield, IL 62702 217.785.7570
OVERVIEW Agency Mission To maximize collection of revenues for the state of Illinois, ensure the integrity of the state's wagering activities, and effectively regulate the manufacture, distribution and sale of alcoholic beverages in a manner that promotes fair and consistent enforcement of state laws. Strategic Priorities • Strengthen enforcement. • Enhance efficiency and effectiveness. • Ensure sound revenue and regulatory policies. Summary of Agency Operations The Department of Revenue (DOR) serves as the tax collection agency for state and local governments. The department regulates riverboat gaming and the state's horse racing industry, administers the state's lottery, and regulates the manufacture, distribution and sale of alcoholic beverages. The department oversees local property tax assessments, administers grant program payments for local officials, and functions as the fiscal agent for the Illinois Housing Development Authority. Agency Resources Employed
FY 2008 FY 2009 FY 2010Actual Enacted Recommended
General Funds 158,429.5 162,347.6 153,766.0Other State Funds 1,041,185.4 1,080,066.5 1,024,539.5
Federal Funds 675.0 100.0 346,050.0Total 1,200,289.8 1,242,514.1 1,524,355.5
Actual Estimated RecommendedHeadcount (FTE) 2,053.5 2,132.5 2,179.5
Appropriations ($ thousands)Fund Category
MAJOR ACCOMPLISHMENTS • Completed first two phases of tax system
replacement. In fiscal year 2007, the Department of Revenue embarked upon an initiative to replace its core tax systems, an investment that will generate revenues for state and local governments beyond the five-year life of the project. As planned, in December 2008, the project team successfully implemented the second of four rollouts (individual income tax). Future rollouts are scheduled in the next two
fiscal years to implement the remaining tax and enhance functionality.
• Increased electronic filing options. Web-
based programs were implemented for taxpayers to electronically file Form RG-6 (Energy Assistance Charges for Natural Gas Distributors), Form RPU-6 (Energy Assistance Charges for Electricity Distributors) and Form ST-44 (Illinois Use Tax). The department also implemented enhancements to individual income tax electronic filing programs to enable electronic filing for first-time filers, taxpayers who are changing their filing status, as well as taxpayers who are reporting certain government payments (1099-G). Electronic filing of these returns reduces taxpayer errors, data entry costs, storage costs and backlogs, and increases processing efficiencies.
• Expanded electronic commerce. In fiscal year
2008, 4.9 million taxpayers (28.3 percent) filed their tax returns by electronic means. This was an all-time record and produced substantial savings for the department. Additionally, the department received $20 billion in electronic payments, representing 61.4 percent of tax dollars deposited by the department during the fiscal year. Electronic payments reduce manual processing, accelerate the time to deposit tax payments, and increase interest earnings for the state.
• Increased service to taxpayers. The
department continues to pursue initiatives to increase availability and utilization of taxpayer self-service options. The Taxpayer Services Voice-Response Unit (VRU), the Lottery player hotline, collection bureaus, Springfield VRU and outbound predictive dialer applications were implemented during 2008. In addition to providing automated points of contact, the department hired additional staff for the toll-free taxpayer assistance line. These efforts have helped enhance the level of service provided to taxpayers.
• Increased compliance. During the past year,
the department has incorporated federal and state tax data into its audit data warehouse and identified opportunities to improve audit selection and efficiencies. On-line use of the data warehouse has proven to be successful for the Audit Bureau and Account Processing
11 - 78

Department Of Revenue www.ILtax.com 101 West Jefferson
Springfield, IL 62702 217.785.7570
Administration. This access has significantly increased efficiency. In addition, the sales tax research data has proven to be a very valuable tool that is used to match with the United States Customs data and the Department of Transportation data on airplanes and recreational vehicles. Fiscal year 2008 collections from enforcement efforts exceeded fiscal year 2007 totals by $17.8 million (2.7 percent).
• Increased gaming and lottery receipts. During
fiscal year 2008, lottery sales increased by $57 million or 2.8 percent. Also, the Gaming Board completed the process to re-bid the tenth casino license.
• Increased enforcement and education of
liquor laws. Due to efficiency improvements, the liquor control agents increased the number of inspections conducted by 21.2 percent. The Illinois Liquor Control Commission (ILCC) attended high school and professional sporting events to present information on the dangers of underage drinking as part of the "Don't Be Sorry" awareness campaign.
• Implemented Liquor Direct Wine Shipment
Program. In response to Public Act 95-0634, the department implemented a new program to administer liquor direct wine shipments in advance of the July 1, 2008 deadline. An Internet application has been developed to enable businesses to electronically file and pay their Liquor Direct Wine Shipper returns. Enforcement and processing procedures have also been developed.
• Enhanced tax compliance. In fiscal year 2005,
the department initiated a four-year auditor hiring plan designed to increase overall tax compliance. Audit positions have been hired, trained and continue to work on audits across the country. The department also hired Revenue Tax Specialists (RTS) in the Federal State Exchange unit to enhance tape match programs using IRS data. This audit hiring initiative has been successful and has allowed the department to generate additional revenues for the state. Total audit collections have increased by $79 million. Collections per audit staff have increased by 19 percent since fiscal year 2005.
KEY BUDGET INITIATIVES • Federal recovery. Approximately $346 million in
funds will be available to the department for the Home Investment Partnership Program and the Low-Income Housing Tax Credit Exchange Program, administered by the Illinois Housing Development Authority. This funding will allow for additional capital investments in qualified low-income housing developments and affordable housing developments.
• Continue tax system replacement project. In
fiscal year 2010, DOR will continue to roll out new phases of the project to implement the remaining taxes and enhance functionality. By continuing this initiative, the state will experience a strong return on investment and significantly enhance its revenue position going forward.
• Improve tax compliance. As part of continued
tax compliance enhancements, the department will hire an additional class of 40 auditors by June 2010. This class will increase the total number of auditors hired to 161. The additional positions will improve the department's ability to develop programs and aggressively pursue other additional uncollected tax liability.
• Upgrade the current liquor control system. In
fiscal year 2010, the department will replace its liquor control system, an initiative that will modernize the over 15-year old system, enhance functionality and improve efficiency.
PROGRAMS Tax Administration The Tax Administration program includes the administration and enforcement of 76 state and local tax laws and the allocation of funds to more than 6,600 units of local government. The department processes approximately 17 million tax documents and collects more than $36 billion in taxes each year. Tax Administration program resources also support oversight of the $20 billion local property tax system. Illinois Affordable Housing The department acts as the funding agent for the State Affordable Housing and the Federal Home
11 - 79

Department Of Revenue www.ILtax.com 101 West Jefferson
Springfield, IL 62702 217.785.7570
Investment Partnership programs, both of which are administered by the Illinois Housing Development Authority (IHDA). The department acts on behalf of the authority, receiving the appropriations and processing commitment letters and payout requests each year for grants, mortgages and loans used to provide housing for low-income families. Gaming and Regulation The Gaming and Regulation program resulted from consolidating of the Lottery, Liquor Control
Commission, Racing and Gaming Boards into the department in June 2003. The program includes regulation of riverboat gaming and the state's horse racing industry, administration of the state's lottery programs, and regulation of the manufacture, distribution and sale of alcoholic beverages.
Program FY 2008 FY 2009 FY 2010 FY 2008 FY 2009 FY 2010Actual Enacted Recommended Actual Estimated Recommended
Tax Administration 525,771.6 564,847.3 542,311.5 1,751.5 1,798.5 1,838.5Illinois Affordable Housing 145,081.7 148,400.0 467,250.0 0.0 0.0 0.0Gaming and Regulation 529,436.6 529,266.8 514,794.0 302.0 334.0 341.0
Total 1,200,289.8 1,242,514.1 1,524,355.5 2,053.5 2,132.5 2,179.5
Appropriations ($ thousands) Headcount (FTE)
PERFORMANCE MEASURES Estimated Projected
FY 2006 FY 2007 FY 2008 FY 2009 FY 2010Enforced collections as a percentage of total collections 1.9% 2.1% 1.9% 1.6% 1.7%
Enforced collections per dollar spent ($) 12.5 12.0 10.9 8.6 8.7Audit collections per audit staff ($ thousands) 461.0 611.4 575.7 473.2 474.2Dollars collected as a percent of dollars assessed 62.0% 60.4% 60.5% 60.0% 60.0%Revenue collections per full time equivalent staff ($ thousands)
16,600.0 17,100.0 20,797.0 19,815.4 21,046.6
Revenue collected per dollar spent ($) 192.1 185.3 211.6 178.5 173.6Percent of returns filed electronically 18.5% 21.8% 28.3% 34.7% 41.3%Percent of individual income tax refunds issued in 7 days 47.4% 48.0% 54.7% 59.0% 62.9%
Percent of dollars deposited on same day as receipt 91.7% 89.2% 90.3% 91.0% 92.0%Return on investment in lottery and gaming programs 32.3% 33.2% 31.3% 31.5% 31.5%
ActualPerformance Metric
11 - 80
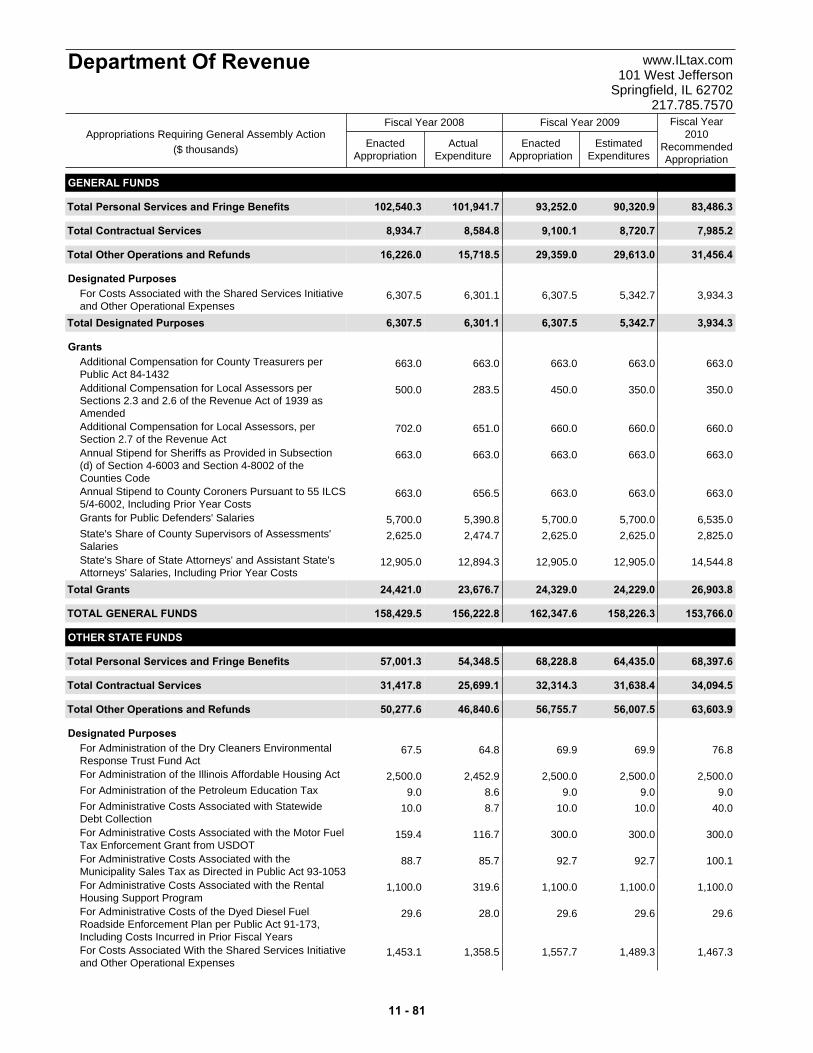
ActualExpenditure
EnactedAppropriation
EstimatedExpenditures
EnactedAppropriation
Fiscal Year2010
RecommendedAppropriation
Fiscal Year 2008 Fiscal Year 2009
Department Of Revenue www.ILtax.com101 West Jefferson
Springfield, IL 62702217.785.7570
Appropriations Requiring General Assembly Action($ thousands)
GENERAL FUNDS
Total 102,540.3 83,486.390,320.993,252.0101,941.7Personal Services and Fringe Benefits
Total 8,934.7 7,985.28,720.79,100.18,584.8Contractual Services
Total 16,226.0 31,456.429,613.029,359.015,718.5Other Operations and Refunds
Designated Purposes6,307.5 3,934.35,342.76,307.56,301.1For Costs Associated with the Shared Services Initiative
and Other Operational ExpensesTotal 6,307.5 3,934.35,342.76,307.56,301.1Designated Purposes
Grants663.0 663.0663.0663.0663.0Additional Compensation for County Treasurers per
Public Act 84-1432500.0 350.0350.0450.0283.5Additional Compensation for Local Assessors per
Sections 2.3 and 2.6 of the Revenue Act of 1939 asAmended
702.0 660.0660.0660.0651.0Additional Compensation for Local Assessors, perSection 2.7 of the Revenue Act
663.0 663.0663.0663.0663.0Annual Stipend for Sheriffs as Provided in Subsection(d) of Section 4-6003 and Section 4-8002 of theCounties Code
663.0 663.0663.0663.0656.5Annual Stipend to County Coroners Pursuant to 55 ILCS5/4-6002, Including Prior Year Costs
5,700.0 6,535.05,700.05,700.05,390.8Grants for Public Defenders' Salaries
2,625.0 2,825.02,625.02,625.02,474.7State's Share of County Supervisors of Assessments'Salaries
12,905.0 14,544.812,905.012,905.012,894.3State's Share of State Attorneys' and Assistant State'sAttorneys' Salaries, Including Prior Year Costs
Total 24,421.0 26,903.824,229.024,329.023,676.7Grants
TOTAL GENERAL FUNDS 158,429.5 153,766.0158,226.3162,347.6156,222.8
OTHER STATE FUNDS
Total 57,001.3 68,397.664,435.068,228.854,348.5Personal Services and Fringe Benefits
Total 31,417.8 34,094.531,638.432,314.325,699.1Contractual Services
Total 50,277.6 63,603.956,007.556,755.746,840.6Other Operations and Refunds
Designated Purposes67.5 76.869.969.964.8For Administration of the Dry Cleaners Environmental
Response Trust Fund Act2,500.0 2,500.02,500.02,500.02,452.9For Administration of the Illinois Affordable Housing Act
9.0 9.09.09.08.6For Administration of the Petroleum Education Tax
10.0 40.010.010.08.7For Administrative Costs Associated with StatewideDebt Collection
159.4 300.0300.0300.0116.7For Administrative Costs Associated with the Motor FuelTax Enforcement Grant from USDOT
88.7 100.192.792.785.7For Administrative Costs Associated with theMunicipality Sales Tax as Directed in Public Act 93-1053
1,100.0 1,100.01,100.01,100.0319.6For Administrative Costs Associated with the RentalHousing Support Program
29.6 29.629.629.628.0For Administrative Costs of the Dyed Diesel FuelRoadside Enforcement Plan per Public Act 91-173,Including Costs Incurred in Prior Fiscal Years
1,453.1 1,467.31,489.31,557.71,358.5For Costs Associated With the Shared Services Initiativeand Other Operational Expenses
11 - 81
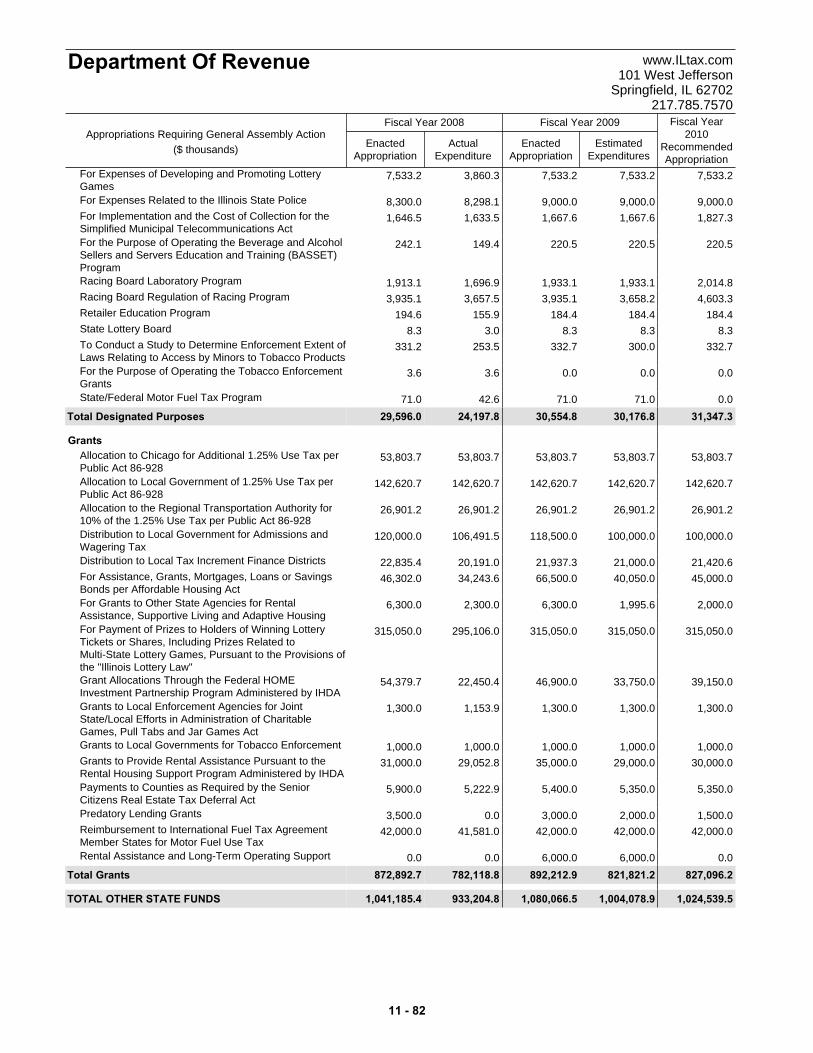
ActualExpenditure
EnactedAppropriation
EstimatedExpenditures
EnactedAppropriation
Fiscal Year2010
RecommendedAppropriation
Fiscal Year 2008 Fiscal Year 2009
Department Of Revenue www.ILtax.com101 West Jefferson
Springfield, IL 62702217.785.7570
Appropriations Requiring General Assembly Action($ thousands)
7,533.2 7,533.27,533.27,533.23,860.3For Expenses of Developing and Promoting LotteryGames
8,300.0 9,000.09,000.09,000.08,298.1For Expenses Related to the Illinois State Police
1,646.5 1,827.31,667.61,667.61,633.5For Implementation and the Cost of Collection for theSimplified Municipal Telecommunications Act
242.1 220.5220.5220.5149.4For the Purpose of Operating the Beverage and AlcoholSellers and Servers Education and Training (BASSET)Program
1,913.1 2,014.81,933.11,933.11,696.9Racing Board Laboratory Program
3,935.1 4,603.33,658.23,935.13,657.5Racing Board Regulation of Racing Program
194.6 184.4184.4184.4155.9Retailer Education Program
8.3 8.38.38.33.0State Lottery Board
331.2 332.7300.0332.7253.5To Conduct a Study to Determine Enforcement Extent ofLaws Relating to Access by Minors to Tobacco Products
3.6 0.00.00.03.6For the Purpose of Operating the Tobacco EnforcementGrants
71.0 0.071.071.042.6State/Federal Motor Fuel Tax Program
Total 29,596.0 31,347.330,176.830,554.824,197.8Designated Purposes
Grants53,803.7 53,803.753,803.753,803.753,803.7Allocation to Chicago for Additional 1.25% Use Tax per
Public Act 86-928142,620.7 142,620.7142,620.7142,620.7142,620.7Allocation to Local Government of 1.25% Use Tax per
Public Act 86-92826,901.2 26,901.226,901.226,901.226,901.2Allocation to the Regional Transportation Authority for
10% of the 1.25% Use Tax per Public Act 86-928120,000.0 100,000.0100,000.0118,500.0106,491.5Distribution to Local Government for Admissions and
Wagering Tax22,835.4 21,420.621,000.021,937.320,191.0Distribution to Local Tax Increment Finance Districts
46,302.0 45,000.040,050.066,500.034,243.6For Assistance, Grants, Mortgages, Loans or SavingsBonds per Affordable Housing Act
6,300.0 2,000.01,995.66,300.02,300.0For Grants to Other State Agencies for RentalAssistance, Supportive Living and Adaptive Housing
315,050.0 315,050.0315,050.0315,050.0295,106.0For Payment of Prizes to Holders of Winning LotteryTickets or Shares, Including Prizes Related toMulti-State Lottery Games, Pursuant to the Provisions ofthe "Illinois Lottery Law"
54,379.7 39,150.033,750.046,900.022,450.4Grant Allocations Through the Federal HOMEInvestment Partnership Program Administered by IHDA
1,300.0 1,300.01,300.01,300.01,153.9Grants to Local Enforcement Agencies for JointState/Local Efforts in Administration of CharitableGames, Pull Tabs and Jar Games Act
1,000.0 1,000.01,000.01,000.01,000.0Grants to Local Governments for Tobacco Enforcement
31,000.0 30,000.029,000.035,000.029,052.8Grants to Provide Rental Assistance Pursuant to theRental Housing Support Program Administered by IHDA
5,900.0 5,350.05,350.05,400.05,222.9Payments to Counties as Required by the SeniorCitizens Real Estate Tax Deferral Act
3,500.0 1,500.02,000.03,000.00.0Predatory Lending Grants
42,000.0 42,000.042,000.042,000.041,581.0Reimbursement to International Fuel Tax AgreementMember States for Motor Fuel Use Tax
0.0 0.06,000.06,000.00.0Rental Assistance and Long-Term Operating Support
Total 872,892.7 827,096.2821,821.2892,212.9782,118.8Grants
TOTAL OTHER STATE FUNDS 1,041,185.4 1,024,539.51,004,078.91,080,066.5933,204.8
11 - 82
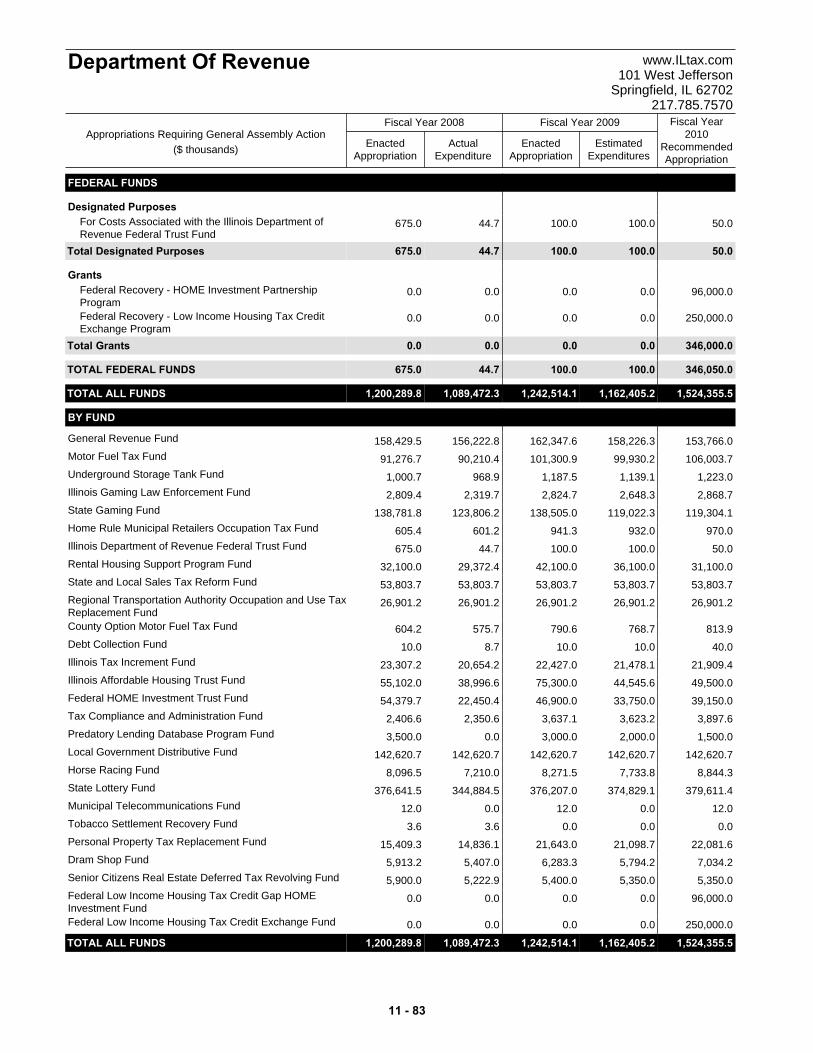
ActualExpenditure
EnactedAppropriation
EstimatedExpenditures
EnactedAppropriation
Fiscal Year2010
RecommendedAppropriation
Fiscal Year 2008 Fiscal Year 2009
Department Of Revenue www.ILtax.com101 West Jefferson
Springfield, IL 62702217.785.7570
Appropriations Requiring General Assembly Action($ thousands)
FEDERAL FUNDS
Designated Purposes675.0 50.0100.0100.044.7For Costs Associated with the Illinois Department of
Revenue Federal Trust FundTotal 675.0 50.0100.0100.044.7Designated Purposes
Grants0.0 96,000.00.00.00.0Federal Recovery - HOME Investment Partnership
Program0.0 250,000.00.00.00.0Federal Recovery - Low Income Housing Tax Credit
Exchange ProgramTotal 0.0 346,000.00.00.00.0Grants
TOTAL FEDERAL FUNDS 675.0 346,050.0100.0100.044.7
TOTAL ALL FUNDS 1,200,289.8 1,524,355.51,162,405.21,242,514.11,089,472.3
BY FUND
158,429.5 153,766.0158,226.3162,347.6156,222.8General Revenue Fund
91,276.7 106,003.799,930.2101,300.990,210.4Motor Fuel Tax Fund
1,000.7 1,223.01,139.11,187.5968.9Underground Storage Tank Fund
2,809.4 2,868.72,648.32,824.72,319.7Illinois Gaming Law Enforcement Fund
138,781.8 119,304.1119,022.3138,505.0123,806.2State Gaming Fund
605.4 970.0932.0941.3601.2Home Rule Municipal Retailers Occupation Tax Fund
675.0 50.0100.0100.044.7Illinois Department of Revenue Federal Trust Fund
32,100.0 31,100.036,100.042,100.029,372.4Rental Housing Support Program Fund
53,803.7 53,803.753,803.753,803.753,803.7State and Local Sales Tax Reform Fund
26,901.2 26,901.226,901.226,901.226,901.2Regional Transportation Authority Occupation and Use TaxReplacement Fund
604.2 813.9768.7790.6575.7County Option Motor Fuel Tax Fund
10.0 40.010.010.08.7Debt Collection Fund
23,307.2 21,909.421,478.122,427.020,654.2Illinois Tax Increment Fund
55,102.0 49,500.044,545.675,300.038,996.6Illinois Affordable Housing Trust Fund
54,379.7 39,150.033,750.046,900.022,450.4Federal HOME Investment Trust Fund
2,406.6 3,897.63,623.23,637.12,350.6Tax Compliance and Administration Fund
3,500.0 1,500.02,000.03,000.00.0Predatory Lending Database Program Fund
142,620.7 142,620.7142,620.7142,620.7142,620.7Local Government Distributive Fund
8,096.5 8,844.37,733.88,271.57,210.0Horse Racing Fund
376,641.5 379,611.4374,829.1376,207.0344,884.5State Lottery Fund
12.0 12.00.012.00.0Municipal Telecommunications Fund
3.6 0.00.00.03.6Tobacco Settlement Recovery Fund
15,409.3 22,081.621,098.721,643.014,836.1Personal Property Tax Replacement Fund
5,913.2 7,034.25,794.26,283.35,407.0Dram Shop Fund
5,900.0 5,350.05,350.05,400.05,222.9Senior Citizens Real Estate Deferred Tax Revolving Fund
0.0 96,000.00.00.00.0Federal Low Income Housing Tax Credit Gap HOMEInvestment Fund
0.0 250,000.00.00.00.0Federal Low Income Housing Tax Credit Exchange Fund
TOTAL ALL FUNDS 1,200,289.8 1,524,355.51,162,405.21,242,514.11,089,472.3
11 - 83
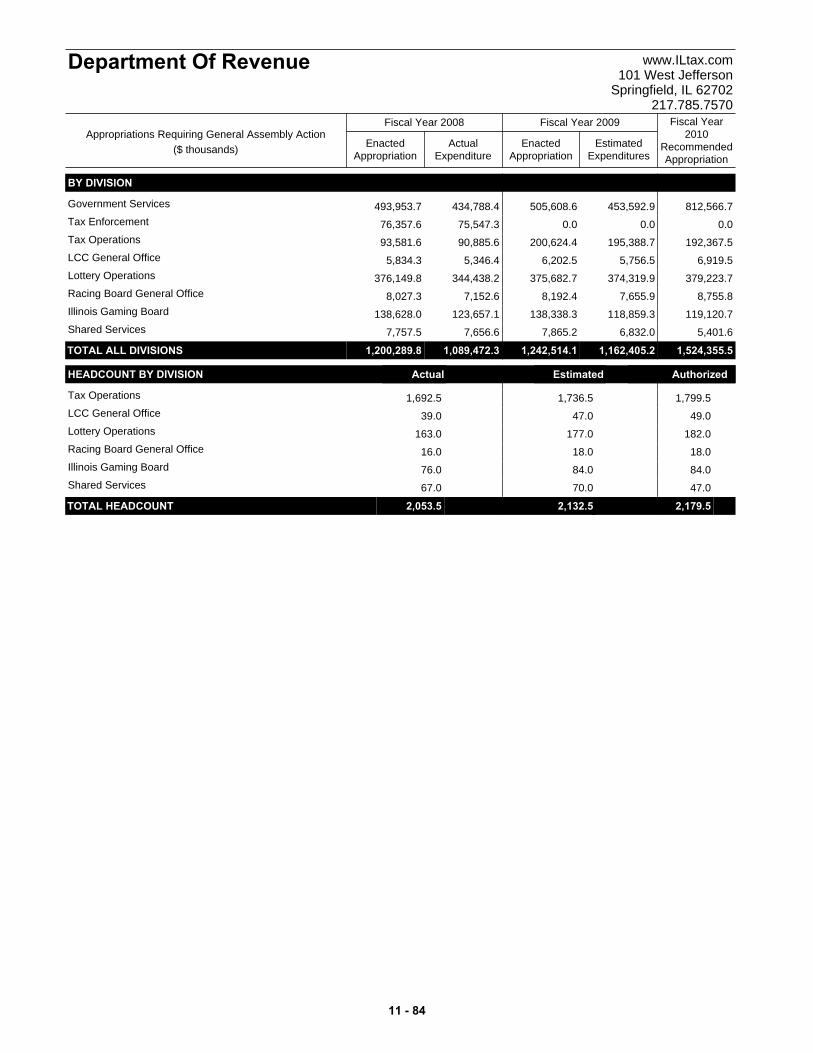
ActualExpenditure
EnactedAppropriation
EstimatedExpenditures
EnactedAppropriation
Fiscal Year2010
RecommendedAppropriation
Fiscal Year 2008 Fiscal Year 2009
Department Of Revenue www.ILtax.com101 West Jefferson
Springfield, IL 62702217.785.7570
Appropriations Requiring General Assembly Action($ thousands)
BY DIVISION
493,953.7 812,566.7453,592.9505,608.6434,788.4Government Services
76,357.6 0.00.00.075,547.3Tax Enforcement
93,581.6 192,367.5195,388.7200,624.490,885.6Tax Operations
5,834.3 6,919.55,756.56,202.55,346.4LCC General Office
376,149.8 379,223.7374,319.9375,682.7344,438.2Lottery Operations
8,027.3 8,755.87,655.98,192.47,152.6Racing Board General Office
138,628.0 119,120.7118,859.3138,338.3123,657.1Illinois Gaming Board
7,757.5 5,401.66,832.07,865.27,656.6Shared Services
TOTAL ALL DIVISIONS 1,200,289.8 1,524,355.51,162,405.21,242,514.11,089,472.3
HEADCOUNT BY DIVISION Actual Estimated Authorized
1,692.5 1,799.51,736.5Tax Operations
39.0 49.047.0LCC General Office
163.0 182.0177.0Lottery Operations
16.0 18.018.0Racing Board General Office
76.0 84.084.0Illinois Gaming Board
67.0 47.070.0Shared Services
TOTAL HEADCOUNT 2,053.5 2,179.52,132.5 t
11 - 84
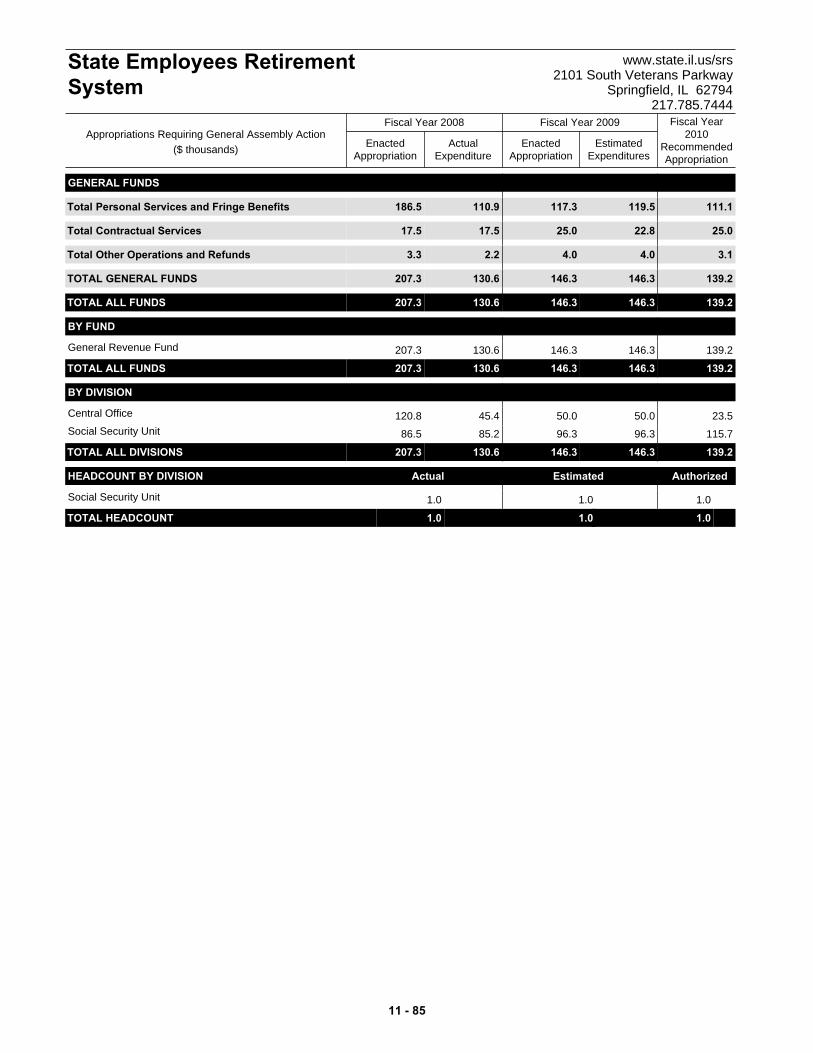
GENERAL FUNDS
Total 186.5 111.1119.5117.3110.9Personal Services and Fringe Benefits
Total 17.5 25.022.825.017.5Contractual Services
Total 3.3 3.14.04.02.2Other Operations and Refunds
TOTAL GENERAL FUNDS 207.3 139.2146.3146.3130.6
TOTAL ALL FUNDS 207.3 139.2146.3146.3130.6
BY FUND
207.3 139.2146.3146.3130.6General Revenue Fund
TOTAL ALL FUNDS 207.3 139.2146.3146.3130.6
BY DIVISION
120.8 23.550.050.045.4Central Office
86.5 115.796.396.385.2Social Security Unit
TOTAL ALL DIVISIONS 207.3 139.2146.3146.3130.6
HEADCOUNT BY DIVISION Actual Estimated Authorized
1.0 1.01.0Social Security Unit
TOTAL HEADCOUNT 1.0 1.01.0 t
ActualExpenditure
EnactedAppropriation
EstimatedExpenditures
EnactedAppropriation
Fiscal Year2010
RecommendedAppropriation
Fiscal Year 2008 Fiscal Year 2009
State Employees RetirementSystem
www.state.il.us/srs2101 South Veterans Parkway
Springfield, IL 62794217.785.7444
Appropriations Requiring General Assembly Action($ thousands)
11 - 85

11 - 86

DEBT MANAGEMENT
www.state.il.us/budget
CHAPTER 12

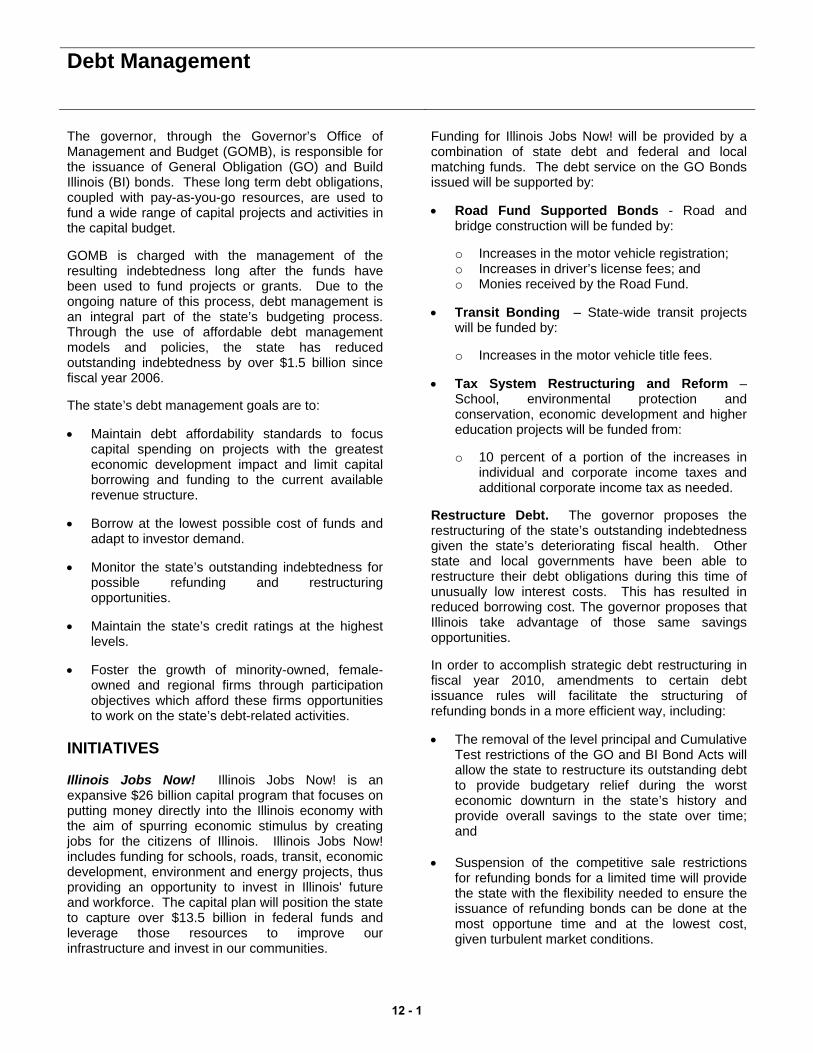
Debt Management
The governor, through the Governor’s Office of Management and Budget (GOMB), is responsible for the issuance of General Obligation (GO) and Build Illinois (BI) bonds. These long term debt obligations, coupled with pay-as-you-go resources, are used to fund a wide range of capital projects and activities in the capital budget. GOMB is charged with the management of the resulting indebtedness long after the funds have been used to fund projects or grants. Due to the ongoing nature of this process, debt management is an integral part of the state’s budgeting process. Through the use of affordable debt management models and policies, the state has reduced outstanding indebtedness by over $1.5 billion since fiscal year 2006. The state’s debt management goals are to: • Maintain debt affordability standards to focus
capital spending on projects with the greatest economic development impact and limit capital borrowing and funding to the current available revenue structure.
• Borrow at the lowest possible cost of funds and
adapt to investor demand. • Monitor the state’s outstanding indebtedness for
possible refunding and restructuring opportunities.
• Maintain the state’s credit ratings at the highest
levels. • Foster the growth of minority-owned, female-
owned and regional firms through participation objectives which afford these firms opportunities to work on the state’s debt-related activities.
INITIATIVES Illinois Jobs Now! Illinois Jobs Now! is an expansive $26 billion capital program that focuses on putting money directly into the Illinois economy with the aim of spurring economic stimulus by creating jobs for the citizens of Illinois. Illinois Jobs Now! includes funding for schools, roads, transit, economic development, environment and energy projects, thus providing an opportunity to invest in Illinois' future and workforce. The capital plan will position the state to capture over $13.5 billion in federal funds and leverage those resources to improve our infrastructure and invest in our communities.
Funding for Illinois Jobs Now! will be provided by a combination of state debt and federal and local matching funds. The debt service on the GO Bonds issued will be supported by: • Road Fund Supported Bonds - Road and
bridge construction will be funded by:
o Increases in the motor vehicle registration; o Increases in driver’s license fees; and o Monies received by the Road Fund.
• Transit Bonding – State-wide transit projects will be funded by:
o Increases in the motor vehicle title fees.
• Tax System Restructuring and Reform – School, environmental protection and conservation, economic development and higher education projects will be funded from:
o 10 percent of a portion of the increases in
individual and corporate income taxes and additional corporate income tax as needed.
Restructure Debt. The governor proposes the restructuring of the state’s outstanding indebtedness given the state’s deteriorating fiscal health. Other state and local governments have been able to restructure their debt obligations during this time of unusually low interest costs. This has resulted in reduced borrowing cost. The governor proposes that Illinois take advantage of those same savings opportunities. In order to accomplish strategic debt restructuring in fiscal year 2010, amendments to certain debt issuance rules will facilitate the structuring of refunding bonds in a more efficient way, including: • The removal of the level principal and Cumulative
Test restrictions of the GO and BI Bond Acts will allow the state to restructure its outstanding debt to provide budgetary relief during the worst economic downturn in the state’s history and provide overall savings to the state over time; and
• Suspension of the competitive sale restrictions
for refunding bonds for a limited time will provide the state with the flexibility needed to ensure the issuance of refunding bonds can be done at the most opportune time and at the lowest cost, given turbulent market conditions.
12 - 1
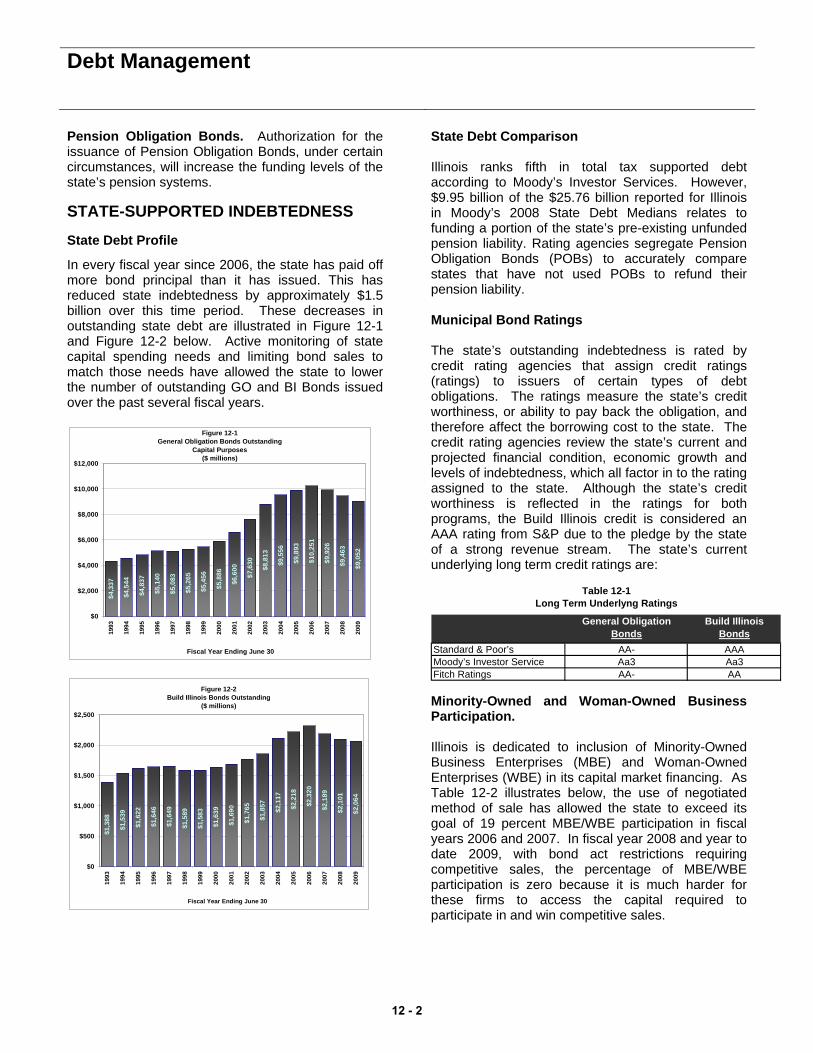
Debt Management
Pension Obligation Bonds. Authorization for the issuance of Pension Obligation Bonds, under certain circumstances, will increase the funding levels of the state’s pension systems. STATE-SUPPORTED INDEBTEDNESS State Debt Profile
In every fiscal year since 2006, the state has paid off more bond principal than it has issued. This has reduced state indebtedness by approximately $1.5 billion over this time period. These decreases in outstanding state debt are illustrated in Figure 12-1 and Figure 12-2 below. Active monitoring of state capital spending needs and limiting bond sales to match those needs have allowed the state to lower the number of outstanding GO and BI Bonds issued over the past several fiscal years.
Figure 12-1General Obligation Bonds Outstanding
Capital Purposes($ millions)
$4,3
37
$4,5
44
$4,8
37
$5,1
40
$5,0
83
$5,2
65
$5,4
56
$5,8
86
$6,6
00
$7,6
30
$8,8
13
$9,5
56
$9,8
93
$10,
251
$9,9
26
$9,4
63
$9,0
52
$0
$2,000
$4,000
$6,000
$8,000
$10,000
$12,000
1993
1994
1995
1996
1997
1998
1999
2000
2001
2002
2003
2004
2005
2006
2007
2008
2009
Fiscal Year Ending June 30
Figure 12-2Build Illinois Bonds Outstanding
($ millions)
$1,3
88
$1,5
39
$1,6
22
$1,6
46
$1,6
49
$1,5
89
$1,5
83
$1,6
39
$1,6
90
$1,7
65
$1,8
57
$2,1
17
$2,2
18
$2,3
20
$2,1
89
$2,1
01
$2,0
64
$0
$500
$1,000
$1,500
$2,000
$2,500
1993
1994
1995
1996
1997
1998
1999
2000
2001
2002
2003
2004
2005
2006
2007
2008
2009
Fiscal Year Ending June 30
State Debt Comparison Illinois ranks fifth in total tax supported debt according to Moody’s Investor Services. However, $9.95 billion of the $25.76 billion reported for Illinois in Moody’s 2008 State Debt Medians relates to funding a portion of the state’s pre-existing unfunded pension liability. Rating agencies segregate Pension Obligation Bonds (POBs) to accurately compare states that have not used POBs to refund their pension liability. Municipal Bond Ratings The state’s outstanding indebtedness is rated by credit rating agencies that assign credit ratings (ratings) to issuers of certain types of debt obligations. The ratings measure the state’s credit worthiness, or ability to pay back the obligation, and therefore affect the borrowing cost to the state. The credit rating agencies review the state’s current and projected financial condition, economic growth and levels of indebtedness, which all factor in to the rating assigned to the state. Although the state’s credit worthiness is reflected in the ratings for both programs, the Build Illinois credit is considered an AAA rating from S&P due to the pledge by the state of a strong revenue stream. The state’s current underlying long term credit ratings are:
General Obligation Bonds
Build Illinois Bonds
Standard & Poor’s AA- AAAMoody’s Investor Service Aa3 Aa3Fitch Ratings AA- AA
Table 12-1Long Term Underlyng Ratings
Minority-Owned and Woman-Owned Business Participation. Illinois is dedicated to inclusion of Minority-Owned Business Enterprises (MBE) and Woman-Owned Enterprises (WBE) in its capital market financing. As Table 12-2 illustrates below, the use of negotiated method of sale has allowed the state to exceed its goal of 19 percent MBE/WBE participation in fiscal years 2006 and 2007. In fiscal year 2008 and year to date 2009, with bond act restrictions requiring competitive sales, the percentage of MBE/WBE participation is zero because it is much harder for these firms to access the capital required to participate in and win competitive sales.
12 - 2
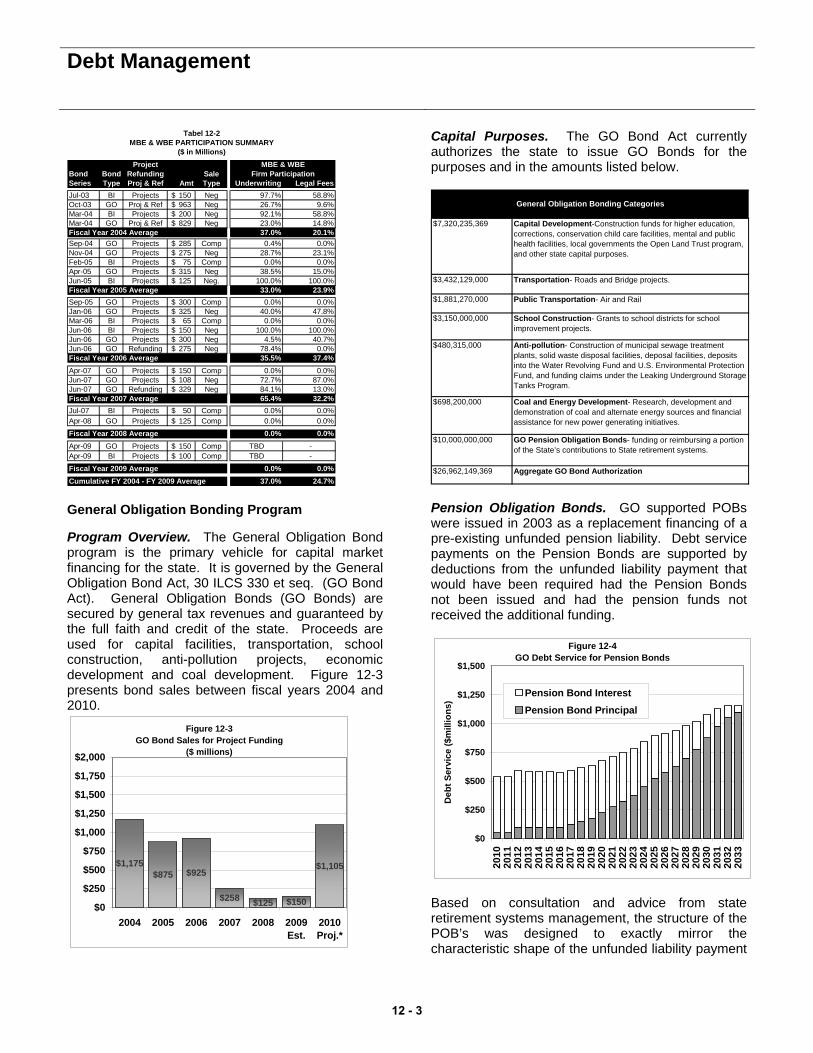
Debt Management
ProjectBond Bond Refunding SaleSeries Type Proj & Ref Amt Type Underwriting Legal FeesJul-03 BI Projects 150$ Neg 97.7% 58.8%Oct-03 GO Proj & Ref 963$ Neg 26.7% 9.6%Mar-04 BI Projects 200$ Neg 92.1% 58.8%Mar-04 GO Proj & Ref 829$ Neg 23.0% 14.8%Fiscal Year 2004 Average 37.0% 20.1%Sep-04 GO Projects 285$ Comp 0.4% 0.0%Nov-04 GO Projects 275$ Neg 28.7% 23.1%Feb-05 BI Projects 75$ Comp 0.0% 0.0%Apr-05 GO Projects 315$ Neg 38.5% 15.0%Jun-05 BI Projects 125$ Neg. 100.0% 100.0%Fiscal Year 2005 Average 33.0% 23.9%Sep-05 GO Projects 300$ Comp 0.0% 0.0%Jan-06 GO Projects 325$ Neg 40.0% 47.8%Mar-06 BI Projects 65$ Comp 0.0% 0.0%Jun-06 BI Projects 150$ Neg 100.0% 100.0%Jun-06 GO Projects 300$ Neg 4.5% 40.7%Jun-06 GO Refunding 275$ Neg 78.4% 0.0%Fiscal Year 2006 Average 35.5% 37.4%Apr-07 GO Projects 150$ Comp 0.0% 0.0%Jun-07 GO Projects 108$ Neg 72.7% 87.0%Jun-07 GO Refunding 329$ Neg 84.1% 13.0%Fiscal Year 2007 Average 65.4% 32.2%Jul-07 BI Projects 50$ Comp 0.0% 0.0%Apr-08 GO Projects 125$ Comp 0.0% 0.0%
Fiscal Year 2008 Average 0.0% 0.0%Apr-09 GO Projects 150$ Comp TBD `-Apr-09 BI Projects 100$ Comp TBD `-
Fiscal Year 2009 Average 0.0% 0.0%Cumulative FY 2004 - FY 2009 Average 37.0% 24.7%
MBE & WBEFirm Participation
Tabel 12-2MBE & WBE PARTICIPATION SUMMARY
($ in Millions)
General Obligation Bonding Program Program Overview. The General Obligation Bond program is the primary vehicle for capital market financing for the state. It is governed by the General Obligation Bond Act, 30 ILCS 330 et seq. (GO Bond Act). General Obligation Bonds (GO Bonds) are secured by general tax revenues and guaranteed by the full faith and credit of the state. Proceeds are used for capital facilities, transportation, school construction, anti-pollution projects, economic development and coal development. Figure 12-3 presents bond sales between fiscal years 2004 and 2010.
Figure 12-3GO Bond Sales for Project Funding
($ millions)
$1,175$875 $925
$258 $125 $150
$1,105
$0
$250
$500
$750
$1,000
$1,250
$1,500
$1,750
$2,000
2004 2005 2006 2007 2008 2009Est.
2010Proj.*
Capital Purposes. The GO Bond Act currently authorizes the state to issue GO Bonds for the purposes and in the amounts listed below.
$7,320,235,369 Capital Development-Construction funds for higher education, corrections, conservation child care facilities, mental and public health facilities, local governments the Open Land Trust program, and other state capital purposes.
$3,432,129,000 Transportation- Roads and Bridge projects.
$1,881,270,000 Public Transportation- Air and Rail
$3,150,000,000 School Construction- Grants to school districts for school improvement projects.
$480,315,000 Anti-pollution- Construction of municipal sewage treatment plants, solid waste disposal facilities, deposal facilities, deposits into the Water Revolving Fund and U.S. Environmental Protection Fund, and funding claims under the Leaking Underground Storage Tanks Program.
$698,200,000 Coal and Energy Development- Research, development and demonstration of coal and alternate energy sources and financial assistance for new power generating initiatives.
$10,000,000,000 GO Pension Obligation Bonds- funding or reimbursing a portion of the State’s contributions to State retirement systems.
$26,962,149,369 Aggregate GO Bond Authorization
General Obligation Bonding Categories
Pension Obligation Bonds. GO supported POBs were issued in 2003 as a replacement financing of a pre-existing unfunded pension liability. Debt service payments on the Pension Bonds are supported by deductions from the unfunded liability payment that would have been required had the Pension Bonds not been issued and had the pension funds not received the additional funding.
Figure 12-4GO Debt Service for Pension Bonds
$0
$250
$500
$750
$1,000
$1,250
$1,500
2010
2011
2012
2013
2014
2015
2016
2017
2018
2019
2020
2021
2022
2023
2024
2025
2026
2027
2028
2029
2030
2031
2032
2033
Deb
t Ser
vice
($m
illio
ns)
Pension Bond InterestPension Bond Principal
Based on consultation and advice from state retirement systems management, the structure of the POB’s was designed to exactly mirror the characteristic shape of the unfunded liability payment
12 - 3

Debt Management
schedule established by the 1995 Pension Funding Plan (see “Public Retirement Systems” chapter). This structure maximizes the earning potential of the retirement systems, versus the 5.05 percent cost of the Pension Bonds when issued. The debt service requirements of the Pension Bonds are included in the statutory debt service limit versus base appropriations; this statutory restriction is discussed elsewhere in this chapter. Security of the Bonds. GO Bonds are direct, general obligations of the state and by law the full faith and credit of the state is pledged for the payment of interest and principal due on these bonds. The GO Bond Act provides that the sections of the GO Bond Act making such a pledge shall not be repealed until all GO Bonds issued under the GO Bond Act have been paid in full. Continuing Appropriation. If, for any reason, there are insufficient funds in the General Revenue Fund, or the Road Fund, to make transfers to the General Obligation Bond Retirement and Interest Fund (GOBRI) as required by the GO Bond Act, or the General Assembly fails to make appropriations sufficient to pay the principal and interest on the outstanding GO Bonds, the GO Bond Act constitutes an irrevocable and continuing appropriation of all amounts necessary for that purpose and the irrevocable and continuing authority for and direction to the treasurer and the comptroller to make the necessary transfers, as directed by the governor, out of and disbursements from the revenues and funds of the state. Debt Service Obligation. GO Bonds are primarily supported by revenue realized in the state’s General Revenue Fund. The primary revenue sources that repay the GO Bonds are sales taxes, income taxes and motor fuel taxes. In addition to these revenue sources, bonds issued under two specific sections of the GO Bond Act are directly supported by the following budgetary resources: • Roads and Bridges – GO Bonds issued for road
construction projects are repaid by monthly transfers from Road Fund sources which are: Motor Fuel taxes, motor vehicle registration fees and driver’s license fees.
• School Construction - GO Bonds for school
construction purposes, issued prior to Illinois Jobs Now!, are repaid, in part, from cigarette and telecommunications taxes received by the School Infrastructure Fund.
• Illinois Jobs Now! – GO Bonds issued for Illinois Jobs Now! are repaid by personal income and corporate income taxes.
• Transit – GO Bonds for transit are repaid from motor vehicle certificate of title fees.
Figure 12-5 below displays GO Bond debt service by major repayment source and Figure 12-6 displays GO Bond debt service by prospective issuance for fiscal year 2009 re-appropriations and fiscal year 2009 proposed new capital. The proposed debt restructuring, as displayed below in Figure 12-5 and Figure 12-6, highlights the $493 million of debt service savings in fiscal year 2010 generated by the restructuring and provides for over $117 million in overall debt service savings through the life of the refunding bonds.
Figure 12-5GO Debt Service (Excluding Pension) by Repayment Source
$0
$250
$500
$750
$1,000
$1,250
$1,500
$1,750
$2,000
2010
2011
2012
2013
2014
2015
2016
2017
2018
2019
2020
2021
2022
2023
2024
2025
2026
2027
2028
2029
2030
2031
2032
2033
2034
2035
2036
2037
2038
2039
Deb
t Ser
vice
($m
illio
ns)
School Infrastructure FundMotor Fuel Taxes (Road)GRF (Including Transit)Effect of Restructuring
Figure 12-6GO Debt Service Excluding Pension Bonds
$0
$250
$500
$750
$1,000
$1,250
$1,500
$1,750
$2,000
2010
2011
2012
2013
2014
2015
2016
2017
2018
2019
2020
2021
2022
2023
2024
2025
2026
2027
2028
2029
2030
2031
2032
2033
2034
2035
2036
2037
2038
2039
Deb
t Ser
vice
($m
illio
ns)
Illinois Jobs Now!FY 2010 Re-AppropsCurrent Debt ServiceEffect of Restructuring
Refunding Bonds. The GO Bond Act also authorizes the issuance of General Obligation Refunding Bonds in an amount up to $2,839,025,000
12 - 4
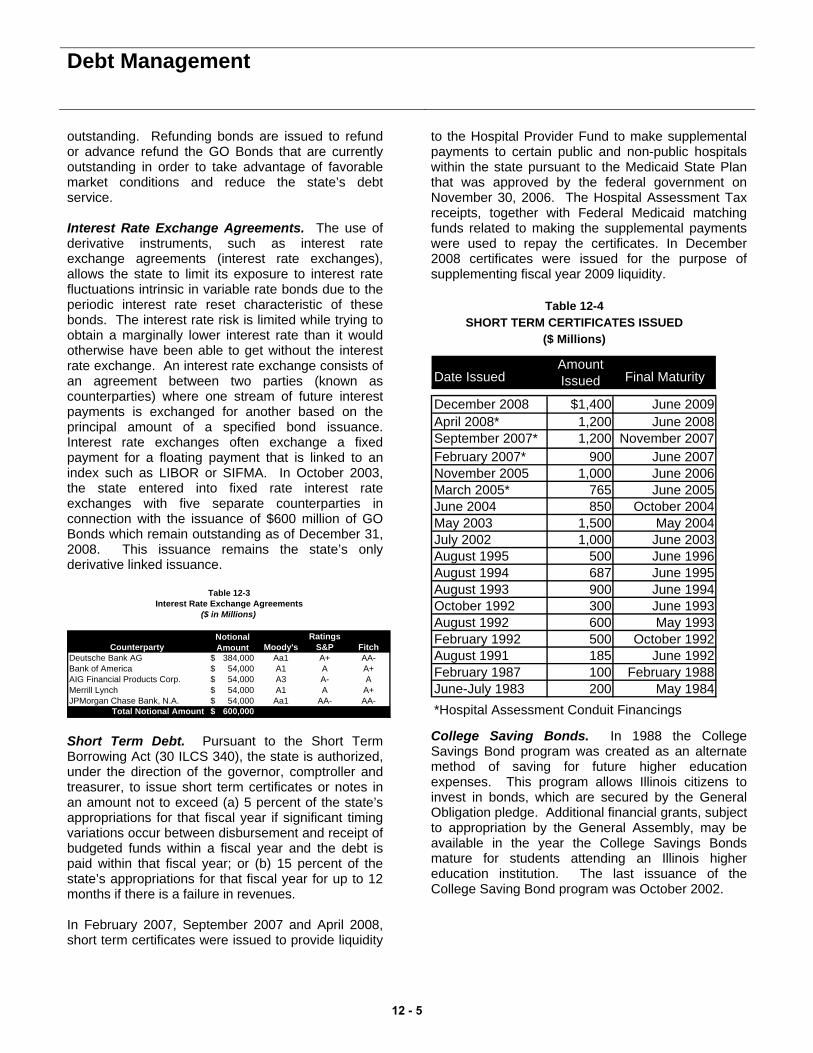
Debt Management
outstanding. Refunding bonds are issued to refund or advance refund the GO Bonds that are currently outstanding in order to take advantage of favorable market conditions and reduce the state’s debt service. Interest Rate Exchange Agreements. The use of derivative instruments, such as interest rate exchange agreements (interest rate exchanges), allows the state to limit its exposure to interest rate fluctuations intrinsic in variable rate bonds due to the periodic interest rate reset characteristic of these bonds. The interest rate risk is limited while trying to obtain a marginally lower interest rate than it would otherwise have been able to get without the interest rate exchange. An interest rate exchange consists of an agreement between two parties (known as counterparties) where one stream of future interest payments is exchanged for another based on the principal amount of a specified bond issuance. Interest rate exchanges often exchange a fixed payment for a floating payment that is linked to an index such as LIBOR or SIFMA. In October 2003, the state entered into fixed rate interest rate exchanges with five separate counterparties in connection with the issuance of $600 million of GO Bonds which remain outstanding as of December 31, 2008. This issuance remains the state’s only derivative linked issuance.
Counterparty Moody's S&P FitchDeutsche Bank AG 384,000$ Aa1 A+ AA-Bank of America 54,000$ A1 A A+AIG Financial Products Corp. 54,000$ A3 A- AMerrill Lynch 54,000$ A1 A A+JPMorgan Chase Bank, N.A. 54,000$ Aa1 AA- AA-
Total Notional Amount 600,000$
Table 12-3Interest Rate Exchange Agreements
($ in Millions)
Notional Amount
Ratings
Short Term Debt. Pursuant to the Short Term Borrowing Act (30 ILCS 340), the state is authorized, under the direction of the governor, comptroller and treasurer, to issue short term certificates or notes in an amount not to exceed (a) 5 percent of the state’s appropriations for that fiscal year if significant timing variations occur between disbursement and receipt of budgeted funds within a fiscal year and the debt is paid within that fiscal year; or (b) 15 percent of the state’s appropriations for that fiscal year for up to 12 months if there is a failure in revenues. In February 2007, September 2007 and April 2008, short term certificates were issued to provide liquidity
to the Hospital Provider Fund to make supplemental payments to certain public and non-public hospitals within the state pursuant to the Medicaid State Plan that was approved by the federal government on November 30, 2006. The Hospital Assessment Tax receipts, together with Federal Medicaid matching funds related to making the supplemental payments were used to repay the certificates. In December 2008 certificates were issued for the purpose of supplementing fiscal year 2009 liquidity.
Date IssuedAmount Issued Final Maturity
December 2008 $1,400 June 2009April 2008* 1,200 June 2008September 2007* 1,200 November 2007February 2007* 900 June 2007November 2005 1,000 June 2006March 2005* 765 June 2005June 2004 850 October 2004May 2003 1,500 May 2004July 2002 1,000 June 2003August 1995 500 June 1996August 1994 687 June 1995August 1993 900 June 1994October 1992 300 June 1993August 1992 600 May 1993February 1992 500 October 1992August 1991 185 `June 1992February 1987 100 February 1988June-July 1983 200 May 1984*Hospital Assessment Conduit Financings
Table 12-4SHORT TERM CERTIFICATES ISSUED
($ Millions)
College Saving Bonds. In 1988 the College Savings Bond program was created as an alternate method of saving for future higher education expenses. This program allows Illinois citizens to invest in bonds, which are secured by the General Obligation pledge. Additional financial grants, subject to appropriation by the General Assembly, may be available in the year the College Savings Bonds mature for students attending an Illinois higher education institution. The last issuance of the College Saving Bond program was October 2002.
12 - 5
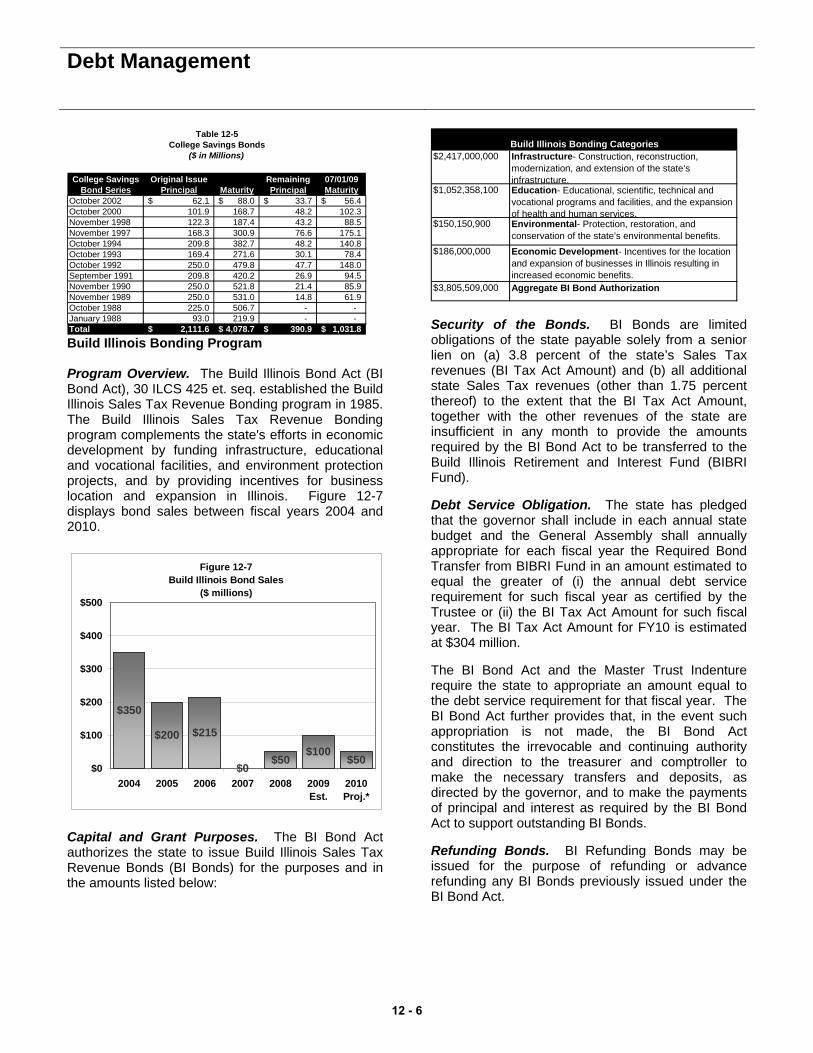
Debt Management
College Savings Original Issue Remaining 07/01/09Bond Series Principal Maturity Principal Maturity
October 2002 62.1$ 88.0$ 33.7$ 56.4$ October 2000 101.9 168.7 48.2 102.3 November 1998 122.3 187.4 43.2 88.5 November 1997 168.3 300.9 76.6 175.1 October 1994 209.8 382.7 48.2 140.8 October 1993 169.4 271.6 30.1 78.4 October 1992 250.0 479.8 47.7 148.0 September 1991 209.8 420.2 26.9 94.5 November 1990 250.0 521.8 21.4 85.9 November 1989 250.0 531.0 14.8 61.9 October 1988 225.0 506.7 - - January 1988 93.0 219.9 - - Total 2,111.6$ 4,078.7$ 390.9$ 1,031.8$
Table 12-5College Savings Bonds
($ in Millions)
Build Illinois Bonding Program Program Overview. The Build Illinois Bond Act (BI Bond Act), 30 ILCS 425 et. seq. established the Build Illinois Sales Tax Revenue Bonding program in 1985. The Build Illinois Sales Tax Revenue Bonding program complements the state's efforts in economic development by funding infrastructure, educational and vocational facilities, and environment protection projects, and by providing incentives for business location and expansion in Illinois. Figure 12-7 displays bond sales between fiscal years 2004 and 2010.
Figure 12-7Build Illinois Bond Sales
($ millions)
$350
$200 $215
$0$100
$50$50$0
$100
$200
$300
$400
$500
2004 2005 2006 2007 2008 2009Est.
2010Proj.*
Capital and Grant Purposes. The BI Bond Act authorizes the state to issue Build Illinois Sales Tax Revenue Bonds (BI Bonds) for the purposes and in the amounts listed below:
$2,417,000,000 Infrastructure- Construction, reconstruction, modernization, and extension of the state’s infrastructure.
$1,052,358,100 Education- Educational, scientific, technical and vocational programs and facilities, and the expansion of health and human services.
$150,150,900 Environmental- Protection, restoration, and conservation of the state’s environmental benefits.
$186,000,000 Economic Development- Incentives for the location and expansion of businesses in Illinois resulting in increased economic benefits.
$3,805,509,000 Aggregate BI Bond Authorization
Build Illinois Bonding Categories
Security of the Bonds. BI Bonds are limited obligations of the state payable solely from a senior lien on (a) 3.8 percent of the state’s Sales Tax revenues (BI Tax Act Amount) and (b) all additional state Sales Tax revenues (other than 1.75 percent thereof) to the extent that the BI Tax Act Amount, together with the other revenues of the state are insufficient in any month to provide the amounts required by the BI Bond Act to be transferred to the Build Illinois Retirement and Interest Fund (BIBRI Fund). Debt Service Obligation. The state has pledged that the governor shall include in each annual state budget and the General Assembly shall annually appropriate for each fiscal year the Required Bond Transfer from BIBRI Fund in an amount estimated to equal the greater of (i) the annual debt service requirement for such fiscal year as certified by the Trustee or (ii) the BI Tax Act Amount for such fiscal year. The BI Tax Act Amount for FY10 is estimated at $304 million. The BI Bond Act and the Master Trust Indenture require the state to appropriate an amount equal to the debt service requirement for that fiscal year. The BI Bond Act further provides that, in the event such appropriation is not made, the BI Bond Act constitutes the irrevocable and continuing authority and direction to the treasurer and comptroller to make the necessary transfers and deposits, as directed by the governor, and to make the payments of principal and interest as required by the BI Bond Act to support outstanding BI Bonds. Refunding Bonds. BI Refunding Bonds may be issued for the purpose of refunding or advance refunding any BI Bonds previously issued under the BI Bond Act.
12 - 6
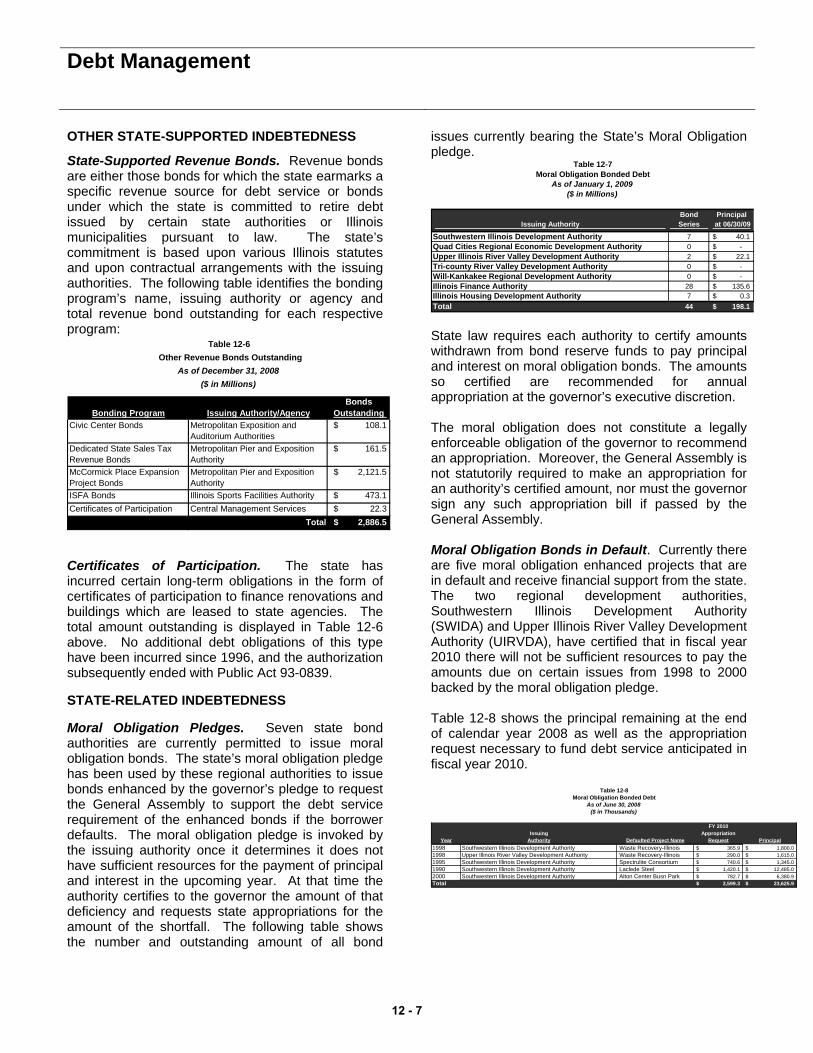
Debt Management
OTHER STATE-SUPPORTED INDEBTEDNESS
State-Supported Revenue Bonds. Revenue bonds are either those bonds for which the state earmarks a specific revenue source for debt service or bonds under which the state is committed to retire debt issued by certain state authorities or Illinois municipalities pursuant to law. The state’s commitment is based upon various Illinois statutes and upon contractual arrangements with the issuing authorities. The following table identifies the bonding program’s name, issuing authority or agency and total revenue bond outstanding for each respective program:
Bonding Program Issuing Authority/AgencyBonds
Outstanding Civic Center Bonds Metropolitan Exposition and
Auditorium Authorities $ 108.1
Dedicated State Sales Tax Revenue Bonds
Metropolitan Pier and Exposition Authority
$ 161.5
McCormick Place Expansion Project Bonds
Metropolitan Pier and Exposition Authority
$ 2,121.5
ISFA Bonds Illinois Sports Facilities Authority $ 473.1 Certificates of Participation Central Management Services $ 22.3
Total $ 2,886.5
Table 12-6 Other Revenue Bonds Outstanding
($ in Millions)As of December 31, 2008
Certificates of Participation. The state has incurred certain long-term obligations in the form of certificates of participation to finance renovations and buildings which are leased to state agencies. The total amount outstanding is displayed in Table 12-6 above. No additional debt obligations of this type have been incurred since 1996, and the authorization subsequently ended with Public Act 93-0839. STATE-RELATED INDEBTEDNESS Moral Obligation Pledges. Seven state bond authorities are currently permitted to issue moral obligation bonds. The state’s moral obligation pledge has been used by these regional authorities to issue bonds enhanced by the governor’s pledge to request the General Assembly to support the debt service requirement of the enhanced bonds if the borrower defaults. The moral obligation pledge is invoked by the issuing authority once it determines it does not have sufficient resources for the payment of principal and interest in the upcoming year. At that time the authority certifies to the governor the amount of that deficiency and requests state appropriations for the amount of the shortfall. The following table shows the number and outstanding amount of all bond
issues currently bearing the State’s Moral Obligation pledge.
Bond PrincipalIssuing Authority Series at 06/30/09
Southwestern Illinois Development Authority 7 40.1$ Quad Cities Regional Economic Development Authority 0 -$ Upper Illinois River Valley Development Authority 2 22.1$ Tri-county River Valley Development Authority 0 -$ Will-Kankakee Regional Development Authority 0 -$ Illinois Finance Authority 28 135.6$ Illinois Housing Development Authority 7 0.3$ Total 44 198.1$
Table 12-7Moral Obligation Bonded Debt
($ in Millions)As of January 1, 2009
State law requires each authority to certify amounts withdrawn from bond reserve funds to pay principal and interest on moral obligation bonds. The amounts so certified are recommended for annual appropriation at the governor’s executive discretion. The moral obligation does not constitute a legally enforceable obligation of the governor to recommend an appropriation. Moreover, the General Assembly is not statutorily required to make an appropriation for an authority’s certified amount, nor must the governor sign any such appropriation bill if passed by the General Assembly. Moral Obligation Bonds in Default. Currently there are five moral obligation enhanced projects that are in default and receive financial support from the state. The two regional development authorities, Southwestern Illinois Development Authority (SWIDA) and Upper Illinois River Valley Development Authority (UIRVDA), have certified that in fiscal year 2010 there will not be sufficient resources to pay the amounts due on certain issues from 1998 to 2000 backed by the moral obligation pledge. Table 12-8 shows the principal remaining at the end of calendar year 2008 as well as the appropriation request necessary to fund debt service anticipated in fiscal year 2010.
FY 2010Issuing Appropriation
Year Authority Defaulted Project Name Request Principal1998 Southwestern Illinois Development Authority Waste Recovery-Illinois 365.9$ 1,800.0$ 1998 Upper Illinois River Valley Development Authority Waste Recovery-Illinois 290.0$ 1,615.0$ 1995 Southwestern Illinois Development Authority Spectrulite Consortium 740.6$ 1,345.0$ 1990 Southwestern Illinois Development Authority Laclede Steel 1,420.1$ 12,485.0$ 2000 Southwestern Illinois Development Authority Alton Center Busn Park 782.7$ 6,380.9$ Total 3,599.3$ 23,625.9$
Table 12-8Moral Obligation Bonded Debt
As of June 30, 2008($ in Thousands)
12 - 7
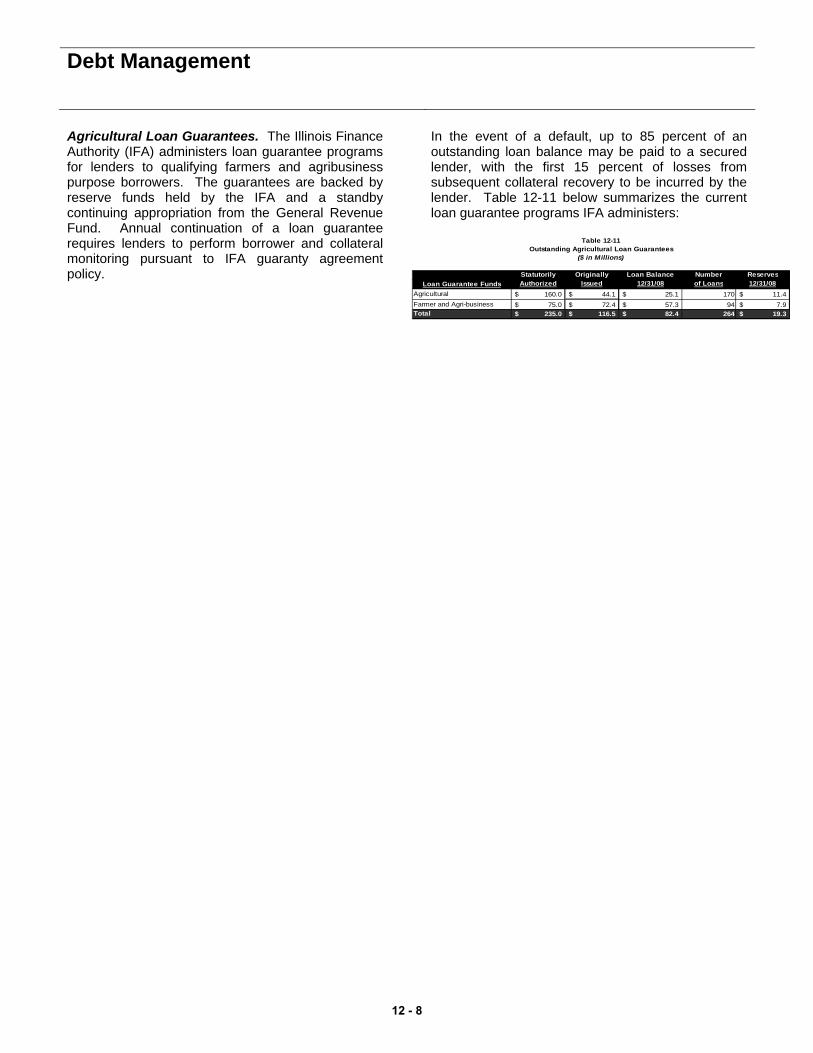
Debt Management
Agricultural Loan Guarantees. The Illinois Finance Authority (IFA) administers loan guarantee programs for lenders to qualifying farmers and agribusiness purpose borrowers. The guarantees are backed by reserve funds held by the IFA and a standby continuing appropriation from the General Revenue Fund. Annual continuation of a loan guarantee requires lenders to perform borrower and collateral monitoring pursuant to IFA guaranty agreement policy.
In the event of a default, up to 85 percent of an outstanding loan balance may be paid to a secured lender, with the first 15 percent of losses from subsequent collateral recovery to be incurred by the lender. Table 12-11 below summarizes the current loan guarantee programs IFA administers:
Statutorily Originally Loan Balance Number ReservesLoan Guarantee Funds Authorized Issued 12/31/08 of Loans 12/31/08
Agricultural 160.0$ 44.1$ 25.1$ 170 11.4$ Farmer and Agri-business 75.0$ 72.4$ 57.3$ 94 7.9$ Total 235.0$ 116.5$ 82.4$ 264 19.3$
Table 12-11Outstanding Agricultural Loan Guarantees
($ in Millions)
12 - 8
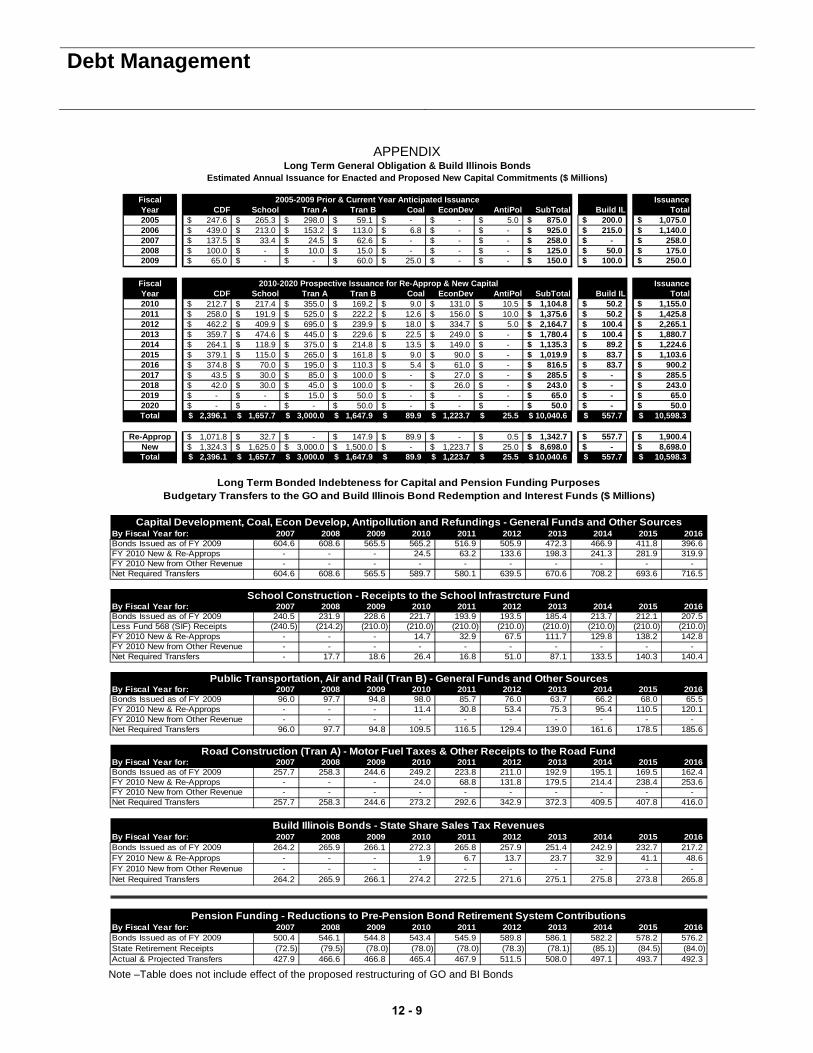
Debt Management
APPENDIX
Fiscal IssuanceYear CDF School Tran A Tran B Coal EconDev AntiPol SubTotal Build IL Total2005 247.6$ 265.3$ 298.0$ 59.1$ -$ -$ 5.0$ 875.0$ 200.0$ 1,075.0$ 2006 439.0$ 213.0$ 153.2$ 113.0$ 6.8$ -$ -$ 925.0$ 215.0$ 1,140.0$ 2007 137.5$ 33.4$ 24.5$ 62.6$ -$ -$ -$ 258.0$ -$ 258.0$ 2008 100.0$ -$ 10.0$ 15.0$ -$ -$ -$ 125.0$ 50.0$ 175.0$ 2009 65.0$ -$ -$ 60.0$ 25.0$ -$ -$ 150.0$ 100.0$ 250.0$
Fiscal IssuanceYear CDF School Tran A Tran B Coal EconDev AntiPol SubTotal Build IL Total 2010 212.7$ 217.4$ 355.0$ 169.2$ 9.0$ 131.0$ 10.5$ 1,104.8$ 50.2$ 1,155.0$ 2011 258.0$ 191.9$ 525.0$ 222.2$ 12.6$ 156.0$ 10.0$ 1,375.6$ 50.2$ 1,425.8$ 2012 462.2$ 409.9$ 695.0$ 239.9$ 18.0$ 334.7$ 5.0$ 2,164.7$ 100.4$ 2,265.1$ 2013 359.7$ 474.6$ 445.0$ 229.6$ 22.5$ 249.0$ -$ 1,780.4$ 100.4$ 1,880.7$ 2014 264.1$ 118.9$ 375.0$ 214.8$ 13.5$ 149.0$ -$ 1,135.3$ 89.2$ 1,224.6$ 2015 379.1$ 115.0$ 265.0$ 161.8$ 9.0$ 90.0$ -$ 1,019.9$ 83.7$ 1,103.6$ 2016 374.8$ 70.0$ 195.0$ 110.3$ 5.4$ 61.0$ -$ 816.5$ 83.7$ 900.2$ 2017 43.5$ 30.0$ 85.0$ 100.0$ -$ 27.0$ -$ 285.5$ -$ 285.5$ 2018 42.0$ 30.0$ 45.0$ 100.0$ -$ 26.0$ -$ 243.0$ -$ 243.0$ 2019 -$ -$ 15.0$ 50.0$ -$ -$ -$ 65.0$ -$ 65.0$ 2020 -$ -$ -$ 50.0$ -$ -$ -$ 50.0$ -$ 50.0$ Total 2,396.1$ 1,657.7$ 3,000.0$ 1,647.9$ 89.9$ 1,223.7$ 25.5$ 10,040.6$ 557.7$ 10,598.3$
Re-Approp 1,071.8$ 32.7$ -$ 147.9$ 89.9$ -$ 0.5$ 1,342.7$ 557.7$ 1,900.4$ New 1,324.3$ 1,625.0$ 3,000.0$ 1,500.0$ -$ 1,223.7$ 25.0$ 8,698.0$ -$ 8,698.0$ Total 2,396.1$ 1,657.7$ 3,000.0$ 1,647.9$ 89.9$ 1,223.7$ 25.5$ 10,040.6$ 557.7$ 10,598.3$
2010-2020 Prospective Issuance for Re-Approp & New Capital
Long Term General Obligation & Build Illinois BondsEstimated Annual Issuance for Enacted and Proposed New Capital Commitments ($ Millions)
2005-2009 Prior & Current Year Anticipated Issuance
Note –Table does not include effect of the proposed restructuring of GO and BI Bonds
By Fiscal Year for: 2007 2008 2009 2010 2011 2012 2013 2014 2015 2016 Bonds Issued as of FY 2009 604.6 608.6 565.5 565.2 516.9 505.9 472.3 466.9 411.8 396.6 FY 2010 New & Re-Approps - - - 24.5 63.2 133.6 198.3 241.3 281.9 319.9 FY 2010 New from Other Revenue - - - - - - - - - - Net Required Transfers 604.6 608.6 565.5 589.7 580.1 639.5 670.6 708.2 693.6 716.5
By Fiscal Year for: 2007 2008 2009 2010 2011 2012 2013 2014 2015 2016 Bonds Issued as of FY 2009 240.5 231.9 228.6 221.7 193.9 193.5 185.4 213.7 212.1 207.5 Less Fund 568 (SIF) Receipts (240.5) (214.2) (210.0) (210.0) (210.0) (210.0) (210.0) (210.0) (210.0) (210.0) FY 2010 New & Re-Approps - - - 14.7 32.9 67.5 111.7 129.8 138.2 142.8 FY 2010 New from Other Revenue - - - - - - - - - - Net Required Transfers - 17.7 18.6 26.4 16.8 51.0 87.1 133.5 140.3 140.4
By Fiscal Year for: 2007 2008 2009 2010 2011 2012 2013 2014 2015 2016 Bonds Issued as of FY 2009 96.0 97.7 94.8 98.0 85.7 76.0 63.7 66.2 68.0 65.5 FY 2010 New & Re-Approps - - - 11.4 30.8 53.4 75.3 95.4 110.5 120.1 FY 2010 New from Other Revenue - - - - - - - - - - Net Required Transfers 96.0 97.7 94.8 109.5 116.5 129.4 139.0 161.6 178.5 185.6
By Fiscal Year for: 2007 2008 2009 2010 2011 2012 2013 2014 2015 2016 Bonds Issued as of FY 2009 257.7 258.3 244.6 249.2 223.8 211.0 192.9 195.1 169.5 162.4 FY 2010 New & Re-Approps - - - 24.0 68.8 131.8 179.5 214.4 238.4 253.6 FY 2010 New from Other Revenue - - - - - - - - - - Net Required Transfers 257.7 258.3 244.6 273.2 292.6 342.9 372.3 409.5 407.8 416.0
By Fiscal Year for: 2007 2008 2009 2010 2011 2012 2013 2014 2015 2016 Bonds Issued as of FY 2009 264.2 265.9 266.1 272.3 265.8 257.9 251.4 242.9 232.7 217.2 FY 2010 New & Re-Approps - - - 1.9 6.7 13.7 23.7 32.9 41.1 48.6 FY 2010 New from Other Revenue - - - - - - - - - - Net Required Transfers 264.2 265.9 266.1 274.2 272.5 271.6 275.1 275.8 273.8 265.8
By Fiscal Year for: 2007 2008 2009 2010 2011 2012 2013 2014 2015 2016 Bonds Issued as of FY 2009 500.4 546.1 544.8 543.4 545.9 589.8 586.1 582.2 578.2 576.2 State Retirement Receipts (72.5) (79.5) (78.0) (78.0) (78.0) (78.3) (78.1) (85.1) (84.5) (84.0) Actual & Projected Transfers 427.9 466.6 466.8 465.4 467.9 511.5 508.0 497.1 493.7 492.3
Pension Funding - Reductions to Pre-Pension Bond Retirement System Contributions
Long Term Bonded Indebteness for Capital and Pension Funding Purposes
Public Transportation, Air and Rail (Tran B) - General Funds and Other Sources
School Construction - Receipts to the School Infrastrcture Fund
Road Construction (Tran A) - Motor Fuel Taxes & Other Receipts to the Road Fund
Budgetary Transfers to the GO and Build Illinois Bond Redemption and Interest Funds ($ Millions)
Capital Development, Coal, Econ Develop, Antipollution and Refundings - General Funds and Other Sources
Build Illinois Bonds - State Share Sales Tax Revenues
12 - 9

Debt Management
Source: Illinois Department of Revenue; U.S. Department of Commerce, Bureau of Economic Analysis; Population is from Population Division of the U.S. Census Bureau
FY-2004 FY-2005 FY-2006 FY-2007 FY-2008 FY-2009 FY-2010Outstanding Debt ($millions) Actual Actual Actual Actual Actual Estimated ProjectedBuild Illinois Bonds 2,117.2$ 2,218.0$ 2,319.6$ 2,188.9$ 2,100.8$ 2,063.7$ 1,968.3$ Civic Center Bonds 136.1 129.7 122.9 115.7 108.1 100.0 91.4 Capital Purposes - GO 9,556.3 9,893.0 10,251.4 9,925.7 9,462.9 9,051.8 9,569.2 Bonded Debt - Capital Purpose 11,809.6$ 12,240.7$ 12,693.8$ 12,230.3$ 11,671.8$ 11,215.5$ 11,628.9$ Pension Bonds 10,000.0 10,000.0 10,000.0 10,000.0 9,950.0 9,900.0 9,850.0 Bonded Debt - Total 21,809.6$ 22,240.7$ 22,693.8$ 22,230.3$ 21,621.8$ 21,115.5$ 21,478.9$
Illinois Population (millions) 12.680 12.720 12.777 12.853 12.902 12.966 13.031 Debt Per Capita - Capital Purpose 931.4 962.4 993.5 951.6 904.7 865.0 892.4 Debt Per Capita - Pension 788.6 786.2 782.7 778.1 771.2 763.5 755.9 Per Capita - Total 1,720.0$ 1,748.5$ 1,776.1$ 1,729.6$ 1,675.9$ 1,628.5$ 1,648.3$
Illinois Personal Income ($millions) 445,151$ 463,114$ 490,450$ 525,920$ 510,142$ 502,490$ 502,490$ Percent of Income - Capital Purpose 2.65% 2.64% 2.59% 2.33% 2.29% 2.23% 2.31%Percent of Income - Pension Bonds 2.25% 2.16% 2.04% 1.90% 1.95% 1.97% 1.96%Percent of Income - Total Debt 4.90% 4.80% 4.63% 4.23% 4.24% 4.20% 4.27%
Illinois EAV ($millions) 277,898$ 303,038$ 331,335$ 362,576$ 382,375$ 353,697$ 353,697$ Percent of EAV - Capital Purpose 4.25% 4.04% 3.83% 3.37% 3.05% 3.17% 3.29%Percent of EAV - Pension Bonds 3.60% 3.30% 3.02% 2.76% 2.60% 2.80% 2.78%Percent of EAV - Total Debt 7.85% 7.34% 6.85% 6.13% 5.65% 5.97% 6.07%
GRF and Road Fund Base Approps 27,090$ 26,736$ 27,982$ 30,952$ 28,267$ 33,356$ 34,356$ % Approps - Build Illinois Bonds 0.76% 0.83% 0.85% 0.85% 0.94% 0.80% 0.80%% Approps - Civic Center Bonds 0.05% 0.05% 0.05% 0.04% 0.05% 0.04% 0.04%% Approps - Capital Purposes - GO 3.45% 4.11% 4.12% 3.81% 4.20% 3.48% 3.38%% Approps - Capital Purpose 4.26% 4.99% 5.02% 4.71% 5.19% 4.32% 4.22%% Approps - Pension Bonds 0.00% 1.86% 1.77% 1.60% 1.93% 1.63% 1.58%% Approps - Debt Service Total 4.26% 6.84% 6.80% 6.31% 7.12% 5.95% 5.80%
Standard Measures of Debt Burden
12 - 10
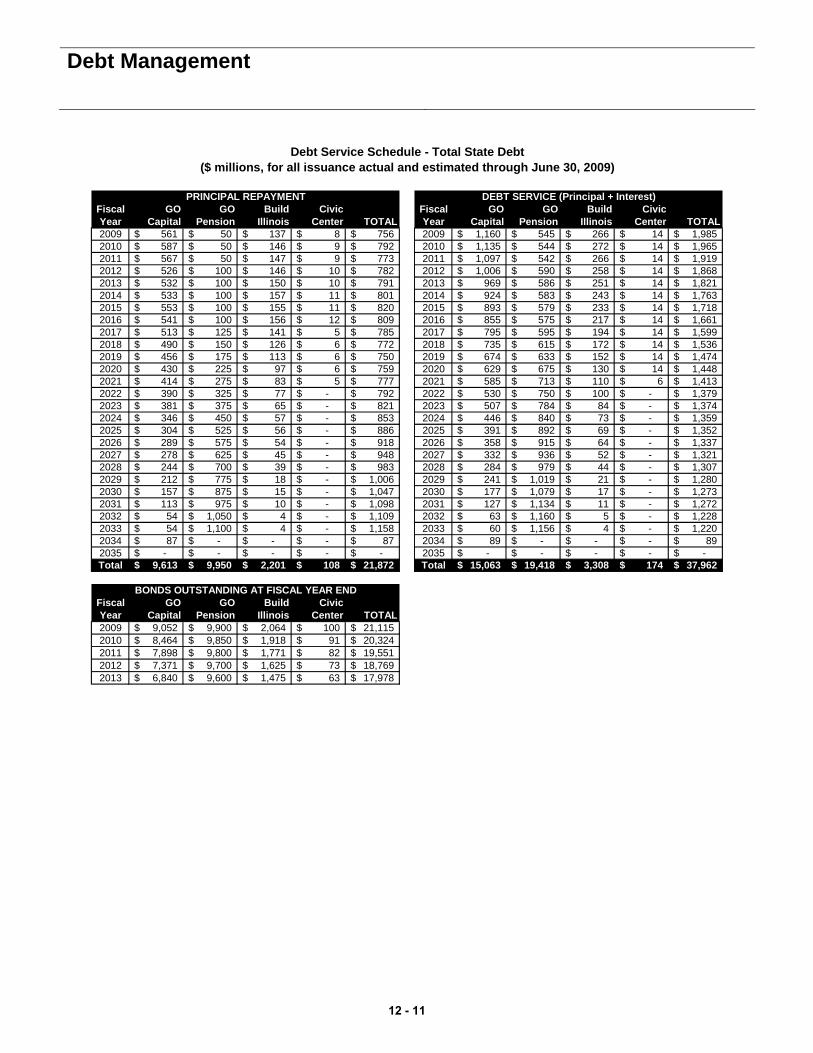
Debt Management
Fiscal GO GO Build Civic Fiscal GO GO Build CivicYear Capital Pension Illinois Center TOTAL Year Capital Pension Illinois Center TOTAL2009 561$ 50$ 137$ 8$ 756$ 2009 1,160$ 545$ 266$ 14$ 1,985$ 2010 587$ 50$ 146$ 9$ 792$ 2010 1,135$ 544$ 272$ 14$ 1,965$ 2011 567$ 50$ 147$ 9$ 773$ 2011 1,097$ 542$ 266$ 14$ 1,919$ 2012 526$ 100$ 146$ 10$ 782$ 2012 1,006$ 590$ 258$ 14$ 1,868$ 2013 532$ 100$ 150$ 10$ 791$ 2013 969$ 586$ 251$ 14$ 1,821$ 2014 533$ 100$ 157$ 11$ 801$ 2014 924$ 583$ 243$ 14$ 1,763$ 2015 553$ 100$ 155$ 11$ 820$ 2015 893$ 579$ 233$ 14$ 1,718$ 2016 541$ 100$ 156$ 12$ 809$ 2016 855$ 575$ 217$ 14$ 1,661$ 2017 513$ 125$ 141$ 5$ 785$ 2017 795$ 595$ 194$ 14$ 1,599$ 2018 490$ 150$ 126$ 6$ 772$ 2018 735$ 615$ 172$ 14$ 1,536$ 2019 456$ 175$ 113$ 6$ 750$ 2019 674$ 633$ 152$ 14$ 1,474$ 2020 430$ 225$ 97$ 6$ 759$ 2020 629$ 675$ 130$ 14$ 1,448$ 2021 414$ 275$ 83$ 5$ 777$ 2021 585$ 713$ 110$ 6$ 1,413$ 2022 390$ 325$ 77$ -$ 792$ 2022 530$ 750$ 100$ -$ 1,379$ 2023 381$ 375$ 65$ -$ 821$ 2023 507$ 784$ 84$ -$ 1,374$ 2024 346$ 450$ 57$ -$ 853$ 2024 446$ 840$ 73$ -$ 1,359$ 2025 304$ 525$ 56$ -$ 886$ 2025 391$ 892$ 69$ -$ 1,352$ 2026 289$ 575$ 54$ -$ 918$ 2026 358$ 915$ 64$ -$ 1,337$ 2027 278$ 625$ 45$ -$ 948$ 2027 332$ 936$ 52$ -$ 1,321$ 2028 244$ 700$ 39$ -$ 983$ 2028 284$ 979$ 44$ -$ 1,307$ 2029 212$ 775$ 18$ -$ 1,006$ 2029 241$ 1,019$ 21$ -$ 1,280$ 2030 157$ 875$ 15$ -$ 1,047$ 2030 177$ 1,079$ 17$ -$ 1,273$ 2031 113$ 975$ 10$ -$ 1,098$ 2031 127$ 1,134$ 11$ -$ 1,272$ 2032 54$ 1,050$ 4$ -$ 1,109$ 2032 63$ 1,160$ 5$ -$ 1,228$ 2033 54$ 1,100$ 4$ -$ 1,158$ 2033 60$ 1,156$ 4$ -$ 1,220$ 2034 87$ -$ -$ -$ 87$ 2034 89$ -$ -$ -$ 89$ 2035 -$ -$ -$ -$ -$ 2035 -$ -$ -$ -$ -$ Total 9,613$ 9,950$ 2,201$ 108$ 21,872$ Total 15,063$ 19,418$ 3,308$ 174$ 37,962$
Fiscal GO GO Build CivicYear Capital Pension Illinois Center TOTAL2009 9,052$ 9,900$ 2,064$ 100$ 21,115$ 2010 8,464$ 9,850$ 1,918$ 91$ 20,324$ 2011 7,898$ 9,800$ 1,771$ 82$ 19,551$ 2012 7,371$ 9,700$ 1,625$ 73$ 18,769$ 2013 6,840$ 9,600$ 1,475$ 63$ 17,978$
BONDS OUTSTANDING AT FISCAL YEAR END
Debt Service Schedule - Total State Debt($ millions, for all issuance actual and estimated through June 30, 2009)
PRINCIPAL REPAYMENT DEBT SERVICE (Principal + Interest)
12 - 11
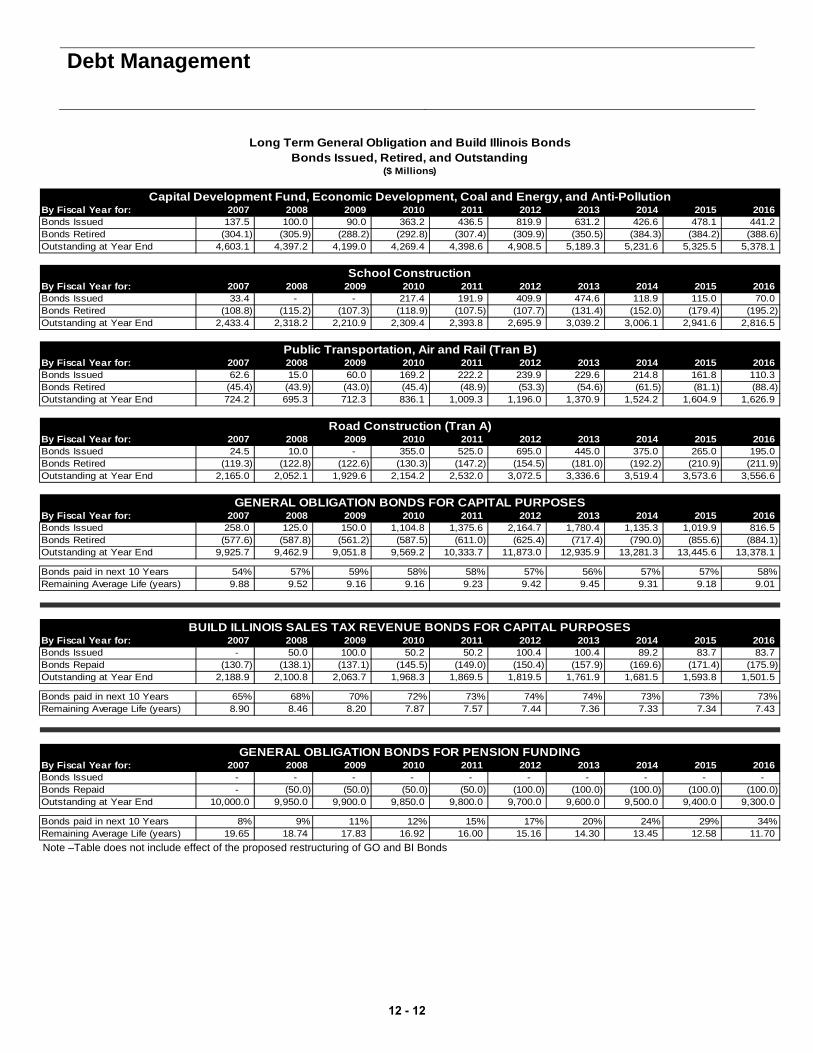
Debt Management
By Fiscal Year for: 2007 2008 2009 2010 2011 2012 2013 2014 2015 2016 Bonds Issued 137.5 100.0 90.0 363.2 436.5 819.9 631.2 426.6 478.1 441.2 Bonds Retired (304.1) (305.9) (288.2) (292.8) (307.4) (309.9) (350.5) (384.3) (384.2) (388.6) Outstanding at Year End 4,603.1 4,397.2 4,199.0 4,269.4 4,398.6 4,908.5 5,189.3 5,231.6 5,325.5 5,378.1
By Fiscal Year for: 2007 2008 2009 2010 2011 2012 2013 2014 2015 2016 Bonds Issued 33.4 - - 217.4 191.9 409.9 474.6 118.9 115.0 70.0 Bonds Retired (108.8) (115.2) (107.3) (118.9) (107.5) (107.7) (131.4) (152.0) (179.4) (195.2) Outstanding at Year End 2,433.4 2,318.2 2,210.9 2,309.4 2,393.8 2,695.9 3,039.2 3,006.1 2,941.6 2,816.5
By Fiscal Year for: 2007 2008 2009 2010 2011 2012 2013 2014 2015 2016 Bonds Issued 62.6 15.0 60.0 169.2 222.2 239.9 229.6 214.8 161.8 110.3 Bonds Retired (45.4) (43.9) (43.0) (45.4) (48.9) (53.3) (54.6) (61.5) (81.1) (88.4) Outstanding at Year End 724.2 695.3 712.3 836.1 1,009.3 1,196.0 1,370.9 1,524.2 1,604.9 1,626.9
By Fiscal Year for: 2007 2008 2009 2010 2011 2012 2013 2014 2015 2016 Bonds Issued 24.5 10.0 - 355.0 525.0 695.0 445.0 375.0 265.0 195.0 Bonds Retired (119.3) (122.8) (122.6) (130.3) (147.2) (154.5) (181.0) (192.2) (210.9) (211.9) Outstanding at Year End 2,165.0 2,052.1 1,929.6 2,154.2 2,532.0 3,072.5 3,336.6 3,519.4 3,573.6 3,556.6
By Fiscal Year for: 2007 2008 2009 2010 2011 2012 2013 2014 2015 2016 Bonds Issued 258.0 125.0 150.0 1,104.8 1,375.6 2,164.7 1,780.4 1,135.3 1,019.9 816.5 Bonds Retired (577.6) (587.8) (561.2) (587.5) (611.0) (625.4) (717.4) (790.0) (855.6) (884.1) Outstanding at Year End 9,925.7 9,462.9 9,051.8 9,569.2 10,333.7 11,873.0 12,935.9 13,281.3 13,445.6 13,378.1
Bonds paid in next 10 Years 54% 57% 59% 58% 58% 57% 56% 57% 57% 58%Remaining Average Life (years) 9.88 9.52 9.16 9.16 9.23 9.42 9.45 9.31 9.18 9.01
By Fiscal Year for: 2007 2008 2009 2010 2011 2012 2013 2014 2015 2016 Bonds Issued - 50.0 100.0 50.2 50.2 100.4 100.4 89.2 83.7 83.7 Bonds Repaid (130.7) (138.1) (137.1) (145.5) (149.0) (150.4) (157.9) (169.6) (171.4) (175.9) Outstanding at Year End 2,188.9 2,100.8 2,063.7 1,968.3 1,869.5 1,819.5 1,761.9 1,681.5 1,593.8 1,501.5
Bonds paid in next 10 Years 65% 68% 70% 72% 73% 74% 74% 73% 73% 73%Remaining Average Life (years) 8.90 8.46 8.20 7.87 7.57 7.44 7.36 7.33 7.34 7.43
By Fiscal Year for: 2007 2008 2009 2010 2011 2012 2013 2014 2015 2016 Bonds Issued - - - - - - - - - - Bonds Repaid - (50.0) (50.0) (50.0) (50.0) (100.0) (100.0) (100.0) (100.0) (100.0) Outstanding at Year End 10,000.0 9,950.0 9,900.0 9,850.0 9,800.0 9,700.0 9,600.0 9,500.0 9,400.0 9,300.0
Bonds paid in next 10 Years 8% 9% 11% 12% 15% 17% 20% 24% 29% 34%Remaining Average Life (years) 19.65 18.74 17.83 16.92 16.00 15.16 14.30 13.45 12.58 11.70
GENERAL OBLIGATION BONDS FOR CAPITAL PURPOSES
GENERAL OBLIGATION BONDS FOR PENSION FUNDING
Long Term General Obligation and Build Illinois Bonds
($ Millions)
School Construction
Public Transportation, Air and Rail (Tran B)
Road Construction (Tran A)
Bonds Issued, Retired, and Outstanding
Capital Development Fund, Economic Development, Coal and Energy, and Anti-Pollution
BUILD ILLINOIS SALES TAX REVENUE BONDS FOR CAPITAL PURPOSES
Note –Table does not include effect of the proposed restructuring of GO and BI Bonds
12 - 12
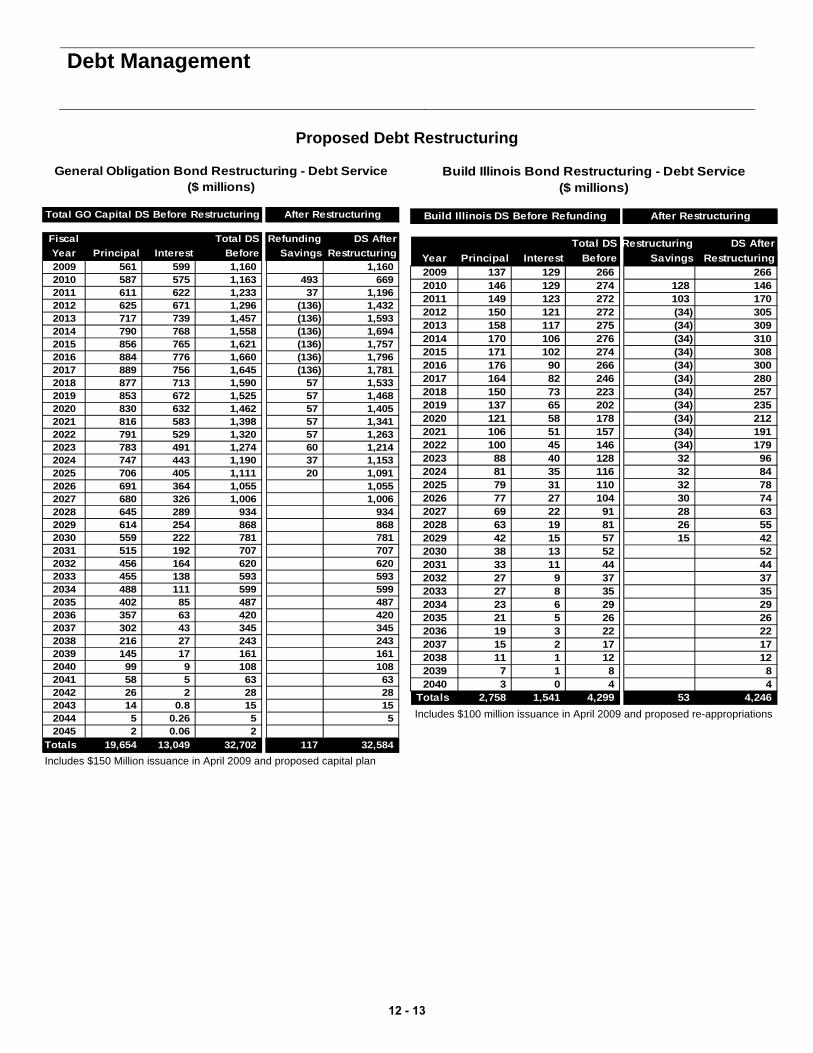
Debt Management
Proposed Debt Restructuring
Includes $150 Million issuance in April 2009 and proposed capital plan
Includes $100 million issuance in April 2009 and proposed re-appropriations
Total DS Restructuring DS AfterYear Principal Interest Before Savings Restructuring2009 137 129 266 266 2010 146 129 274 128 146 2011 149 123 272 103 170 2012 150 121 272 (34) 305 2013 158 117 275 (34) 309 2014 170 106 276 (34) 310 2015 171 102 274 (34) 308 2016 176 90 266 (34) 300 2017 164 82 246 (34) 280 2018 150 73 223 (34) 257 2019 137 65 202 (34) 235 2020 121 58 178 (34) 212 2021 106 51 157 (34) 191 2022 100 45 146 (34) 179 2023 88 40 128 32 96 2024 81 35 116 32 84 2025 79 31 110 32 78 2026 77 27 104 30 74 2027 69 22 91 28 63 2028 63 19 81 26 55 2029 42 15 57 15 42 2030 38 13 52 52 2031 33 11 44 44 2032 27 9 37 37 2033 27 8 35 35 2034 23 6 29 29 2035 21 5 26 26 2036 19 3 22 22 2037 15 2 17 17 2038 11 1 12 12 2039 7 1 8 8 2040 3 0 4 4
Totals 2,758 1,541 4,299 53 4,246
Build Illinois DS Before Refunding After Restructuring
Build Illinois Bond Restructuring - Debt Service($ millions)
Fiscal Total DS Refunding DS AfterYear Principal Interest Before Savings Restructuring2009 561 599 1,160 1,160 2010 587 575 1,163 493 669 2011 611 622 1,233 37 1,196 2012 625 671 1,296 (136) 1,432 2013 717 739 1,457 (136) 1,593 2014 790 768 1,558 (136) 1,694 2015 856 765 1,621 (136) 1,757 2016 884 776 1,660 (136) 1,796 2017 889 756 1,645 (136) 1,781 2018 877 713 1,590 57 1,533 2019 853 672 1,525 57 1,468 2020 830 632 1,462 57 1,405 2021 816 583 1,398 57 1,341 2022 791 529 1,320 57 1,263 2023 783 491 1,274 60 1,214 2024 747 443 1,190 37 1,153 2025 706 405 1,111 20 1,091 2026 691 364 1,055 1,055 2027 680 326 1,006 1,006 2028 645 289 934 934 2029 614 254 868 868 2030 559 222 781 781 2031 515 192 707 707 2032 456 164 620 620 2033 455 138 593 593 2034 488 111 599 599 2035 402 85 487 487 2036 357 63 420 420 2037 302 43 345 345 2038 216 27 243 243 2039 145 17 161 161 2040 99 9 108 108 2041 58 5 63 63 2042 26 2 28 28 2043 14 0.8 15 15 2044 5 0.26 5 5 2045 2 0.06 2
Totals 19,654 13,049 32,702 117 32,584
Total GO Capital DS Before Restructuring After Restructuring
General Obligation Bond Restructuring - Debt Service($ millions)
12 - 13

12 - 14

DEMOGRAPHIC INFORMATION
www.state.il.us/budget
CHAPTER 13

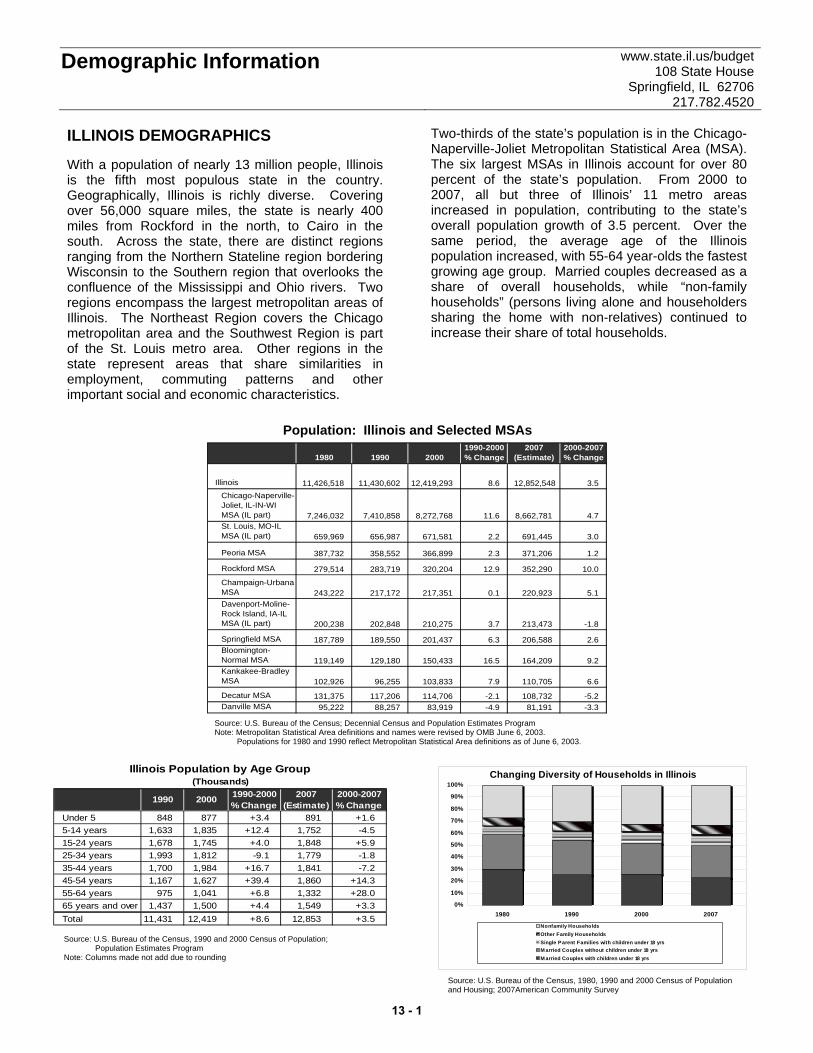
Demographic Information www.state.il.us/budget 108 State House
Springfield, IL 62706 217.782.4520
ILLINOIS DEMOGRAPHICS With a population of nearly 13 million people, Illinois is the fifth most populous state in the country. Geographically, Illinois is richly diverse. Covering over 56,000 square miles, the state is nearly 400 miles from Rockford in the north, to Cairo in the south. Across the state, there are distinct regions ranging from the Northern Stateline region bordering Wisconsin to the Southern region that overlooks the confluence of the Mississippi and Ohio rivers. Two regions encompass the largest metropolitan areas of Illinois. The Northeast Region covers the Chicago metropolitan area and the Southwest Region is part of the St. Louis metro area. Other regions in the state represent areas that share similarities in employment, commuting patterns and other important social and economic characteristics.
Two-thirds of the state’s population is in the Chicago-Naperville-Joliet Metropolitan Statistical Area (MSA). The six largest MSAs in Illinois account for over 80 percent of the state’s population. From 2000 to 2007, all but three of Illinois’ 11 metro areas increased in population, contributing to the state’s overall population growth of 3.5 percent. Over the same period, the average age of the Illinois population increased, with 55-64 year-olds the fastest growing age group. Married couples decreased as a share of overall households, while “non-family households” (persons living alone and householders sharing the home with non-relatives) continued to increase their share of total households.
1980 1990 2000
1990-2000 % Change
2007 (Estimate)
2000-2007 % Change
Illinois 11,426,518 11,430,602 12,419,293 8.6 12,852,548 3.5Chicago-Naperville-Joliet, IL-IN-WI MSA (IL part) 7,246,032 7,410,858 8,272,768 11.6 8,662,781 4.7St. Louis, MO-IL MSA (IL part) 659,969 656,987 671,581 2.2 691,445 3.0
Peoria MSA 387,732 358,552 366,899 2.3 371,206 1.2
Rockford MSA 279,514 283,719 320,204 12.9 352,290 10.0
Champaign-Urbana MSA 243,222 217,172 217,351 0.1 220,923 5.1Davenport-Moline-Rock Island, IA-IL MSA (IL part) 200,238 202,848 210,275 3.7 213,473 -1.8
Springfield MSA 187,789 189,550 201,437 6.3 206,588 2.6Bloomington-Normal MSA 119,149 129,180 150,433 16.5 164,209 9.2Kankakee-Bradley MSA 102,926 96,255 103,833 7.9 110,705 6.6
Decatur MSA 131,375 117,206 114,706 -2.1 108,732 -5.2Danville MSA 95,222 88,257 83,919 -4.9 81,191 -3.3
Source: U.S. Bureau of the Census; Decennial Census and Population Estimates Program Note: Metropolitan Statistical Area definitions and names were revised by OMB June 6, 2003. Populations for 1980 and 1990 reflect Metropolitan Statistical Area definitions as of June 6, 2003.
Population: Illinois and Selected MSAs
Changing Diversity of Households in Illinois
0%
10%
20%
30%
40%
50%
60%
70%
80%
90%
100%
1980 1990 2000 2007
Nonfamily HouseholdsOther Family HouseholdsSingle Parent Families with children under 18 yrsM arried Couples without children under 18 yrsM arried Couples with children under 18 yrs
Source: U.S. Bureau of the Census, 1980, 1990 and 2000 Census of Population and Housing; 2007American Community Survey
1990 2000 1990-2000 % Change
2007 (Estimate)
2000-2007 % Change
Under 5 848 877 +3.4 891 +1.65-14 years 1,633 1,835 +12.4 1,752 -4.515-24 years 1,678 1,745 +4.0 1,848 +5.925-34 years 1,993 1,812 -9.1 1,779 -1.835-44 years 1,700 1,984 +16.7 1,841 -7.245-54 years 1,167 1,627 +39.4 1,860 +14.355-64 years 975 1,041 +6.8 1,332 +28.065 years and over 1,437 1,500 +4.4 1,549 +3.3Total 11,431 12,419 +8.6 12,853 +3.5
Illinois Population by Age Group(Thousands)
Source: U.S. Bureau of the Census, 1990 and 2000 Census of Population; Population Estimates Program Note: Columns made not add due to rounding
13 - 1

Demographic Information
www.state.il.us/budget 108 State House
Springfield, IL 62706 217.782.4520
5:34:34 PM
13 - 2

Demographic Information www.state.il.us/budget 108 State House
Springfield, IL 62706 217.782.4520
Between 1990 and 2000 every region of the state had improvements in the level of educational attainment. The percentage of the population age 25 and over either lacking a high school diploma or being a high school graduate decreased throughout the state. The number of people that have gone beyond a basic high school diploma also uniformly increased in all regions. The Northeast Region has the greatest share of college graduates in Illinois, with nearly 30 percent of the population. The Northwest Region had the smallest percentage of
college graduates, but had the second highest percentage of people who have pursued education beyond high school.
The importance of educational attainment can be seen by examining the per capita income in the ten regions of the state. The Northeast Region had the highest per capita income in Illinois in 2006 with $42,300. The Southern Region, which had the largest share of people lacking a high school diploma also had the lowest per capita income of $25,700.
Educational Attainment by Economic Development Region
Population 25 years & over
% Less than High School Graduate
% High School Graduate
% Some College no Bachelor’s
% Bachelor’s Degree or Higher
1990 2000 1990 2000 1990 2000 1990 2000 1990 2000 ILLINOIS 7,293,930 7,973,671 23.8 18.6 30.0 27.7 25.2 27.6 21.0 26.1 Central 335,248 347,604 23.0 16.2 38.1 36.8 23.0 27.2 15.9 19.8 East Central 207,236 211,046 19.6 14.4 33.8 32.0 24.7 28.4 21.9 25.2 North Central 376,041 404,045 21.3 15.0 36.0 33.0 25.1 29.5 17.6 22.5 Northeast 4,781,496 5,335,722 23.3 19.0 26.7 24.3 25.6 26.7 24.3 29.9 Northern Stateline 243,449 274,032 23.6 18.1 36.5 34.4 24.6 29.3 15.3 18.2
Northwest 326,492 339,495 24.4 17.7 38.9 37.4 24.5 30.3 12.2 14.6 Southeast 171,793 178,649 27.7 19.7 37.9 37.5 23.2 29.3 11.2 13.5 Southern 249,160 258,404 31.6 22.9 32.1 31.9 23.8 30.3 12.5 14.9 Southwest 450,312 470,315 27.1 18.4 34.6 33.3 25.0 30.9 13.2 17.4 West Central 152,703 154,359 24.4 17.3 38.4 38.2 23.3 28.2 14.0 16.3
Source: U.S. Bureau of the Census (data are for people 25 years of age and older)
Per Capita Personal Income by Economic Development Region
Additional economic and demographic information can be found at the following websites:
www.illinois.gov www.commerce.state.il.us/dceo
www.ides.state.il.us www.isbe.state.il.us www.ibhe.state.il.us
www.census.gov
Region 1980 1990 2000 2001 2002 2003 2004 2005 2006ILLINOIS 11,005 20,824 32,186 32,537 32,891 33,811 35,106 36,489 38,409
Central 9,506 17,602 26,172 26,783 27,062 29,652 29,545 29,541 30,819East Central 9,062 16,720 24,534 25,174 25,423 28,896 28,039 27,416 28,667North Central 10,383 17,929 27,585 28,230 28,497 29,969 31,272 32,084 34,040Northeast 11,932 22,958 35,546 35,800 36,125 36,659 38,278 40,162 42,337Northern Stateline 10,087 18,492 26,983 26,560 26,923 27,667 27,715 28,245 29,483Northwest 9,777 16,974 25,662 25,774 26,018 27,201 28,706 29,094 30,560Southeast 8,092 15,170 22,750 23,190 23,047 24,561 25,697 25,426 26,599Southern 7,962 14,022 20,734 21,632 22,129 24,073 24,307 24,557 25,685Southwest 9,260 16,713 25,614 26,335 27,168 28,299 29,067 29,902 31,071West Central 8,494 14,725 22,707 23,223 23,542 25,586 26,234 25,592 26,622
Source: Regional Economic Information System, Bureau of Economic Analysis, U.S. Department of CommerceNote: State totals differ from other tables due to time series releases of Local data and State data
13 - 3
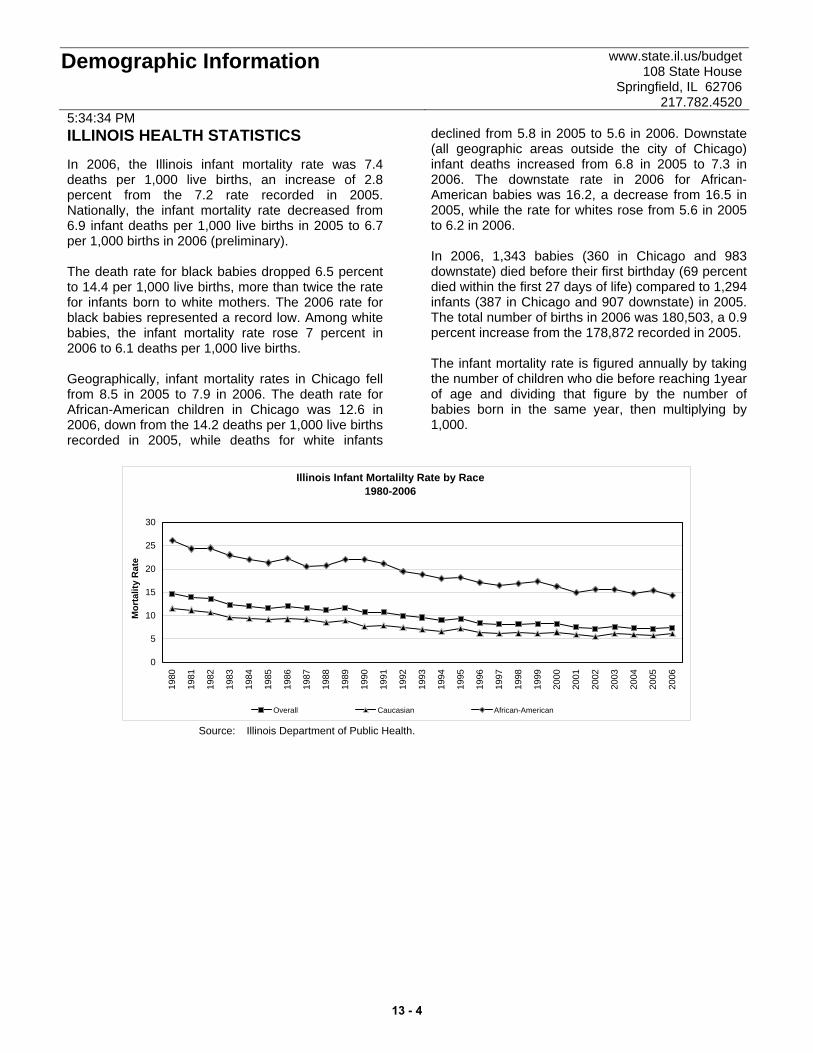
Demographic Information
www.state.il.us/budget 108 State House
Springfield, IL 62706 217.782.4520
5:34:34 PM
ILLINOIS HEALTH STATISTICS In 2006, the Illinois infant mortality rate was 7.4 deaths per 1,000 live births, an increase of 2.8 percent from the 7.2 rate recorded in 2005. Nationally, the infant mortality rate decreased from 6.9 infant deaths per 1,000 live births in 2005 to 6.7 per 1,000 births in 2006 (preliminary). The death rate for black babies dropped 6.5 percent to 14.4 per 1,000 live births, more than twice the rate for infants born to white mothers. The 2006 rate for black babies represented a record low. Among white babies, the infant mortality rate rose 7 percent in 2006 to 6.1 deaths per 1,000 live births. Geographically, infant mortality rates in Chicago fell from 8.5 in 2005 to 7.9 in 2006. The death rate for African-American children in Chicago was 12.6 in 2006, down from the 14.2 deaths per 1,000 live births recorded in 2005, while deaths for white infants
declined from 5.8 in 2005 to 5.6 in 2006. Downstate (all geographic areas outside the city of Chicago) infant deaths increased from 6.8 in 2005 to 7.3 in 2006. The downstate rate in 2006 for African-American babies was 16.2, a decrease from 16.5 in 2005, while the rate for whites rose from 5.6 in 2005 to 6.2 in 2006. In 2006, 1,343 babies (360 in Chicago and 983 downstate) died before their first birthday (69 percent died within the first 27 days of life) compared to 1,294 infants (387 in Chicago and 907 downstate) in 2005. The total number of births in 2006 was 180,503, a 0.9 percent increase from the 178,872 recorded in 2005. The infant mortality rate is figured annually by taking the number of children who die before reaching 1year of age and dividing that figure by the number of babies born in the same year, then multiplying by 1,000.
Illinois Infant Mortalilty Rate by Race
1980-2006
0
5
10
15
20
25
30
1980
1981
1982
1983
1984
1985
1986
1987
1988
1989
1990
1991
1992
1993
1994
1995
1996
1997
1998
1999
2000
2001
2002
2003
2004
2005
2006
Mor
talit
y R
ate
Overall Caucasian African-American
Source: Illinois Department of Public Health.
13 - 4
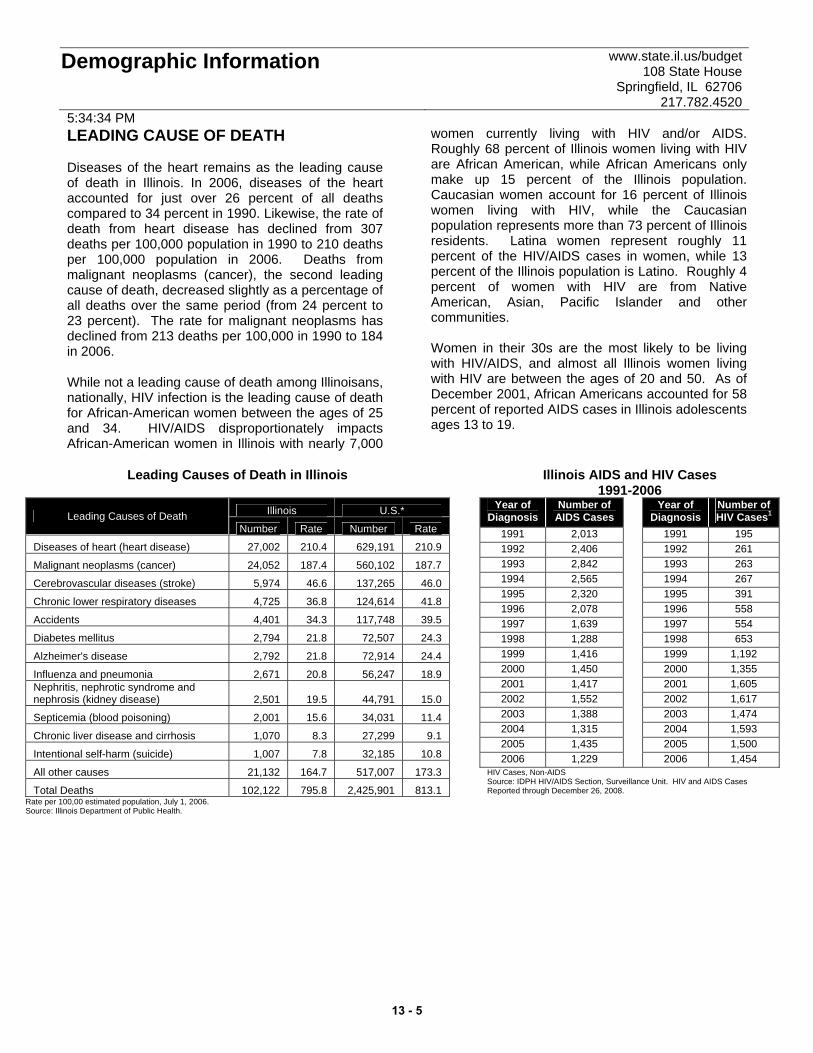
Demographic Information
www.state.il.us/budget 108 State House
Springfield, IL 62706 217.782.4520
5:34:34 PM
LEADING CAUSE OF DEATH Diseases of the heart remains as the leading cause of death in Illinois. In 2006, diseases of the heart accounted for just over 26 percent of all deaths compared to 34 percent in 1990. Likewise, the rate of death from heart disease has declined from 307 deaths per 100,000 population in 1990 to 210 deaths per 100,000 population in 2006. Deaths from malignant neoplasms (cancer), the second leading cause of death, decreased slightly as a percentage of all deaths over the same period (from 24 percent to 23 percent). The rate for malignant neoplasms has declined from 213 deaths per 100,000 in 1990 to 184 in 2006. While not a leading cause of death among Illinoisans, nationally, HIV infection is the leading cause of death for African-American women between the ages of 25 and 34. HIV/AIDS disproportionately impacts African-American women in Illinois with nearly 7,000
women currently living with HIV and/or AIDS. Roughly 68 percent of Illinois women living with HIV are African American, while African Americans only make up 15 percent of the Illinois population. Caucasian women account for 16 percent of Illinois women living with HIV, while the Caucasian population represents more than 73 percent of Illinois residents. Latina women represent roughly 11 percent of the HIV/AIDS cases in women, while 13 percent of the Illinois population is Latino. Roughly 4 percent of women with HIV are from Native American, Asian, Pacific Islander and other communities. Women in their 30s are the most likely to be living with HIV/AIDS, and almost all Illinois women living with HIV are between the ages of 20 and 50. As of December 2001, African Americans accounted for 58 percent of reported AIDS cases in Illinois adolescents ages 13 to 19.
Leading Causes of Death in Illinois
Illinois AIDS and HIV Cases
1991-2006 Illinois U.S.* Leading Causes of Death
Number Rate Number Rate
Diseases of heart (heart disease) 27,002 210.4 629,191 210.9
Malignant neoplasms (cancer) 24,052 187.4 560,102 187.7
Cerebrovascular diseases (stroke) 5,974 46.6 137,265 46.0
Chronic lower respiratory diseases 4,725 36.8 124,614 41.8
Accidents 4,401 34.3 117,748 39.5
Diabetes mellitus 2,794 21.8 72,507 24.3
Alzheimer's disease 2,792 21.8 72,914 24.4
Influenza and pneumonia 2,671 20.8 56,247 18.9 Nephritis, nephrotic syndrome and nephrosis (kidney disease) 2,501 19.5 44,791 15.0
Septicemia (blood poisoning) 2,001 15.6 34,031 11.4
Chronic liver disease and cirrhosis 1,070 8.3 27,299 9.1
Intentional self-harm (suicide) 1,007 7.8 32,185 10.8
All other causes 21,132 164.7 517,007 173.3
Total Deaths 102,122 795.8 2,425,901 813.1
Year of Diagnosis
Number of AIDS Cases
Year of Diagnosis
Number of HIV Cases1
1991 2,013 1991 195 1992 2,406 1992 261 1993 2,842 1993 263 1994 2,565 1994 267 1995 2,320 1995 391 1996 2,078 1996 558 1997 1,639 1997 554 1998 1,288 1998 653 1999 1,416 1999 1,192 2000 1,450 2000 1,355 2001 1,417 2001 1,605 2002 1,552 2002 1,617 2003 1,388 2003 1,474 2004 1,315 2004 1,593 2005 1,435 2005 1,500 2006 1,229 2006 1,454
HIV Cases, Non-AIDS Source: IDPH HIV/AIDS Section, Surveillance Unit. HIV and AIDS Cases Reported through December 26, 2008.
Rate per 100,00 estimated population, July 1, 2006. Source: Illinois Department of Public Health.
13 - 5

13 - 6

GLOSSARY
www.state.il.us/budget
CHAPTER 14

Glossary
www.state.il.us/budget 108 State House
Springfield, IL 62706 217.782.4520
ALPLM - Abraham Lincoln Presidential Library and Museum Abusive Tax Shelters - Any plan or arrangement devised for the principal purpose of avoiding federal and state income tax, including but not limited to, "listed transactions" as defined by the Internal Revenue Service. Accrual Method - A method of recognition of accounting transactions when the transactions occur, regardless of when the money for them is actually received or paid. In other words, income is counted when the sale occurs, and expenses are counted when the goods or services are received. Activity Measure - Information or data used to quantify the delivery of state services. For instance, the number of people served and the number of cases closed. Ad Valorem Tax - A tax assessment levied on either the actual or estimated value of an item or service, rather than its usage. All Funds - Every fund appropriated to, or spent by, an agency. American Recovery and Reinvestment Act (ARRA) – The federal government's $787 billion plan to jump-start the U.S. economy and create jobs. It will modernize healthcare, improve schools, build and repair infrastructure, and invest in the clean energy technologies of the future. Programs in Illinois that will receive funding through ARRA are denoted in the Fiscal Year 2010 Budget Book as "Federal recovery." Annualize - To provide full-year funding in the next fiscal year when a program is started or a person is hired part way through the current fiscal year. Appropriation - Spending authority from a specific fund given by the General Assembly and approved by the governor for a specific amount, purpose and time period. Assessments - A levy imposed for a specific purpose, typically the medical assessment program under which the Department of Healthcare and Family Services levies a fee on long-term care and other providers to help fund Medicaid liability. Attrition - Natural reduction in caseload or staff. For example, attrition through retirement or resignation.
Authorization - An act of the legislature that establishes or continues a program or agency and sets forth the guidelines to which it must adhere. Available Fund Balance - The total amount of money in a fund at a particular point in time, typically at the beginning of a month or year.
Balanced Budget - A balanced budget occurs when total receipts equal total outlays for a fiscal year. Balance Sheet - Presentation of the financial condition at a specific point in time including assets, liabilities and fund balance. Basis of Accounting - The method of accounting used to track and report state revenues and expenditures, for example: cash, budgetary or accrual. Benchmark – A measurement that allows comparison to other similar organizations. This can be used to track performance over time. It is important to use a relevant peer group. BIBRI – Build Illinois Bond Redemption Fund Bond - A debt security that grants the holder specific and binding authority to receive a return of principal and periodic interest payments up to and including the instrument’s maturity. The state uses bonds to finance long-term capital projects. Bond Fund - A fund that receives proceeds from the sale of bonds to be used for capital projects. Bond Rating - An assessment of the credit risk with respect to a specific bond issue. Bond Retirement and Interest Fund - A fund used to repay principal and interest on bonds or other debt obligations, typically spent pursuant to a continuing and irrevocable appropriation. Budgetary Balance - Available cash balance on June 30 minus lapse period spending for the fiscal year just ended.
Budget Authority - Budget authority is the authority provided by law to incur financial obligations that will result in outlays.
14 - 1
Glossary
www.state.il.us/budget 108 State House
Springfield, IL 62706 217.782.4520
Budget Deficit - The excess of expenditures over revenues in a fiscal year. Build Illinois - A state economic development and public infrastructure program begun in 1986 and primarily funded by dedicated state sales tax revenue bonds.
Budget Resolution - The annual framework that sets targets for total budget authority, total outlays, total revenues, and the deficit (on-budget), as well as discretionary and mandatory allocations within the spending targets.
Cap - Legal limit on annual discretionary spending.
Capital - Buildings, structures, equipment and land. Acquisition, development, construction and improvement of capital is typically funded through bond funds. Capital Budget - A capital budget is a spending blueprint that identifies capital projects that invest in assets with a long, useful life for the state. Capital Expenditures - Includes expenditures from all aspects of the capital budget: financial and physical planning, land acquisition, architecture and engineering, construction and durable equipment purchases, and grants and loans to other entities for capital purposes. Case Management - Monitoring and oversight of the delivery of services, which may include coordination of all services to a client. Caseload - The number of clients being served at a point in time, sometimes used in the context of clients per staff. Cash Flow - The amount of cash available for use during a period of time, calculated by subtracting spending from the sum of the receipts and the beginning balance. Census - Population measure, typically of clients in a facility or program. Certificate of Participation - Similar to bonds or other debt instruments; a security issued by the state or a third party that gives the holder a share of the stream of annual appropriated lease payments made by the state.
Client - A person or family receiving services, typically from a human service agency. CMS - Central Management Services Commodities - Line item for consumable items used in connection with current agency operations. For instance, household, medical or office supplies; food for those in institutions; coal, bottled and natural gas; and equipment costing less than $100. Common School Fund - One of four funds that comprise the state general funds. It is used to fund Elementary and Secondary Education. If revenues to the fund from the lottery, bingo, public utility, cigarette and sales taxes and from investment income, among others, are insufficient to make monthly general state aid payments, the Common School Fund receives automatic transfers from the General Revenue Fund. Consent Decree - An agreement between both parties in a lawsuit that binds them and determines their rights and obligations. While made under sanction of the court, it does not bind the court, and it is not a judicial sentence. Continuing Appropriation - Statutory authority for the comptroller and treasurer to spend funds in the event the legislature fails to appropriate necessary funds or appropriates an insufficient amount for a specified purpose. Examples of continuing appropriations are for debt service on state bonds or payments to the state retirement systems. Continuing Resolution - Provides for the ongoing operation of the government in the absence of enacted appropriations, usually at the same spending rate as the prior year. Contractual Services - Line item for services provided by a non-state employee or vendor including, utilities; medical services for those in institutions; professional, technical or artistic consulting; and property and equipment rental. Debt Service - Payment of principal, interest and other obligations associated with the retirement of debt. Debt Held by the Public - The cumulative amount of money the state has borrowed from the public and not repaid.
14 - 2

Glossary
www.state.il.us/budget 108 State House
Springfield, IL 62706 217.782.4520
Debt Limit - The maximum amount of state debt that may legally be outstanding at any time. It includes both the debt held by the public and the debt held by government accounts. When the debt limit is reached, the government cannot borrow more money until the legislature has enacted a law to increase the limit. Dedicated Funds - Revenues assessed and collected for a specific state program.
Deficit - See Budget Deficit Depreciation - The allocation of the value of capital assets over time. Discretionary Spending - Spending that the legislature controls through annual appropriations bills. Divisions - Organizational units within agencies designated as such for programmatic or administrative convenience. Education Assistance Fund - One of four funds that comprise the state general funds. It is used to fund elementary, secondary and higher education. It receives 7.3 percent of the state income tax net of refunds, as well as wagering taxes paid to the state by riverboat casinos. EEO - Equal Employment Opportunity Electronic Data Processing (EDP) - Line item for lease or purchase of computer or other data processing equipment and related services including supplies, services and personnel. EMAP - Emergency Management Accreditation Program Employee Retirement Contributions Paid by State (Pension Pick-Up) - Line item for payment of an employee’s required contribution to the State Employees’ Retirement System, which an agency has chosen or contracted to make on behalf of the employee. Entitlement - Program benefits that must be provided in a timely fashion to those who meet eligibility criteria and that may not be taken away without due process.
Equipment - Line item for non-consumable items of tangible personal property used in connection with current agency operations, for instance, office furniture, vehicles or machinery, and scientific or other major instruments and apparatus. Executive Branch - Distinguished from the legislative and judicial branches of state government, it is charged with the detail of carrying out and effectuating the law through the day-to-day operations and activities of state government. The governor, as chief executive officer of the state, is responsible for the operation and administration of state agencies. Executive Order - A decree or mandate issued by the governor for the purpose of interpreting or implementing a provision of the law. Executive orders often are used to reorganize and assign functions among executive agencies, create advisory and special commissions and boards or direct state agencies regarding policy. Expenditures - State spending. Agencies submit payment vouchers to the comptroller’s office, which prepares a state check (warrant) and maintains accounting records. Warrants are presented to the treasurer, who maintains and invests state funds. Federal Aid - Funding provided by the federal government. Fiscal Note - A statement attached to a bill giving the estimated amount of increase or decrease in revenue or expenditures, and the present and future fiscal implications of a bill. Fiscal Year - Illinois state government’s fiscal year is July 1 through June 30. This is the period during which obligations are incurred, encumbrances are made and appropriations are expended. The federal government’s fiscal year is October 1 through September 30. FPL - Federal Poverty Level FTE - See Full Time Equivalent Full Faith and Credit - A pledge or promise to repay general obligation debt, typically includes all of an issuer’s taxing powers. Full-Time Equivalent - A calculated measure of full-time employment for comparison purposes, in which
14 - 3

Glossary
www.state.il.us/budget 108 State House
Springfield, IL 62706 217.782.4520
each full-time employee works 37.5 hours per week for 52 weeks per year. Fund - An account established to hold money for specific programs, activities or objectives. Fund Balance - The amount of cash available in a fund as of a given date. The end of year cash balance is equal to the beginning of year cash balance, plus receipts, minus disbursements. GASB - Governmental Accounting Standards Board General Funds - (usually lower-case) Refers to the following group of funds, inclusively: the General Revenue Fund, the Education Assistance Fund, the Common School Fund, and the General Revenue-Common School Special Account Fund. General Obligation Bonds - Bonds issued for capital purposes as direct legal obligations secured by general tax revenues and guaranteed by the full faith and credit of the state. General Revenue-Common School Special Account Fund - One of four funds that comprise the state general funds. It is used for accounting purposes to receive 25 percent of state sales tax and subsequently transfer these moneys to the Common School Fund. General Revenue Fund - The largest of four funds that comprise the state general funds. It receives the majority of undedicated tax revenues, mostly income and sales taxes, for use generally to operate and administer state programs. General State Aid - An unrestricted formula-driven grant that comprises the largest portion of state assistance to local school districts. The amount of funds a district receives depends on its financial need measured by its average daily attendance, its equalized assessed valuation of property, its local tax measured by its statutory tax rate, and its concentration of low-income families within the district. GCDHC - Governor’s Commission on Discrimination and Hate Crimes GFOA - Government Finance Officers Association
GOMB - The Governor’s Office of Management and Budget; serves the governor’s financial, management and budgeting needs by providing accurate, timely and objective information. Grant - An award or contribution to be used either for a specific or a general purpose, typically with no repayment provision. Group Insurance - Line item for life and health insurance program for all state employees, retirees and their dependents. Headcount - A statement of the number of employees for some period of time, typically either the actual number of staff working or a calculated full-time equivalent. Highway Fund - A fund that receives special dedicated revenues related to transportation. For example, the motor fuel tax or federal highway trust funds, to be used to support the construction and maintenance of transportation facilities and activities. Hiring Lag - The savings in personal services and benefits associated with the time period between an employee leaving the job and a replacement being hired. I-CLEAR - Integrated Citizens and Law Enforcement Analysis and Reporting System. Illinois FIRST - A $12 billion, multi-year public works initiative begun in fiscal year 2000. Half of the money is provided from bond proceeds with the remainder covered by a combination of local, state and federal resources. Income Tax Surcharge - Originally a temporary increase of 0.5 percent in the state personal income tax and 0.8 percent in the corporate income tax established in July 1989 to fund education, local governments and property tax relief. Subsequently, in July 1991, half of the surcharge was made permanent and dedicated to education. The remaining half was made permanent in July 1993. Infant Mortality - Measure of infant deaths during the first year of life per 1,000 live births. Infrastructure - The underlying foundation or framework of a system or organization; it is indispensable to supporting the purposes of and operations of a wide range of public and private
14 - 4

Glossary
www.state.il.us/budget 108 State House
Springfield, IL 62706 217.782.4520
sector entities and activities. The physical infrastructure of the State of Illinois is the framework of facilities including prisons, universities, mental health centers and state parks; and the transportation network encompassing highways, bridges, airports, public transit rail, freight rail and passenger systems. IT - Information Technology ITECS - Illinois Transportable Emergency Communications System Judicial Branch - Distinguished from the legislative and executive branches of state government, it is charged with interpreting and applying laws. Lapse - The portion of an appropriation that is not spent during the authorized period, typically the fiscal year, including the lapse period. Lapse Period - The two-month period following the fiscal year (July 1 to August 31) when agencies can liquidate liabilities incurred before the end of that fiscal year (June 30). Public Act 89-511, effective in fiscal year 1997, reduced the lapse period from three months to two months. Lapse Period Spending - Spending that occurs during the lapse period from the previous year’s appropriation. LESO - Law Enforcement Support Office LEED – Leadership in Energy and Environment Design standard for Green Building design. Legislative Branch - Distinguished from the judicial and executive branches of state government, it is charged with making and enacting the law, including appropriations. Legislative Transfer - Reallocation of appropriation amounts among line items by the General Assembly during the fiscal year. Distinguished from a 2 percent transfer, which may be accomplished by the executive branch without participation of the legislative branch. Line Item - Specific purpose of an appropriation, for instance, personal services, retirement, printing or travel. Liquidate - To settle or pay a debt, or to convert assets into cash.
Local Government Distributive Fund - Receives one-tenth of the income tax proceeds to the general funds, via a transfer, for distribution to units of local government based on population. Funds may be used for any purpose. Lump Sum - Appropriation line for a general program purpose without specific line items identified. Managed Care - The process of coordinating and controlling all services provided to a client to assure efficient and effective results. Mandate – A law or regulation that generally should be followed, whether or not funding is provided. The State Mandates Act permits certain regulations and laws to be ignored if funding is not provided.
Mandatory Spending - Is controlled by permanent law rather than annual appropriations.
Match - Contribution to program required to receive a program grant, may be either money (hard match) or services (soft match). Medicaid - Public assistance financed jointly by the state and federal governments to provide medical care for individuals who meet certain eligibility criteria. Modified Accrual Basis - The basis of accounting under which revenues should be recognized during the accounting period in which they become available and measurable. Expenditures should be recognized during the accounting period in which the fund liability is incurred, if measurable, except for unmatured interest on general long-term debt, which should be recognized when due. Moral Obligation - A duty that is not binding or enforceable by law, typically debt service on bonds issued by others that the state agrees to consider funding if the issuer is unable to pay. There is no legal guarantee the state will make such payments. MD - Metropolitan District MSAs - Metropolitan Statistical Areas N/A - Not available NFIRS - National Fire Incident Reporting System NITE - National Information Technology Equipment
14 - 5
Glossary
www.state.il.us/budget 108 State House
Springfield, IL 62706 217.782.4520
Obligations - Binding agreements that result in outlays, immediately or in the future. Opportunity Returns - A program created in 2003 to coordinate state, federal and local economic development expenditures in the state and organize development activities by 10 distinct economic regions. Other Funds - All state and federal funds except the four general funds. Other Operations - Administrative non-grant expenses of state agencies except salaries and payments for fringe benefits. For example, contractual services, travel, printing and telecommunications. Outlays - The primary measure of government spending; they are payments to liquidate obligations, largely measured on a cash basis. Pay-As-You-Go - Refers to requirements that new mandatory spending proposals or tax reductions must be offset by cuts in other mandatory spending or by tax increases. Peer Group - A relevant sample of similar agencies or organizations. Peer group can be defined by size, geography, complexity, function, etc. Pension - Money paid under given conditions to a person following retirement or to surviving dependents. Pension Liability - Pension liabilities arise due to an underfunding of the pension trust. When the underfunding exceeds the accumulated benefit obligation, a liability must be recognized. Per Diem - By the day. An amount of so much paid for each day. Performance Measure - Information or data used to determine the quality and outcomes of state services; for instance, the number of people who receive jobs following job counseling and employment services or the number of people who remain off drugs following treatment services. Personal Services - Line item for salary payments to employees.
Phase-In - Staged expenditure pattern, such as initiating a program, hiring employees or opening an institution over time (see Annualize). Pilot Program - Tentative model for future full scale development, typically a program operated in a limited area or targeted to a limited population to analyze its effectiveness before expanding its scope. Position Title - Name and description of a job. Printing - Line item for contractual services, materials and supplies used to produce and print information; for example, letterhead stationery, annual reports and forms. Program Area - Major organizational categories of state government, including education, human services, public safety, environment and business regulations, economic development and infrastructure and government services. Reappropriation - An unspent appropriation that continues into the next fiscal year, typically for a capital or other multi-year project or liability. Recommended - Governor’s budget requests presented to the General Assembly for its approval. Receipts - Governmental receipts, sometimes called revenues, are the collections of money that primarily result from taxes, fees, and similar government powers to compel payment. Refunding Bonds - Bonds issued to refinance other outstanding bonds, which generally were originally issued at higher interest rates. Refunds - Line item for return of funds to the rightful owner, typically return of overpaid taxes or fees. Repair and Maintenance - Line item for upkeep, restoration and improvement of equipment and facilities in connection with current agency operations. Reserve - Portion of appropriation intentionally set aside and not spent, either to increase lapse or as a contingency for increased liabilities in other line items. Resources - All assets available for use by agencies, whether appropriated or not.
14 - 6

Glossary
www.state.il.us/budget 108 State House
Springfield, IL 62706 217.782.4520
Retirement - Line item for employer’s share of contributions to the state retirement system. Revenues - Receipts from taxes, fees, assessments, grants and other payments used to fund programs. Revolving Fund - Receives intergovernmental payments charged for providing central operational services, such as computer, purchasing, state garage and telecommunications. Road Fund - Receives motor fuel tax and other transportation-related revenues for use to operate the Department of Transportation, Illinois State Police and the Secretary of State’s Office, and to build and maintain roads, bridges and other transportation facilities. Shared Services Program - A multi-year program to reorganize state resources into high-performance, technology-based Shared Services Centers in order to more efficiently and effectively fulfill common service needs. The initial phase of this program focuses on the state's fiscal and human resources related operations. SEOC - State Emergency Operations Center Social Security - Line item for employer’s share of contributions to the Federal Insurance Contributions Act (FICA) tax. Special State Funds - All state funds except the general funds, bond-financed funds, debt service funds, federal trust funds and state trust funds. State Agency - Government organization created by statute to administer and implement particular legislation. Statute - A law enacted by the General Assembly and approved by the governor. Structural Deficit - When the collective expenses of state obligations increase at a rate faster than the revenues received over an extended period covering more than one fiscal year. Substitute Care - A program to place children away from their families in foster homes or residential facilities.
Superfund – The federal environmental program established to address abandoned hazardous waste sites. Supplemental Appropriation - Additional spending authority given by the General Assembly during the fiscal year, following passage of the initial budget. Surplus - A surplus is the amount by which receipts exceed outlays in a fiscal year Target - A quantifiable metric to which an organization aspires. Incorporates elements of both performance and time to enable ranking of performance.
Transfer - Reallocation of resources, typically movement of money from one fund to another or shift of appropriation authority among line items by the legislative or the executive branch. Trust Fund - Receives revenues assessed and collected for a specific state program. Two Percent Transfer - Reallocation of appropriation amounts by the governor during the fiscal year, limited to 2 percent of an agency’s appropriation by fund for specific operations lines. This is different from a legislative transfer, which requires approval by the legislative branch. Unobligated Balance - Funding that has been approved or is available, but not yet obligated for any particular purpose. VESSA - Victims’ Economic Security and Safety Act VOCA - Victims of Crime Act Voids - Checks (warrants) that are not cashed.
Voucher - Document requesting payment submitted to the comptroller, who then writes and issues a warrant.
Warrant - Check issued by the comptroller to a third party who cashes it with the treasurer. Zero Coupon Bonds - Bonds without interest coupons for semi-annual payment. Interest accrues over the life of the bond and is paid at maturity along with the principal.
14 - 7

14 - 8


State of IllinoisPat Quinn, Governor
Printed by the Authority of the State of Illinois
IOCI 384-09 2M 3/09
Printed on Recycled Content