Pressure-shift measurements of the oxygen A-band by Fourier-transform spectroscopy
5
Pressure-shift measurements of the oxygen A-band by Fourier-transform spectroscopy Christian Hill, a, * David A. Newnham, b and John M. Brown a a Physical and Theoretical Chemistry Laboratory, Oxford University, South Parks Road, Oxford OX1 3QZ, UK b Space Science and Technology Department, Rutherford Appleton Laboratory, Chilton, Didcot, Oxon OX11 0QX, UK Received 25 September 2002; in revised form 21 December 2002 Abstract The pressure shifts, d, of the (0–0) band of the b 1 R þ g –X 3 R g electronic transition of oxygen (the so-called ÔA-bandÕ) have been measured at room temperature using high-resolution Fourier transform spectroscopy. The rotational dependence of d has been measured and characterised; the average value of the shift over the whole band is 0:009 0:001 cm 1 atm 1 . No significant var- iation in d is found for different O 2 mixing ratios in N 2 , and the results presented here are therefore appropriate for high-resolution atmospheric applications using the O 2 A-band. Ó 2003 Elsevier Science (USA). All rights reserved. 1. Introduction Despite being formally forbidden by spectroscopic selection rules, the b 1 R þ g –X 3 R g electronic transition of oxygen plays a significant role in atmospheric studies, e.g. [1–3]. It is often important in these studies to know the exact line-centre position of the component rota- tional transitions as a function of pressure. The results presented here focus on the (0–0) vibrational band of the b–X system, the so-called A-band of oxygen. Since the half-width of these lines at 1 atm is typically 0:05 cm 1 ,a shift of up to 0:01 cm 1 may be significant and is com- parable to the atmospheric wind-induced Doppler shift (measured by Balthasar et al. [4] to be a maximum of 0.008 cm 1 ). In the atmosphere, the cumulative effect of pressure shifts at different altitudes is known to be one reason for the observed asymmetry of absorption lines [5]. Several studies of pressure shifts in the A-band have been published, as briefly summarised in Table 1. It is clear that there is still considerable disagreement be- tween these studies (even for comparatively recent measurements) and the uncertainties quoted for d are as high as 50%. In particular, the most commonly used database for line parameters in atmospheric science, the HITRAN list [6], currently recommends values for d in this band which are up to half the magnitude of those found in a recent study by Phillips and Hamilton [7]. The relative magnitude of the self-shift ðd self ) and air- shift ðd air ) parameters is also undecided (see Table 1). As noted by Brown and Plymate [8], further work is nec- essary to obtain a consensus about the A-band pressure shift, and this need motivates the present study. 2. Experimental All spectra were recorded at the Rutherford Appleton Laboratory with a Bruker IFS 120HR high-resolution Fourier-transform spectrometer and a multi-pass optical absorption cell in a White configuration [9]. A halogen lamp (Phillips 7158, 150 W) provided the spectrometer light source through a 0.5 mm aperture; all optical windows were made of CaF 2 . The stainless-steel cell was adjusted to give a total path length of 16.137 m. Optical filters (Corion S10-767-F) were chosen to isolate the band pass and maximise the signal-to-noise ratio within a practical acquisition time. Interferograms were co-added and processed using the Bruker acquisition Journal of Molecular Spectroscopy 219 (2003) 65–69 www.elsevier.com/locate/jms * Corresponding author. Fax. +44-0-1865-275410. E-mail addresses: [email protected] (C. Hill), jmb@phy- schem.ox.ac.uk (J.M. Brown). 0022-2852/03/$ - see front matter Ó 2003 Elsevier Science (USA). All rights reserved. doi:10.1016/S0022-2852(03)00017-1
-
Upload
christian-hill -
Category
Documents
-
view
216 -
download
4
Transcript of Pressure-shift measurements of the oxygen A-band by Fourier-transform spectroscopy

Pressure-shift measurements of the oxygen A-band byFourier-transform spectroscopy
Christian Hill,a,* David A. Newnham,b and John M. Browna
a Physical and Theoretical Chemistry Laboratory, Oxford University, South Parks Road, Oxford OX1 3QZ, UKb Space Science and Technology Department, Rutherford Appleton Laboratory, Chilton, Didcot, Oxon OX11 0QX, UK
Received 25 September 2002; in revised form 21 December 2002
Abstract
The pressure shifts, d, of the (0–0) band of the b1Rþg –X
3R�g electronic transition of oxygen (the so-called �A-band�) have been
measured at room temperature using high-resolution Fourier transform spectroscopy. The rotational dependence of d has beenmeasured and characterised; the average value of the shift over the whole band is �0:009� 0:001cm�1 atm�1. No significant var-iation in d is found for different O2 mixing ratios in N2, and the results presented here are therefore appropriate for high-resolutionatmospheric applications using the O2 A-band.
� 2003 Elsevier Science (USA). All rights reserved.
1. Introduction
Despite being formally forbidden by spectroscopic
selection rules, the b1Rþg –X
3R�g electronic transition of
oxygen plays a significant role in atmospheric studies,
e.g. [1–3]. It is often important in these studies to know
the exact line-centre position of the component rota-tional transitions as a function of pressure. The results
presented here focus on the (0–0) vibrational band of the
b–X system, the so-called A-band of oxygen. Since the
half-width of these lines at 1 atm is typically 0:05cm�1, ashift of up to 0:01cm�1 may be significant and is com-parable to the atmospheric wind-induced Doppler shift
(measured by Balthasar et al. [4] to be a maximum of
�0.008 cm�1). In the atmosphere, the cumulative effectof pressure shifts at different altitudes is known to be
one reason for the observed asymmetry of absorption
lines [5].
Several studies of pressure shifts in the A-band have
been published, as briefly summarised in Table 1. It is
clear that there is still considerable disagreement be-
tween these studies (even for comparatively recent
measurements) and the uncertainties quoted for d are ashigh as 50%. In particular, the most commonly used
database for line parameters in atmospheric science, the
HITRAN list [6], currently recommends values for d inthis band which are up to half the magnitude of those
found in a recent study by Phillips and Hamilton [7].
The relative magnitude of the self-shift ðdself ) and air-shift ðdair) parameters is also undecided (see Table 1). Asnoted by Brown and Plymate [8], further work is nec-
essary to obtain a consensus about the A-band pressure
shift, and this need motivates the present study.
2. Experimental
All spectra were recorded at the Rutherford Appleton
Laboratory with a Bruker IFS 120HR high-resolutionFourier-transform spectrometer and a multi-pass optical
absorption cell in a White configuration [9]. A halogen
lamp (Phillips 7158, 150W) provided the spectrometer
light source through a 0.5mm aperture; all optical
windows were made of CaF2. The stainless-steel cell was
adjusted to give a total path length of 16.137m. Optical
filters (Corion S10-767-F) were chosen to isolate the
band pass and maximise the signal-to-noise ratio withina practical acquisition time. Interferograms were
co-added and processed using the Bruker acquisition
Journal of Molecular Spectroscopy 219 (2003) 65–69
www.elsevier.com/locate/jms
*Corresponding author. Fax. +44-0-1865-275410.
E-mail addresses: [email protected] (C. Hill), jmb@phy-
schem.ox.ac.uk (J.M. Brown).
0022-2852/03/$ - see front matter � 2003 Elsevier Science (USA). All rights reserved.doi:10.1016/S0022-2852(03)00017-1
processor and OPUS software [10]. Since line-centre
positions were of primary interest in this study, no nu-
merical apodisation (i.e., a box-car function) was ap-
plied in the Fourier transformation of the data, to
minimise line broadening. At the pressures used, most
lines were well-separated and ringing effects (side-lobe
artefacts introduced by truncating the interferogram
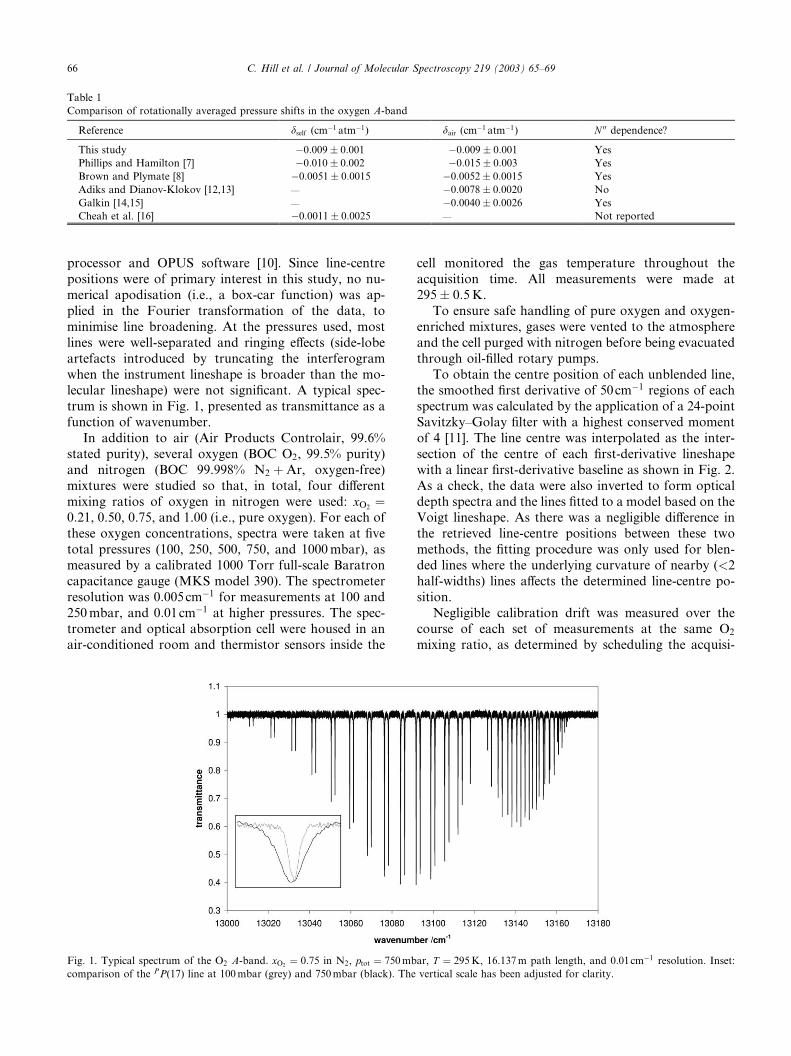
when the instrument lineshape is broader than the mo-lecular lineshape) were not significant. A typical spec-
trum is shown in Fig. 1, presented as transmittance as a
function of wavenumber.
In addition to air (Air Products Controlair, 99.6%
stated purity), several oxygen (BOC O2, 99.5% purity)
and nitrogen (BOC 99.998% N2 þAr, oxygen-free)mixtures were studied so that, in total, four different
mixing ratios of oxygen in nitrogen were used: xO2 ¼0:21, 0.50, 0.75, and 1.00 (i.e., pure oxygen). For each ofthese oxygen concentrations, spectra were taken at five
total pressures (100, 250, 500, 750, and 1000mbar), as
measured by a calibrated 1000 Torr full-scale Baratron
capacitance gauge (MKS model 390). The spectrometer
resolution was 0:005cm�1 for measurements at 100 and250mbar, and 0:01cm�1 at higher pressures. The spec-trometer and optical absorption cell were housed in anair-conditioned room and thermistor sensors inside the
cell monitored the gas temperature throughout the
acquisition time. All measurements were made at
295� 0:5K.To ensure safe handling of pure oxygen and oxygen-
enriched mixtures, gases were vented to the atmosphere
and the cell purged with nitrogen before being evacuated
through oil-filled rotary pumps.
To obtain the centre position of each unblended line,the smoothed first derivative of 50cm�1 regions of eachspectrum was calculated by the application of a 24-point
Savitzky–Golay filter with a highest conserved moment
of 4 [11]. The line centre was interpolated as the inter-
section of the centre of each first-derivative lineshape
with a linear first-derivative baseline as shown in Fig. 2.
As a check, the data were also inverted to form optical
depth spectra and the lines fitted to a model based on theVoigt lineshape. As there was a negligible difference in
the retrieved line-centre positions between these two
methods, the fitting procedure was only used for blen-
ded lines where the underlying curvature of nearby (<2half-widths) lines affects the determined line-centre po-
sition.
Negligible calibration drift was measured over the
course of each set of measurements at the same O2mixing ratio, as determined by scheduling the acquisi-
Table 1
Comparison of rotationally averaged pressure shifts in the oxygen A-band
Reference dself (cm�1 atm�1) dair (cm�1 atm�1) N 00 dependence?
This study �0:009� 0:001 �0:009� 0:001 Yes
Phillips and Hamilton [7] �0:010� 0:002 �0:015� 0:003 Yes
Brown and Plymate [8] �0:0051� 0:0015 �0:0052� 0:0015 Yes
Adiks and Dianov-Klokov [12,13] — �0:0078� 0:0020 No
Galkin [14,15] — �0:0040� 0:0026 Yes
Cheah et al. [16] �0:0011� 0:0025 — Not reported
Fig. 1. Typical spectrum of the O2 A-band. xO2 ¼ 0:75 in N2, ptot ¼ 750mbar, T ¼ 295K, 16.137m path length, and 0:01cm�1 resolution. Inset:comparison of the PP(17) line at 100mbar (grey) and 750mbar (black). The vertical scale has been adjusted for clarity.
66 C. Hill et al. / Journal of Molecular Spectroscopy 219 (2003) 65–69

tion of low-pressure spectra in between higher-pressure
measurements. Comparison of spectra taken several
hours apart at 100mbar showed a difference in mea-
sured line-centre positions of much less (typically<0:0001cm�1) than the pressure shift to be measured,and the good straight line regression shown in Fig. 3
also testifies to the calibration stability. Of course, this
method provides no absolute calibration of the wave-
number scale, and consequently line positions are not
reported in this study.
The pressure shifts, d (reported in cm�1 atm�1), areobtained by linear least-squares regression of the re-trieved line-centre positions against the total pressure at
which they were measured, as shown in Fig. 3 for two
oxygen mixing ratios (pure O2: xO2 ¼ 1:00, and air:xO2 ¼ 0:21). As can be seen from this figure, a good
linear relation is obtained, with a slope (within experi-
mental error) independent of xO2 . The regression wasonly attempted when line-centre positions were obtained
for all five pressures considered.
3. Results and discussion
The retrieved pressure-shift parameters for 37 lines in
the oxygen A-band are given in Table 2, with errors at�2r, and plotted in Fig. 4 as d (the average oxygenpressure shift in cm�1 atm�1) against line-centre wave-number. As can be seen from this figure, our values for dlie between those retrieved in two recent studies [7,8].
The large uncertainty in the measurements of Brown
and Plymate [8] was noted by those authors, whose
primary objectives were measurements of line intensities
and broadening parameters, and who concluded theirpaper with an exhortation to other groups to improve
on the accuracy to which the shifts are measured. The
present study, covering a wider range of pressures and at
higher resolution does just that and we find values for dwhich lie closest to those of Phillips and Hamilton [7],
who recorded spectra at three pressures and lower
(0:05cm�1) resolution. Quantitatively, the average ratioof our values of d to those of Phillips and Hamilton is0.89 (standard deviation 0.07); comparison with Brown
and Plymate�s results gives a ratio of 1.89 (standarddeviation 0.47).
Fig. 4 also shows a characteristic dependence of d onthe ground-state rotational quantum number N 00, whichis reported in all three studies. However, Phillips and
Hamilton [7] found the same pressure shift for each
Fig. 3. Linear regression of the retrieved centre position of the PP(15)
O2 line, for two oxygen concentrations. Note that the slope of this
regression is very similar for both values of xO2 , indicating that the self-shift and nitrogen-shift parameters are equal to within our experi-
mental error. Error bars are at �1r standard deviation.
Fig. 2. Determination of the line-centre position from the smoothed first-derivative lineshape, as described in the text. Linear interpolation to the
1� f baseline is found to be adequate.
C. Hill et al. / Journal of Molecular Spectroscopy 219 (2003) 65–69 67

J-component of a given DN transition, whereas ourvalues of d show a small variation with J (particularly
for the DN ¼ �1 branches), which can also be seen at adifferent magnitude in the results of Brown and Plymate
[8]. Further qualitative agreement with the results of
that study is illustrated in Fig. 5, a plot of d against theupper-state quantum number, J 0: P-branch lines are
pressure shifted to a greater extent than R-branch lines
(at least up to J 0 � 15), but the magnitude of d increasesmore slowly with J 0 for the P branch than for the R
branch.
The magnitude of d is found to be independent of O2mixing ratio in nitrogen within the experimental error,
in agreement with Brown and Plymate [8] and in marked
contrast to the reported results of Phillips and Hamilton
[7] who find N2-induced shifts a factor of 2 greater than
the self-shift.
Table 2
Oxygen pressure shifts for lines in the b–X (0–0) band
Line DNDJðN 00Þ m (cm�1) d (cm�1 atm�1) �2r error(cm�1 atm�1)
PP(21) 13041.1251 )0.0089 0.0012PQ(21) 13042.9487 )0.0093 0.0015PP(19) 13050.4813 )0.0091 0.0010PQ(19) 13052.3233 )0.0093 0.0011PP(17) 13059.4670 )0.0099 0.0007PQ(17) 13061.3278 )0.0095 0.0008PP(15) 13068.0823 )0.0097 0.0006PQ(15) 13069.9624 )0.0095 0.0006PP(13) 13076.3278 )0.0098 0.0005PQ(13) 13078.2280 )0.0095 0.0005PP(11) 13084.2040 )0.0097 0.0005PQ(11) 13086.1257 )0.0095 0.0005PP(9) 13091.7109 )0.0098 0.0005PQ(9) 13093.6563 )0.0097 0.0006PP(7) 13098.8488 )0.0099 0.0005PQ(7) 13100.8223 )0.0094 0.0006PP(5) 13105.6175 )0.0091 0.0005PQ(5) 13107.6291 )0.0091 0.0007PP(3) 13112.0166 )0.0087 0.0009PQ(3) 13114.1009 )0.0085 0.0011PP(1) 13118.0456 )0.0064 0.0015RQ(1) 13128.2695 )0.0066 0.0012RR(3) 13131.4920 )0.0066 0.0012RQ(3) 13133.4416 )0.0074 0.0010RR(5) 13136.2176 )0.0087 0.0008RQ(5) 13138.2053 )0.0079 0.0007RR(7) 13140.5679 )0.0086 0.0009RQ(7) 13142.5838 )0.0081 0.0008RR(9) 13144.5413 )0.0086 0.0008RQ(9) 13146.5810 )0.0087 0.0008RR(11) 13148.1357 )0.0098 0.0010RQ(11) 13150.1971 )0.0092 0.0009RR(13) 13151.3491 )0.0091 0.0010RQ(13) 13153.4309 )0.0089 0.0011RR(15) 13154.1793 )0.0083 0.0012RQ(15) 13156.2807 )0.0102 0.0012RR(17) 13156.6237 )0.0107 0.0018
Fig. 5. Retrieved O2 pressure shifts plotted against upper-state quan-
tum number, J 0 for each branch in the A-band (error bars at �2r). Inagreement with previous results [8], jdj is larger for the DN ¼ �1, thanfor the DN ¼ þ1 branches (labelled P(N) and R(N) respectively), but
increases less rapidly with J 0.
Fig. 4. Retrieved O2 pressure shifts for the O2 A-band, with error bars at �2r. Values of d for this study and that of [8] are averaged over xO2 ; thosefrom [7] are the oxygen self-shift.
68 C. Hill et al. / Journal of Molecular Spectroscopy 219 (2003) 65–69

4. Conclusion
The rotationally averaged pressure shift, d, of therotational lines of the O2 b–X (0–0) band is found to be
�0:009� 0:001cm�1 atm�1, in broad agreement withPhillips and Hamilton [7] and approximately twice as
large as that reported by Brown and Plymate [8] and
listed in the current HITRAN database. Nitrogen in-
duces a line-shift of the same amount as oxygen itself(the self-shift), within the experimental error. Since our
measurements were taken as part of a dedicated study of
line shifts, at higher spectral resolution, and with smaller
experimental error than previous studies we believe our
results can be taken as the most accurate measurements
of d to date.The studies published to date on the oxygen A-band
show a striking agreement in their prediction of thevariation of the pressure shift with rotational quantum
number. There is a distinctive and reproducible depen-
dence of d on N 00 which has no immediately obviousexplanation. The theory of pressure shifts in the spectra
of O2 is not well-developed, and it is clear that more
work is needed in this area to explain such phenomena.
Atmospheric applications demand spectroscopic pa-
rameters to be known to a high degree of accuracy and itis hoped that the results reported here will help to re-
solve some of the uncertainties connected with the
magnitude and nature of the O2 A-band pressure shift.
Acknowledgments
The research described in this paper was funded by theUKs Natural Environment Research Council (NERC)
through the Core-Strategic Measurements for Atmo-
spheric Science (COSMAS) Grant Ref. GST022698awarded to JMB at the University of Oxford. The
authors thank NERC for access to the Molecular Spec-
troscopy Facility at the Rutherford Appleton Labora-
tory (RAL) and Mr. R.G. Williams at RAL for
providing technical support.
References
[1] A. Kuze, K.V. Chance, J. Geophys. Res. 99 (1994) 14481–14491.
[2] D.M. O�Brien, R.M. Mitchell, S.A. English, G.A. Da Costa, J.Atmos. Oceanic Tech. 15 (1998) 1272–1286.
[3] P.B. Hays, V.J. Abreu, M.E. Dobbs, D.A. Gell, H.J. Grassl, W.R.
Skinner, J. Geophys. Res. 98 (1994) 10713–10723.
[4] H. Balthasar, U. Thiele, H. W€oohl, Astron. Astrophys. 114 (1985)
357–359.
[5] B. Caccin, F. Cavallini, G. Ceppatelli, A. Righini, A.M. Sambuco,
Astron. Astrophys. 149 (1985) 357–364.
[6] L.S. Rothman, C.P. Rinsland, A. Goldman, S.T. Massie, D.P.
Edwards, J.-M. Flaud, A. Perrin, C. Camy-Peyret, V. Dana, J.-Y.
Mandin, J. Schroeder, A. McCann, R.R. Gamache, R.B. Watt-
son, K. Yoshino, K.V. Chance, K.W. Jucks, L.R. Brown, V.
Nemtchinov, P. Varanasi, J. Quant. Spectrosc. Radiat. Transfer
60 (1998) 665–710.
[7] A.J. Phillips, P.A.Hamilton, J.Mol. Spectrosc. 174 (1995) 587–594.
[8] L.R. Brown, C. Plymate, J. Mol. Spectrosc. 199 (2000) 166–179.
[9] J.U. White, J. Opt. Soc. Am. 32 (1942) 285–288.
[10] OPUS (OPtics User Software) version 4 for Windows NT, Bruker
Optik GmbH.
[11] W.H. Press, S.A. Teukolsky, W.T. Vetterling, B.P. Flannery,
Numerical Recipes, second ed., Cambridge University Press,
Cambridge, 1994.
[12] T.G. Adiks, V.I. Dianov-Klokov, Opt. Spectrosc. 30 (1971) 110–
111.
[13] T.G. Adiks, V.I. Dianov-Klokov, Opt. Spectrosc. 32 (1972) 226.
[14] V.D. Galkin, Opt. Spectrosc. 35 (1973) 367–369.
[15] V.D. Galkin, Opt. Spectrosc. 46 (1979) 106–107.
[16] S.-L. Cheah, Y.-P. Lee, J.F. Ogilvie, J. Quant. Spectrosc. Radiat.
Transfer 64 (2000) 467–482.
C. Hill et al. / Journal of Molecular Spectroscopy 219 (2003) 65–69 69