Presidio Independent School District Presidio Independent School District Improvement Plan 2015-2016...
251
Presidio Independent School District District Improvement Plan 2015-2016 CCI Committee –Revised: August 6, 2015 District-wide Education Improvement Council Revised: May 29, 2015, November 12, 2015, December 7, 2015 Approved: January 07, 2016 School Board Approved: January 20, 2016 Presidio ISD does not discriminate on the basis of race, religion, color, national origin, sex, or disability in providing education services, activities, and programs, including vocational programs, in accordance with Title VI of the Civil Rights act of 1964, as amended; Title IX of the Educational Amendments of 1972; and Section 504 of the Rehabilitation Act of 1973, as amended. For more information call 432-229-3375.
Transcript of Presidio Independent School District Presidio Independent School District Improvement Plan 2015-2016...
Presidio Independent School District
District Improvement Plan
2015-2016
CCI Committee –Revised: August 6, 2015
District-wide Education Improvement Council
Revised: May 29, 2015, November 12, 2015, December 7, 2015
Approved: January 07, 2016
School Board Approved: January 20, 2016
Presidio ISD does not discriminate on the basis of race, religion, color, national origin, sex, or disability in providing education services, activities, and programs, including
vocational programs, in accordance with Title VI of the Civil Rights act of 1964, as amended; Title IX of the Educational Amendments of 1972; and Section 504 of the
Rehabilitation Act of 1973, as amended. For more information call 432-229-3375.
2
Table of Contents
District Improvement Plan 2015-2016
Summary
Introduction
Mission
District
Profile
District Improvement Plan
Focus Area: Student Learning
Focus Area: Quality Learning and Working Environment
Focus Area: Effective and Efficient Organization
Focus Area: Parent and Community Engagement
Special Population Improvement Plans
3
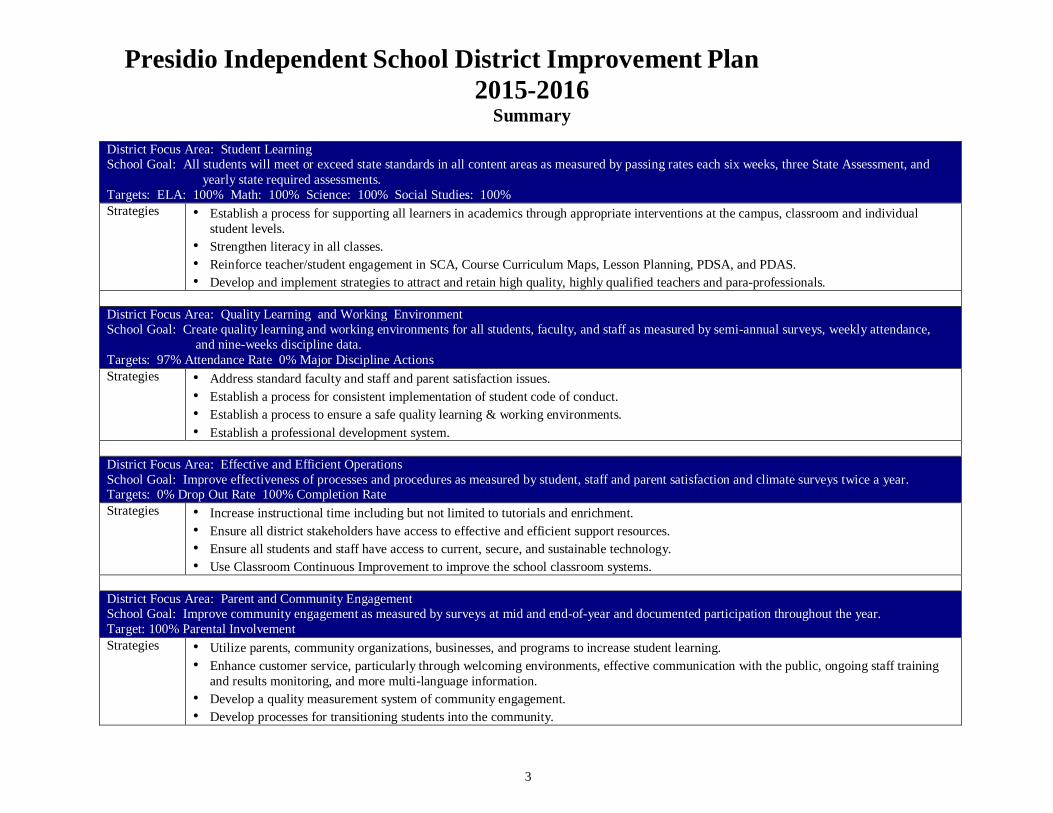
Presidio Independent School District Improvement Plan
2015-2016 Summary
District Focus Area: Student Learning School Goal: All students will meet or exceed state standards in all content areas as measured by passing rates each six weeks, three State Assessment, and
yearly state required assessments.
Targets: ELA: 100% Math: 100% Science: 100% Social Studies: 100%
Strategies • Establish a process for supporting all learners in academics through appropriate interventions at the campus, classroom and individual
student levels.
• Strengthen literacy in all classes.
• Reinforce teacher/student engagement in SCA, Course Curriculum Maps, Lesson Planning, PDSA, and PDAS.
• Develop and implement strategies to attract and retain high quality, highly qualified teachers and para-professionals.
District Focus Area: Quality Learning and Working Environment School Goal: Create quality learning and working environments for all students, faculty, and staff as measured by semi-annual surveys, weekly attendance,
and nine-weeks discipline data.
Targets: 97% Attendance Rate 0% Major Discipline Actions
Strategies • Address standard faculty and staff and parent satisfaction issues.
• Establish a process for consistent implementation of student code of conduct.
• Establish a process to ensure a safe quality learning & working environments.
• Establish a professional development system.
District Focus Area: Effective and Efficient Operations
School Goal: Improve effectiveness of processes and procedures as measured by student, staff and parent satisfaction and climate surveys twice a year. Targets: 0% Drop Out Rate 100% Completion Rate
Strategies • Increase instructional time including but not limited to tutorials and enrichment.
• Ensure all district stakeholders have access to effective and efficient support resources.
• Ensure all students and staff have access to current, secure, and sustainable technology.
• Use Classroom Continuous Improvement to improve the school classroom systems.
District Focus Area: Parent and Community Engagement School Goal: Improve community engagement as measured by surveys at mid and end-of-year and documented participation throughout the year.
Target: 100% Parental Involvement
Strategies • Utilize parents, community organizations, businesses, and programs to increase student learning.
• Enhance customer service, particularly through welcoming environments, effective communication with the public, ongoing staff training
and results monitoring, and more multi-language information.
• Develop a quality measurement system of community engagement.
• Develop processes for transitioning students into the community.
4
Introduction
The Presidio Independent School District (PISD) Improvement Plan (DIP) is prepared in accordance with requirements of Chapter 11,
Subchapter F, of the Texas Education Code, specifically §11.251 and §11.252. These requirements are also contained in PISD policies BQ
(Legal) and BQA (Legal).
Each school district shall have a district improvement plan that is developed, evaluated, and revised annually, in accordance with district policy,
by the Superintendent with the assistance of the district-level committee. The purpose of the district improvement plan is to guide district and
campus staff in the improvement of student performance for all student groups in order to attain state standards in respect to academic excellence
indicators.
The DIP is required by statute to include the following components:
• Comprehensive needs assessment
• Measurable district performance objectives
• Strategies for improvement of student performance
• Strategies for providing secondary students with information on higher education preparation and opportunities
• Description of resources needed to implement identified strategies
• Description of staff responsible accomplishing of each strategy
• Timelines for implementation of each strategy
• Formative evaluation criteria
In developing the 2015-2016 DIP, the entire faculty and administration of Presidio ISD spent two days in June 2015, to work on the needs
assessment, not only as a District but also at the campus level. Presidio ISD District-wide Education Improvement Council (DWEIC) met in
committee through the fall and spring semester of the 2014-2015 school years to review the Needs Assessment, proposed Performance
Objectives and Targets, and complete the Action Steps. Campuses review data and plans throughout the year; plans carry over from previous
years to continue the revisions and appropriate strategies to continue for the current year and make changes to continue to improve and address
the student needs. The full DWEIC reviewed throughout the year and May 29, 2015, November 12, 2015, December 7, 2015 Approved: January
07, 2016 CCI Committee Revised 08-06-15 The Board of Trustees provided final approval:

5
Mission
Public Education Mission Statement: The mission of the public education system of this state is to ensure that all Texas children have access to a quality education that enables them
to achieve their potential and fully participate now and in the future in the social, economic, and educational opportunities of our state and
nation.
This mission is grounded on the conviction that a general diffusion of knowledge is essential for the welfare of this state and for the preservation
of the liberties and rights of citizens. It is further grounded on the conviction that a successful public education system is directly related to a
strong, dedicated and supportive family and that parental involvement in the school is essential for the maximum educational achievement of a
child.
Texas Education Code (TEC) 4.001 Public Education Goals
The goals of public education are to serve as a foundation for a well-balanced and appropriate education. The students in the public education
system will demonstrate exemplary performance in:
Goal One: The reading and writing of the English language.
Goal Two: The understanding of mathematics. Goal Three: The understanding of science.
Goal Four: The understanding of social studies.
Texas Education Code (TEC) 4.002 Presidio Independent School District Mission Statement:
The mission of the Presidio Schools, in cooperation with parents and the community, is to provide quality education and related support to
school-aged children in an equitable and accountable manner so that each student may become a literate, productive, and responsible American
citizen in a changing world.
Board Approved 1/20/04
6
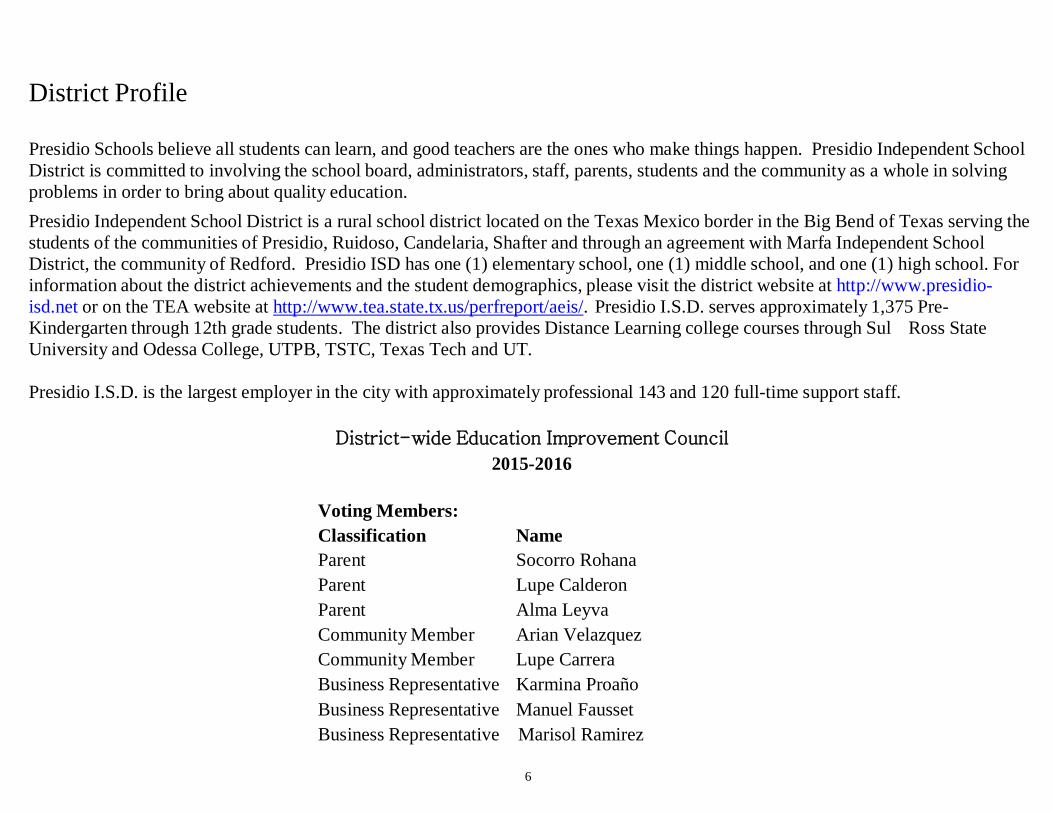
District Profile
Presidio Schools believe all students can learn, and good teachers are the ones who make things happen. Presidio Independent School
District is committed to involving the school board, administrators, staff, parents, students and the community as a whole in solving
problems in order to bring about quality education.
Presidio Independent School District is a rural school district located on the Texas Mexico border in the Big Bend of Texas serving the
students of the communities of Presidio, Ruidoso, Candelaria, Shafter and through an agreement with Marfa Independent School
District, the community of Redford. Presidio ISD has one (1) elementary school, one (1) middle school, and one (1) high school. For
information about the district achievements and the student demographics, please visit the district website at http://www.presidio-
isd.net or on the TEA website at http://www.tea.state.tx.us/perfreport/aeis/. Presidio I.S.D. serves approximately 1,375 Pre-
Kindergarten through 12th grade students. The district also provides Distance Learning college courses through Sul Ross State
University and Odessa College, UTPB, TSTC, Texas Tech and UT.
Presidio I.S.D. is the largest employer in the city with approximately professional 143 and 120 full-time support staff.
District-wide Education Improvement Council
2015-2016
Voting Members:
Classification Name
Parent Socorro Rohana
Parent Lupe Calderon
Parent Alma Leyva
Community Member Arian Velazquez
Community Member Lupe Carrera
Business Representative Karmina Proaño
Business Representative Manuel Fausset
Business Representative Marisol Ramirez
7
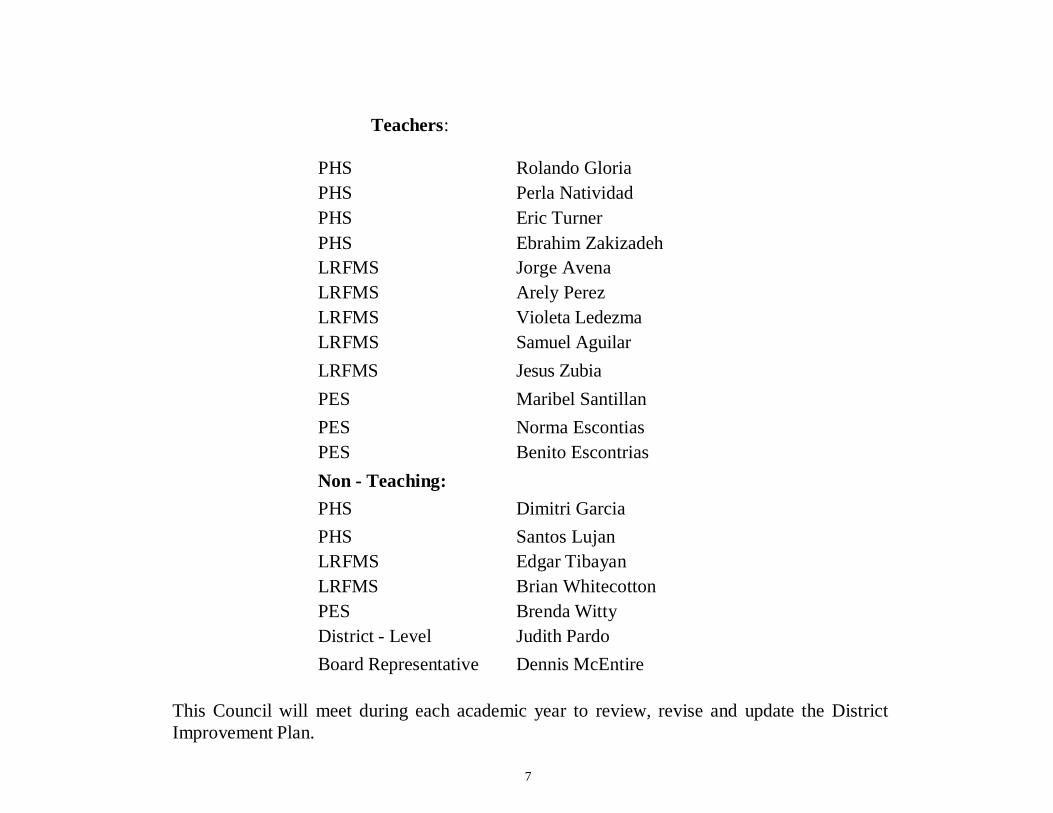
Teachers:
PHS Rolando Gloria
PHS Perla Natividad
PHS Eric Turner
PHS Ebrahim Zakizadeh
LRFMS Jorge Avena
LRFMS Arely Perez
LRFMS Violeta Ledezma
LRFMS Samuel Aguilar
LRFMS Jesus Zubia
PES Maribel Santillan
PES Norma Escontias
PES Benito Escontrias
Non - Teaching:
PHS Dimitri Garcia
PHS Santos Lujan
LRFMS Edgar Tibayan
LRFMS Brian Whitecotton
PES Brenda Witty
District - Level Judith Pardo
Board Representative Dennis McEntire
This Council will meet during each academic year to review, revise and update the District
Improvement Plan.
8
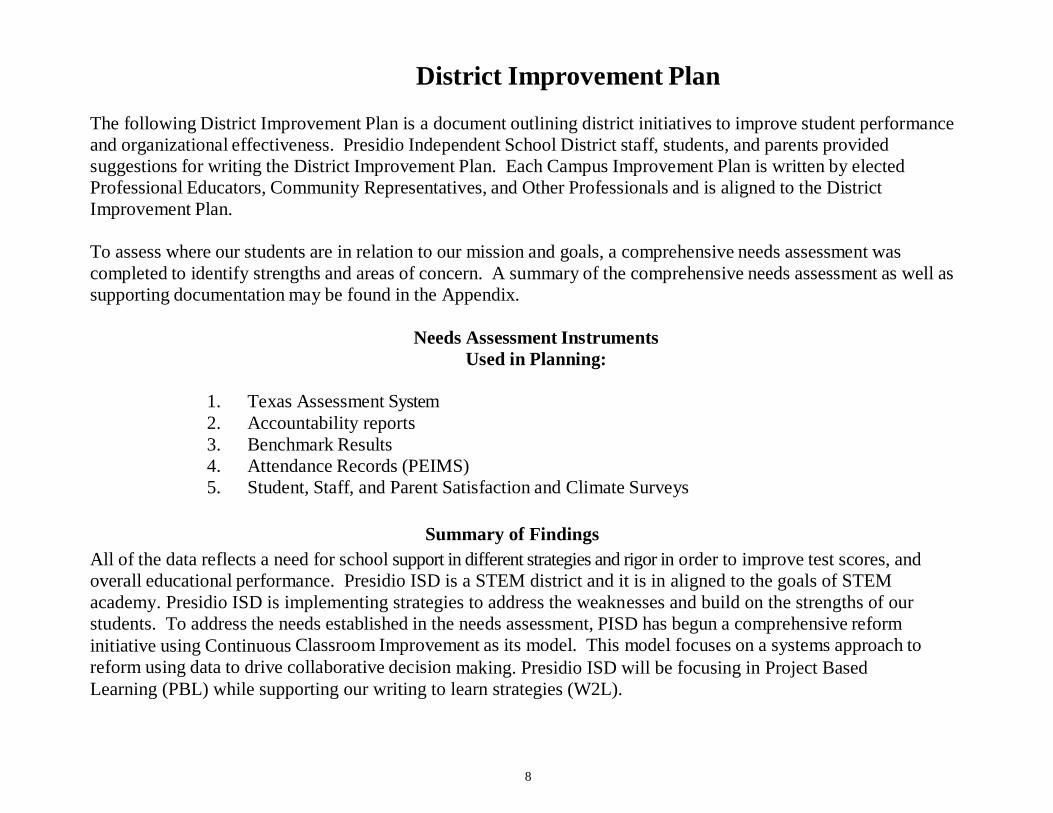
District Improvement Plan
The following District Improvement Plan is a document outlining district initiatives to improve student performance
and organizational effectiveness. Presidio Independent School District staff, students, and parents provided
suggestions for writing the District Improvement Plan. Each Campus Improvement Plan is written by elected
Professional Educators, Community Representatives, and Other Professionals and is aligned to the District
Improvement Plan.
To assess where our students are in relation to our mission and goals, a comprehensive needs assessment was
completed to identify strengths and areas of concern. A summary of the comprehensive needs assessment as well as
supporting documentation may be found in the Appendix.
Needs Assessment Instruments
Used in Planning:
1. Texas Assessment System
2. Accountability reports
3. Benchmark Results
4. Attendance Records (PEIMS)
5. Student, Staff, and Parent Satisfaction and Climate Surveys
Summary of Findings
All of the data reflects a need for school support in different strategies and rigor in order to improve test scores, and
overall educational performance. Presidio ISD is a STEM district and it is in aligned to the goals of STEM
academy. Presidio ISD is implementing strategies to address the weaknesses and build on the strengths of our
students. To address the needs established in the needs assessment, PISD has begun a comprehensive reform
initiative using Continuous Classroom Improvement as its model. This model focuses on a systems approach to
reform using data to drive collaborative decision making. Presidio ISD will be focusing in Project Based
Learning (PBL) while supporting our writing to learn strategies (W2L).
9
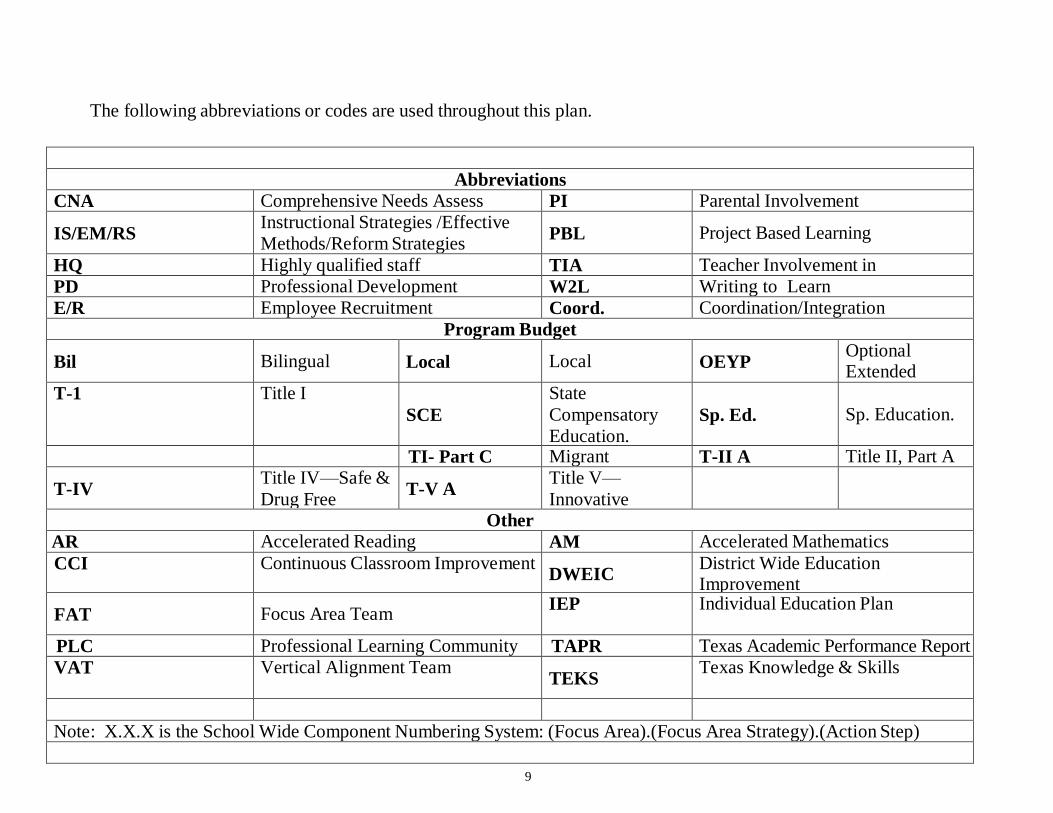
The following abbreviations or codes are used throughout this plan.
Abbreviations
CNA Comprehensive Needs Assess PI Parental Involvement
IS/EM/RS Instructional Strategies /Effective
Methods/Reform Strategies
PBL
Project Based Learning
HQ Highly qualified staff TIA Teacher Involvement in Assessments PD Professional Development W2L Writing to Learn
E/R Employee Recruitment Coord. Coordination/Integration
Program Budget
Codes
Bil
Bilingual
Local
Local
OEYP Optional Extended
Year T-1 Title I
SCE
State
Compensatory
Education.
Sp. Ed.
Sp. Education.
TI- Part C Migrant T-II A Title II, Part A
T-IV Title IV—Safe &
Drug Free
T-V A Title V—
Innovative
Other
Abbreviations AR Accelerated Reading AM Accelerated Mathematics
CCI Continuous Classroom Improvement
DWEIC District Wide Education Improvement
Council
FAT
Focus Area Team IEP Individual Education Plan
PLC Professional Learning Community TAPR Texas Academic Performance Report
VAT Vertical Alignment Team
TEKS Texas Knowledge & Skills
Note: X.X.X is the School Wide Component Numbering System: (Focus Area).(Focus Area Strategy).(Action Step)
10
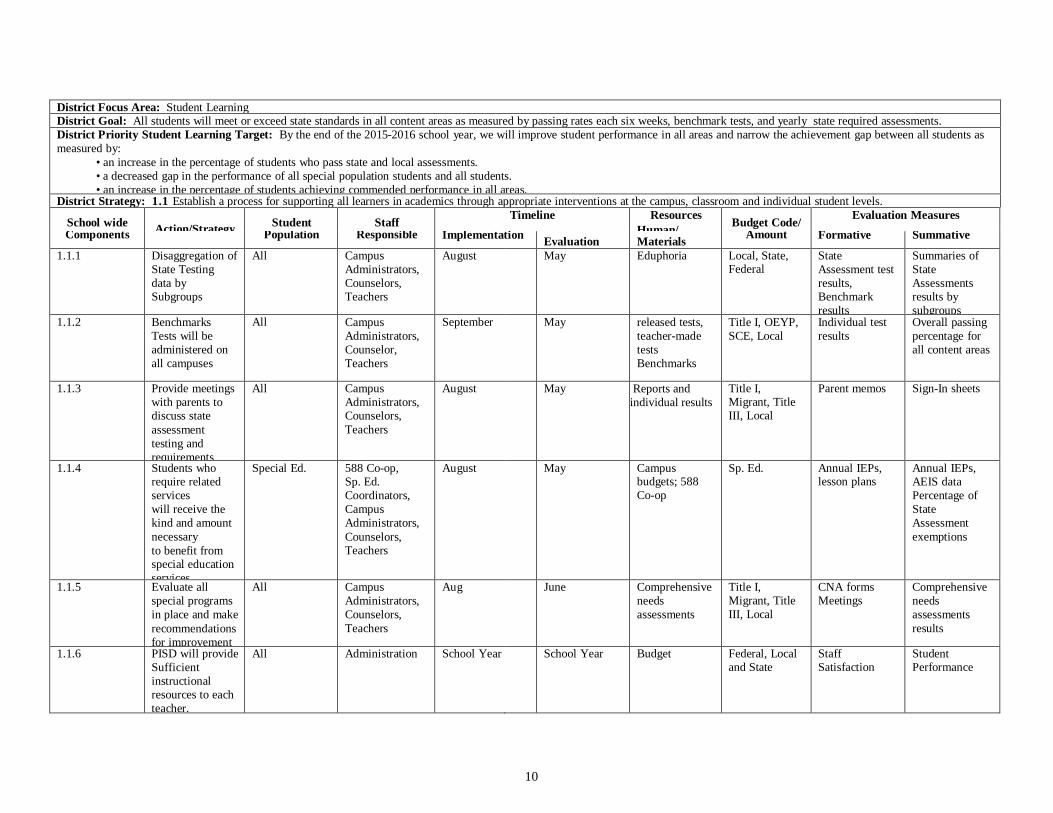
District Focus Area: Student Learning District Goal: All students will meet or exceed state standards in all content areas as measured by passing rates each six weeks, benchmark tests, and yearly state required assessments.
District Priority Student Learning Target: By the end of the 2015-2016 school year, we will improve student performance in all areas and narrow the achievement gap between all students as
measured by:
• an increase in the percentage of students who pass state and local assessments.
• a decreased gap in the performance of all special population students and all students.
• an increase in the percentage of students achieving commended performance in all areas. District Strategy: 1.1 Establish a process for supporting all learners in academics through appropriate interventions at the campus, classroom and individual student levels.
School wide
Action/Strategy
Student
Staff Timeline Resources
Human/
Budget Code/ Evaluation Measures
Components Population Responsible Implementation Evaluation Materials
Amount Formative Summative
1.1.1 Disaggregation of
State Testing
data by Subgroups
All Campus
Administrators,
Counselors, Teachers
August May Eduphoria
Local, State, Federal
State
Assessment test
results, Benchmark
results
Summaries of
State
Assessments results by
subgroups 1.1.2 Benchmarks
Tests will be
administered on
all campuses
All Campus
Administrators,
Counselor,
Teachers
September May released tests,
teacher-made
tests
Benchmarks
Title I, OEYP,
SCE, Local
Individual test
results
Overall passing
percentage for
all content areas
1.1.3 Provide meetings
with parents to discuss state
assessment
testing and
requirements
All Campus
Administrators, Counselors,
Teachers
August May Reports and
individual results
Title I, Migrant, Title III, Local
Parent memos Sign-In sheets
1.1.4 Students who require related
services
will receive the
kind and amount
necessary
to benefit from special education
services
Special Ed. 588 Co-op, Sp. Ed.
Coordinators,
Campus
Administrators,
Counselors, Teachers
August May Campus budgets; 588
Co-op
Sp. Ed. Annual IEPs, lesson plans
Annual IEPs, AEIS data
Percentage of
State
Assessment
exemptions
1.1.5 Evaluate all
special programs
in place and make
recommendations
for improvement
All Campus
Administrators,
Counselors,
Teachers
Aug June Comprehensive
needs
assessments
Title I, Migrant, Title
III, Local
CNA forms Meetings
Comprehensive
needs
assessments
results
1.1.6 PISD will provide
Sufficient
instructional resources to each
teacher.
All Administration School Year School Year Budget Federal, Local and State
Staff Satisfaction
Student Performance
11
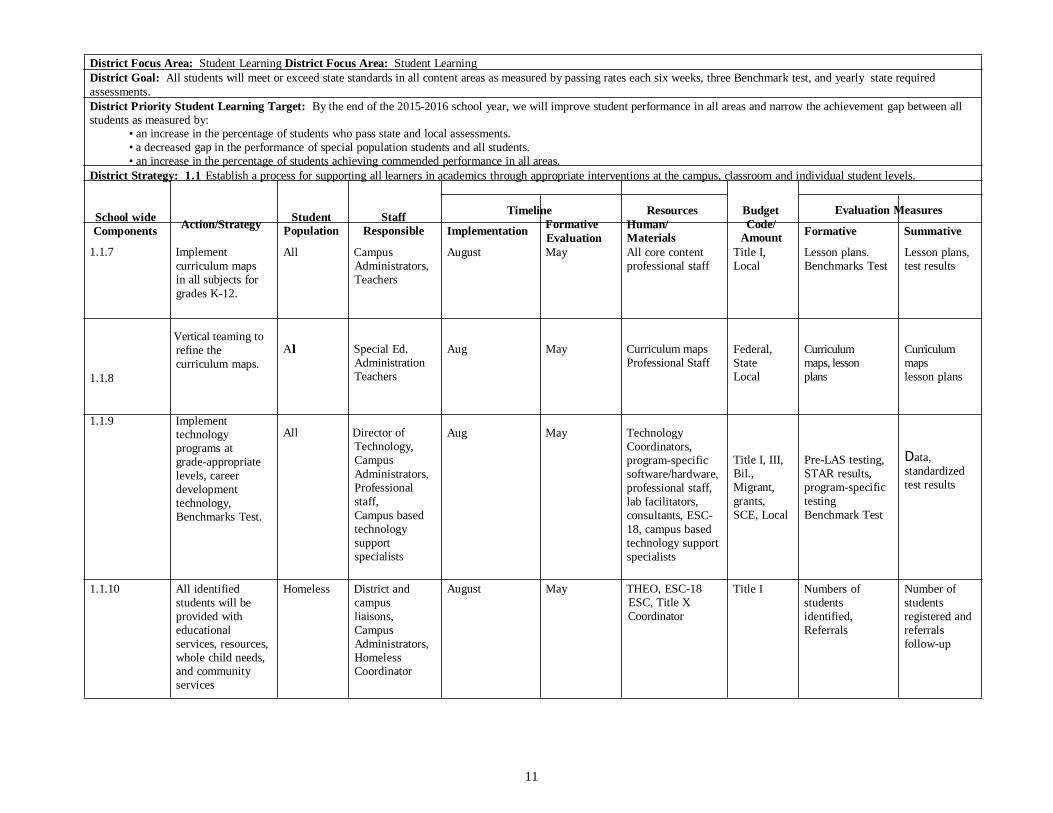
District Focus Area: Student Learning District Focus Area: Student Learning
District Goal: All students will meet or exceed state standards in all content areas as measured by passing rates each six weeks, three Benchmark test, and yearly state required
assessments.
District Priority Student Learning Target: By the end of the 2015-2016 school year, we will improve student performance in all areas and narrow the achievement gap between all students as measured by:
• an increase in the percentage of students who pass state and local assessments.
• a decreased gap in the performance of special population students and all students.
• an increase in the percentage of students achieving commended performance in all areas.
District Strategy: 1.1 Establish a process for supporting all learners in academics through appropriate interventions at the campus, classroom and individual student levels.
School wide
Student
Staff Timeline Resources Budget Evaluation Measures
Components Action/Strategy Population Responsible Implementation
Formative Evaluation
Human/ Materials
Code/ Amount
Formative Summative
1.1.7 Implement
curriculum maps
in all subjects for
grades K-12.
Vertical teaming to
refine the
curriculum maps.
1.1.8
1.1.9 Implement technology
programs at
grade-appropriate
levels, career
development
technology,
Benchmarks Test.
All Campus
Administrators,
Teachers A lll Special Ed.
Administration
Teachers All Director of
Technology,
Campus
Administrators,
Professional
staff,
Campus based
technology
support
specialists
August May All core content
professional staff Aug May Curriculum maps
Professional Staff Aug May Technology
Coordinators,
program-specific
software/hardware,
professional staff,
lab facilitators,
consultants, ESC-
18, campus based
technology support
specialists
Title I,
Local Federal,
State
Local Title I, III,
Bil.,
Migrant,
grants,
SCE, Local
Lesson plans.
Benchmarks Test Curriculum
maps, lesson
plans Pre-LAS testing,
STAR results,
program-specific
testing
Benchmark Test
Lesson plans,
test results Curriculum
maps
lesson plans Data,
standardized
test results
1.1.10 All identified
students will be
provided with
educational
services, resources,
whole child needs, and community
services
Homeless District and
campus
liaisons,
Campus
Administrators,
Homeless Coordinator
August May THEO, ESC-18
ESC, Title X
Coordinator
Title I Numbers of
students
identified,
Referrals
Number of
students
registered and
referrals
follow-up
12
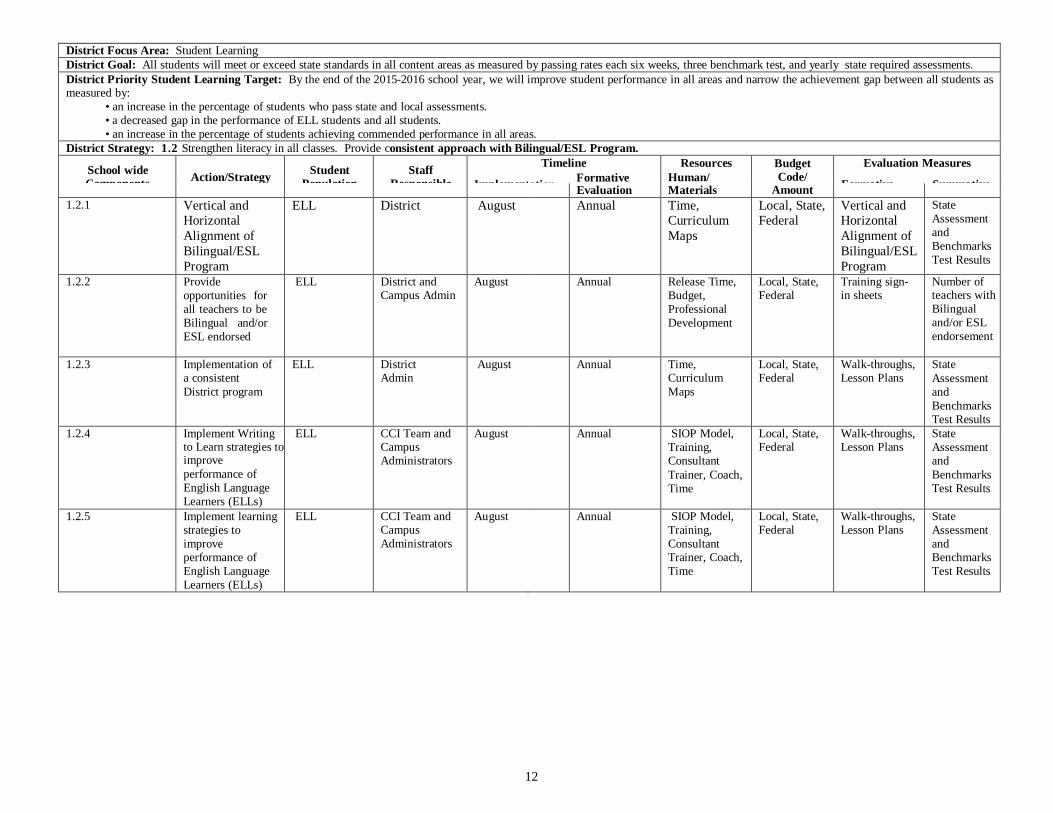
District Focus Area: Student Learning
District Goal: All students will meet or exceed state standards in all content areas as measured by passing rates each six weeks, three benchmark test, and yearly state required assessments.
District Priority Student Learning Target: By the end of the 2015-2016 school year, we will improve student performance in all areas and narrow the achievement gap between all students as measured by:
• an increase in the percentage of students who pass state and local assessments.
• a decreased gap in the performance of ELL students and all students.
• an increase in the percentage of students achieving commended performance in all areas.
District Strategy: 1.2 Strengthen literacy in all classes. Provide consistent approach with Bilingual/ESL Program.
School wide Components
Action/Strategy
Student Population
Staff Responsible
Implement
Timeline
ation Formative
Resources
Human/
Budget Code/
Evaluation Measures
Formative Summative
Evaluation Materials Amount 1.2.1 Vertical and
Horizontal
Alignment of
Bilingual/ESL
Program
ELL District August Annual Time, Curriculum
Maps
Local, State, Federal
Vertical and Horizontal
Alignment of
Bilingual/ESL
Program
State
Assessment
and
Benchmarks
Test Results
1.2.2 Provide
opportunities for
all teachers to be
Bilingual and/or
ESL endorsed
ELL District and Campus Admin
August Annual Release Time,
Budget,
Professional
Development
Local, State, Federal
Training sign- in sheets
Number of teachers with
Bilingual
and/or ESL
endorsement
1.2.3 Implementation of a consistent
District program
ELL District Admin
August Annual Time, Curriculum
Maps
Local, State, Federal
Walk-throughs, Lesson Plans
State
Assessment
and
Benchmarks
Test Results
1.2.4 Implement Writing to Learn strategies to improve
performance of
English Language
Learners (ELLs)
ELL CCI Team and Campus Administrators
August Annual SIOP Model,
Training, Consultant
Trainer, Coach,
Time
Local, State, Federal
Walk-throughs, Lesson Plans
State
Assessment and
Benchmarks
Test Results
1.2.5 Implement learning
strategies to
improve performance of
English Language
Learners (ELLs)
ELL CCI Team and Campus
Administrators
August Annual SIOP Model,
Training,
Consultant Trainer, Coach,
Time
Local, State, Federal
Walk-throughs, Lesson Plans
State
Assessment
and Benchmarks
Test Results
13
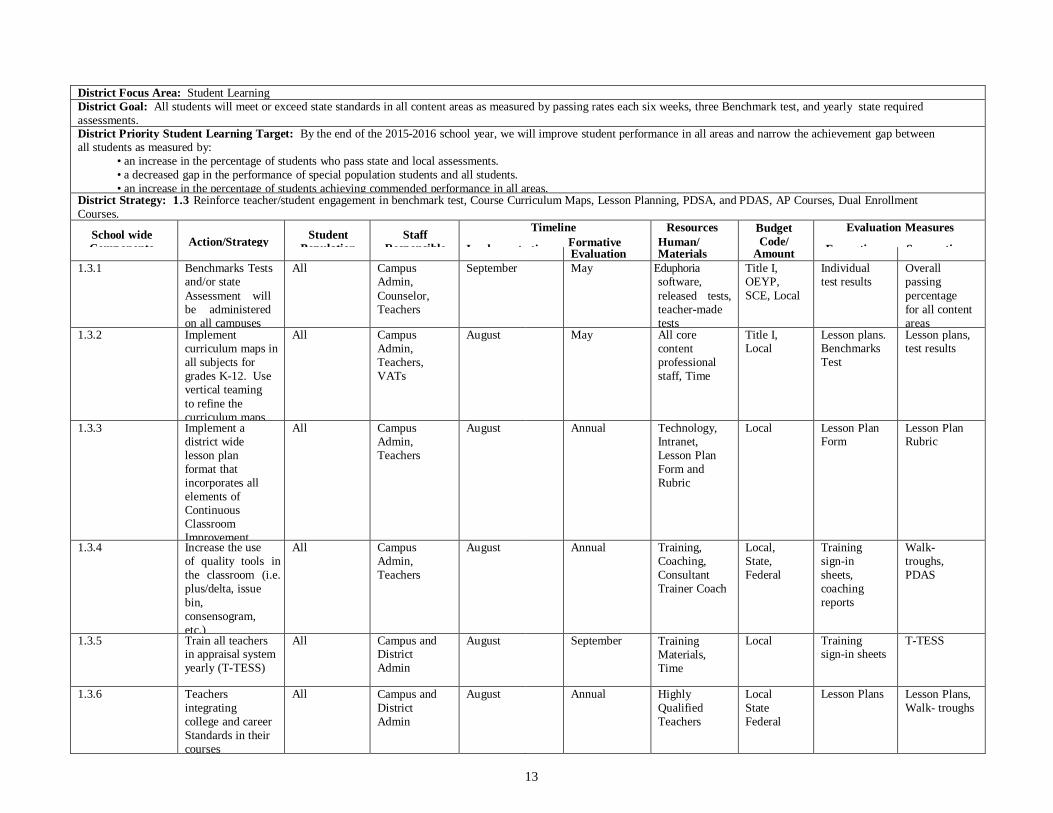
District Focus Area: Student Learning
District Goal: All students will meet or exceed state standards in all content areas as measured by passing rates each six weeks, three Benchmark test, and yearly state required
assessments. District Priority Student Learning Target: By the end of the 2015-2016 school year, we will improve student performance in all areas and narrow the achievement gap between all students as measured by:
• an increase in the percentage of students who pass state and local assessments.
• a decreased gap in the performance of special population students and all students.
• an increase in the percentage of students achieving commended performance in all areas. District Strategy: 1.3 Reinforce teacher/student engagement in benchmark test, Course Curriculum Maps, Lesson Planning, PDSA, and PDAS, AP Courses, Dual Enrollment
Courses.
School wide Components
Action/Strategy
Student Population
Staff Responsible
Implementa
Timeline
tion Formative
Resources
Human/
Budget Code/
Evaluation Measures
Formative Summative Evaluation Materials Amount
1.3.1 Benchmarks Tests and/or state
Assessment will be administered
on all campuses
All Campus Admin,
Counselor, Teachers
September May Eduphoria software,
released tests, teacher-made
tests
Title I, OEYP,
SCE, Local
Individual test results
Overall passing
percentage
for all content
areas 1.3.2 Implement
curriculum maps in
all subjects for
grades K-12. Use vertical teaming
to refine the
curriculum maps.
All Campus
Admin,
Teachers,
VATs
August May All core
content
professional
staff, Time
Title I, Local
Lesson plans. Benchmarks
Test
Lesson plans, test results
1.3.3 Implement a district wide
lesson plan
format that
incorporates all
elements of Continuous
Classroom
Improvement
All Campus Admin,
Teachers
August Annual Technology, Intranet,
Lesson Plan
Form and
Rubric
Local Lesson Plan Form
Lesson Plan Rubric
1.3.4 Increase the use
of quality tools in
the classroom (i.e.
plus/delta, issue
bin,
consensogram,
etc.)
All Campus
Admin,
Teachers
August Annual Training,
Coaching,
Consultant
Trainer Coach
Local,
State,
Federal
Training
sign-in
sheets,
coaching
reports
Walk-
troughs,
PDAS
1.3.5 Train all teachers in appraisal system
yearly (T-TESS)
All Campus and District
Admin
August September Training Materials,
Time
Local Training sign-in sheets
T-TESS
1.3.6 Teachers
integrating
college and career
Standards in their
courses
All Campus and
District
Admin
August Annual Highly
Qualified
Teachers
Local
State
Federal
Lesson Plans Lesson Plans,
Walk- troughs
14
1.3.7 Provide
professional
development for teachers in
college and career
standards
All Campus and District
Admin
August Annual Highly Qualified
Teachers
Local State
Federal
Sign-in sheets
Lesson Plans,
Walk- troughs
1.3.8 Expand the use of
concurrent and dual enrollment
courses
All Campus and
District Admin,
Counselor
August Annual Partnership
Agreements with area
colleges
Local State
Federal
Class Rosters Course Completion
Rate
15
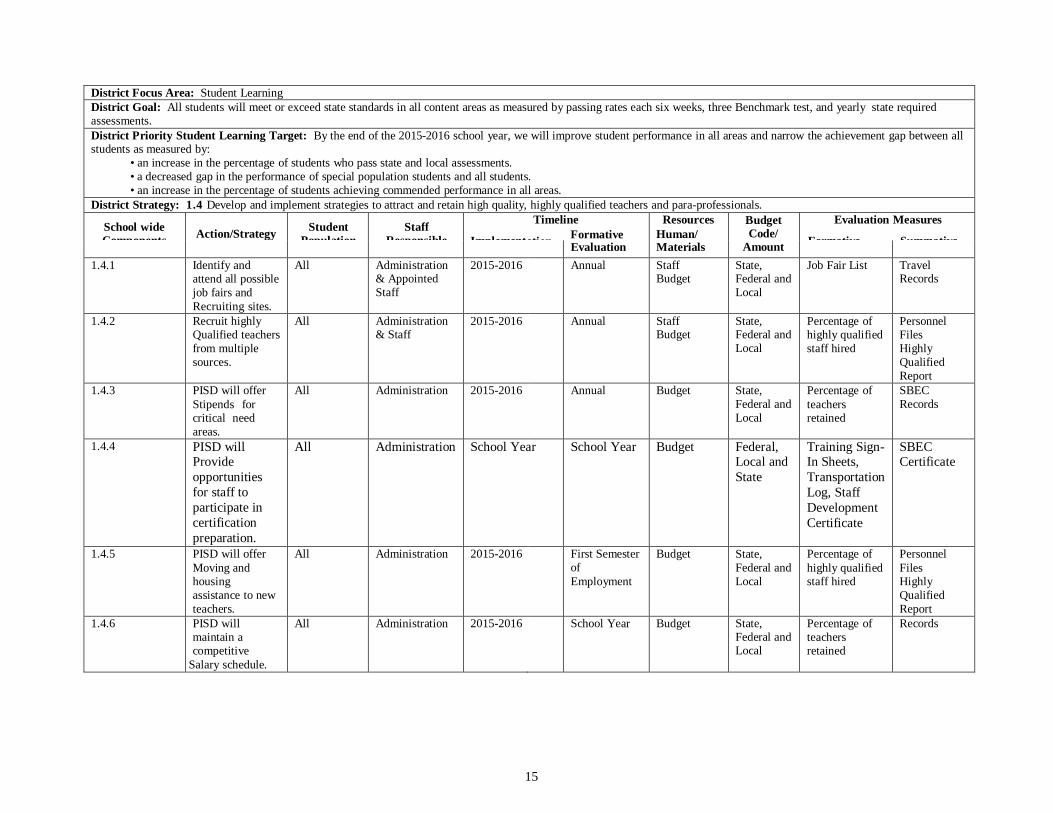
District Focus Area: Student Learning
District Goal: All students will meet or exceed state standards in all content areas as measured by passing rates each six weeks, three Benchmark test, and yearly state required assessments.
District Priority Student Learning Target: By the end of the 2015-2016 school year, we will improve student performance in all areas and narrow the achievement gap between all students as measured by:
• an increase in the percentage of students who pass state and local assessments.
• a decreased gap in the performance of special population students and all students.
• an increase in the percentage of students achieving commended performance in all areas.
District Strategy: 1.4 Develop and implement strategies to attract and retain high quality, highly qualified teachers and para-professionals.
School wide Components
Action/Strategy
Student Population
Staff Responsible
Implement
Timeline
ation Formative
Resources
Human/
Budget Code/
Evaluation Measures
Formative Summative
Evaluation Materials Amount 1.4.1 Identify and
attend all possible
job fairs and
Recruiting sites.
All Administration & Appointed
Staff
2015-2016 Annual Staff Budget
State, Federal and
Local
Job Fair List Travel Records
1.4.2 Recruit highly Qualified teachers
from multiple
sources.
All Administration & Staff
2015-2016 Annual Staff Budget
State, Federal and
Local
Percentage of highly qualified
staff hired
Personnel Files
Highly
Qualified
Report
1.4.3 PISD will offer
Stipends for critical need
areas.
All Administration 2015-2016 Annual Budget State,
Federal and
Local
Percentage of
teachers retained
SBEC
Records
1.4.4 PISD will Provide
opportunities
for staff to
participate in
certification
preparation.
All Administration School Year School Year Budget Federal, Local and
State
Training Sign- In Sheets,
Transportation
Log, Staff
Development
Certificate
SBEC Certificate
1.4.5 PISD will offer
Moving and housing
assistance to new
teachers.
All Administration 2015-2016 First Semester
of
Employment
Budget State,
Federal and
Local
Percentage of
highly qualified staff hired
Personnel
Files Highly
Qualified
Report
1.4.6 PISD will
maintain a competitive
Salary schedule.
All Administration 2015-2016 School Year Budget State, Federal and Local
Percentage of
teachers retained
Records
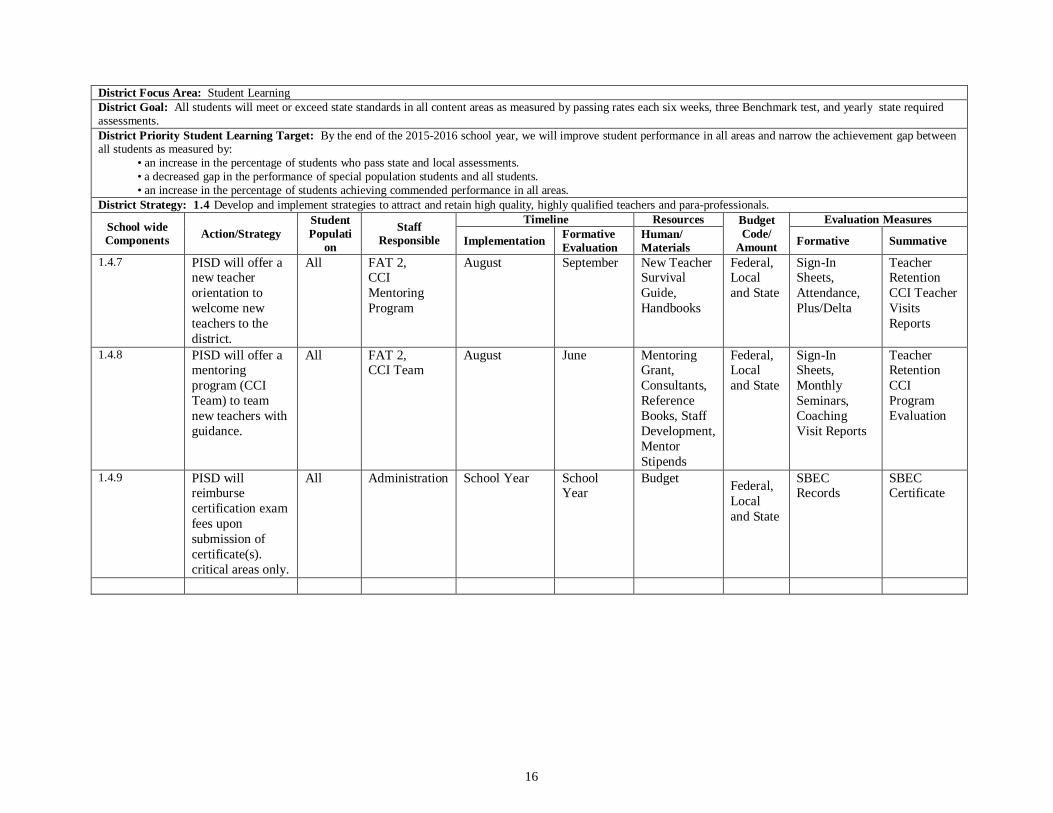
16
District Focus Area: Student Learning
District Goal: All students will meet or exceed state standards in all content areas as measured by passing rates each six weeks, three Benchmark test, and yearly state required assessments.
District Priority Student Learning Target: By the end of the 2015-2016 school year, we will improve student performance in all areas and narrow the achievement gap between all students as measured by:
• an increase in the percentage of students who pass state and local assessments.
• a decreased gap in the performance of special population students and all students.
• an increase in the percentage of students achieving commended performance in all areas.
District Strategy: 1.4 Develop and implement strategies to attract and retain high quality, highly qualified teachers and para-professionals.
School wide Components
Action/Strategy
Student
Populati
on
Staff Responsible
Timeline Resources Budget
Code/
Amount
Evaluation Measures
Implementation Formative
Evaluation Human/
Materials Formative Summative
1.4.7 PISD will offer a new teacher
orientation to
welcome new
teachers to the
district.
All FAT 2, CCI
Mentoring
Program
August September New Teacher Survival
Guide,
Handbooks
Federal, Local
and State
Sign-In Sheets,
Attendance,
Plus/Delta
Teacher Retention
CCI Teacher
Visits
Reports
1.4.8 PISD will offer a mentoring
program (CCI
Team) to team
new teachers with
guidance.
All FAT 2, CCI Team
August June Mentoring Grant,
Consultants,
Reference
Books, Staff
Development,
Mentor
Stipends
Federal, Local
and State
Sign-In Sheets,
Monthly
Seminars,
Coaching
Visit Reports
Teacher Retention
CCI
Program
Evaluation
1.4.9 PISD will reimburse
certification exam
fees upon
submission of
certificate(s).
critical areas only.
All Administration School Year School Year
Budget
Federal,
Local
and State
SBEC Records
SBEC Certificate
17
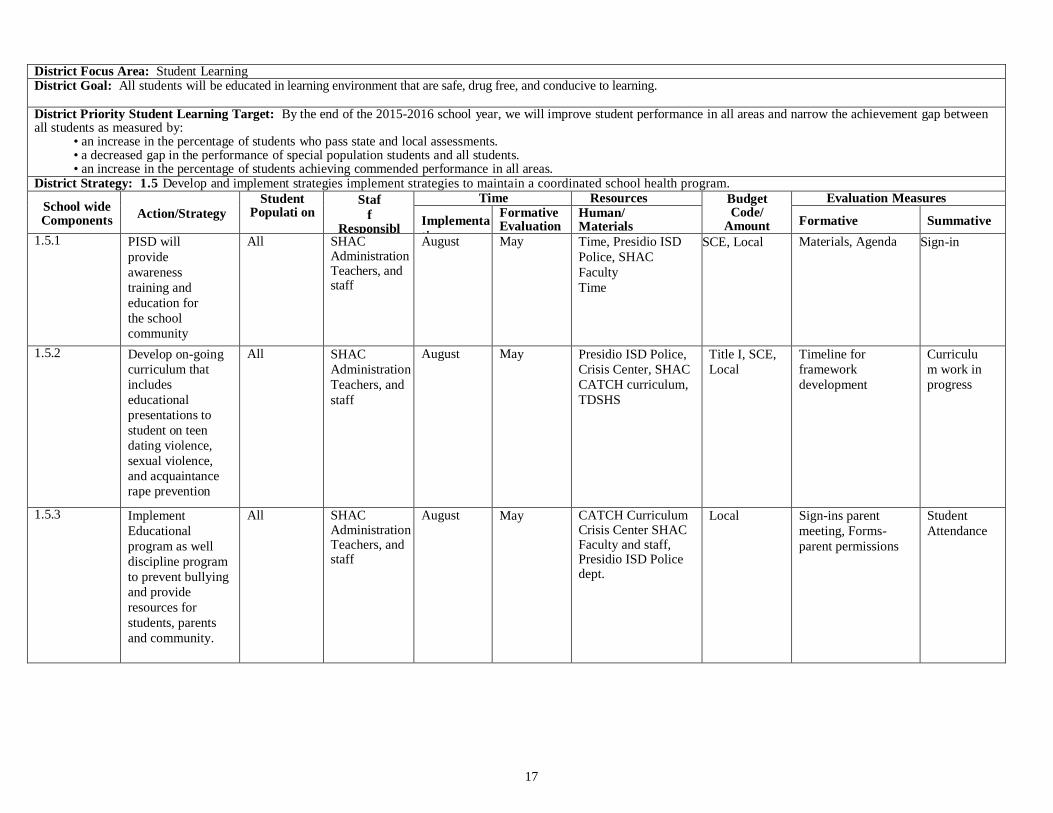
District Focus Area: Student Learning District Goal: All students will be educated in learning environment that are safe, drug free, and conducive to learning.
District Priority Student Learning Target: By the end of the 2015-2016 school year, we will improve student performance in all areas and narrow the achievement gap between all students as measured by:
• an increase in the percentage of students who pass state and local assessments. • a decreased gap in the performance of special population students and all students. • an increase in the percentage of students achieving commended performance in all areas.
District Strategy: 1.5 Develop and implement strategies implement strategies to maintain a coordinated school health program.
School wide Components
Action/Strategy
Student Populati on
Staf
f Responsibl
e
Timeline
Resources Budget Code/
Amount
Evaluation Measures
Implementa
tion
Formative Evaluation
Human/ Materials Formative Summative
1.5.1 PISD will
provide
awareness
training and
education for
the school
community
All SHAC Administration Teachers, and staff
August May Time, Presidio ISD
Police, SHAC
Faculty
Time
SCE, Local
Materials, Agenda Sign-in
1.5.2 Develop on-going
curriculum that
includes
educational
presentations to
student on teen
dating violence,
sexual violence,
and acquaintance
rape prevention
All SHAC
Administration
Teachers, and
staff
August May Presidio ISD Police,
Crisis Center, SHAC
CATCH curriculum,
TDSHS
Title I, SCE,
Local
Timeline for
framework
development
Curriculu
m work in
progress
1.5.3 Implement
Educational
program as well
discipline program
to prevent bullying
and provide
resources for
students, parents
and community.
All SHAC Administration Teachers, and staff
August May CATCH Curriculum Crisis Center SHAC Faculty and staff, Presidio ISD Police dept.
Local Sign-ins parent
meeting, Forms-
parent permissions
Student
Attendance
18
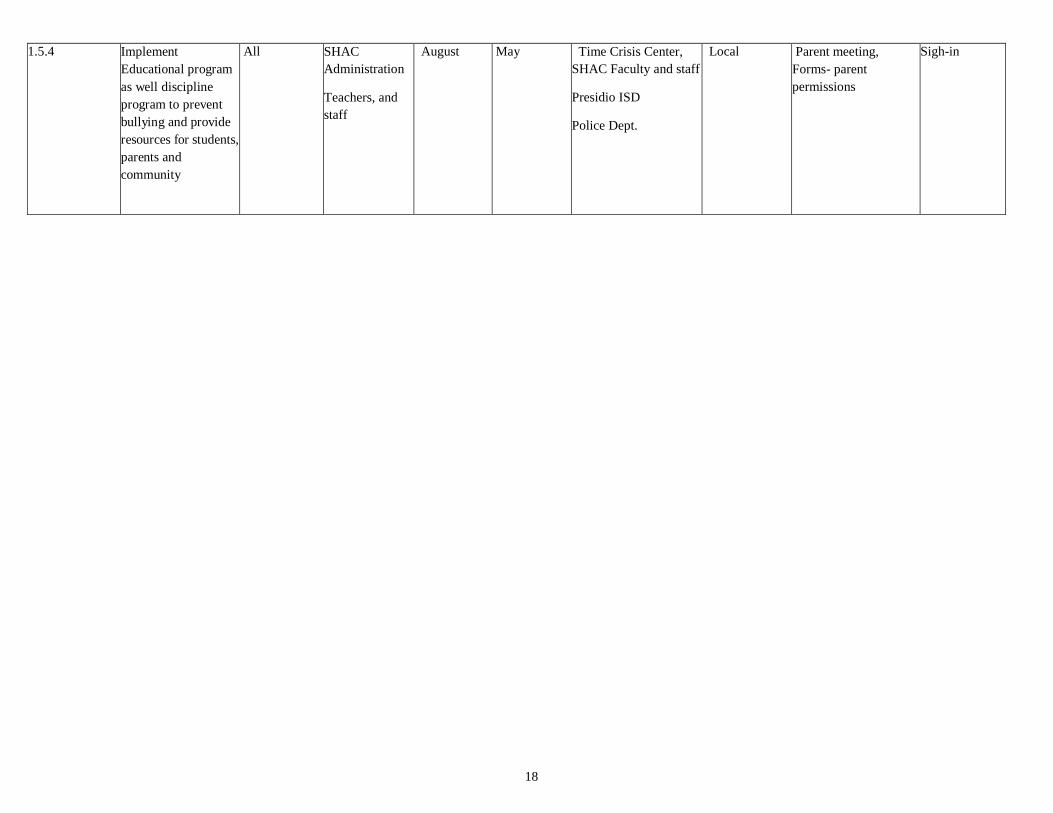
1.5.4 Implement
Educational program
as well discipline
program to prevent
bullying and provide
resources for students,
parents and
community
All SHAC
Administration
Teachers, and
staff
August May Time Crisis Center,
SHAC Faculty and staff
Presidio ISD
Police Dept.
Local Parent meeting,
Forms- parent
permissions
Sigh-in
19
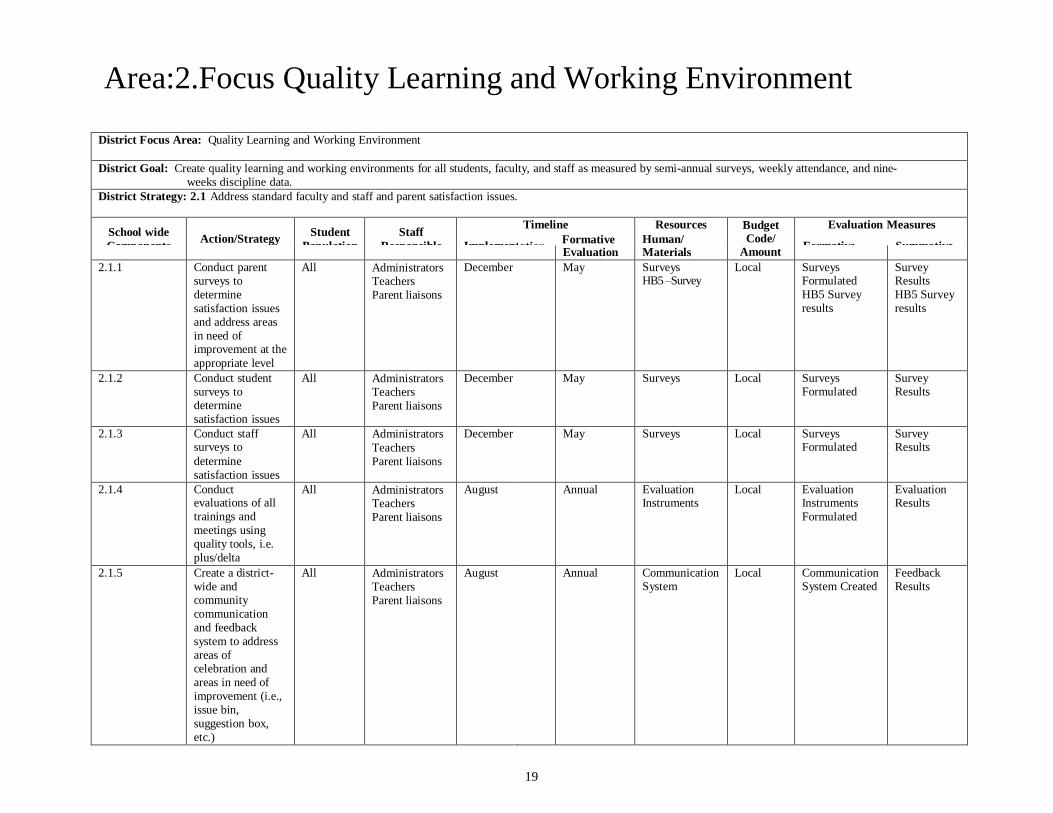
Area:2.Focus Quality Learning and Working Environment
District Focus Area: Quality Learning and Working Environment
District Goal: Create quality learning and working environments for all students, faculty, and staff as measured by semi-annual surveys, weekly attendance, and nine-
weeks discipline data.
District Strategy: 2.1 Address standard faculty and staff and parent satisfaction issues.
School wide
Components
Action/Strategy
Student
Population
Staff
Responsible
Implement
Timeline
ation Formative
Resources
Human/
Budget Code/
Evaluation Measures
Formative Summative
Evaluation Materials Amount 2.1.1 Conduct parent
surveys to
determine
satisfaction issues
and address areas
in need of improvement at the
appropriate level
All Administrators Teachers
Parent liaisons
December May Surveys HB5 –Survey
Local Surveys Formulated
HB5 Survey
results
Survey Results
HB5 Survey
results
2.1.2 Conduct student
surveys to determine
satisfaction issues
All Administrators Teachers
Parent liaisons
December May Surveys Local Surveys Formulated
Survey Results
2.1.3 Conduct staff surveys to
determine
satisfaction issues
All Administrators
Teachers
Parent liaisons
December May Surveys Local Surveys Formulated
Survey Results
2.1.4 Conduct evaluations of all
trainings and
meetings using
quality tools, i.e.
plus/delta
All Administrators Teachers
Parent liaisons
August Annual Evaluation Instruments
Local Evaluation Instruments
Formulated
Evaluation Results
2.1.5 Create a district-
wide and community
communication
and feedback
system to address
areas of celebration and
areas in need of
improvement (i.e.,
issue bin,
suggestion box,
etc.)
All Administrators Teachers
Parent liaisons
August Annual Communication System
Local Communication System Created
Feedback Results
20
District Focus Area: Quality Learning and Working Environment
District Goal: Create quality learning and working environments for all students, faculty, and staff as measured by semi-annual surveys, weekly attendance, and nine-
weeks discipline data.
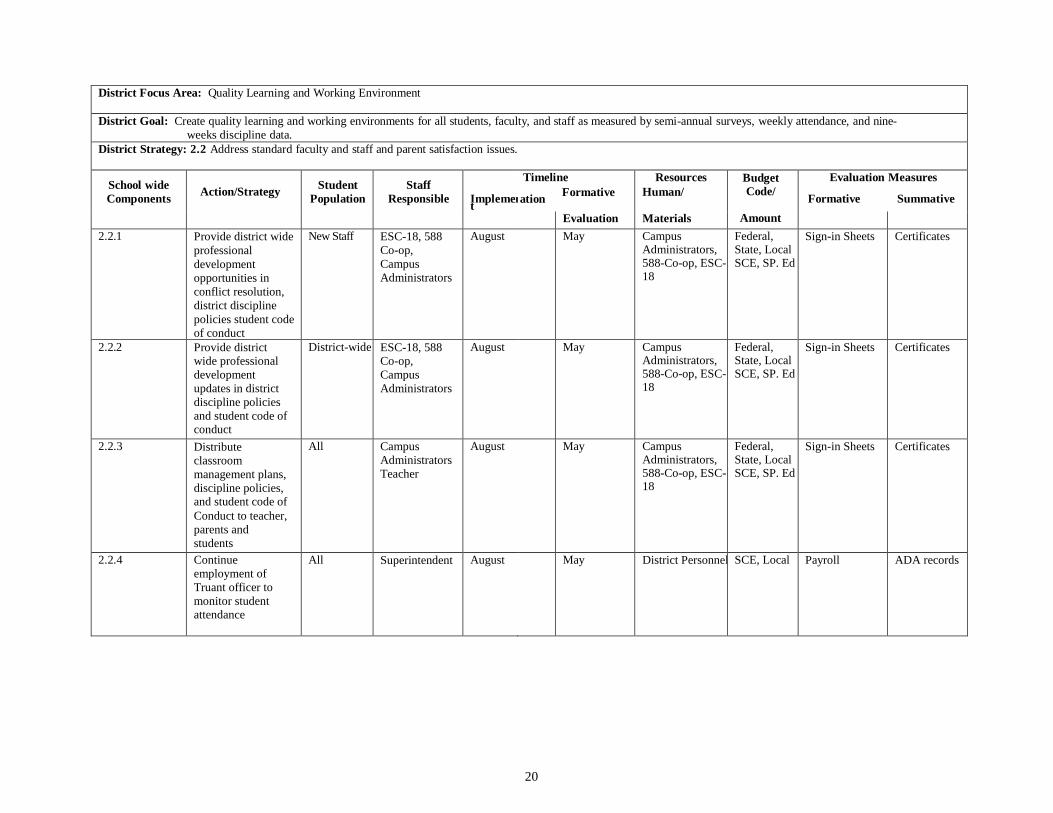
District Strategy: 2.2 Address standard faculty and staff and parent satisfaction issues.
School wide
Components
Action/Strategy
Student
Population
Staff
Responsible
Implement
Timeline
ation Formative
Resources
Human/
Budget Code/
Evaluation Measures
Formative Summative
Evaluation Materials Amount 2.2.1 Provide district wide
professional
development
opportunities in
conflict resolution,
district discipline
policies student code
of conduct
New Staff ESC-18, 588
Co-op,
Campus
Administrators
August May Campus Administrators, 588-Co-op, ESC-18
Federal, State, Local SCE, SP. Ed
Sign-in Sheets Certificates
2.2.2 Provide district wide professional
development
updates in district
discipline policies
and student code of conduct
District-wide ESC-18, 588 Co-op,
Campus
Administrators
August May Campus Administrators, 588-Co-op, ESC-18
Federal, State, Local SCE, SP. Ed
Sign-in Sheets Certificates
2.2.3 Distribute
classroom
management plans,
discipline policies, and student code of
Conduct to teacher,
parents and
students
All Campus
Administrators
Teacher
August May Campus Administrators, 588-Co-op, ESC-18
Federal, State, Local SCE, SP. Ed
Sign-in Sheets Certificates
2.2.4 Continue
employment of
Truant officer to
monitor student
attendance
All Superintendent August May District Personnel SCE, Local Payroll ADA records
21
District Focus Area: Quality Learning and Working Environment
District Goal: Create quality learning and working environments for all students, faculty, and staff as measured by semi-annual surveys, weekly attendance, and nine-weeks discipline data.
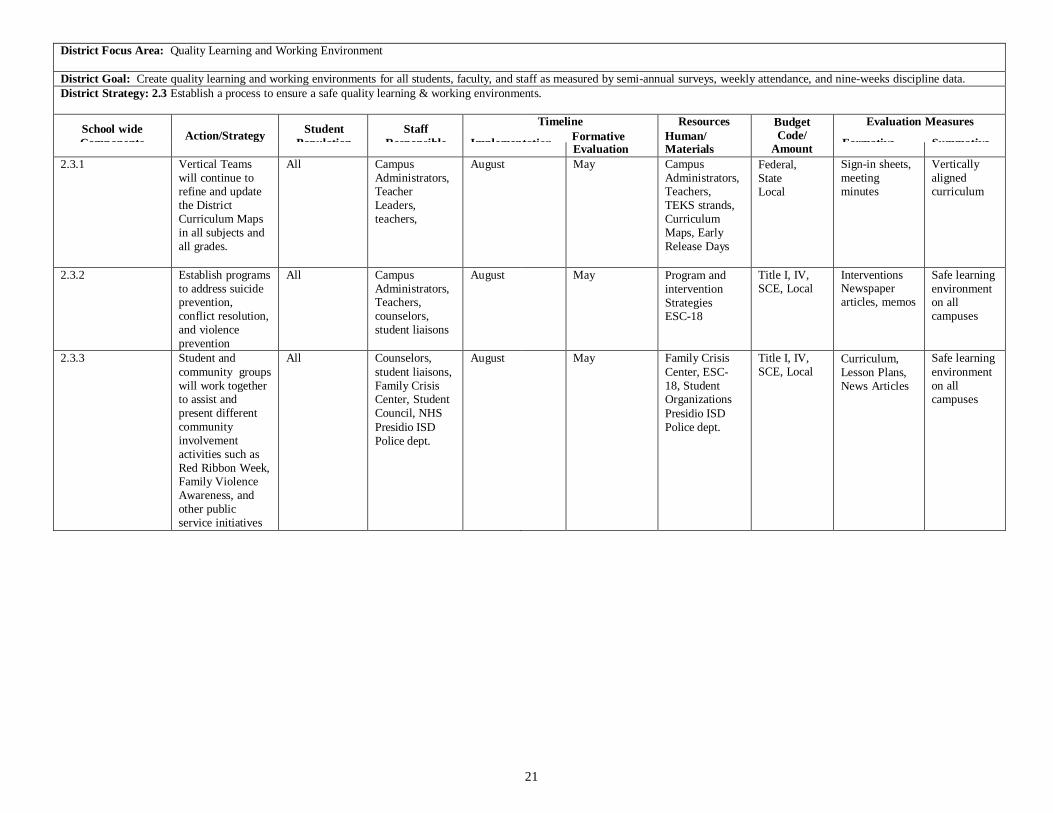
District Strategy: 2.3 Establish a process to ensure a safe quality learning & working environments.
School wide
Components
Action/Strategy
Student
Population
Staff
Responsible
Implemen
Timeline
tation Formative
Resources
Human/
Budget Code/
Evaluation Measures
Formative Summative
Evaluation Materials Amount 2.3.1 Vertical Teams
will continue to refine and update
the District
Curriculum Maps
in all subjects and
all grades.
All Campus
Administrators, Teacher
Leaders,
teachers,
August May Campus
Administrators, Teachers,
TEKS strands,
Curriculum
Maps, Early
Release Days
Federal,
State Local
Sign-in sheets,
meeting minutes
Vertically
aligned curriculum
2.3.2 Establish programs
to address suicide prevention,
conflict resolution,
and violence
prevention
All Campus
Administrators, Teachers,
counselors,
student liaisons
August May Program and
intervention
Strategies ESC-18
Title I, IV, SCE, Local
Interventions Newspaper articles, memos
Safe learning
environment on all
campuses
2.3.3 Student and
community groups
will work together to assist and
present different
community
involvement
activities such as
Red Ribbon Week, Family Violence
Awareness, and
other public
service initiatives
All Counselors,
student liaisons,
Family Crisis Center, Student
Council, NHS
Presidio ISD
Police dept.
August May Family Crisis
Center, ESC-
18, Student Organizations
Presidio ISD
Police dept.
Title I, IV,
SCE, Local Curriculum,
Lesson Plans,
News Articles
Safe learning
environment
on all campuses
22
District Focus Area: Quality Learning and Working Environment
District Goal: Create quality learning and working environments for all students, faculty, and staff as measured by semi-annual surveys, weekly attendance, and nine-weeks discipline data.
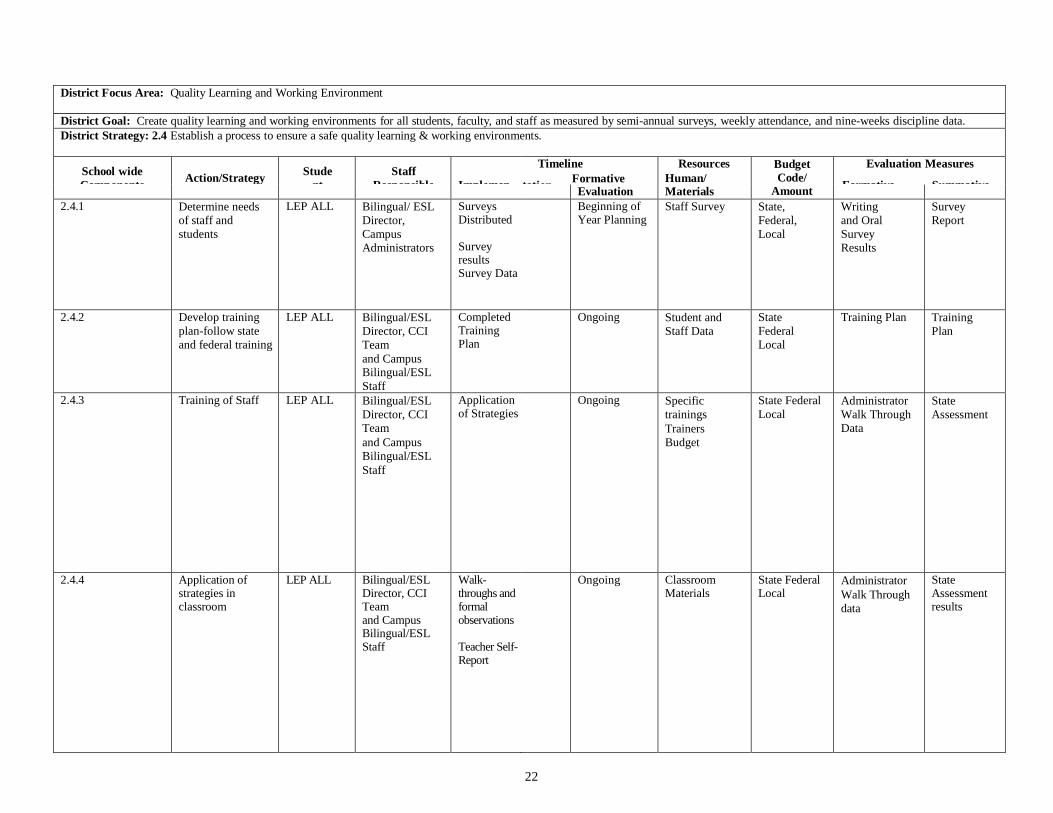
District Strategy: 2.4 Establish a process to ensure a safe quality learning & working environments.
School wide
Components
Action/Strategy
Stude
nt
Population
Staff
Responsible
Implemen
Timeline
tation Formative
Resources
Human/
Budget Code/
Evaluation Measures
Formative Summative
Evaluation Materials Amount 2.4.1 Determine needs
of staff and
students
LEP ALL Bilingual/ ESL
Director,
Campus
Administrators
Surveys Distributed Survey results Survey Data
Beginning of Year Planning
Staff Survey State,
Federal,
Local
Writing
and Oral
Survey
Results
Survey
Report
2.4.2 Develop training
plan-follow state
and federal training
LEP ALL Bilingual/ESL
Director, CCI
Team
and Campus Bilingual/ESL
Staff
Completed Training Plan
Ongoing Student and
Staff Data
State
Federal
Local
Training Plan Training
Plan
2.4.3 Training of Staff LEP ALL Bilingual/ESL
Director, CCI
Team
and Campus
Bilingual/ESL
Staff
Application of Strategies
Ongoing Specific
trainings
Trainers
Budget
State Federal
Local Administrator
Walk Through
Data
State
Assessment
2.4.4 Application of strategies in classroom
LEP ALL Bilingual/ESL Director, CCI Team and Campus Bilingual/ESL Staff
Walk-throughs and formal observations Teacher Self- Report
Ongoing Classroom Materials
State Federal Local
Administrator
Walk Through
data
State Assessment results
23
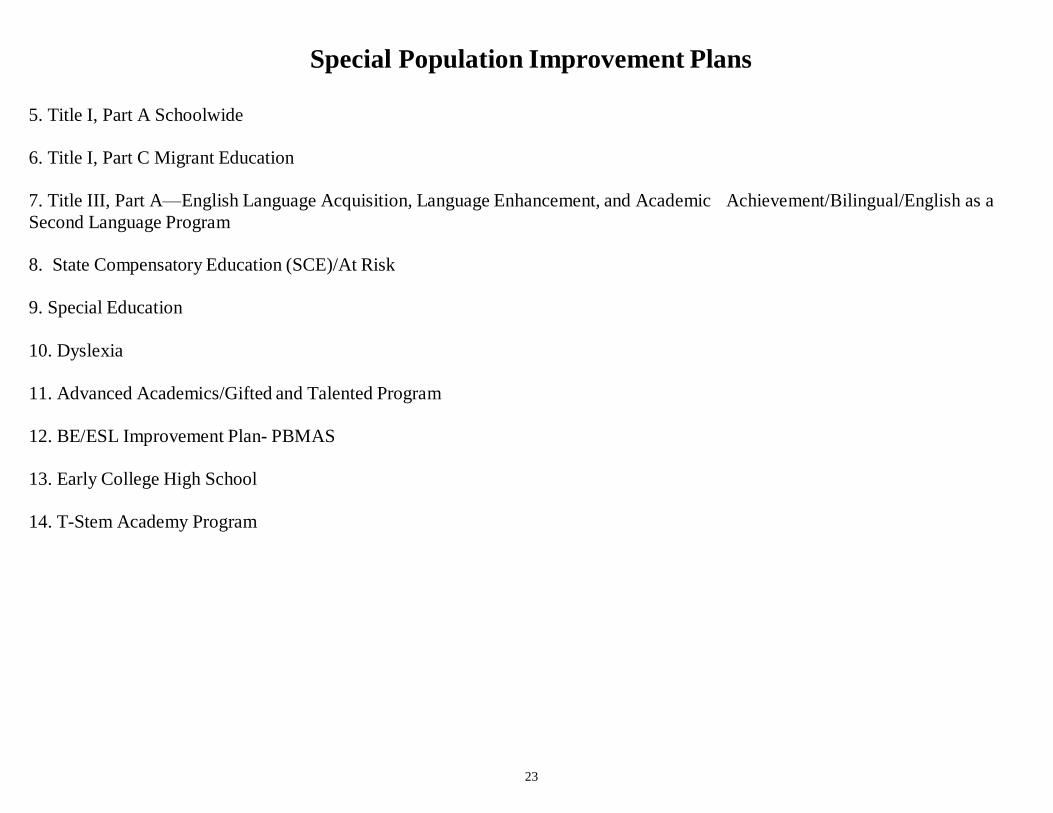
Special Population Improvement Plans
5. Title I, Part A Schoolwide
6. Title I, Part C Migrant Education
7. Title III, Part A—English Language Acquisition, Language Enhancement, and Academic Achievement/Bilingual/English as a
Second Language Program
8. State Compensatory Education (SCE)/At Risk
9. Special Education
10. Dyslexia
11. Advanced Academics/Gifted and Talented Program
12. BE/ESL Improvement Plan- PBMAS
13. Early College High School
14. T-Stem Academy Program

24
5. Title I, Part A Schoolwide
This district and campus ensure that the goals of the Elementary and Secondary Education Act (ESEA) have been adopted
and implemented in the district and campus improvement plans.
Elementary and Secondary Education Act (ESEA) Goals and Indicators
Performance Goal 1: All students will reach high standards, at a minimum attaining proficiency or better in reading/language arts and mathematics
as measured by the State Assessments.
1.1 Performance indicator: The percentage of students, in the aggregate and for each subgroup, who are at or above the proficient level in
reading/language arts on the State’s assessment (Note: These subgroups are those for which the ESEA requires State reporting, as identified in section
1111(h)(1)(C)(i).)
1.2 Performance indicator: The percentage of students, in the aggregate and in each individual student group, who are at or above the proficient
level in mathematics on the State’s assessment. (Note: These subgroups are those for which the ESEA requires State reporting, as identified in section
1111(h)(1)(C)(i).)
1.3 Performance indicator: The percentage of Title I schools that make adequate yearly progress.
Performance Goal 2: All limited English proficient students will become proficient in English and reach high academic standards, at a minimum attaining
proficiency or better in reading/language arts and mathematics as measured by the State Assessments.
2.1 Performance indicator: The percentage of limited English proficient students, determined by cohort, who have attained English proficiency
by the end of the school year.
2.2 Performance indicator: The percentage of limited English proficient students who are at or above the proficient level in reading/language arts on the State’s assessment, as reported for performance indicator 1.1.
2.3 Performance indicator: The percentage of limited English proficient students who are at or above the proficient level in mathematics on the State’s assessment, as reported for performance indicator 1.2.
Performance Goal 3: All students will be taught by highly qualified teachers as measured by the State Assessments.
3.1 Performance indicator: The percentage of classes being taught by “highly qualified” teachers (as the term is defined in section 9101(23) of the ESEA), in the aggregate and in “high-poverty” schools (as the term is defined in section 1111(h)(1)(C)(viii) of the SEA).
3.2 Performance indicator: The percentage of teachers receiving high-quality professional development (as the term, “professional development,” is defined in section 9101(34).
3.3 Performance indicator: The percentage of paraprofessionals (excluding those with sole duties as translators and parental involvement assistants) who are qualified (see criteria in section 1119(c) and (d).
Performance Goal 4: All students will be educated in learning environments that are safe, drug free, and conducive to learning as measured by the public
safety report.
4.1 Performance indicator: The number of persistently dangerous schools, as defined by the State.
25
Performance Goal 5: All students will graduate from high school as measured by drop out report.
5.1 Performance indicator: The percentage of students in the aggregate and in each group who graduate from high school each year with a
regular diploma,-disaggregated by race, ethnicity, gender, disability status, migrant status, English proficiency, and status as economically
disadvantaged:-calculated in the same manner as utilized in Nation Center for Education Statistics reports on Common Core of Data.
5.2 Performance indicator: The percentage of students who drop out of school,-disaggregated by race, ethnicity, gender, disability status, migrant
status, English proficiency, and status as economically disadvantaged;-calculated in the same manner as utilized in Nation Center for
Education Statistics reports on Common Core of Data.
Title I, Part A—Improving Basic Programs Operated by LEAs
Intent and Purpose
Title I, Part A, provides supplemental resources to local education agencies (LEAs) to help schools with high concentrations of students from low-income
families provide high-quality education that will enable all children to meet the state student performance standards. Title I, Part A, supports campuses in
implementing either a schoolwide program or a targeted assistance program. All campuses in Presidio ISD are Title I Schoolwide campuses.
It is recommended that all Title I, Part A, campuses have a school support team consisting of two to three members as appropriate to monitor program
compliance and effectiveness. The campus site-based decision-making committee provides the school support team function.
The school support team verifies the effectiveness of the General Program Requirements and Schoolwide Requirements stated below.
Intended Program Beneficiaries
The intended program beneficiaries are students who experience difficulties mastering the state academic achievement standards. General Program Requirements
All Campuses
All Title I, Part A, campuses must do the following:
1. implement Parents Right-to-Know in accordance with P.L. 107–110, Section 1111(h)(6)
2. develop school-parent compacts jointly with parents
3. provide information to parents in the language parents understand
4. develop an LEA and campus Parent Involvement Policies
5. implement Section 1304.21 of the Head Start Standards if implementing pre-school programs
35
6. integrate and coordinate Title I, Part A, professional development and services with other educational services and programs
7. provide additional assistance to students identified as needing help in meeting the state’s challenging student academic achievement standards
8. ensure that all new teachers hired on the campus to teach core academic subjects are highly qualified when hired
9. include in the Campus Improvement Plan (CIP) strategies and activities to ensure that all core academic subject area teachers teaching within the
school are highly qualified not later than the end of 2012–2013 school year Schoolwide Campuses The CIP of a Schoolwide Campus must do the following:
10. incorporate the requirements of a Schoolwide Plan as cited in P.L. 107–110, Section 1114(b)
11. clearly incorporate the Ten Components of a Schoolwide Program
12. describe how the school will use Title I, Part A, resources and other sources to implement the ten components
13. include a list of state and federal programs whose funds will be combined to implement a schoolwide program
14. describe how the intent and purposes of the Federal programs whose funds are combined on a schoolwide campus are met
15. include sufficient activities to address the needs of the intended beneficiaries of the Federal programs whose funds are combined on a schoolwide
campus for upgrading the entire education program.
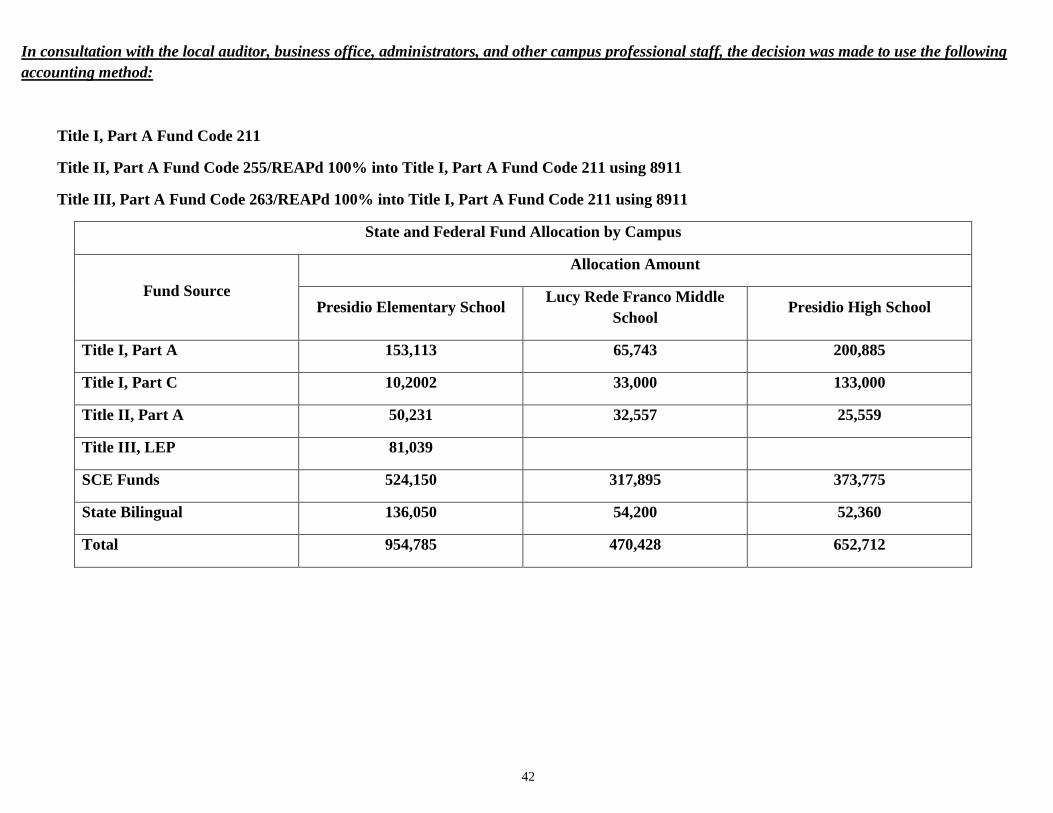
In consultation with the local auditor, business office, administrators, and other campus professional staff, the decision was made to use the following
accounting method:
The following narrative contains the Intent and Purpose of each Federal fund that is used on this campus to enhance and upgrade the activities. The
district and campus ensure that the intent and purpose of each program is met through sufficient resources and activities addressed in the District
Improvement Plan and Campus Improvement Plan.
Title II, Part A—Teacher and Principal Training and Recruiting Fund (TPTR) The Presidio ISD REAPS 100% of the Title II, Part A funds into the Title I, Part A Schoolwide Program.
Intent and Purpose
The intent and purpose of this program is to provide financial assistance to LEAs to do the following:
36
16. increase student academic achievement through improving teacher and principal quality and increasing the number of highly qualified teachers in
classrooms and highly qualified principals and assistant principals in schools
17. hold LEAs and schools accountable for improving student academic achievement Intended Program Beneficiaries
Intended beneficiaries are teachers and principals, including assistant principals, and as appropriate, administrators, pupil services personnel, and
paraprofessionals.
General Program Requirements
TPTR program activities are required to do the following:
18. They must be based on a local assessment of needs for professional development and hiring.
19. These activities must meet the following:
be aligned with state academic content and student academic performance standards and State Assessments
be aligned with curricula and programs tied to state academic content and student academic performance standards
be based on a review of scientifically-based research
have a substantial, measurable, and positive impact on student academic achievement
be part of a broader strategy to eliminate the achievement gap between low-income and minority students and other students
20. Professional development activities must be coordinated with other professional development activities provided through other Federal, state, and
local programs, including Title II, Part D (technology), funds.
Allowable Use of Funds [Section 2123(a)]
You must use TPTR funds to implement one or more of the following allowable activities:
21. recruiting, hiring, and retention of highly qualified personnel
22. providing professional development
23. improving the quality of the teacher and paraprofessional work force under Section 1119
24. reducing class size (only when the class-size reduction teacher is a highly qualified teacher) Consistent with local planning requirements and your organization’s needs assessment, the Title II, Part A, program offers you the flexibility to design and
implement a wide variety of activities that promote a teaching staff that is highly qualified and able to help all students—regardless of individual learning
37
needs—achieve challenging State content and academic achievement standards. Funds also can be used to provide school principals with the knowledge and
skills necessary to lead their schools’ efforts to increase student academic achievement.
You should be able to respond appropriately to and maintain documentation for each of the following questions to determine whether an expenditure would
be allowable:
25. Is the program, activity, or strategy reasonable and necessary to carry out the intent and purpose of the program?
26. Does the program, activity, or strategy address a need previously identified in the campus comprehensive needs assessment?
27. How will the program, activity, or strategy be evaluated to measure a positive impact on student achievement?
28. Is the program, activity, or strategy supplemental to other non-federal programs?
The Title II, Part A, statute specifically authorizes the following types of activities:
1. developing and implementing mechanisms to assist schools to effectively recruit and retain highly qualified teachers, principals, and specialists in
core academic areas (and other pupil services personnel in special circumstances).
2. developing and implementing strategies and activities to recruit, hire, and retain highly qualified teachers and principals
These strategies may include the following:
3. providing monetary incentives such as scholarships, signing bonuses, or differential pay for teachers in academic subjects or schools in which the
LEA has shortages
4. reducing class size
5. recruiting teachers to teach special needs children
6. recruiting qualified paraprofessionals and teachers from populations underrepresented in the teaching profession and providing those
paraprofessionals with alternative routes to obtaining teacher certification
7. providing professional development activities that improve the knowledge of teachers and principals and in appropriate cases paraprofessionals in the
following:
8. content knowledge—providing training in one or more of the core academic subjects that the teachers teach
9. classroom practices—providing training to improve teaching practices and student academic achievement through (1) effective instructional
strategies, methods, and skills, and (2) the use of challenging state academic content standards and student academic achievement standards in
preparing students for the State Assessments
38
10. providing professional development activities that improve the knowledge of teachers and principals, and in appropriate cases, paraprofessionals
regarding effective instructional practices that do the following:
11. involve collaborative groups of teachers and administrators
12. address the needs of students with different learning styles, particularly students with disabilities, students with special needs (including students
who are gifted and talented), and students with LEP
13. provide training in improving student behavior in the classroom and identifying early and appropriate interventions to help students with special
needs
14. provide training to enable teachers and principals to involve parents in their children’s education, especially parents of LEP and immigrant
children
15. provide training on how to use data and assessments to improve classroom practice and student learning. 16. developing and implementing initiatives to promote retention of highly qualified teachers and principals, particularly in schools with a high
percentage of low-achieving students, including programs that provide teacher mentoring from exemplary teachers and administrators, induction and
support for new teachers and principals during their first three years, and financial incentives to retain teachers and principals with a record of helping
students to achieve academic success 17. carrying out programs and activities that are designed to improve the quality of the teaching force, such as innovative professional development
programs that focus on technology literacy, tenure reform, testing teachers in the academic subjects in which teachers teach, and merit pay programs 18. carrying out professional development programs that are designed to improve the quality of principals and superintendents, including the
development and support of academies to help them become outstanding managers and educational leaders 19. hiring highly qualified teachers, including teachers who become highly qualified through State and local alternative routes to certification, and
special education teachers in order to reduce class size, particularly in the early grades 20. carrying out teacher advancement initiatives that promote professional growth and emphasize multiple career paths (such as paths to becoming a
mentor teacher, career teacher, or exemplary teacher) and pay differentiation
39
Title III, Part A—English Language Acquisition, Language Enhancement, and Academic
Achievement
Intent and Purpose
Title III, Part A, provides supplemental resources to LEAs to help ensure that children who are limited English proficient attain English proficiency (LEP)
at high levels in core academic subjects and can meet state mandated achievement performance standards.
Intended Program Beneficiaries
Intended beneficiaries are LEP students, including immigrant children and youth General Program Requirements
The requirements are to help ensure that LEP children, including immigrant children and youth, attain English proficiency, develop high levels of
academic attainment, and meet the same challenging State academic content and student academic achievement standards as all children are expected to
meet by doing the following:
29. assisting all LEP and immigrant students to achieve at high levels in the core academic subjects and achieve standards required in Title I, Section
1111(b)(1)
30. developing high-quality language instruction educational programs designed to assist state educational agencies, LEAs, and schools in teaching
LEP
and immigrant students
31. assisting state and local educational agencies to develop and enhance their capacity to provide high-quality instructional programs designed
to prepare LEP and immigrant students enter all-English instruction settings
32. assisting State and local educational agencies and schools to build their capacity to establish, implement, and sustain language
instruction educational programs and programs of English language development for LEP students
33. promoting parental and community participation in language instruction educational programs for LEP students
34. streamlining language instruction educational programs to help LEP and immigrant students develop proficiency in English while
meeting challenging state academic content and student academic achievement standards
35. holding State and local educational agencies and schools accountable for increases in English proficiency and core academic content knowledge of
LEP students
36. providing State and local educational agencies the flexibility to implement language instructional programs that are the most effective based
on scientifically-based research on teaching LEP students P.L. 107–110, Section 3102
40
Title III, Part A, funds shall be used to supplement and not supplant any other Federal, State, or local funds. For example, if an LEA is using state
bilingual funds to provide LEP services to students, and now replaces those state funds with Title III, Part A, funds, then the LEA has supplanted state
funds with
federal funds. To avoid supplanting funds, the LEA would have to demonstrate that any LEP services provided with Title III, Part A, funds are above
and beyond any LEP services provided with state funds. Allowable Use of Funds
An LEA receiving Title III, Part A, funds must use the funds to do the following:
increase the English proficiency of LEP children by providing high-quality language-instruction educational programs that are based on
scientifically-based research demonstrating the effectiveness of the programs in increasing English proficiency and student academic achievement
in the core academic subjects
provide high-quality professional development to classroom teachers (including teachers in classroom settings that are not the settings of
language- instruction educational programs), principals, administrators, and other school or community-based organizational personnel, that
meets the following:
is designed to improve the instruction and assessment of LEP children
is designed to enhance the ability of such teachers to understand and to use curricula, assessment measures, and instructional strategies for LEP
children
is based on documented research demonstrating the effectiveness of the professional development in increasing children’s English proficiency
or substantially increasing the subject matter knowledge, teaching knowledge, and teaching skills of such teachers
is of sufficient intensity and duration to have a positive and lasting impact on the teachers’ performance in the classroom.
This last point does not include activities such as one-day or short-term workshops and conferences unless these activities are components of a
long-term, comprehensive professional-development plan established by a teacher and the teacher’s supervisor and are based on an assessment
of the needs of the teacher, the supervisor, the students of the teacher, and any LEA employing the teacher.
The district and campus is able to respond appropriately to and maintains documentation for each of the following questions to determine whether
an expenditure would be allowable:
37. Is the program, activity, or strategy reasonable and necessary to carry out the intent and purpose of the program?
38. Does the program, activity, or strategy address a need previously identified in the campus comprehensive needs assessment?
39. How will the program, activity, or strategy e be evaluated to measure a positive impact on the English language acquisition and
academic achievement of LEP students?
40. Is the program, activity, or strategy supplemental to other Federal and non-Federal programs?
41
The district and/or campus may also use Title III, Part A, funds to achieve one of the program purposes by undertaking one or more of the
following activities:
upgrading program objectives and effective instructional strategies
improving the instructional program for LEP children by identifying, acquiring, and upgrading curricula, instructional materials, educational
software, and assessment procedures
providing the following
tutorials and academic or vocational education for LEP children
intensified instruction
developing and implementing elementary school or secondary school language-instruction educational programs that are coordinated with other
relevant programs and services
improving the English proficiency and academic achievement of LEP children
providing community participation programs, family literacy services, and parent outreach and training activities to LEP children and their families
to do the following:
to improve the English language skills of LEP children
to assist parents in helping their children to improve their academic achievement by becoming active participants in the education of their children
improving the instruction of LEP children by providing for the following:
the acquisition or development of educational technology or instructional materials
access to and participation in electronic networks for materials, training, and communication
incorporation of these resources into curricula and programs
Note: Administrative costs, both direct and indirect, are restricted to no more than 2% of the current-year Title III, Part A—LEP entitlement.
42
In consultation with the local auditor, business office, administrators, and other campus professional staff, the decision was made to use the following
accounting method:
Title I, Part A Fund Code 211
Title II, Part A Fund Code 255/REAPd 100% into Title I, Part A Fund Code 211 using 8911
Title III, Part A Fund Code 263/REAPd 100% into Title I, Part A Fund Code 211 using 8911
State and Federal Fund Allocation by Campus
Fund Source
Allocation Amount
Presidio Elementary School Lucy Rede Franco Middle
School Presidio High School
Title I, Part A 153,113 65,743 200,885
Title I, Part C 10,2002 33,000 133,000
Title II, Part A 50,231 32,557 25,559
Title III, LEP 81,039
SCE Funds 524,150 317,895 373,775
State Bilingual 136,050 54,200 52,360
Total 954,785 470,428 652,712
43
The following campus activities and/or staff positions will be funded using the combined federal funds:
Comprehensive Needs Assessment Results
The following data sources were available for review to assess the district’s strengths and priorities:
Disaggregated student assessment information
TPRI
Compliance Reports
Highly Qualified Reports
Teacher and parent interviews/surveys
Technology, Fiscal and Facility Resources
Participation records of students enrolled in special programs (GT, Special Education, ESL)
Staff Development Records
Assessment data and curriculum alignment
Impact of initiatives on student performance
The AEIS reports indicate that the needs of most of our students are being addressed. As indicated in the comprehensive needs assessment section, we need
to address the needs of the ELL students in all areas. While the gap between ethnic groups and economically disadvantaged has improved slightly, we still
have gaps that need to be closed.
We have a schoolwide Title I school program with approximately 89.02% economically disadvantaged students and use the following fund sources to
improve our educational program.
Multiple sources are used to support each of the educational programs on the campus. The funds used and the amounts are allocated according to the
following table:
44
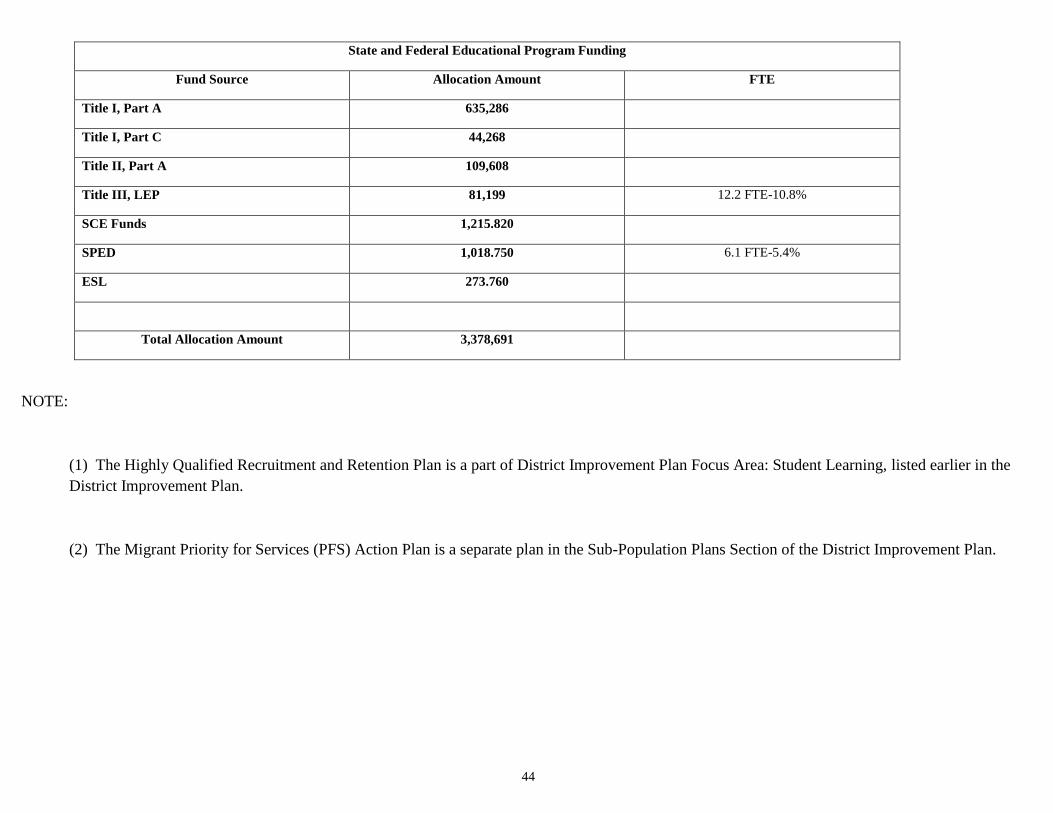
State and Federal Educational Program Funding
Fund Source Allocation Amount FTE
Title I, Part A 635,286
Title I, Part C 44,268
Title II, Part A 109,608
Title III, LEP 81,199 12.2 FTE-10.8%
SCE Funds 1,215.820
SPED 1,018.750 6.1 FTE-5.4%
ESL 273.760
Total Allocation Amount 3,378,691
NOTE:
(1) The Highly Qualified Recruitment and Retention Plan is a part of District Improvement Plan Focus Area: Student Learning, listed earlier in the
District Improvement Plan.
(2) The Migrant Priority for Services (PFS) Action Plan is a separate plan in the Sub-Population Plans Section of the District Improvement Plan.
45
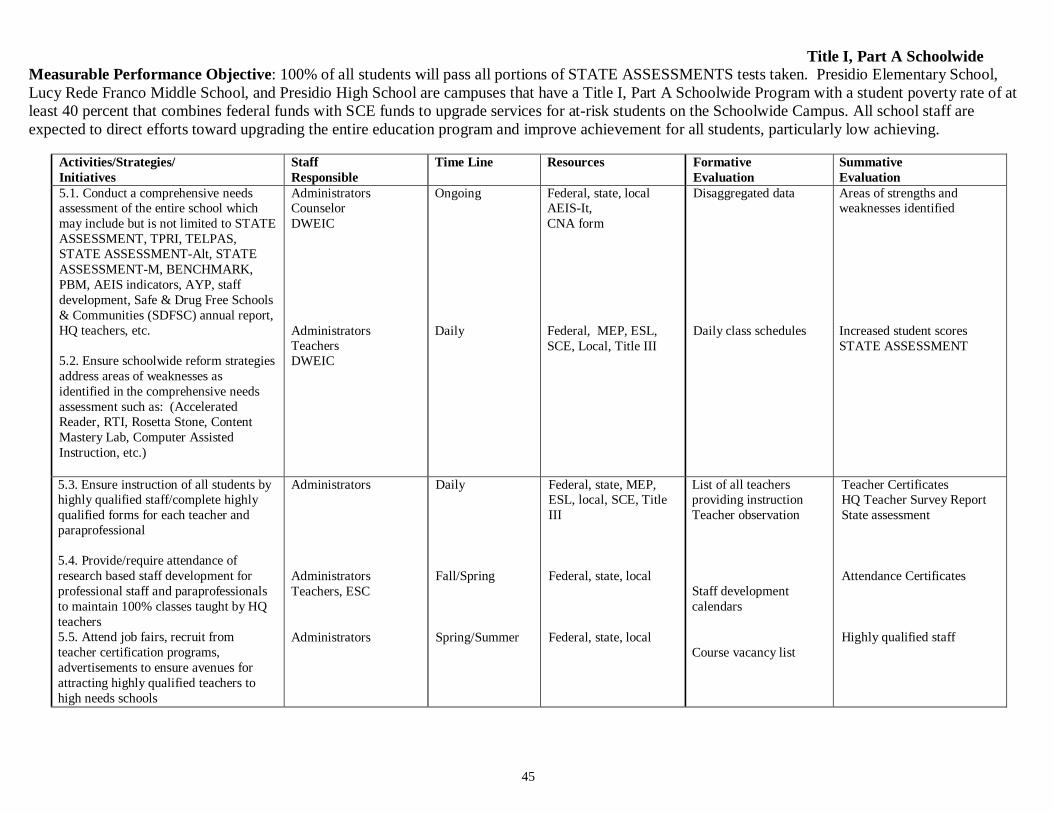
Title I, Part A Schoolwide
Measurable Performance Objective: 100% of all students will pass all portions of STATE ASSESSMENTS tests taken. Presidio Elementary School,
Lucy Rede Franco Middle School, and Presidio High School are campuses that have a Title I, Part A Schoolwide Program with a student poverty rate of at
least 40 percent that combines federal funds with SCE funds to upgrade services for at-risk students on the Schoolwide Campus. All school staff are
expected to direct efforts toward upgrading the entire education program and improve achievement for all students, particularly low achieving.
Activities/Strategies/
Initiatives
Staff
Responsible
Time Line Resources Formative
Evaluation
Summative
Evaluation
5.1. Conduct a comprehensive needs assessment of the entire school which
may include but is not limited to STATE
ASSESSMENT, TPRI, TELPAS,
STATE ASSESSMENT-Alt, STATE
ASSESSMENT-M, BENCHMARK,
PBM, AEIS indicators, AYP, staff
development, Safe & Drug Free Schools
& Communities (SDFSC) annual report,
HQ teachers, etc.
5.2. Ensure schoolwide reform strategies
address areas of weaknesses as
identified in the comprehensive needs
assessment such as: (Accelerated
Reader, RTI, Rosetta Stone, Content
Mastery Lab, Computer Assisted
Instruction, etc.)
Administrators Counselor
DWEIC
Administrators Teachers
DWEIC
Ongoing Daily
Federal, state, local AEIS-It,
CNA form Federal, MEP, ESL,
SCE, Local, Title III
Disaggregated data
Daily class schedules
Areas of strengths and weaknesses identified
Increased student scores
STATE ASSESSMENT
5.3. Ensure instruction of all students by highly qualified staff/complete highly
qualified forms for each teacher and
paraprofessional
5.4. Provide/require attendance of
research based staff development for
professional staff and paraprofessionals
to maintain 100% classes taught by HQ
teachers
5.5. Attend job fairs, recruit from
teacher certification programs,
advertisements to ensure avenues for
attracting highly qualified teachers to
high needs schools
Administrators
Administrators
Teachers, ESC
Administrators
Daily
Fall/Spring
Spring/Summer
Federal, state, MEP, ESL, local, SCE, Title
III
Federal, state, local
Federal, state, local
List of all teachers providing instruction
Teacher observation
Staff development
calendars Course vacancy list
Teacher Certificates HQ Teacher Survey Report
State assessment
Attendance Certificates
Highly qualified staff
46
Title I, Part A Schoolwide
Activities/Strategies/
Initiatives
Staff
Responsible
Time Line Resources Formative
Evaluation
Summative
Evaluation
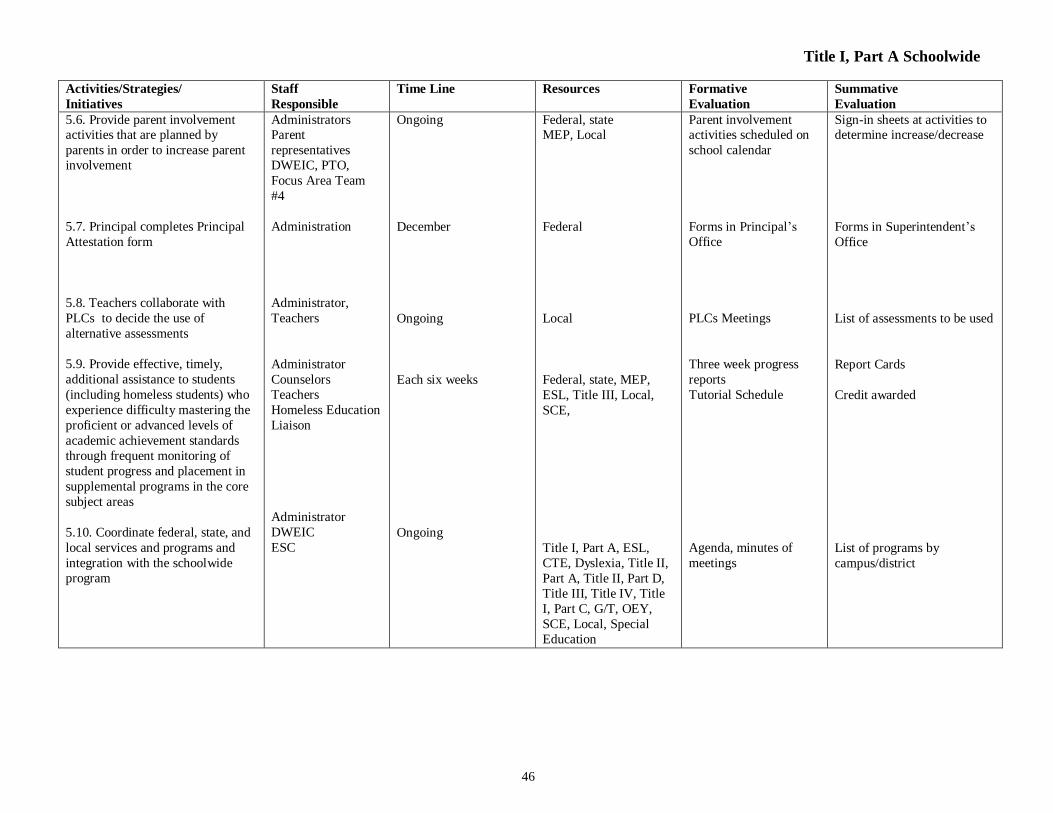
5.6. Provide parent involvement activities that are planned by
parents in order to increase parent
involvement
5.7. Principal completes Principal
Attestation form
5.8. Teachers collaborate with
PLCs to decide the use of
alternative assessments
5.9. Provide effective, timely,
additional assistance to students
(including homeless students) who
experience difficulty mastering the
proficient or advanced levels of
academic achievement standards
through frequent monitoring of
student progress and placement in
supplemental programs in the core
subject areas
5.10. Coordinate federal, state, and
local services and programs and
integration with the schoolwide
program
Administrators Parent
representatives
DWEIC, PTO,
Focus Area Team
#4
Administration
Administrator,
Teachers
Administrator
Counselors
Teachers
Homeless Education
Liaison
Administrator
DWEIC
ESC
Ongoing
December
Ongoing
Each six weeks
Ongoing
Federal, state MEP, Local
Federal
Local
Federal, state, MEP,
ESL, Title III, Local,
SCE,
Title I, Part A, ESL,
CTE, Dyslexia, Title II,
Part A, Title II, Part D,
Title III, Title IV, Title
I, Part C, G/T, OEY,
SCE, Local, Special
Education
Parent involvement activities scheduled on
school calendar
Forms in Principal’s
Office
PLCs Meetings
Three week progress
reports
Tutorial Schedule
Agenda, minutes of
meetings
Sign-in sheets at activities to determine increase/decrease
Forms in Superintendent’s
Office
List of assessments to be used
Report Cards
Credit awarded
List of programs by
campus/district
47
Title I, Part A Schoolwide
Activities/Strategies/
Initiatives
Staff
Responsible
Time Line Resources Formative
Evaluation
Summative
Evaluation
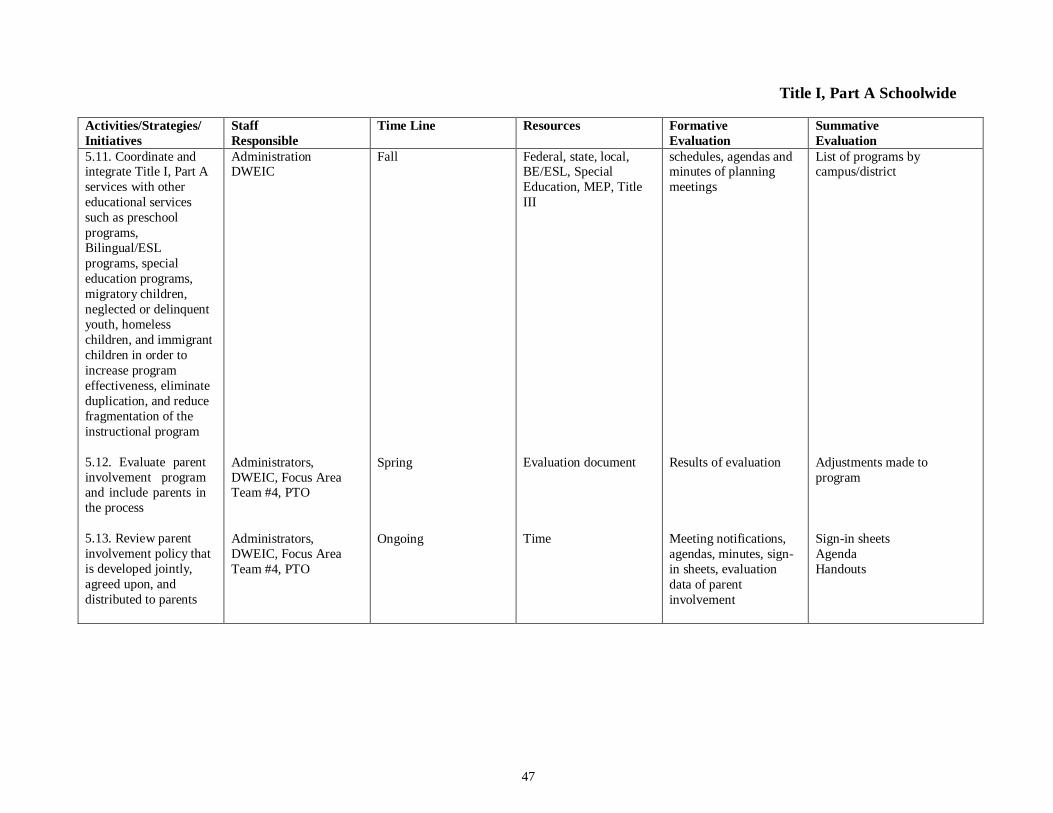
5.11. Coordinate and integrate Title I, Part A
services with other
educational services
such as preschool
programs,
Bilingual/ESL
programs, special
education programs,
migratory children,
neglected or delinquent
youth, homeless
children, and immigrant
children in order to
increase program
effectiveness, eliminate
duplication, and reduce
fragmentation of the
instructional program
5.12. Evaluate parent
involvement program
and include parents in
the process
5.13. Review parent
involvement policy that
is developed jointly,
agreed upon, and
distributed to parents
Administration DWEIC
Administrators,
DWEIC, Focus Area Team #4, PTO
Administrators,
DWEIC, Focus Area
Team #4, PTO
Fall
Spring
Ongoing
Federal, state, local, BE/ESL, Special
Education, MEP, Title
III
Evaluation document
Time
schedules, agendas and minutes of planning
meetings
Results of evaluation
Meeting notifications,
agendas, minutes, sign-
in sheets, evaluation
data of parent
involvement
List of programs by campus/district
Adjustments made to
program
Sign-in sheets
Agenda
Handouts
48
Title I, Part A Schoolwide Activities/Strategies/ Initiatives
Staff Responsible
Time Line Resources Formative Evaluation
Summative Evaluation
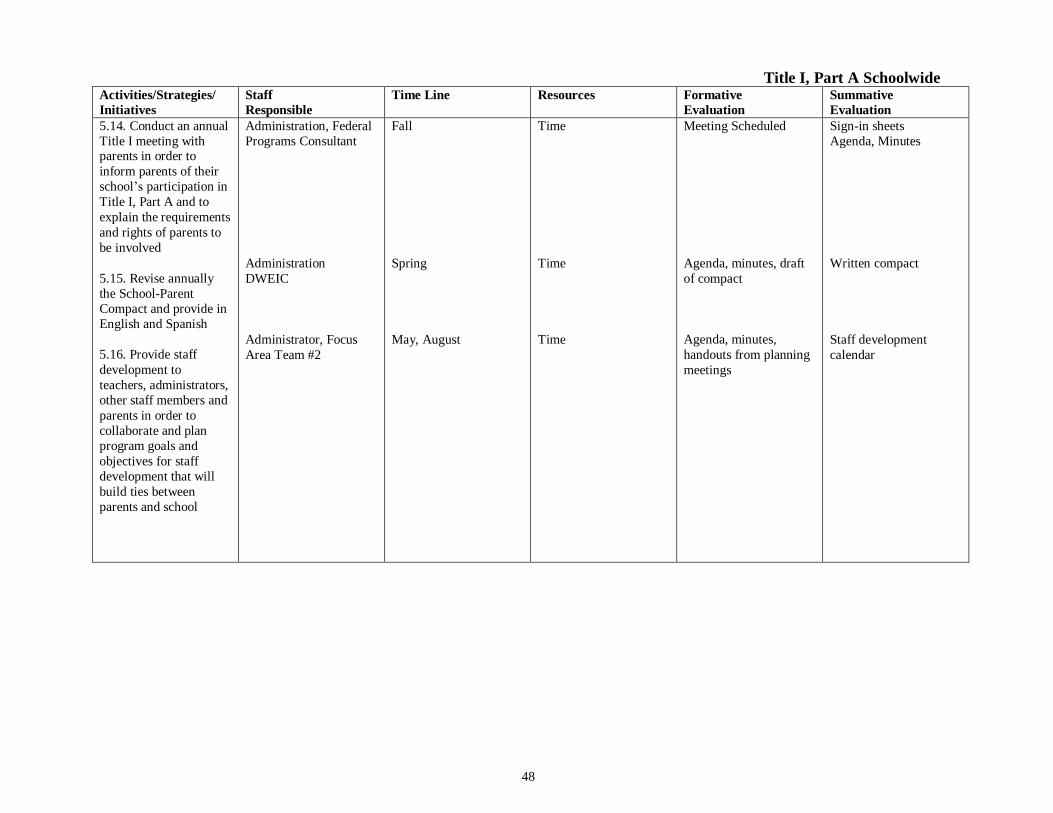
5.14. Conduct an annual
Title I meeting with parents in order to
inform parents of their
school’s participation in
Title I, Part A and to
explain the requirements
and rights of parents to
be involved
5.15. Revise annually
the School-Parent
Compact and provide in
English and Spanish
5.16. Provide staff
development to
teachers, administrators,
other staff members and
parents in order to
collaborate and plan
program goals and
objectives for staff
development that will
build ties between
parents and school
Administration, Federal
Programs Consultant
Administration
DWEIC
Administrator, Focus
Area Team #2
Fall
Spring
May, August
Time
Time
Time
Meeting Scheduled
Agenda, minutes, draft
of compact
Agenda, minutes,
handouts from planning
meetings
Sign-in sheets
Agenda, Minutes
Written compact
Staff development
calendar
49
Title I, Part A Schoolwide
Activities/Strategies/
Initiatives
Staff
Responsible
Time Line Resources Formative
Evaluation
Summative
Evaluation
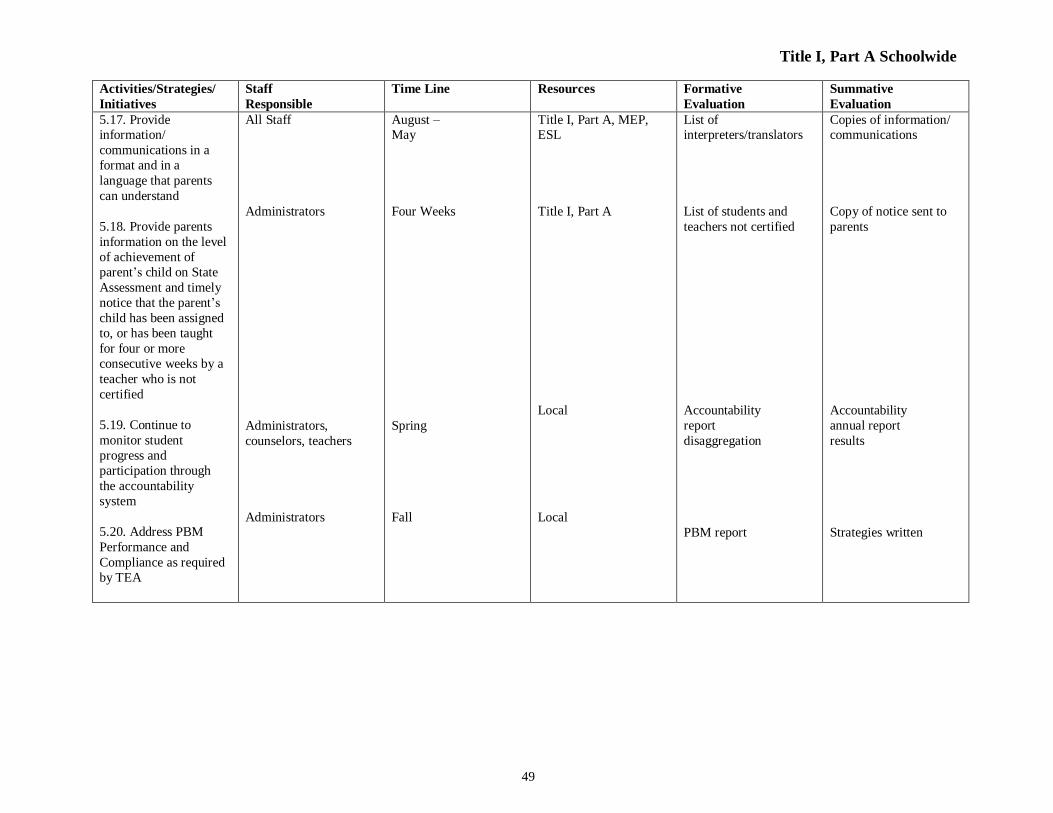
5.17. Provide information/
communications in a
format and in a
language that parents
can understand
5.18. Provide parents
information on the level
of achievement of
parent’s child on State
Assessment and timely
notice that the parent’s
child has been assigned
to, or has been taught
for four or more
consecutive weeks by a
teacher who is not
certified
5.19. Continue to
monitor student
progress and
participation through
the accountability
system
5.20. Address PBM
Performance and
Compliance as required
by TEA
All Staff
Administrators
Administrators,
counselors, teachers
Administrators
August – May
Four Weeks
Spring
Fall
Title I, Part A, MEP, ESL
Title I, Part A
Local
Local
List of interpreters/translators
List of students and
teachers not certified
Accountability
report
disaggregation
PBM report
Copies of information/ communications
Copy of notice sent to
parents
Accountability
annual report
results
Strategies written
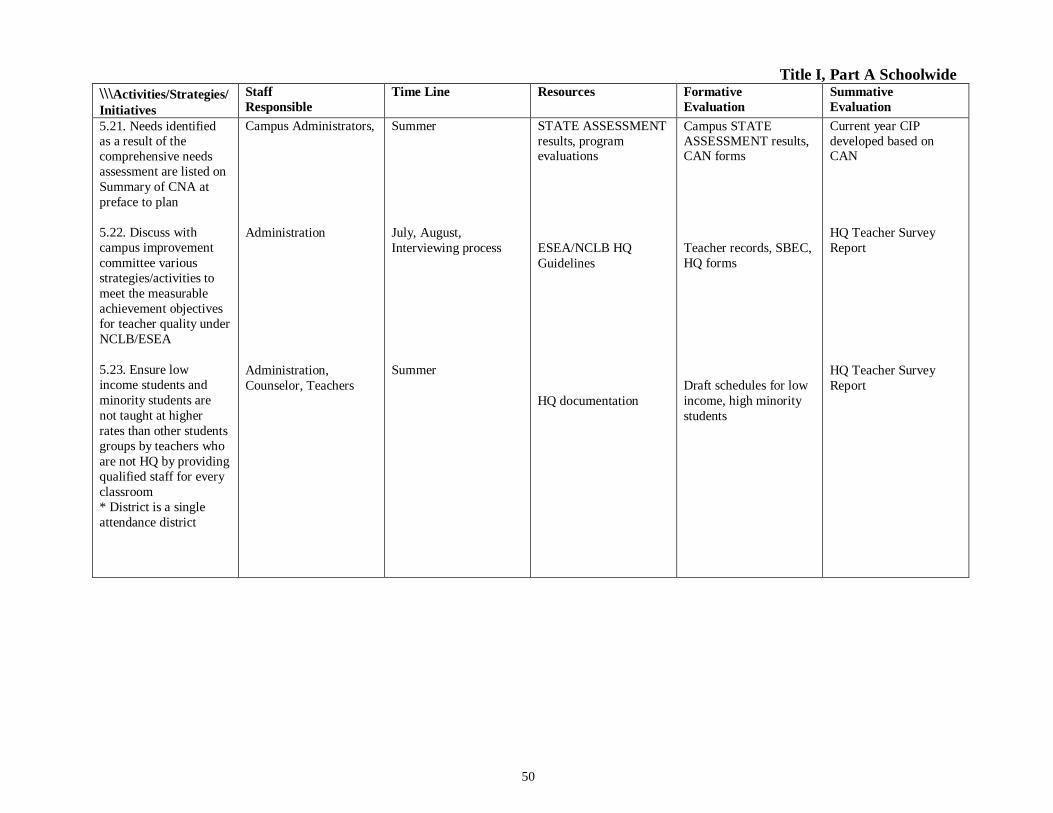
50
Title I, Part A Schoolwide
\\\Activities/Strategies/
Initiatives
Staff
Responsible
Time Line Resources Formative
Evaluation
Summative
Evaluation
5.21. Needs identified as a result of the
comprehensive needs
assessment are listed on
Summary of CNA at
preface to plan
5.22. Discuss with
campus improvement
committee various
strategies/activities to
meet the measurable
achievement objectives
for teacher quality under
NCLB/ESEA
5.23. Ensure low
income students and
minority students are
not taught at higher
rates than other students
groups by teachers who
are not HQ by providing
qualified staff for every
classroom
* District is a single
attendance district
Campus Administrators,
Administration
Administration,
Counselor, Teachers
Summer
July, August,
Interviewing process
Summer
STATE ASSESSMENT
results, program evaluations
ESEA/NCLB HQ
Guidelines
HQ documentation
Campus STATE ASSESSMENT results, CAN forms
Teacher records, SBEC,
HQ forms
Draft schedules for low
income, high minority
students
Current year CIP
developed based on CAN
HQ Teacher Survey
Report
HQ Teacher Survey
Report
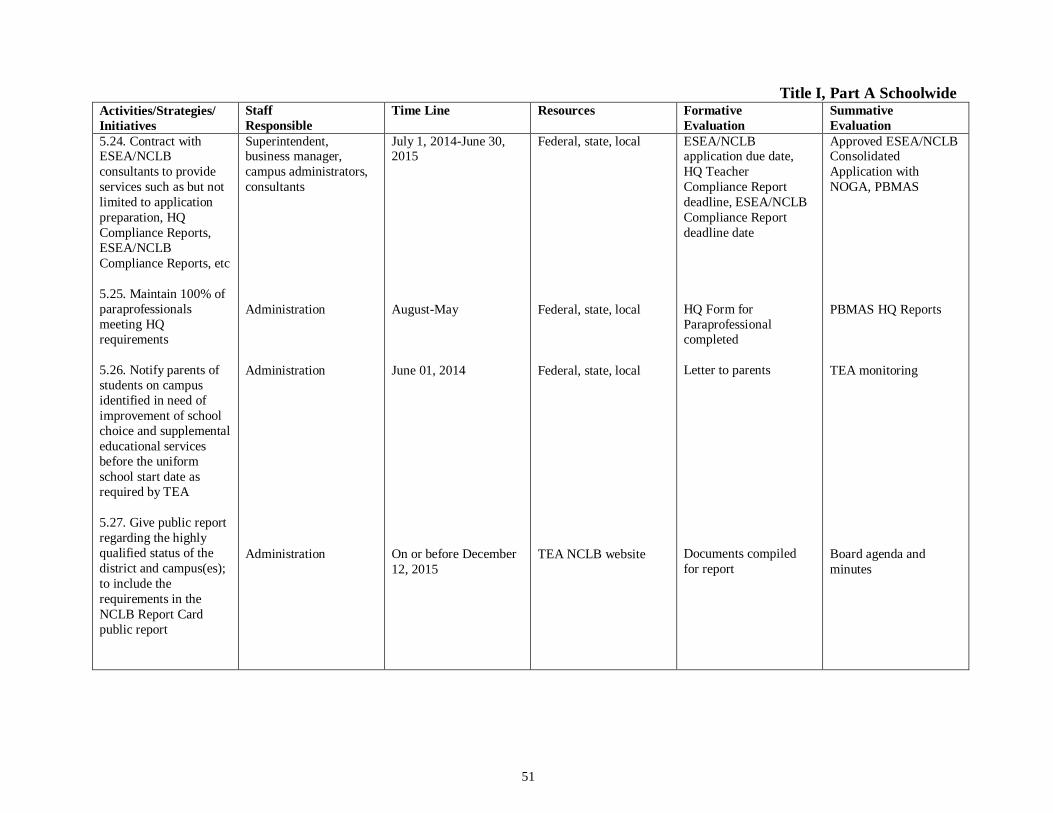
51
Title I, Part A Schoolwide Activities/Strategies/
Initiatives
Staff
Responsible
Time Line Resources Formative
Evaluation
Summative
Evaluation
5.24. Contract with ESEA/NCLB
consultants to provide
services such as but not
limited to application
preparation, HQ
Compliance Reports,
ESEA/NCLB
Compliance Reports, etc
5.25. Maintain 100% of
paraprofessionals
meeting HQ
requirements
5.26. Notify parents of
students on campus
identified in need of
improvement of school
choice and supplemental
educational services
before the uniform
school start date as
required by TEA
5.27. Give public report
regarding the highly
qualified status of the
district and campus(es);
to include the
requirements in the
NCLB Report Card
public report
Superintendent, business manager,
campus administrators,
consultants
Administration
Administration
Administration
July 1, 2014-June 30, 2015
August-May
June 01, 2014
On or before December
12, 2015
Federal, state, local
Federal, state, local
Federal, state, local
TEA NCLB website
ESEA/NCLB application due date,
HQ Teacher
Compliance Report
deadline, ESEA/NCLB
Compliance Report
deadline date
HQ Form for
Paraprofessional completed
Letter to parents
Documents compiled
for report
Approved ESEA/NCLB Consolidated
Application with
NOGA, PBMAS
PBMAS HQ Reports
TEA monitoring
Board agenda and
minutes
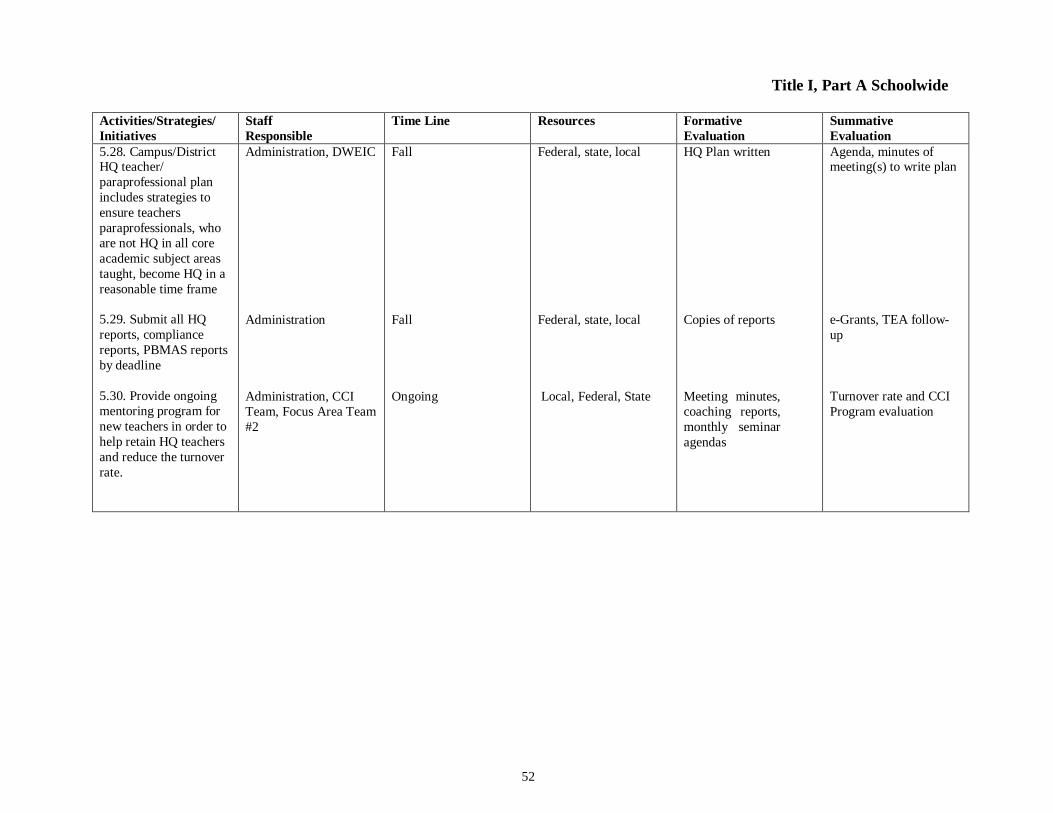
52
Title I, Part A Schoolwide
Activities/Strategies/
Initiatives
Staff
Responsible
Time Line Resources Formative
Evaluation
Summative
Evaluation
5.28. Campus/District HQ teacher/
paraprofessional plan
includes strategies to
ensure teachers
paraprofessionals, who
are not HQ in all core
academic subject areas
taught, become HQ in a
reasonable time frame
5.29. Submit all HQ
reports, compliance
reports, PBMAS reports
by deadline
5.30. Provide ongoing
mentoring program for
new teachers in order to
help retain HQ teachers
and reduce the turnover
rate.
Administration, DWEIC
Administration
Administration, CCI
Team, Focus Area Team
#2
Fall
Fall
Ongoing
Federal, state, local
Federal, state, local
Local, Federal, State
HQ Plan written
Copies of reports
Meeting minutes,
coaching reports,
monthly seminar
agendas
Agenda, minutes of meeting(s) to write plan
e-Grants, TEA follow-
up
Turnover rate and CCI
Program evaluation
53
6. Title I, Part C—Migrant Education
Intent and Purpose
The purpose of the Title I, Part C, Migrant Education Program (MEP) is to do all of the following:
1. Support high-quality and comprehensive education programs for migratory children to help reduce the educational disruptions and other problems that result from repeated moves;
2. Ensure that migratory children who move among the states are not penalized in any manner by disparities among the states in curriculum, graduation requirements, and state academic content and student academic achievement standards;
3. Ensure that migratory children are provided with appropriate education services (including supportive services) that address their special needs in a coordinated and efficient manner;
4. Ensure that migratory children receive full and appropriate opportunities to meet the same challenging State academic content and students’ academic achievement standards that all children are expected to meet;
5. Design programs to help migratory children overcome educational disruption, cultural and language barriers, social isolation, various health-related
problems and other factors that inhibit the ability of such children to do well in school, and to prepare such children to make a successful transition to
postsecondary education or employment; and,
6. Ensure that migratory children benefit from State and local systemic reforms (NCLB Title I, Part C).
The intended program beneficiaries are migratory children, ages 0 through 21, and their families.
1. MEP activities shall be used to do the following:
• meet the identified needs of migratory children that result from their migratory lifestyle to permit these children to participate effectively in
school
• address the unique needs of migratory children that are not addressed by services available from other Federal or non-Federal programs,
except that migratory children who are eligible to receive services under Title I, Part A, may receive those services through funds provided
under that part
2. In providing services with Title I, Part C, funds, you must give priority to migratory children who are failing or most at risk of failing to meet the
State’s challenging academic content and academic achievement standards, and whose education has been interrupted during the regular school year.
3. In the planning and operation of MEP projects and activities, you must consult regularly with migrant parents through the district’s parent advisory
council (PAC).
4. To the extent feasible, the district’s MEP will provide for the following:
• advocacy and outreach activities for migratory children and their families, including coordination to allow them to gain access to other
education, health, nutrition, and social services (Migrant Services Coordination (MSC))
• professional development programs, including mentoring, for teachers and other MEP personnel
• family literacy programs, including such programs that use models developed under Even Start
• the integration of information technology into educational and related programs
• programs to facilitate the transition of secondary school students to postsecondary education or employment
• supportive services for out-of-school youth
5. In the planning and operation of MEP projects, MSC, migrant student identification and recruitment (ID&R, and migrant student’s data collection
and entry on the New Generation System (NGS) and the Public Education Information Management System (PEIMS)) are conducted on a year-round
basis.
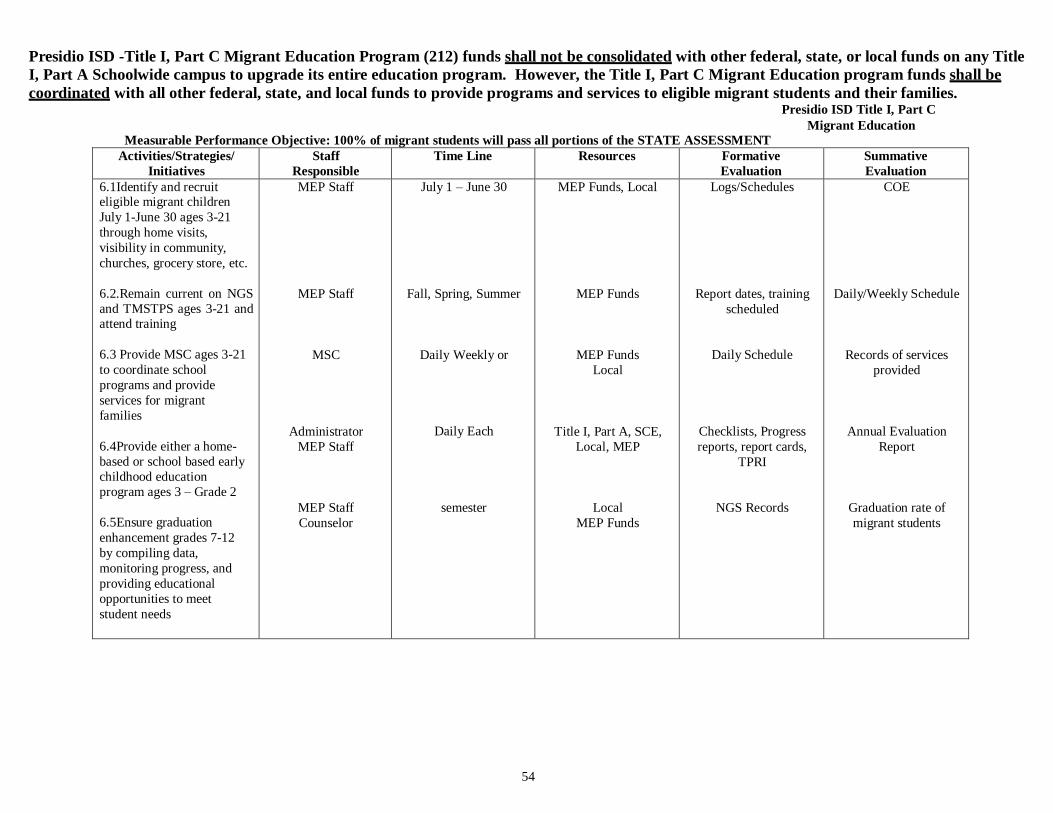
54
Presidio ISD -Title I, Part C Migrant Education Program (212) funds shall not be consolidated with other federal, state, or local funds on any Title
I, Part A Schoolwide campus to upgrade its entire education program. However, the Title I, Part C Migrant Education program funds shall be
coordinated with all other federal, state, and local funds to provide programs and services to eligible migrant students and their families. Presidio ISD Title I, Part C
Migrant Education
Measurable Performance Objective: 100% of migrant students will pass all portions of the STATE ASSESSMENT
Activities/Strategies/
Initiatives
Staff
Responsible
Time Line Resources Formative
Evaluation
Summative
Evaluation
6.1Identify and recruit eligible migrant children
July 1-June 30 ages 3-21
through home visits,
visibility in community,
churches, grocery store, etc.
6.2.Remain current on NGS
and TMSTPS ages 3-21 and attend training
6.3 Provide MSC ages 3-21
to coordinate school
programs and provide
services for migrant
families
6.4Provide either a home-
based or school based early
childhood education
program ages 3 – Grade 2
6.5Ensure graduation
enhancement grades 7-12
by compiling data,
monitoring progress, and
providing educational
opportunities to meet
student needs
MEP Staff
MEP Staff
MSC
Administrator
MEP Staff
MEP Staff
Counselor
July 1 – June 30
Fall, Spring, Summer
Daily Weekly or
Daily Each
semester
MEP Funds, Local
MEP Funds
MEP Funds
Local
Title I, Part A, SCE,
Local, MEP
Local
MEP Funds
Logs/Schedules
Report dates, training
scheduled
Daily Schedule
Checklists, Progress
reports, report cards,
TPRI
NGS Records
COE
Daily/Weekly Schedule
Records of services
provided
Annual Evaluation
Report
Graduation rate of
migrant students
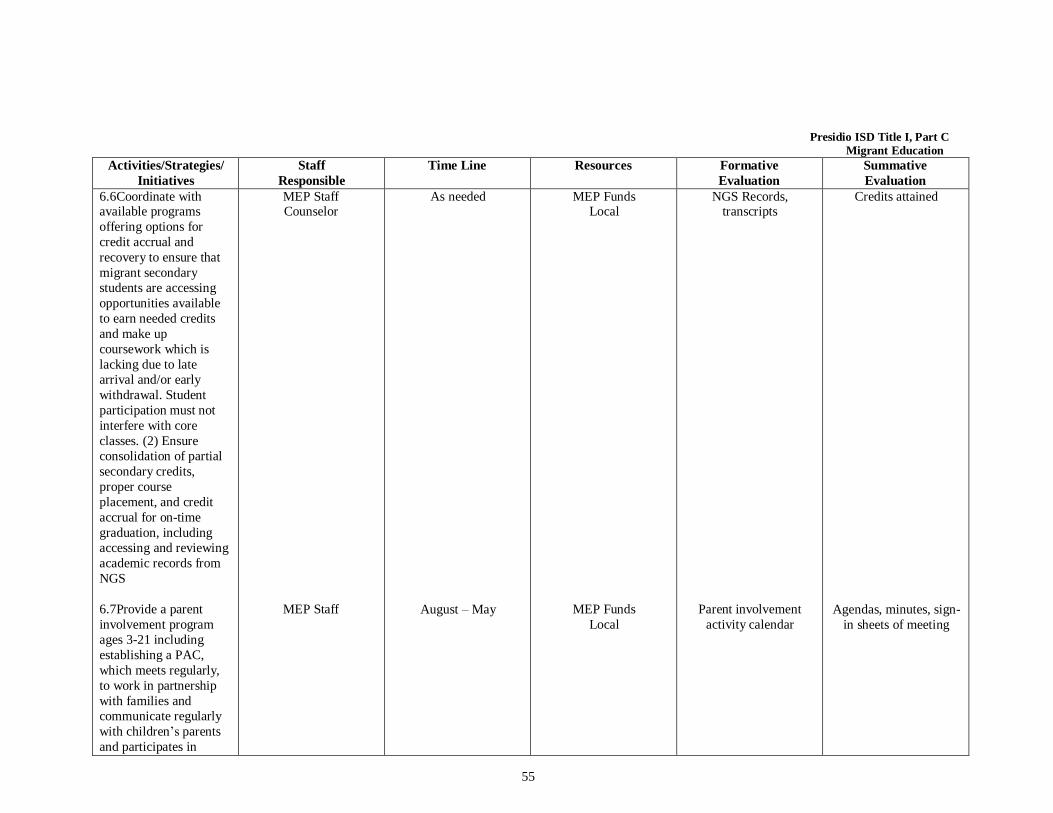
55
Presidio ISD Title I, Part C
Migrant Education
Activities/Strategies/
Initiatives
Staff
Responsible
Time Line Resources Formative
Evaluation
Summative
Evaluation
6.6Coordinate with available programs
offering options for
credit accrual and
recovery to ensure that
migrant secondary
students are accessing
opportunities available
to earn needed credits
and make up
coursework which is
lacking due to late
arrival and/or early
withdrawal. Student
participation must not
interfere with core
classes. (2) Ensure
consolidation of partial
secondary credits,
proper course
placement, and credit
accrual for on-time
graduation, including
accessing and reviewing
academic records from
NGS
6.7Provide a parent
involvement program
ages 3-21 including
establishing a PAC,
which meets regularly,
to work in partnership
with families and
communicate regularly
with children’s parents
and participates in
MEP Staff Counselor
MEP Staff
As needed
August – May
MEP Funds Local
MEP Funds
Local
NGS Records, transcripts
Parent involvement
activity calendar
Credits attained
Agendas, minutes, sign-
in sheets of meeting
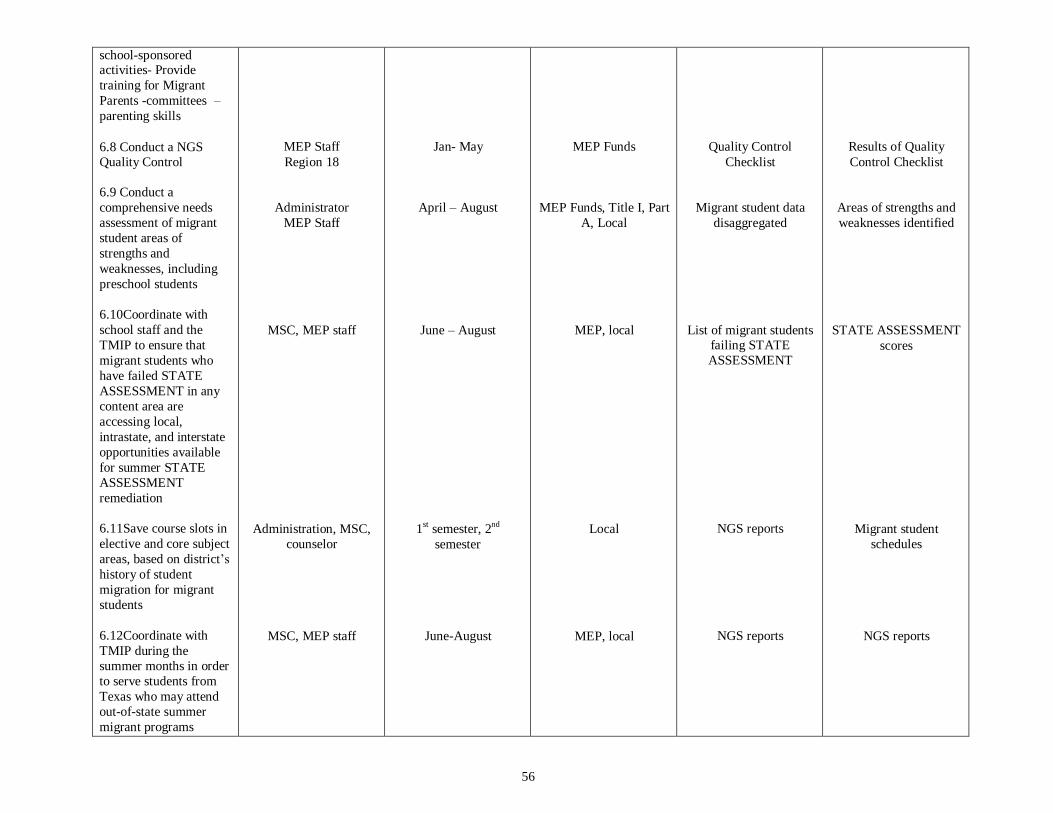
56
school-sponsored activities- Provide
training for Migrant
Parents -committees –
parenting skills
6.8 Conduct a NGS Quality Control
6.9 Conduct a
comprehensive needs
assessment of migrant
student areas of
strengths and
weaknesses, including
preschool students
6.10Coordinate with
school staff and the
TMIP to ensure that
migrant students who
have failed STATE
ASSESSMENT in any
content area are
accessing local,
intrastate, and interstate
opportunities available
for summer STATE
ASSESSMENT
remediation
6.11Save course slots in
elective and core subject
areas, based on district’s
history of student
migration for migrant
students
6.12Coordinate with
TMIP during the
summer months in order
to serve students from
Texas who may attend
out-of-state summer
migrant programs
MEP Staff
Region 18
Administrator
MEP Staff
MSC, MEP staff
Administration, MSC,
counselor
MSC, MEP staff
Jan- May
April – August
June – August
1st
semester, 2nd
semester
June-August
MEP Funds
MEP Funds, Title I, Part
A, Local
MEP, local
Local
MEP, local
Quality Control
Checklist
Migrant student data
disaggregated
List of migrant students failing STATE
ASSESSMENT
NGS reports
NGS reports
Results of Quality
Control Checklist
Areas of strengths and
weaknesses identified
STATE ASSESSMENT
scores
Migrant student
schedules
NGS reports
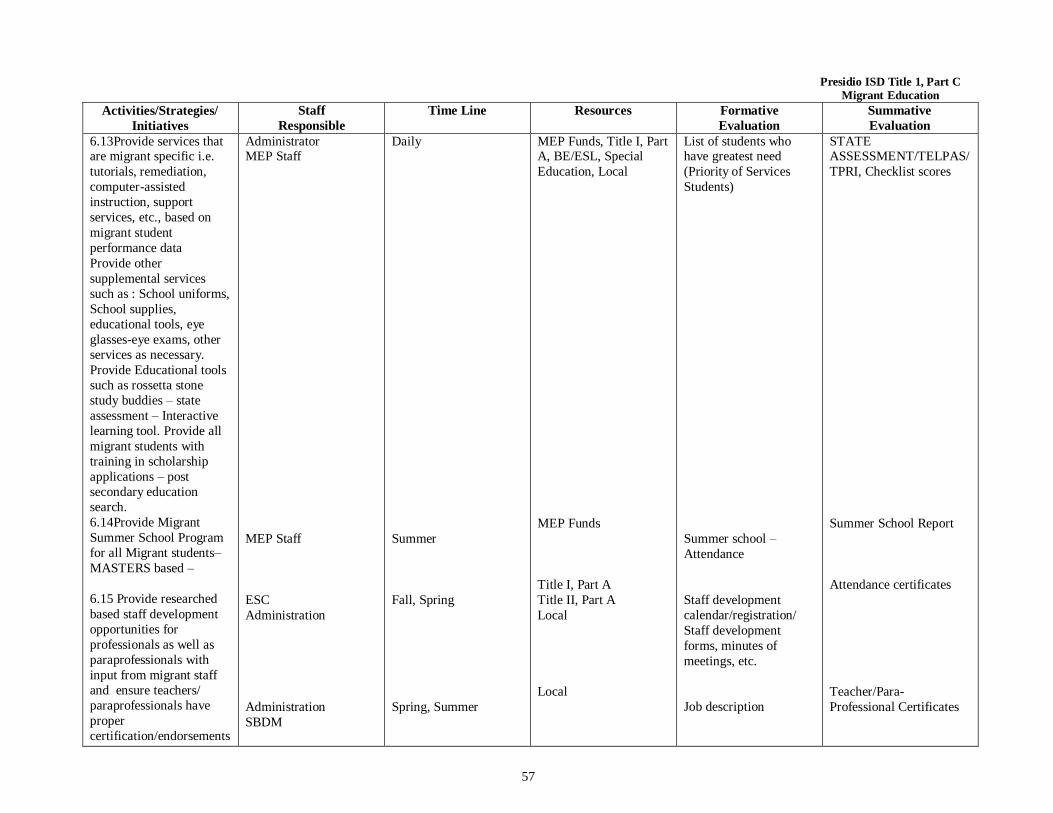
57
Presidio ISD Title 1, Part C
Migrant Education
Activities/Strategies/
Initiatives
Staff
Responsible
Time Line Resources Formative
Evaluation
Summative
Evaluation
6.13Provide services that are migrant specific i.e.
tutorials, remediation,
computer-assisted
instruction, support
services, etc., based on
migrant student
performance data
Provide other
supplemental services
such as : School uniforms,
School supplies,
educational tools, eye
glasses-eye exams, other
services as necessary.
Provide Educational tools
such as rossetta stone
study buddies – state
assessment – Interactive
learning tool. Provide all
migrant students with
training in scholarship
applications – post
secondary education
search.
6.14Provide Migrant
Summer School Program
for all Migrant students–
MASTERS based –
6.15 Provide researched
based staff development
opportunities for
professionals as well as
paraprofessionals with
input from migrant staff
and ensure teachers/
paraprofessionals have
proper
certification/endorsements
Administrator MEP Staff
MEP Staff
ESC
Administration
Administration
SBDM
Daily
Summer
Fall, Spring
Spring, Summer
MEP Funds, Title I, Part A, BE/ESL, Special
Education, Local
MEP Funds
Title I, Part A
Title II, Part A
Local
Local
List of students who have greatest need
(Priority of Services
Students)
Summer school –
Attendance
Staff development
calendar/registration/
Staff development
forms, minutes of
meetings, etc.
Job description
STATE ASSESSMENT/TELPAS/
TPRI, Checklist scores
Summer School Report
Attendance certificates
Teacher/Para-
Professional Certificates
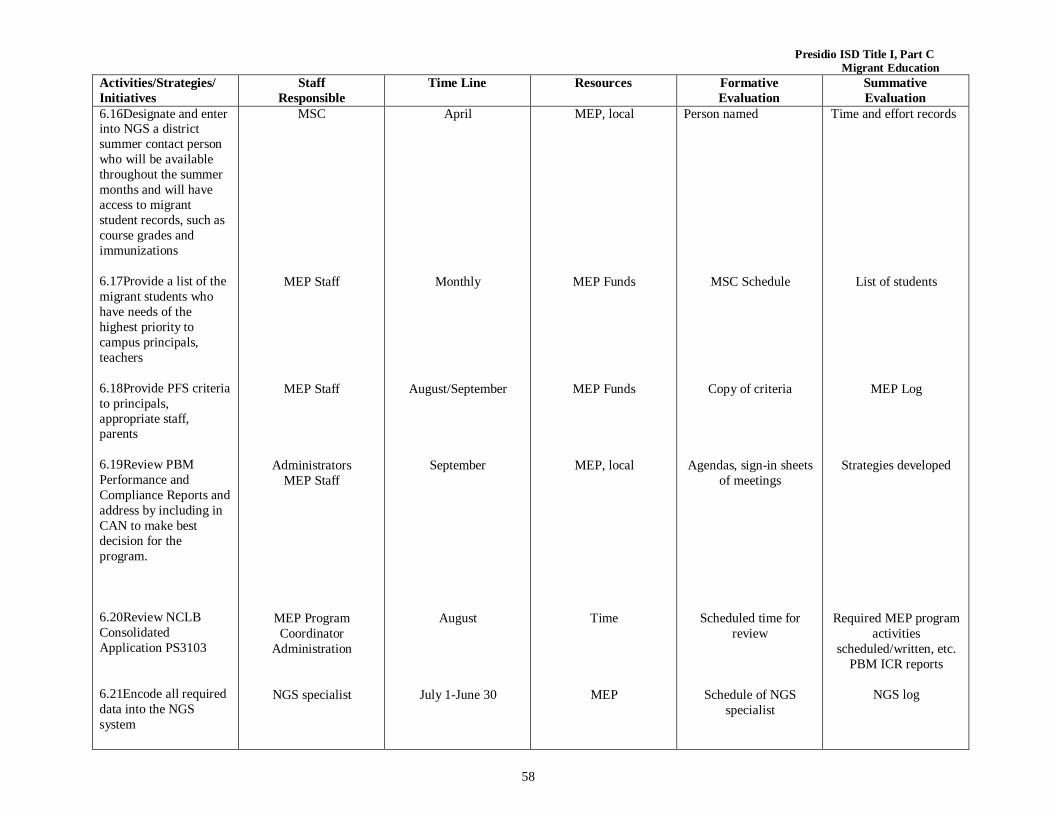
58
Presidio ISD Title I, Part C
Migrant Education
Activities/Strategies/
Initiatives
Staff
Responsible
Time Line Resources Formative
Evaluation
Summative
Evaluation
6.16Designate and enter into NGS a district
summer contact person
who will be available
throughout the summer
months and will have
access to migrant
student records, such as
course grades and
immunizations
6.17Provide a list of the
migrant students who
have needs of the
highest priority to
campus principals,
teachers
6.18Provide PFS criteria
to principals,
appropriate staff, parents
6.19Review PBM
Performance and
Compliance Reports and
address by including in
CAN to make best
decision for the
program.
6.20Review NCLB
Consolidated
Application PS3103
6.21Encode all required
data into the NGS
system
MSC
MEP Staff
MEP Staff
Administrators
MEP Staff
MEP Program
Coordinator
Administration
NGS specialist
April
Monthly
August/September
September
August
July 1-June 30
MEP, local
MEP Funds
MEP Funds
MEP, local
Time
MEP
Person named
MSC Schedule
Copy of criteria
Agendas, sign-in sheets
of meetings
Scheduled time for
review
Schedule of NGS
specialist
Time and effort records
List of students
MEP Log
Strategies developed
Required MEP program
activities
scheduled/written, etc.
PBM ICR reports
NGS log
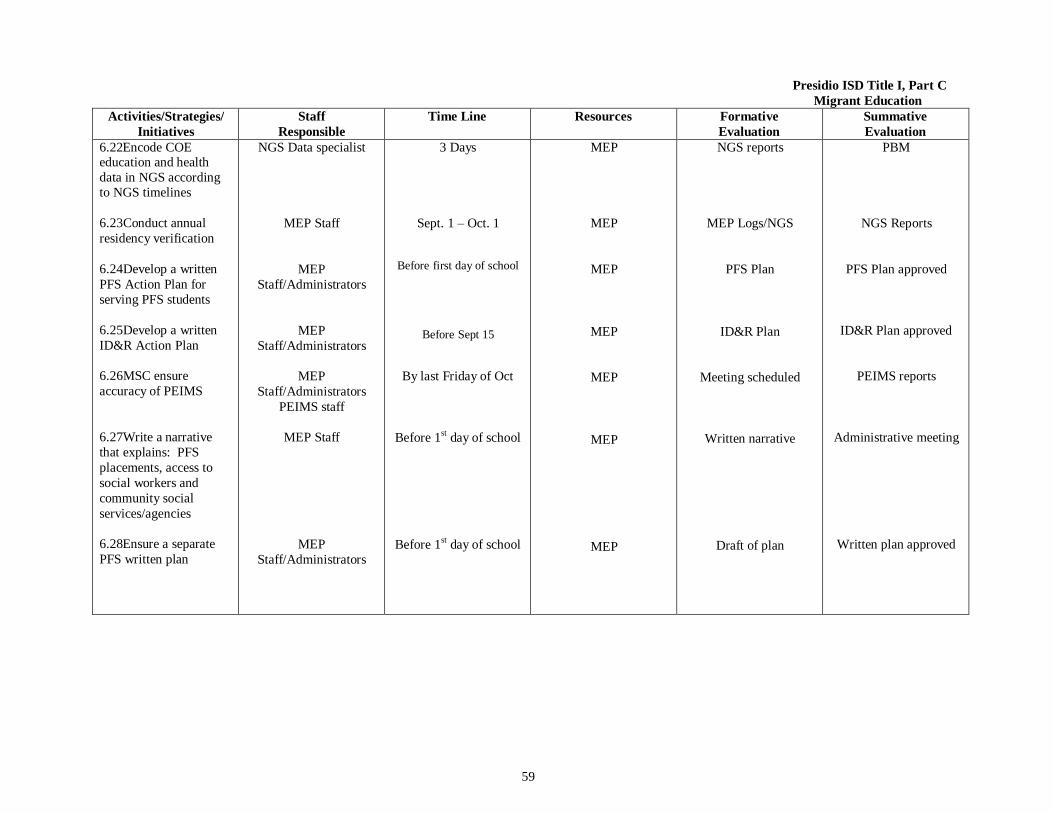
59
Presidio ISD Title I, Part C
Migrant Education
Activities/Strategies/
Initiatives
Staff
Responsible
Time Line Resources Formative
Evaluation
Summative
Evaluation
6.22Encode COE education and health
data in NGS according to NGS timelines
6.23Conduct annual
residency verification
6.24Develop a written
PFS Action Plan for
serving PFS students
6.25Develop a written
ID&R Action Plan
6.26MSC ensure
accuracy of PEIMS
6.27Write a narrative
that explains: PFS
placements, access to
social workers and
community social
services/agencies
6.28Ensure a separate
PFS written plan
NGS Data specialist
MEP Staff
MEP
Staff/Administrators
MEP
Staff/Administrators
MEP
Staff/Administrators
PEIMS staff
MEP Staff
MEP
Staff/Administrators
3 Days
Sept. 1 – Oct. 1
Before first day of school
Before Sept 15
By last Friday of Oct
Before 1
st day of school
Before 1st
day of school
MEP
MEP
MEP
MEP
MEP
MEP
MEP
NGS reports
MEP Logs/NGS
PFS Plan
ID&R Plan
Meeting scheduled
Written narrative
Draft of plan
PBM
NGS Reports
PFS Plan approved
ID&R Plan approved
PEIMS reports
Administrative meeting
Written plan approved
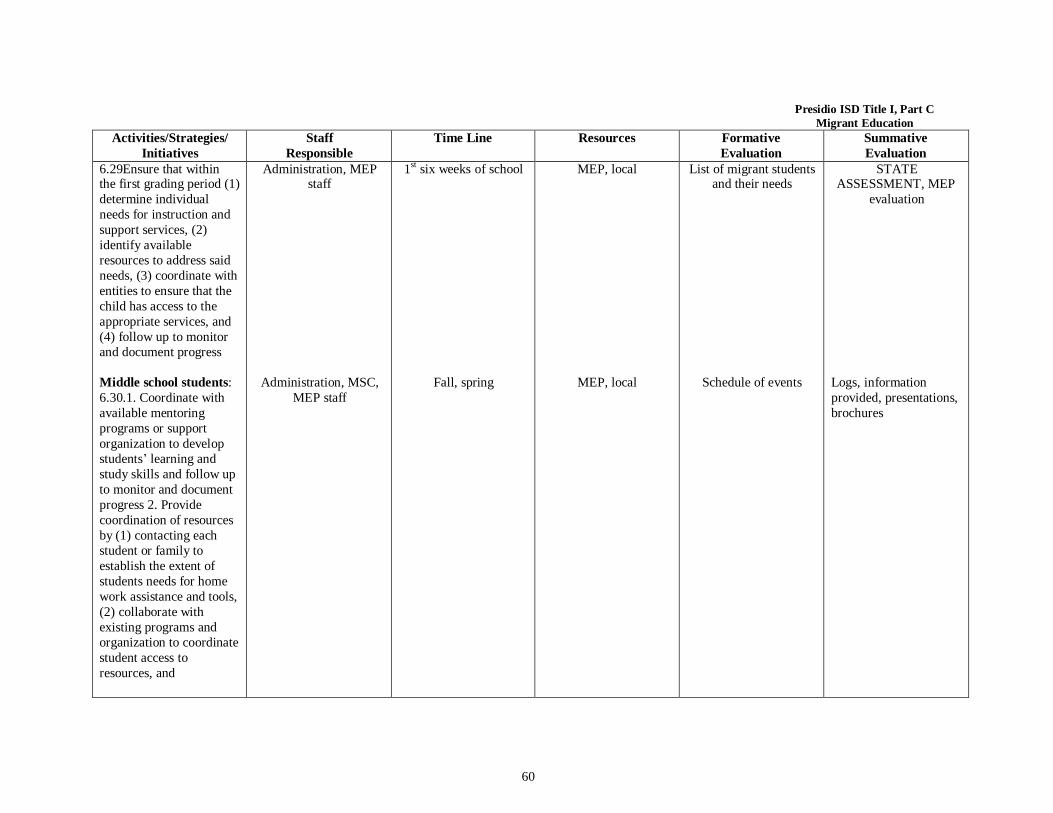
60
Presidio ISD Title I, Part C
Migrant Education
Activities/Strategies/
Initiatives
Staff
Responsible
Time Line Resources Formative
Evaluation
Summative
Evaluation
6.29Ensure that within the first grading period (1)
determine individual
needs for instruction and
support services, (2)
identify available
resources to address said
needs, (3) coordinate with
entities to ensure that the
child has access to the
appropriate services, and
(4) follow up to monitor
and document progress
Middle school students:
6.30.1. Coordinate with
available mentoring
programs or support
organization to develop
students’ learning and
study skills and follow up
to monitor and document
progress 2. Provide
coordination of resources
by (1) contacting each
student or family to
establish the extent of
students needs for home
work assistance and tools,
(2) collaborate with
existing programs and
organization to coordinate
student access to
resources, and
Administration, MEP staff
Administration, MSC,
MEP staff
1st
six weeks of school
Fall, spring
MEP, local
MEP, local
List of migrant students and their needs
Schedule of events
STATE ASSESSMENT, MEP
evaluation
Logs, information
provided, presentations,
brochures
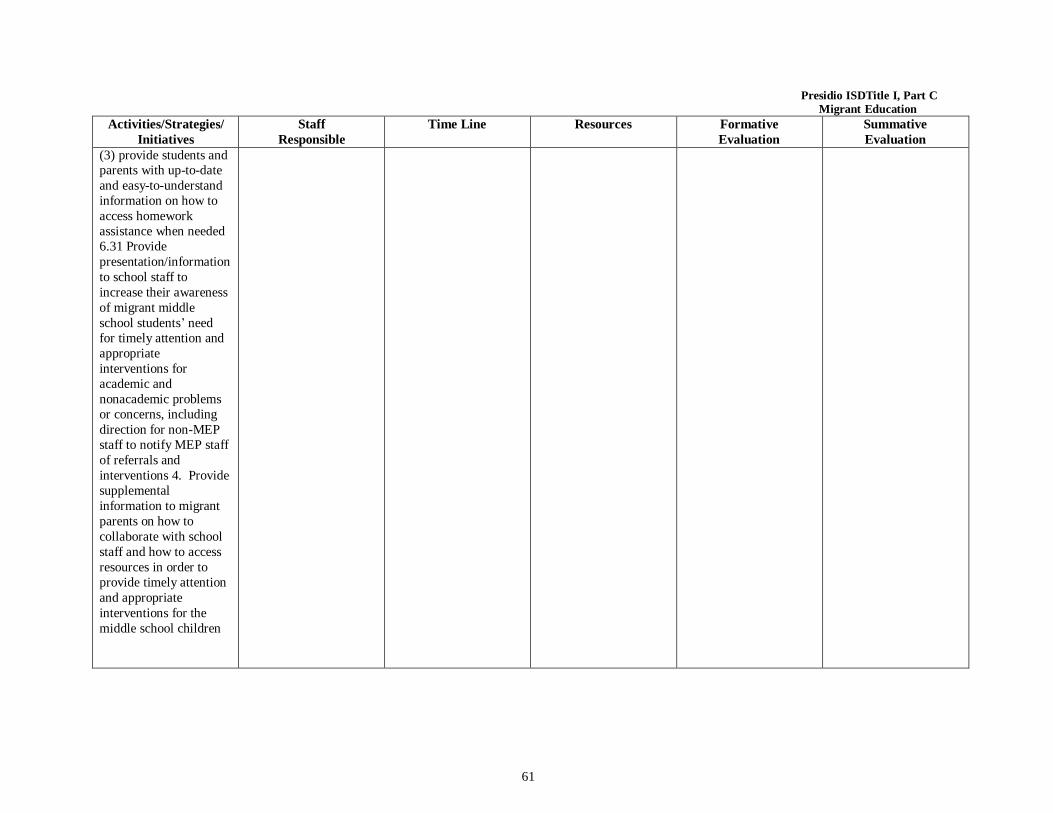
61
Presidio ISDTitle I, Part C
Migrant Education
Activities/Strategies/
Initiatives
Staff
Responsible
Time Line Resources Formative
Evaluation
Summative
Evaluation
(3) provide students and parents with up-to-date
and easy-to-understand
information on how to
access homework
assistance when needed
6.31 Provide
presentation/information
to school staff to
increase their awareness
of migrant middle
school students’ need
for timely attention and
appropriate
interventions for
academic and
nonacademic problems
or concerns, including
direction for non-MEP
staff to notify MEP staff
of referrals and
interventions 4. Provide
supplemental
information to migrant
parents on how to
collaborate with school
staff and how to access
resources in order to
provide timely attention
and appropriate
interventions for the
middle school children
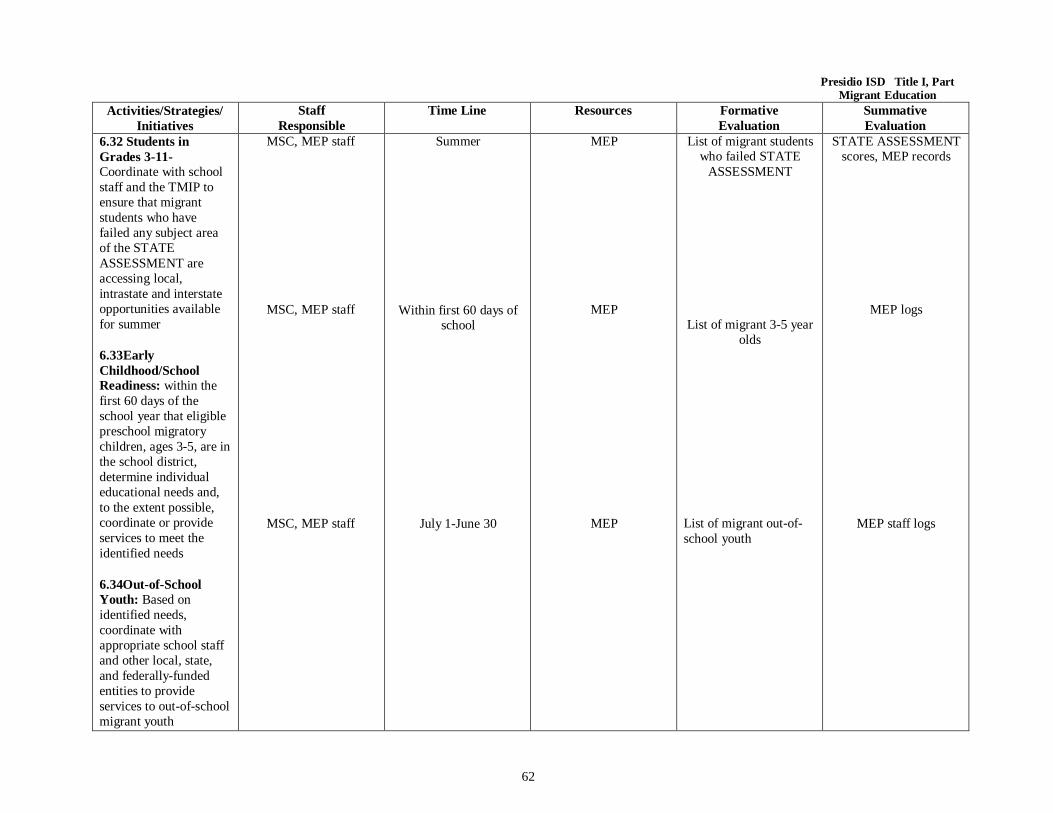
62
Presidio ISD Title I, Part Migrant Education
Activities/Strategies/
Initiatives
Staff
Responsible
Time Line Resources Formative
Evaluation
Summative
Evaluation
6.32 Students in
Grades 3-11-
Coordinate with school
staff and the TMIP to
ensure that migrant
students who have
failed any subject area
of the STATE
ASSESSMENT are
accessing local,
intrastate and interstate
opportunities available
for summer
6.33Early
Childhood/School
Readiness: within the
first 60 days of the
school year that eligible
preschool migratory
children, ages 3-5, are in
the school district,
determine individual
educational needs and,
to the extent possible,
coordinate or provide
services to meet the
identified needs
6.34Out-of-School
Youth: Based on
identified needs,
coordinate with
appropriate school staff
and other local, state,
and federally-funded
entities to provide
services to out-of-school
migrant youth
MSC, MEP staff
MSC, MEP staff
MSC, MEP staff
Summer
Within first 60 days of school
July 1-June 30
MEP
MEP
MEP
List of migrant students who failed STATE
ASSESSMENT
List of migrant 3-5 year
olds
List of migrant out-of-
school youth
STATE ASSESSMENT scores, MEP records
MEP logs
MEP staff logs
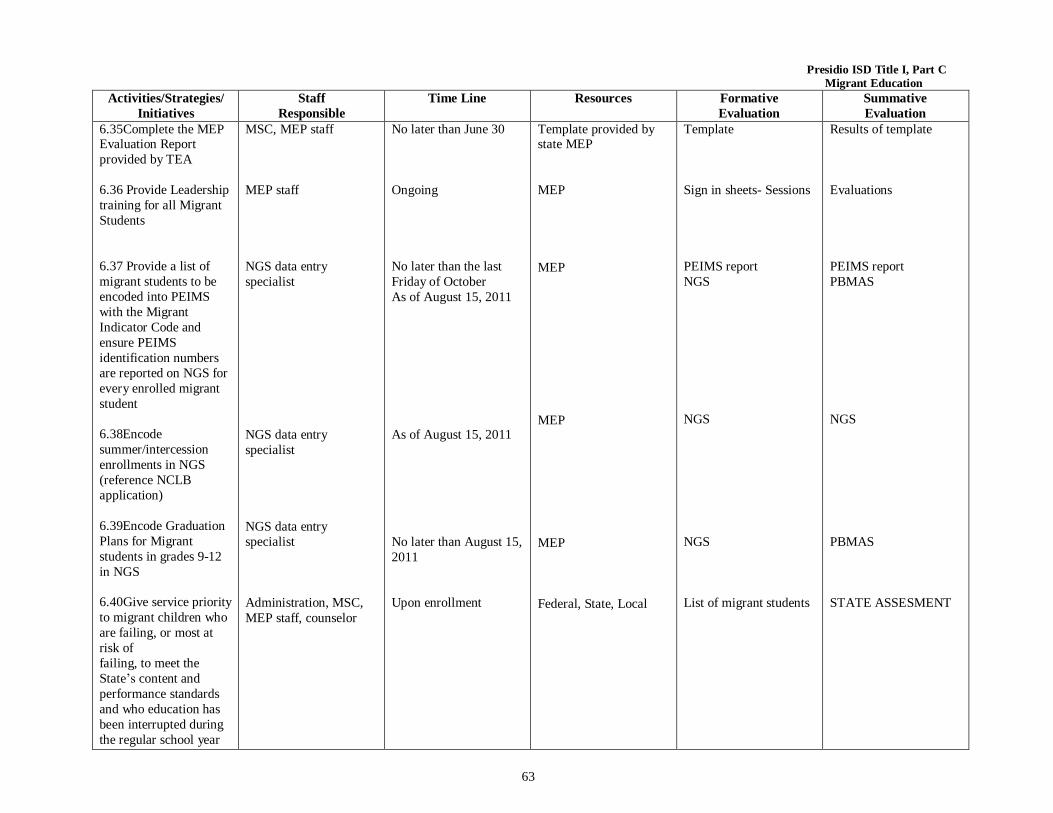
63
Presidio ISD Title I, Part C
Migrant Education
Activities/Strategies/
Initiatives
Staff
Responsible
Time Line Resources Formative
Evaluation
Summative
Evaluation
6.35Complete the MEP Evaluation Report
provided by TEA
6.36 Provide Leadership
training for all Migrant
Students
6.37 Provide a list of
migrant students to be
encoded into PEIMS
with the Migrant
Indicator Code and
ensure PEIMS
identification numbers
are reported on NGS for
every enrolled migrant
student
6.38Encode
summer/intercession
enrollments in NGS
(reference NCLB
application)
6.39Encode Graduation
Plans for Migrant
students in grades 9-12
in NGS
6.40Give service priority
to migrant children who
are failing, or most at
risk of
failing, to meet the
State’s content and
performance standards
and who education has
been interrupted during
the regular school year
MSC, MEP staff
MEP staff
NGS data entry
specialist
NGS data entry
specialist
NGS data entry
specialist
Administration, MSC,
MEP staff, counselor
No later than June 30
Ongoing
No later than the last
Friday of October
As of August 15, 2011
As of August 15, 2011
No later than August 15,
2011
Upon enrollment
Template provided by state MEP
MEP
MEP
MEP
MEP
Federal, State, Local
Template
Sign in sheets- Sessions
PEIMS report
NGS
NGS
NGS
List of migrant students
Results of template
Evaluations
PEIMS report
PBMAS
NGS
PBMAS
STATE ASSESMENT
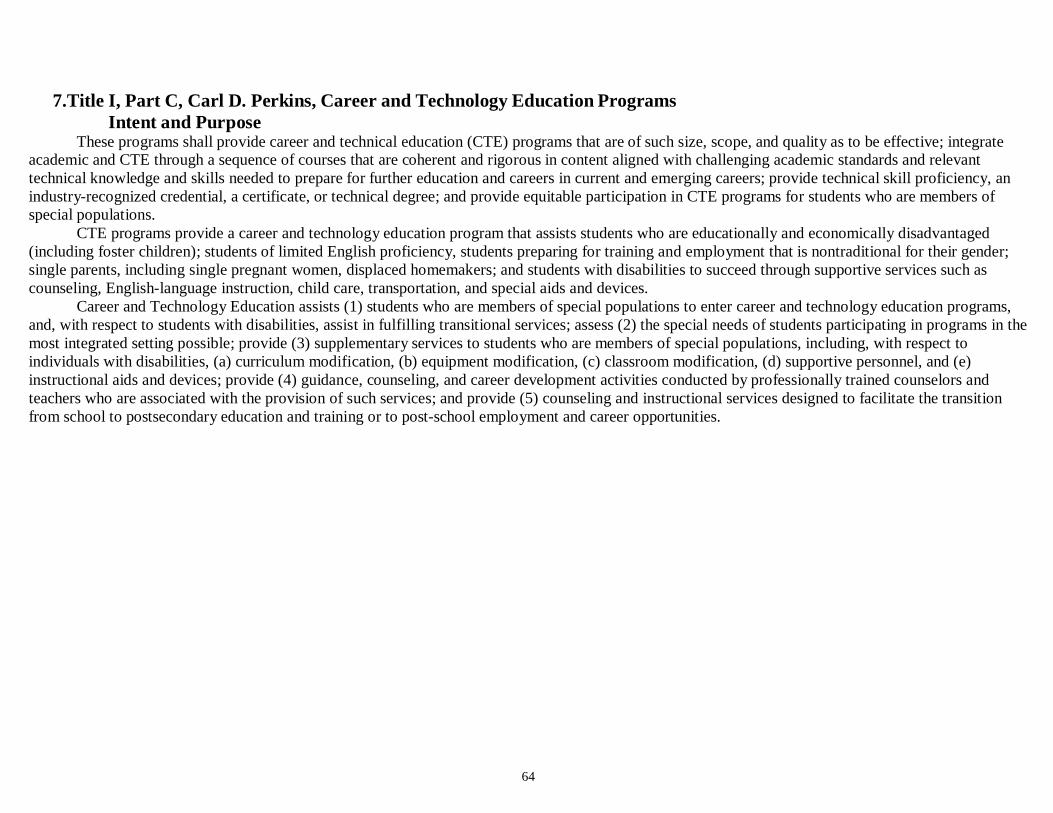
64
7.Title I, Part C, Carl D. Perkins, Career and Technology Education Programs
Intent and Purpose These programs shall provide career and technical education (CTE) programs that are of such size, scope, and quality as to be effective; integrate
academic and CTE through a sequence of courses that are coherent and rigorous in content aligned with challenging academic standards and relevant
technical knowledge and skills needed to prepare for further education and careers in current and emerging careers; provide technical skill proficiency, an
industry-recognized credential, a certificate, or technical degree; and provide equitable participation in CTE programs for students who are members of
special populations.
CTE programs provide a career and technology education program that assists students who are educationally and economically disadvantaged
(including foster children); students of limited English proficiency, students preparing for training and employment that is nontraditional for their gender;
single parents, including single pregnant women, displaced homemakers; and students with disabilities to succeed through supportive services such as
counseling, English-language instruction, child care, transportation, and special aids and devices.
Career and Technology Education assists (1) students who are members of special populations to enter career and technology education programs,
and, with respect to students with disabilities, assist in fulfilling transitional services; assess (2) the special needs of students participating in programs in the
most integrated setting possible; provide (3) supplementary services to students who are members of special populations, including, with respect to
individuals with disabilities, (a) curriculum modification, (b) equipment modification, (c) classroom modification, (d) supportive personnel, and (e)
instructional aids and devices; provide (4) guidance, counseling, and career development activities conducted by professionally trained counselors and
teachers who are associated with the provision of such services; and provide (5) counseling and instructional services designed to facilitate the transition
from school to postsecondary education and training or to post-school employment and career opportunities.
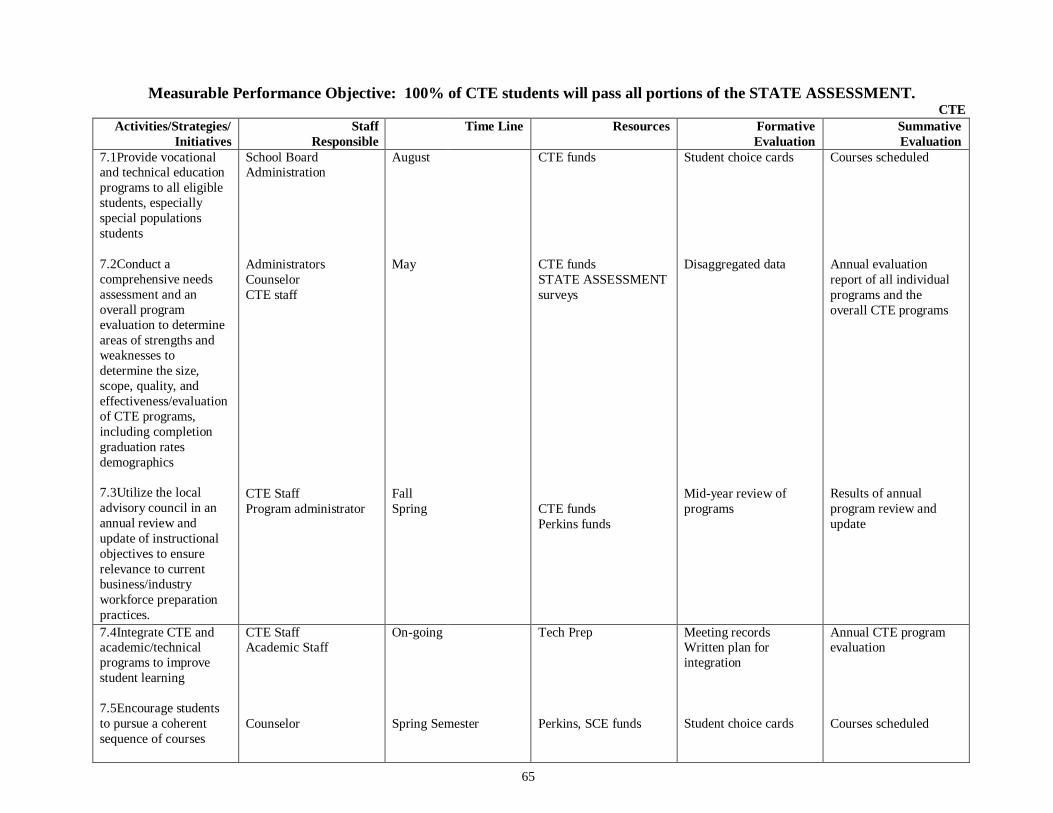
65
Measurable Performance Objective: 100% of CTE students will pass all portions of the STATE ASSESSMENT. CTE
Activities/Strategies/
Initiatives
Staff
Responsible Time Line Resources Formative
Evaluation
Summative
Evaluation
7.1Provide vocational and technical education
programs to all eligible
students, especially
special populations
students
7.2Conduct a
comprehensive needs
assessment and an
overall program
evaluation to determine
areas of strengths and
weaknesses to
determine the size,
scope, quality, and
effectiveness/evaluation
of CTE programs,
including completion
graduation rates
demographics
7.3Utilize the local
advisory council in an
annual review and
update of instructional
objectives to ensure
relevance to current
business/industry
workforce preparation
practices.
School Board Administration
Administrators
Counselor
CTE staff
CTE Staff
Program administrator
August
May
Fall
Spring
CTE funds
CTE funds
STATE ASSESSMENT
surveys
CTE funds
Perkins funds
Student choice cards
Disaggregated data
Mid-year review of
programs
Courses scheduled
Annual evaluation
report of all individual
programs and the
overall CTE programs
Results of annual
program review and
update
7.4Integrate CTE and academic/technical
programs to improve
student learning
7.5Encourage students
to pursue a coherent
sequence of courses
CTE Staff Academic Staff
Counselor
On-going
Spring Semester
Tech Prep
Perkins, SCE funds
Meeting records Written plan for
integration
Student choice cards
Annual CTE program evaluation
Courses scheduled
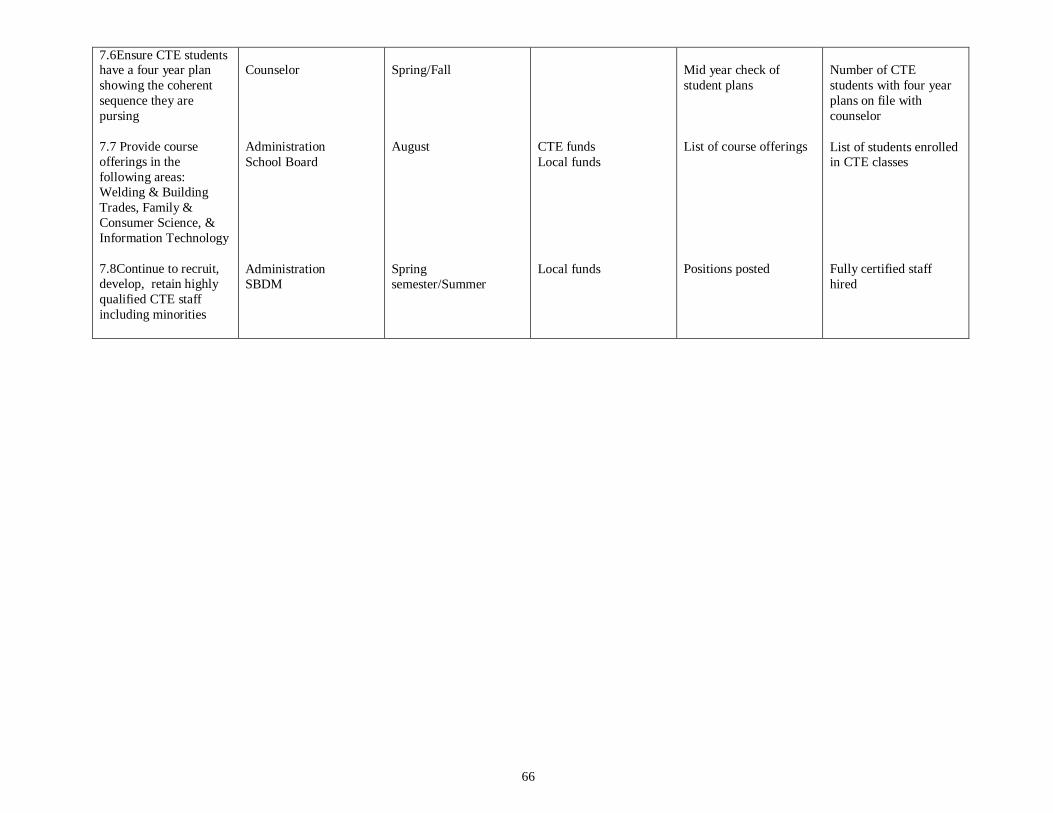
66
7.6Ensure CTE students have a four year plan
showing the coherent
sequence they are
pursing
7.7 Provide course
offerings in the
following areas:
Welding & Building
Trades, Family &
Consumer Science, &
Information Technology
7.8Continue to recruit,
develop, retain highly
qualified CTE staff
including minorities
Counselor
Administration
School Board
Administration
SBDM
Spring/Fall
August
Spring
semester/Summer
CTE funds
Local funds
Local funds
Mid year check of
student plans
List of course offerings
Positions posted
Number of CTE
students with four year
plans on file with
counselor
List of students enrolled in CTE classes
Fully certified staff
hired
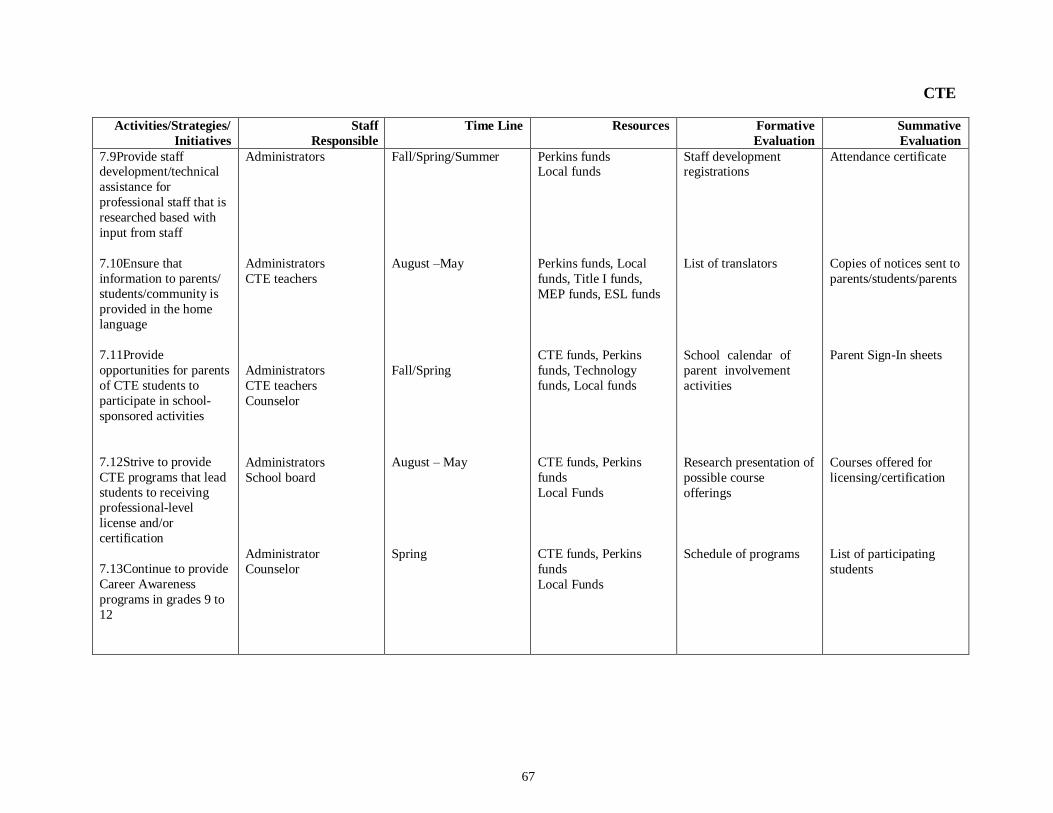
67
CTE
Activities/Strategies/
Initiatives
Staff
Responsible
Time Line Resources Formative
Evaluation
Summative
Evaluation
7.9Provide staff development/technical
assistance for
professional staff that is
researched based with
input from staff
7.10Ensure that
information to parents/
students/community is
provided in the home
language
7.11Provide
opportunities for parents
of CTE students to
participate in school-
sponsored activities
7.12Strive to provide
CTE programs that lead
students to receiving
professional-level
license and/or
certification
7.13Continue to provide
Career Awareness
programs in grades 9 to
12
Administrators
Administrators
CTE teachers
Administrators
CTE teachers
Counselor
Administrators
School board
Administrator
Counselor
Fall/Spring/Summer
August –May
Fall/Spring
August – May
Spring
Perkins funds Local funds
Perkins funds, Local
funds, Title I funds,
MEP funds, ESL funds
CTE funds, Perkins
funds, Technology
funds, Local funds
CTE funds, Perkins
funds
Local Funds
CTE funds, Perkins
funds
Local Funds
Staff development registrations
List of translators
School calendar of
parent involvement
activities
Research presentation of
possible course
offerings
Schedule of programs
Attendance certificate
Copies of notices sent to
parents/students/parents
Parent Sign-In sheets
Courses offered for
licensing/certification
List of participating
students
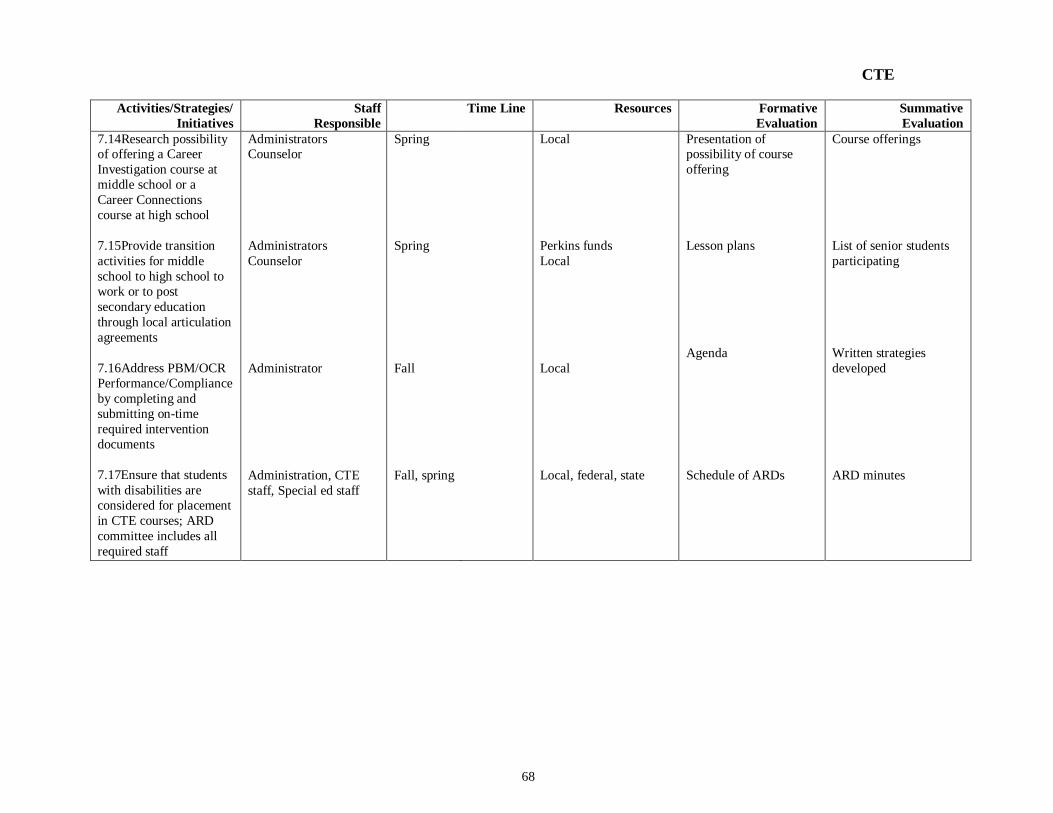
68
CTE
Activities/Strategies/
Initiatives
Staff
Responsible Time Line Resources Formative
Evaluation
Summative
Evaluation
7.14Research possibility of offering a Career
Investigation course at
middle school or a
Career Connections
course at high school
7.15Provide transition
activities for middle
school to high school to
work or to post
secondary education
through local articulation
agreements
7.16Address PBM/OCR
Performance/Compliance
by completing and
submitting on-time
required intervention
documents
7.17Ensure that students
with disabilities are
considered for placement
in CTE courses; ARD
committee includes all
required staff
Administrators Counselor
Administrators
Counselor
Administrator
Administration, CTE
staff, Special ed staff
Spring
Spring
Fall
Fall, spring
Local
Perkins funds
Local
Local
Local, federal, state
Presentation of possibility of course
offering
Lesson plans
Agenda
Schedule of ARDs
Course offerings
List of senior students
participating
Written strategies
developed
ARD minutes
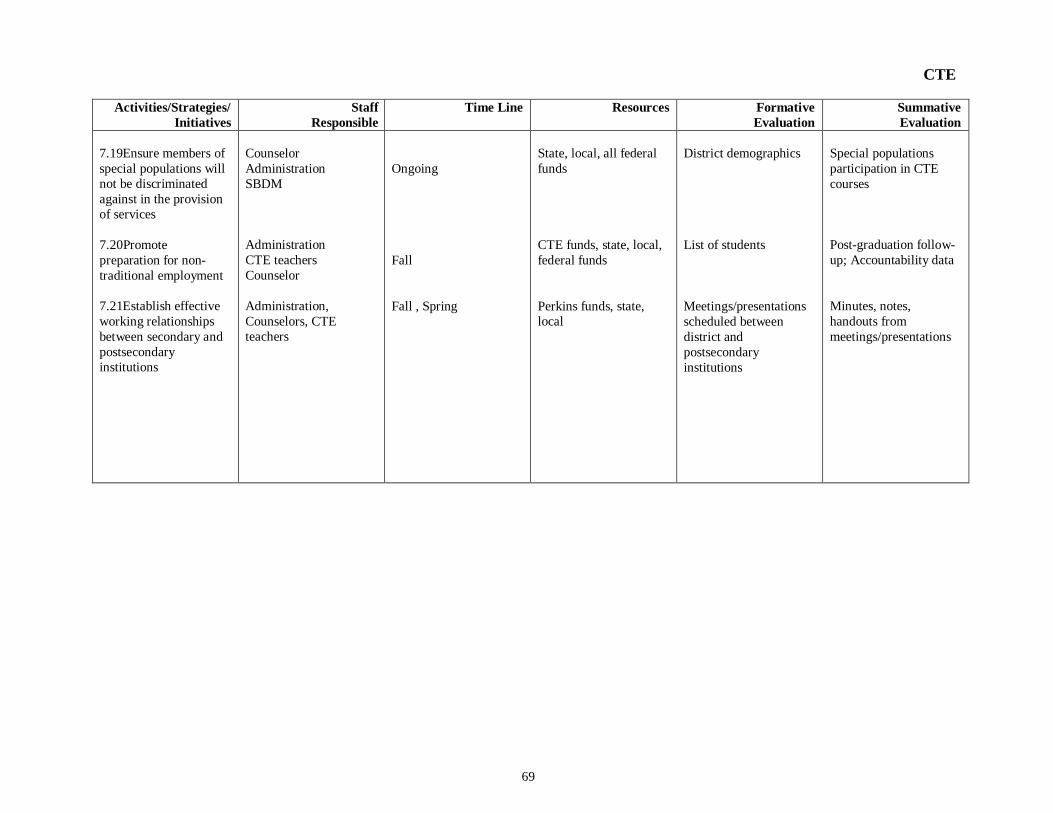
69
CTE
Activities/Strategies/
Initiatives
Staff
Responsible
Time Line Resources Formative
Evaluation
Summative
Evaluation
7.19Ensure members of
special populations will
not be discriminated
against in the provision
of services
7.20Promote
preparation for non-
traditional employment
7.21Establish effective
working relationships
between secondary and
postsecondary
institutions
Counselor
Administration
SBDM
Administration
CTE teachers
Counselor
Administration,
Counselors, CTE
teachers
Ongoing
Fall
Fall , Spring
State, local, all federal
funds
CTE funds, state, local,
federal funds
Perkins funds, state,
local
District demographics
List of students
Meetings/presentations
scheduled between
district and
postsecondary
institutions
Special populations
participation in CTE
courses
Post-graduation follow-
up; Accountability data
Minutes, notes,
handouts from
meetings/presentations
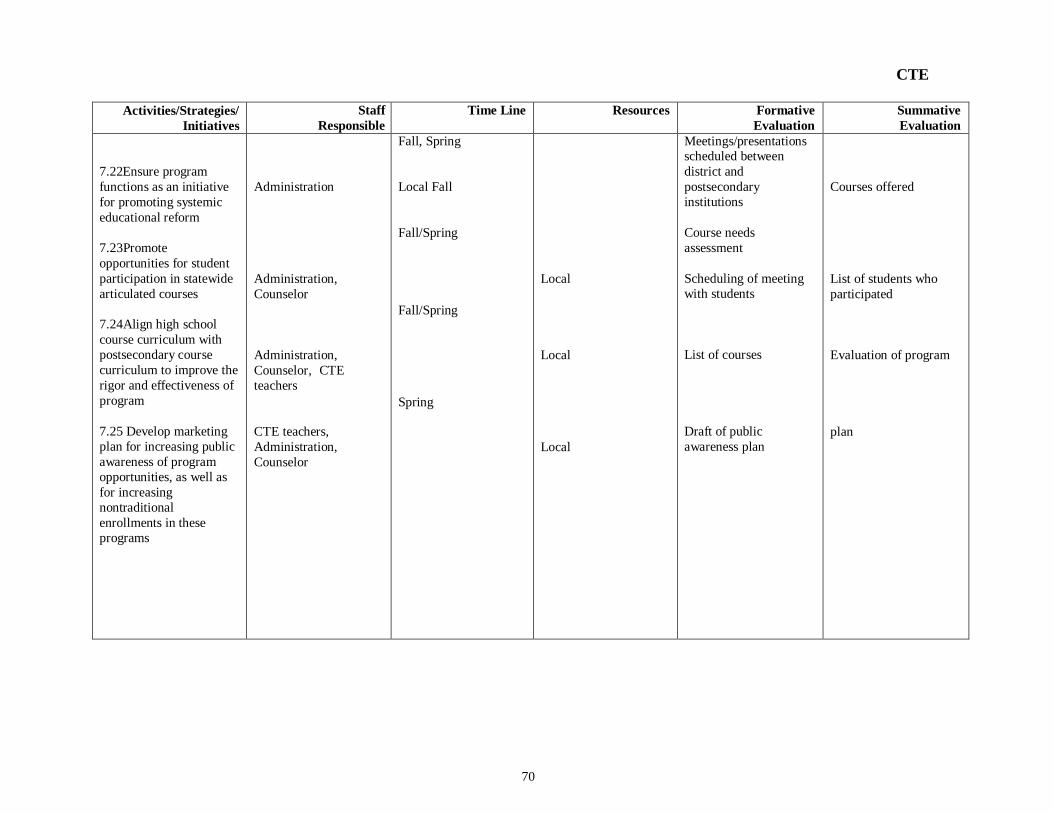
70
CTE
Activities/Strategies/
Initiatives
Staff
Responsible
Time Line Resources Formative
Evaluation
Summative
Evaluation
7.22Ensure program
functions as an initiative
for promoting systemic
educational reform
7.23Promote
opportunities for student
participation in statewide
articulated courses
7.24Align high school
course curriculum with
postsecondary course
curriculum to improve the
rigor and effectiveness of
program
7.25 Develop marketing
plan for increasing public
awareness of program
opportunities, as well as
for increasing
nontraditional
enrollments in these
programs
Administration
Administration,
Counselor
Administration,
Counselor, CTE
teachers
CTE teachers,
Administration,
Counselor
Fall, Spring
Local Fall
Fall/Spring
Fall/Spring
Spring
Local
Local
Local
Meetings/presentations scheduled between
district and
postsecondary
institutions
Course needs
assessment
Scheduling of meeting
with students
List of courses
Draft of public
awareness plan
Courses offered
List of students who
participated
Evaluation of program
plan
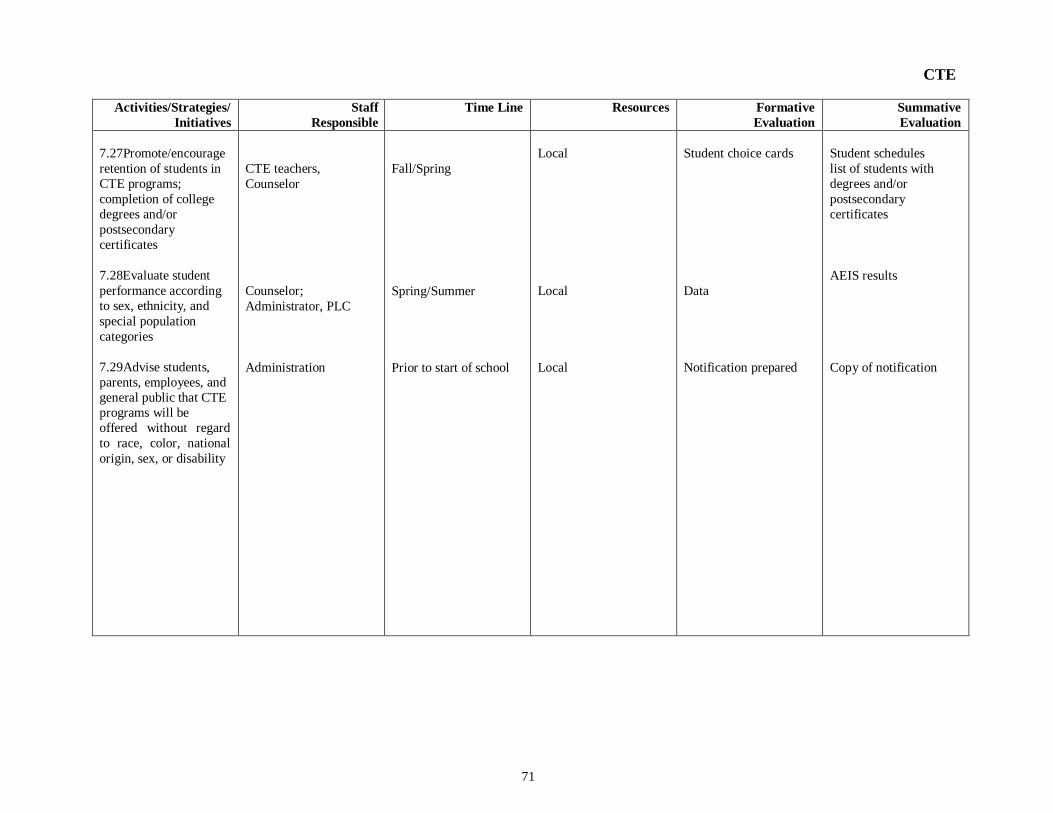
71
CTE
Activities/Strategies/
Initiatives
Staff
Responsible
Time Line Resources Formative
Evaluation
Summative
Evaluation
7.27Promote/encourage
retention of students in
CTE programs;
completion of college
degrees and/or
postsecondary
certificates
7.28Evaluate student
performance according
to sex, ethnicity, and
special population
categories
7.29Advise students,
parents, employees, and
general public that CTE
programs will be
offered without regard
to race, color, national
origin, sex, or disability
CTE teachers,
Counselor
Counselor;
Administrator, PLC
Administration
Fall/Spring
Spring/Summer
Prior to start of school
Local
Local
Local
Student choice cards
Data
Notification prepared
Student schedules
list of students with
degrees and/or
postsecondary
certificates
AEIS results
Copy of notification
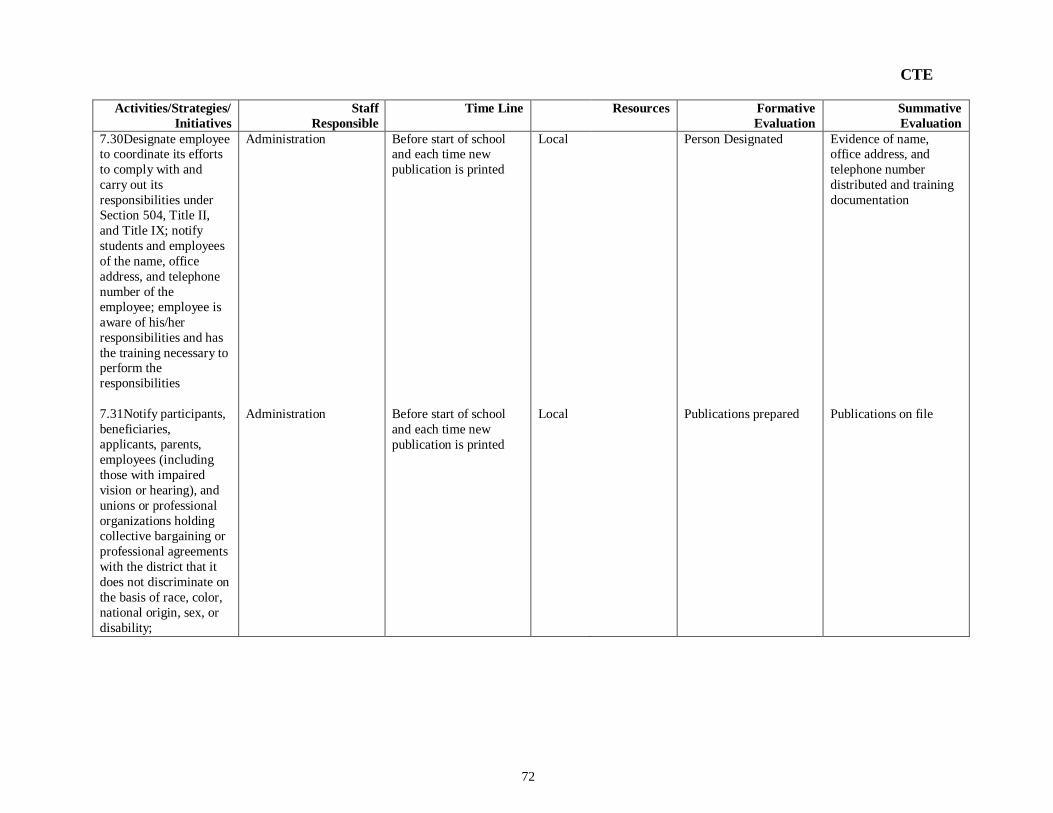
72
CTE
Activities/Strategies/
Initiatives
Staff
Responsible
Time Line Resources Formative
Evaluation
Summative
Evaluation
7.30Designate employee to coordinate its efforts
to comply with and
carry out its
responsibilities under
Section 504, Title II,
and Title IX; notify
students and employees
of the name, office
address, and telephone
number of the
employee; employee is
aware of his/her
responsibilities and has
the training necessary to perform the
responsibilities
7.31Notify participants,
beneficiaries,
applicants, parents,
employees (including
those with impaired
vision or hearing), and
unions or professional
organizations holding
collective bargaining or
professional agreements
with the district that it
does not discriminate on
the basis of race, color,
national origin, sex, or
disability;
Administration
Administration
Before start of school and each time new
publication is printed
Before start of school
and each time new
publication is printed
Local
Local
Person Designated
Publications prepared
Evidence of name, office address, and
telephone number
distributed and training
documentation
Publications on file
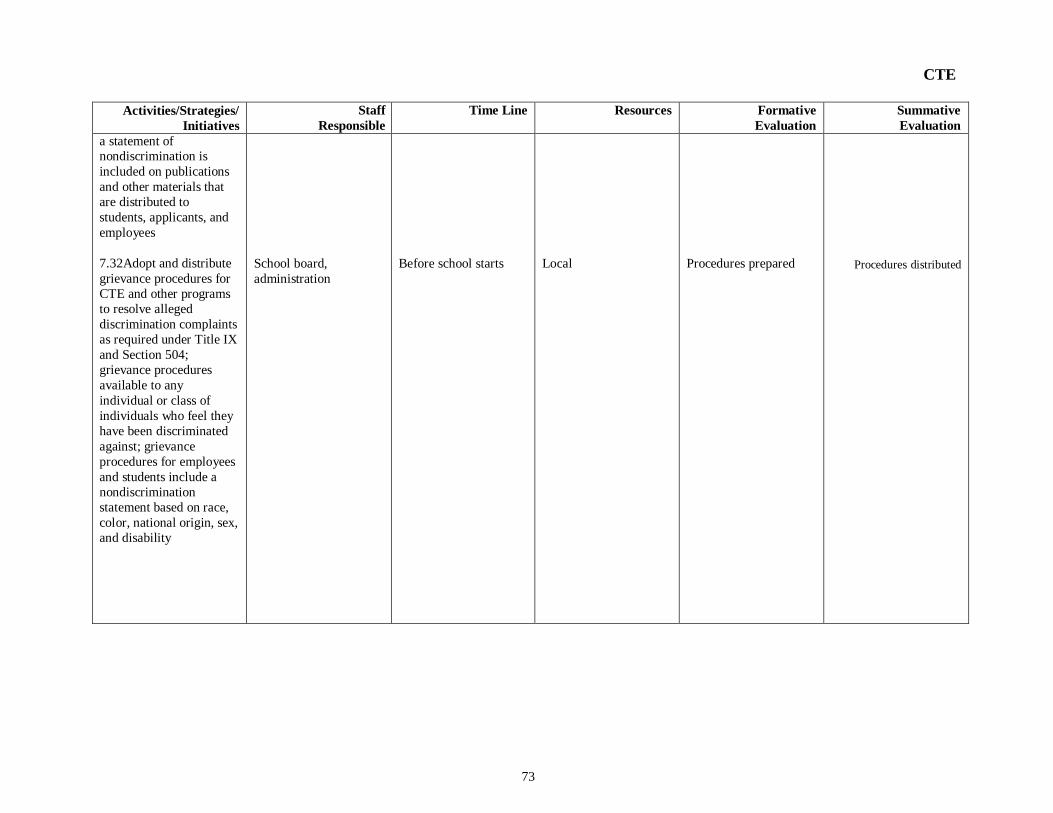
73
CTE
Activities/Strategies/
Initiatives
Staff
Responsible
Time Line Resources Formative
Evaluation
Summative
Evaluation
a statement of nondiscrimination is
included on publications
and other materials that
are distributed to
students, applicants, and
employees
7.32Adopt and distribute
grievance procedures for
CTE and other programs
to resolve alleged
discrimination complaints
as required under Title IX
and Section 504;
grievance procedures
available to any
individual or class of
individuals who feel they
have been discriminated
against; grievance
procedures for employees
and students include a
nondiscrimination
statement based on race,
color, national origin, sex,
and disability
School board,
administration
Before school starts
Local
Procedures prepared
Procedures distributed
74
CTE
Activities/Strategies/
Initiatives
Staff
Responsible
Time Line Resources Formative
Evaluation
Summative
Evaluation
7.33Facilities housing programs located at
sites that are readily
accessible to persons
who are mobility
impaired
7.34Provide changing
rooms, showers, and
other restroom facilities
for CTE students of one
sex that are comparable
to those provided to
students of the other sex
7.35Provide access to
CTE programs to
disabled persons that
need related aids or
services in accordance
with the students’ IEPs
and/or Section 504
accommodation plans
7.36District/campus
does not deny access to
CTE programs to
national-origin minority
persons with limited
English language skills
on the grounds that the
student cannot
participate in and
benefit from CTE instruction to the same
extend as a student who
primary language is
Administration
Administration
Administration, CTE
teachers, special ed
teachers
Administration, CTE
teachers and staff
First day of school
First day of school
First day of school
Upon student
enrollment
Local
Local
Local, federal
Local, federal, state
Locations inspected
Locations inspected
ARD minutes, IEPs,
504 plans
Interviews
Inspection report
Inspection report
Inspection report
Results of interview
75
CTE
Activities/Strategies/
Initiatives
Staff
Responsible
Time Line Resources Formative
Evaluation
Summative
Evaluation
English; ensure CTE programs are open to
these students and that services are available
7.37CTE facilities are
located at sites that are
readily accessible to both
minority and non-
minority communities;
facilities or programs are
not identified as being for
non-minority or minority
person; and equal access
is provided without
regard to race, color,
national origin, sex, or
disability
7.38District/campus does
not discriminate in its
admission practices on
the basis of limited
English skills; secondary
CTE program identifies
applicants with Limited
English and assesses their
ability to participate;
ensure CTE programs are
open to these students
Administration, CTE
staff
Administration, CTE
staff
Before first day of
school
Upon enrollment
Federal, state, local
Federal, state, local
Inspection
Observations, LEP
records, student
schedules
Inspection report
STATE
ASSESSMENT, student
report cards, class
rosters
76
CTE
Activities/Strategies/
Initiatives
Staff
Responsible
Time Line Resources Formative
Evaluation
Summative
Evaluation
7.39Ensure that
introductory, preliminary,
or exploratory courses are
not established as
prerequisite for admission
to a CTE program unless
the course has been and is
available to all students
without regard to race,
color, national origin, sex,
or disability
7.40District/campus does
not exclude a woman
from admission to or
participation in any
program on the basis of
pregnancy nor treat a
temporary disability due
to pregnancy differently
from any other temporary
disabilities
7.41District/campus does
not judge candidates for
admission to programs,
activities, or services on
the basis of criteria that
have the effect of
disproportionately
excluding persons of a
particular race, color,
national origin, sex, or
disability
Administration,
counselor
Administration, counselor
Administration, counselor
Beginning of each
semester
Beginning of each semester
Upon enrollment
Local List of course of
offerings
Student records
List of participants
Student schedules
Student schedules
Interviews
77
CTE
Activities/Strategies/
Initiatives
Staff
Responsible
Time Line Resources Formative
Evaluation
Summative
Evaluation
7.42District/campus does not develop,
sponsor, or engage in
recruiting or counseling
activities, including the
development or
dissemination of
materials, that
discriminate against or
stereotype persons on
the basis of sex, race,
color, nation origin, or
disability; the curricula and program cover a broad range of
occupational
opportunities and are
not limited on the basis
of sex, race, color,
national origin, or
disability to potential
students for whom the
presentation is made
Administration, counselor, recruiters
Ongoing Local, state, federal Schedule of presentations, recruitment, curriculum
Written materials used in presentation, recruitment, curriculum
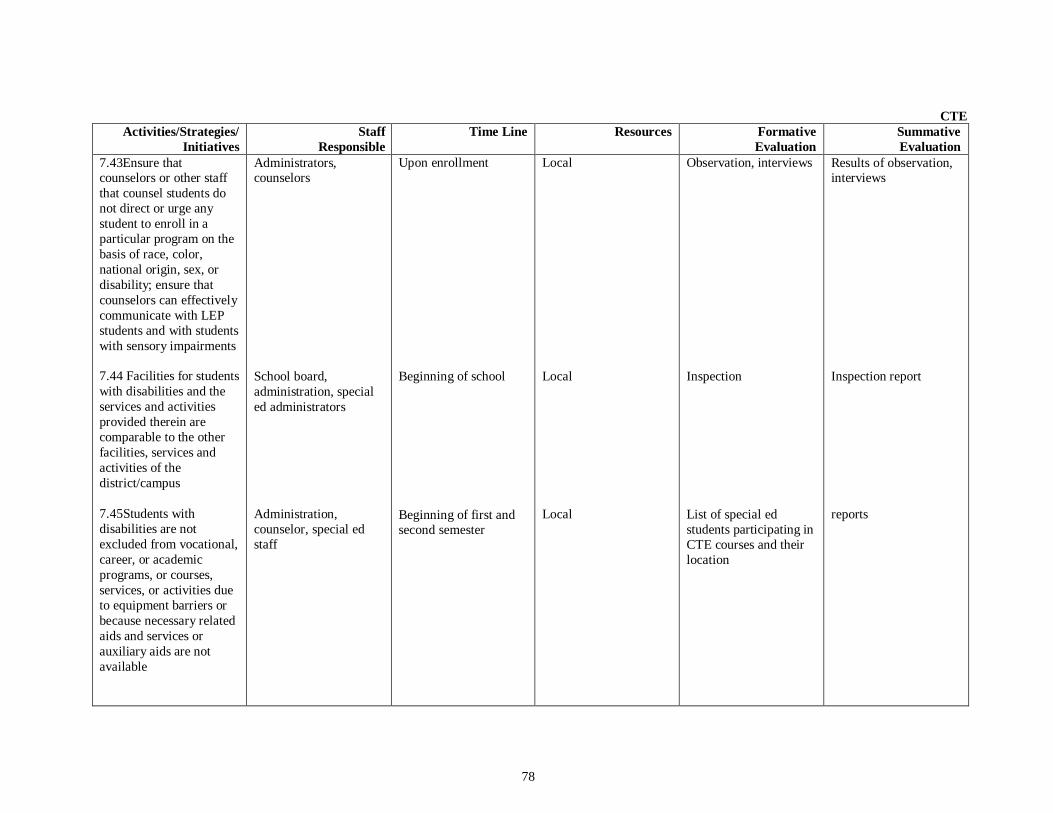
78
CTE
Activities/Strategies/
Initiatives
Staff
Responsible
Time Line Resources Formative
Evaluation
Summative
Evaluation
7.43Ensure that counselors or other staff
that counsel students do
not direct or urge any
student to enroll in a
particular program on the
basis of race, color,
national origin, sex, or
disability; ensure that
counselors can effectively
communicate with LEP
students and with students
with sensory impairments
7.44 Facilities for students
with disabilities and the
services and activities
provided therein are
comparable to the other
facilities, services and
activities of the
district/campus
7.45Students with
disabilities are not
excluded from vocational,
career, or academic
programs, or courses,
services, or activities due
to equipment barriers or
because necessary related
aids and services or
auxiliary aids are not
available
Administrators, counselors
School board,
administration, special
ed administrators
Administration,
counselor, special ed
staff
Upon enrollment
Beginning of school
Beginning of first and second semester
Local
Local
Local
Observation, interviews
Inspection
List of special ed
students participating in
CTE courses and their
location
Results of observation, interviews
Inspection report
reports
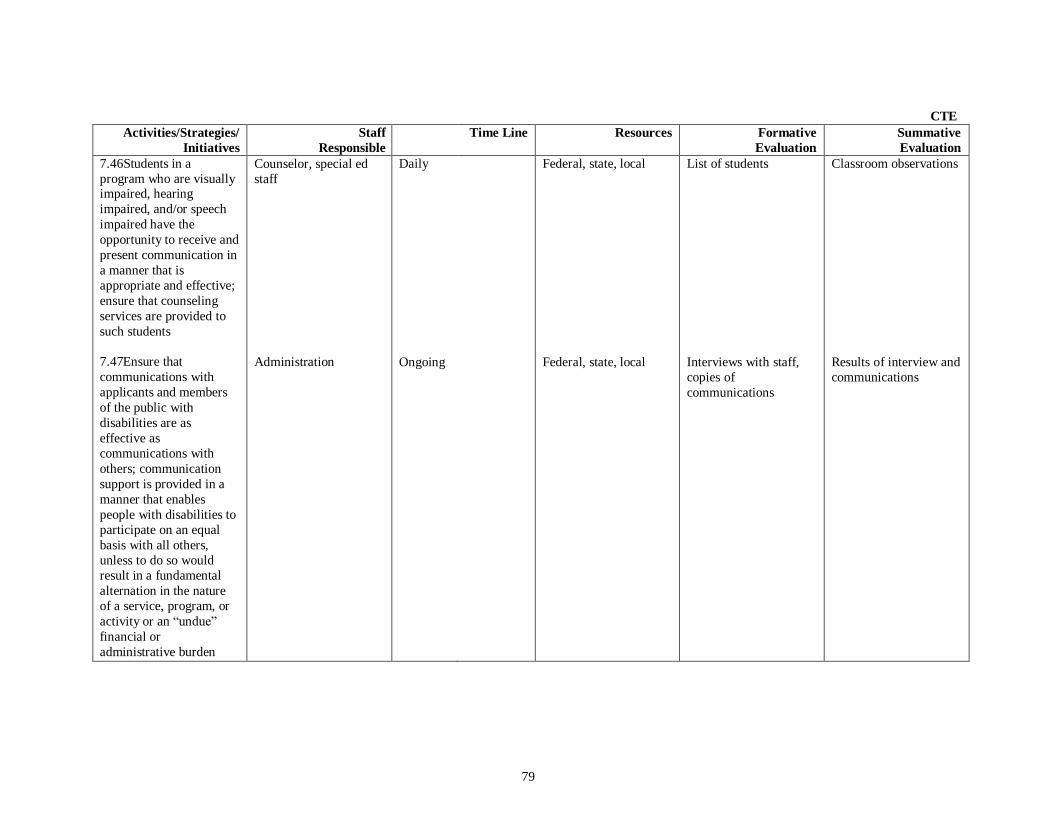
79
CTE
Activities/Strategies/
Initiatives
Staff
Responsible Time Line Resources Formative
Evaluation
Summative
Evaluation
7.46Students in a
program who are visually impaired, hearing
impaired, and/or speech
impaired have the
opportunity to receive and
present communication in
a manner that is
appropriate and effective;
ensure that counseling
services are provided to
such students
7.47Ensure that
communications with
applicants and members
of the public with
disabilities are as
effective as
communications with
others; communication
support is provided in a
manner that enables
people with disabilities to
participate on an equal
basis with all others,
unless to do so would
result in a fundamental
alternation in the nature
of a service, program, or
activity or an “undue”
financial or
administrative burden
Counselor, special ed
staff
Administration
Daily
Ongoing
Federal, state, local
Federal, state, local
List of students
Interviews with staff,
copies of
communications
Classroom observations
Results of interview and
communications
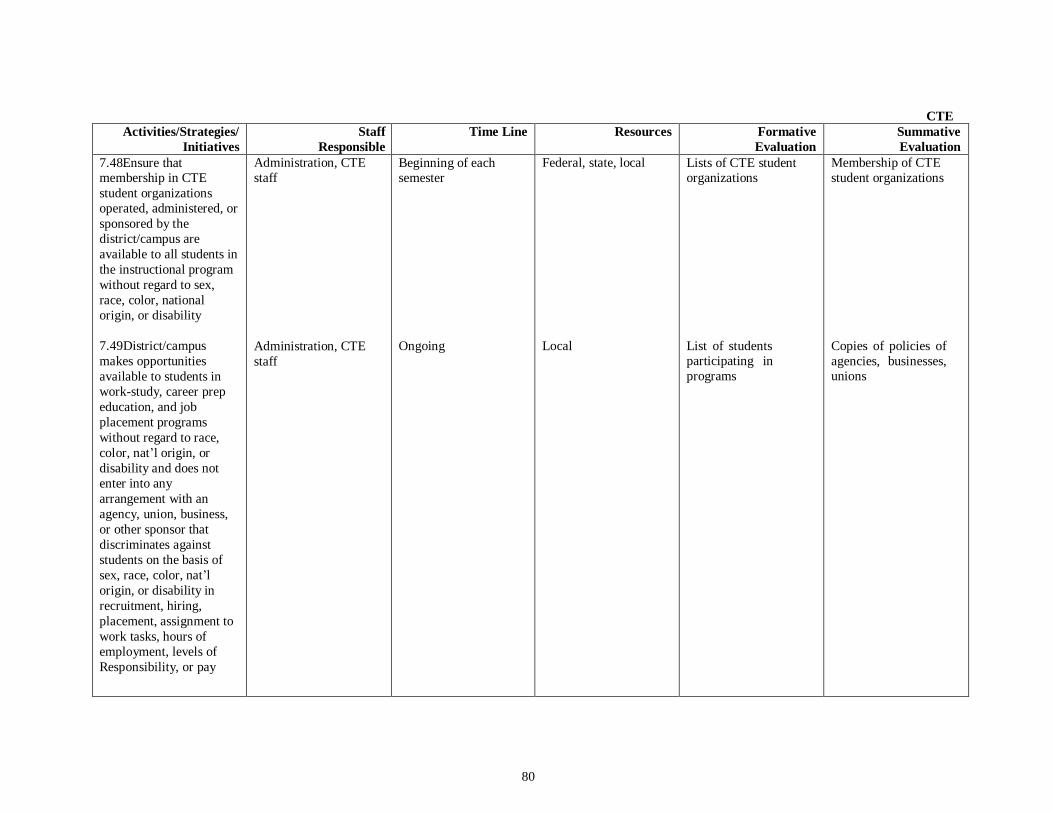
80
CTE
Activities/Strategies/
Initiatives
Staff
Responsible
Time Line Resources Formative
Evaluation
Summative
Evaluation
7.48Ensure that membership in CTE
student organizations
operated, administered, or
sponsored by the
district/campus are
available to all students in
the instructional program
without regard to sex,
race, color, national
origin, or disability
7.49District/campus
makes opportunities
available to students in
work-study, career prep
education, and job
placement programs
without regard to race,
color, nat’l origin, or
disability and does not
enter into any
arrangement with an
agency, union, business,
or other sponsor that
discriminates against
students on the basis of
sex, race, color, nat’l
origin, or disability in
recruitment, hiring,
placement, assignment to
work tasks, hours of
employment, levels of
Responsibility, or pay
Administration, CTE
staff
Administration, CTE
staff
Beginning of each semester
Ongoing
Federal, state, local
Local
Lists of CTE student organizations
List of students participating in
programs
Membership of CTE
student organizations
Copies of policies of
agencies, businesses, unions
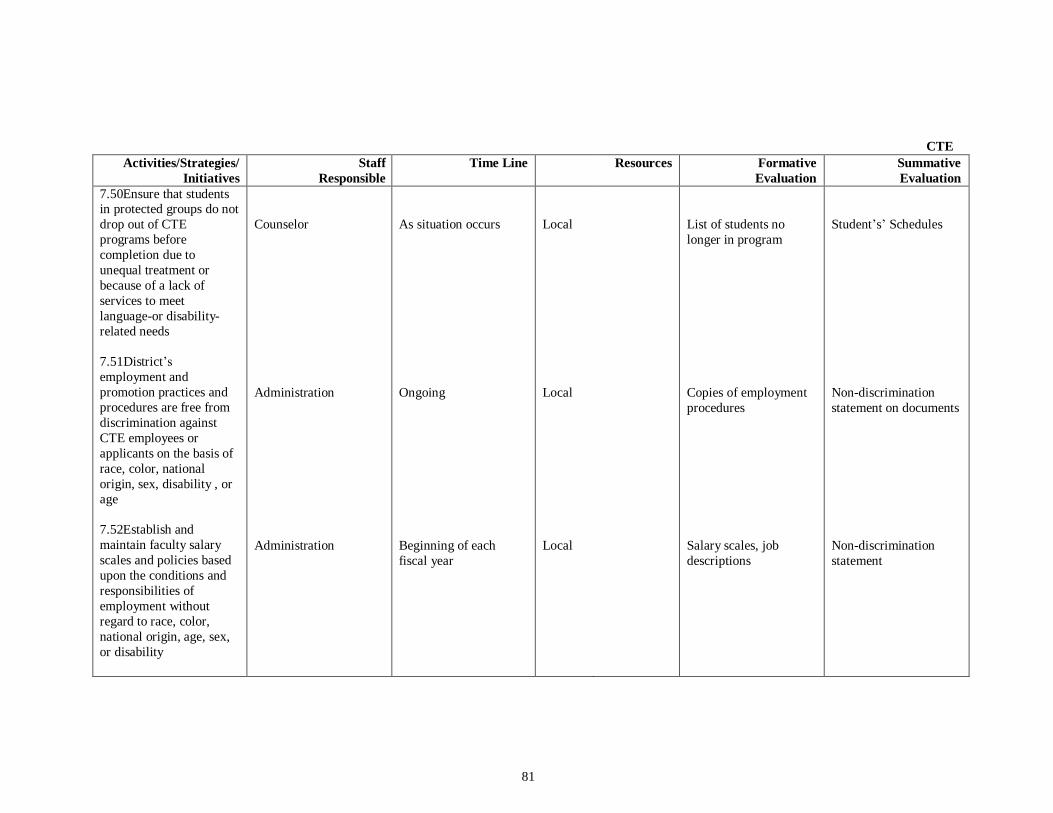
81
CTE
Activities/Strategies/
Initiatives
Staff
Responsible
Time Line Resources Formative
Evaluation
Summative
Evaluation
7.50Ensure that students in protected groups do not
drop out of CTE
programs before
completion due to
unequal treatment or
because of a lack of
services to meet
language-or disability-
related needs
7.51District’s
employment and
promotion practices and
procedures are free from
discrimination against
CTE employees or
applicants on the basis of
race, color, national
origin, sex, disability , or
age
7.52Establish and
maintain faculty salary
scales and policies based
upon the conditions and
responsibilities of
employment without
regard to race, color,
national origin, age, sex,
or disability
Counselor
Administration
Administration
As situation occurs
Ongoing
Beginning of each
fiscal year
Local
Local
Local
List of students no
longer in program
Copies of employment
procedures
Salary scales, job
descriptions
Student’s’ Schedules
Non-discrimination
statement on documents
Non-discrimination
statement
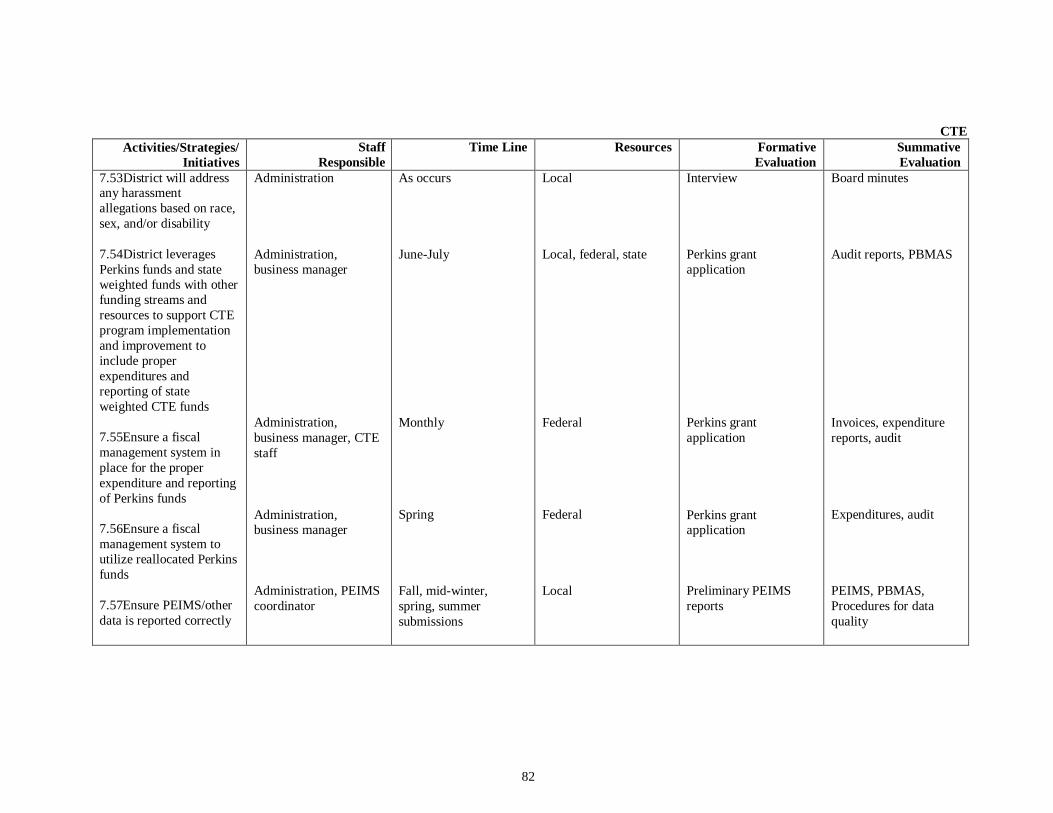
82
CTE
Activities/Strategies/
Initiatives
Staff
Responsible
Time Line Resources Formative
Evaluation
Summative
Evaluation
7.53District will address any harassment
allegations based on race,
sex, and/or disability
7.54District leverages
Perkins funds and state
weighted funds with other
funding streams and
resources to support CTE
program implementation
and improvement to
include proper
expenditures and
reporting of state
weighted CTE funds
7.55Ensure a fiscal
management system in
place for the proper
expenditure and reporting
of Perkins funds
7.56Ensure a fiscal
management system to
utilize reallocated Perkins
funds
7.57Ensure PEIMS/other
data is reported correctly
Administration
Administration,
business manager
Administration,
business manager, CTE
staff
Administration, business manager
Administration, PEIMS
coordinator
As occurs
June-July
Monthly
Spring
Fall, mid-winter,
spring, summer
submissions
Local
Local, federal, state
Federal
Federal
Local
Interview
Perkins grant
application
Perkins grant
application
Perkins grant application
Preliminary PEIMS
reports
Board minutes
Audit reports, PBMAS
Invoices, expenditure
reports, audit
Expenditures, audit
PEIMS, PBMAS,
Procedures for data
quality
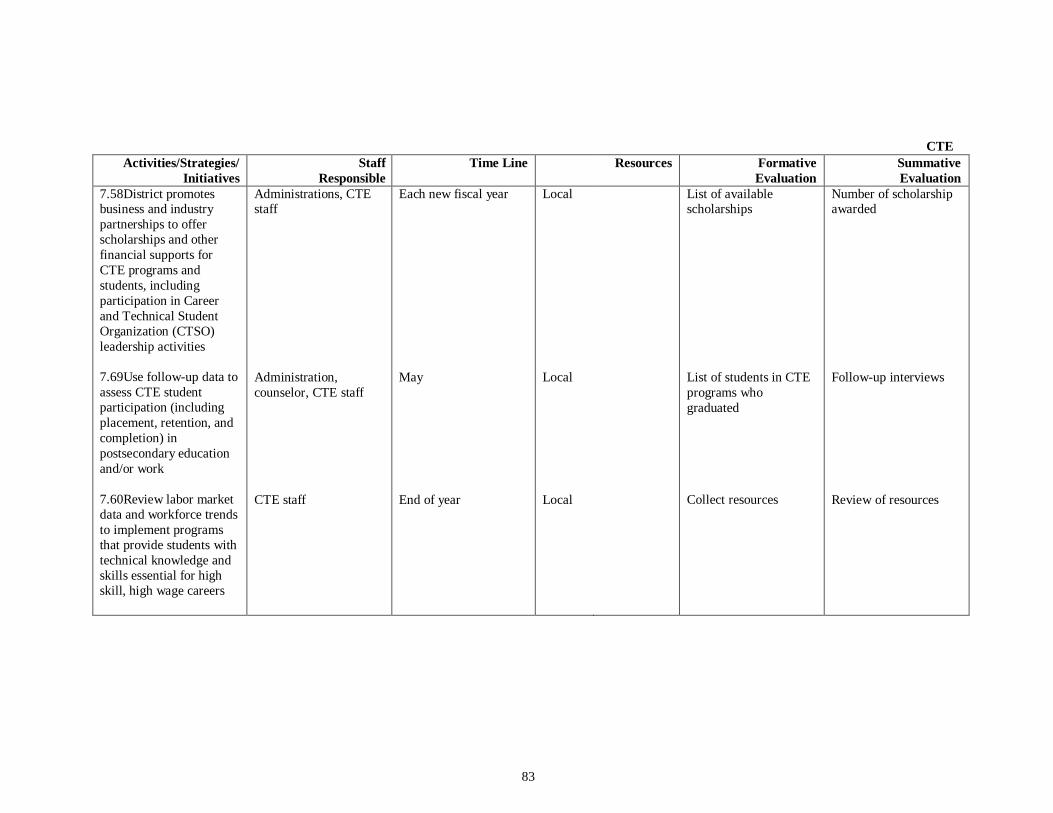
83
CTE
Activities/Strategies/
Initiatives
Staff
Responsible
Time Line Resources Formative
Evaluation
Summative
Evaluation
7.58District promotes business and industry
partnerships to offer
scholarships and other
financial supports for
CTE programs and
students, including
participation in Career
and Technical Student
Organization (CTSO)
leadership activities
7.69Use follow-up data to
assess CTE student
participation (including
placement, retention, and
completion) in
postsecondary education
and/or work
7.60Review labor market
data and workforce trends
to implement programs
that provide students with
technical knowledge and
skills essential for high
skill, high wage careers
Administrations, CTE staff
Administration,
counselor, CTE staff
CTE staff
Each new fiscal year
May
End of year
Local
Local
Local
List of available scholarships
List of students in CTE
programs who
graduated
Collect resources
Number of scholarship awarded
Follow-up interviews
Review of resources
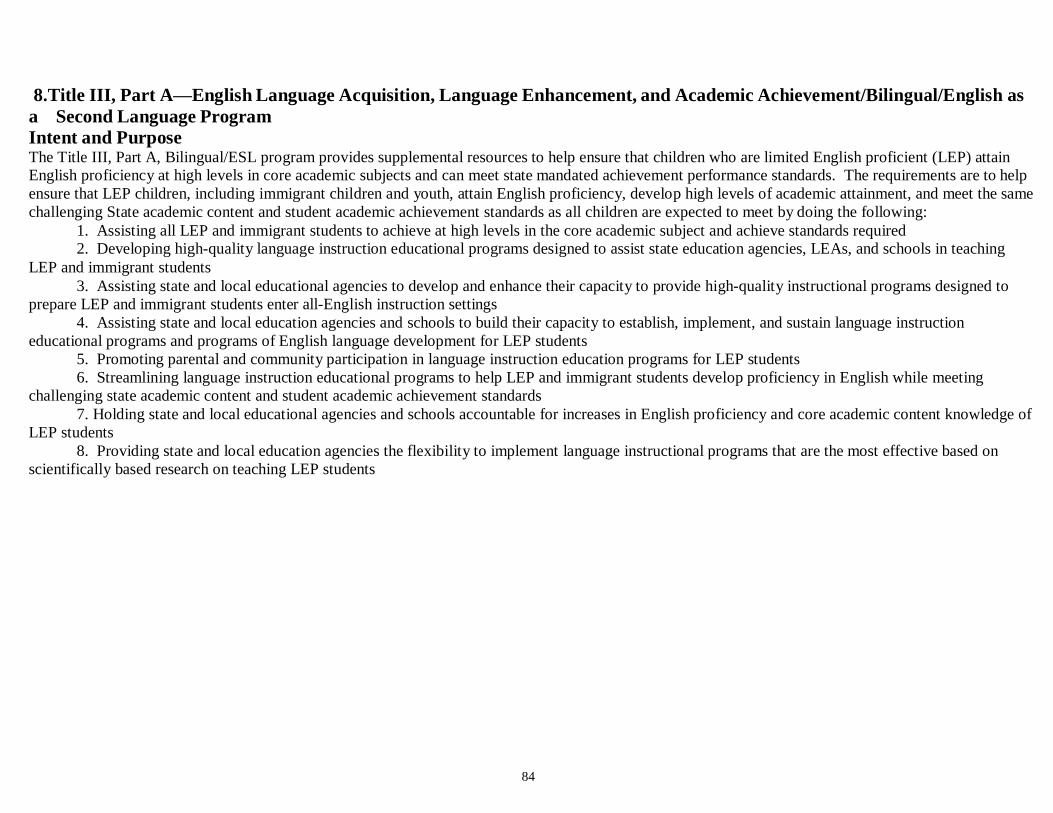
84
8.Title III, Part A—English Language Acquisition, Language Enhancement, and Academic Achievement/Bilingual/English as
a Second Language Program Intent and Purpose The Title III, Part A, Bilingual/ESL program provides supplemental resources to help ensure that children who are limited English proficient (LEP) attain English proficiency at high levels in core academic subjects and can meet state mandated achievement performance standards. The requirements are to help
ensure that LEP children, including immigrant children and youth, attain English proficiency, develop high levels of academic attainment, and meet the same
challenging State academic content and student academic achievement standards as all children are expected to meet by doing the following:
1. Assisting all LEP and immigrant students to achieve at high levels in the core academic subject and achieve standards required 2. Developing high-quality language instruction educational programs designed to assist state education agencies, LEAs, and schools in teaching
LEP and immigrant students
3. Assisting state and local educational agencies to develop and enhance their capacity to provide high-quality instructional programs designed to
prepare LEP and immigrant students enter all-English instruction settings
4. Assisting state and local education agencies and schools to build their capacity to establish, implement, and sustain language instruction
educational programs and programs of English language development for LEP students
5. Promoting parental and community participation in language instruction education programs for LEP students
6. Streamlining language instruction educational programs to help LEP and immigrant students develop proficiency in English while meeting
challenging state academic content and student academic achievement standards
7. Holding state and local educational agencies and schools accountable for increases in English proficiency and core academic content knowledge of
LEP students
8. Providing state and local education agencies the flexibility to implement language instructional programs that are the most effective based on
scientifically based research on teaching LEP students
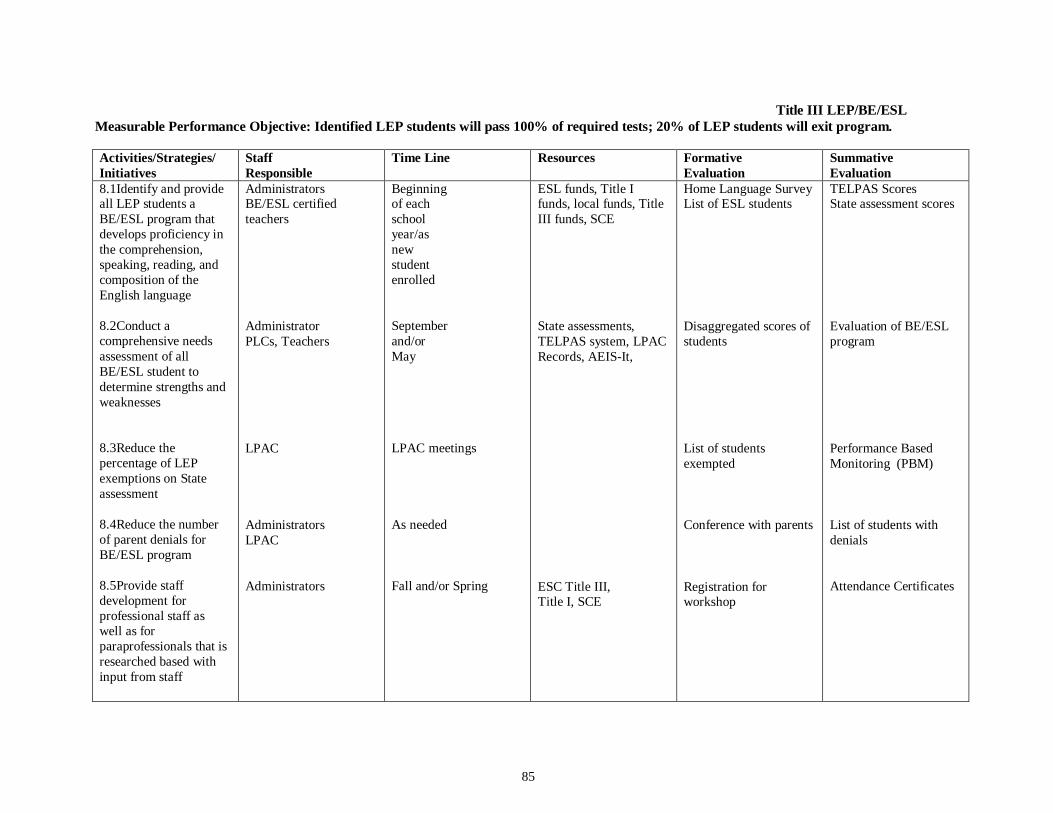
85
Title III LEP/BE/ESL
Measurable Performance Objective: Identified LEP students will pass 100% of required tests; 20% of LEP students will exit program.
Activities/Strategies/
Initiatives
Staff
Responsible
Time Line Resources Formative
Evaluation
Summative
Evaluation
8.1Identify and provide all LEP students a
BE/ESL program that
develops proficiency in
the comprehension,
speaking, reading, and
composition of the
English language
8.2Conduct a
comprehensive needs
assessment of all
BE/ESL student to
determine strengths and
weaknesses
8.3Reduce the
percentage of LEP
exemptions on State
assessment
8.4Reduce the number
of parent denials for
BE/ESL program
8.5Provide staff
development for
professional staff as
well as for
paraprofessionals that is
researched based with
input from staff
Administrators BE/ESL certified
teachers
Administrator
PLCs, Teachers
LPAC
Administrators
LPAC
Administrators
Beginning of each
school
year/as
new
student
enrolled
September
and/or
May
LPAC meetings
As needed
Fall and/or Spring
ESL funds, Title I funds, local funds, Title
III funds, SCE
State assessments,
TELPAS system, LPAC
Records, AEIS-It,
ESC Title III, Title I, SCE
Home Language Survey List of ESL students
Disaggregated scores of
students
List of students
exempted
Conference with parents
Registration for workshop
TELPAS Scores State assessment scores
Evaluation of BE/ESL
program
Performance Based
Monitoring (PBM)
List of students with
denials
Attendance Certificates
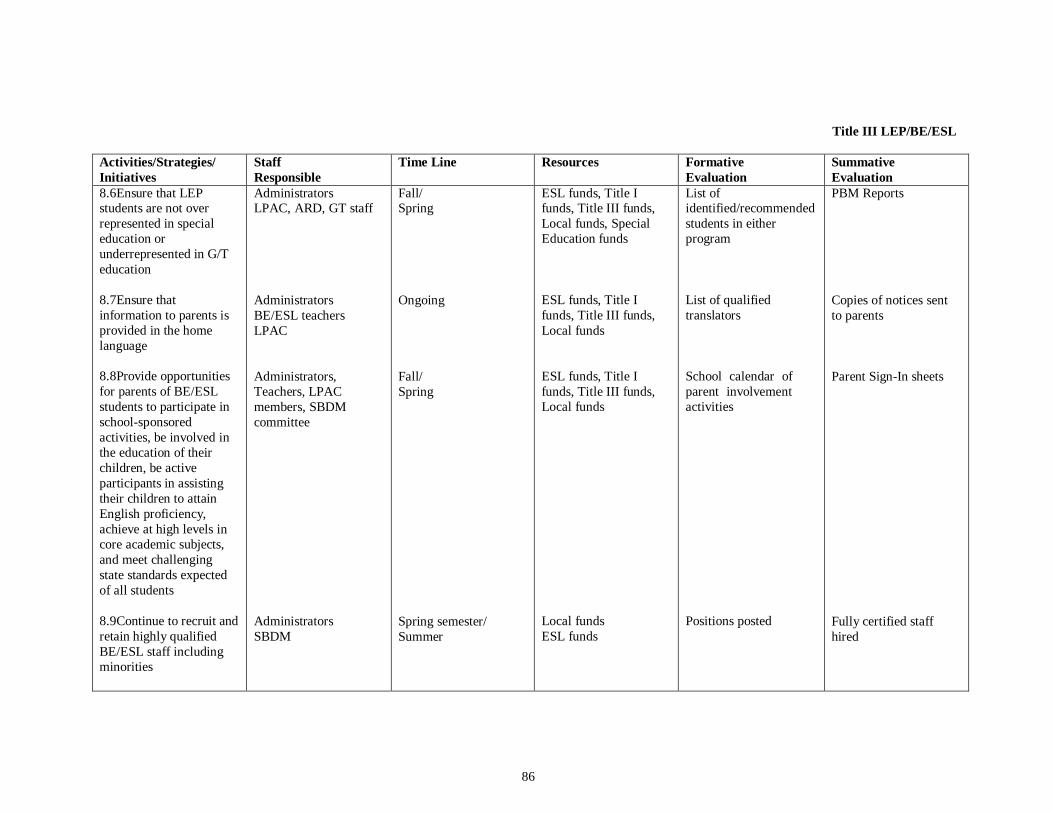
86
Title III LEP/BE/ESL
Activities/Strategies/
Initiatives
Staff
Responsible
Time Line Resources Formative
Evaluation
Summative
Evaluation
8.6Ensure that LEP students are not over
represented in special
education or
underrepresented in G/T
education
8.7Ensure that
information to parents is
provided in the home
language
8.8Provide opportunities
for parents of BE/ESL
students to participate in
school-sponsored
activities, be involved in
the education of their
children, be active
participants in assisting
their children to attain
English proficiency,
achieve at high levels in
core academic subjects,
and meet challenging
state standards expected
of all students
8.9Continue to recruit and
retain highly qualified
BE/ESL staff including
minorities
Administrators LPAC, ARD, GT staff
Administrators
BE/ESL teachers
LPAC
Administrators,
Teachers, LPAC
members, SBDM
committee
Administrators
SBDM
Fall/ Spring
Ongoing
Fall/
Spring
Spring semester/
Summer
ESL funds, Title I funds, Title III funds,
Local funds, Special
Education funds
ESL funds, Title I
funds, Title III funds,
Local funds
ESL funds, Title I
funds, Title III funds,
Local funds
Local funds
ESL funds
List of identified/recommended
students in either
program
List of qualified
translators
School calendar of
parent involvement
activities
Positions posted
PBM Reports
Copies of notices sent
to parents
Parent Sign-In sheets
Fully certified staff
hired
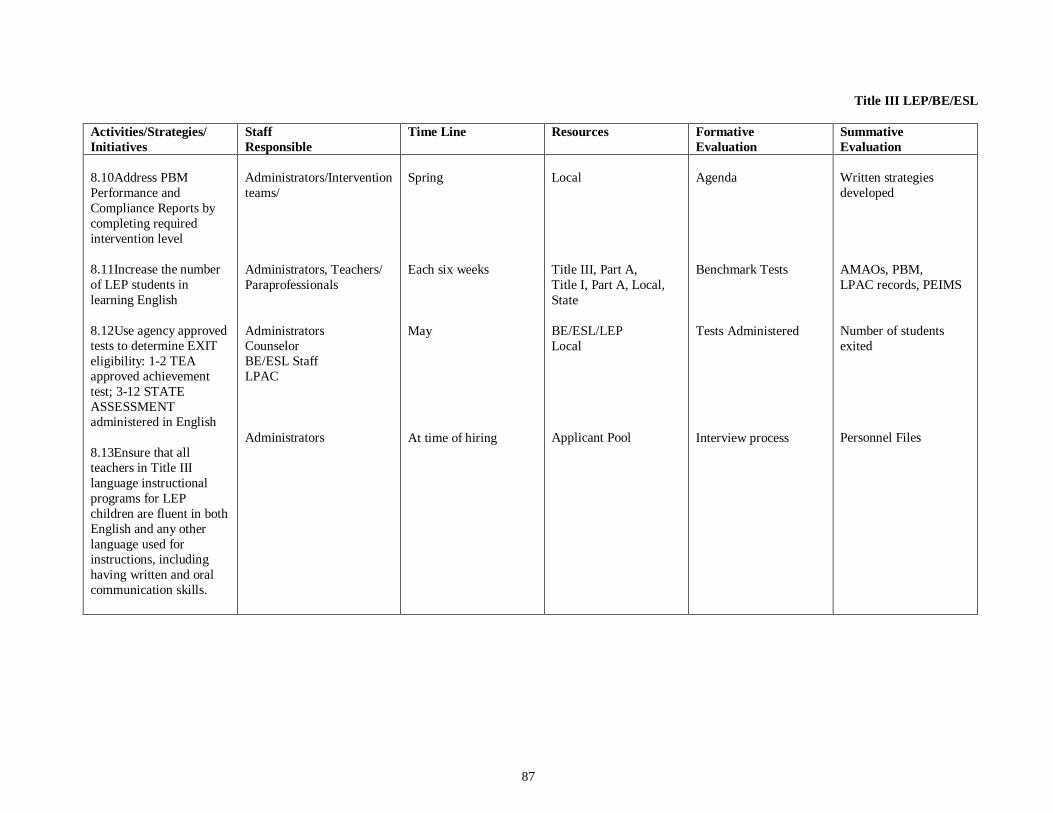
87
Title III LEP/BE/ESL
Activities/Strategies/
Initiatives
Staff
Responsible
Time Line Resources Formative
Evaluation
Summative
Evaluation
8.10Address PBM
Performance and
Compliance Reports by
completing required
intervention level
8.11Increase the number
of LEP students in
learning English
8.12Use agency approved
tests to determine EXIT
eligibility: 1-2 TEA
approved achievement
test; 3-12 STATE
ASSESSMENT
administered in English
8.13Ensure that all
teachers in Title III
language instructional
programs for LEP
children are fluent in both
English and any other
language used for
instructions, including
having written and oral
communication skills.
Administrators/Intervention
teams/
Administrators, Teachers/
Paraprofessionals
Administrators
Counselor
BE/ESL Staff
LPAC
Administrators
Spring
Each six weeks
May
At time of hiring
Local
Title III, Part A,
Title I, Part A, Local,
State
BE/ESL/LEP
Local
Applicant Pool
Agenda
Benchmark Tests
Tests Administered
Interview process
Written strategies
developed
AMAOs, PBM,
LPAC records, PEIMS
Number of students
exited
Personnel Files
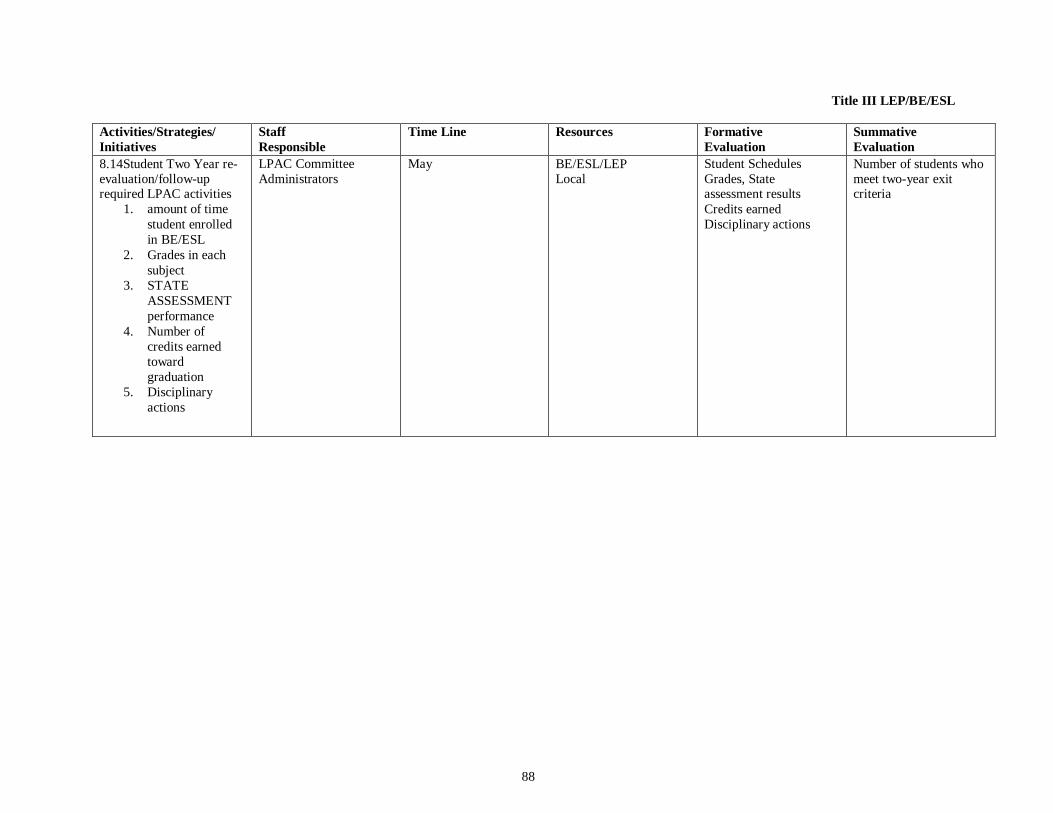
88
Title III LEP/BE/ESL
Activities/Strategies/
Initiatives
Staff
Responsible
Time Line Resources Formative
Evaluation
Summative
Evaluation
8.14Student Two Year re- evaluation/follow-up required LPAC activities
1. amount of time
student enrolled
in BE/ESL
2. Grades in each
subject
3. STATE
ASSESSMENT
performance
4. Number of
credits earned
toward
graduation
5. Disciplinary
actions
LPAC Committee
Administrators
May BE/ESL/LEP Local
Student Schedules
Grades, State assessment results
Credits earned
Disciplinary actions
Number of students who meet two-year exit criteria
89
9. State Compensatory Education
Intent and Purpose State compensatory education (SCE) is a supplemental program designed to eliminate any disparity in performance on assessment instruments administered
under Subchapter B, Chapter 39, or disparity in the rates of high school completion between students at risk of dropping out of school, as defined by TEC
§29.081, and all other students. The purpose is to design and implement appropriate compensatory, intensive, or accelerated instruction that enable the
students to be performing at grade level at the conclusion of the next regular school term. In determining the appropriate intensive accelerated instruction or
SCE program, districts must use student performance data resulting from the basic skills assessment instrument and achievement tests administered under
Subchapter B, Chapter 39. Based on this needs assessment, district and campus staff shall design the appropriate strategies and include them in the campus
and/or district improvement plan.
In 2014-2015 at-risk students performance had slight increase writing. Economically Disadvantaged students performances, had slight increase Science,
Social Studies and Writing. Although there were slight decreases for both subgroups, we continue to provide targeted assistance to students in need. Thus
funds were used as in prior years.
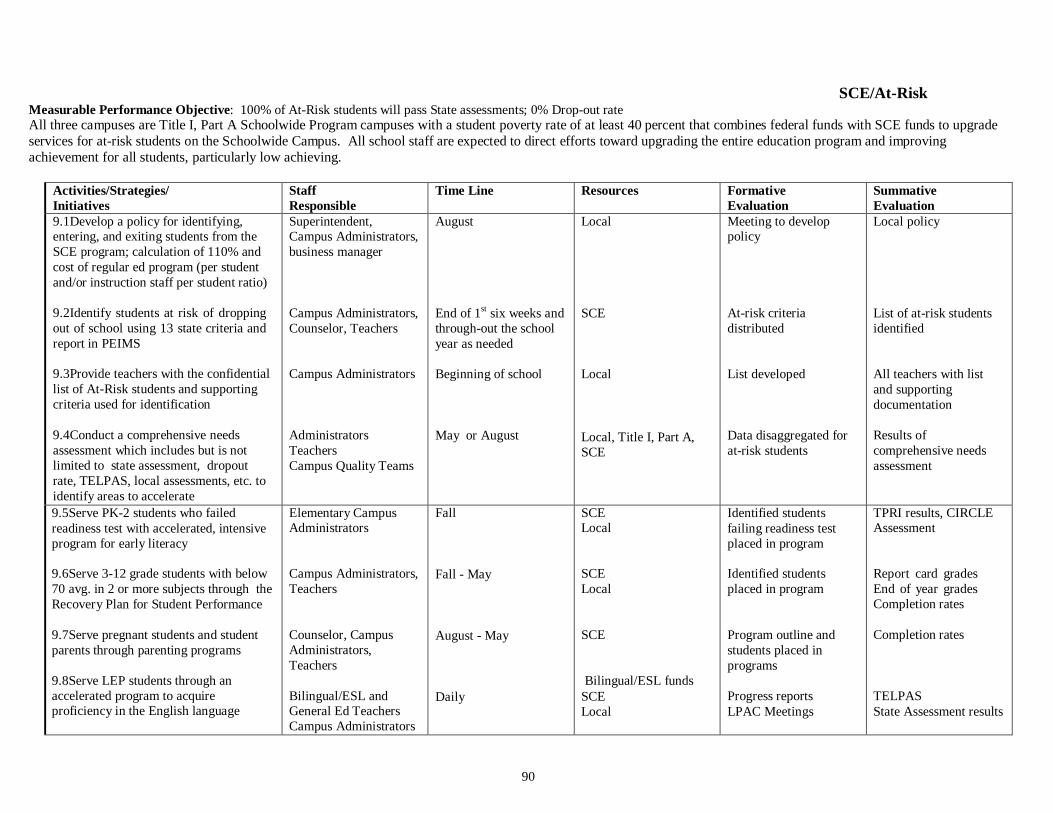
90
Measurable Performance Objective: 100% of At-Risk students will pass State assessments; 0% Drop-out rate
SCE/At-Risk
All three campuses are Title I, Part A Schoolwide Program campuses with a student poverty rate of at least 40 percent that combines federal funds with SCE funds to upgrade
services for at-risk students on the Schoolwide Campus. All school staff are expected to direct efforts toward upgrading the entire education program and improving
achievement for all students, particularly low achieving.
Activities/Strategies/
Initiatives
Staff
Responsible
Time Line Resources Formative
Evaluation
Summative
Evaluation
9.1Develop a policy for identifying, entering, and exiting students from the
SCE program; calculation of 110% and
cost of regular ed program (per student
and/or instruction staff per student ratio)
9.2Identify students at risk of dropping
out of school using 13 state criteria and
report in PEIMS
9.3Provide teachers with the confidential
list of At-Risk students and supporting
criteria used for identification
9.4Conduct a comprehensive needs
assessment which includes but is not
limited to state assessment, dropout
rate, TELPAS, local assessments, etc. to
identify areas to accelerate
Superintendent, Campus Administrators,
business manager
Campus Administrators,
Counselor, Teachers
Campus Administrators
Administrators
Teachers
Campus Quality Teams
August
End of 1st
six weeks and
through-out the school
year as needed
Beginning of school
May or August
Local
SCE
Local
Local, Title I, Part A,
SCE
Meeting to develop policy
At-risk criteria
distributed
List developed
Data disaggregated for
at-risk students
Local policy
List of at-risk students
identified
All teachers with list
and supporting
documentation
Results of
comprehensive needs
assessment
9.5Serve PK-2 students who failed
readiness test with accelerated, intensive
program for early literacy
9.6Serve 3-12 grade students with below
70 avg. in 2 or more subjects through the
Recovery Plan for Student Performance
9.7Serve pregnant students and student
parents through parenting programs
9.8Serve LEP students through an
accelerated program to acquire proficiency in the English language
Elementary Campus Administrators
Campus Administrators,
Teachers
Counselor, Campus
Administrators,
Teachers
Bilingual/ESL and General Ed Teachers
Campus Administrators
Fall
Fall - May
August - May
Daily
SCE Local
SCE
Local
SCE
Bilingual/ESL funds
SCE
Local
Identified students
failing readiness test
placed in program
Identified students
placed in program
Program outline and
students placed in
programs
Progress reports
LPAC Meetings
TPRI results, CIRCLE Assessment
Report card grades
End of year grades
Completion rates
Completion rates
TELPAS
State Assessment results
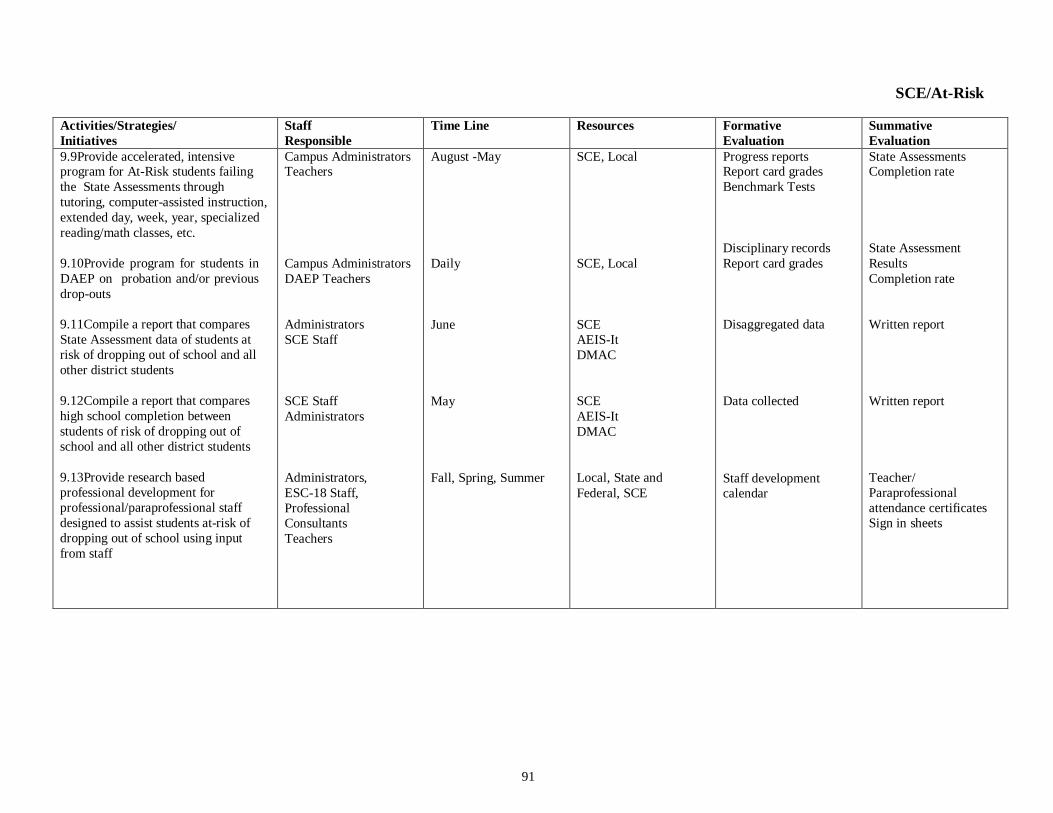
91
SCE/At-Risk
Activities/Strategies/
Initiatives
Staff
Responsible
Time Line Resources Formative
Evaluation
Summative
Evaluation
9.9Provide accelerated, intensive program for At-Risk students failing
the State Assessments through
tutoring, computer-assisted instruction,
extended day, week, year, specialized
reading/math classes, etc.
9.10Provide program for students in
DAEP on probation and/or previous
drop-outs
9.11Compile a report that compares
State Assessment data of students at
risk of dropping out of school and all
other district students
9.12Compile a report that compares
high school completion between
students of risk of dropping out of
school and all other district students
9.13Provide research based
professional development for
professional/paraprofessional staff
designed to assist students at-risk of
dropping out of school using input
from staff
Campus Administrators Teachers
Campus Administrators
DAEP Teachers
Administrators
SCE Staff
SCE Staff
Administrators
Administrators,
ESC-18 Staff,
Professional
Consultants
Teachers
August -May
Daily
June
May
Fall, Spring, Summer
SCE, Local
SCE, Local
SCE
AEIS-It
DMAC
SCE
AEIS-It
DMAC
Local, State and
Federal, SCE
Progress reports Report card grades
Benchmark Tests
Disciplinary records
Report card grades
Disaggregated data
Data collected
Staff development calendar
State Assessments Completion rate
State Assessment
Results
Completion rate
Written report
Written report
Teacher/
Paraprofessional
attendance certificates
Sign in sheets
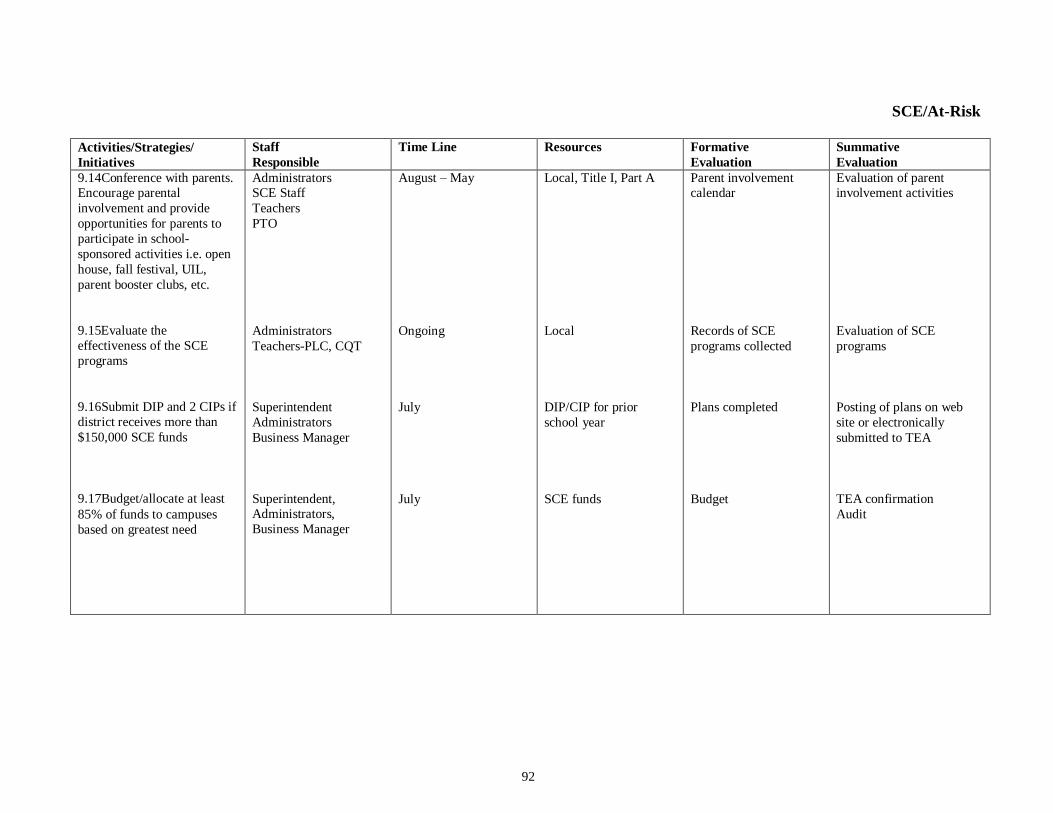
92
SCE/At-Risk
Activities/Strategies/
Initiatives
Staff
Responsible
Time Line Resources Formative
Evaluation
Summative
Evaluation
9.14Conference with parents. Encourage parental
involvement and provide
opportunities for parents to
participate in school-
sponsored activities i.e. open
house, fall festival, UIL,
parent booster clubs, etc.
9.15Evaluate the
effectiveness of the SCE
programs
9.16Submit DIP and 2 CIPs if
district receives more than
$150,000 SCE funds
9.17Budget/allocate at least
85% of funds to campuses
based on greatest need
Administrators SCE Staff
Teachers
PTO
Administrators
Teachers-PLC, CQT
Superintendent
Administrators
Business Manager
Superintendent, Administrators,
Business Manager
August – May
Ongoing
July
July
Local, Title I, Part A
Local
DIP/CIP for prior
school year
SCE funds
Parent involvement calendar
Records of SCE
programs collected
Plans completed
Budget
Evaluation of parent involvement activities
Evaluation of SCE
programs
Posting of plans on web
site or electronically
submitted to TEA
TEA confirmation
Audit
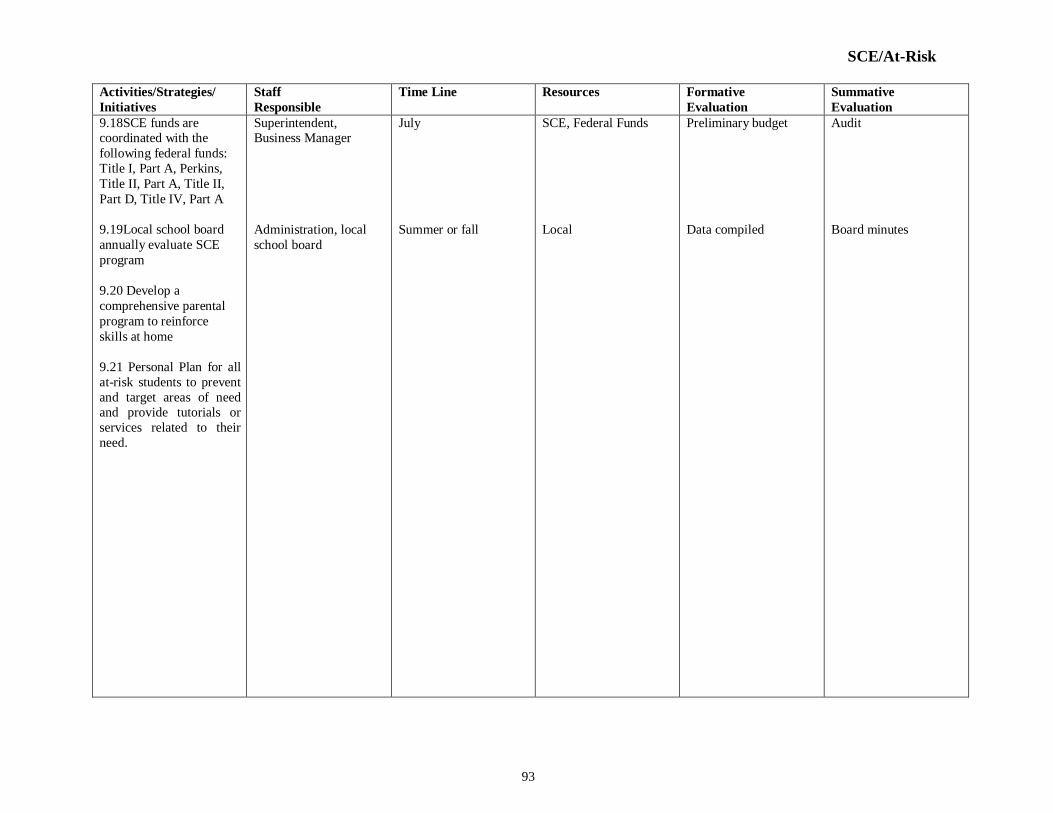
93
SCE/At-Risk
Activities/Strategies/
Initiatives
Staff
Responsible
Time Line Resources Formative
Evaluation
Summative
Evaluation
9.18SCE funds are coordinated with the
following federal funds:
Title I, Part A, Perkins,
Title II, Part A, Title II,
Part D, Title IV, Part A
9.19Local school board
annually evaluate SCE
program
9.20 Develop a
comprehensive parental
program to reinforce
skills at home
9.21 Personal Plan for all
at-risk students to prevent
and target areas of need and provide tutorials or
services related to their
need.
Superintendent, Business Manager
Administration, local
school board
July
Summer or fall
SCE, Federal Funds
Local
Preliminary budget
Data compiled
Audit
Board minutes
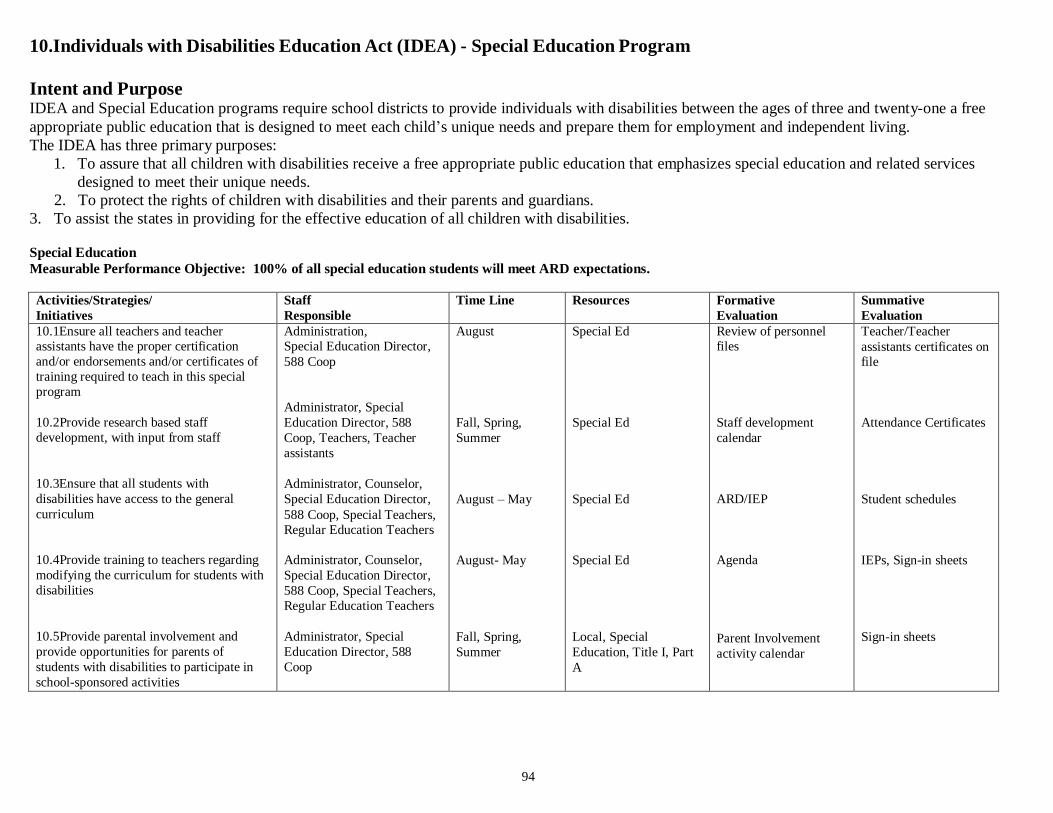
94
10.Individuals with Disabilities Education Act (IDEA) - Special Education Program
Intent and Purpose IDEA and Special Education programs require school districts to provide individuals with disabilities between the ages of three and twenty-one a free
appropriate public education that is designed to meet each child’s unique needs and prepare them for employment and independent living.
The IDEA has three primary purposes:
1. To assure that all children with disabilities receive a free appropriate public education that emphasizes special education and related services
designed to meet their unique needs.
2. To protect the rights of children with disabilities and their parents and guardians.
3. To assist the states in providing for the effective education of all children with disabilities. Special Education
Measurable Performance Objective: 100% of all special education students will meet ARD expectations.
Activities/Strategies/
Initiatives
Staff
Responsible
Time Line Resources Formative
Evaluation
Summative
Evaluation
10.1Ensure all teachers and teacher assistants have the proper certification
and/or endorsements and/or certificates of
training required to teach in this special
program
10.2Provide research based staff
development, with input from staff
10.3Ensure that all students with
disabilities have access to the general
curriculum
10.4Provide training to teachers regarding
modifying the curriculum for students with
disabilities
10.5Provide parental involvement and
provide opportunities for parents of
students with disabilities to participate in
school-sponsored activities
Administration, Special Education Director,
588 Coop
Administrator, Special
Education Director, 588
Coop, Teachers, Teacher
assistants
Administrator, Counselor,
Special Education Director,
588 Coop, Special Teachers, Regular Education Teachers
Administrator, Counselor,
Special Education Director,
588 Coop, Special Teachers,
Regular Education Teachers
Administrator, Special
Education Director, 588
Coop
August
Fall, Spring,
Summer
August – May
August- May
Fall, Spring,
Summer
Special Ed
Special Ed
Special Ed
Special Ed
Local, Special
Education, Title I, Part
A
Review of personnel files
Staff development
calendar
ARD/IEP
Agenda
Parent Involvement
activity calendar
Teacher/Teacher
assistants certificates on file
Attendance Certificates
Student schedules
IEPs, Sign-in sheets
Sign-in sheets
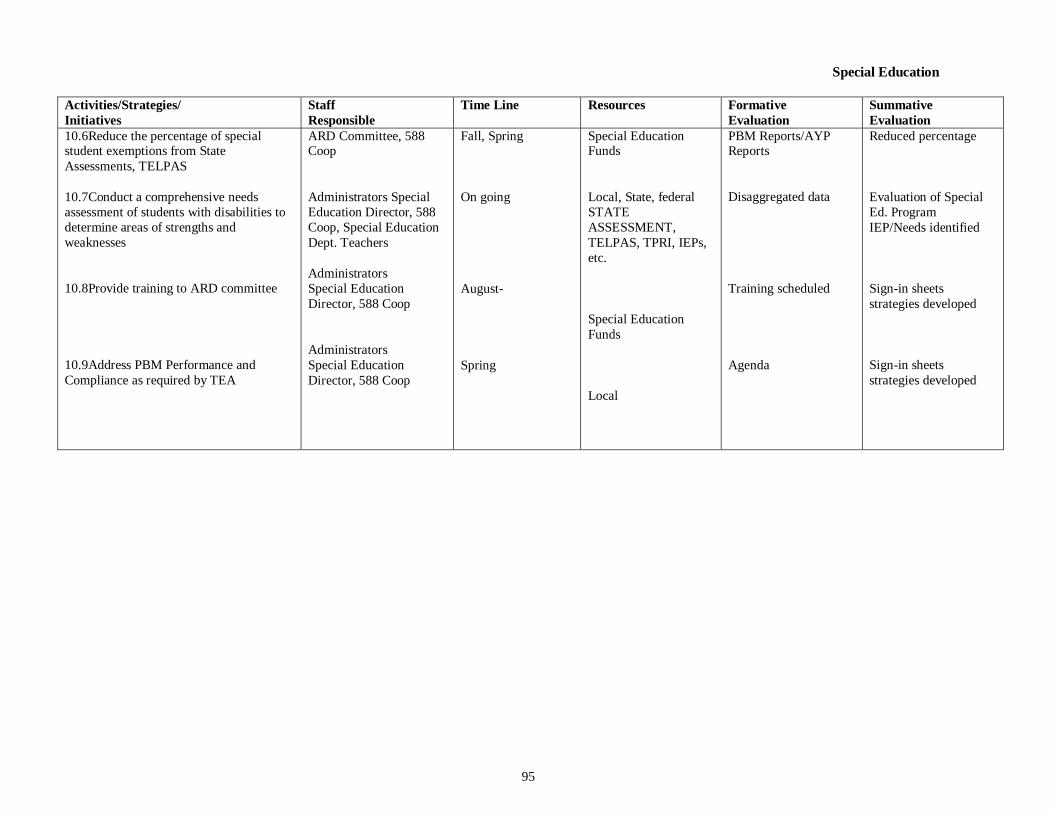
95
Special Education
Activities/Strategies/
Initiatives
Staff
Responsible
Time Line Resources Formative
Evaluation
Summative
Evaluation
10.6Reduce the percentage of special student exemptions from State
Assessments, TELPAS
10.7Conduct a comprehensive needs
assessment of students with disabilities to
determine areas of strengths and
weaknesses
10.8Provide training to ARD committee
10.9Address PBM Performance and
Compliance as required by TEA
ARD Committee, 588 Coop
Administrators Special
Education Director, 588
Coop, Special Education
Dept. Teachers
Administrators
Special Education
Director, 588 Coop
Administrators
Special Education
Director, 588 Coop
Fall, Spring
On going
August-
Spring
Special Education Funds
Local, State, federal
STATE
ASSESSMENT,
TELPAS, TPRI, IEPs,
etc.
Special Education
Funds
Local
PBM Reports/AYP Reports
Disaggregated data
Training scheduled
Agenda
Reduced percentage
Evaluation of Special
Ed. Program
IEP/Needs identified
Sign-in sheets
strategies developed
Sign-in sheets
strategies developed
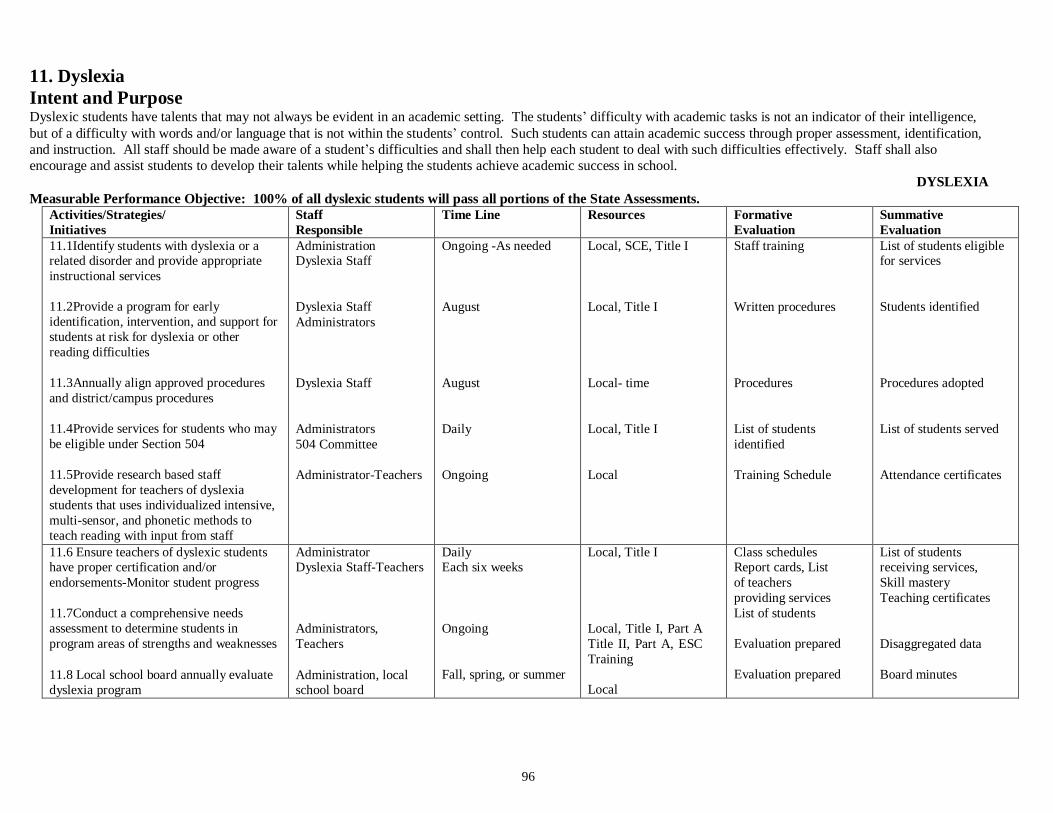
96
11. Dyslexia
Intent and Purpose Dyslexic students have talents that may not always be evident in an academic setting. The students’ difficulty with academic tasks is not an indicator of their intelligence,
but of a difficulty with words and/or language that is not within the students’ control. Such students can attain academic success through proper assessment, identification,
and instruction. All staff should be made aware of a student’s difficulties and shall then help each student to deal with such difficulties effectively. Staff shall also
encourage and assist students to develop their talents while helping the students achieve academic success in school.
Measurable Performance Objective: 100% of all dyslexic students will pass all portions of the State Assessments.
DYSLEXIA
Activities/Strategies/
Initiatives
Staff
Responsible
Time Line Resources Formative
Evaluation
Summative
Evaluation
11.1Identify students with dyslexia or a related disorder and provide appropriate
instructional services
11.2Provide a program for early
identification, intervention, and support for
students at risk for dyslexia or other
reading difficulties
11.3Annually align approved procedures
and district/campus procedures
11.4Provide services for students who may
be eligible under Section 504
11.5Provide research based staff
development for teachers of dyslexia
students that uses individualized intensive,
multi-sensor, and phonetic methods to
teach reading with input from staff
Administration Dyslexia Staff
Dyslexia Staff
Administrators
Dyslexia Staff
Administrators
504 Committee
Administrator-Teachers
Ongoing -As needed
August
August
Daily
Ongoing
Local, SCE, Title I
Local, Title I
Local- time
Local, Title I
Local
Staff training
Written procedures
Procedures
List of students
identified
Training Schedule
List of students eligible for services
Students identified
Procedures adopted
List of students served
Attendance certificates
11.6 Ensure teachers of dyslexic students have proper certification and/or
endorsements-Monitor student progress
11.7Conduct a comprehensive needs
assessment to determine students in
program areas of strengths and weaknesses
11.8 Local school board annually evaluate
dyslexia program
Administrator Dyslexia Staff-Teachers
Administrators,
Teachers
Administration, local school board
Daily Each six weeks
Ongoing
Fall, spring, or summer
Local, Title I
Local, Title I, Part A
Title II, Part A, ESC
Training
Local
Class schedules Report cards, List
of teachers
providing services
List of students
Evaluation prepared
Evaluation prepared
List of students receiving services,
Skill mastery
Teaching certificates
Disaggregated data
Board minutes
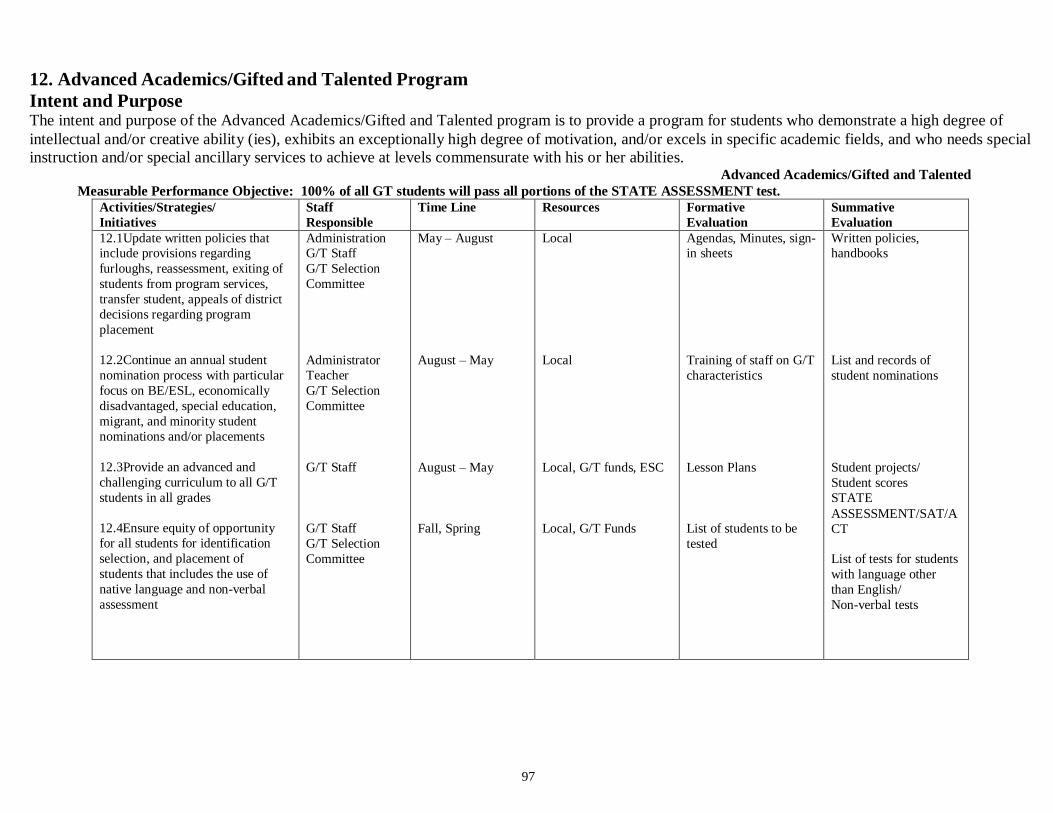
97
12. Advanced Academics/Gifted and Talented Program
Intent and Purpose The intent and purpose of the Advanced Academics/Gifted and Talented program is to provide a program for students who demonstrate a high degree of
intellectual and/or creative ability (ies), exhibits an exceptionally high degree of motivation, and/or excels in specific academic fields, and who needs special
instruction and/or special ancillary services to achieve at levels commensurate with his or her abilities. Advanced Academics/Gifted and Talented
Measurable Performance Objective: 100% of all GT students will pass all portions of the STATE ASSESSMENT test.
Activities/Strategies/
Initiatives
Staff
Responsible
Time Line Resources Formative
Evaluation
Summative
Evaluation
12.1Update written policies that include provisions regarding
furloughs, reassessment, exiting of
students from program services,
transfer student, appeals of district
decisions regarding program
placement
12.2Continue an annual student
nomination process with particular
focus on BE/ESL, economically
disadvantaged, special education,
migrant, and minority student
nominations and/or placements
12.3Provide an advanced and
challenging curriculum to all G/T
students in all grades
12.4Ensure equity of opportunity
for all students for identification
selection, and placement of
students that includes the use of
native language and non-verbal
assessment
Administration G/T Staff
G/T Selection
Committee
Administrator
Teacher
G/T Selection
Committee
G/T Staff
G/T Staff
G/T Selection
Committee
May – August
August – May
August – May
Fall, Spring
Local
Local
Local, G/T funds, ESC
Local, G/T Funds
Agendas, Minutes, sign- in sheets
Training of staff on G/T
characteristics
Lesson Plans
List of students to be
tested
Written policies, handbooks
List and records of
student nominations
Student projects/
Student scores
STATE
ASSESSMENT/SAT/A
CT
List of tests for students
with language other
than English/
Non-verbal tests
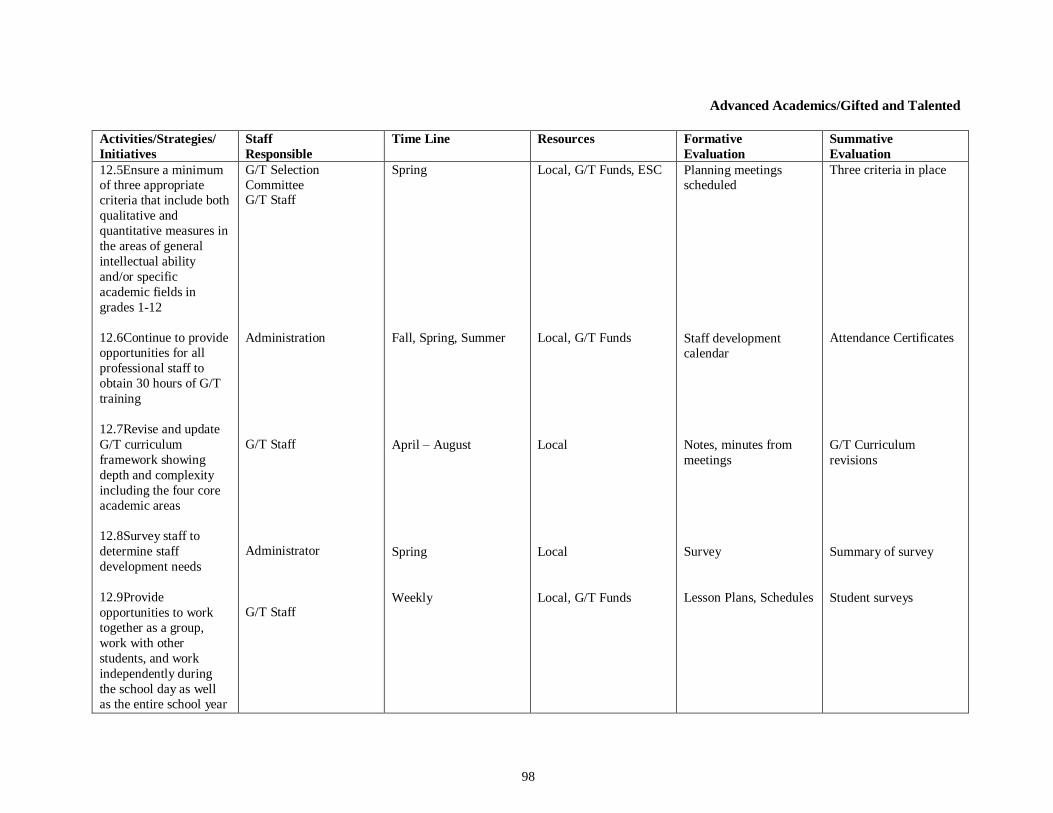
98
Advanced Academics/Gifted and Talented
Activities/Strategies/
Initiatives
Staff
Responsible
Time Line Resources Formative
Evaluation
Summative
Evaluation
12.5Ensure a minimum of three appropriate
criteria that include both
qualitative and
quantitative measures in
the areas of general
intellectual ability
and/or specific
academic fields in
grades 1-12
12.6Continue to provide
opportunities for all
professional staff to
obtain 30 hours of G/T
training
12.7Revise and update
G/T curriculum
framework showing
depth and complexity
including the four core
academic areas
12.8Survey staff to
determine staff
development needs
12.9Provide
opportunities to work
together as a group,
work with other
students, and work
independently during
the school day as well
as the entire school year
G/T Selection
Committee G/T Staff
Administration
G/T Staff
Administrator
G/T Staff
Spring
Fall, Spring, Summer
April – August
Spring
Weekly
Local, G/T Funds, ESC
Local, G/T Funds
Local
Local
Local, G/T Funds
Planning meetings scheduled
Staff development calendar
Notes, minutes from
meetings
Survey
Lesson Plans, Schedules
Three criteria in place
Attendance Certificates
G/T Curriculum
revisions
Summary of survey
Student surveys
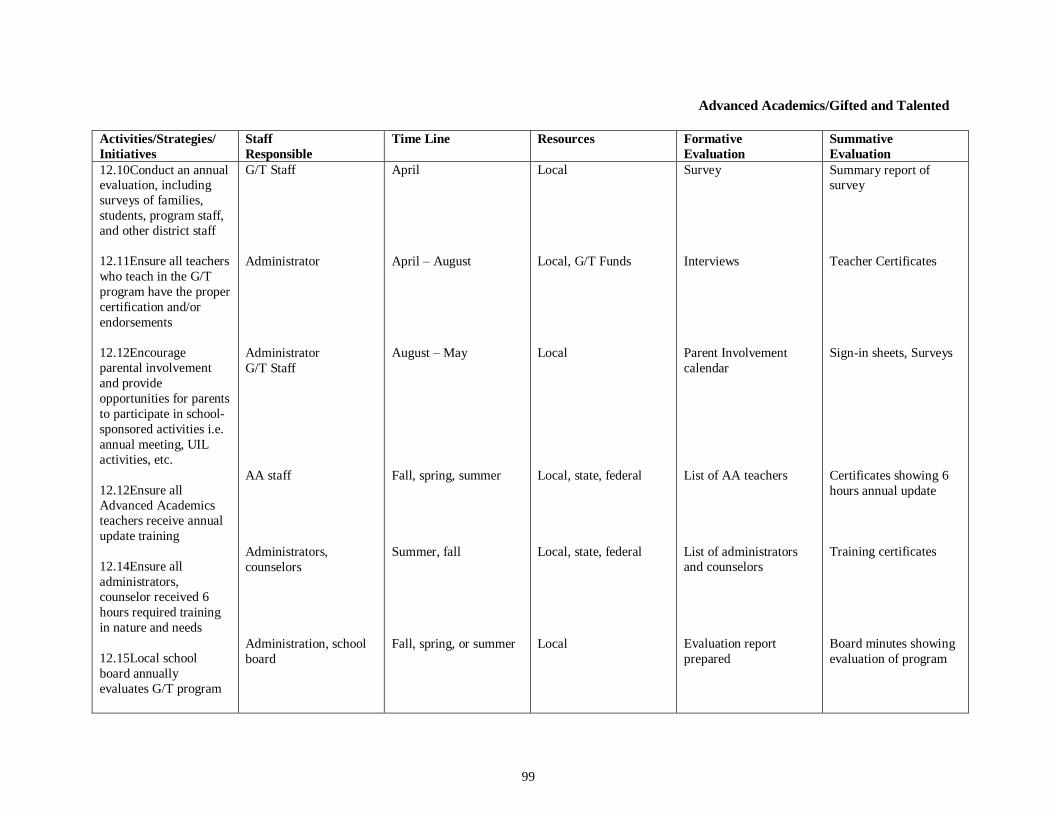
99
Advanced Academics/Gifted and Talented
Activities/Strategies/
Initiatives
Staff
Responsible
Time Line Resources Formative
Evaluation
Summative
Evaluation
12.10Conduct an annual evaluation, including
surveys of families,
students, program staff,
and other district staff
12.11Ensure all teachers
who teach in the G/T
program have the proper
certification and/or
endorsements
12.12Encourage
parental involvement
and provide
opportunities for parents
to participate in school-
sponsored activities i.e.
annual meeting, UIL
activities, etc.
12.12Ensure all
Advanced Academics
teachers receive annual
update training
12.14Ensure all
administrators,
counselor received 6
hours required training
in nature and needs
12.15Local school
board annually
evaluates G/T program
G/T Staff
Administrator
Administrator
G/T Staff
AA staff
Administrators,
counselors
Administration, school
board
April
April – August
August – May
Fall, spring, summer
Summer, fall
Fall, spring, or summer
Local
Local, G/T Funds
Local
Local, state, federal
Local, state, federal
Local
Survey
Interviews
Parent Involvement
calendar
List of AA teachers
List of administrators
and counselors
Evaluation report
prepared
Summary report of survey
Teacher Certificates
Sign-in sheets, Surveys
Certificates showing 6
hours annual update
Training certificates
Board minutes showing
evaluation of program
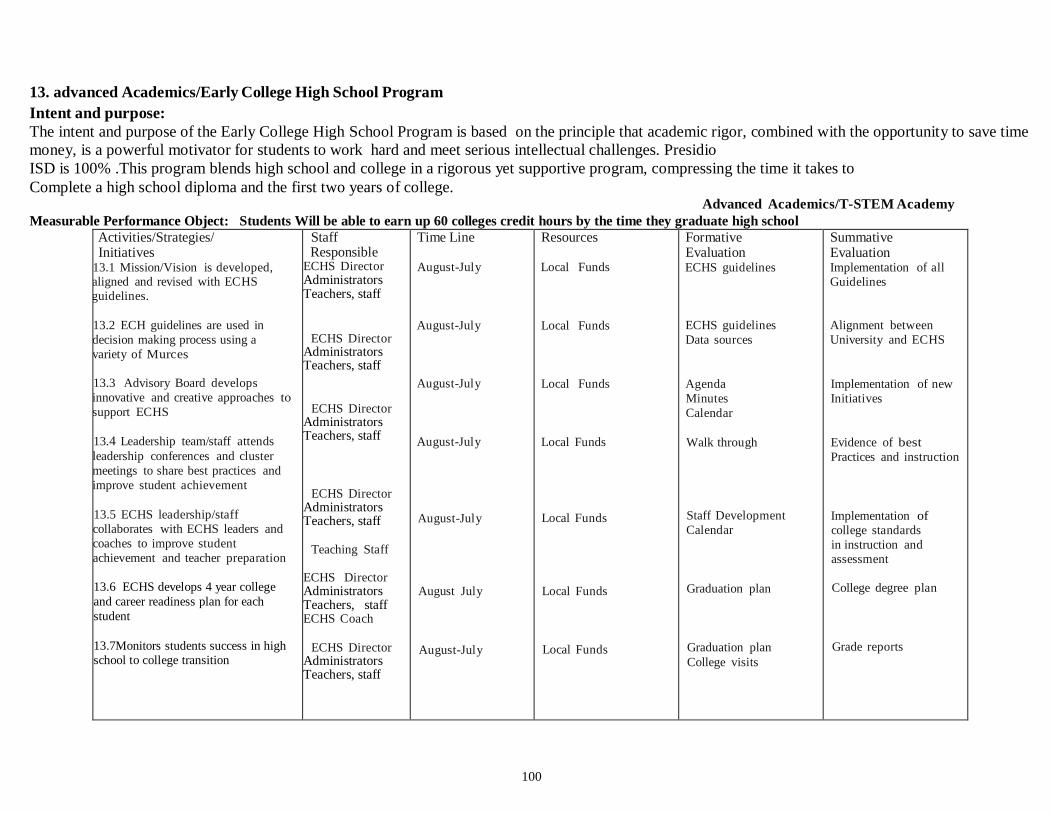
100
13. advanced Academics/Early College High School Program
Intent and purpose:
The intent and purpose of the Early College High School Program is based on the principle that academic rigor, combined with the opportunity to save time
money, is a powerful motivator for students to work hard and meet serious intellectual challenges. Presidio
ISD is 100% .This program blends high school and college in a rigorous yet supportive program, compressing the time it takes to
Complete a high school diploma and the first two years of college. Advanced Academics/T-STEM Academy
Measurable Performance Object: Students Will be able to earn up 60 colleges credit hours by the time they graduate high school
Activities/Strategies/ Initiatives
13.1 Mission/Vision is developed, aligned and revised with ECHS
guidelines.
13.2 ECH guidelines are used in
decision making process using a
variety of Murces
13.3 Advisory Board develops
innovative and creative approaches to
support ECHS
13.4 Leadership team/staff attends
leadership conferences and cluster
meetings to share best practices and
improve student achievement
13.5 ECHS leadership/staff
collaborates with ECHS leaders and
coaches to improve student
achievement and teacher preparation
13.6 ECHS develops 4 year college
and career readiness plan for each
student
13.7Monitors students success in high
school to college transition
Staff Responsible
ECHS Director Administrators Teachers, staff
ECHS Director
Administrators Teachers, staff
ECHS Director Administrators Teachers, staff
ECHS Director
Administrators Teachers, staff
Teaching Staff
ECHS Director Administrators Teachers, staff ECHS Coach
ECHS Director
Administrators Teachers, staff
Time Line
August-July
August-July
August-July
August-July
August-July
August July
August-July
Resources
Local Funds
Local Funds
Local Funds
Local Funds
Local Funds
Local Funds
Local Funds
Formative Evaluation ECHS guidelines
ECHS guidelines
Data sources
Agenda
Minutes
Calendar
Walk through
Staff Development
Calendar
Graduation plan
Graduation plan
College visits
Summative Evaluation Implementation of all
Guidelines
Alignment between
University and ECHS
Implementation of new
Initiatives
Evidence of best
Practices and instruction
Implementation of
college standards
in instruction and
assessment
College degree plan
Grade reports
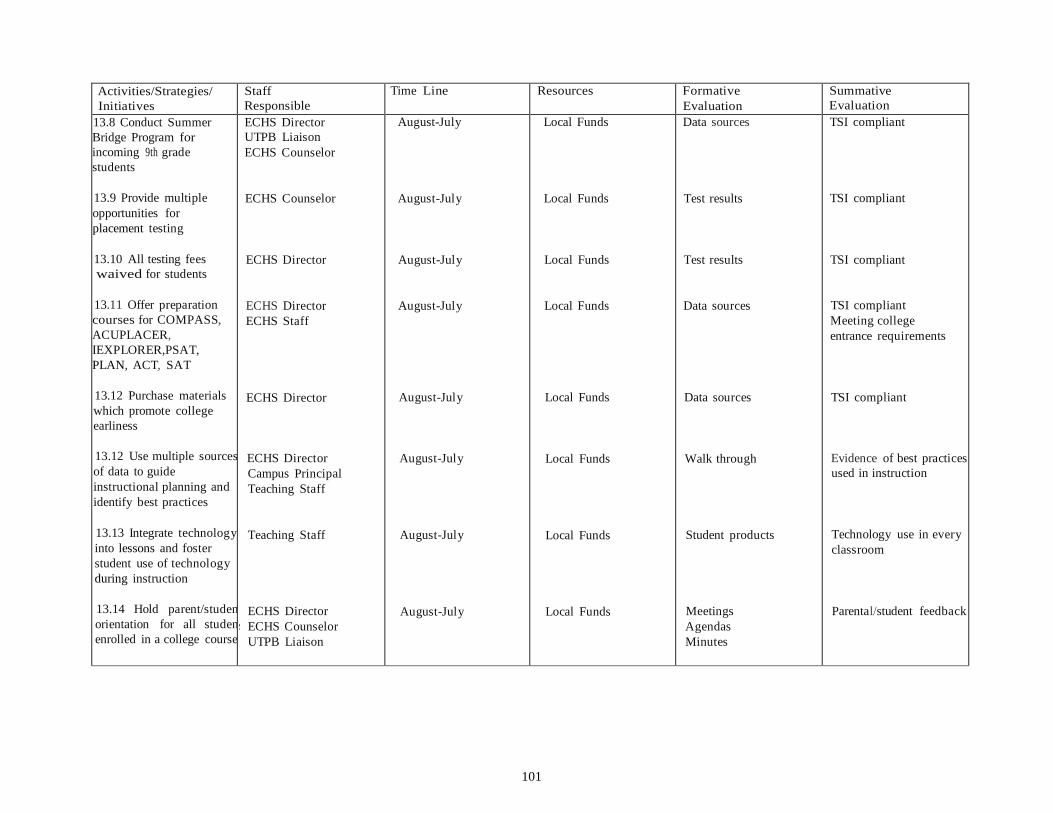
101
s
Activities/Strategies/
Initiatives
Staff
Responsible
Time Line Resources Formative
Evaluation
Summative
Evaluation
13.8 Conduct Summer
Bridge Program for
incoming 9th grade
students
13.9 Provide multiple
opportunities for
placement testing
13.10 All testing fees
waived for students
13.11 Offer preparation
courses for COMPASS,
ACUPLACER,
IEXPLORER,PSAT,
PLAN, ACT, SAT
13.12 Purchase materials
which promote college
earliness
13.12 Use multiple sources
of data to guide
instructional planning and
identify best practices
13.13 Integrate technology
into lessons and foster
student use of technology
during instruction
13.14 Hold parent/student
orientation for all student
enrolled in a college course
ECHS Director
UTPB Liaison
ECHS Counselor
ECHS Counselor
ECHS Director
ECHS Director
ECHS Staff
ECHS Director
ECHS Director
Campus Principal
Teaching Staff
Teaching Staff
ECHS Director
ECHS Counselor
UTPB Liaison
August-July
August-July
August-July
August-July
August-July
August-July
August-July
August-July
Local Funds
Local Funds
Local Funds
Local Funds
Local Funds
Local Funds
Local Funds
Local Funds
Data sources
Test results
Test results
Data sources
Data sources
Walk through
Student products
Meetings
Agendas
Minutes
TSI compliant
TSI compliant
TSI compliant
TSI compliant
Meeting college
entrance requirements
TSI compliant
Evidence of best practices
used in instruction
Technology use in every
classroom
Parental/student feedback
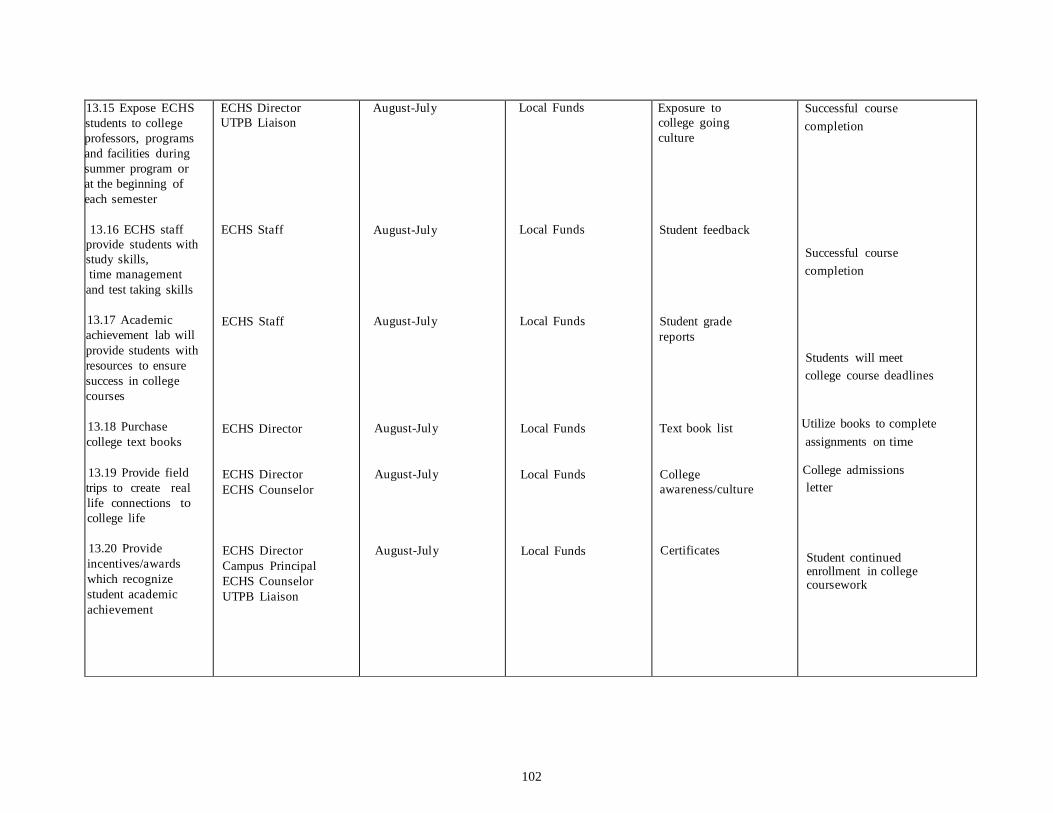
102
13.15 Expose ECHS
students to college
professors, programs
and facilities during
summer program or
at the beginning of
each semester
13.16 ECHS staff
provide students with
study skills,
time management
and test taking skills
13.17 Academic
achievement lab will
provide students with
resources to ensure
success in college
courses
13.18 Purchase
college text books
13.19 Provide field
trips to create real
life connections to
college life
13.20 Provide
incentives/awards
which recognize
student academic
achievement
ECHS Director
UTPB Liaison
ECHS Staff
ECHS Staff
ECHS Director
ECHS Director
ECHS Counselor
ECHS Director
Campus Principal
ECHS Counselor
UTPB Liaison
August-July
August-July
August-July
August-July
August-July
August-July
Local Funds
Local Funds
Local Funds
Local Funds
Local Funds
Local Funds
Exposure to
college going
culture
Student feedback
Student grade
reports
Text book list
College
awareness/culture
Certificates
Successful course
completion
Successful course
completion
Students will meet
college course deadlines
Utilize books to complete
assignments on time
College admissions
letter
Student continued enrollment in college coursework
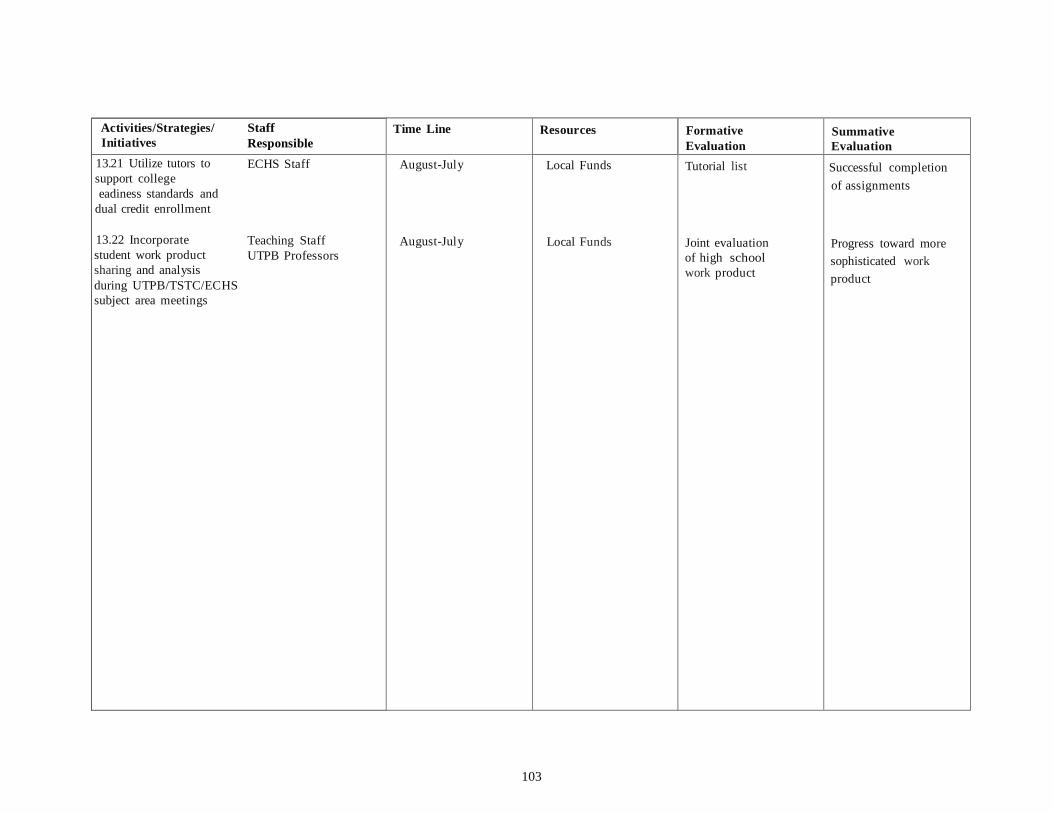
103
Activities/Strategies/ Staff
Initiatives Responsible
Time Line Resources Formative
Evaluation
Summative
Evaluation
13.21 Utilize tutors to ECHS Staff
support college
eadiness standards and
dual credit enrollment
13.22 Incorporate Teaching Staff
student work product UTPB Professors
sharing and analysis
during UTPB/TSTC/ECHS
subject area meetings
August-July
August-July
Local Funds
Local Funds
Tutorial list
Joint evaluation
of high school
work product
Successful completion
of assignments
Progress toward more
sophisticated work
product
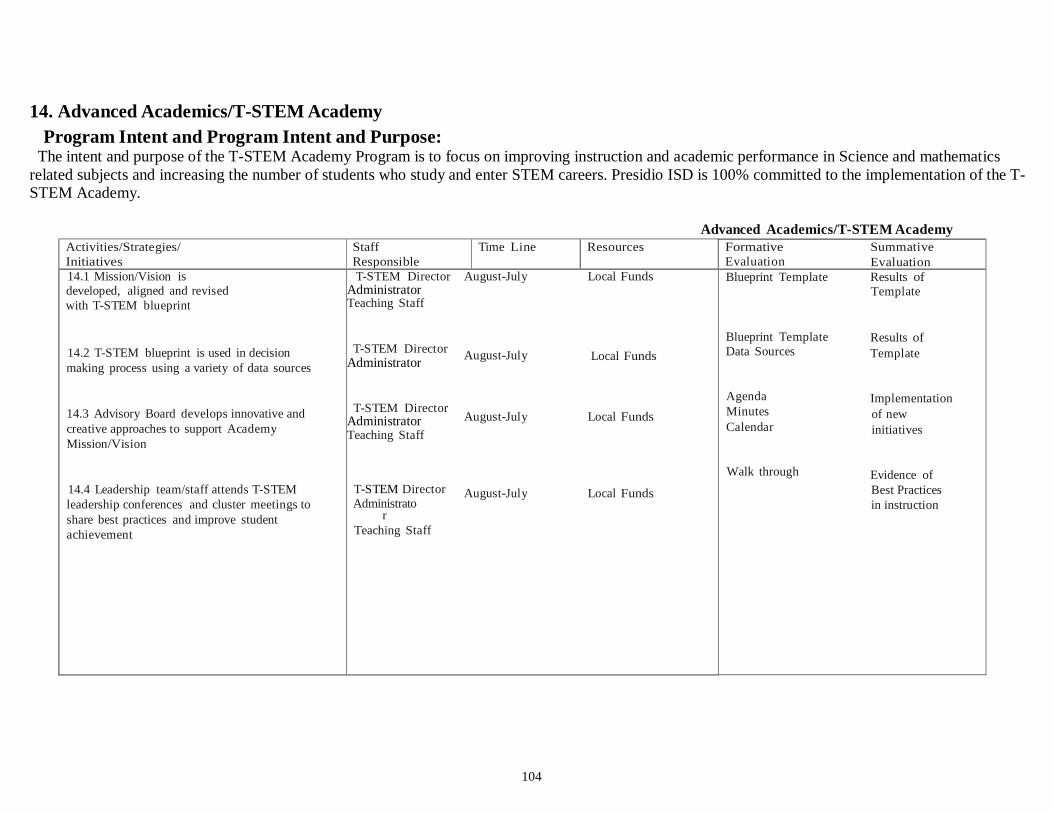
104
14. Advanced Academics/T-STEM Academy
Program Intent and Program Intent and Purpose: The intent and purpose of the T-STEM Academy Program is to focus on improving instruction and academic performance in Science and mathematics
related subjects and increasing the number of students who study and enter STEM careers. Presidio ISD is 100% committed to the implementation of the T- STEM Academy.
Advanced Academics/T-STEM Academy
Activities/Strategies/
Initiatives
Staff
Responsible
Time Line Resources Formative Summative
Evaluation Evaluation 14.1 Mission/Vision is
developed, aligned and revised
with T-STEM blueprint
14.2 T-STEM blueprint is used in decision
making process using a variety of data sources
14.3 Advisory Board develops innovative and
creative approaches to support Academy
Mission/Vision
14.4 Leadership team/staff attends T-STEM
leadership conferences and cluster meetings to
share best practices and improve student
achievement
T-STEM Director August-July Local Funds Administrator Teaching Staff
T-STEM Director August-July Local Funds
Administrator
T-STEM Director August-July Local Funds
Administrator Teaching Staff
T-STEM Director August-July Local Funds Administrato
r
Teaching Staff
Blueprint Template Results of
Template
Blueprint Template Results of Data Sources Template
Agenda Implementation Minutes of new Calendar initiatives
Walk through Evidence of
Best Practices
in instruction
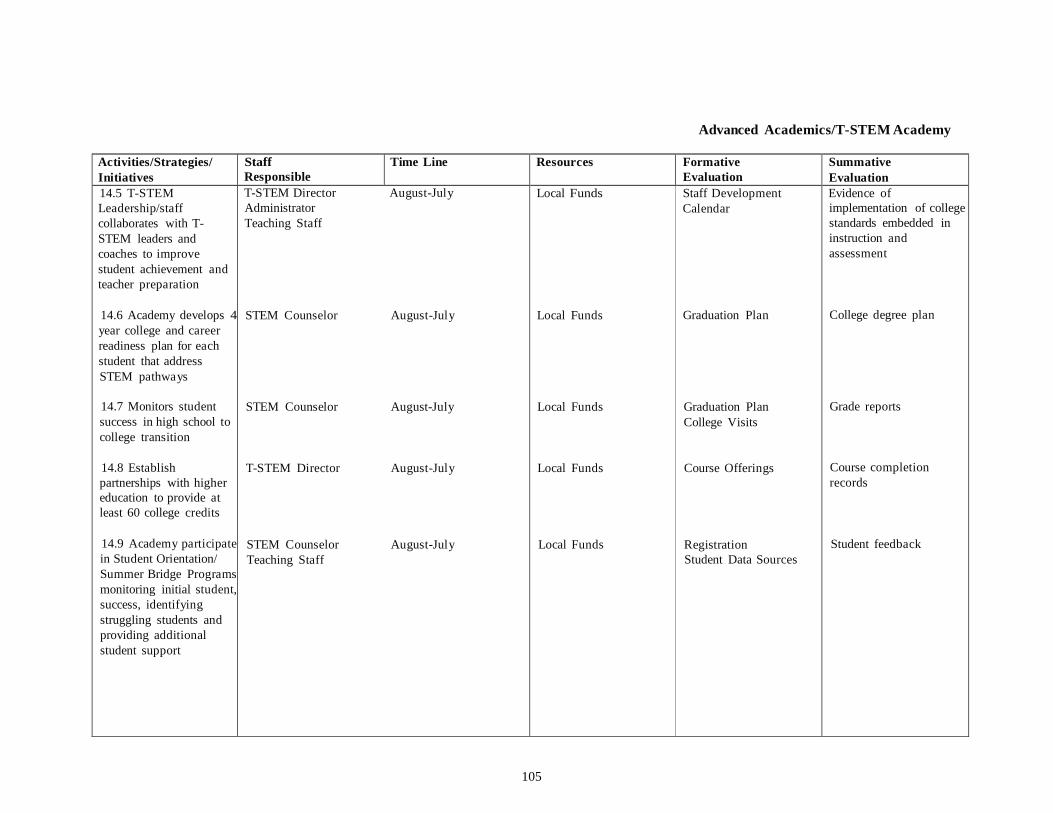
105
Advanced Academics/T-STEM Academy
Activities/Strategies/
Initiatives
Staff
Responsible
Time Line Resources Formative
Evaluation
Summative
Evaluation
14.5 T-STEM
Leadership/staff
collaborates with T-
STEM leaders and
coaches to improve
student achievement and
teacher preparation
14.6 Academy develops 4
year college and career
readiness plan for each
student that address
STEM pathways
14.7 Monitors student
success in high school to
college transition
14.8 Establish
partnerships with higher
education to provide at
least 60 college credits
14.9 Academy participate
in Student Orientation/
Summer Bridge Programs
monitoring initial student,
success, identifying
struggling students and
providing additional
student support
T-STEM Director August-July
Administrator
Teaching Staff
STEM Counselor August-July
STEM Counselor August-July
T-STEM Director August-July
STEM Counselor August-July
Teaching Staff
Local Funds
Local Funds
Local Funds
Local Funds
Local Funds
Staff Development
Calendar
Graduation Plan
Graduation Plan
College Visits
Course Offerings
Registration
Student Data Sources
Evidence of
implementation of college
standards embedded in
instruction and
assessment
College degree plan
Grade reports
Course completion
records
Student feedback
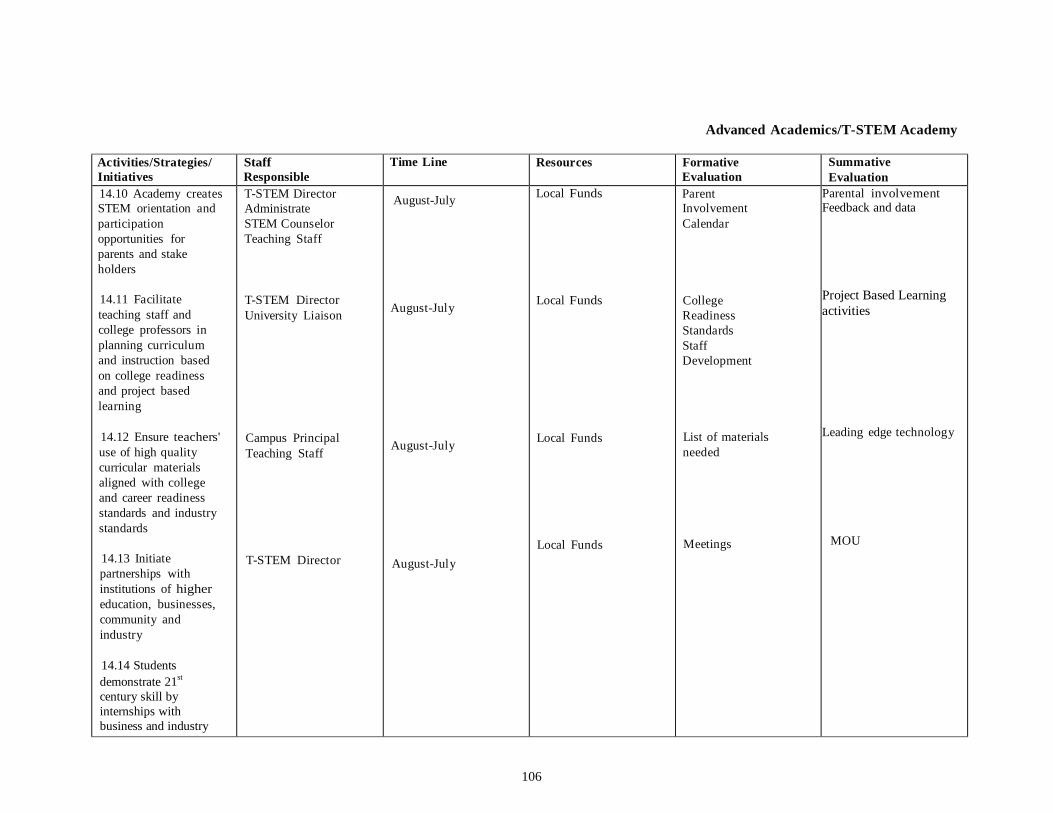
106
Advanced Academics/T-STEM Academy
Activities/Strategies/
Initiatives
Staff
Responsible
Time Line Resources Formative
Evaluation
Summative
Evaluation
14.10 Academy creates
STEM orientation and
participation
opportunities for
parents and stake
holders
14.11 Facilitate
teaching staff and
college professors in
planning curriculum
and instruction based
on college readiness
and project based
learning
14.12 Ensure teachers'
use of high quality
curricular materials
aligned with college
and career readiness
standards and industry
standards
14.13 Initiate
partnerships with
institutions of higher
education, businesses,
community and
industry
14.14 Students
demonstrate 21st
century skill by
internships with
business and industry
T-STEM Director
Administrate
STEM Counselor
Teaching Staff
T-STEM Director
University Liaison
Campus Principal
Teaching Staff
T-STEM Director
August-July
August-July
August-July
August-July
Local Funds
Local Funds
Local Funds
Local Funds
Parent
Involvement
Calendar
College
Readiness
Standards
Staff
Development
List of materials
needed
Meetings
Parental involvement Feedback and data
Project Based Learning
activities Leading edge technology
MOU
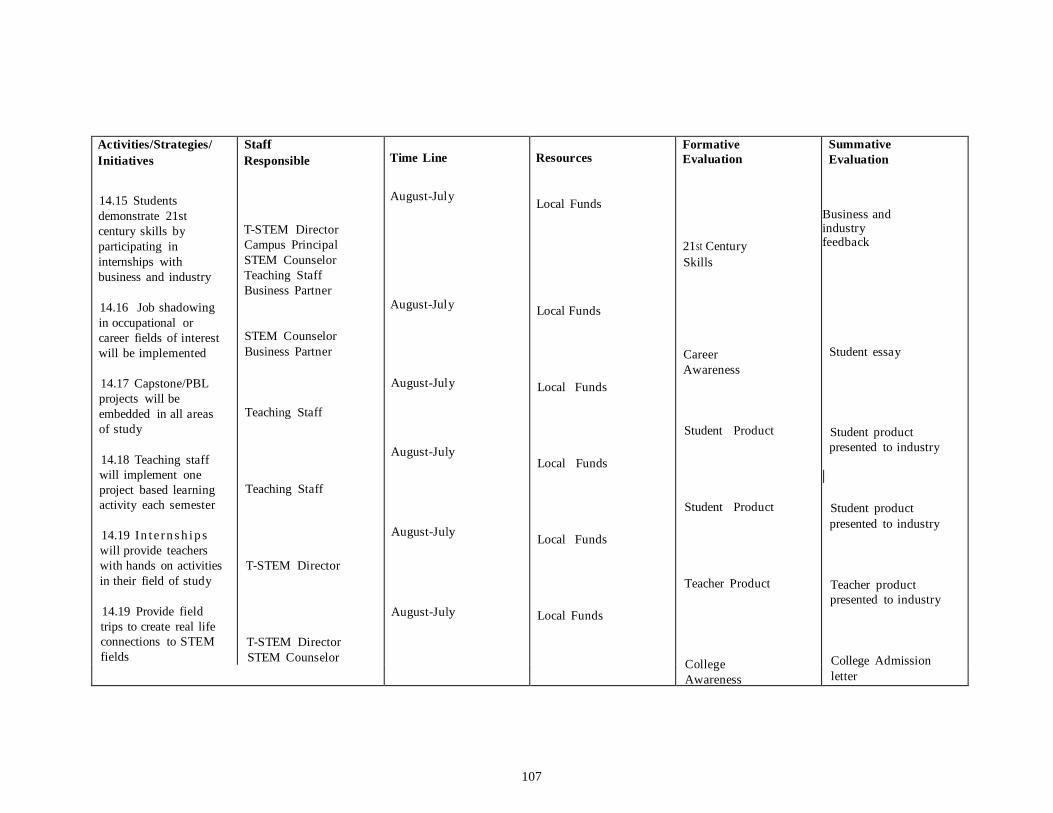
107
Activities/Strategies/
Initiatives
14.15 Students
demonstrate 21st
century skills by
participating in
internships with
business and industry
14.16 Job shadowing
in occupational or
career fields of interest
will be implemented
14.17 Capstone/PBL
projects will be
embedded in all areas
of study
14.18 Teaching staff
will implement one
project based learning
activity each semester
14.19 I n t e r n s h i p s
will provide teachers
with hands on activities
in their field of study
14.19 Provide field
trips to create real life
connections to STEM
fields
Staff
Responsible T-STEM Director
Campus Principal
STEM Counselor
Teaching Staff
Business Partner
STEM Counselor
Business Partner
Teaching Staff
Teaching Staff
T-STEM Director
T-STEM Director
STEM Counselor
Time Line
August-July
August-July
August-July
August-July
August-July
August-July
Resources
Local Funds
Local Funds
Local Funds
Local Funds
Local Funds
Local Funds
Formative
Evaluation
21st Century
Skills
Career
Awareness
Student Product
Student Product
Teacher Product
College
Awareness
Summative
Evaluation Business and industry feedback
Student essay
Student product
presented to industry
I
Student product
presented to industry
Teacher product
presented to industry
College Admission
letter
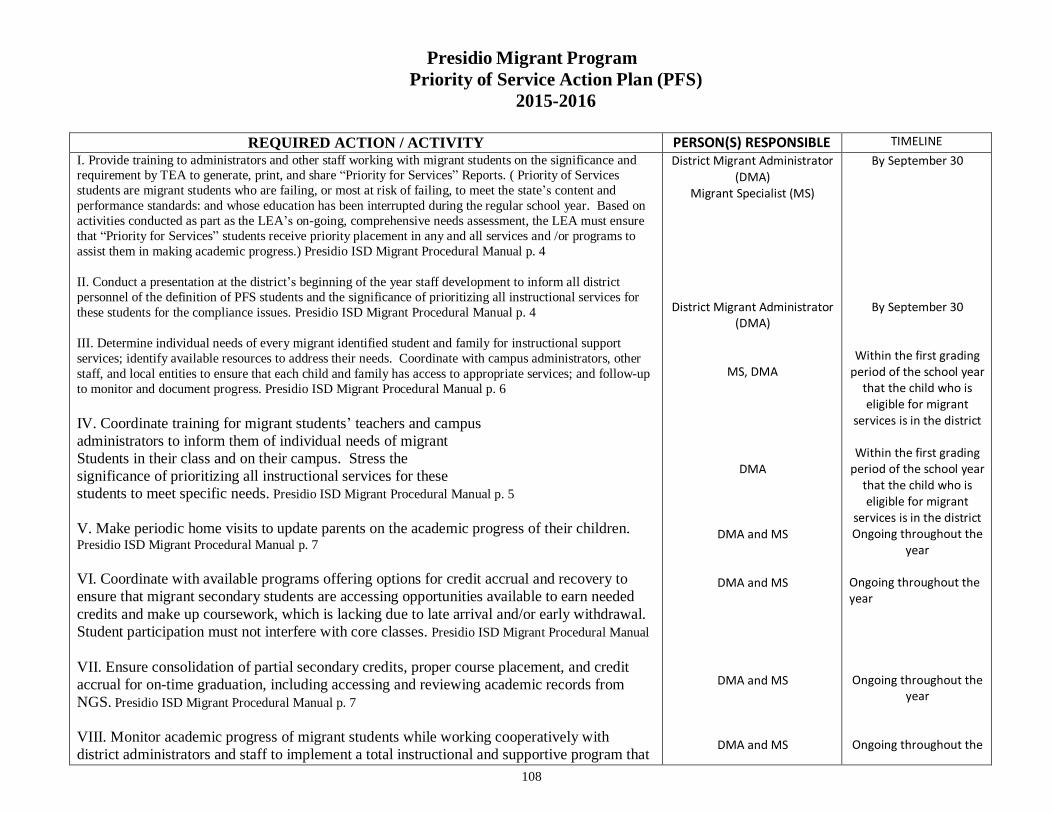
108
Presidio Migrant Program
Priority of Service Action Plan (PFS)
2015-2016
REQUIRED ACTION / ACTIVITY PERSON(S) RESPONSIBLE TIMELINE
I. Provide training to administrators and other staff working with migrant students on the significance and requirement by TEA to generate, print, and share “Priority for Services” Reports. ( Priority of Services
students are migrant students who are failing, or most at risk of failing, to meet the state’s content and
performance standards: and whose education has been interrupted during the regular school year. Based on
activities conducted as part as the LEA’s on-going, comprehensive needs assessment, the LEA must ensure
that “Priority for Services” students receive priority placement in any and all services and /or programs to
assist them in making academic progress.) Presidio ISD Migrant Procedural Manual p. 4
II. Conduct a presentation at the district’s beginning of the year staff development to inform all district
personnel of the definition of PFS students and the significance of prioritizing all instructional services for
these students for the compliance issues. Presidio ISD Migrant Procedural Manual p. 4
III. Determine individual needs of every migrant identified student and family for instructional support
services; identify available resources to address their needs. Coordinate with campus administrators, other
staff, and local entities to ensure that each child and family has access to appropriate services; and follow-up
to monitor and document progress. Presidio ISD Migrant Procedural Manual p. 6
IV. Coordinate training for migrant students’ teachers and campus
administrators to inform them of individual needs of migrant
Students in their class and on their campus. Stress the
significance of prioritizing all instructional services for these students to meet specific needs. Presidio ISD Migrant Procedural Manual p. 5
V. Make periodic home visits to update parents on the academic progress of their children. Presidio ISD Migrant Procedural Manual p. 7
VI. Coordinate with available programs offering options for credit accrual and recovery to
ensure that migrant secondary students are accessing opportunities available to earn needed
credits and make up coursework, which is lacking due to late arrival and/or early withdrawal.
Student participation must not interfere with core classes. Presidio ISD Migrant Procedural Manual
VII. Ensure consolidation of partial secondary credits, proper course placement, and credit
accrual for on-time graduation, including accessing and reviewing academic records from
NGS. Presidio ISD Migrant Procedural Manual p. 7
VIII. Monitor academic progress of migrant students while working cooperatively with
district administrators and staff to implement a total instructional and supportive program that
District Migrant Administrator (DMA)
Migrant Specialist (MS)
District Migrant Administrator
(DMA)
MS, DMA
DMA
DMA and MS
DMA and MS
DMA and MS
DMA and MS
By September 30
By September 30
Within the first grading
period of the school year that the child who is eligible for migrant
services is in the district
Within the first grading period of the school year
that the child who is eligible for migrant
services is in the district Ongoing throughout the
year
Ongoing throughout the year
Ongoing throughout the year
Ongoing throughout the
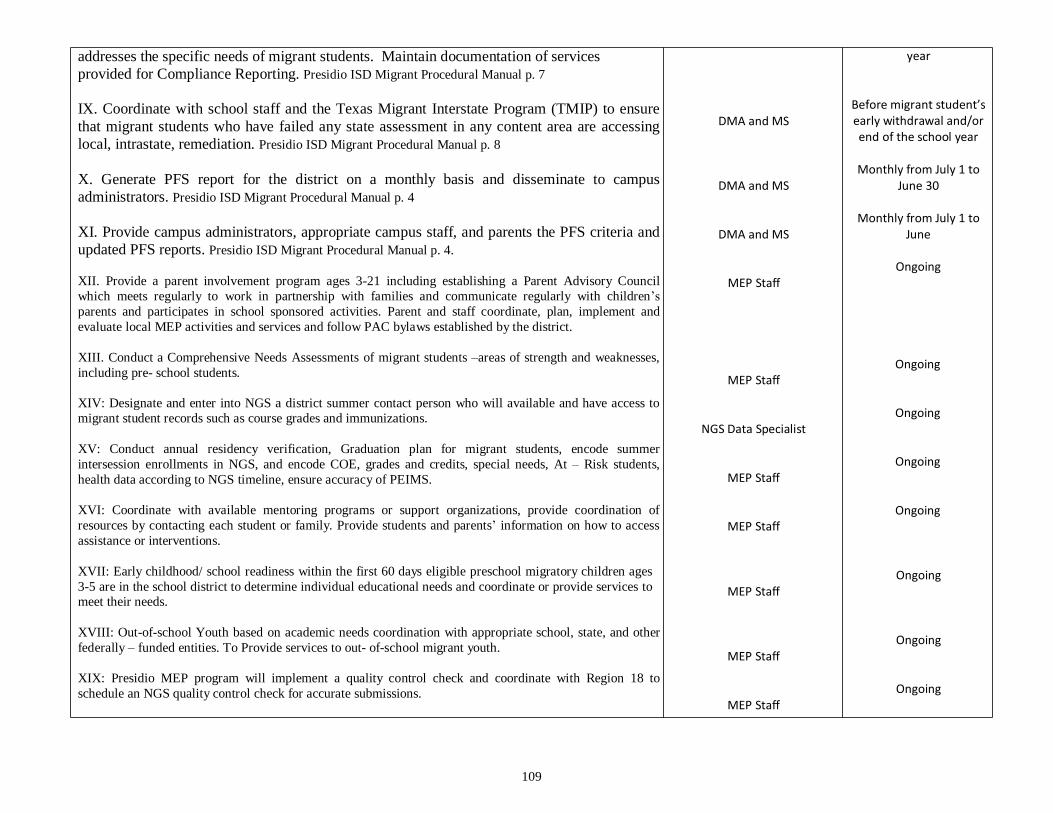
109
addresses the specific needs of migrant students. Maintain documentation of services
provided for Compliance Reporting. Presidio ISD Migrant Procedural Manual p. 7
IX. Coordinate with school staff and the Texas Migrant Interstate Program (TMIP) to ensure
that migrant students who have failed any state assessment in any content area are accessing
local, intrastate, remediation. Presidio ISD Migrant Procedural Manual p. 8
X. Generate PFS report for the district on a monthly basis and disseminate to campus
administrators. Presidio ISD Migrant Procedural Manual p. 4
XI. Provide campus administrators, appropriate campus staff, and parents the PFS criteria and
updated PFS reports. Presidio ISD Migrant Procedural Manual p. 4.
XII. Provide a parent involvement program ages 3-21 including establishing a Parent Advisory Council
which meets regularly to work in partnership with families and communicate regularly with children’s
parents and participates in school sponsored activities. Parent and staff coordinate, plan, implement and
evaluate local MEP activities and services and follow PAC bylaws established by the district.
XIII. Conduct a Comprehensive Needs Assessments of migrant students –areas of strength and weaknesses,
including pre- school students.
XIV: Designate and enter into NGS a district summer contact person who will available and have access to
migrant student records such as course grades and immunizations.
XV: Conduct annual residency verification, Graduation plan for migrant students, encode summer
intersession enrollments in NGS, and encode COE, grades and credits, special needs, At – Risk students,
health data according to NGS timeline, ensure accuracy of PEIMS.
XVI: Coordinate with available mentoring programs or support organizations, provide coordination of
resources by contacting each student or family. Provide students and parents’ information on how to access
assistance or interventions.
XVII: Early childhood/ school readiness within the first 60 days eligible preschool migratory children ages
3-5 are in the school district to determine individual educational needs and coordinate or provide services to meet their needs.
XVIII: Out-of-school Youth based on academic needs coordination with appropriate school, state, and other
federally – funded entities. To Provide services to out- of-school migrant youth.
XIX: Presidio MEP program will implement a quality control check and coordinate with Region 18 to
schedule an NGS quality control check for accurate submissions.
DMA and MS
DMA and MS
DMA and MS
MEP Staff
MEP Staff
NGS Data Specialist
MEP Staff
MEP Staff
MEP Staff
MEP Staff
MEP Staff
year
Before migrant student’s early withdrawal and/or end of the school year
Monthly from July 1 to
June 30
Monthly from July 1 to
June
Ongoing
Ongoing
Ongoing
Ongoing
Ongoing
Ongoing
Ongoing
Ongoing
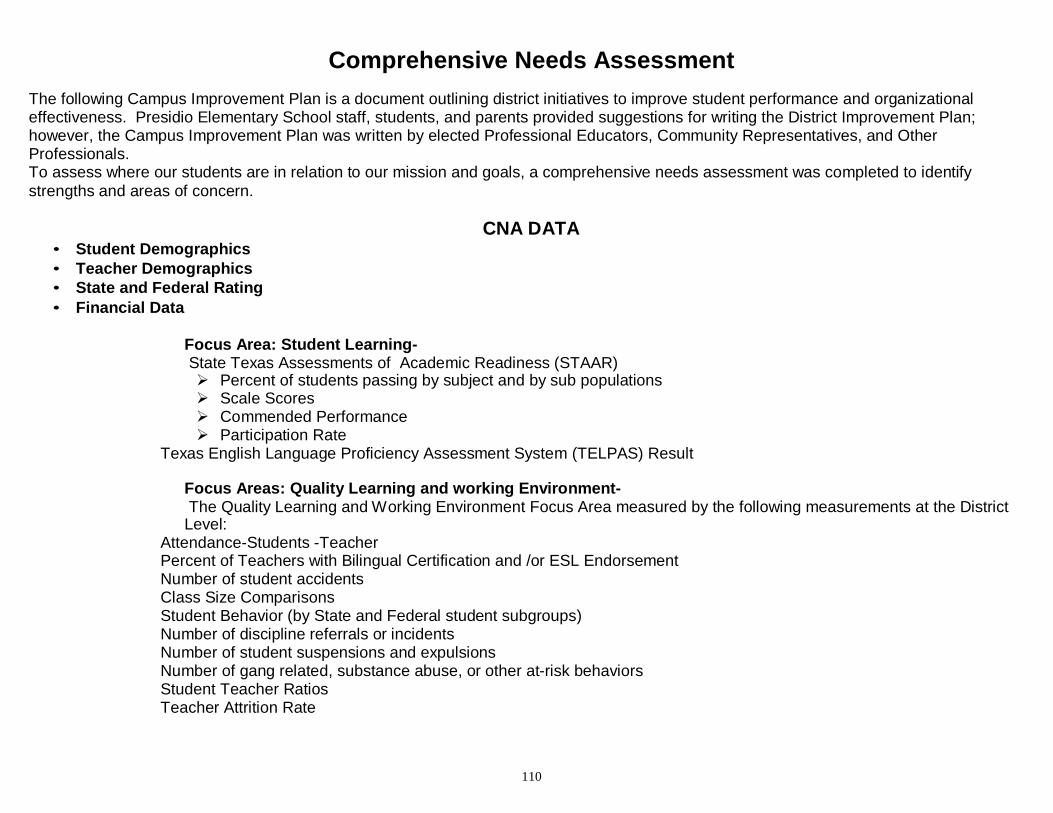
110
Comprehensive Needs Assessment
The following Campus Improvement Plan is a document outlining district initiatives to improve student performance and organizational effectiveness. Presidio Elementary School staff, students, and parents provided suggestions for writing the District Improvement Plan; however, the Campus Improvement Plan was written by elected Professional Educators, Community Representatives, and Other Professionals. To assess where our students are in relation to our mission and goals, a comprehensive needs assessment was completed to identify
strengths and areas of concern.
• Student Demographics
• Teacher Demographics
• State and Federal Rating
• Financial Data
CNA DATA
Focus Area: Student Learning-
State Texas Assessments of Academic Readiness (STAAR) Percent of students passing by subject and by sub populations Scale Scores Commended Performance Participation Rate
Texas English Language Proficiency Assessment System (TELPAS) Result
Focus Areas: Quality Learning and working Environment- The Quality Learning and Working Environment Focus Area measured by the following measurements at the District
Level: Attendance-Students -Teacher Percent of Teachers with Bilingual Certification and /or ESL Endorsement Number of student accidents Class Size Comparisons Student Behavior (by State and Federal student subgroups) Number of discipline referrals or incidents Number of student suspensions and expulsions Number of gang related, substance abuse, or other at-risk behaviors Student Teacher Ratios Teacher Attrition Rate
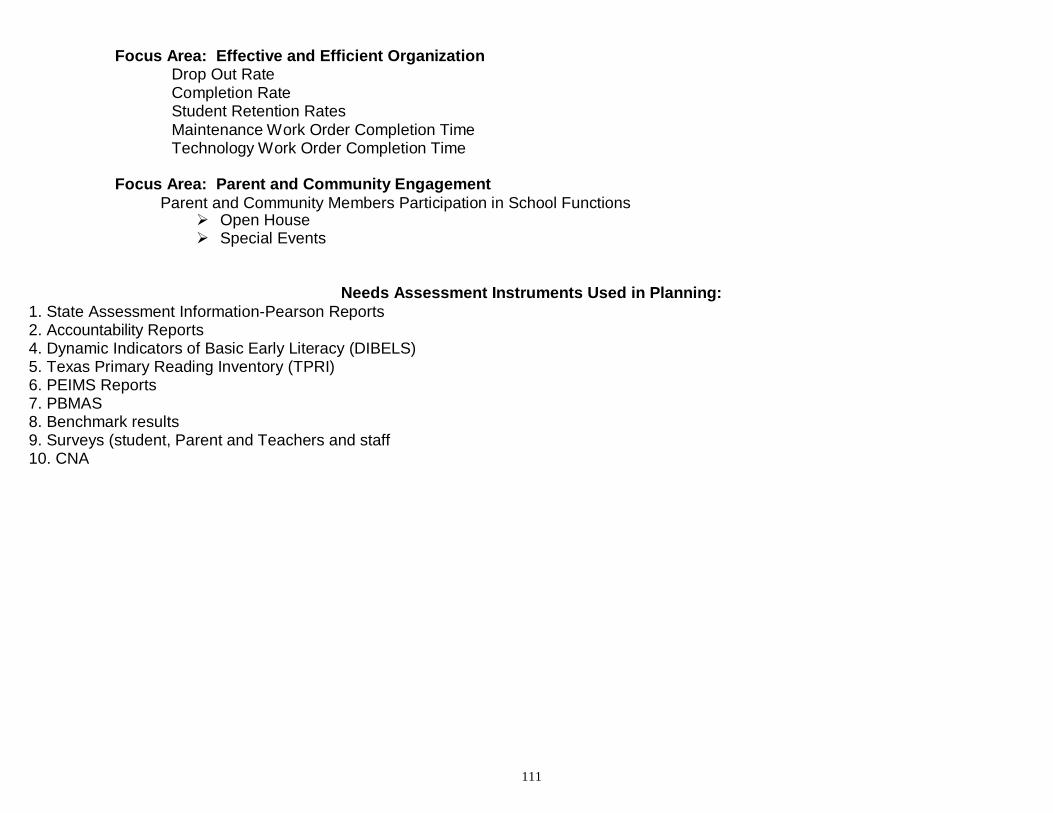
111
Focus Area: Effective and Efficient Organization Drop Out Rate Completion Rate Student Retention Rates Maintenance Work Order Completion Time Technology Work Order Completion Time
Focus Area: Parent and Community Engagement
Parent and Community Members Participation in School Functions Open House Special Events
Needs Assessment Instruments Used in Planning:
1. State Assessment Information-Pearson Reports 2. Accountability Reports 4. Dynamic Indicators of Basic Early Literacy (DIBELS) 5. Texas Primary Reading Inventory (TPRI) 6. PEIMS Reports 7. PBMAS 8. Benchmark results 9. Surveys (student, Parent and Teachers and staff 10. CNA
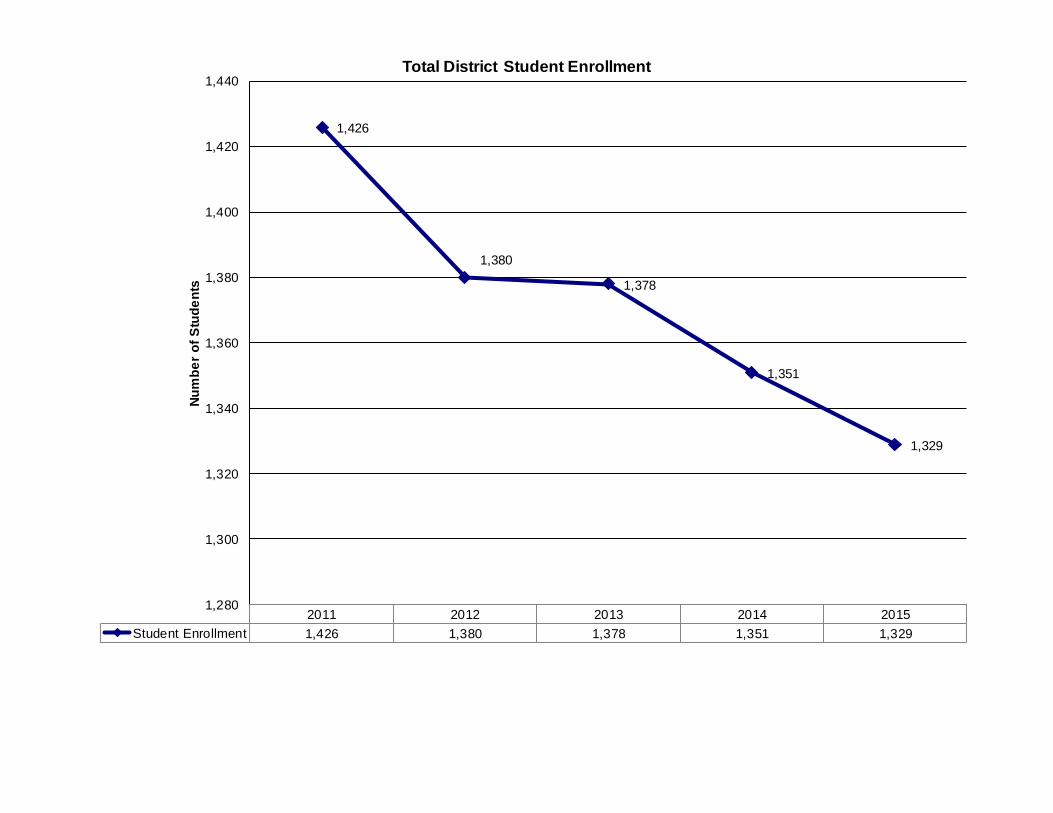
2011 2012 2013 2014 2015
Student Enrollment 1,426 1,380 1,378 1,351 1,329
1,426
1,380
1,378
1,351
1,329
1,280
1,300
1,320
1,340
1,360
1,380
1,400
1,420
1,440
Nu
mb
er
of
Stu
de
nts
Total District Student Enrollment
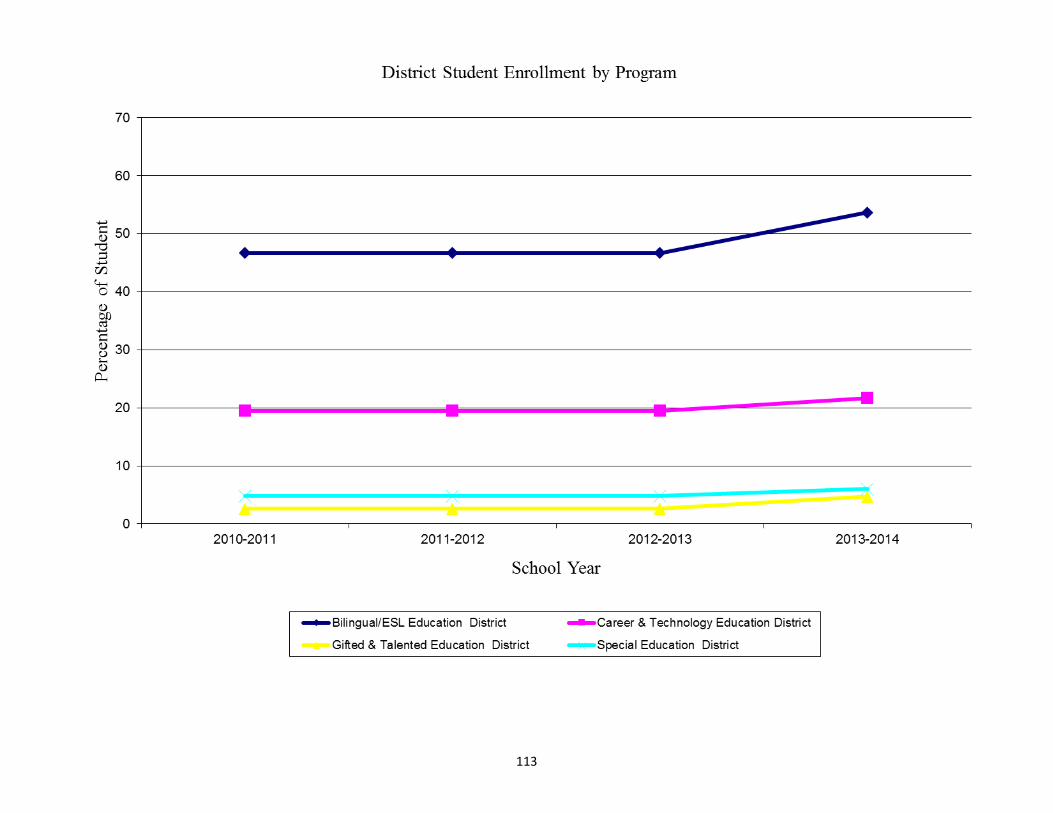
113
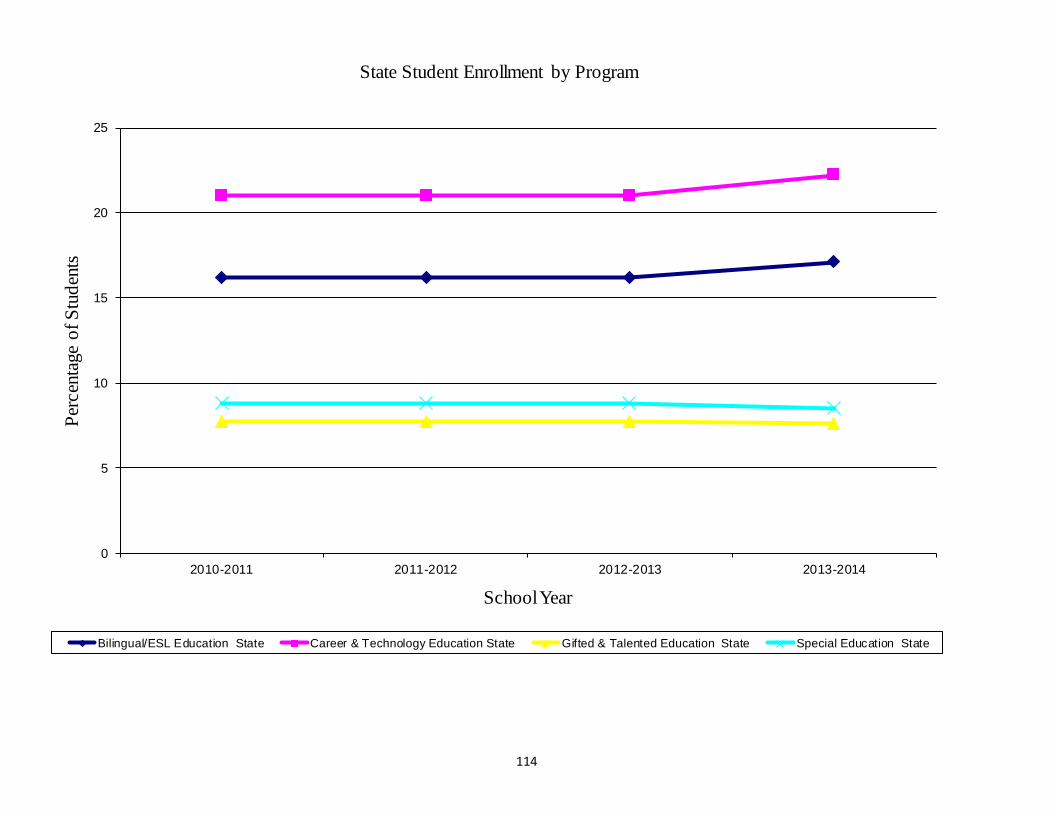
114
0
5
10
15
20
25
2010-2011 2011-2012 2012-2013 2013-2014
Per
cen
tage
of
Stu
den
ts
School Year
State Student Enrollment by Program
Bilingual/ESL Education State Career & Technology Education State Gifted & Talented Education State Special Education State
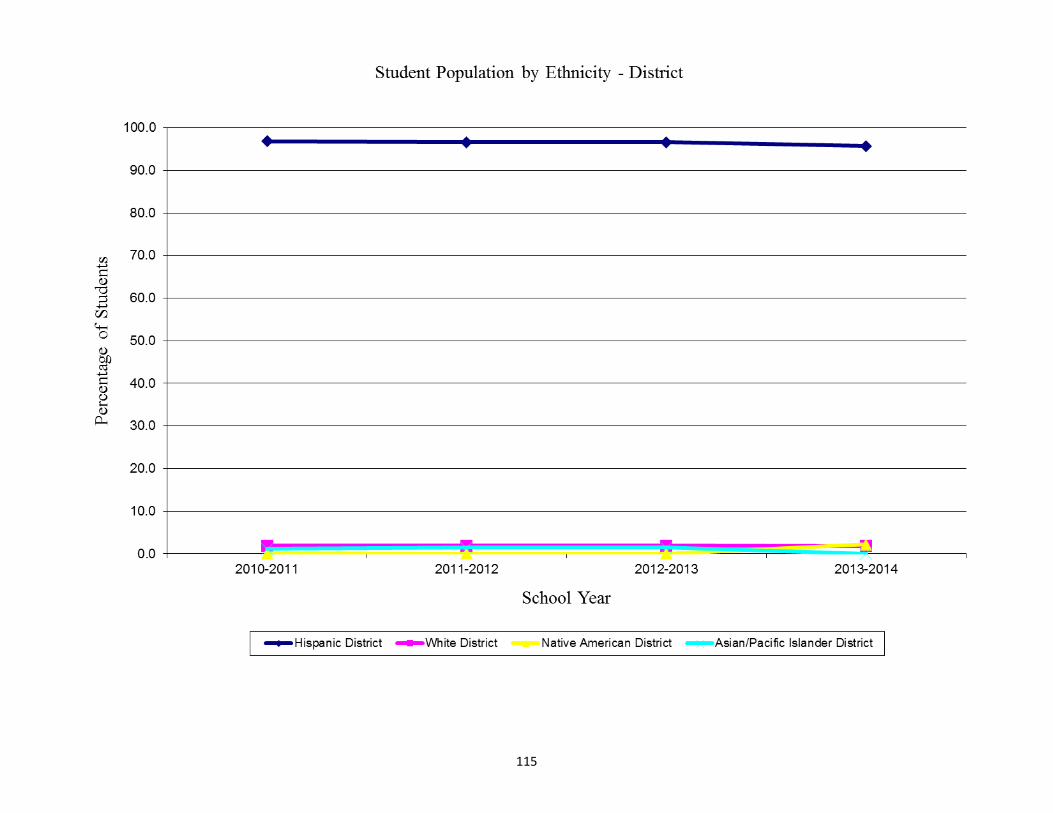
115
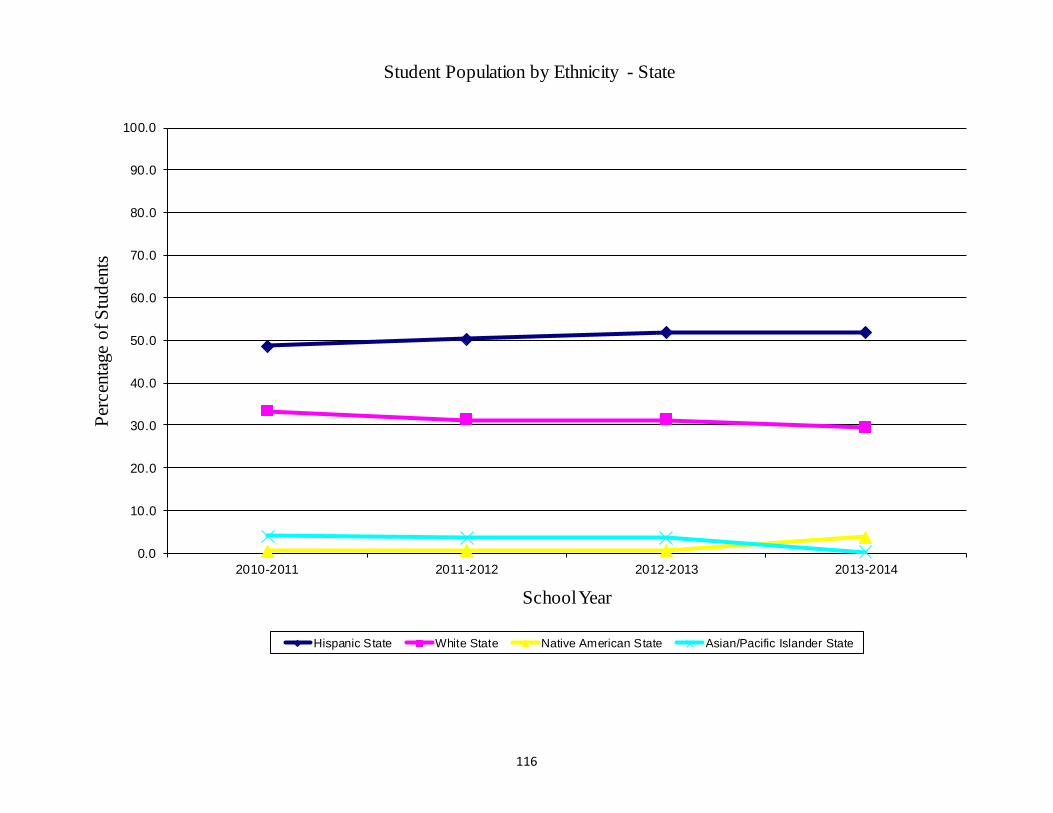
116
0.0
10.0
20.0
30.0
40.0
50.0
60.0
70.0
80.0
90.0
100.0
2010-2011 2011-2012 2012-2013 2013-2014
Per
cen
tage
of
Stu
den
ts
School Year
Student Population by Ethnicity - State
Hispanic State White State Native American State Asian/Pacific Islander State

117
0.0
10.0
20.0
30.0
40.0
50.0
60.0
70.0
80.0
90.0
100.0
2010-2011 2011-2012 2012-2013 2013-2014
Per
cen
tage
of
Stu
den
ta
School Year
Student Population by Federal and State Subgroups - District
Economically Disadvantaged District ELL District At-Risk District
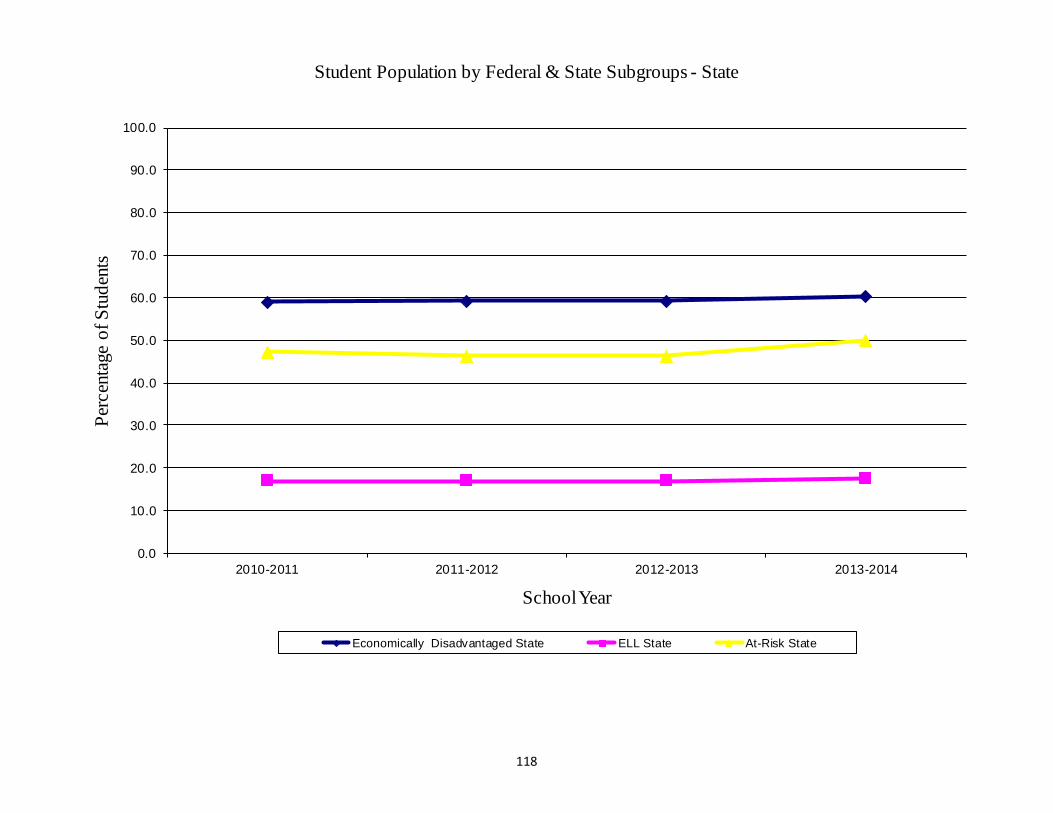
118
0.0
10.0
20.0
30.0
40.0
50.0
60.0
70.0
80.0
90.0
100.0
2010-2011 2011-2012 2012-2013 2013-2014
Per
cen
tage
of
Stu
den
ts
School Year
Student Population by Federal & State Subgroups - State
Economically Disadvantaged State ELL State At-Risk State
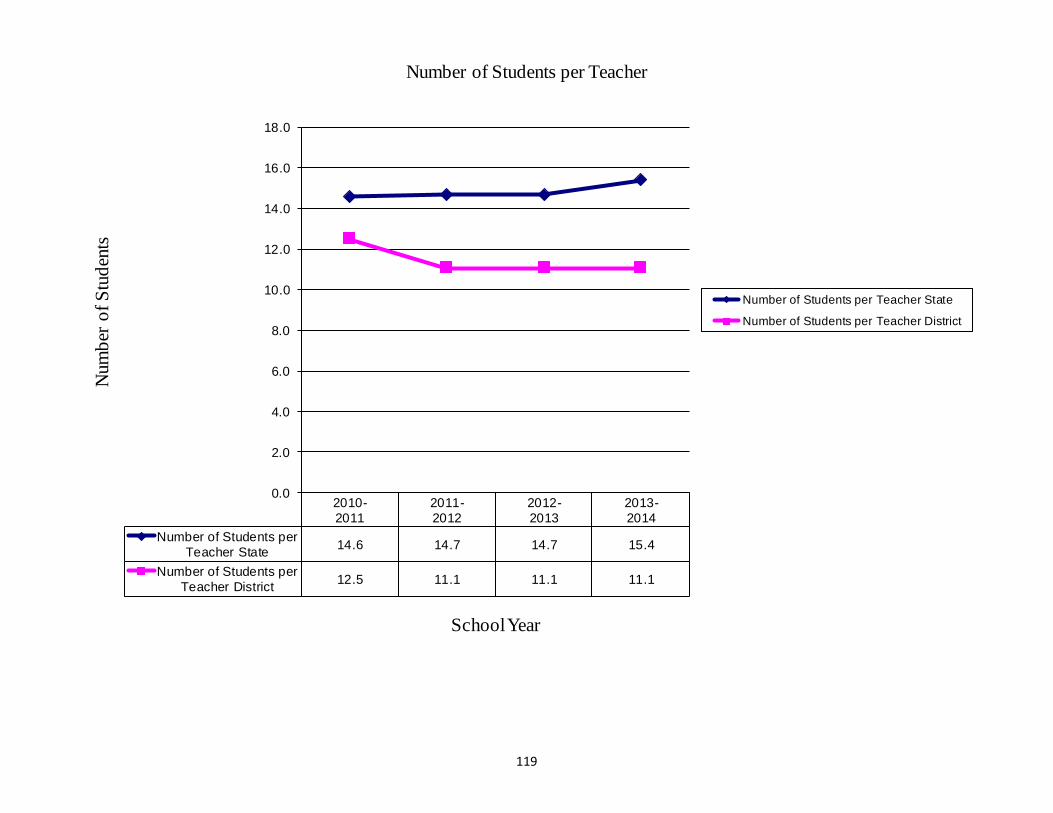
119
2010-
2011
2011-
2012
2012-
2013
2013-
2014
Number of Students per
Teacher State14.6 14.7 14.7 15.4
Number of Students per
Teacher District12.5 11.1 11.1 11.1
0.0
2.0
4.0
6.0
8.0
10.0
12.0
14.0
16.0
18.0
Num
ber
of
Stu
den
ts
School Year
Number of Students per Teacher
Number of Students per Teacher State
Number of Students per Teacher District
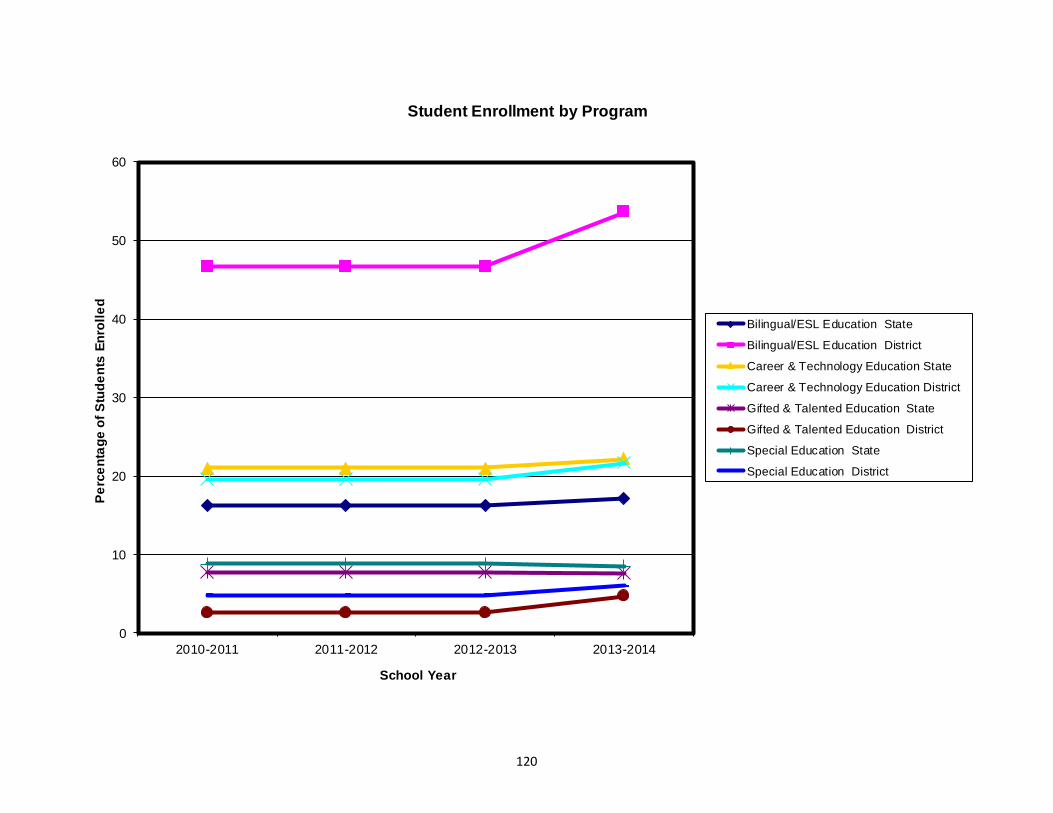
120
0
10
20
30
40
50
60
2010-2011 2011-2012 2012-2013 2013-2014
Pe
rce
nta
ge
of
Stu
de
nts
En
roll
ed
School Year
Student Enrollment by Program
Bilingual/ESL Education State
Bilingual/ESL Education District
Career & Technology Education State
Career & Technology Education District
Gifted & Talented Education State
Gifted & Talented Education District
Special Education State
Special Education District
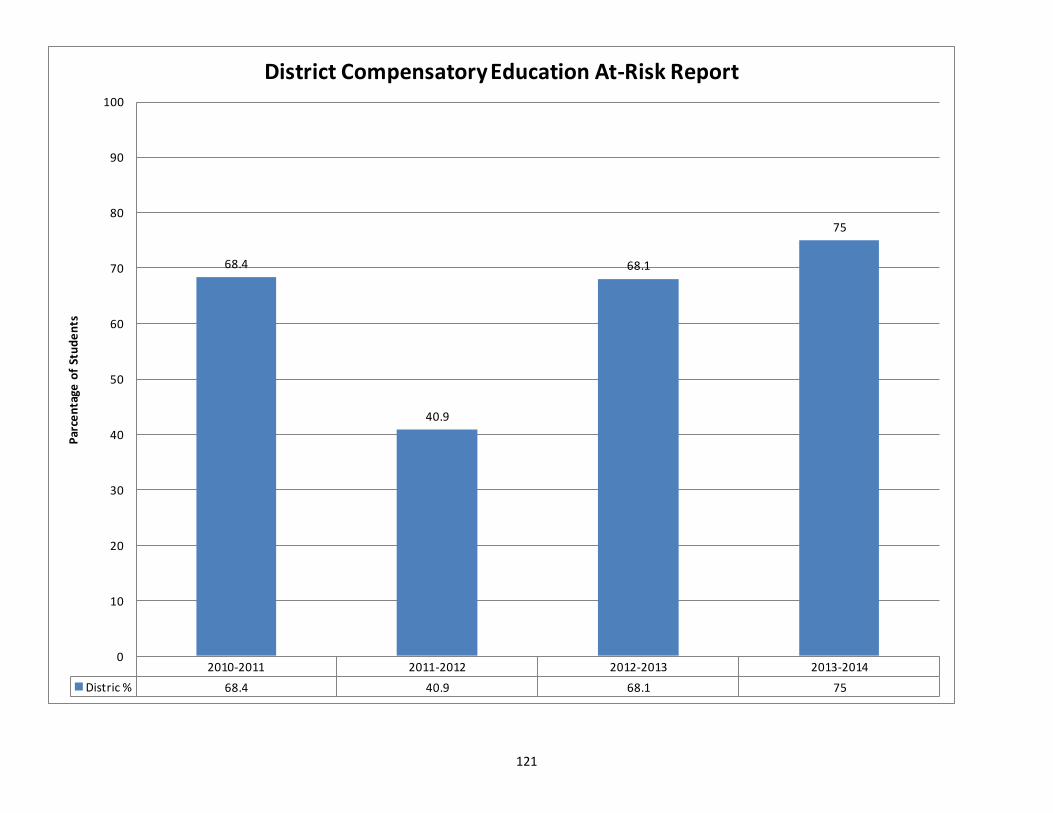
121
2010-2011 2011-2012 2012-2013 2013-2014
Distric % 68.4 40.9 68.1 75
68.4
40.9
68.1
75
0
10
20
30
40
50
60
70
80
90
100
Par
cen
tage
of
Stu
de
nts
District Compensatory Education At-Risk Report
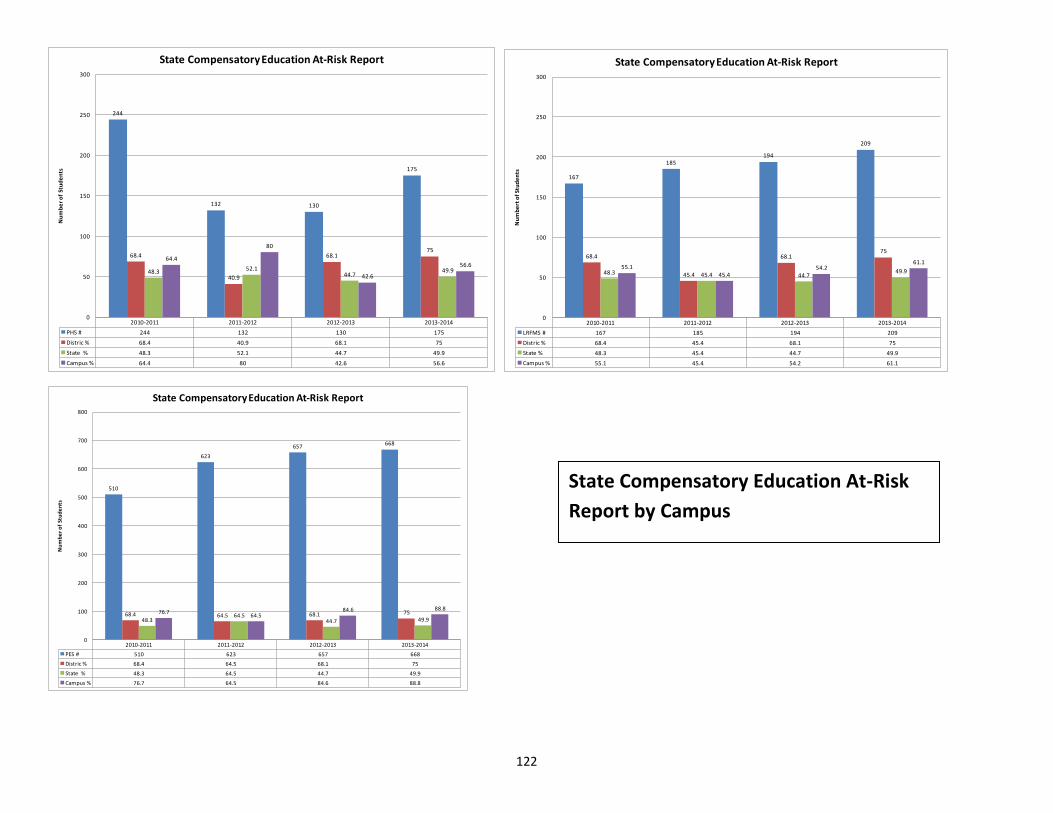
122
2010-2011 2011-2012 2012-2013 2013-2014
PHS # 244 132 130 175
Distric % 68.4 40.9 68.1 75
State % 48.3 52.1 44.7 49.9
Campus % 64.4 80 42.6 56.6
244
132 130
175
68.4
40.9
68.175
48.3 52.144.7
49.9
64.4
80
42.6
56.6
0
50
100
150
200
250
300
Nu
mb
er
of
Stu
de
nts
State Compensatory Education At-Risk Report
2010-2011 2011-2012 2012-2013 2013-2014
LRFMS # 167 185 194 209
Distric % 68.4 45.4 68.1 75
State % 48.3 45.4 44.7 49.9
Campus % 55.1 45.4 54.2 61.1
167
185194
209
68.4
45.4
68.175
48.3 45.4 44.749.9
55.145.4
54.261.1
0
50
100
150
200
250
300
Nu
mb
ert
of
Stu
de
nts
State Compensatory Education At-Risk Report
2010-2011 2011-2012 2012-2013 2013-2014
PES # 510 623 657 668
Distric % 68.4 64.5 68.1 75
State % 48.3 64.5 44.7 49.9
Campus % 76.7 64.5 84.6 88.8
510
623
657668
68.4 64.5 68.1 75
48.364.5
44.7 49.9
76.764.5
84.6 88.8
0
100
200
300
400
500
600
700
800
Nu
mb
er
of
Stu
de
nts
State Compensatory Education At-Risk Report
State Compensatory Education At-Risk
Report by Campus
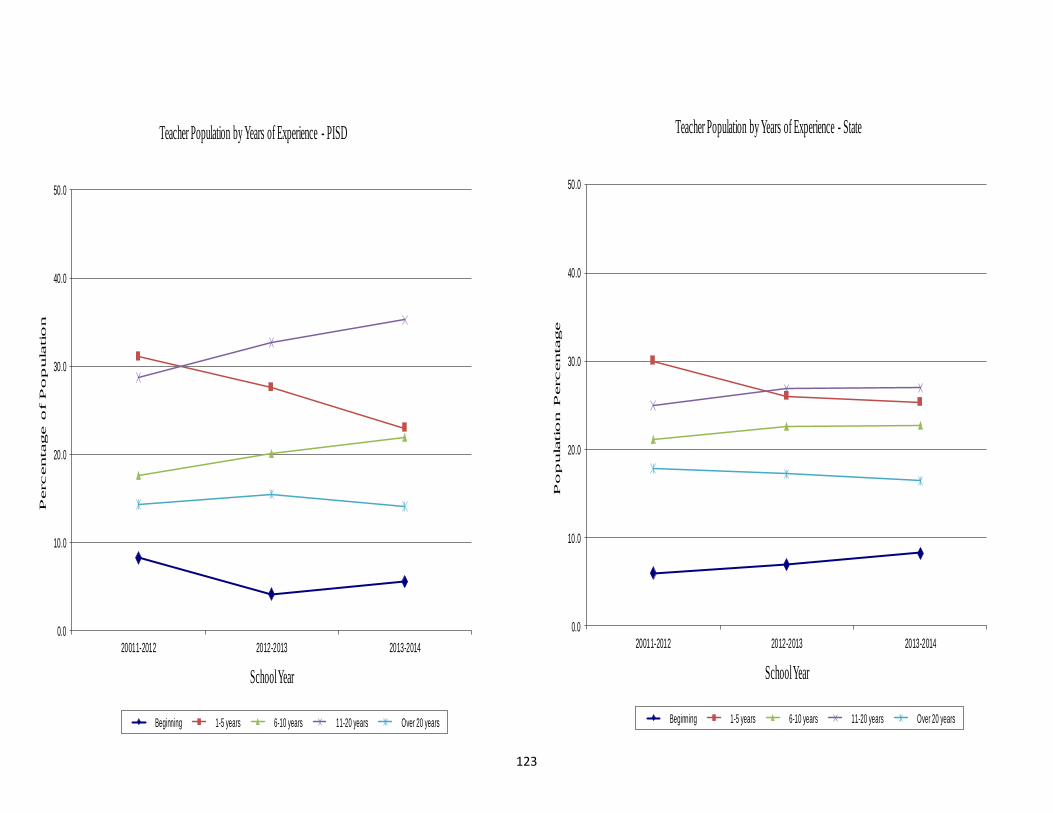
123
0.0
10.0
20.0
30.0
40.0
50.0
20011-2012 2012-2013 2013-2014
Percentage o
f P
op
ula
tio
n
School Year
Teacher Population by Years of Experience - PISD
Beginning 1-5 years 6-10 years 11-20 years Over 20 years
0.0
10.0
20.0
30.0
40.0
50.0
20011-2012 2012-2013 2013-2014
Po
pula
tio
n P
ercentage
School Year
Teacher Population by Years of Experience - State
Beginning 1-5 years 6-10 years 11-20 years Over 20 years
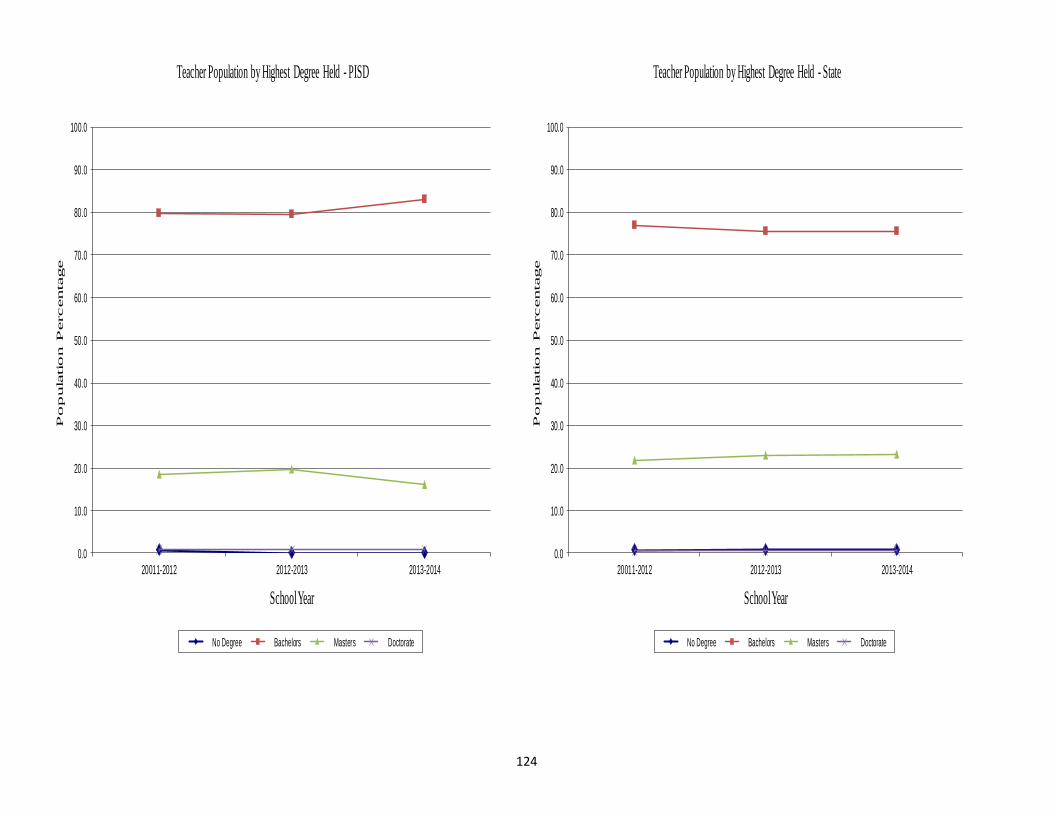
124
0.0
10.0
20.0
30.0
40.0
50.0
60.0
70.0
80.0
90.0
100.0
20011-2012 2012-2013 2013-2014
Po
pula
tio
n P
ercentage
School Year
Teacher Population by Highest Degree Held - PISD
No Degree Bachelors Masters Doctorate
0.0
10.0
20.0
30.0
40.0
50.0
60.0
70.0
80.0
90.0
100.0
20011-2012 2012-2013 2013-2014
Po
pula
tio
n P
ercentage
School Year
Teacher Population by Highest Degree Held - State
No Degree Bachelors Masters Doctorate
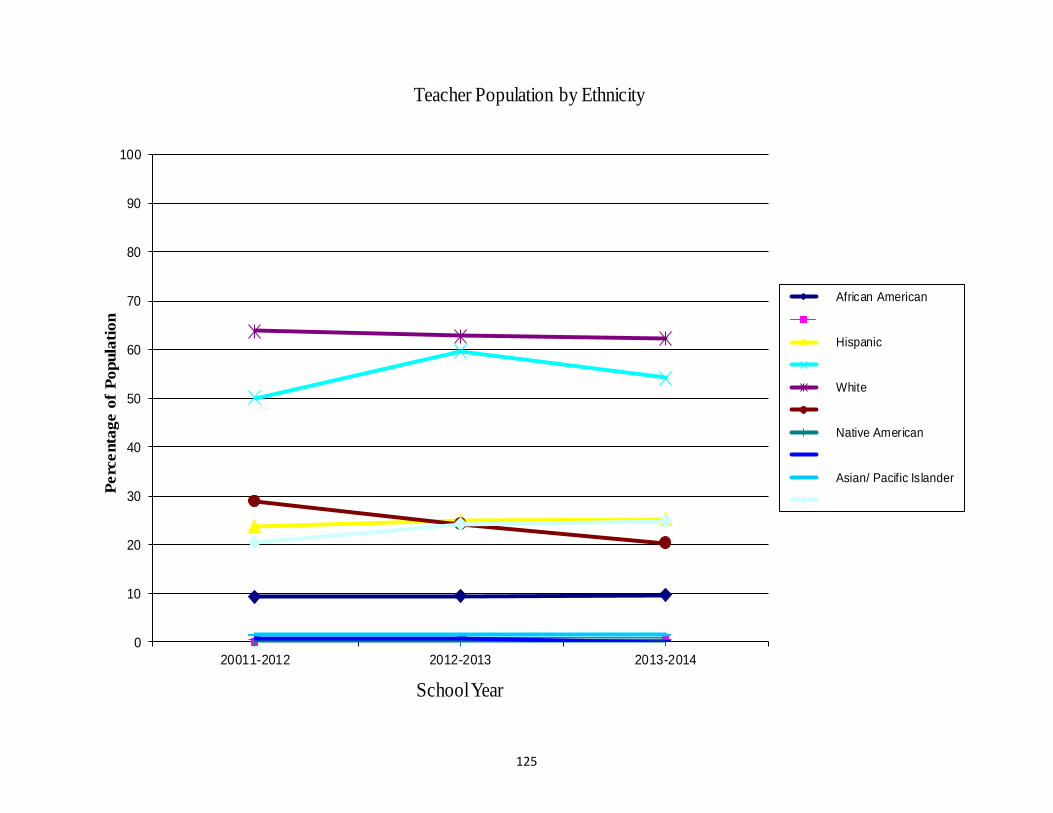
125
0
10
20
30
40
50
60
70
80
90
100
20011-2012 2012-2013 2013-2014
Pe
rce
nta
ge
of
Po
pu
lati
on
School Year
Teacher Population by Ethnicity
African American
Hispanic
White
Native American
Asian/ Pacific Islander
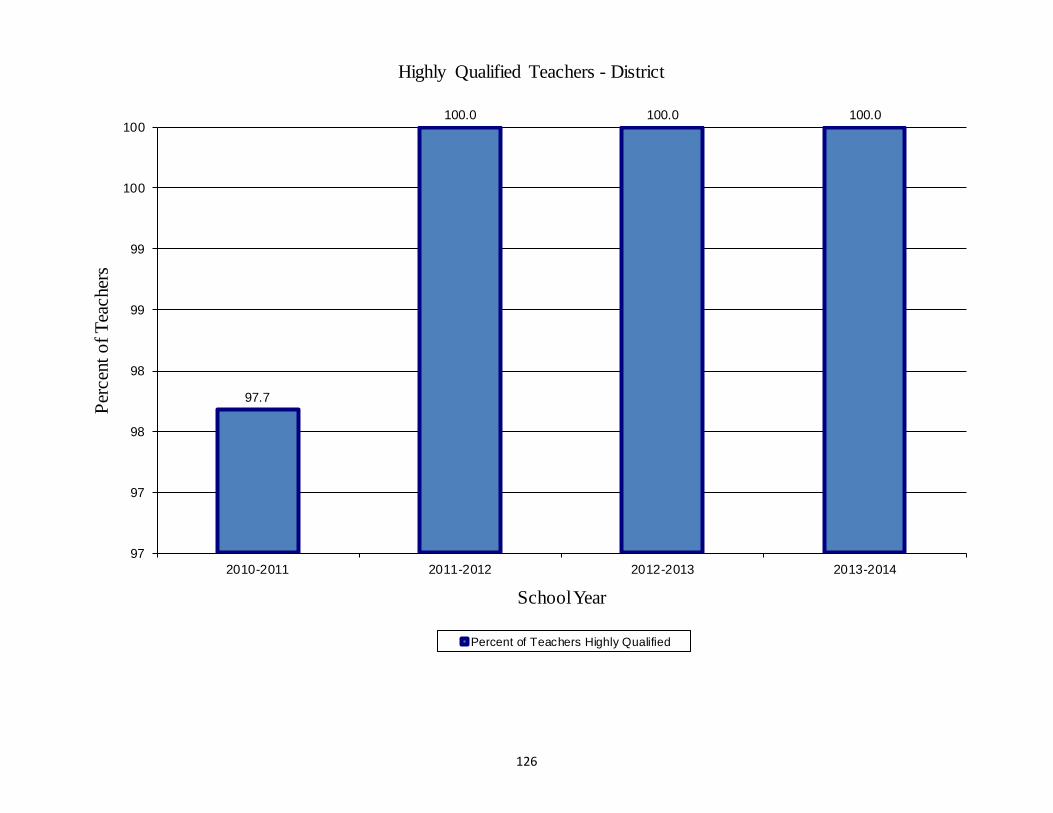
126
97.7
100.0 100.0 100.0
97
97
98
98
99
99
100
100
2010-2011 2011-2012 2012-2013 2013-2014
Per
cen
t o
f T
eacher
s
School Year
Highly Qualified Teachers - District
Percent of Teachers Highly Qualified
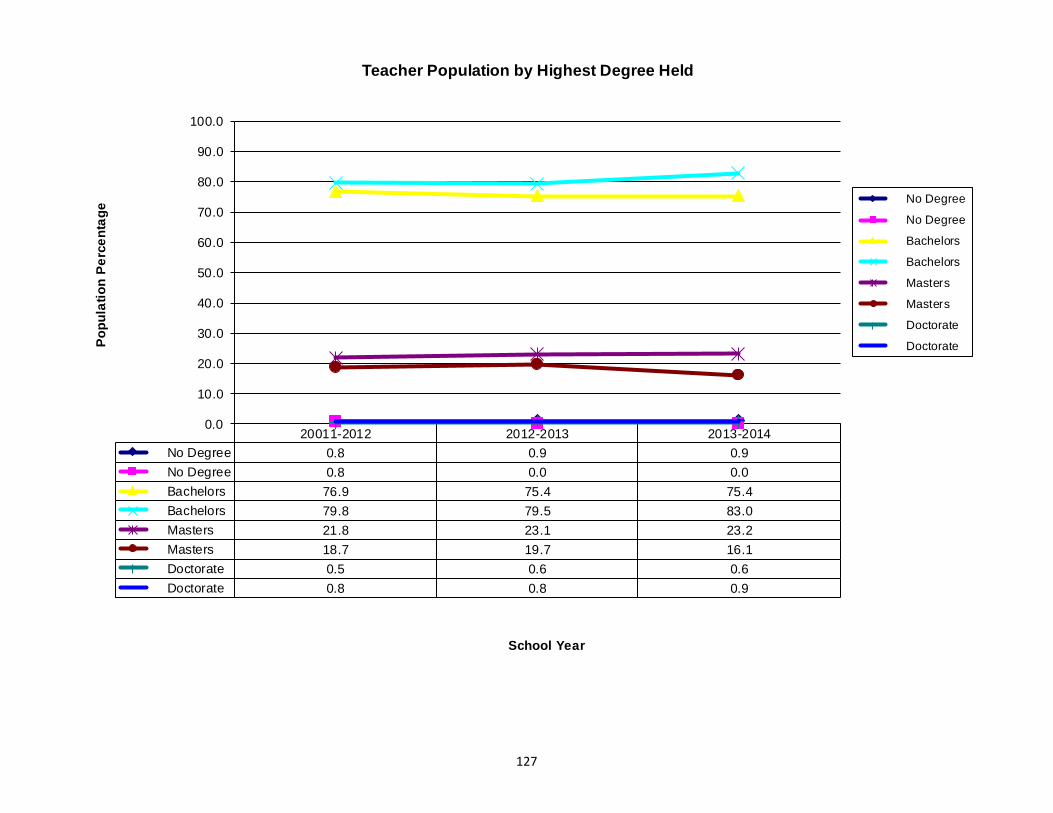
127
20011-2012 2012-2013 2013-2014
No Degree 0.8 0.9 0.9
No Degree 0.8 0.0 0.0
Bachelors 76.9 75.4 75.4
Bachelors 79.8 79.5 83.0
Masters 21.8 23.1 23.2
Masters 18.7 19.7 16.1
Doctorate 0.5 0.6 0.6
Doctorate 0.8 0.8 0.9
0.0
10.0
20.0
30.0
40.0
50.0
60.0
70.0
80.0
90.0
100.0
Po
pu
lati
on
Pe
rce
nta
ge
School Year
Teacher Population by Highest Degree Held
No Degree
No Degree
Bachelors
Bachelors
Masters
Masters
Doctorate
Doctorate
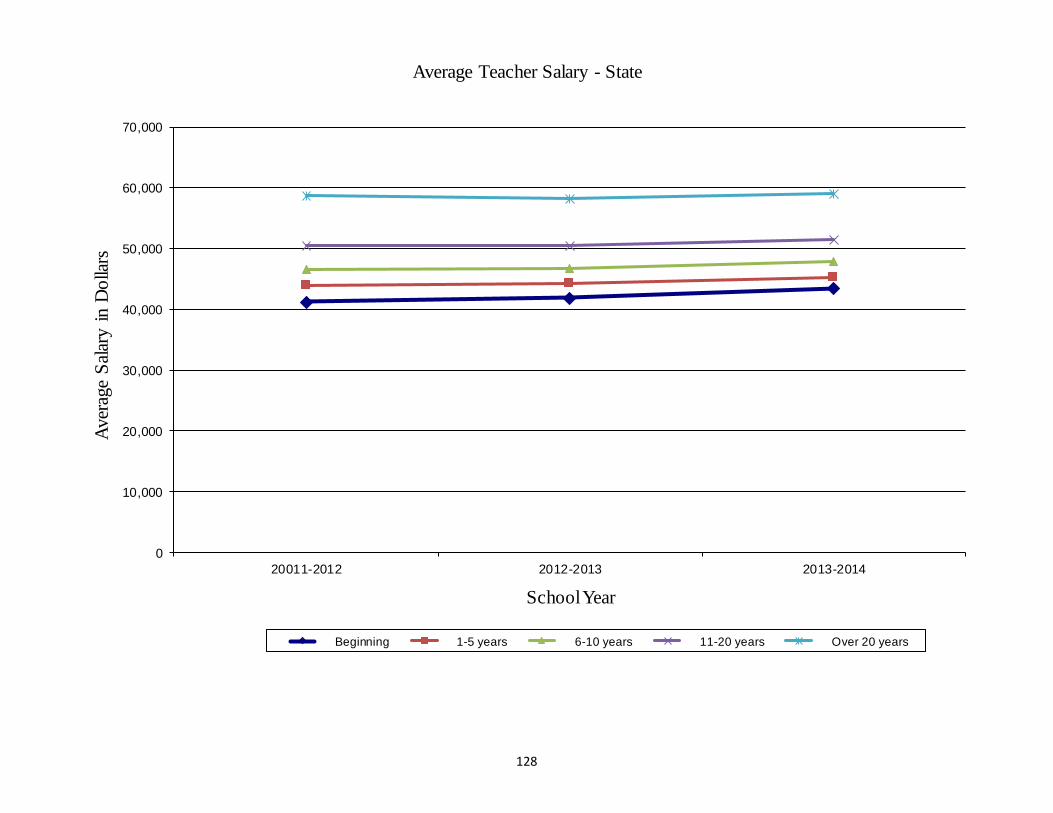
128
0
10,000
20,000
30,000
40,000
50,000
60,000
70,000
20011-2012 2012-2013 2013-2014
Aver
age
Sal
ary i
n D
olla
rs
School Year
Average Teacher Salary - State
Beginning 1-5 years 6-10 years 11-20 years Over 20 years
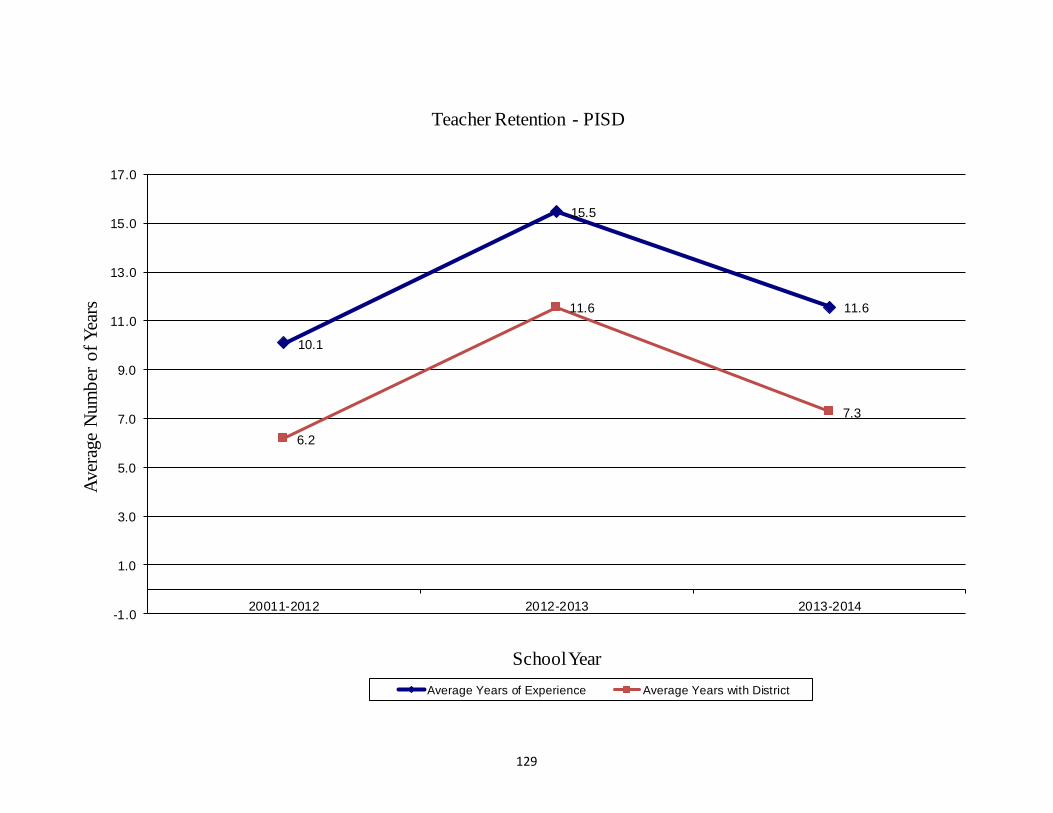
129
10.1
15.5
11.6
6.2
11.6
7.3
-1.0
1.0
3.0
5.0
7.0
9.0
11.0
13.0
15.0
17.0
20011-2012 2012-2013 2013-2014
Aver
age
Num
ber
of
Yea
rs
School Year
Teacher Retention - PISD
Average Years of Experience Average Years with District
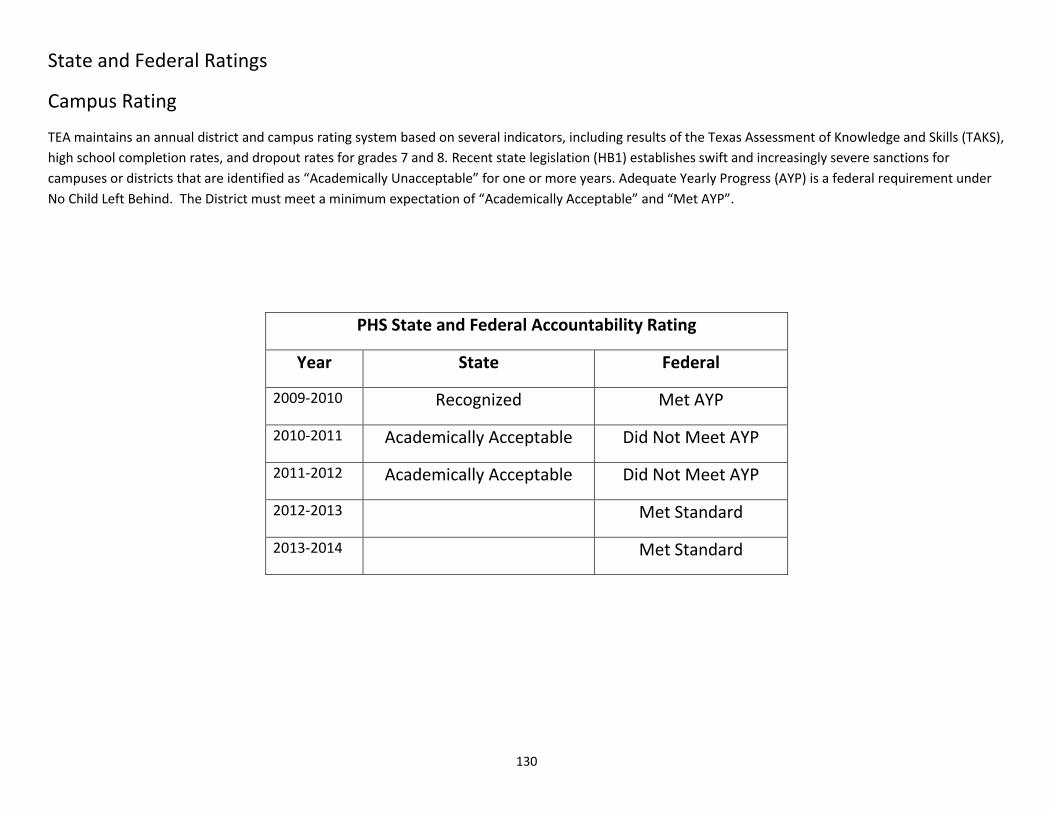
130
State and Federal Ratings
Campus Rating
TEA maintains an annual district and campus rating system based on several indicators, including results of the Texas Assessment of Knowledge and Skills (TAKS),
high school completion rates, and dropout rates for grades 7 and 8. Recent state legislation (HB1) establishes swift and increasingly severe sanctions for
campuses or districts that are identified as “Academically Unacceptable” for one or more years. Adequate Yearly Progress (AYP) is a federal requirement under
No Child Left Behind. The District must meet a minimum expectation of “Academically Acceptable” and “Met AYP”.
PHS State and Federal Accountability Rating
Year State Federal
2009-2010 Recognized Met AYP
2010-2011 Academically Acceptable Did Not Meet AYP
2011-2012 Academically Acceptable Did Not Meet AYP
2012-2013 Met Standard
2013-2014 Met Standard
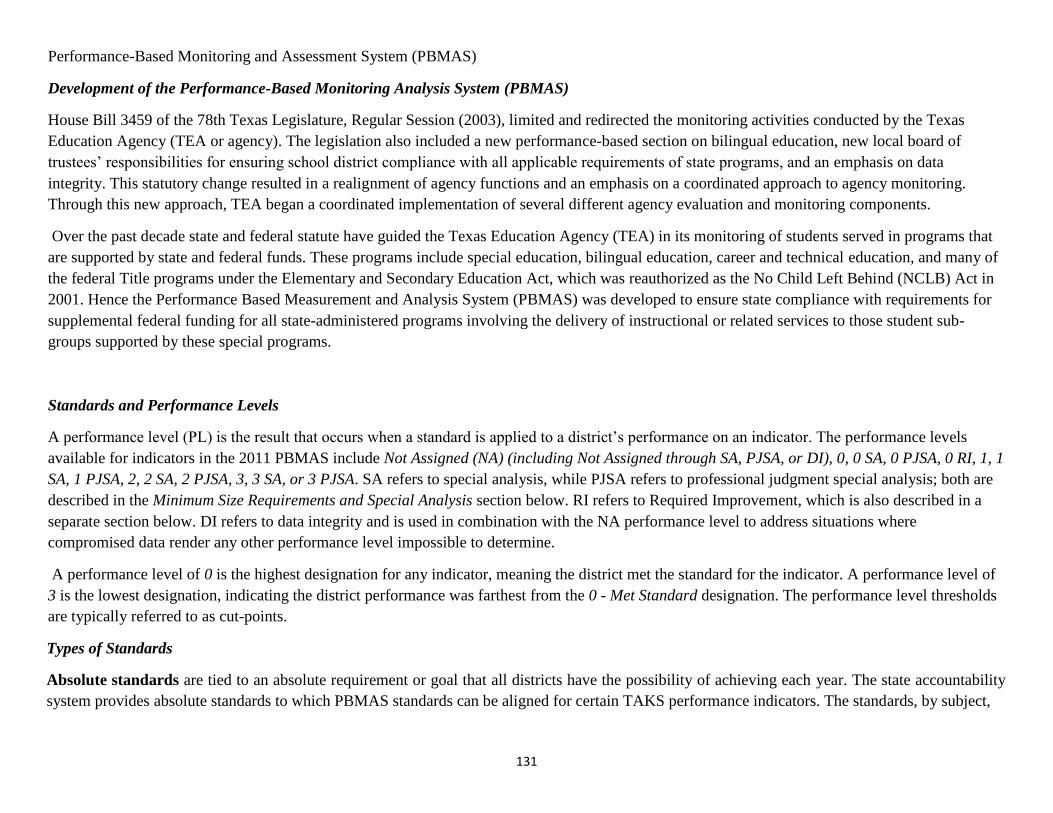
131
Performance-Based Monitoring and Assessment System (PBMAS)
Development of the Performance-Based Monitoring Analysis System (PBMAS)
House Bill 3459 of the 78th Texas Legislature, Regular Session (2003), limited and redirected the monitoring activities conducted by the Texas
Education Agency (TEA or agency). The legislation also included a new performance-based section on bilingual education, new local board of
trustees’ responsibilities for ensuring school district compliance with all applicable requirements of state programs, and an emphasis on data
integrity. This statutory change resulted in a realignment of agency functions and an emphasis on a coordinated approach to agency monitoring.
Through this new approach, TEA began a coordinated implementation of several different agency evaluation and monitoring components.
Over the past decade state and federal statute have guided the Texas Education Agency (TEA) in its monitoring of students served in programs that
are supported by state and federal funds. These programs include special education, bilingual education, career and technical education, and many of
the federal Title programs under the Elementary and Secondary Education Act, which was reauthorized as the No Child Left Behind (NCLB) Act in
2001. Hence the Performance Based Measurement and Analysis System (PBMAS) was developed to ensure state compliance with requirements for
supplemental federal funding for all state-administered programs involving the delivery of instructional or related services to those student sub-
groups supported by these special programs.
Standards and Performance Levels
A performance level (PL) is the result that occurs when a standard is applied to a district’s performance on an indicator. The performance levels
available for indicators in the 2011 PBMAS include Not Assigned (NA) (including Not Assigned through SA, PJSA, or DI), 0, 0 SA, 0 PJSA, 0 RI, 1, 1
SA, 1 PJSA, 2, 2 SA, 2 PJSA, 3, 3 SA, or 3 PJSA. SA refers to special analysis, while PJSA refers to professional judgment special analysis; both are
described in the Minimum Size Requirements and Special Analysis section below. RI refers to Required Improvement, which is also described in a
separate section below. DI refers to data integrity and is used in combination with the NA performance level to address situations where
compromised data render any other performance level impossible to determine.
A performance level of 0 is the highest designation for any indicator, meaning the district met the standard for the indicator. A performance level of
3 is the lowest designation, indicating the district performance was farthest from the 0 - Met Standard designation. The performance level thresholds
are typically referred to as cut-points.
Types of Standards
Absolute standards are tied to an absolute requirement or goal that all districts have the possibility of achieving each year. The state accountability
system provides absolute standards to which PBMAS standards can be aligned for certain TAKS performance indicators. The standards, by subject,
132
PBMAS District Performance
State District
2012 68 48
2013 50 43
2014 62 40
68
4850
43
62
40
0
10
20
30
40
50
60
70
80
90
100
PB
MA
S P
assi
ng
Rat
e
PBMAS Career &Technical Education LEP TAKS Passing Rate-Reading/ELA
State District
2012 63 61
2013 70 75
2014 69 65
6361
70
75
69
65
0
10
20
30
40
50
60
70
80
90
100
PB
MA
S P
ass
ing R
ate
PBMAS Special Education TAKS Passing Rate -Mathematics
State District
2012 63 61
2013 70 75
2014 69 65
6361
70
75
69
65
0
10
20
30
40
50
60
70
80
90
100
PB
MA
S P
ass
ing R
ate
PBMAS Special Education TAKS Passing Rate -Mathematics
State District
2012 68 42
2013 50 45
2014 62 41
68
42
50
45
62
41
0
10
20
30
40
50
60
70
80
90
100
PB
MA
S P
ass
ing R
ate
PBMAS Billingual Education English TAKS Passing-Science
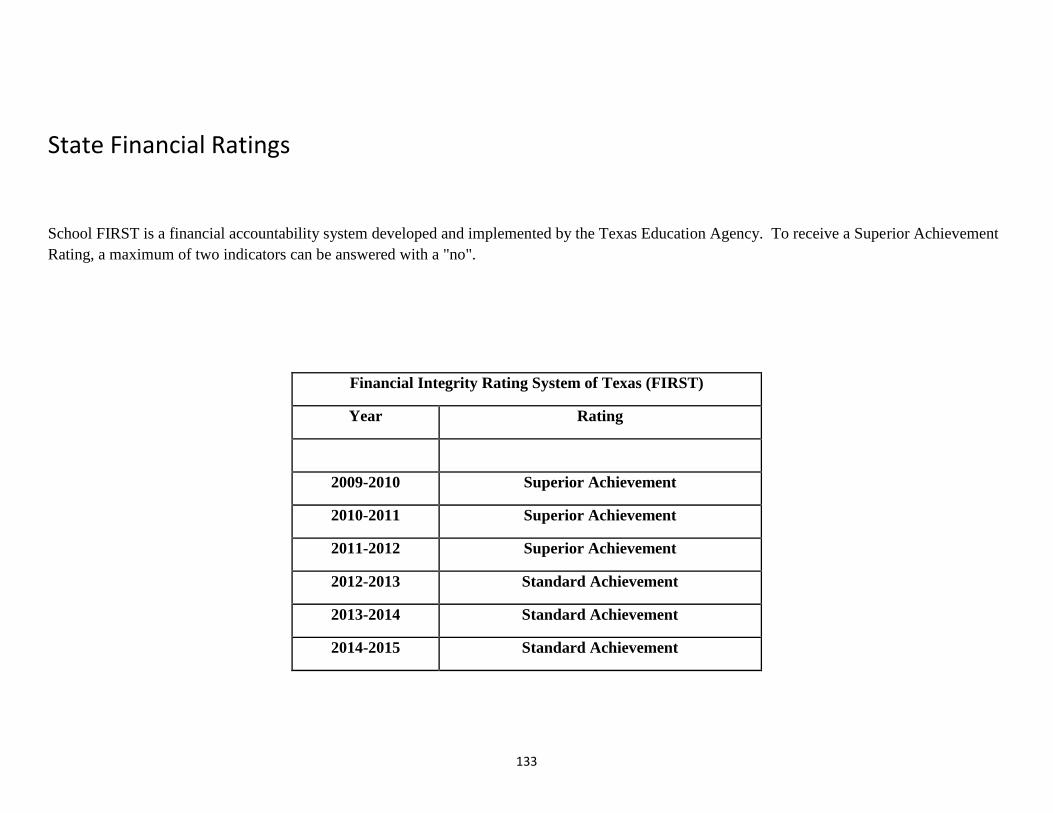
133
State Financial Ratings
School FIRST is a financial accountability system developed and implemented by the Texas Education Agency. To receive a Superior Achievement
Rating, a maximum of two indicators can be answered with a "no".
Financial Integrity Rating System of Texas (FIRST)
Year Rating
2009-2010 Superior Achievement
2010-2011 Superior Achievement
2011-2012 Superior Achievement
2012-2013 Standard Achievement
2013-2014 Standard Achievement
2014-2015 Standard Achievement
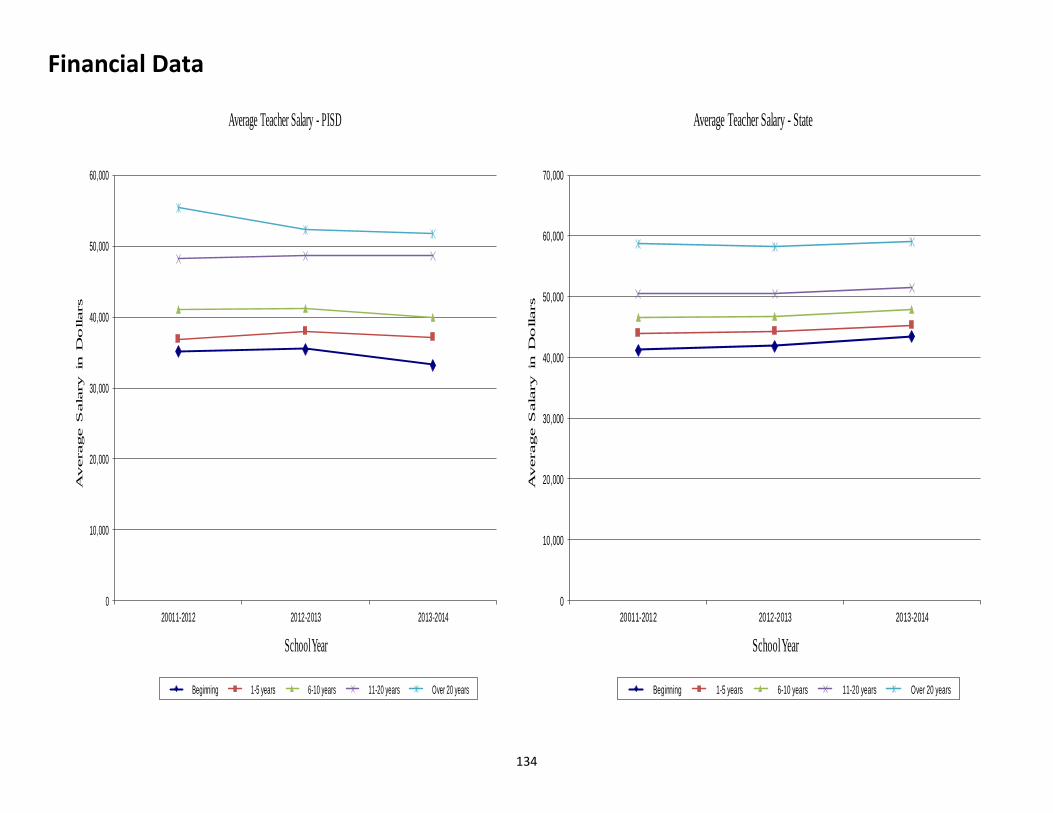
134
Financial Data
0
10,000
20,000
30,000
40,000
50,000
60,000
20011-2012 2012-2013 2013-2014
Average S
ala
ry in
D
ollars
School Year
Average Teacher Salary - PISD
Beginning 1-5 years 6-10 years 11-20 years Over 20 years
0
10,000
20,000
30,000
40,000
50,000
60,000
70,000
20011-2012 2012-2013 2013-2014
Average S
ala
ry in
D
ollars
School Year
Average Teacher Salary - State
Beginning 1-5 years 6-10 years 11-20 years Over 20 years
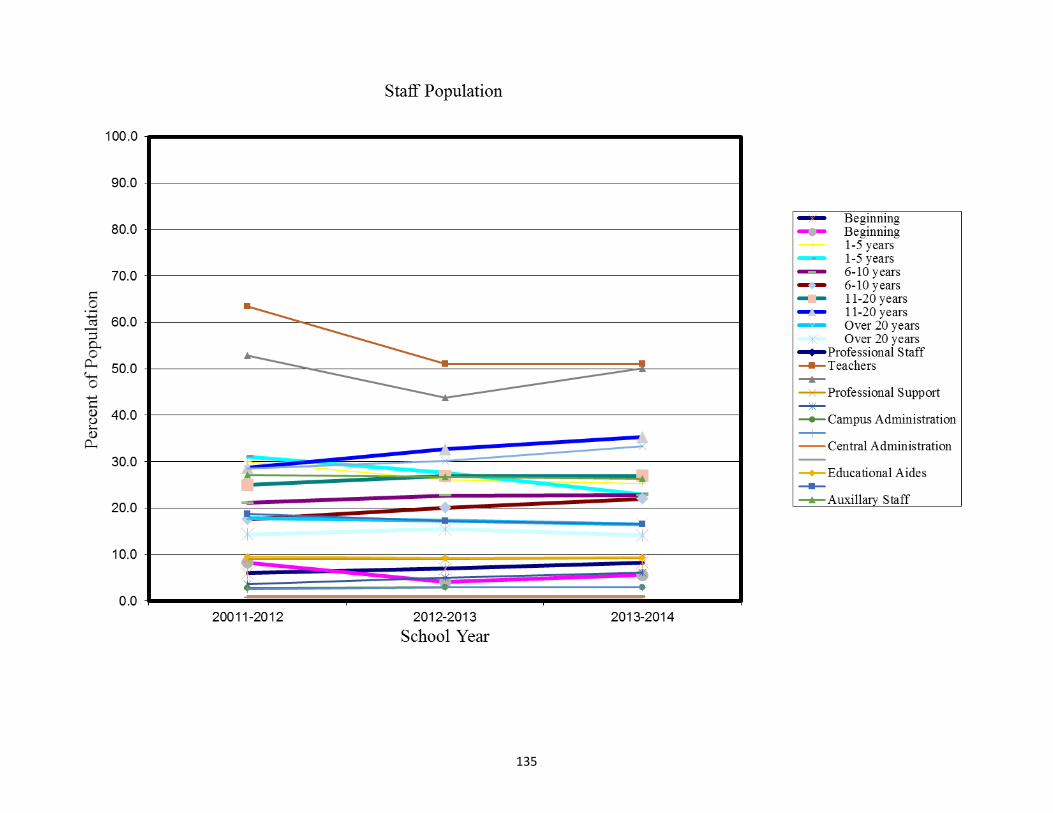
135
136
State District Hispanic White AsianTwo or more
RaceSpecial Education
Economically
Disadvantaged
2012 78 75 74 73 74
2013 81 55 50 48
2014 76 72 70 72
7875 74 73 74
81
55
5048
76
7270
72
0
10
20
30
40
50
60
70
80
90
100
Pe
rce
nta
ge
of S
tu
de
nts
3rd Grade STAAR Reading Results 2012-2014
State District Hispanic White AsianTwo or more
Race
Special
Education
Economically
Disadvantaged
2012 69 69 68 55 67
2013 70 61 57 55
2014 71 65 62 66
69 69 68
55
6770
61
5755
71
6562
66
0
10
20
30
40
50
60
70
80
90
100
Pe
rce
nta
ge
of S
tu
de
nts
3rd Grade STAAR Math Results 2012- 2014
STAAR Percent at Phase-in 1 Level II or Above 3rd grade
137
State District Hispanic White AsianTwo or more
RaceSpecial Education
Economically
Disadvantaged
2012 73 77 78 38 77
2013 72 73 73 75 71
2014 71 70 69 72
73
77 78
38
77
72 73 7375
7171 70 6972
0
10
20
30
40
50
60
70
80
90
100
Pe
rce
nta
ge
of S
tu
de
nts
4th Grade STAAR Reading
2012-2014
State District Hispanic White AsianTwo or more
Race
Special
Education
Economically
Disadvantaged
2012 54 69 64 54 65
2013 69 54 53 58 53
2014 71 41 38 39
54
69
64
54
65
69
54 53
58
53
71
4138 39
0
10
20
30
40
50
60
70
80
90
100
Pe
rce
nta
ge
of S
tu
de
nts
4th Grade STAAR Math 2012-2014
138
State District Hispanic White AsianTwo or more
Race
Special
Education
Economically
Disadvantaged
2012 72 73 72 93 73
2013 70 66 65 75 64
2014 73 66 64 62
72 73 72
93
7370
66 65
75
64
73
6664
62
0
10
20
30
40
50
60
70
80
90
100
Pe
rce
nta
ge o
f St
ud
en
ts
4th Grade STAAR Writing 2012-2014
STAAR Percent at Phase-1 Level II or Above 4th Grade
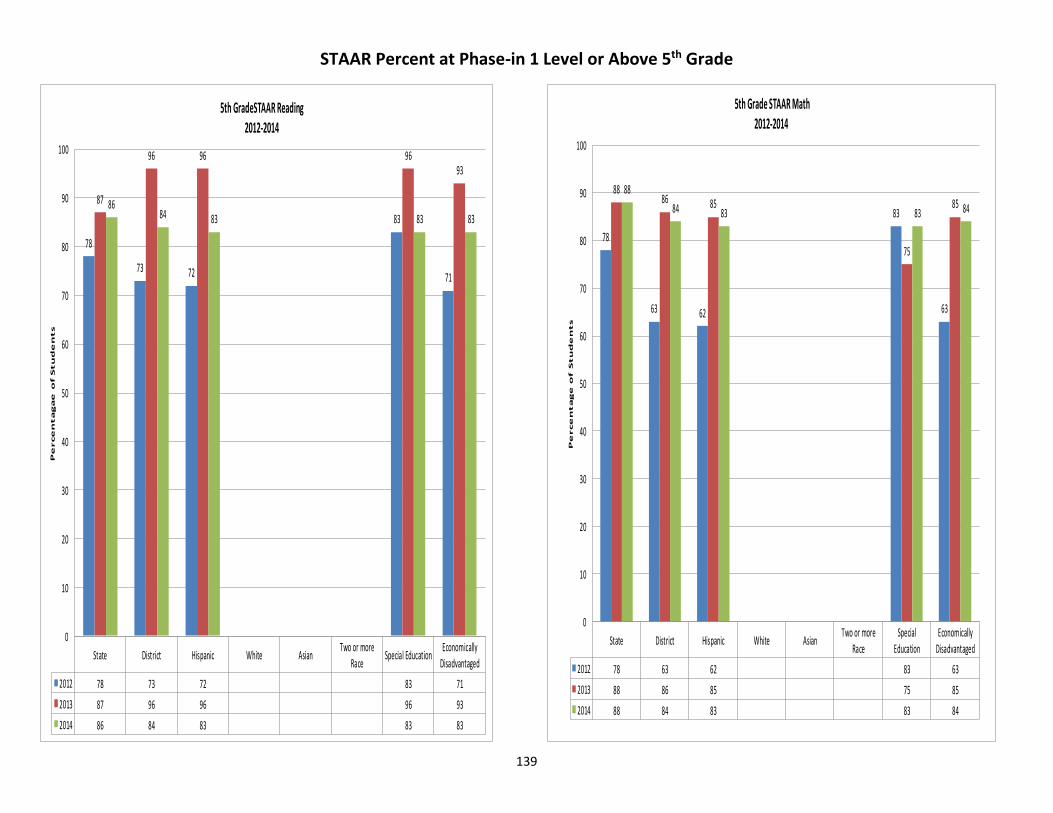
139
State District Hispanic White AsianTwo or more
RaceSpecial Education
Economically
Disadvantaged
2012 78 73 72 83 71
2013 87 96 96 96 93
2014 86 84 83 83 83
78
73 72
83
71
87
96 96 9693
8684 83 83 83
0
10
20
30
40
50
60
70
80
90
100
Pe
rce
nta
ga
e o
f S
tu
de
nts
5th GradeSTAAR Reading2012-2014
State District Hispanic White AsianTwo or more
Race
Special
Education
Economically
Disadvantaged
2012 78 63 62 83 63
2013 88 86 85 75 85
2014 88 84 83 83 84
78
63 62
83
63
8886 85
75
8588
84 83 83 84
0
10
20
30
40
50
60
70
80
90
100
Pe
rce
nta
ge
of S
tu
de
nts
5th Grade STAAR Math2012-2014
STAAR Percent at Phase-in 1 Level or Above 5th Grade
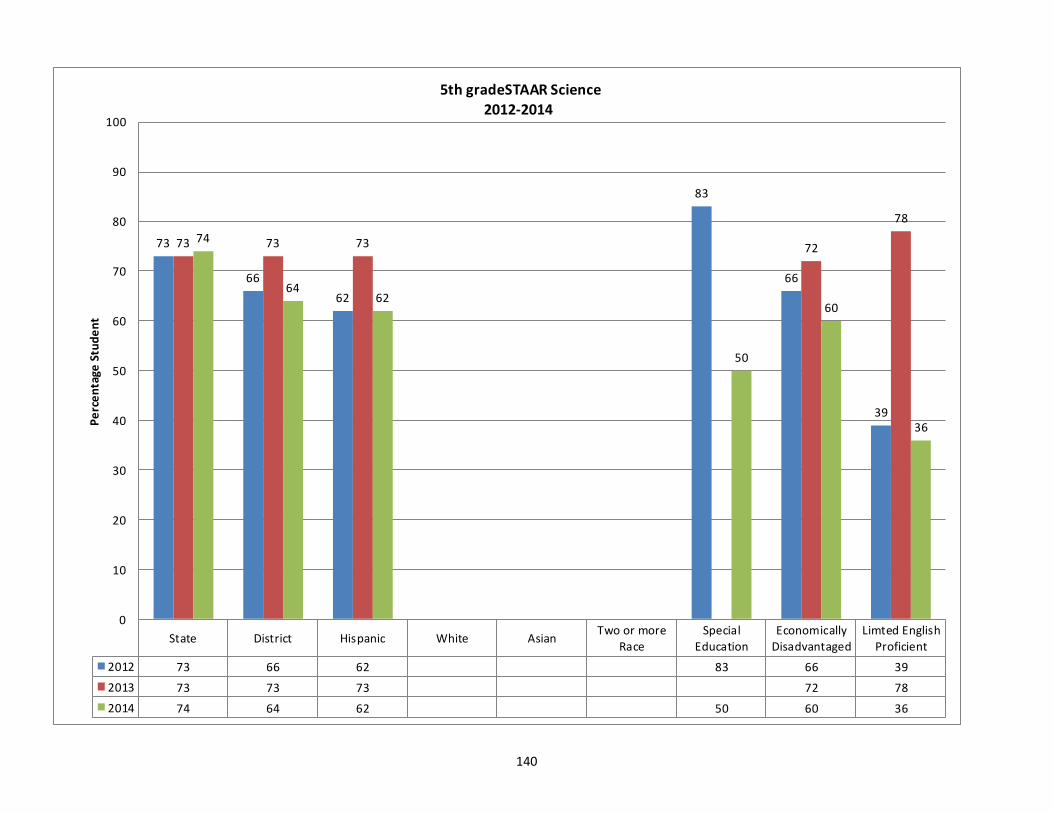
140
State District Hispanic White AsianTwo or more
RaceSpecial
EducationEconomically
DisadvantagedLimted English
Proficient
2012 73 66 62 83 66 39
2013 73 73 73 72 78
2014 74 64 62 50 60 36
73
66
62
83
66
39
73 73 73 72
78
74
6462
50
60
36
0
10
20
30
40
50
60
70
80
90
100
Pe
rce
nta
ge S
tud
en
t5th gradeSTAAR Science
2012-2014
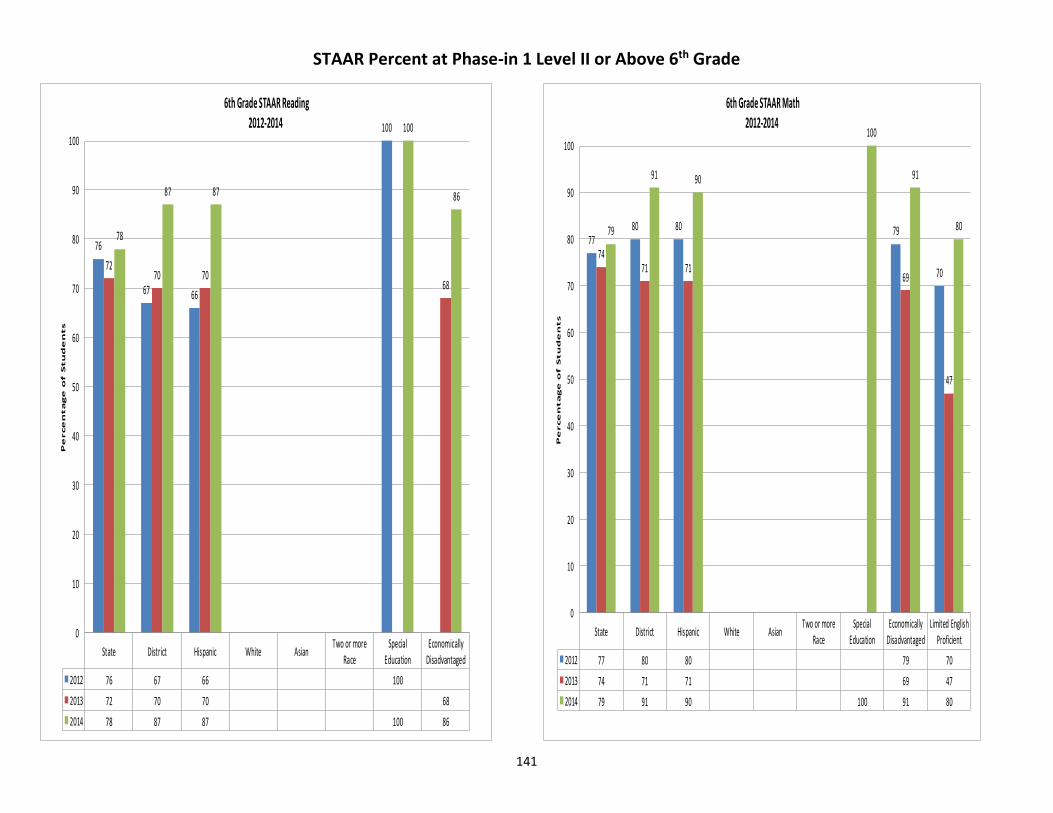
141
State District Hispanic White AsianTwo or more
Race
Special
Education
Economically
Disadvantaged
2012 76 67 66 100
2013 72 70 70 68
2014 78 87 87 100 86
76
67 66
100
7270 70
68
78
87 87
100
86
0
10
20
30
40
50
60
70
80
90
100
Pe
rce
nta
ge
of S
tu
de
nts
6th Grade STAAR Reading2012-2014
State District Hispanic White AsianTwo or more
RaceSpecial
EducationEconomically
DisadvantagedLimited English
Proficient
2012 77 80 80 79 70
2013 74 71 71 69 47
2014 79 91 90 100 91 80
7780 80 79
70
7471 71
69
47
79
91 90
100
91
80
0
10
20
30
40
50
60
70
80
90
100
Pe
rce
nta
ge
of S
tu
de
nts
6th Grade STAAR Math2012-2014
STAAR Percent at Phase-in 1 Level II or Above 6th Grade
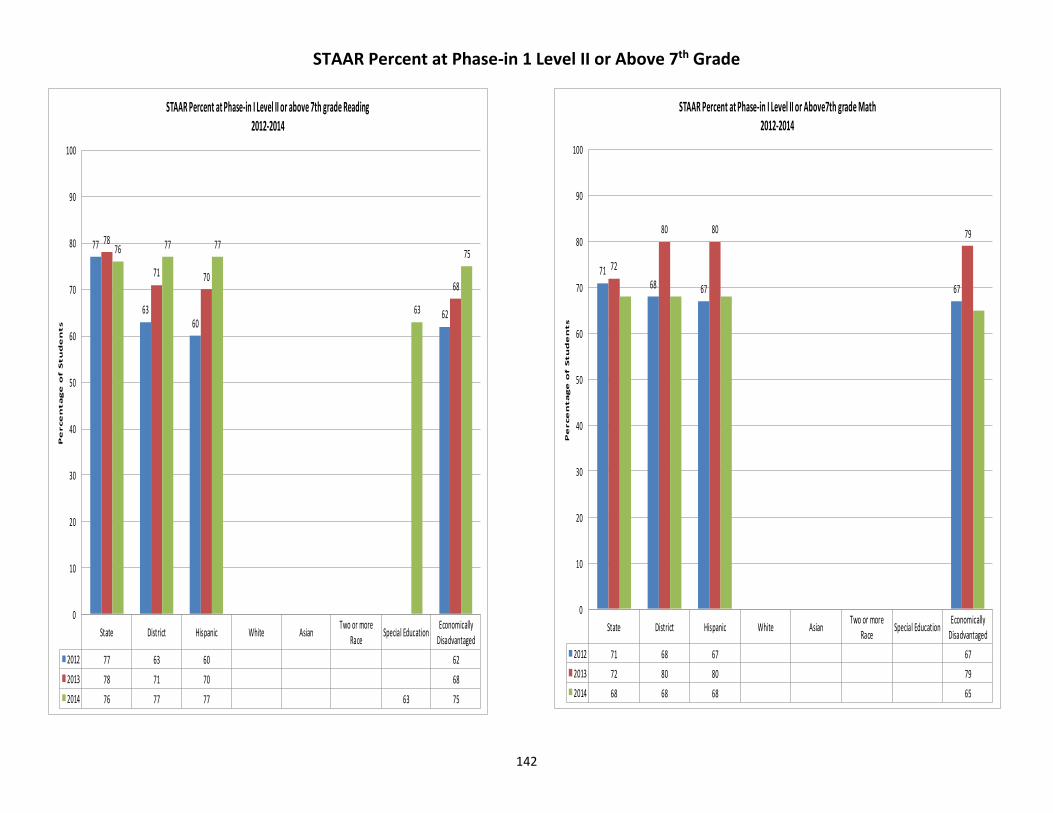
142
State District Hispanic White AsianTwo or more
RaceSpecial Education
Economically
Disadvantaged
2012 77 63 60 62
2013 78 71 70 68
2014 76 77 77 63 75
77
6360
62
78
71 7068
76 77 77
63
75
0
10
20
30
40
50
60
70
80
90
100
Pe
rce
nta
ge
of S
tu
de
nts
STAAR Percent at Phase-in I Level II or above 7th grade Reading2012-2014
State District Hispanic White AsianTwo or more
RaceSpecial Education
Economically
Disadvantaged
2012 71 68 67 67
2013 72 80 80 79
2014 68 68 68 65
7168 67 67
72
80 80 79
0
10
20
30
40
50
60
70
80
90
100
Pe
rce
nta
ge
of S
tu
de
nts
STAAR Percent at Phase-in I Level II or Above7th grade Math2012-2014
STAAR Percent at Phase-in 1 Level II or Above 7th Grade
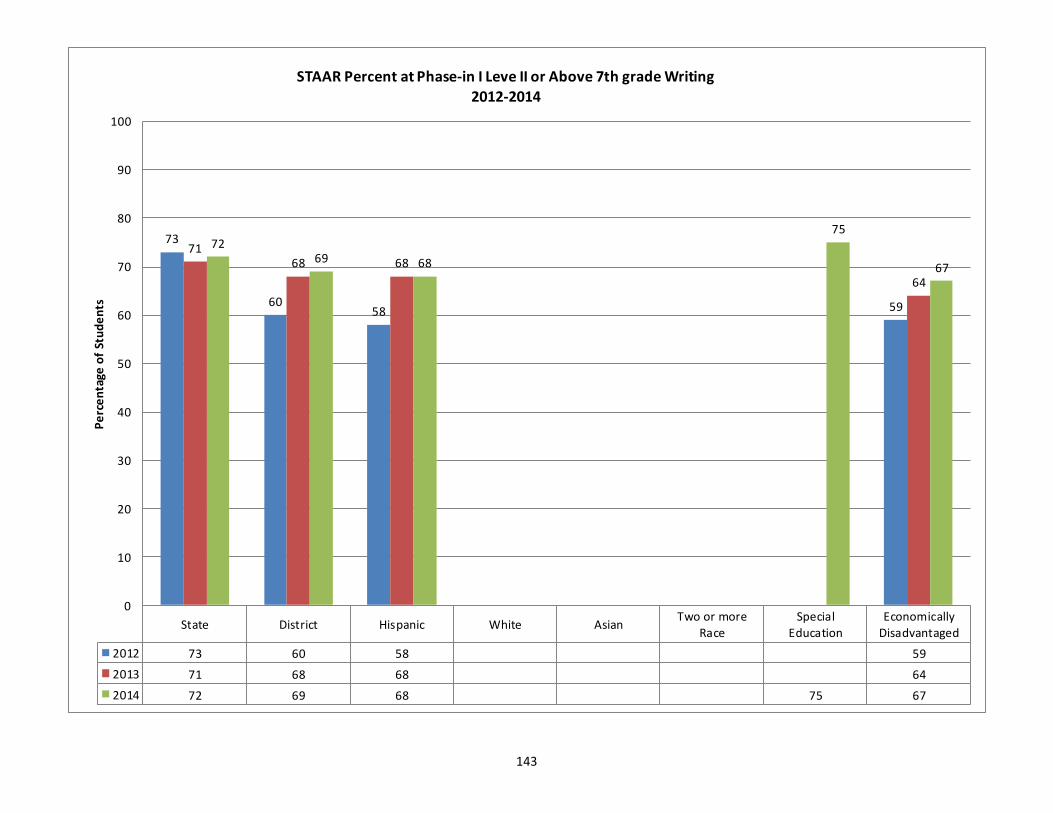
143
State District Hispanic White AsianTwo or more
RaceSpecial
EducationEconomically
Disadvantaged
2012 73 60 58 59
2013 71 68 68 64
2014 72 69 68 75 67
73
6058 59
7168 68
64
7269 68
75
67
0
10
20
30
40
50
60
70
80
90
100
Pe
rce
nta
ge o
f St
ud
en
ts
STAAR Percent at Phase-in I Leve II or Above 7th grade Writing2012-2014
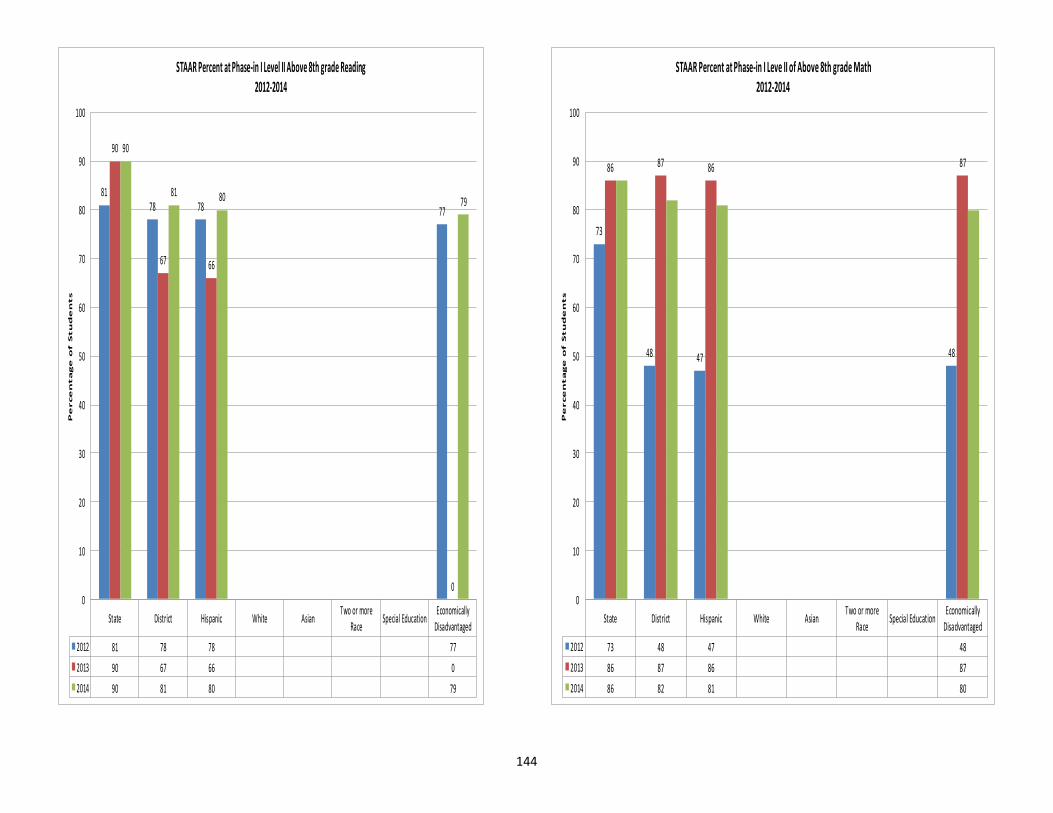
144
State District Hispanic White AsianTwo or more
RaceSpecial Education
Economically
Disadvantaged
2012 81 78 78 77
2013 90 67 66 0
2014 90 81 80 79
8178 78 77
90
67 66
0
90
81 80 79
0
10
20
30
40
50
60
70
80
90
100
Pe
rce
nta
ge
of S
tu
de
nts
STAAR Percent at Phase-in I Level II Above 8th grade Reading2012-2014
State District Hispanic White AsianTwo or more
RaceSpecial Education
Economically
Disadvantaged
2012 73 48 47 48
2013 86 87 86 87
2014 86 82 81 80
73
48 47 48
86 87 86 87
0
10
20
30
40
50
60
70
80
90
100
Pe
rce
nta
ge
of S
tu
de
nts
STAAR Percent at Phase-in I Leve II of Above 8th grade Math 2012-2014
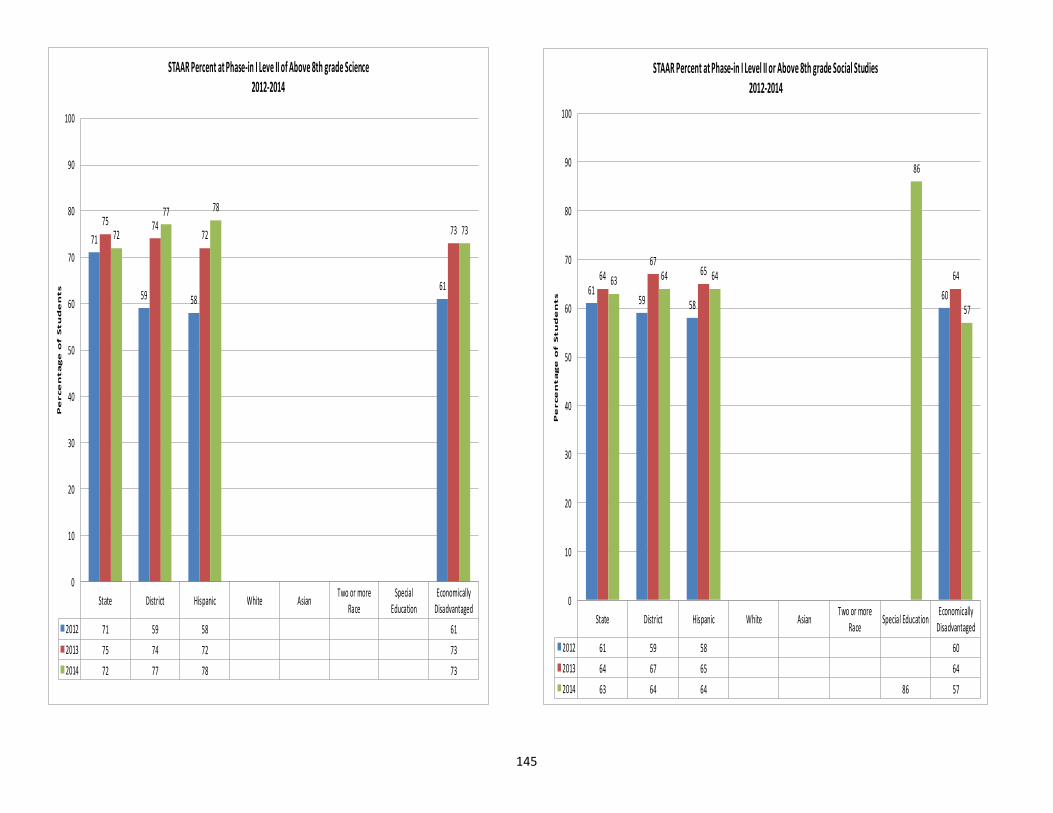
145
State District Hispanic White AsianTwo or more
Race
Special
Education
Economically
Disadvantaged
2012 71 59 58 61
2013 75 74 72 73
2014 72 77 78 73
71
59 5861
75 7472 7372
77 78
73
0
10
20
30
40
50
60
70
80
90
100
Pe
rce
nta
ge
of S
tu
de
nts
STAAR Percent at Phase-in I Leve II of Above 8th grade Science2012-2014
State District Hispanic White AsianTwo or more
RaceSpecial Education
Economically
Disadvantaged
2012 61 59 58 60
2013 64 67 65 64
2014 63 64 64 86 57
6159 58
60
6467
65 6463 64 64
86
57
0
10
20
30
40
50
60
70
80
90
100
Pe
rce
nta
ge
of S
tu
de
nts
STAAR Percent at Phase-in I Level II or Above 8th grade Social Studies2012-2014
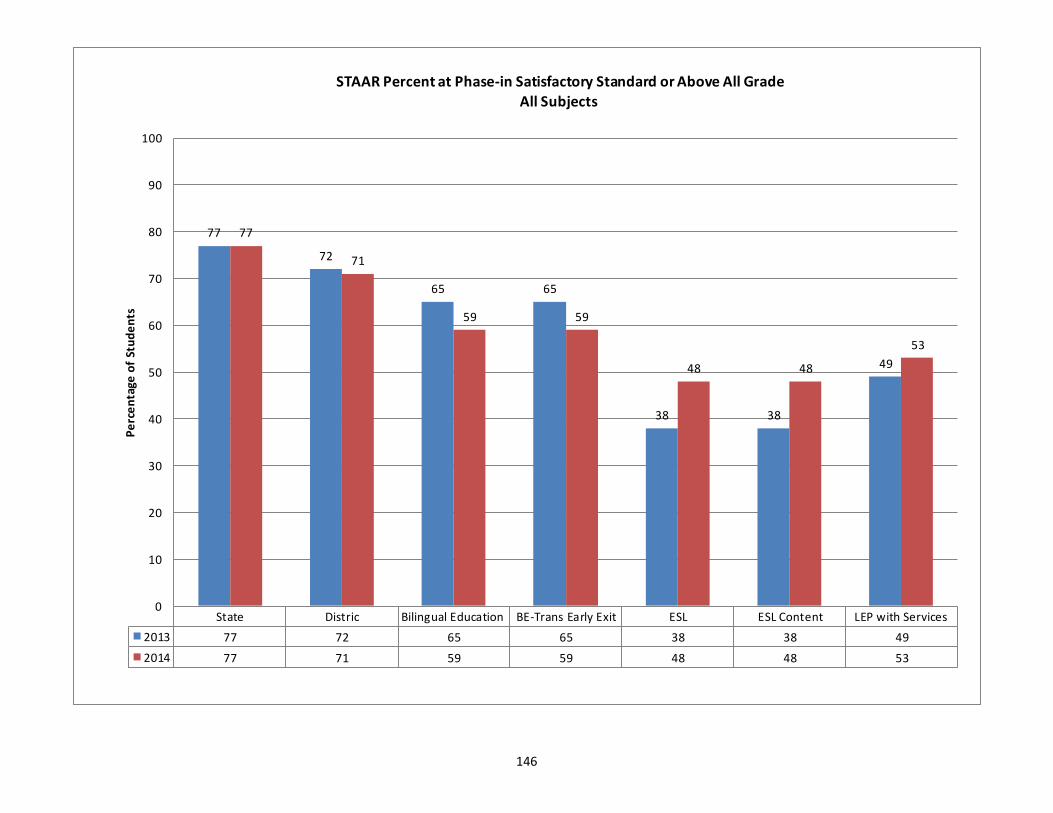
146
State Distric Bilingual Education BE-Trans Early Exit ESL ESL Content LEP with Services
2013 77 72 65 65 38 38 49
2014 77 71 59 59 48 48 53
77
72
65 65
38 38
49
77
71
59 59
48 48
53
0
10
20
30
40
50
60
70
80
90
100P
erc
en
tage
of
Stu
de
nts
STAAR Percent at Phase-in Satisfactory Standard or Above All GradeAll Subjects
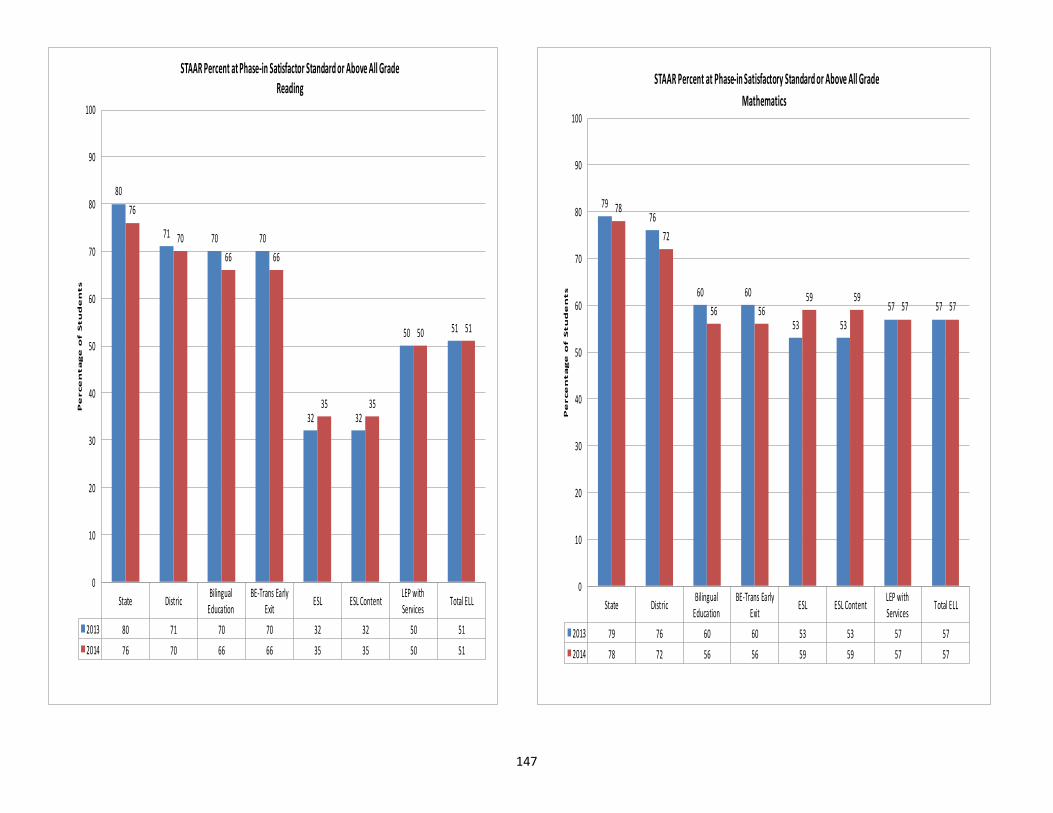
147
State DistricBilingual
Education
BE-Trans Early
ExitESL ESL Content
LEP with
ServicesTotal ELL
2013 80 71 70 70 32 32 50 51
2014 76 70 66 66 35 35 50 51
80
71 70 70
32 32
50 51
76
70
66 66
35 35
50 51
0
10
20
30
40
50
60
70
80
90
100
Pe
rce
nta
ge
of S
tu
de
nts
STAAR Percent at Phase-in Satisfactor Standard or Above All GradeReading
State DistricBilingual
Education
BE-Trans Early
ExitESL ESL Content
LEP with
ServicesTotal ELL
2013 79 76 60 60 53 53 57 57
2014 78 72 56 56 59 59 57 57
7976
60 60
53 53
57 57
78
72
56 5659 59
57 57
0
10
20
30
40
50
60
70
80
90
100
Pe
rce
nta
ge
of S
tu
de
nts
STAAR Percent at Phase-in Satisfactory Standard or Above All Grade
Mathematics
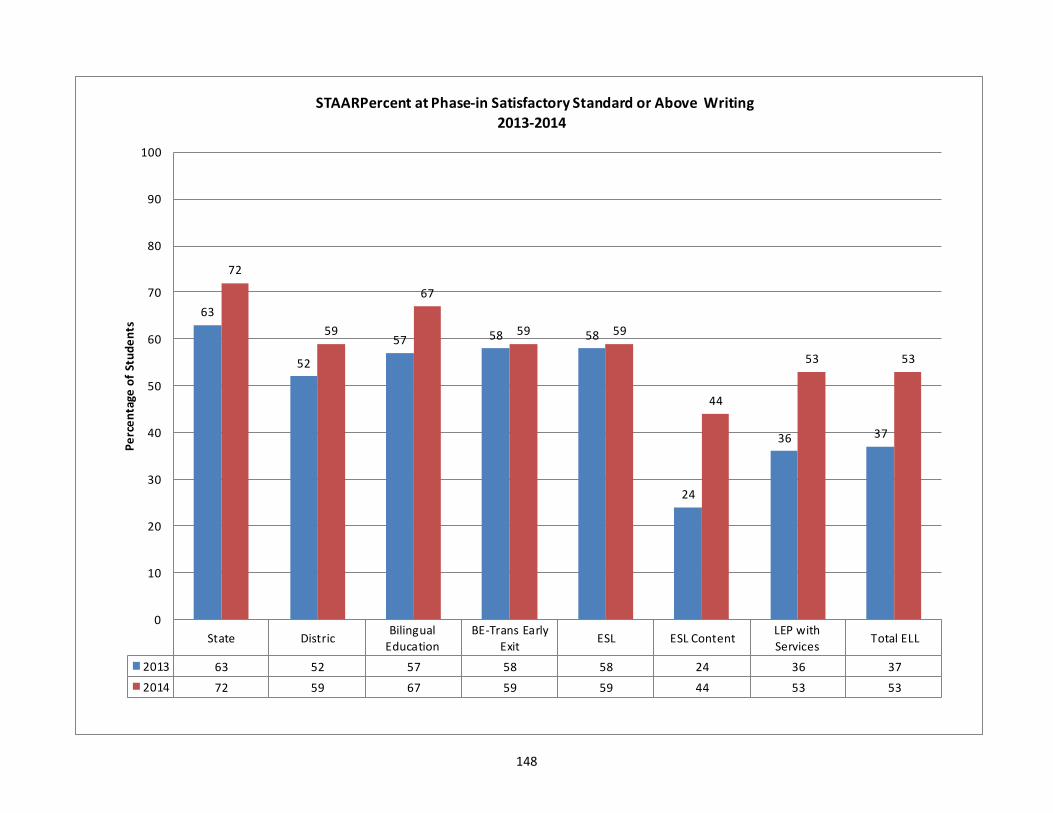
148
State DistricBilingual
Education
BE-Trans Early
ExitESL ESL Content
LEP with
ServicesTotal ELL
2013 63 52 57 58 58 24 36 37
2014 72 59 67 59 59 44 53 53
63
52
57 58 58
24
36 37
72
59
67
59 59
44
53 53
0
10
20
30
40
50
60
70
80
90
100
Pe
rce
nta
ge o
f St
ud
en
ts
STAARPercent at Phase-in Satisfactory Standard or Above Writing 2013-2014
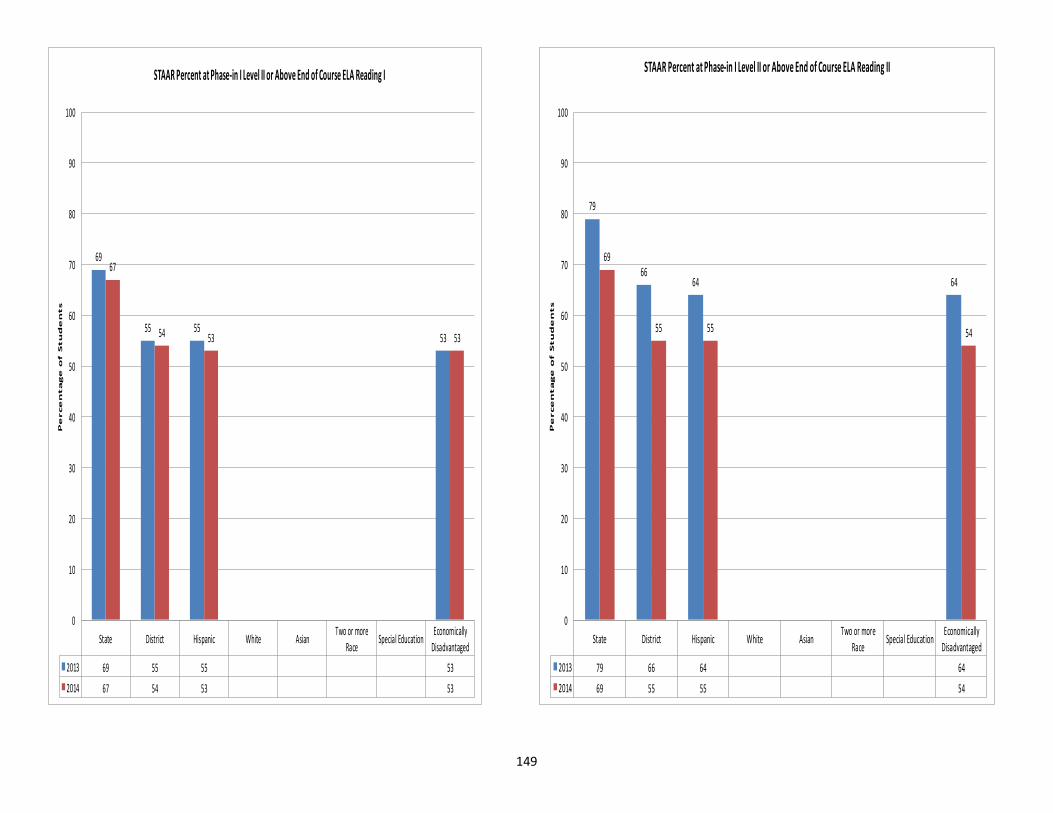
149
State District Hispanic White AsianTwo or more
RaceSpecial Education
Economically
Disadvantaged
2013 69 55 55 53
2014 67 54 53 53
69
55 5553
67
54 53 53
0
10
20
30
40
50
60
70
80
90
100
Pe
rce
nta
ge
of S
tu
de
nts
STAAR Percent at Phase-in I Level II or Above End of Course ELA Reading I
State District Hispanic White AsianTwo or more
RaceSpecial Education
Economically
Disadvantaged
2013 79 66 64 64
2014 69 55 55 54
79
6664 64
69
55 55 54
0
10
20
30
40
50
60
70
80
90
100
Pe
rce
nta
ge
of S
tu
de
nts
STAAR Percent at Phase-in I Level II or Above End of Course ELA Reading II
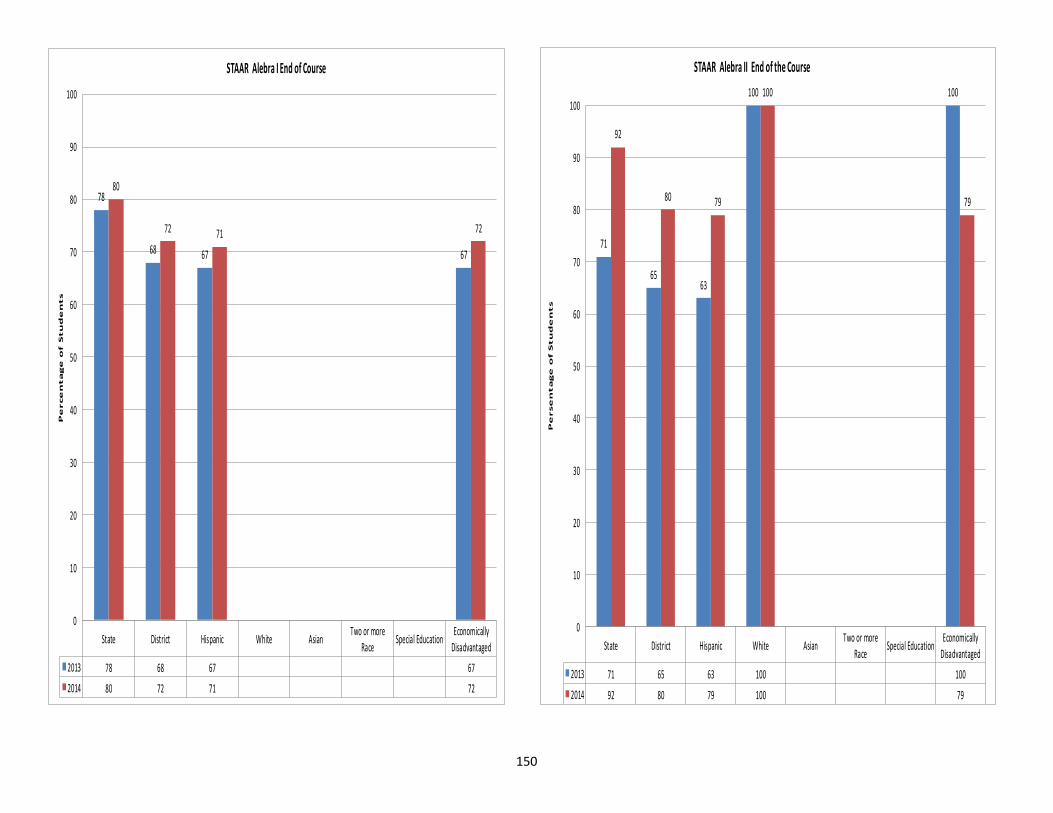
150
State District Hispanic White AsianTwo or more
RaceSpecial Education
Economically
Disadvantaged
2013 78 68 67 67
2014 80 72 71 72
78
68 67 67
80
72 71 72
0
10
20
30
40
50
60
70
80
90
100
Pe
rce
nta
ge
of S
tu
de
nts
STAAR Alebra I End of Course
State District Hispanic White AsianTwo or more
RaceSpecial Education
Economically
Disadvantaged
2013 71 65 63 100 100
2014 92 80 79 100 79
71
6563
100 100
92
80 79
100
79
0
10
20
30
40
50
60
70
80
90
100
Pe
rse
nta
ge
of S
tu
de
nts
STAAR Alebra II End of the Course
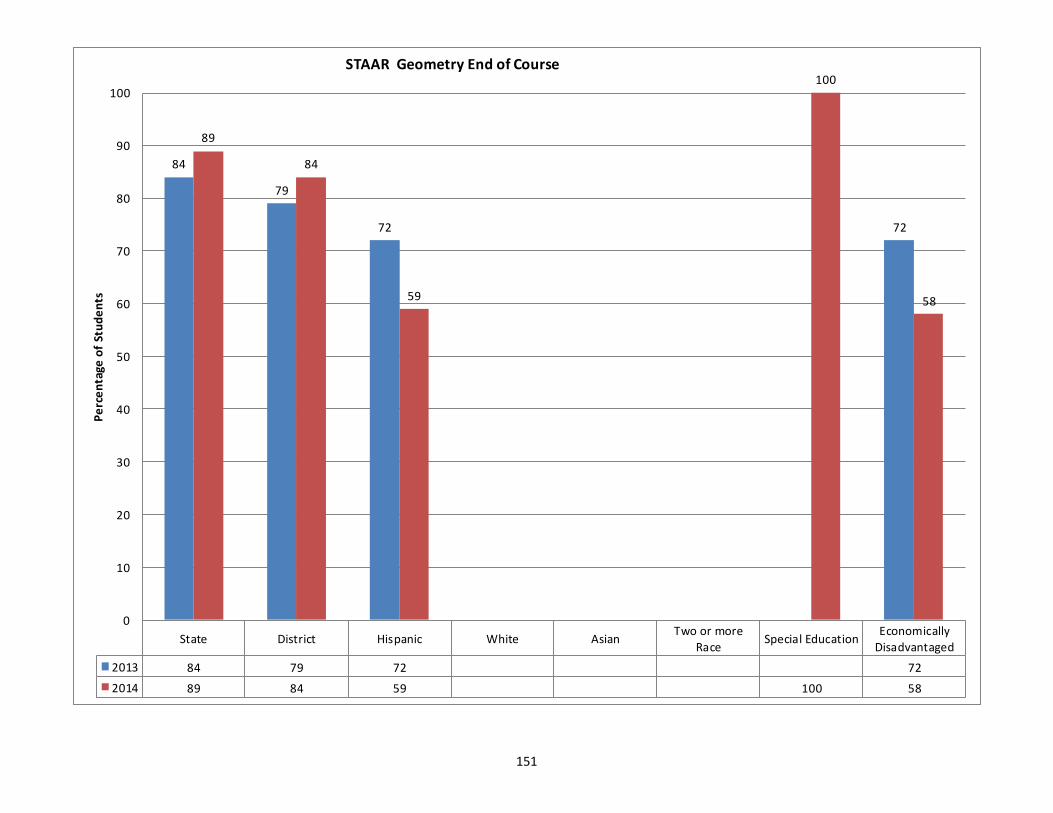
151
State District Hispanic White AsianTwo or more
RaceSpecial Education
Economically
Disadvantaged
2013 84 79 72 72
2014 89 84 59 100 58
84
79
72 72
89
84
59
100
58
0
10
20
30
40
50
60
70
80
90
100P
erc
en
tage
of
Stu
de
nts
STAAR Geometry End of Course
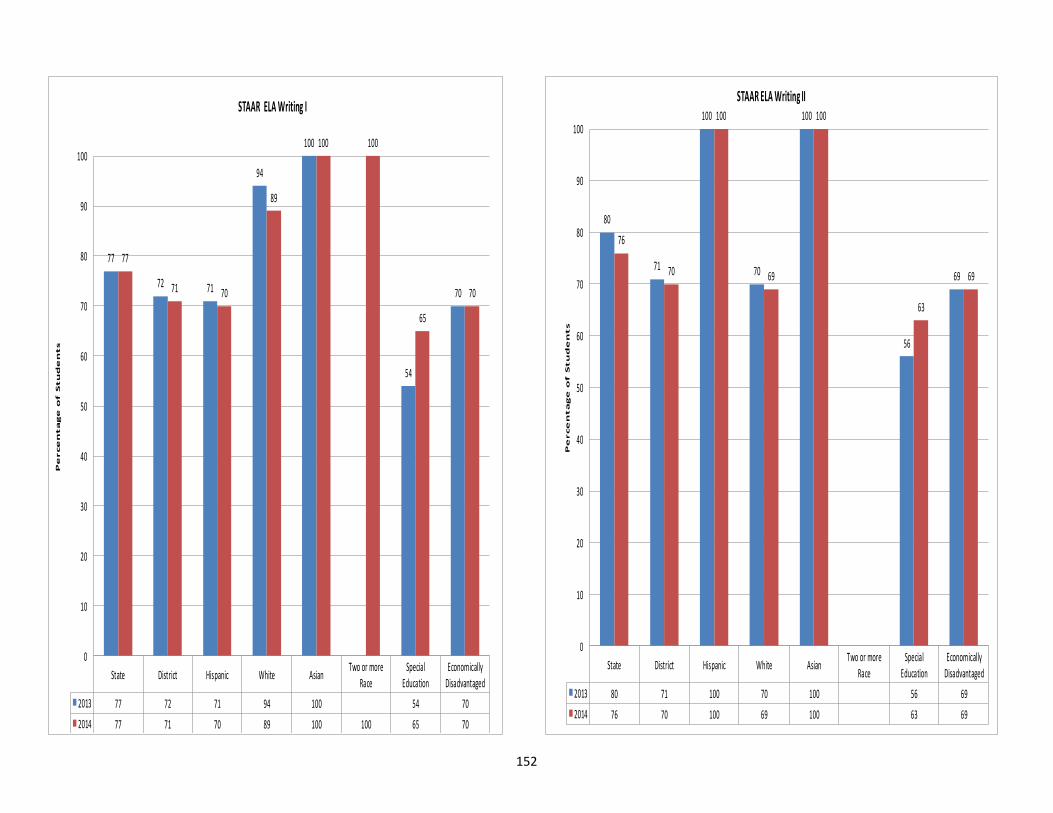
152
State District Hispanic White AsianTwo or more
Race
Special
Education
Economically
Disadvantaged
2013 77 72 71 94 100 54 70
2014 77 71 70 89 100 100 65 70
77
72 71
94
100
54
70
77
71 70
89
100 100
65
70
0
10
20
30
40
50
60
70
80
90
100
Pe
rce
nta
ge
of S
tu
de
nts
STAAR ELA Writing I
State District Hispanic White AsianTwo or more
Race
Special
Education
Economically
Disadvantaged
2013 80 71 100 70 100 56 69
2014 76 70 100 69 100 63 69
80
71
100
70
100
56
69
76
70
100
69
100
63
69
0
10
20
30
40
50
60
70
80
90
100
Pe
rce
nta
ge
of S
tu
de
nts
STAAR ELA Writing II
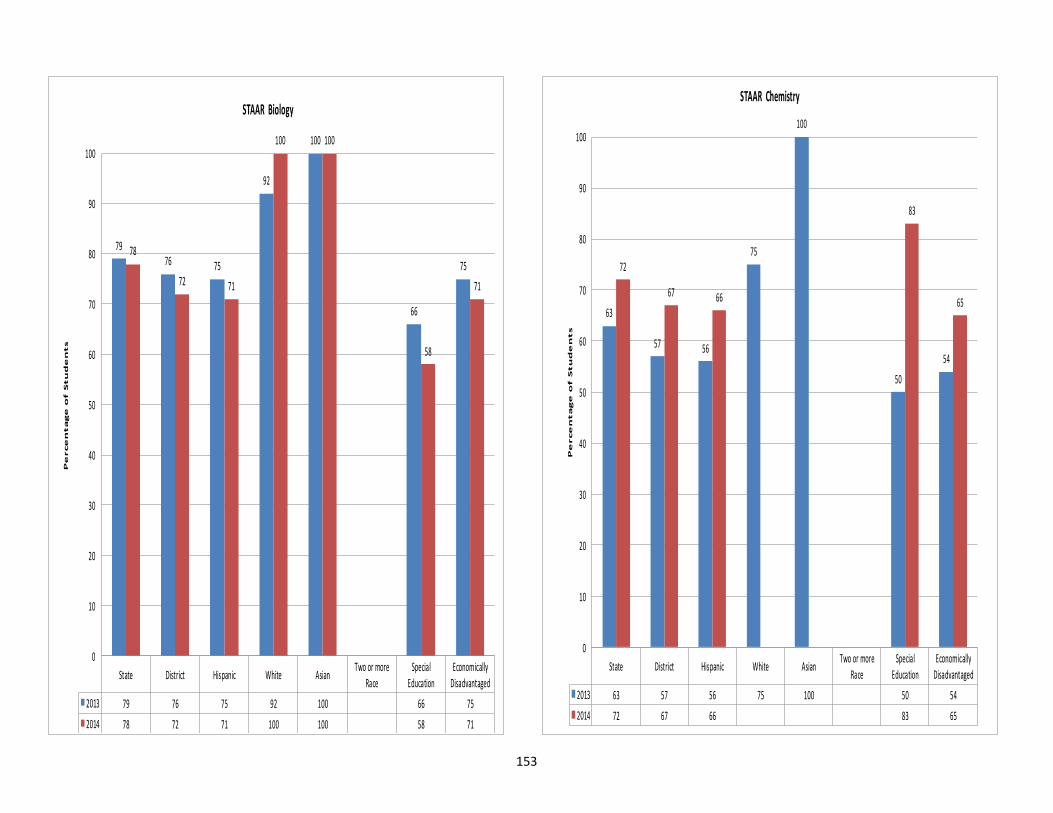
153
State District Hispanic White AsianTwo or more
Race
Special
Education
Economically
Disadvantaged
2013 79 76 75 92 100 66 75
2014 78 72 71 100 100 58 71
7976 75
92
100
66
7578
72 71
100 100
58
71
0
10
20
30
40
50
60
70
80
90
100
Pe
rce
nta
ge
of S
tu
de
nts
STAAR Biology
State District Hispanic White AsianTwo or more
Race
Special
Education
Economically
Disadvantaged
2013 63 57 56 75 100 50 54
2014 72 67 66 83 65
63
57 56
75
100
50
54
72
67 66
83
65
0
10
20
30
40
50
60
70
80
90
100
Pe
rce
nta
ge
of S
tu
de
nts
STAAR Chemistry
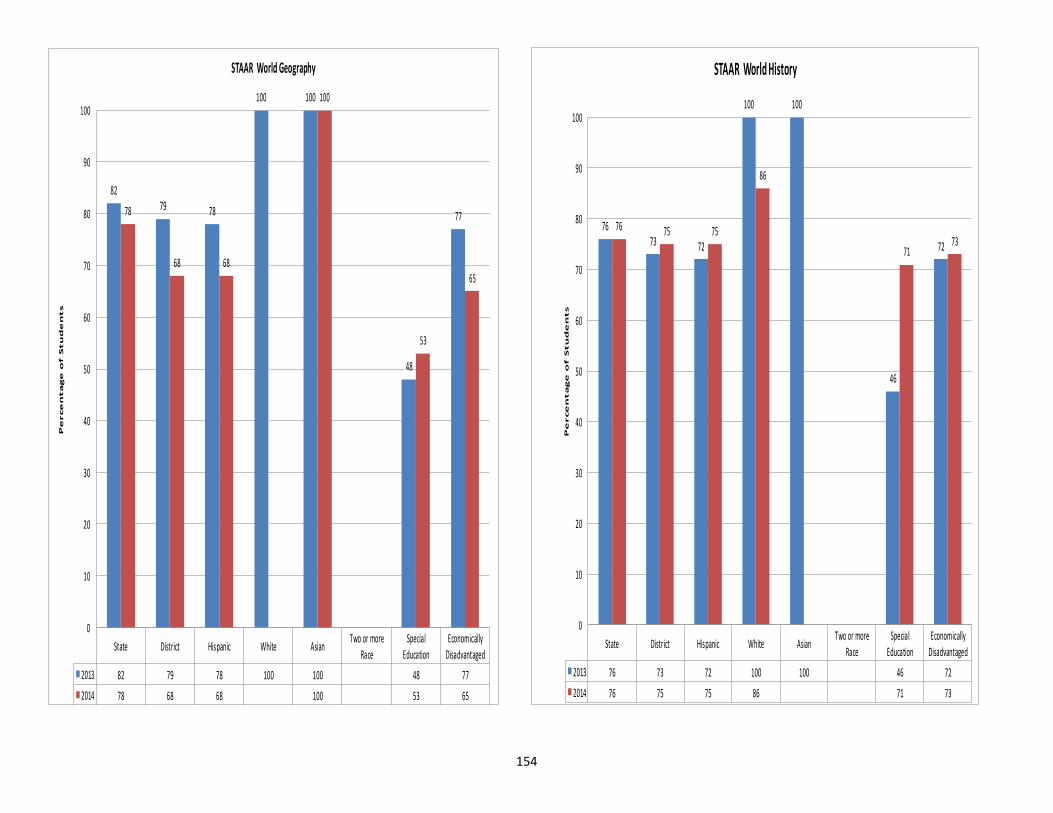
154
State District Hispanic White AsianTwo or more
Race
Special
Education
Economically
Disadvantaged
2013 82 79 78 100 100 48 77
2014 78 68 68 100 53 65
8279 78
100 100
48
7778
68 68
100
53
65
0
10
20
30
40
50
60
70
80
90
100
Pe
rce
nta
ge
of S
tu
de
nts
STAAR World Geography
State District Hispanic White AsianTwo or more
Race
Special
Education
Economically
Disadvantaged
2013 76 73 72 100 100 46 72
2014 76 75 75 86 71 73
7673 72
100 100
46
72
76 75 75
86
7173
0
10
20
30
40
50
60
70
80
90
100
Pe
rce
nta
ge
of S
tu
de
nts
STAAR World History
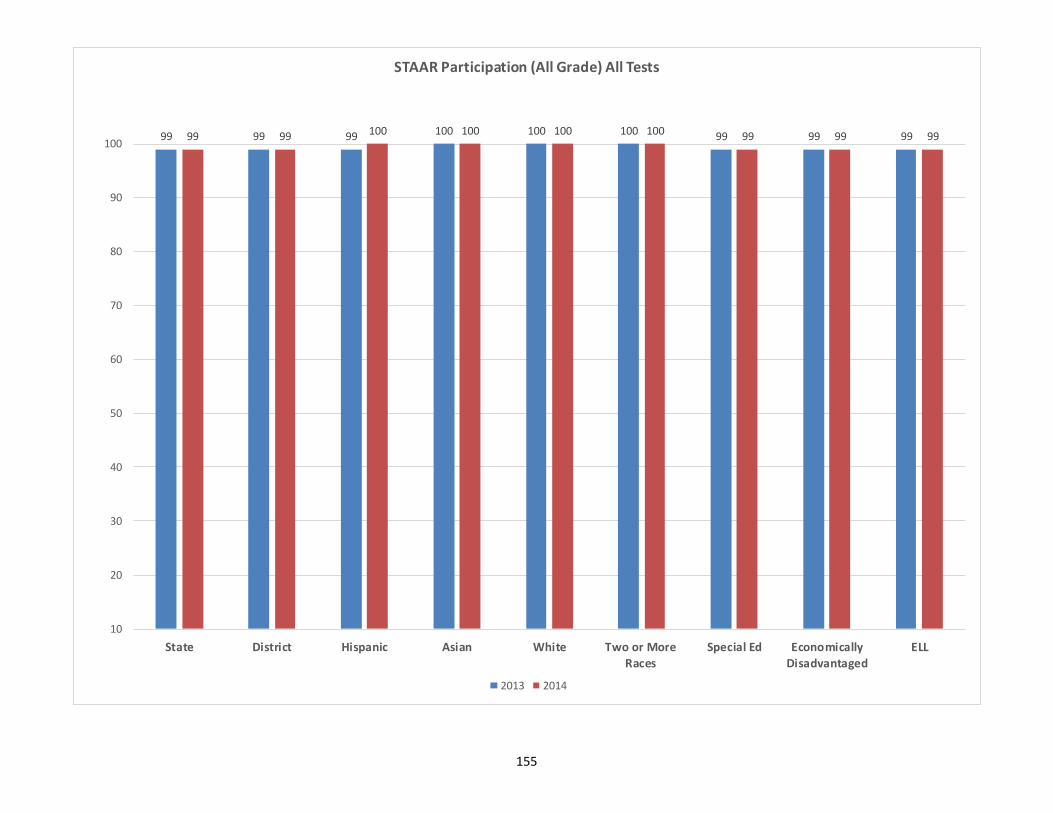
155
99 99 99 100 100 100 99 99 9999 99 100 100 100 100 99 99 99
10
20
30
40
50
60
70
80
90
100
State District Hispanic Asian White Two or More
Races
Special Ed Economically
Disadvantaged
ELL
STAAR Participation (All Grade) All Tests
2013 2014
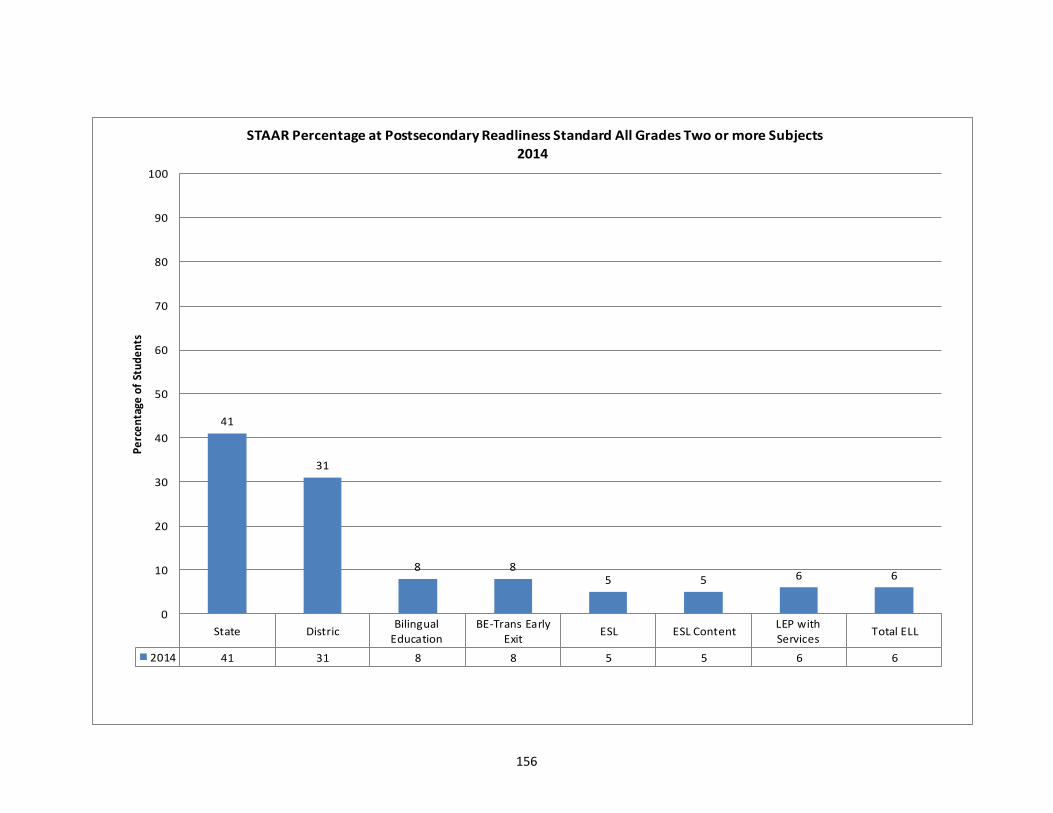
156
State DistricBilingual
Education
BE-Trans Early
ExitESL ESL Content
LEP with
ServicesTotal ELL
2014 41 31 8 8 5 5 6 6
41
31
8 85 5 6 6
0
10
20
30
40
50
60
70
80
90
100
Pe
rce
nta
ge o
f St
ud
en
tsSTAAR Percentage at Postsecondary Readliness Standard All Grades Two or more Subjects
2014
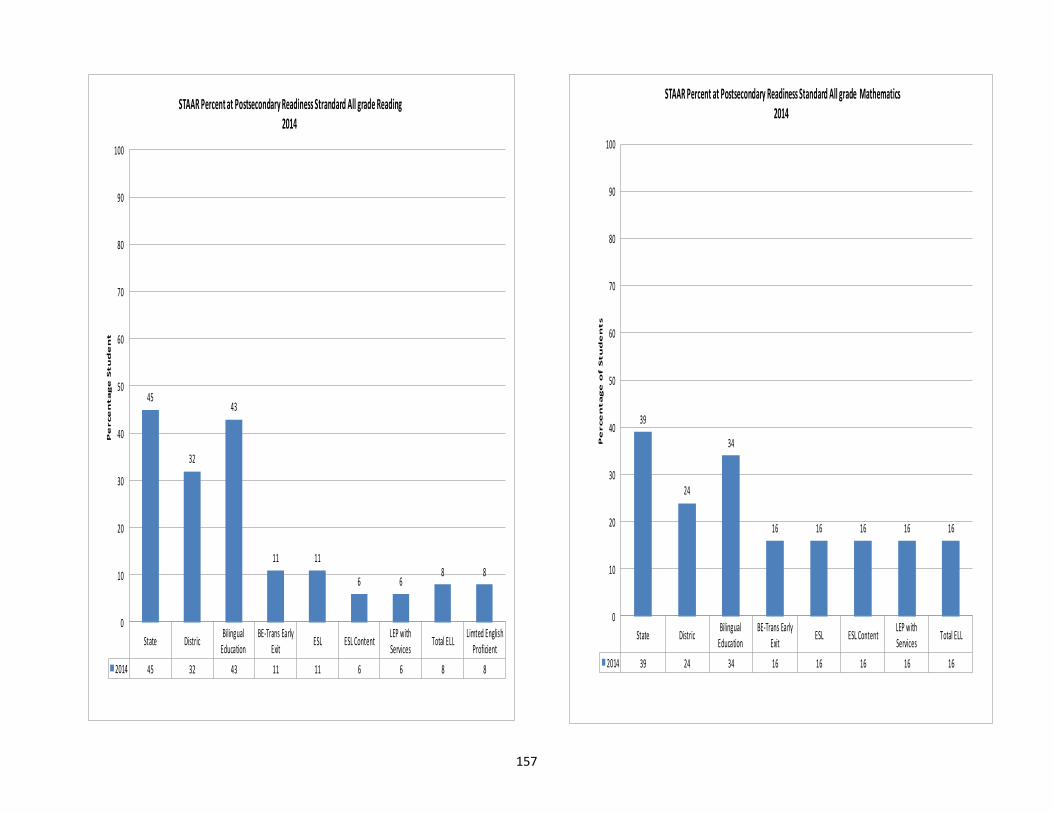
157
State DistricBilingual
Education
BE-Trans Early
ExitESL ESL Content
LEP with
ServicesTotal ELL
2014 39 24 34 16 16 16 16 16
39
24
34
16 16 16 16 16
0
10
20
30
40
50
60
70
80
90
100
Pe
rce
nta
ge
of S
tu
de
nts
STAAR Percent at Postsecondary Readiness Standard All grade Mathematics 2014
State DistricBilingual
Education
BE-Trans Early
ExitESL ESL Content
LEP with
ServicesTotal ELL
Limted English
Proficient
2014 45 32 43 11 11 6 6 8 8
45
32
43
11 11
6 68 8
0
10
20
30
40
50
60
70
80
90
100
Pe
rce
nta
ge
Stu
de
nt
STAAR Percent at Postsecondary Readiness Strandard All grade Reading 2014
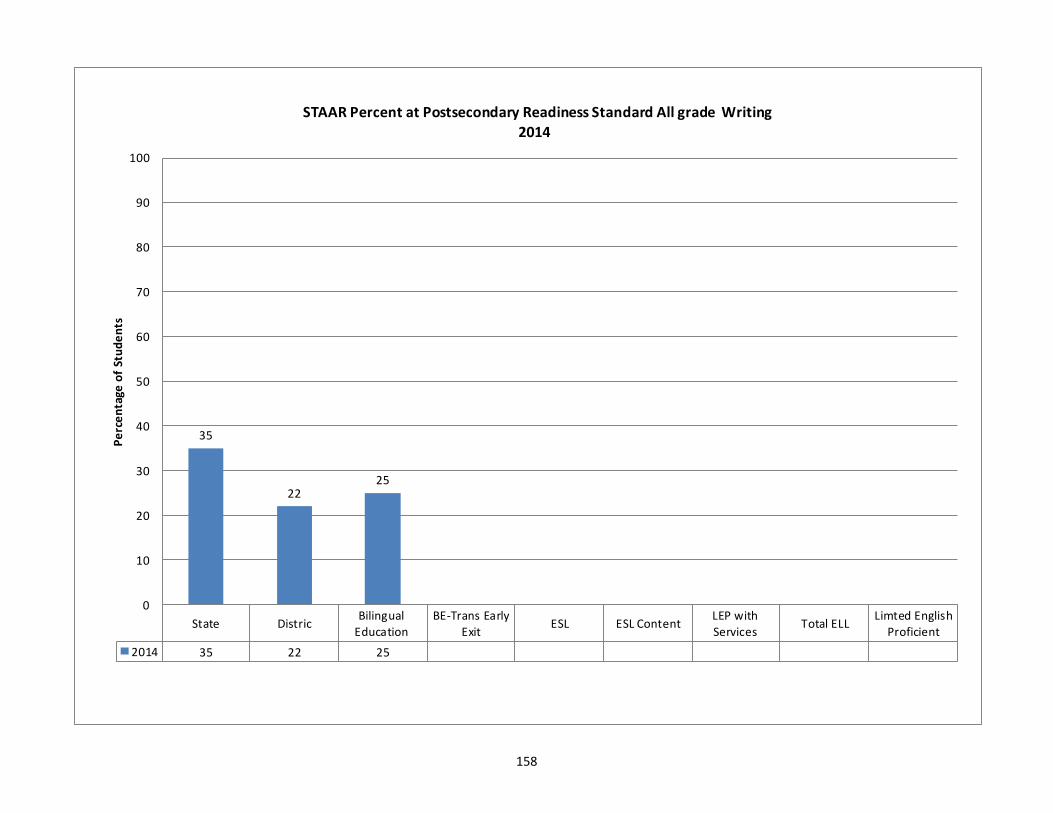
158
State DistricBilingual
Education
BE-Trans Early
ExitESL ESL Content
LEP with
ServicesTotal ELL
Limted English
Proficient
2014 35 22 25
35
2225
0
10
20
30
40
50
60
70
80
90
100
Pe
rce
nta
ge o
f St
ud
en
ts
STAAR Percent at Postsecondary Readiness Standard All grade Writing 2014
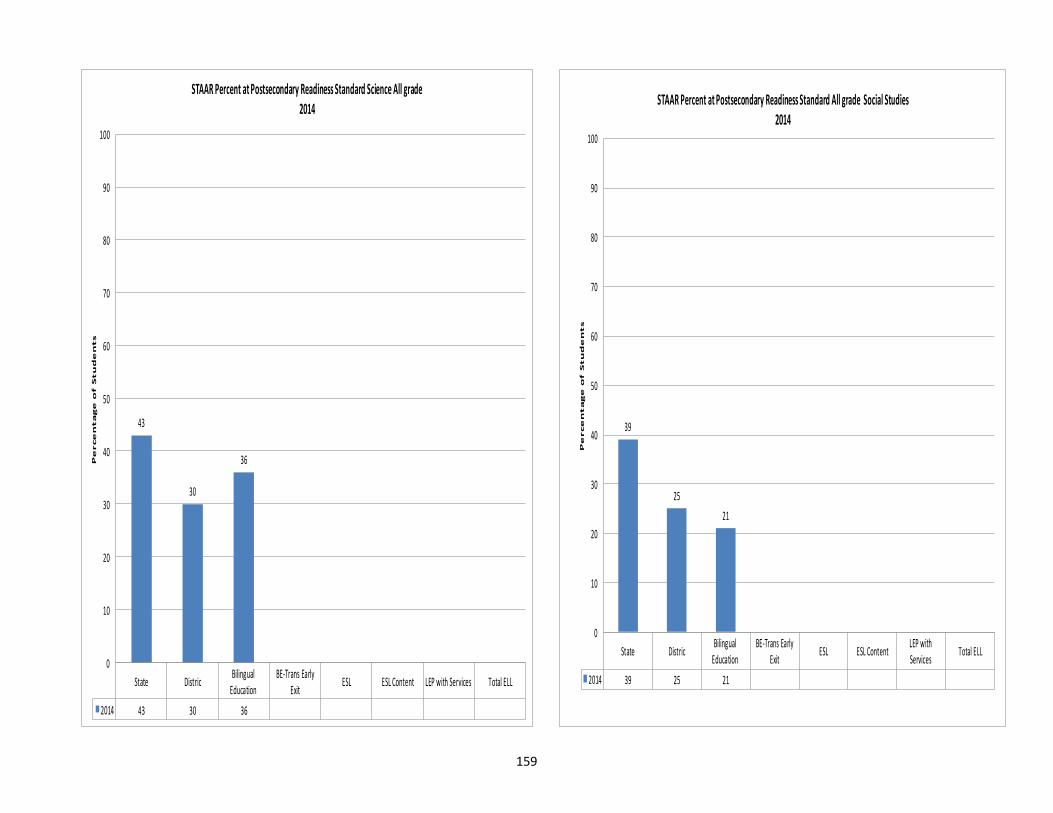
159
State DistricBilingual
Education
BE-Trans Early
ExitESL ESL Content LEP with Services Total ELL
2014 43 30 36
43
30
36
0
10
20
30
40
50
60
70
80
90
100
Pe
rce
nta
ge
of S
tu
de
nts
STAAR Percent at Postsecondary Readiness Standard Science All grade 2014
State DistricBilingual
Education
BE-Trans Early
ExitESL ESL Content
LEP with
ServicesTotal ELL
2014 39 25 21
39
25
21
0
10
20
30
40
50
60
70
80
90
100
Pe
rce
nta
ge
of S
tu
de
nts
STAAR Percent at Postsecondary Readiness Standard All grade Social Studies
2014
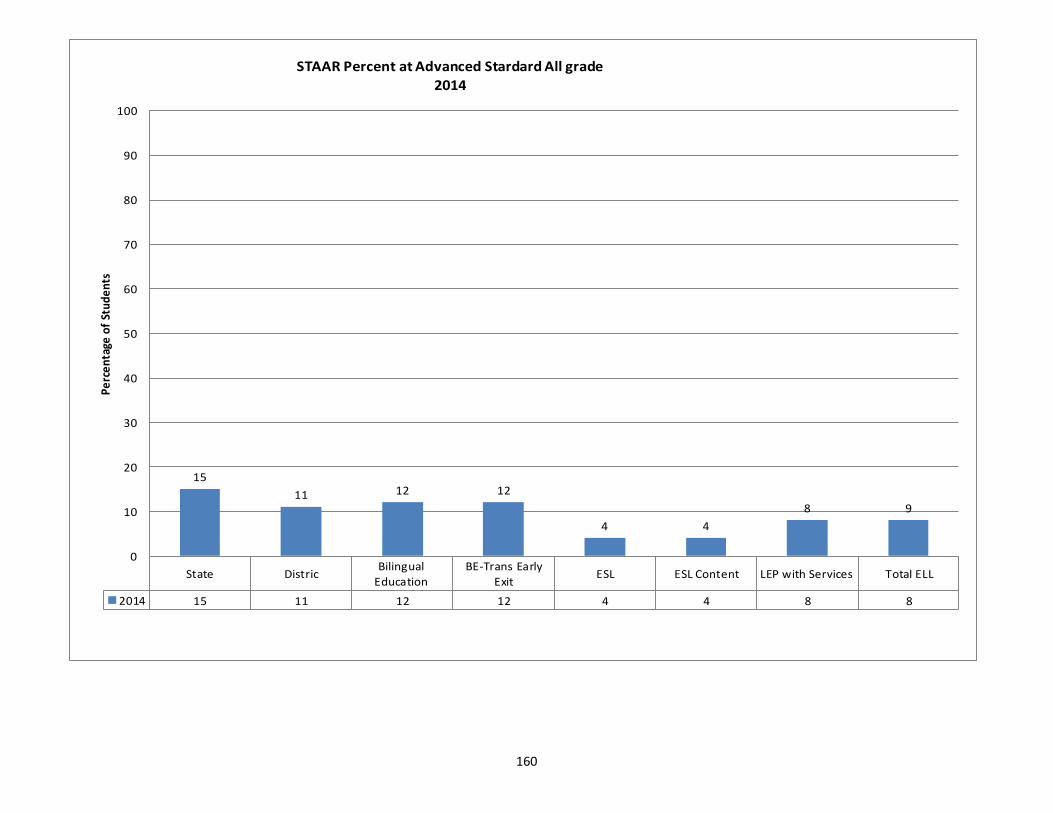
160
State DistricBilingual
Education
BE-Trans Early
ExitESL ESL Content LEP with Services Total ELL
2014 15 11 12 12 4 4 8 8
15
11 12 12
4 4
8 9
0
10
20
30
40
50
60
70
80
90
100P
erc
en
tage
of
Stu
de
nts
STAAR Percent at Advanced Stardard All grade 2014
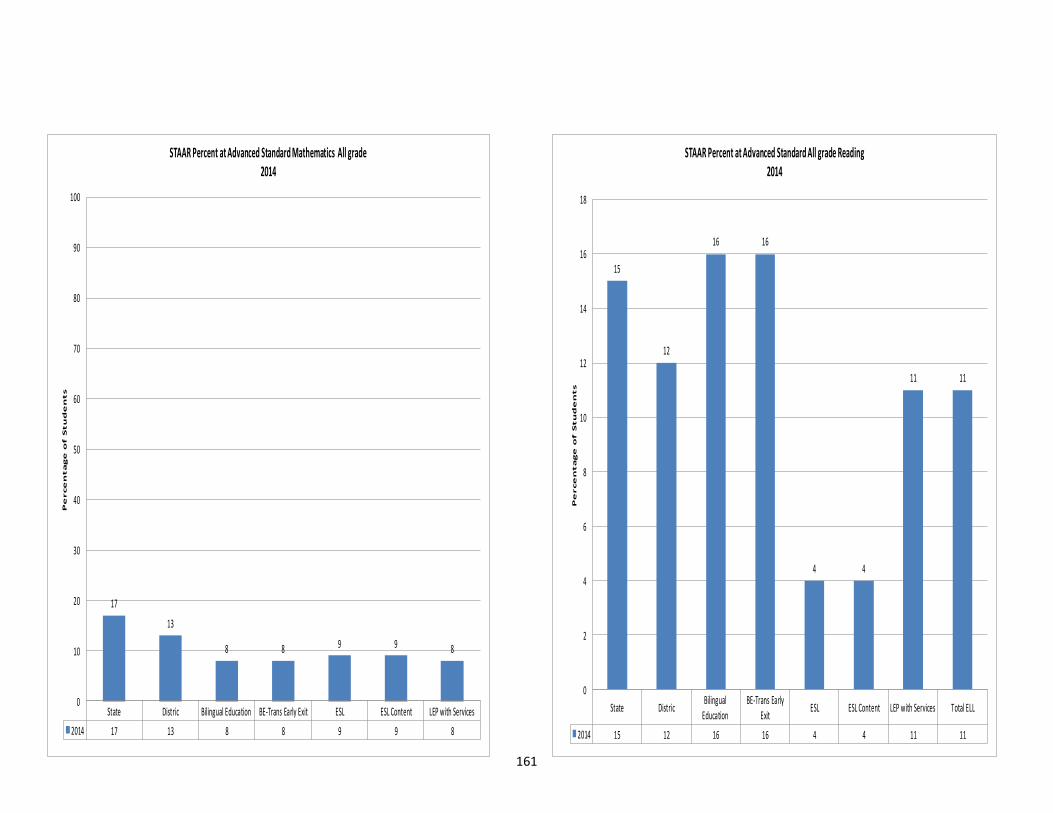
161
State DistricBilingual
EducationBE-Trans Early
ExitESL ESL Content LEP with Services Total ELL
2014 15 12 16 16 4 4 11 11
15
12
16 16
4 4
11 11
0
2
4
6
8
10
12
14
16
18
Pe
rce
nta
ge
of S
tu
de
nts
STAAR Percent at Advanced Standard All grade Reading 2014
State Distric Bilingual Education BE-Trans Early Exit ESL ESL Content LEP with Services
2014 17 13 8 8 9 9 8
17
13
8 8 9 9 8
0
10
20
30
40
50
60
70
80
90
100
Pe
rce
nta
ge
of S
tu
de
nts
STAAR Percent at Advanced Standard Mathematics All grade 2014
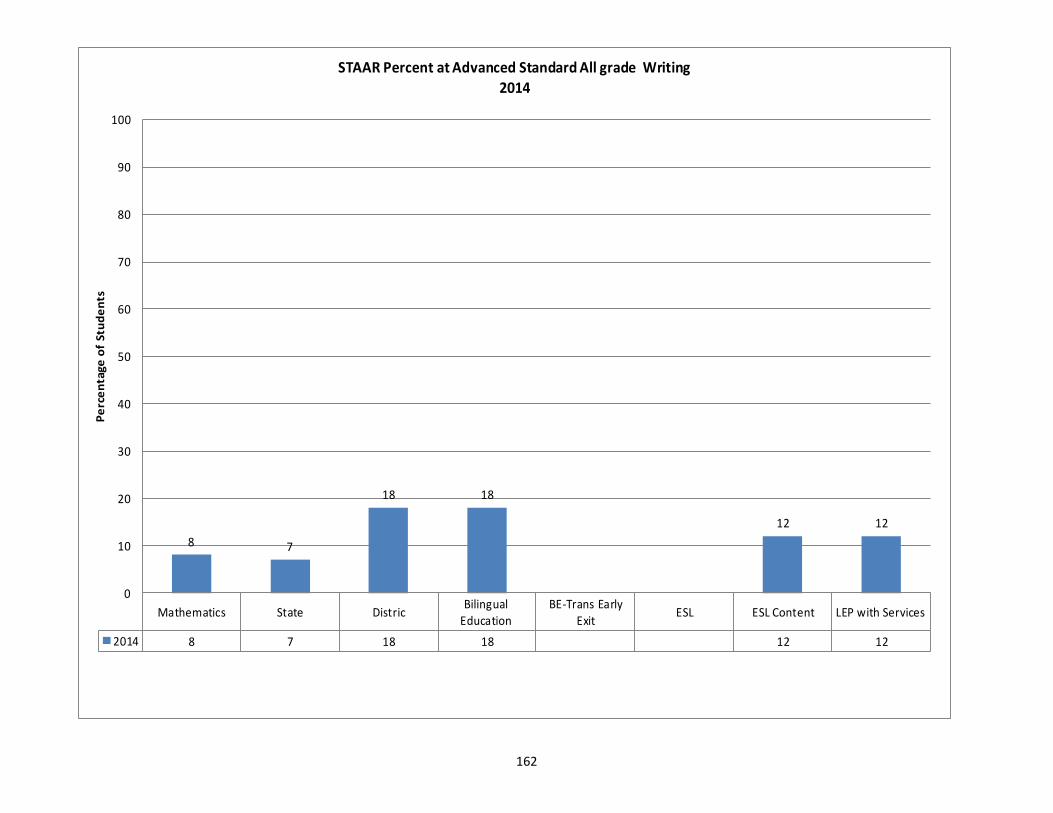
162
Mathematics State DistricBilingual
Education
BE-Trans Early
ExitESL ESL Content LEP with Services
2014 8 7 18 18 12 12
8 7
18 18
12 12
0
10
20
30
40
50
60
70
80
90
100
Pe
rce
nta
ge o
f St
ud
en
ts
STAAR Percent at Advanced Standard All grade Writing2014
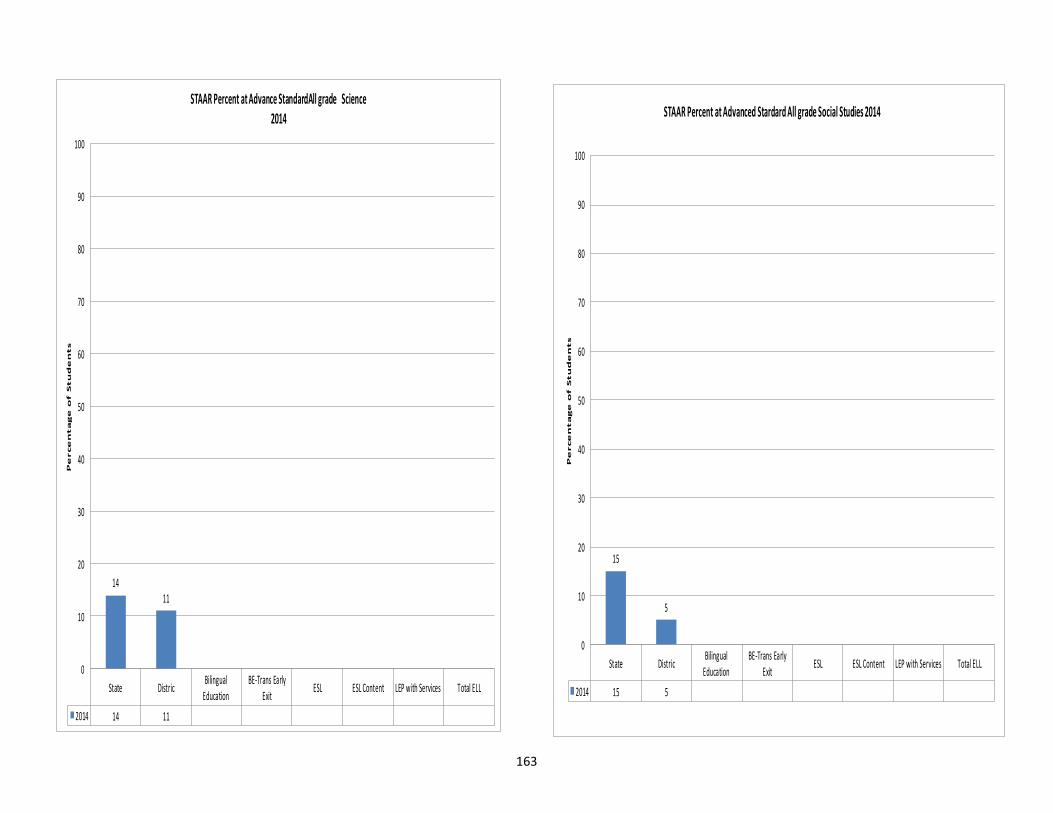
163
State DistricBilingual
EducationBE-Trans Early
ExitESL ESL Content LEP with Services Total ELL
2014 14 11
1411
0
10
20
30
40
50
60
70
80
90
100
Pe
rce
nta
ge
of S
tu
de
nts
STAAR Percent at Advance StandardAll grade Science2014
State DistricBilingual
Education
BE-Trans Early
ExitESL ESL Content LEP with Services Total ELL
2014 15 5
15
5
0
10
20
30
40
50
60
70
80
90
100
Pe
rce
nta
ge
of S
tu
de
nts
STAAR Percent at Advanced Stardard All grade Social Studies 2014
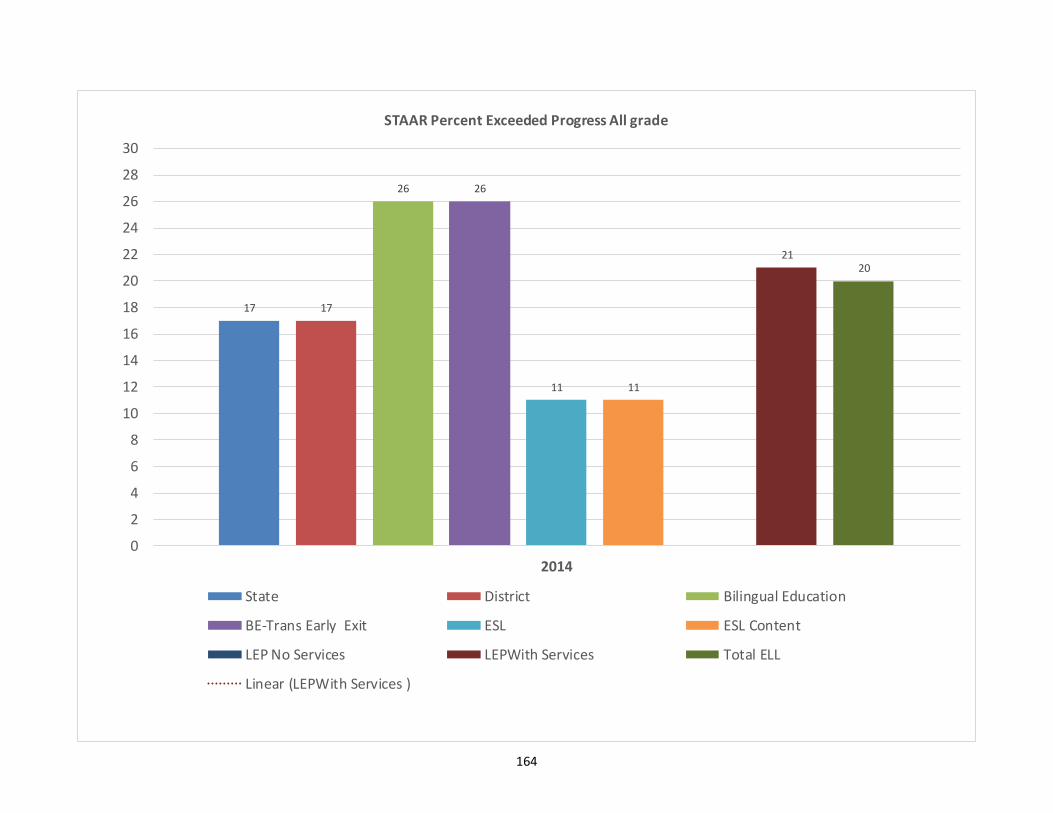
164
17 17
26 26
11 11
2120
0
2
4
6
8
10
12
14
16
18
20
22
24
26
28
30
2014
STAAR Percent Exceeded Progress All grade
State District Bilingual Education
BE-Trans Early Exit ESL ESL Content
LEP No Services LEPWith Services Total ELL
Linear (LEPWith Services )
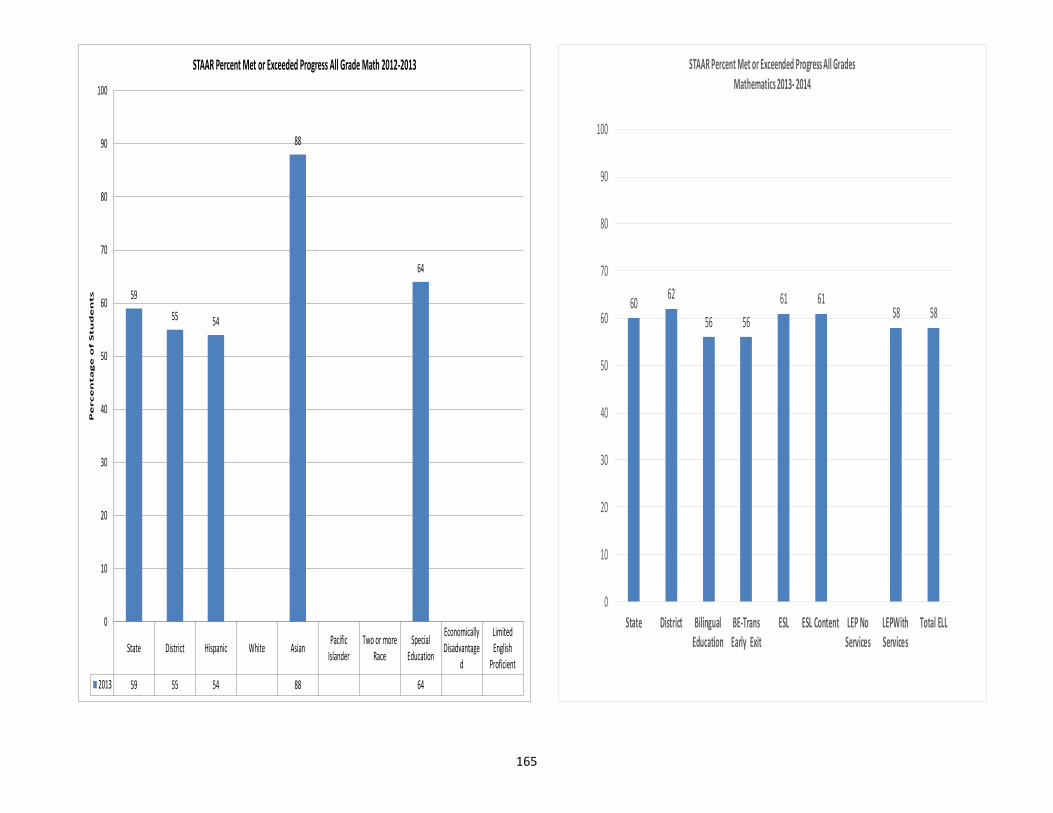
165
State District Hispanic White AsianPacific
IslanderTwo or more
RaceSpecial
Education
EconomicallyDisadvantage
d
LimitedEnglish
Proficient
2013 59 55 54 88 64
59
55 54
88
64
0
10
20
30
40
50
60
70
80
90
100P
erce
nta
ge
of S
tu
de
nts
STAAR Percent Met or Exceeded Progress All Grade Math 2012-2013
6062
56 56
61 6158 58
0
10
20
30
40
50
60
70
80
90
100
State District BilingualEducation
BE-TransEarly Exit
ESL ESL Content LEP NoServices
LEPWithServices
Total ELL
STAAR Percent Met or Exceended Progress All Grades Mathematics 2013- 2014
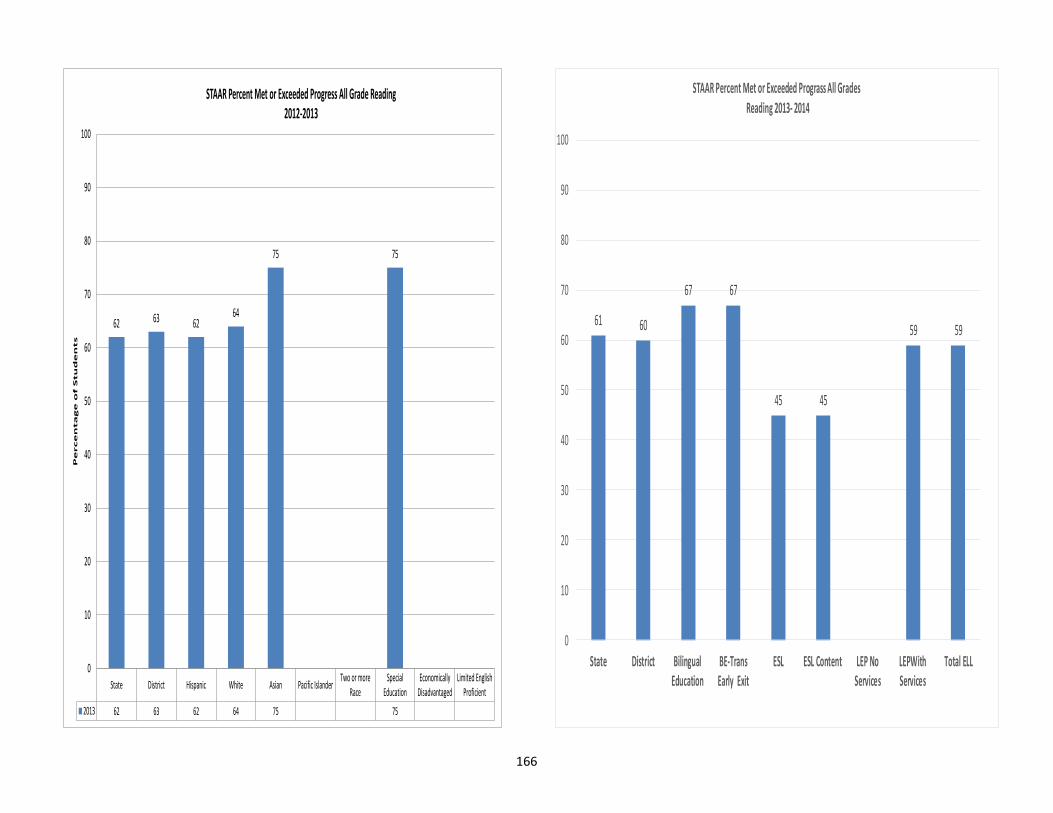
166
61 60
67 67
45 45
59 59
0
10
20
30
40
50
60
70
80
90
100
State District BilingualEducation
BE-TransEarly Exit
ESL ESL Content LEP NoServices
LEPWithServices
Total ELL
STAAR Percent Met or Exceeded Prograss All GradesReading 2013- 2014
State District Hispanic White Asian Pacific IslanderTwo or more
RaceSpecial
EducationEconomically
DisadvantagedLimited English
Proficient
2013 62 63 62 64 75 75
62 63 6264
75 75
0
10
20
30
40
50
60
70
80
90
100
Pe
rce
nta
ge
of S
tu
de
nts
STAAR Percent Met or Exceeded Progress All Grade Reading 2012-2013
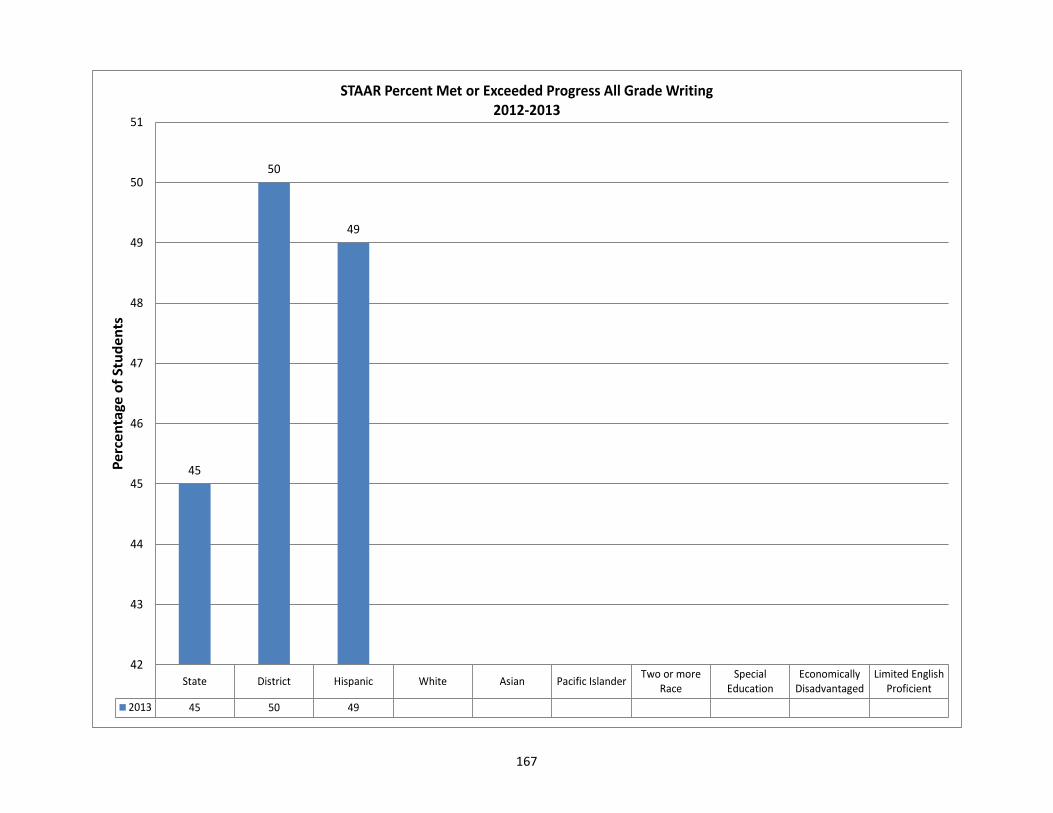
167
State District Hispanic White Asian Pacific IslanderTwo or more
RaceSpecial
EducationEconomically
DisadvantagedLimited English
Proficient
2013 45 50 49
45
50
49
42
43
44
45
46
47
48
49
50
51P
erc
en
tage
of
Stu
de
nts
STAAR Percent Met or Exceeded Progress All Grade Writing2012-2013
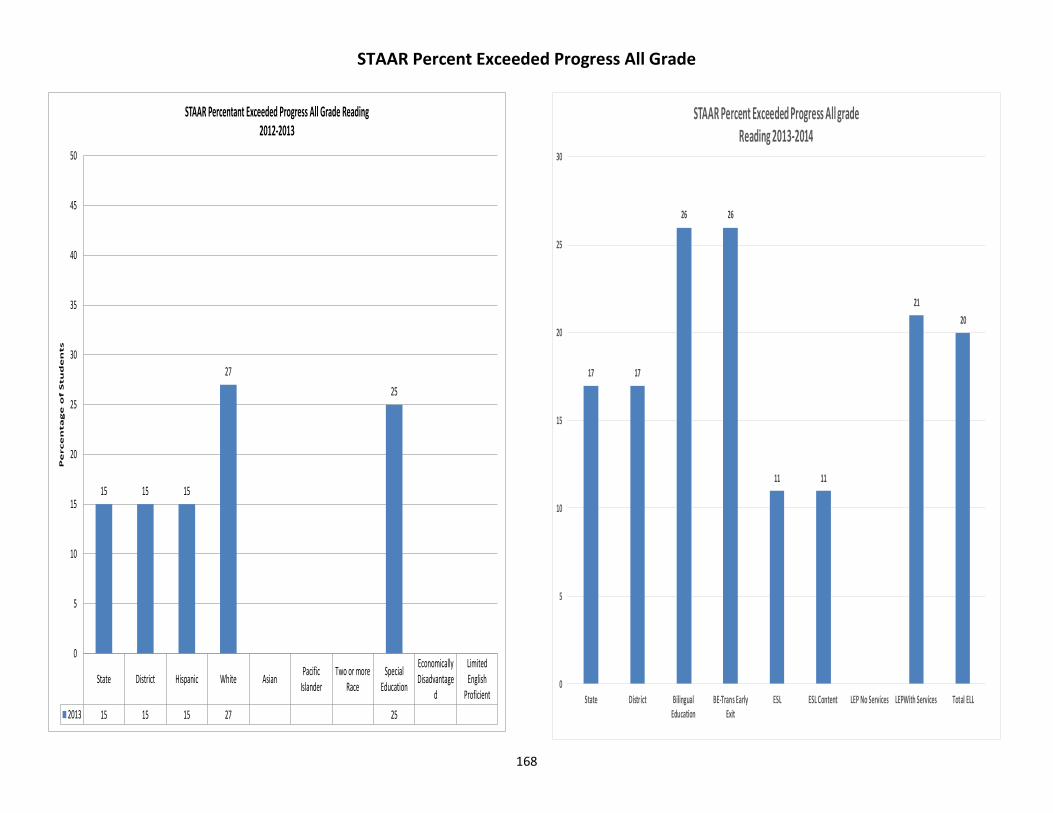
168
State District Hispanic White AsianPacific
IslanderTwo or more
RaceSpecial
Education
EconomicallyDisadvantage
d
LimitedEnglish
Proficient
2013 15 15 15 27 25
15 15 15
27
25
0
5
10
15
20
25
30
35
40
45
50
Pe
rce
nta
ge
of S
tu
de
nts
STAAR Percentant Exceeded Progress All Grade Reading2012-2013
17 17
26 26
11 11
21
20
0
5
10
15
20
25
30
State District BilingualEducation
BE-Trans EarlyExit
ESL ESL Content LEP No Services LEPWith Services Total ELL
STAAR Percent Exceeded Progress All gradeReading 2013-2014
STAAR Percent Exceeded Progress All Grade
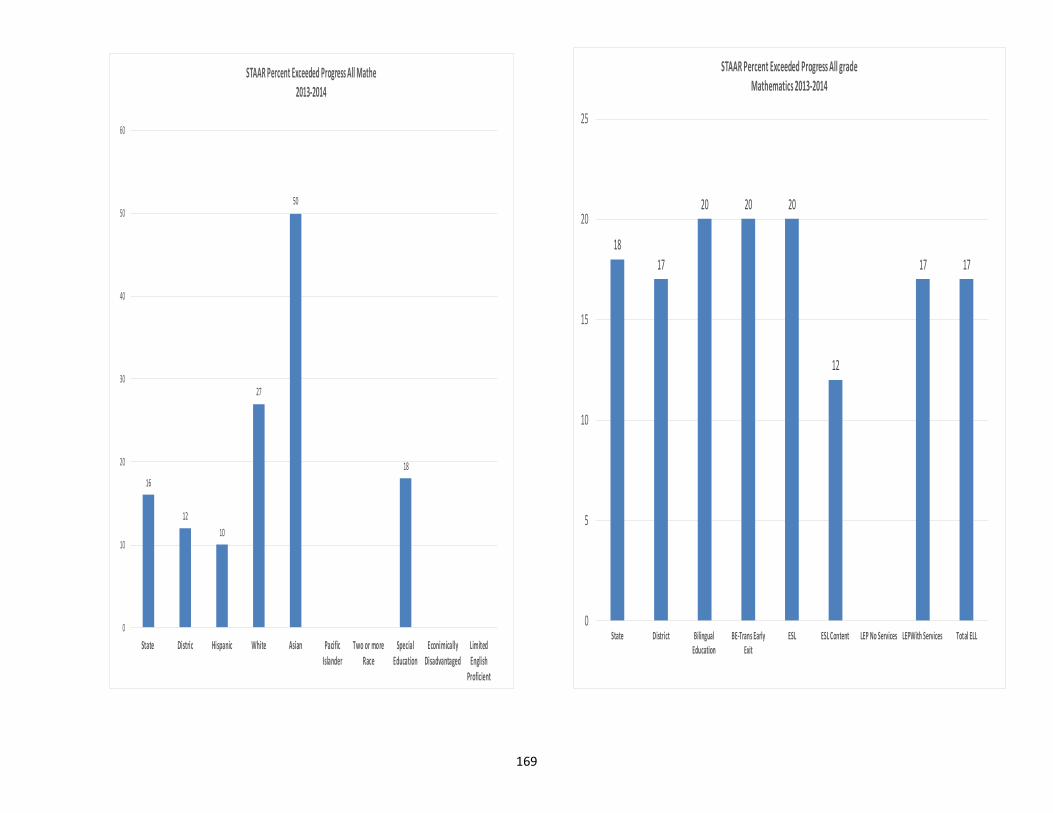
169
16
12
10
27
50
18
0
10
20
30
40
50
60
State Distric Hispanic White Asian Pacific
Islander
Two or more
Race
Special
Education
Econimically
Disadvantaged
Limited
English
Proficient
STAAR Percent Exceeded Progress All Mathe2013-2014
18
17
20 20 20
12
17 17
0
5
10
15
20
25
State District BilingualEducation
BE-Trans EarlyExit
ESL ESL Content LEP No Services LEPWith Services Total ELL
STAAR Percent Exceeded Progress All grade Mathematics 2013-2014
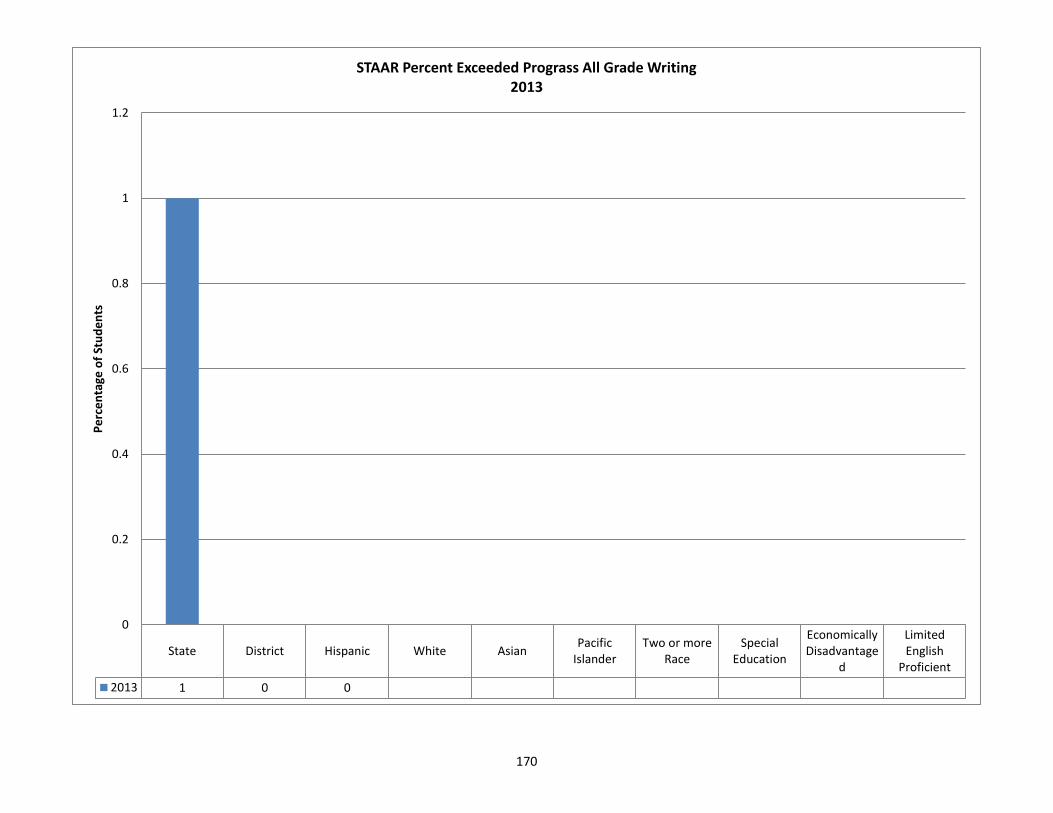
170
State District Hispanic White AsianPacific
IslanderTwo or more
RaceSpecial
Education
EconomicallyDisadvantage
d
LimitedEnglish
Proficient
2013 1 0 0
0
0.2
0.4
0.6
0.8
1
1.2P
erc
en
tage
of
Stu
de
nts
STAAR Percent Exceeded Prograss All Grade Writing 2013
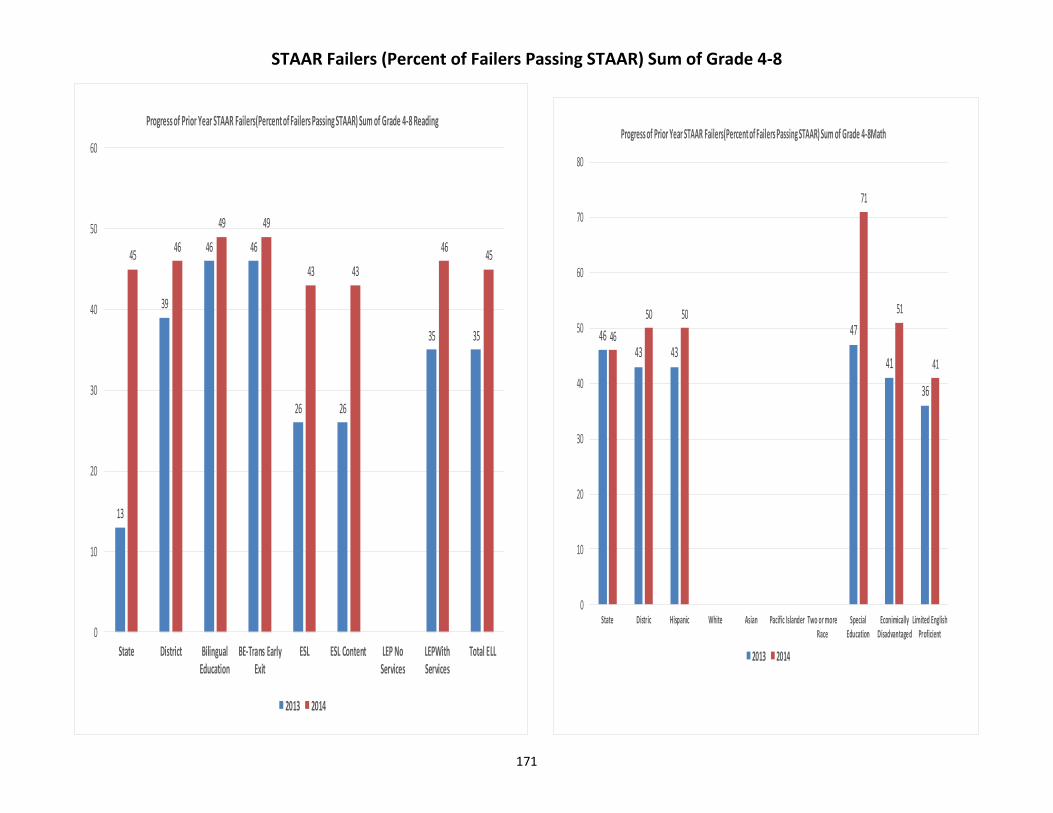
171
STAAR Failers (Percent of Failers Passing STAAR) Sum of Grade 4-8
13
39
46 46
26 26
35 35
4546
49 49
43 43
4645
0
10
20
30
40
50
60
State District BilingualEducation
BE-Trans EarlyExit
ESL ESL Content LEP NoServices
LEPWithServices
Total ELL
Progress of Prior Year STAAR Failers(Percent of Failers Passing STAAR) Sum of Grade 4-8 Reading
2013 2014
4643 43
47
41
36
46
50 50
71
51
41
0
10
20
30
40
50
60
70
80
State Distric Hispanic White Asian Pacific Islander Two or moreRace
SpecialEducation
EconimicallyDisadvantaged
Limited EnglishProficient
Progress of Prior Year STAAR Failers(Percent of Failers Passing STAAR) Sum of Grade 4-8Math
2013 2014
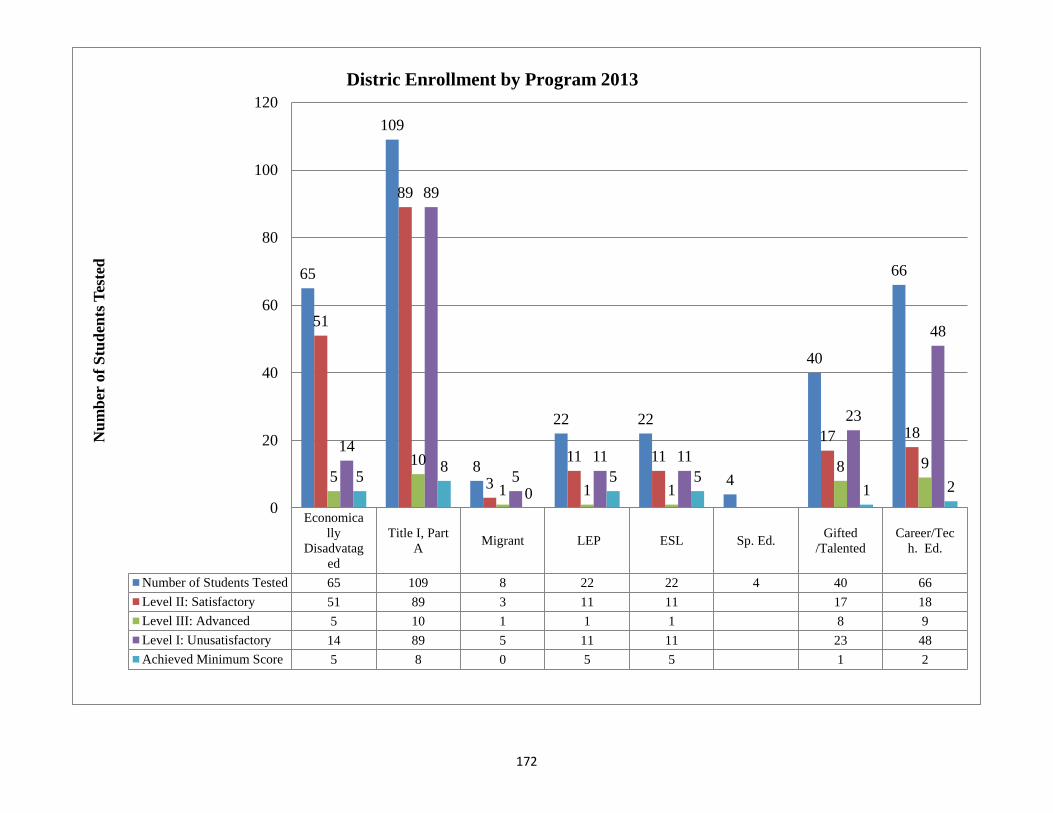
172
Economica
lly
Disadvatag
ed
Title I, Part
AMigrant LEP ESL Sp. Ed.
Gifted
/Talented
Career/Tec
h. Ed.
Number of Students Tested 65 109 8 22 22 4 40 66
Level II: Satisfactory 51 89 3 11 11 17 18
Level III: Advanced 5 10 1 1 1 8 9
Level I: Unusatisfactory 14 89 5 11 11 23 48
Achieved Minimum Score 5 8 0 5 5 1 2
65
109
8
22 22
4
40
66
51
89
3
11 11
17 18
510
1 1 1
8 914
89
5
11 11
23
48
58
05 5
1 2
0
20
40
60
80
100
120N
um
ber
of
Stu
den
ts T
este
d
Distric Enrollment by Program 2013
173
Comprehensive Needs Assessment
The purpose of a needs assessment is to identify the strengths and weaknesses of existing programs, practices, procedures, and
activities. There are many areas that data may be collected in order to get the big picture of the school. Data may come from
students’ norm reference, and criterion reference scores, archival data, school demographic data, surveys, and focus group
interviews. The stakeholders must know where they are and where they want to be. They must identify any hurdles that they
may encounter in order to achieve their goal. A Comprehensive Needs Assessment/Analysis the process of identifying causes
of performance problems in order to select methods, means, tactics, tools and approaches for solving the problems.
TEC §11.252(a)(1) District-Level Planning and Decision-Making requires a comprehensive needs assessment addressing
district student performance on the academic excellence indicators, and other appropriate measures of performance, that are
disaggregated by all student groups served by the district, including categories of ethnicity, socioeconomic status, sex, and
populations served by special programs; including students in special education programs under Subchapter A, Chapter 29.
NCLB Act of 2001--Title I, Part A--§1114(b)(1) School wide Programs requires a comprehensive needs assessment of the
entire school that is based on information on the achievement of children in relation to the State academic content standards and
student academic achievement standards.
District Focus Areas
The Board of Education has established four focus areas for Presidio Independent School District. They are: Student Learning,
Quality Learning and Working Environment, Effective and Efficient Organization, and Parent and Community Engagement.
Each of these focus areas will have a continuous improvement plan based on the comprehensive needs assessment. In addition,
each campus will have a continuous improvement plan that is aligned to the District continuous improvement plan. Each of the
four focus areas will have a goal and continuous improvement action steps. In addition, each focus area will have a
measurement system to keep everyone informed on how well the District is doing in meeting its goals. The data to assess the
needs of the District in the focus areas follows as a major part of the Comprehensive Needs Assessment. The other part of the
Comprehensive Needs Assessment will be the findings that result from the data. Note that additional data for each subgroup in
provided in the Appendices.
174
Focus Area: Student Learning
The Student Learning Focus Area will be measured by the following measurements at the District Level:
o Texas Assessment of Knowledge and Skills (TAKS) Results
Percent of students passing by subject and by Federal and State mandated sub populations
Scale Scores
Commended Performance
Participation Rate
o Texas English Language Proficiency Assessment System (TELPAS) Results
o Passing Rates
o College Readiness Indicators
SAT/ACT Data
AP Course Performance
College Course Performance
Texas Success initiative(TSI)
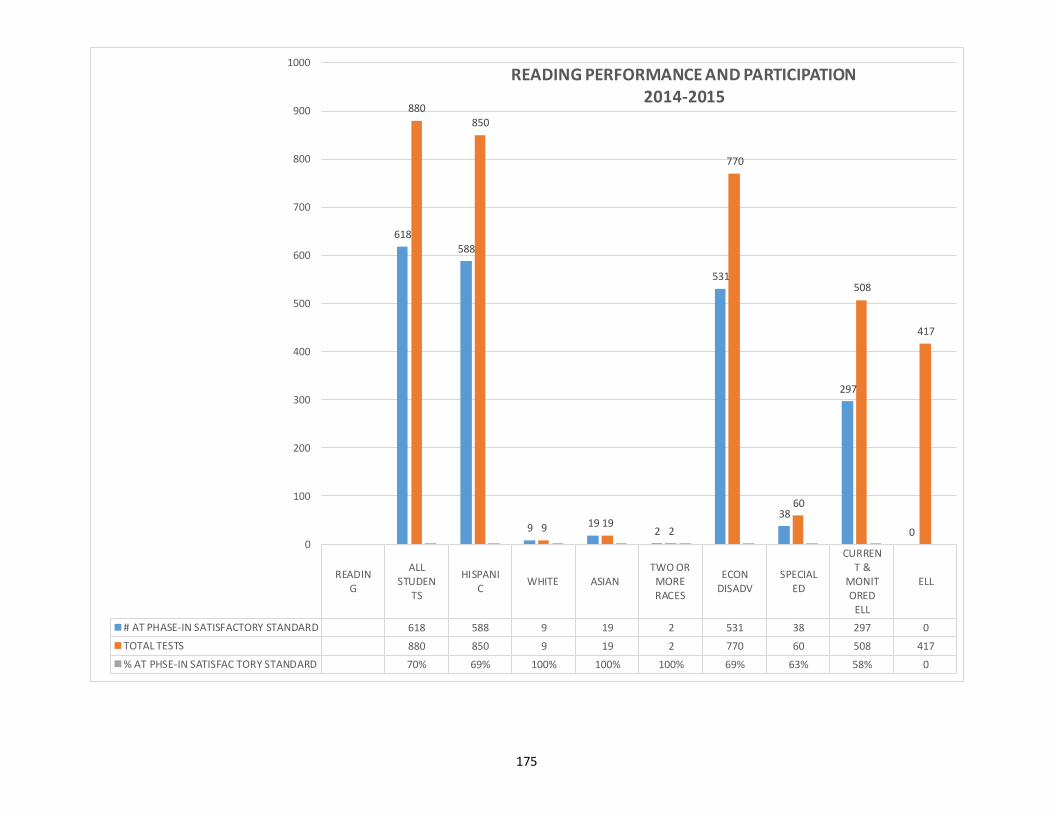
175
READING
ALLSTUDEN
TS
HISPANIC
WHITE ASIANTWO OR
MORERACES
ECONDISADV
SPECIALED
CURRENT &
MONITORED
ELL
ELL
# AT PHASE-IN SATISFACTORY STANDARD 618 588 9 19 2 531 38 297 0
TOTAL TESTS 880 850 9 19 2 770 60 508 417
% AT PHSE-IN SATISFAC TORY STANDARD 70% 69% 100% 100% 100% 69% 63% 58% 0
618
588
9 192
531
38
297
0
880
850
9 192
770
60
508
417
0
100
200
300
400
500
600
700
800
900
1000READING PERFORMANCE AND PARTICIPATION
2014-2015
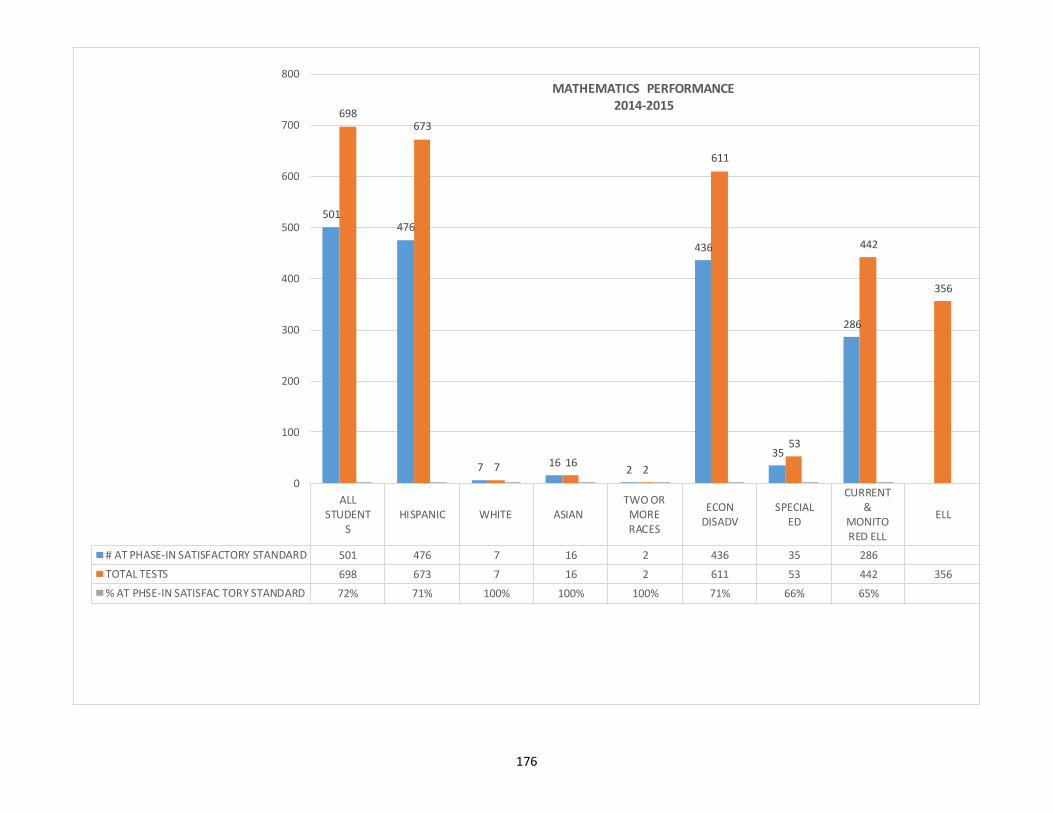
176
ALLSTUDENT
SHISPANIC WHITE ASIAN
TWO ORMORERACES
ECONDISADV
SPECIALED
CURRENT&
MONITORED ELL
ELL
# AT PHASE-IN SATISFACTORY STANDARD 501 476 7 16 2 436 35 286
TOTAL TESTS 698 673 7 16 2 611 53 442 356
% AT PHSE-IN SATISFAC TORY STANDARD 72% 71% 100% 100% 100% 71% 66% 65%
501476
7 162
436
35
286
698673
7 162
611
53
442
356
0
100
200
300
400
500
600
700
800
MATHEMATICS PERFORMANCE 2014-2015
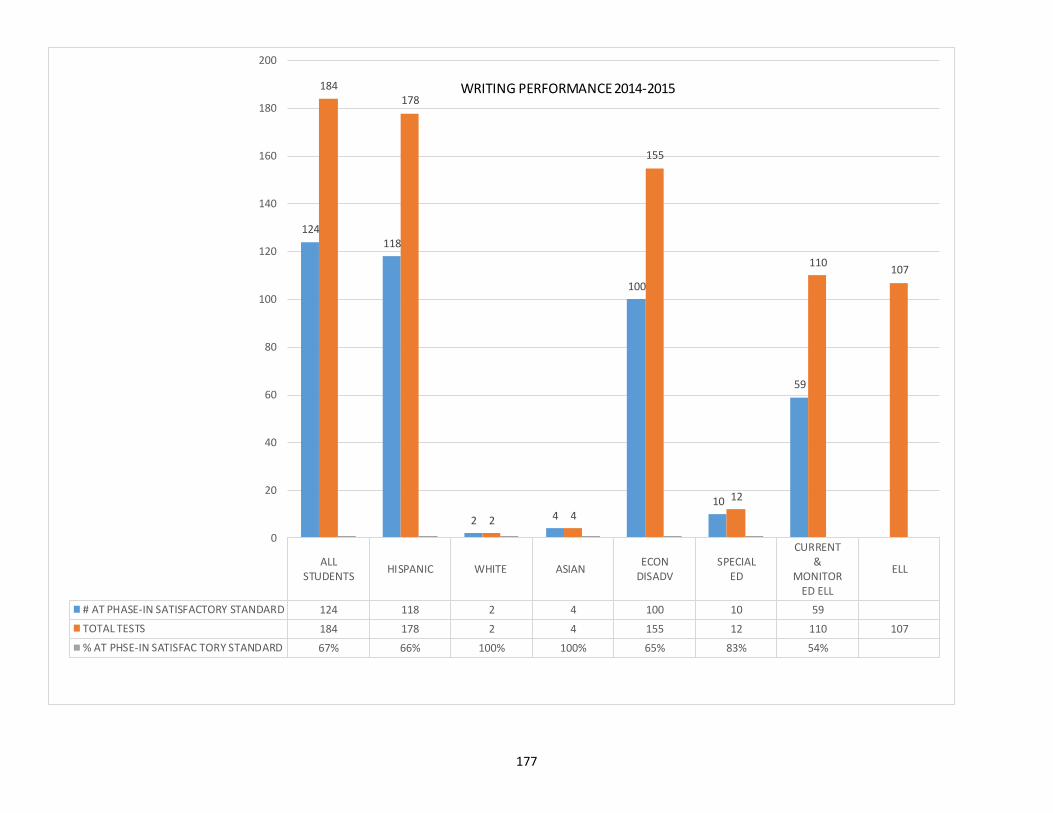
177
ALLSTUDENTS
HISPANIC WHITE ASIANECON
DISADVSPECIAL
ED
CURRENT&
MONITORED ELL
ELL
# AT PHASE-IN SATISFACTORY STANDARD 124 118 2 4 100 10 59
TOTAL TESTS 184 178 2 4 155 12 110 107
% AT PHSE-IN SATISFAC TORY STANDARD 67% 66% 100% 100% 65% 83% 54%
124118
2 4
100
10
59
184178
2 4
155
12
110107
0
20
40
60
80
100
120
140
160
180
200
WRITING PERFORMANCE 2014-2015
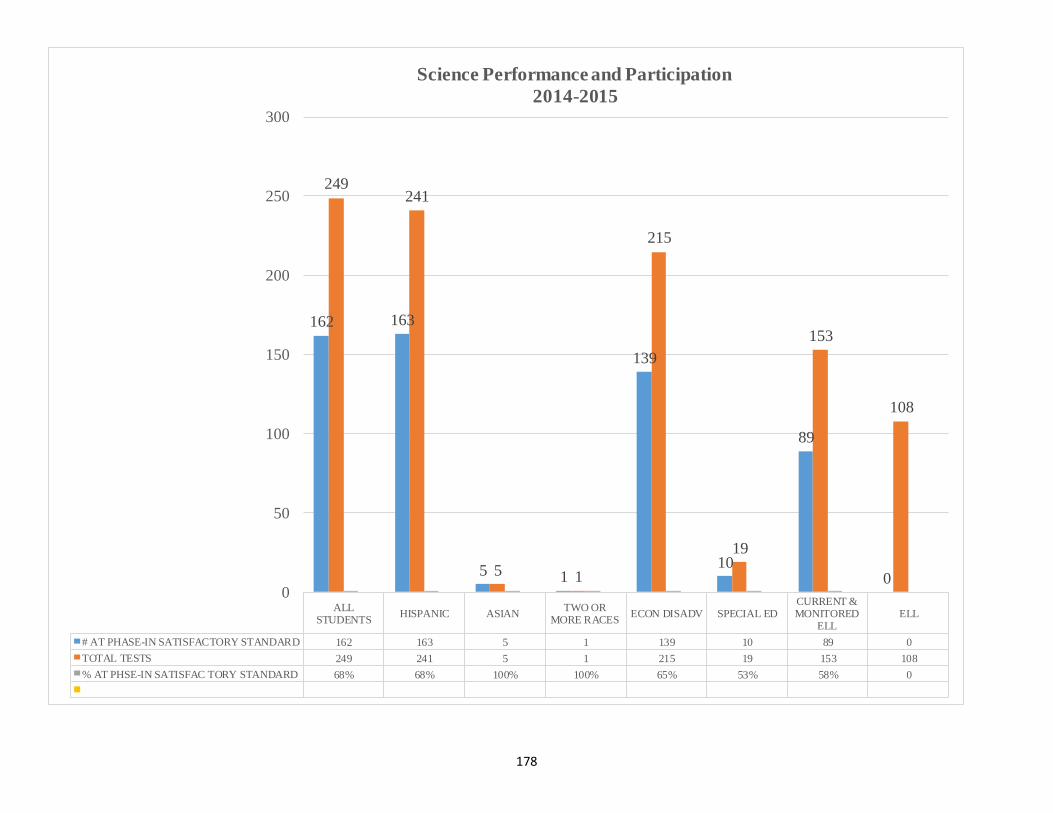
178
ALLSTUDENTS
HISPANIC ASIANTWO OR
MORE RACESECON DISADV SPECIAL ED
CURRENT &MONITORED
ELLELL
# AT PHASE-IN SATISFACTORY STANDARD 162 163 5 1 139 10 89 0
TOTAL TESTS 249 241 5 1 215 19 153 108
% AT PHSE-IN SATISFAC TORY STANDARD 68% 68% 100% 100% 65% 53% 58% 0
162 163
5 1
139
10
89
0
249241
5 1
215
19
153
108
0
50
100
150
200
250
300
Science Performance and Participation
2014-2015
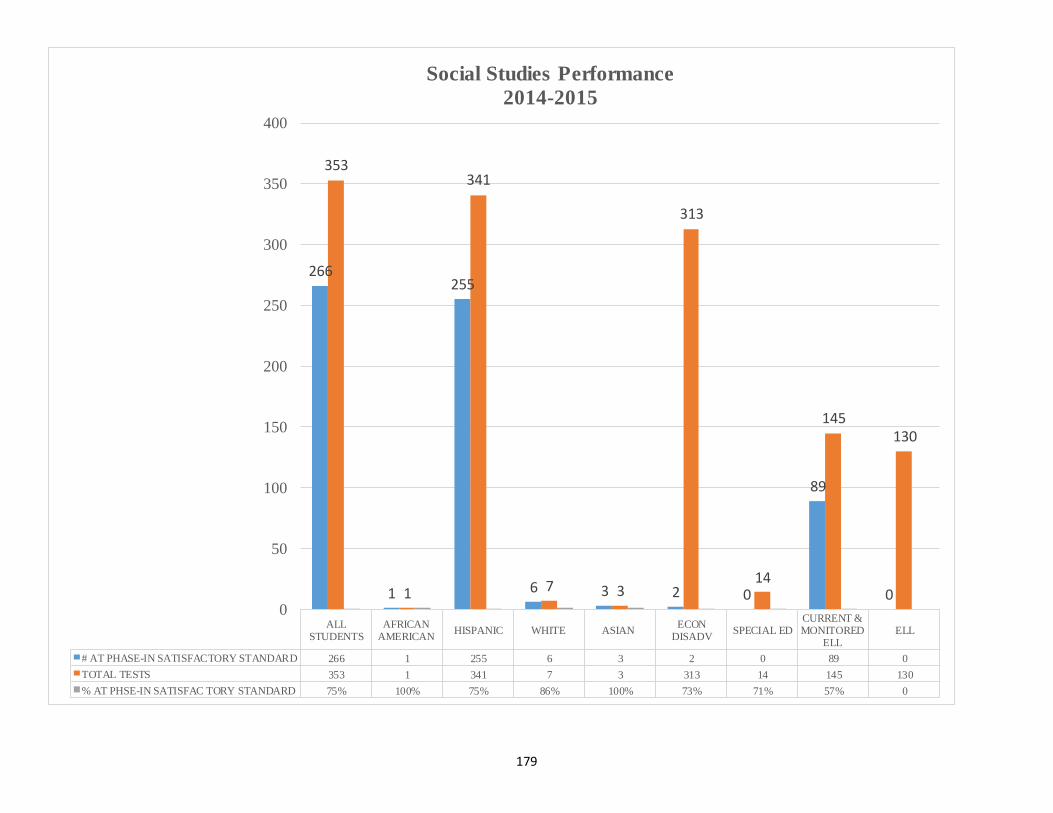
179
ALLSTUDENTS
AFRICANAMERICAN
HISPANIC WHITE ASIANECON
DISADVSPECIAL ED
CURRENT &MONITORED
ELLELL
# AT PHASE-IN SATISFACTORY STANDARD 266 1 255 6 3 2 0 89 0
TOTAL TESTS 353 1 341 7 3 313 14 145 130
% AT PHSE-IN SATISFAC TORY STANDARD 75% 100% 75% 86% 100% 73% 71% 57% 0
266
1
255
6 3 2 0
89
0
353
1
341
7 3
313
14
145130
0
50
100
150
200
250
300
350
400
Social Studies Performance
2014-2015
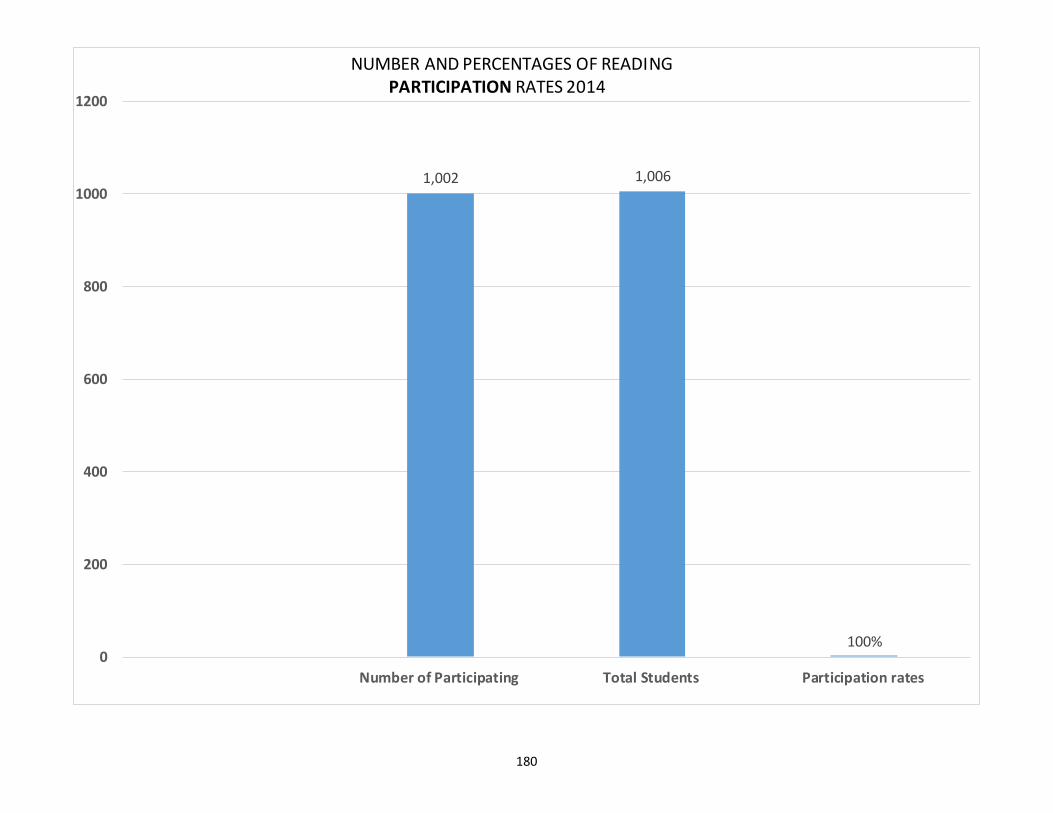
180
1,002 1,006
100%0
200
400
600
800
1000
1200
Number of Participating Total Students Participation rates
NUMBER AND PERCENTAGES OF READINGPARTICIPATION RATES 2014
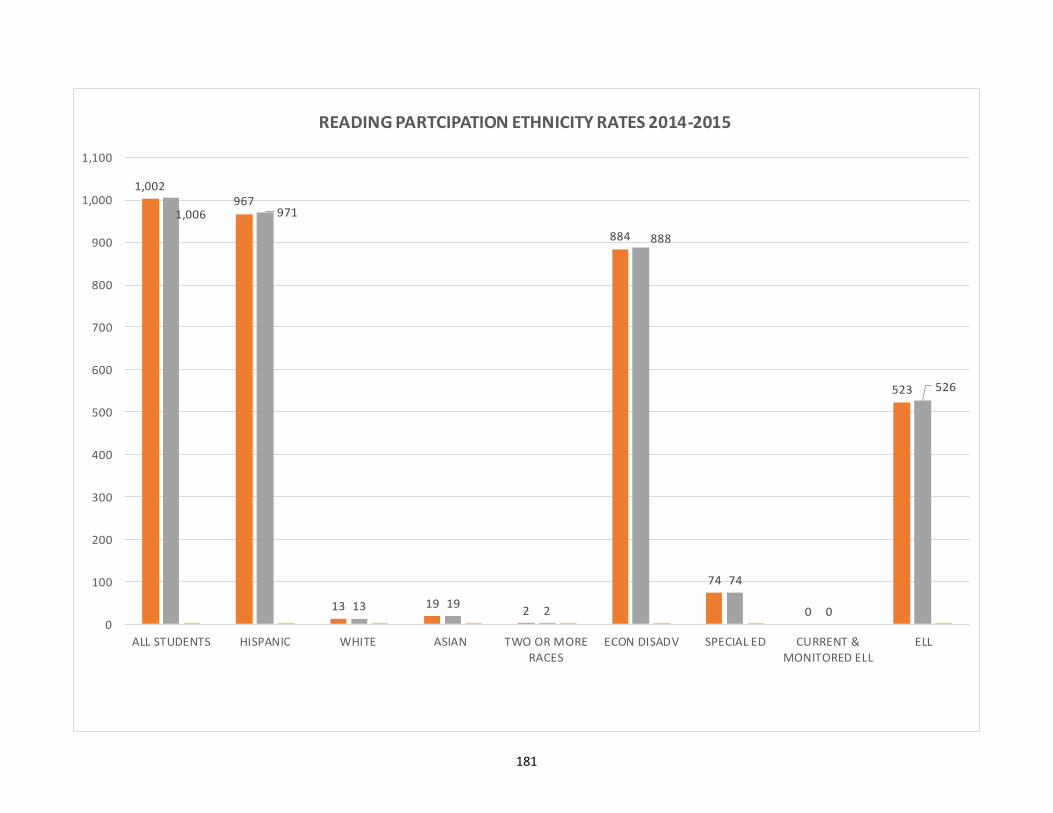
181
1,002967
13 192
884
74
0
523
1,006 971
13 192
888
74
0
526
0
100
200
300
400
500
600
700
800
900
1,000
1,100
ALL STUDENTS HISPANIC WHITE ASIAN TWO OR MORE
RACES
ECON DISADV SPECIAL ED CURRENT &
MONITORED ELL
ELL
READING PARTCIPATION ETHNICITY RATES 2014-2015
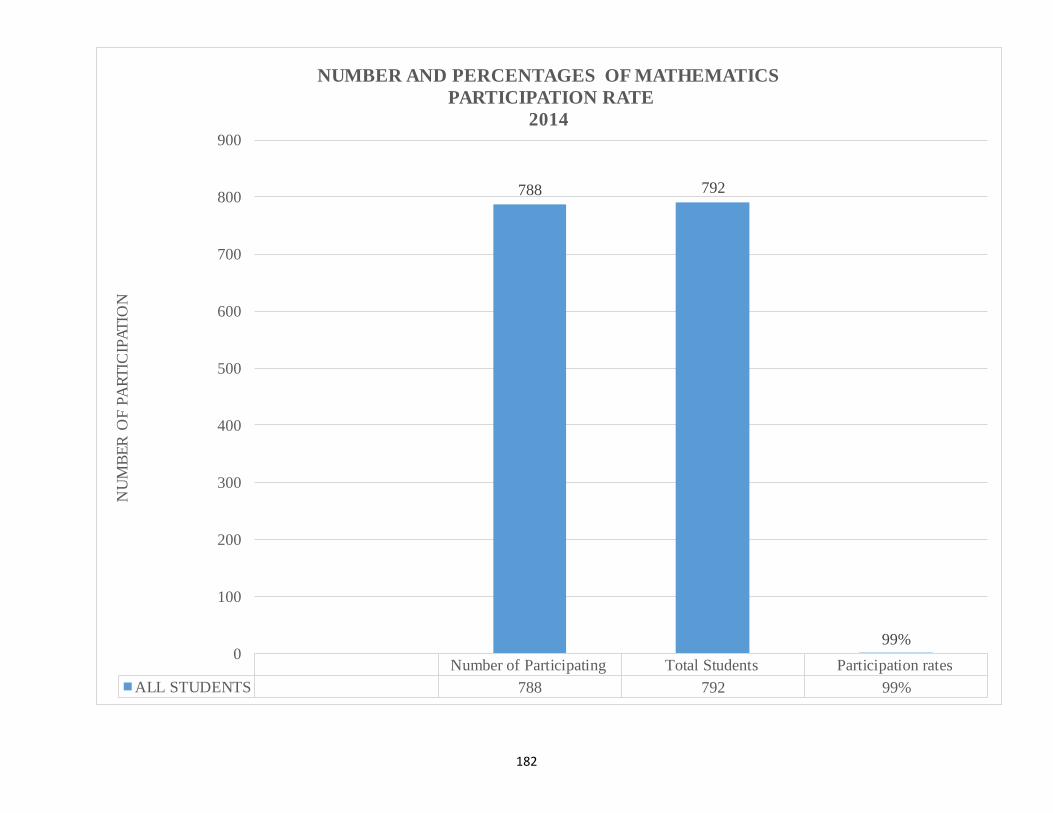
182
Number of Participating Total Students Participation rates
ALL STUDENTS 788 792 99%
788 792
99%0
100
200
300
400
500
600
700
800
900
NU
MB
ER
OF
PA
RT
ICIP
AT
ION
NUMBER AND PERCENTAGES OF MATHEMATICS
PARTICIPATION RATE
2014
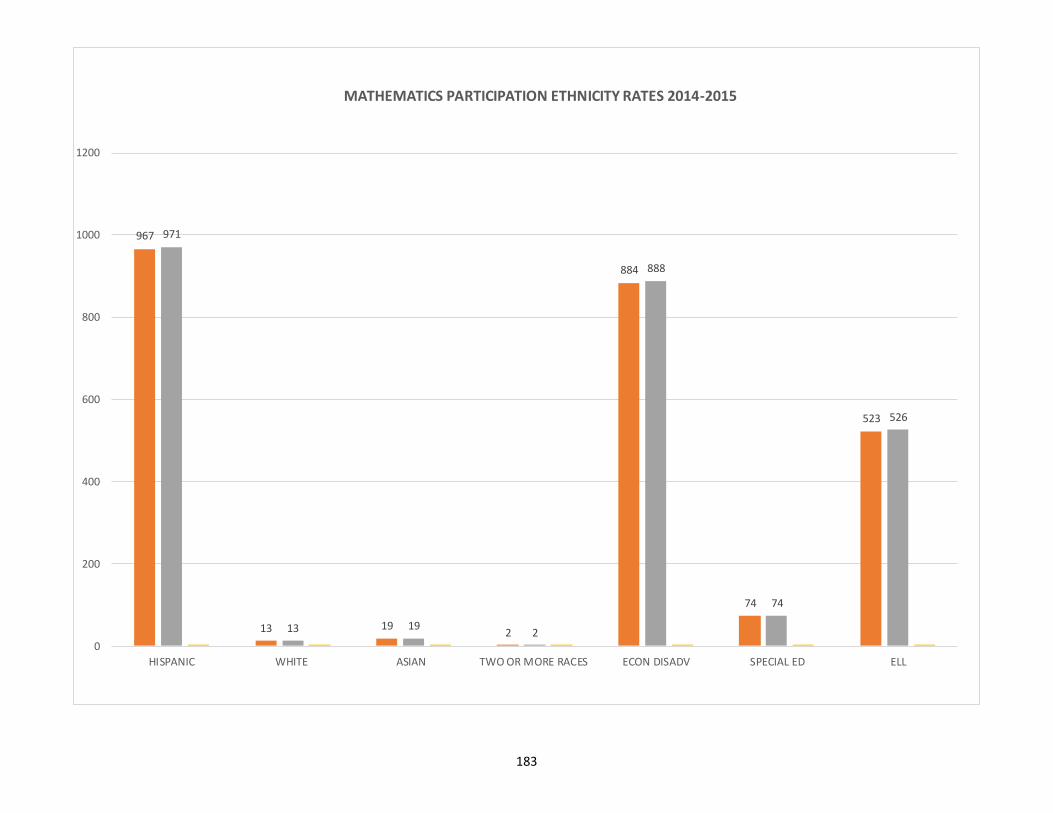
183
967
13 192
884
74
523
971
13 192
888
74
526
0
200
400
600
800
1000
1200
HISPANIC WHITE ASIAN TWO OR MORE RACES ECON DISADV SPECIAL ED ELL
MATHEMATICS PARTICIPATION ETHNICITY RATES 2014-2015
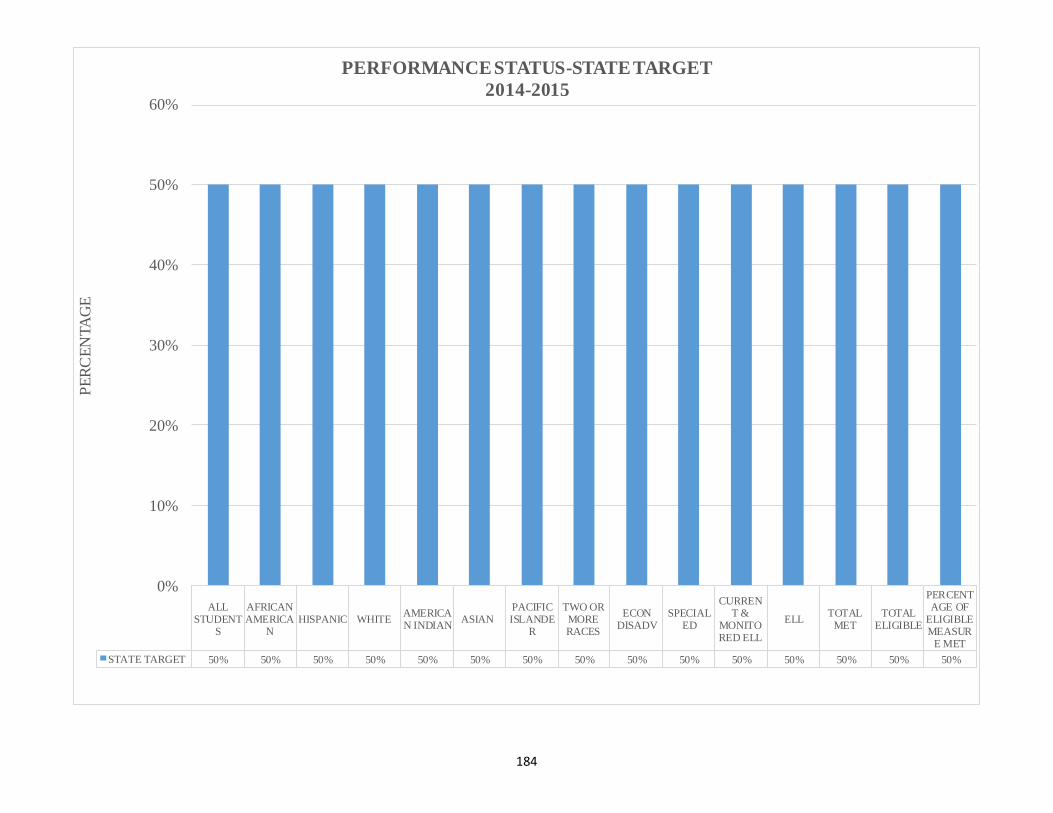
184
ALLSTUDENT
S
AFRICANAMERICA
NHISPANIC WHITE
AMERICAN INDIAN
ASIANPACIFICISLANDE
R
TWO ORMORERACES
ECONDISADV
SPECIALED
CURRENT &
MONITORED ELL
ELLTOTAL
METTOTAL
ELIGIBLE
PERCENTAGE OF
ELIGIBLEMEASUR
E MET
STATE TARGET 50% 50% 50% 50% 50% 50% 50% 50% 50% 50% 50% 50% 50% 50% 50%
0%
10%
20%
30%
40%
50%
60%
PE
RC
EN
TA
GE
PERFORMANCE STATUS-STATE TARGET
2014-2015
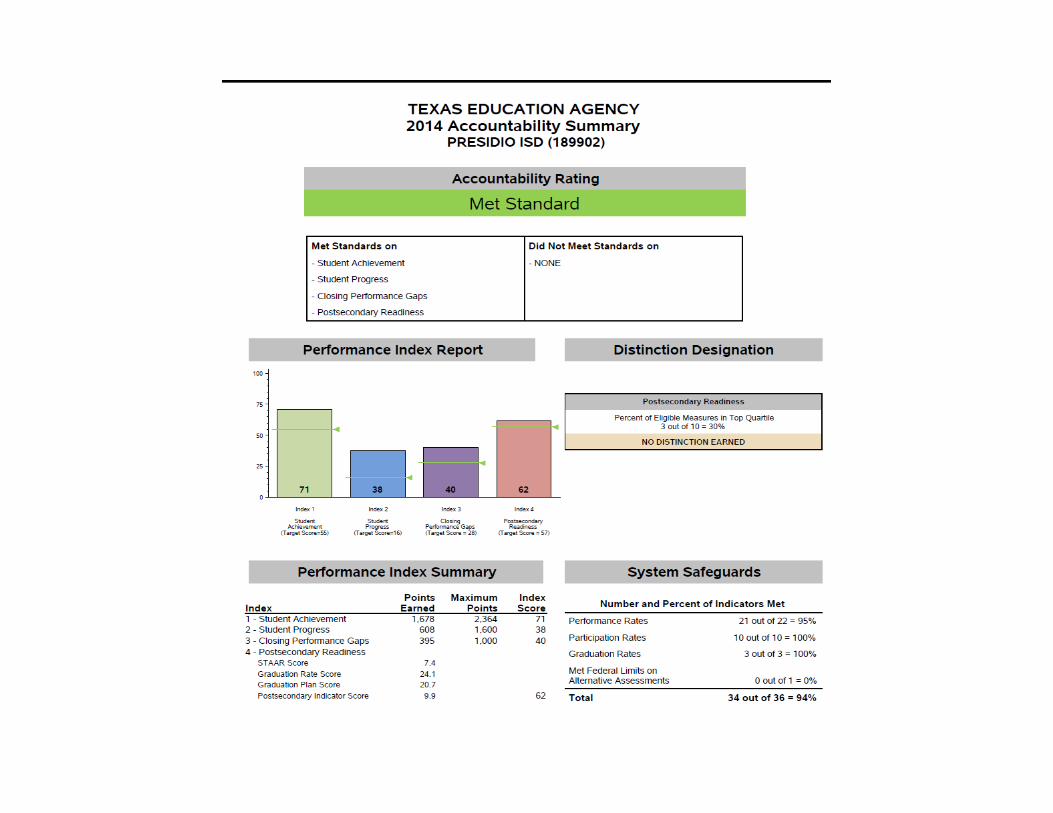
185
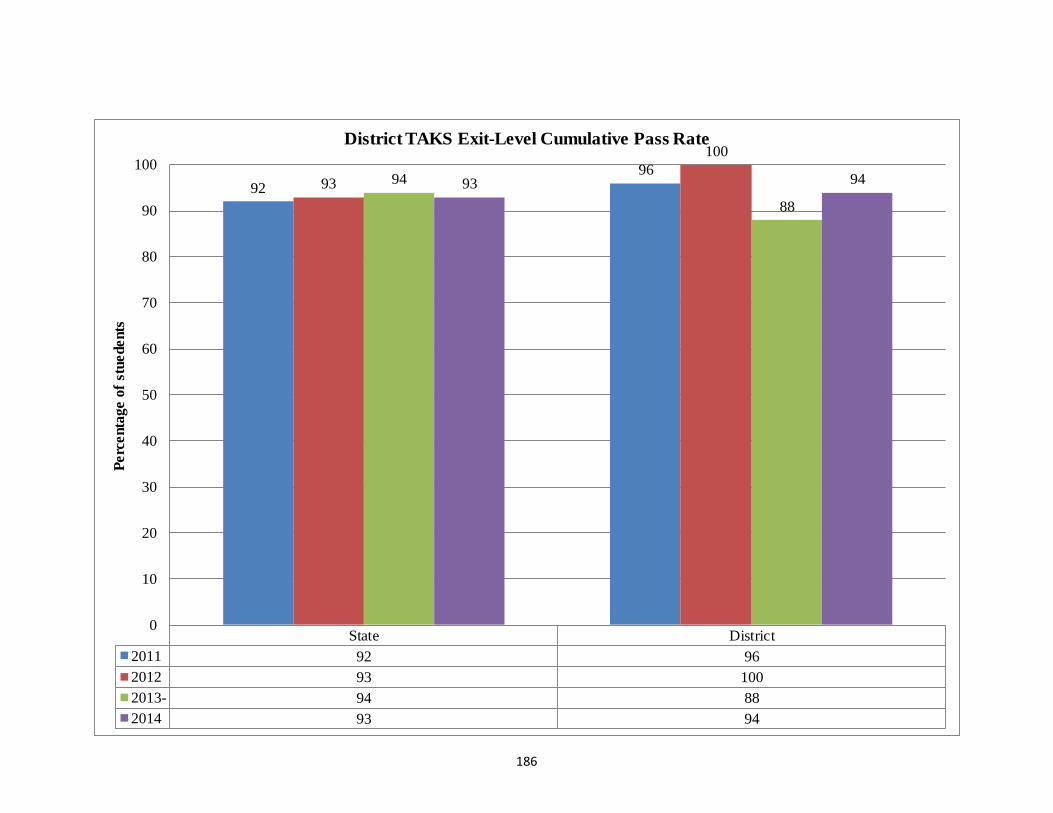
186
State District
2011 92 96
2012 93 100
2013- 94 88
2014 93 94
92
9693
100
94
88
93 94
0
10
20
30
40
50
60
70
80
90
100
Perc
enta
ge o
f st
uedents
District TAKS Exit-Level Cumulative Pass Rate
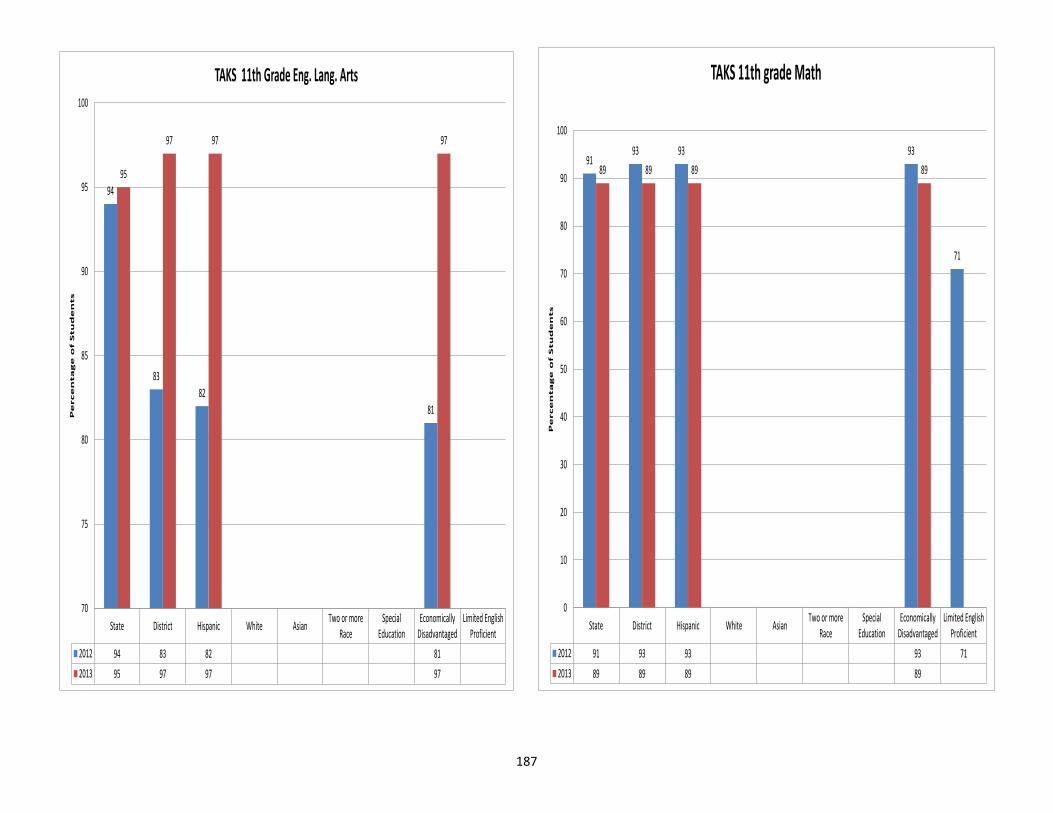
187
State District Hispanic White AsianTwo or more
RaceSpecial
EducationEconomically
DisadvantagedLimited English
Proficient
2012 94 83 82 81
2013 95 97 97 97
94
83
82
81
95
97 97 97
70
75
80
85
90
95
100
Pe
rce
nta
ge
of S
tu
de
nts
TAKS 11th Grade Eng. Lang. Arts
State District Hispanic White AsianTwo or more
RaceSpecial
EducationEconomically
DisadvantagedLimited English
Proficient
2012 91 93 93 93 71
2013 89 89 89 89
9193 93 93
71
89 89 89 89
0
10
20
30
40
50
60
70
80
90
100
Pe
rce
nta
ge
of S
tu
de
nts
TAKS 11th grade Math
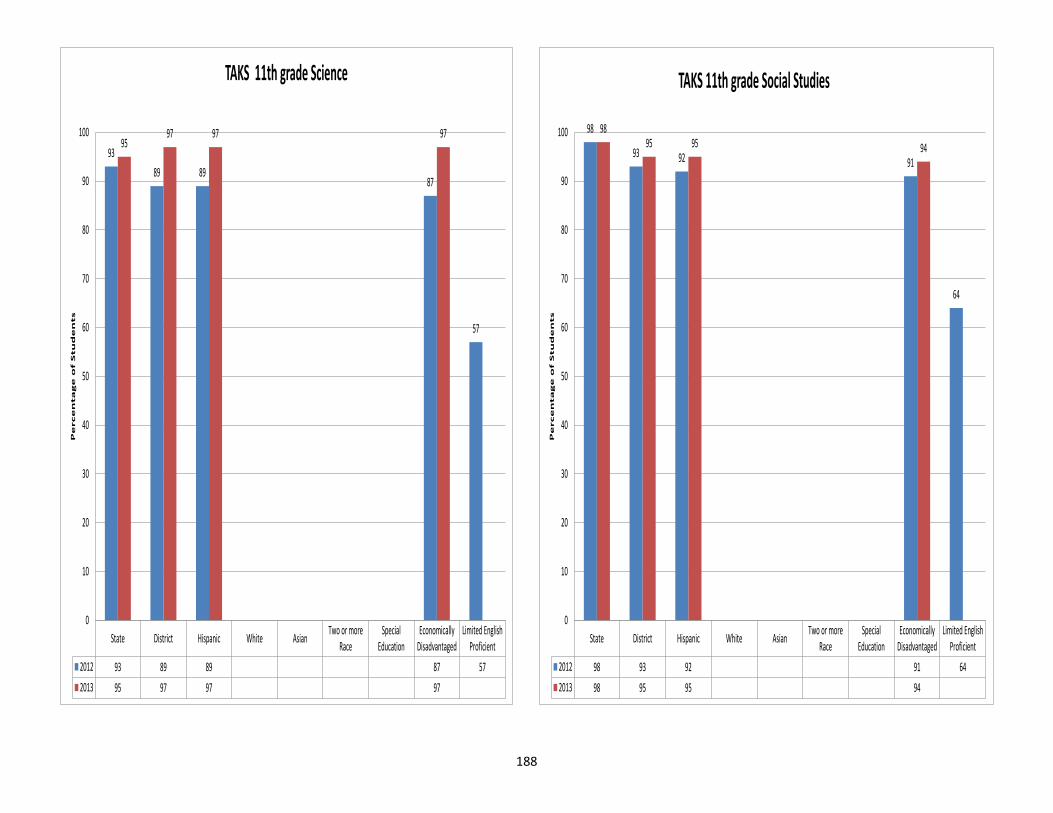
188
State District Hispanic White AsianTwo or more
RaceSpecial
EducationEconomically
DisadvantagedLimited English
Proficient
2012 93 89 89 87 57
2013 95 97 97 97
93
89 8987
57
9597 97 97
0
10
20
30
40
50
60
70
80
90
100
Pe
rce
nta
ge
of S
tu
de
nts
TAKS 11th grade Science
State District Hispanic White AsianTwo or more
RaceSpecial
EducationEconomically
DisadvantagedLimited English
Proficient
2012 98 93 92 91 64
2013 98 95 95 94
98
93 92 91
64
9895 95 94
0
10
20
30
40
50
60
70
80
90
100
Pe
rce
nta
ge
of S
tu
de
nts
TAKS 11th grade Social Studies
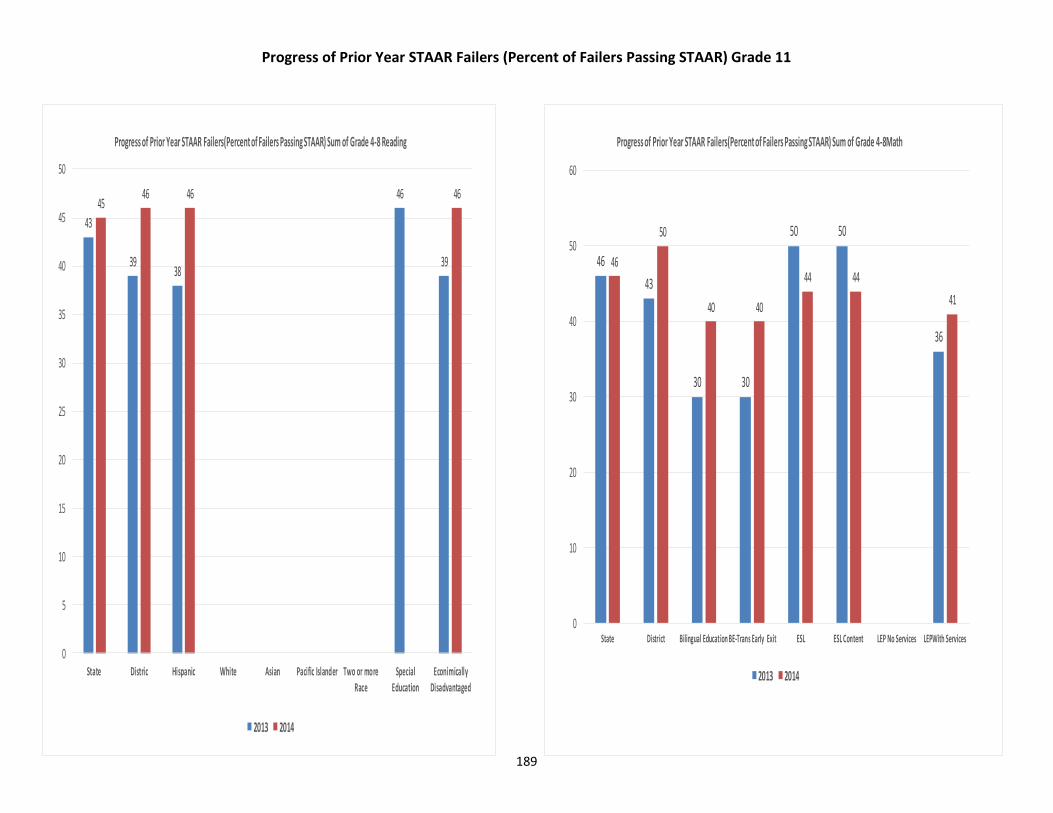
189
43
3938
46
39
4546 46 46
0
5
10
15
20
25
30
35
40
45
50
State Distric Hispanic White Asian Pacific Islander Two or more
Race
Special
Education
Econimically
Disadvantaged
Progress of Prior Year STAAR Failers(Percent of Failers Passing STAAR) Sum of Grade 4-8 Reading
2013 2014
46
43
30 30
50 50
36
46
50
40 40
44 44
41
0
10
20
30
40
50
60
State District Bilingual Education BE-Trans Early Exit ESL ESL Content LEP No Services LEPWith Services
Progress of Prior Year STAAR Failers(Percent of Failers Passing STAAR) Sum of Grade 4-8Math
2013 2014
Progress of Prior Year STAAR Failers (Percent of Failers Passing STAAR) Grade 11
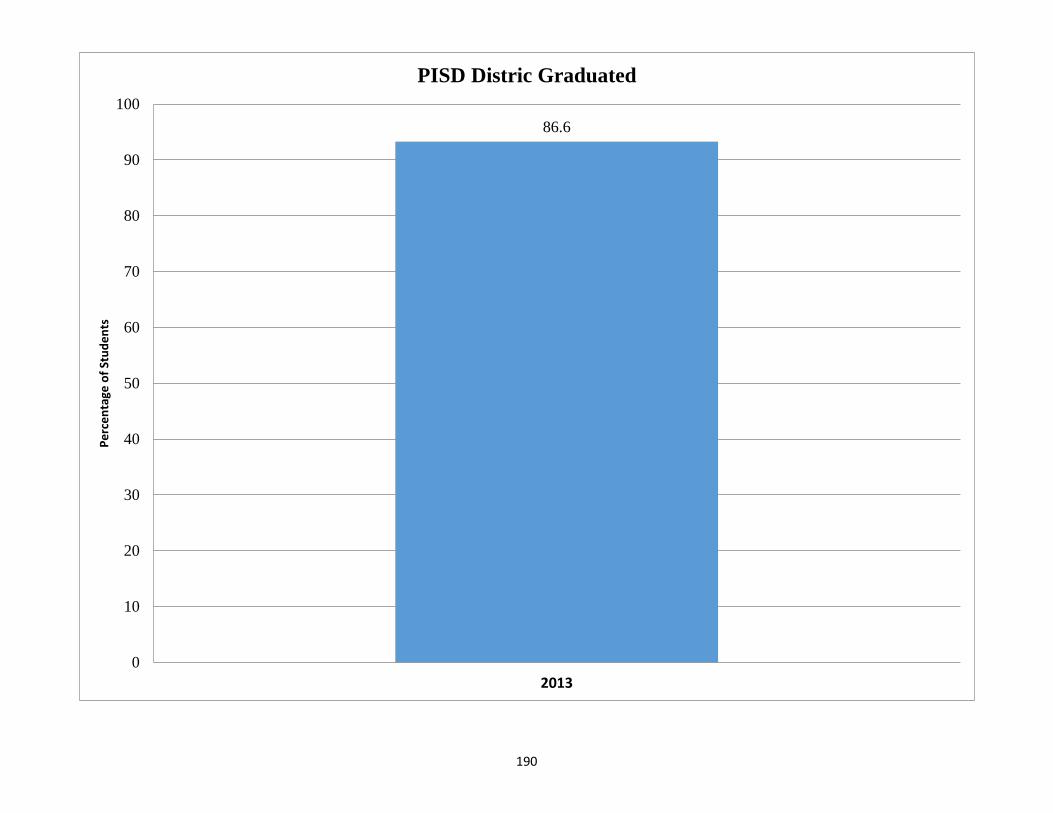
190
86.6
0
10
20
30
40
50
60
70
80
90
100
2013
Pe
rce
nta
ge o
f St
ud
en
ts
PISD Distric Graduated
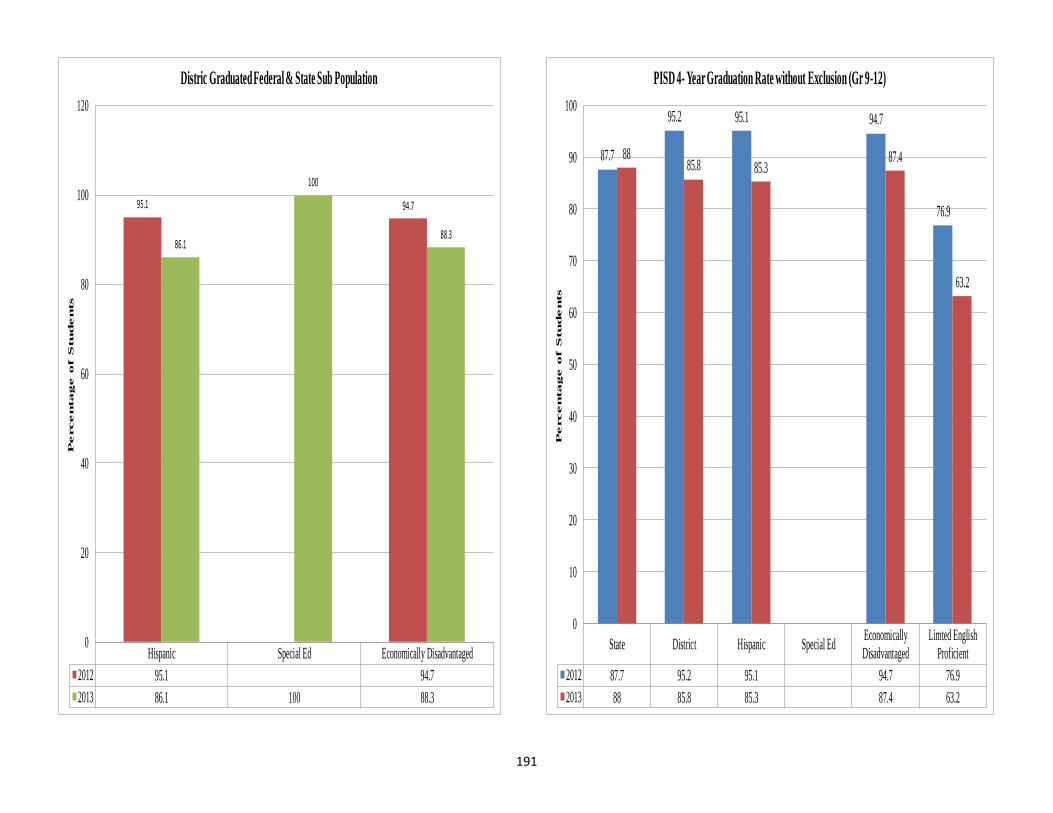
191
Hispanic Special Ed Economically Disadvantaged
2012 95.1 94.7
2013 86.1 100 88.3
95.1 94.7
86.1
100
88.3
0
20
40
60
80
100
120
Pe
rce
nta
ge
o
f S
tu
de
nts
Distric Graduated Federal & State Sub Population
State District Hispanic Special EdEconomically
Disadvantaged
Limted English
Proficient
2012 87.7 95.2 95.1 94.7 76.9
2013 88 85.8 85.3 87.4 63.2
87.7
95.2 95.1 94.7
76.9
8885.8 85.3
87.4
63.2
0
10
20
30
40
50
60
70
80
90
100
Percenta
ge o
f S
tudents
PISD 4- Year Graduation Rate without Exclusion (Gr 9-12)
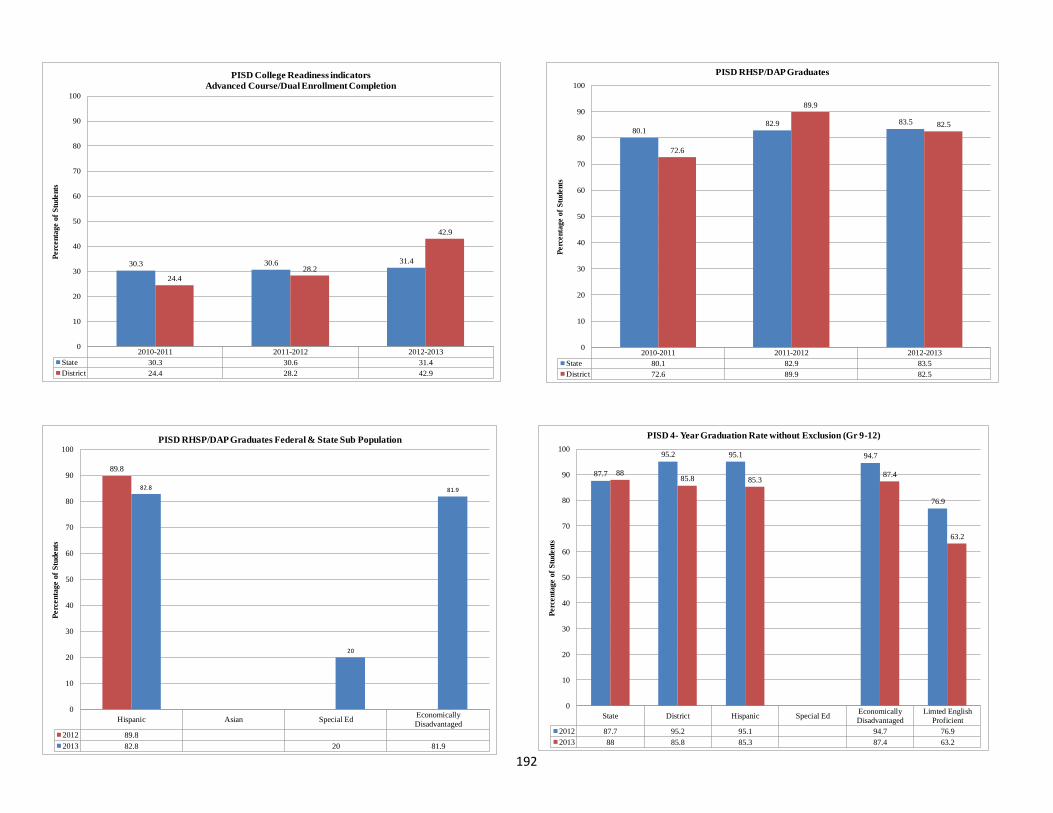
192
2010-2011 2011-2012 2012-2013
State 30.3 30.6 31.4
District 24.4 28.2 42.9
30.3 30.6 31.4
24.4
28.2
42.9
0
10
20
30
40
50
60
70
80
90
100
Perc
enta
ge o
f S
tudents
PISD College Readiness indicators
Advanced Course/Dual Enrollment Completion
2010-2011 2011-2012 2012-2013
State 80.1 82.9 83.5
District 72.6 89.9 82.5
80.182.9 83.5
72.6
89.9
82.5
0
10
20
30
40
50
60
70
80
90
100
Perc
en
tage
of
Stu
den
ts
PISD RHSP/DAP Graduates
Hispanic Asian Special EdEconomically
Disadvantaged
2012 89.8
2013 82.8 20 81.9
89.8
82.8
20
81.9
0
10
20
30
40
50
60
70
80
90
100
Perc
enta
ge o
f S
tudents
PISD RHSP/DAP Graduates Federal & State Sub Population
State District Hispanic Special EdEconomically
Disadvantaged
Limted English
Proficient
2012 87.7 95.2 95.1 94.7 76.9
2013 88 85.8 85.3 87.4 63.2
87.7
95.2 95.1 94.7
76.9
8885.8 85.3
87.4
63.2
0
10
20
30
40
50
60
70
80
90
100
Perc
enta
ge o
f S
tudents
PISD 4- Year Graduation Rate without Exclusion (Gr 9-12)
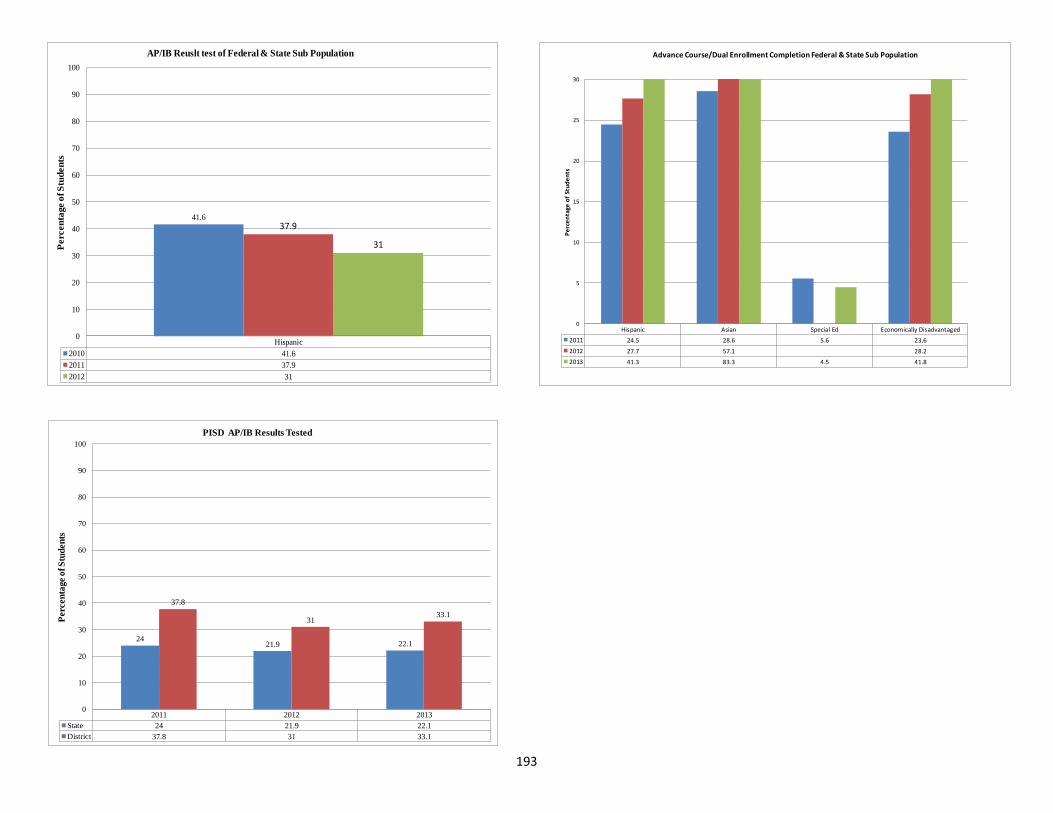
193
Hispanic
2010 41.6
2011 37.9
2012 31
41.637.9
31
0
10
20
30
40
50
60
70
80
90
100P
erc
en
tage o
f S
tud
en
tsAP/IB Reuslt test of Federal & State Sub Population
Hispanic Asian Special Ed Economically Disadvantaged
2011 24.5 28.6 5.6 23.6
2012 27.7 57.1 28.2
2013 41.3 83.3 4.5 41.8
0
5
10
15
20
25
30
Pe
rce
nta
ge o
f St
ud
en
ts
Advance Course/Dual Enrollment Completion Federal & State Sub Population
2011 2012 2013
State 24 21.9 22.1
District 37.8 31 33.1
2421.9 22.1
37.8
3133.1
0
10
20
30
40
50
60
70
80
90
100
Perc
en
tage o
f S
tud
en
ts
PISD AP/IB Results Tested
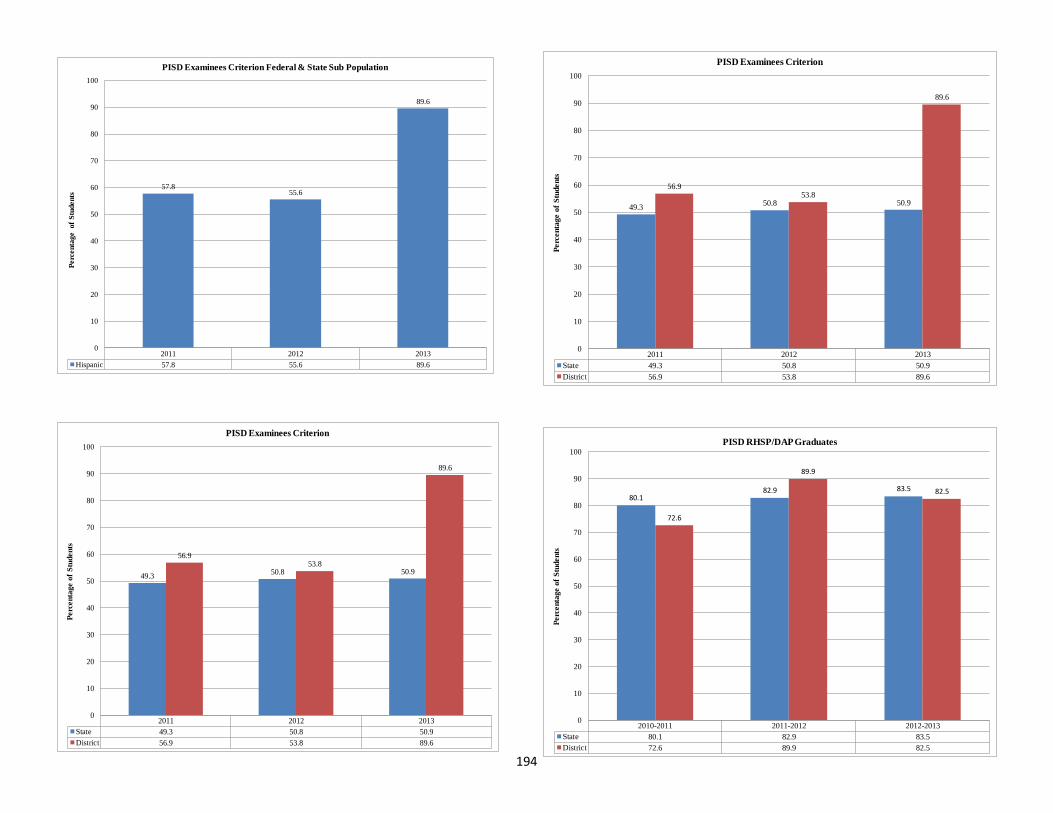
194
2011 2012 2013
State 49.3 50.8 50.9
District 56.9 53.8 89.6
49.350.8 50.9
56.953.8
89.6
0
10
20
30
40
50
60
70
80
90
100
Perc
en
tage
of
Stu
den
ts
PISD Examinees Criterion
2010-2011 2011-2012 2012-2013
State 80.1 82.9 83.5
District 72.6 89.9 82.5
80.182.9 83.5
72.6
89.9
82.5
0
10
20
30
40
50
60
70
80
90
100
Perc
en
tage
of
Stu
den
ts
PISD RHSP/DAP Graduates
2011 2012 2013
Hispanic 57.8 55.6 89.6
57.855.6
89.6
0
10
20
30
40
50
60
70
80
90
100
Pe
rce
nta
ge
o
f S
tud
en
tsPISD Examinees Criterion Federal & State Sub Population
2011 2012 2013
State 49.3 50.8 50.9
District 56.9 53.8 89.6
49.350.8 50.9
56.953.8
89.6
0
10
20
30
40
50
60
70
80
90
100
Perc
en
tage
of
Stu
den
ts
PISD Examinees Criterion
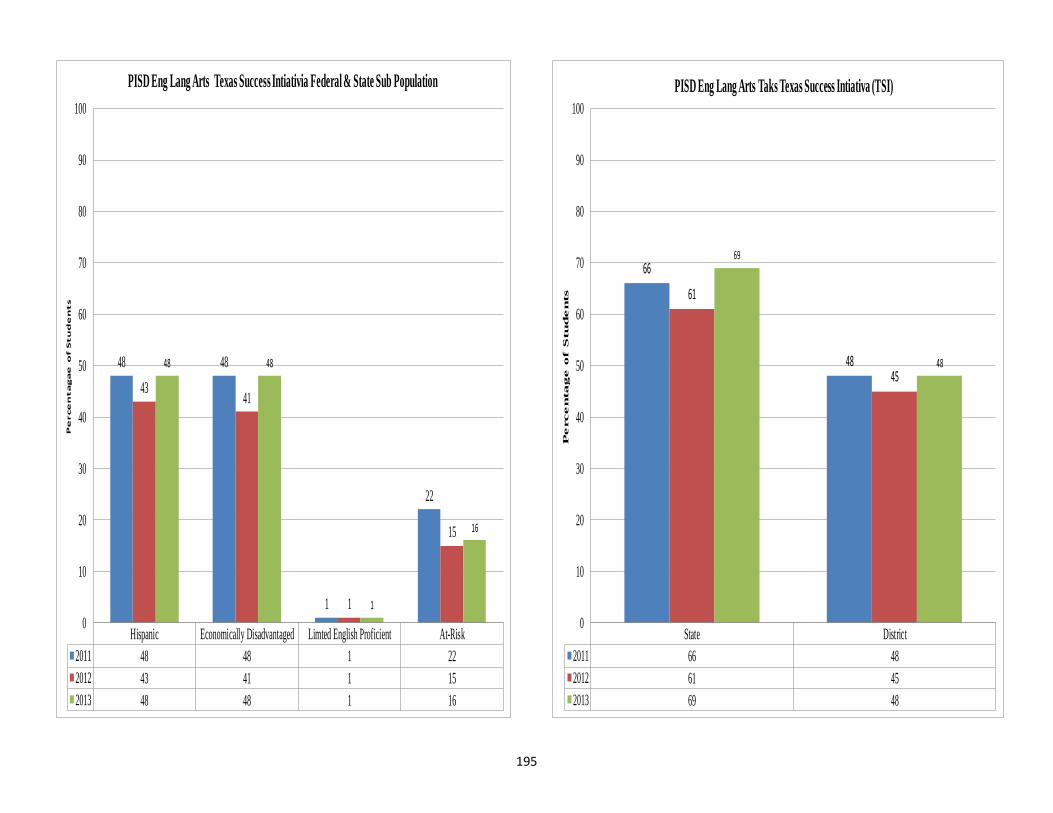
195
Hispanic Economically Disadvantaged Limted English Proficient At-Risk
2011 48 48 1 22
2012 43 41 1 15
2013 48 48 1 16
48 48
1
22
4341
1
15
48 48
1
16
0
10
20
30
40
50
60
70
80
90
100
Pe
rce
nta
ga
e o
f S
tu
de
nts
PISD Eng Lang Arts Texas Success Intiativia Federal & State Sub Population
State District
2011 66 48
2012 61 45
2013 69 48
66
48
61
45
69
48
0
10
20
30
40
50
60
70
80
90
100
Pe
rce
nta
ge
o
f S
tu
de
nts
PISD Eng Lang Arts Taks Texas Success Intiativa (TSI)
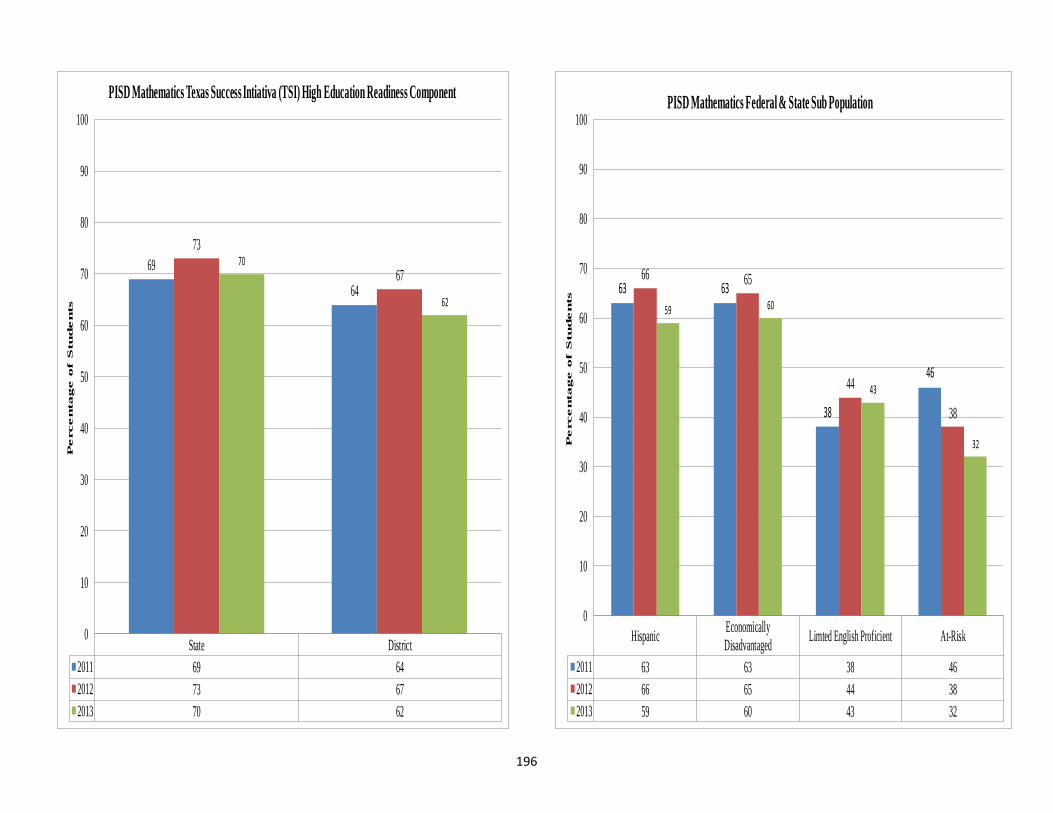
196
State District
2011 69 64
2012 73 67
2013 70 62
69
64
73
6770
62
0
10
20
30
40
50
60
70
80
90
100
Pe
rce
nta
ge
o
f S
tu
de
nts
PISD Mathematics Texas Success Intiativa (TSI) High Education Readiness Component
HispanicEconomically
DisadvantagedLimted English Proficient At-Risk
2011 63 63 38 46
2012 66 65 44 38
2013 59 60 43 32
63 63
38
46
66 65
44
38
59 60
43
32
0
10
20
30
40
50
60
70
80
90
100
Percenta
ge o
f S
tudents
PISD Mathematics Federal & State Sub Population
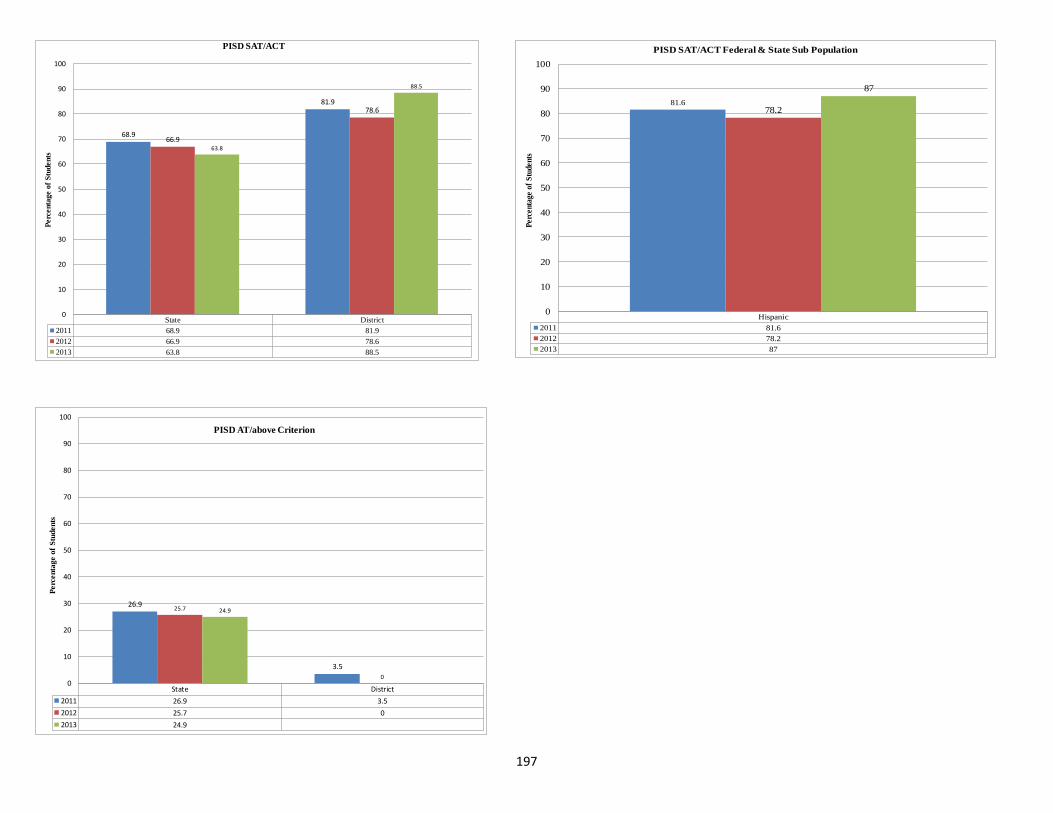
197
Hispanic
2011 81.6
2012 78.2
2013 87
81.678.2
87
0
10
20
30
40
50
60
70
80
90
100
Perc
en
tag
e o
f S
tud
en
ts
PISD SAT/ACT Federal & State Sub Population
State District
2011 68.9 81.9
2012 66.9 78.6
2013 63.8 88.5
68.9
81.9
66.9
78.6
63.8
88.5
0
10
20
30
40
50
60
70
80
90
100
Perc
enta
ge o
f S
tudents
PISD SAT/ACT
State District
2011 26.9 3.5
2012 25.7 0
2013 24.9
26.9
3.5
25.7
0
24.9
0
10
20
30
40
50
60
70
80
90
100
Pe
rce
nta
ge
of
Stu
de
nts
PISD AT/above Criterion
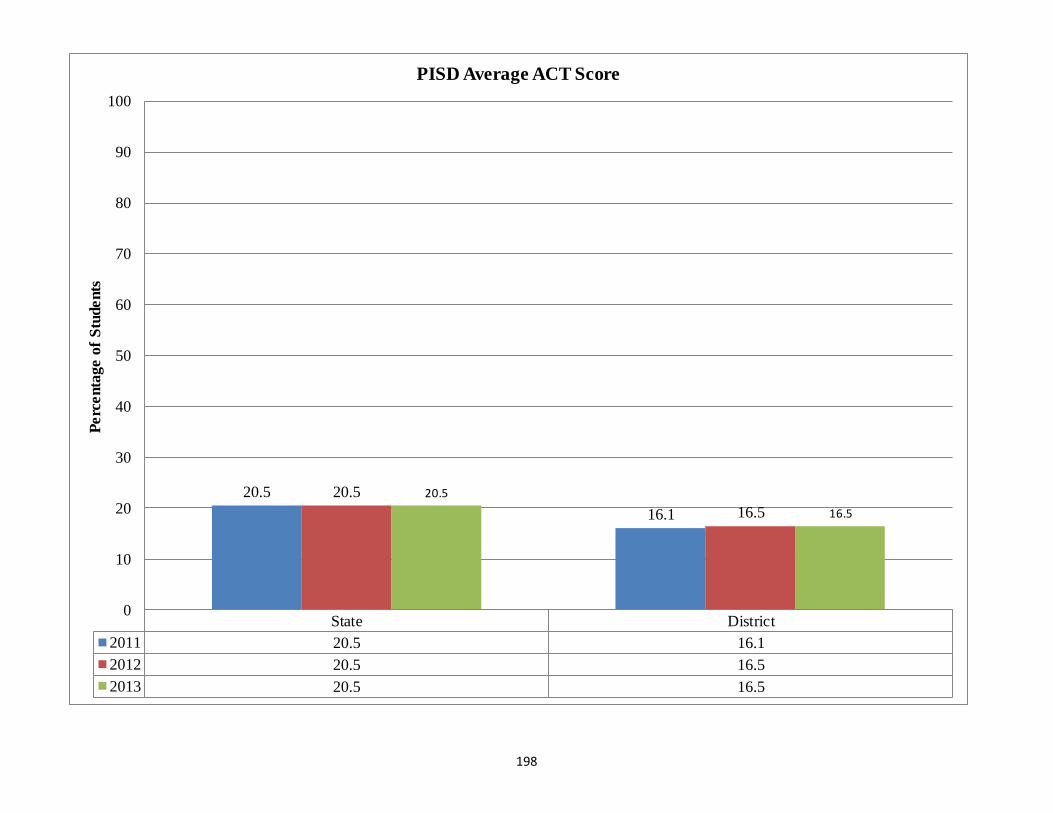
198
State District
2011 20.5 16.1
2012 20.5 16.5
2013 20.5 16.5
20.5
16.1
20.5
16.5
20.5
16.5
0
10
20
30
40
50
60
70
80
90
100P
erc
en
tage
of
Stu
den
ts
PISD Average ACT Score
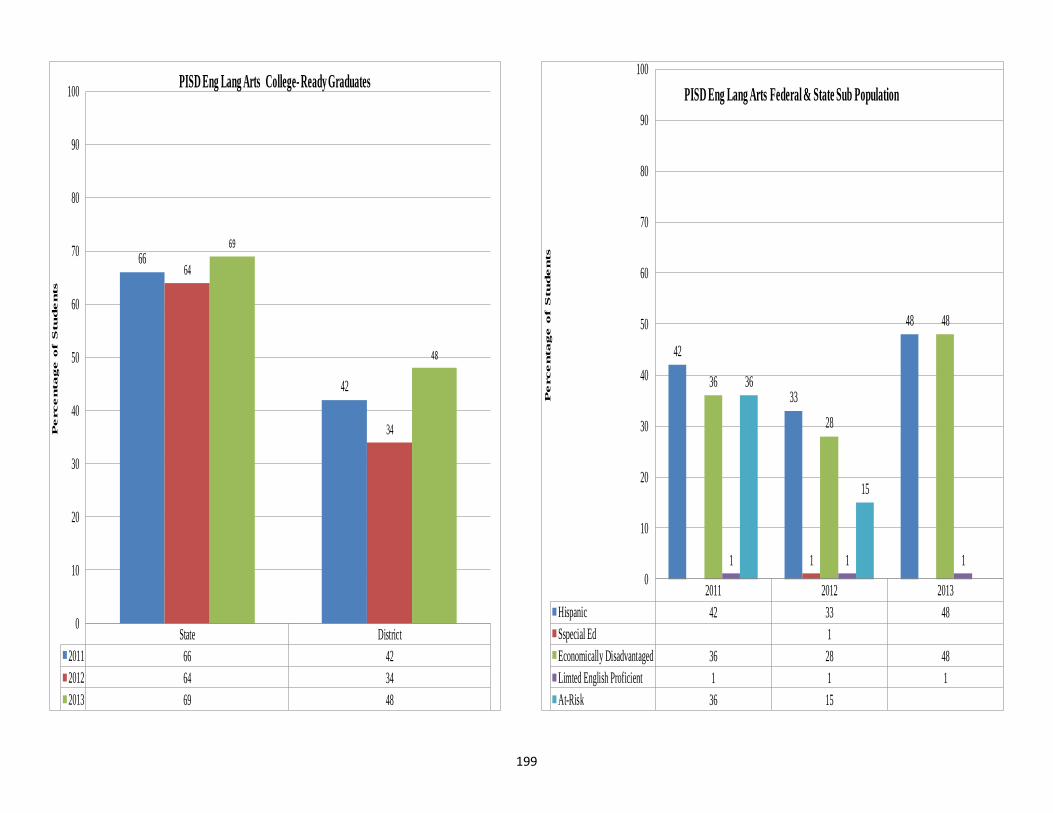
199
State District
2011 66 42
2012 64 34
2013 69 48
66
42
64
34
69
48
0
10
20
30
40
50
60
70
80
90
100
Percen
ta
ge o
f S
tu
den
ts
PISD Eng Lang Arts College- Ready Graduates
2011 2012 2013
Hispanic 42 33 48
Sspecial Ed 1
Economically Disadvantaged 36 28 48
Limted English Proficient 1 1 1
At-Risk 36 15
42
33
48
1
36
28
48
1 1 1
36
15
0
10
20
30
40
50
60
70
80
90
100
Pe
rce
nta
ge
o
f S
tu
de
nts
PISD Eng Lang Arts Federal & State Sub Population
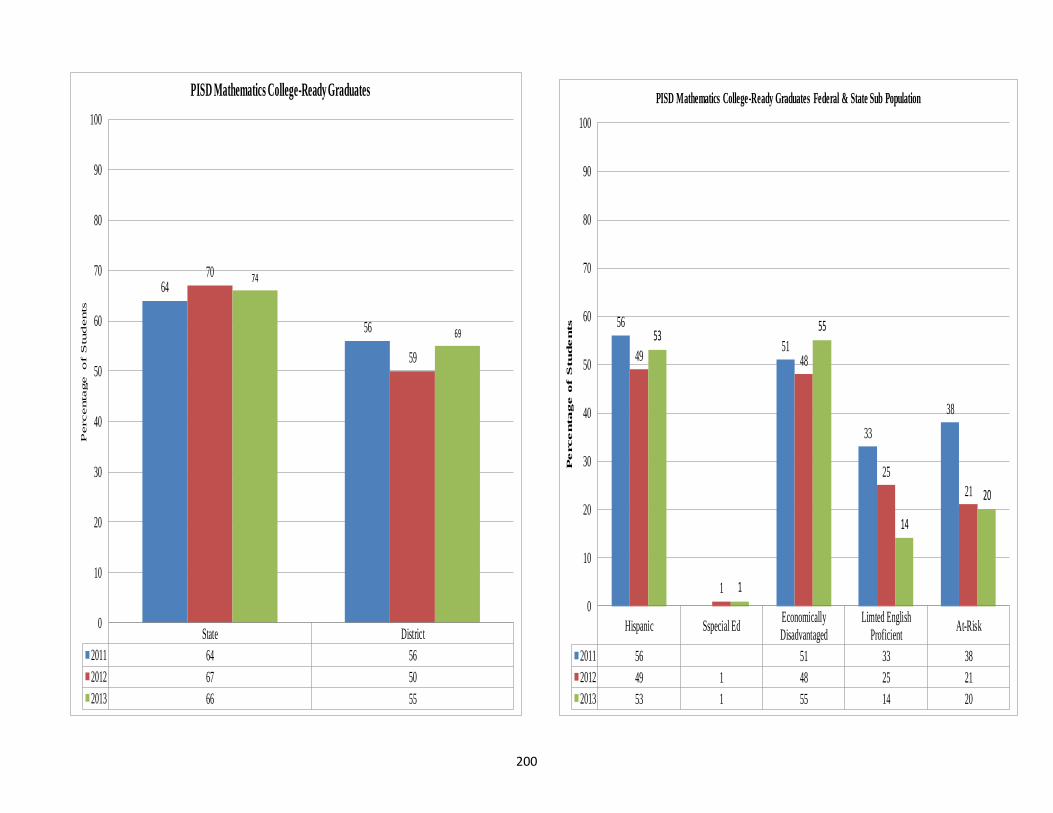
200
State District
2011 64 56
2012 67 50
2013 66 55
64
56
70
59
74
69
0
10
20
30
40
50
60
70
80
90
100
Percentage of S
tudents
PISD Mathematics College-Ready Graduates
Hispanic Sspecial EdEconomically
Disadvantaged
Limted English
ProficientAt-Risk
2011 56 51 33 38
2012 49 1 48 25 21
2013 53 1 55 14 20
56
51
33
38
49
1
48
25
21
53
1
55
14
20
0
10
20
30
40
50
60
70
80
90
100
Percen
ta
ge o
f S
tu
den
ts
PISD Mathematics College-Ready Graduates Federal & State Sub Population
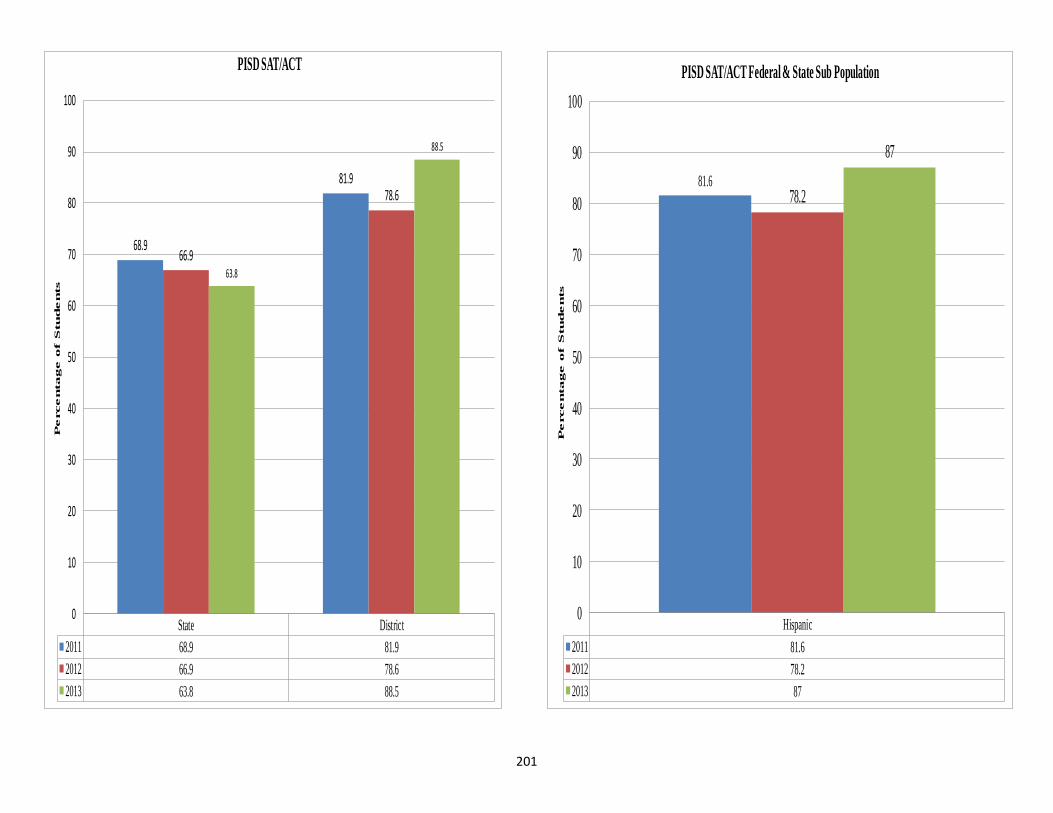
201
State District
2011 68.9 81.9
2012 66.9 78.6
2013 63.8 88.5
68.9
81.9
66.9
78.6
63.8
88.5
0
10
20
30
40
50
60
70
80
90
100
Percenta
ge o
f S
tudents
PISD SAT/ACT
Hispanic
2011 81.6
2012 78.2
2013 87
81.678.2
87
0
10
20
30
40
50
60
70
80
90
100
Percentage of S
tudents
PISD SAT/ACT Federal & State Sub Population
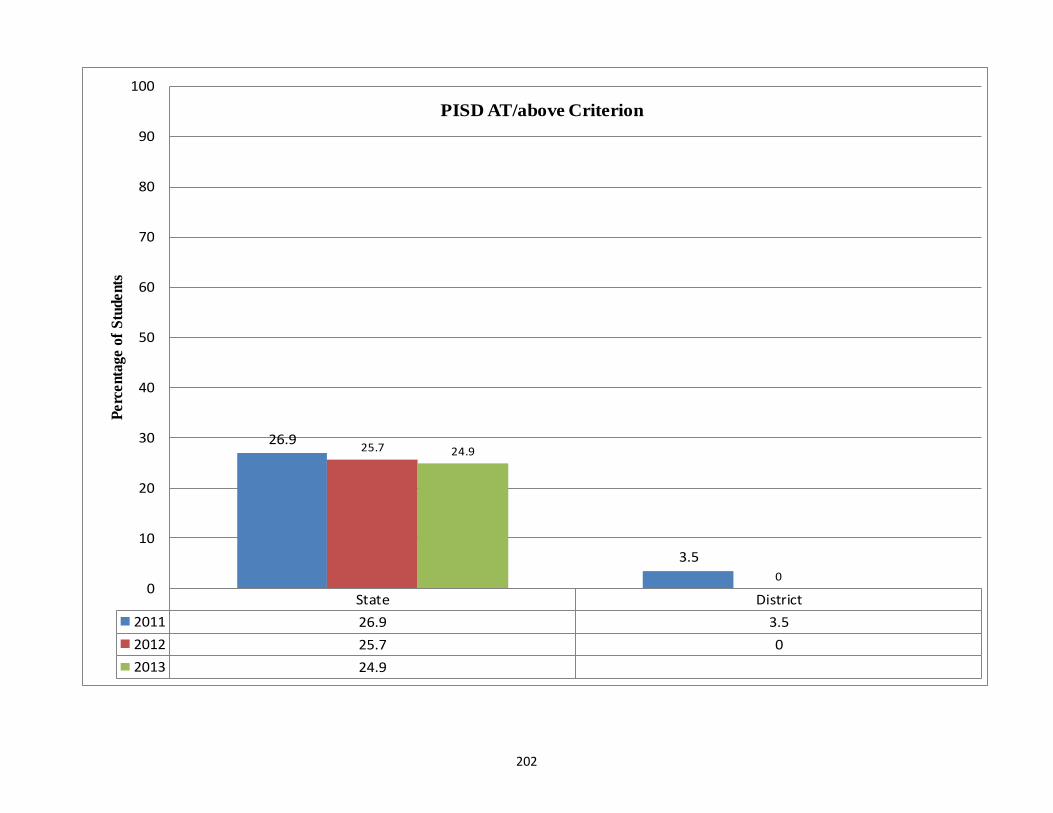
202
State District
2011 26.9 3.5
2012 25.7 0
2013 24.9
26.9
3.5
25.7
0
24.9
0
10
20
30
40
50
60
70
80
90
100
Pe
rce
nta
ge
of
Stu
de
nts
PISD AT/above Criterion
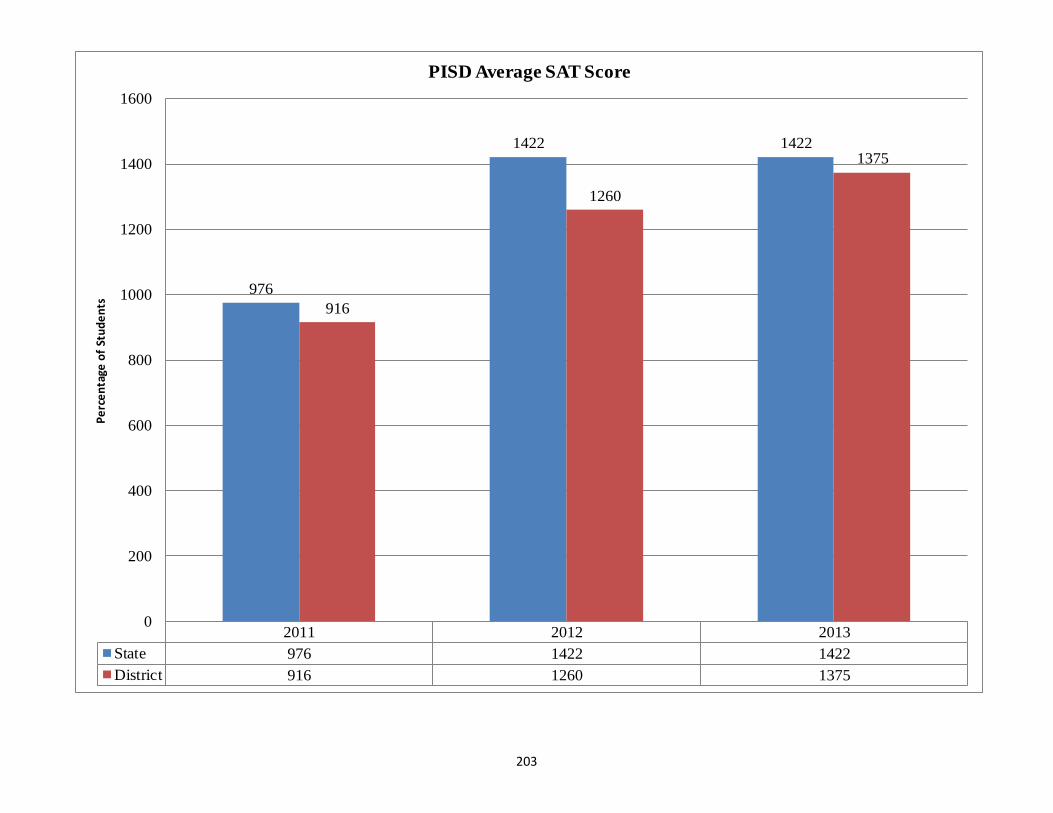
203
2011 2012 2013
State 976 1422 1422
District 916 1260 1375
976
1422 1422
916
1260
1375
0
200
400
600
800
1000
1200
1400
1600P
erc
en
tage
of
Stu
de
nts
PISD Average SAT Score
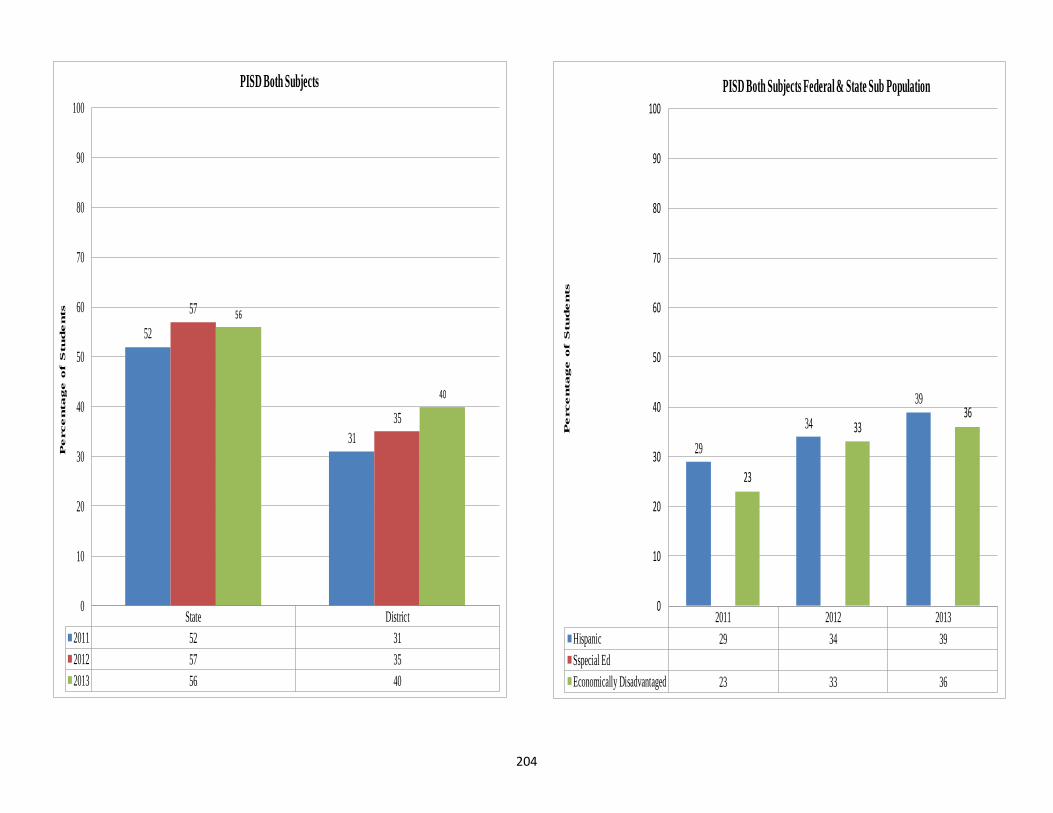
204
State District
2011 52 31
2012 57 35
2013 56 40
52
31
57
35
56
40
0
10
20
30
40
50
60
70
80
90
100
Pe
rce
nta
ge
o
f S
tu
de
nts
PISD Both Subjects
2011 2012 2013
Hispanic 29 34 39
Sspecial Ed
Economically Disadvantaged 23 33 36
29
34
39
23
3336
0
10
20
30
40
50
60
70
80
90
100
Pe
rce
nta
ge
o
f S
tu
de
nts
PISD Both Subjects Federal & State Sub Population
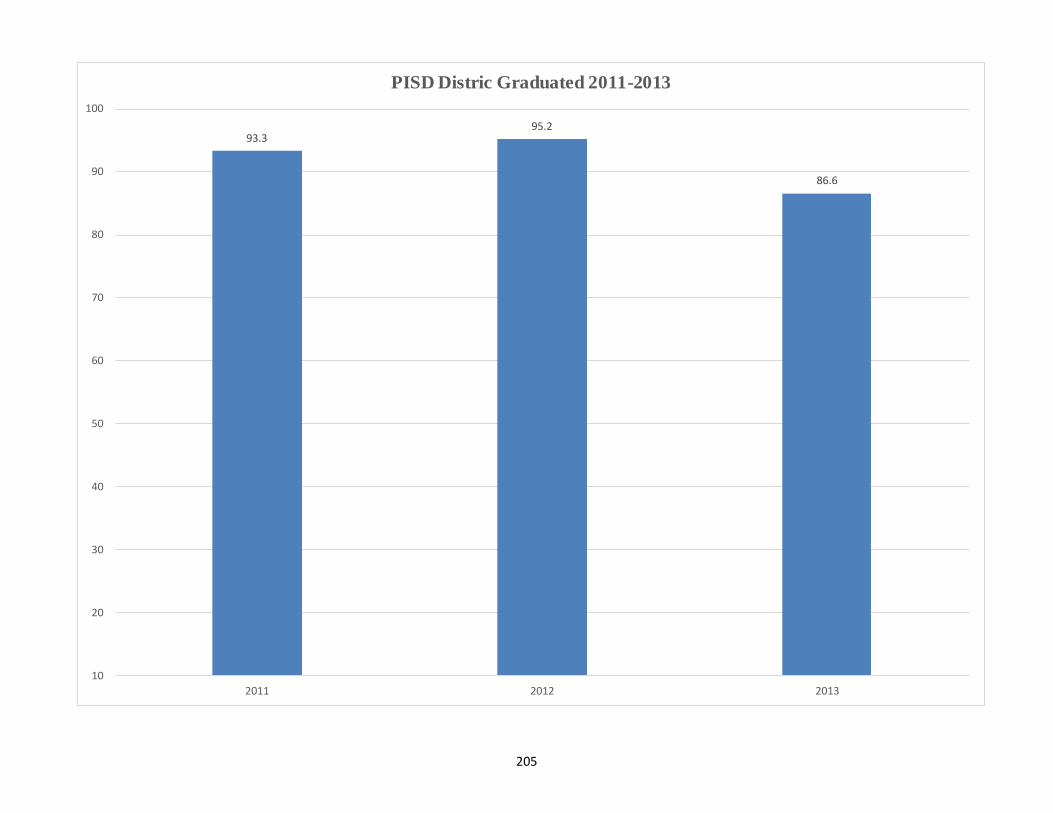
205
93.395.2
86.6
10
20
30
40
50
60
70
80
90
100
2011 2012 2013
PISD Distric Graduated 2011-2013
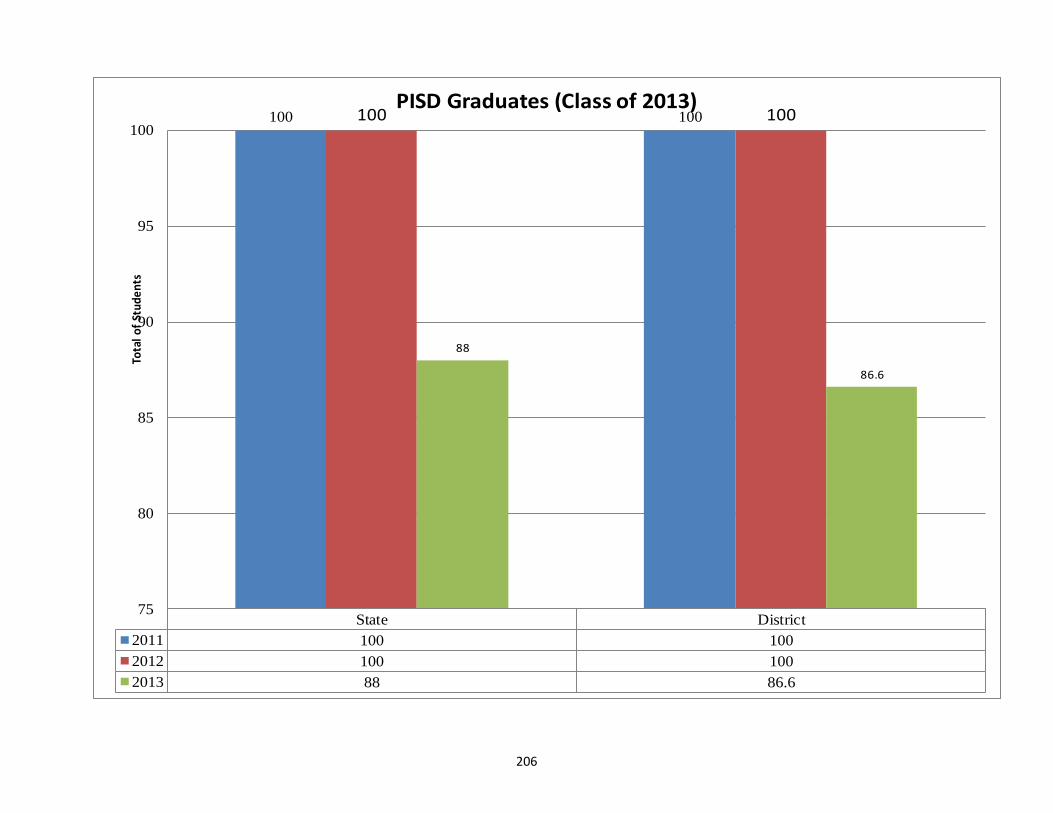
206
State District
2011 100 100
2012 100 100
2013 88 86.6
100 100100 100
88
86.6
75
80
85
90
95
100To
tal
of
Stu
de
nts
PISD Graduates (Class of 2013)
207
Focus Area: Quality Learning and Working Environment
The Quality Learning and Working Environment Focus Area will be measured by the following measurements at the District
Level:
o Attendance
Student
Teachers
o Professional Learning
Percent of teachers deploying Continuous Classroom Improvement
Percent using technology in the classrooms
Percent of Teachers with Bilingual Certification and/or ESL Endorsement
o Safety
Surveys (student, teacher, parent)
Number of student accidents
o Class Size Comparisons
o Student Behavior (by State and Federal student subgroups)
Number of discipline referrals or incidents
Number of student suspensions and expulsions
Number of gang related, substance abuse, or other at-risk behaviors
o Student Teacher Ratios
o Teacher Attrition Rate
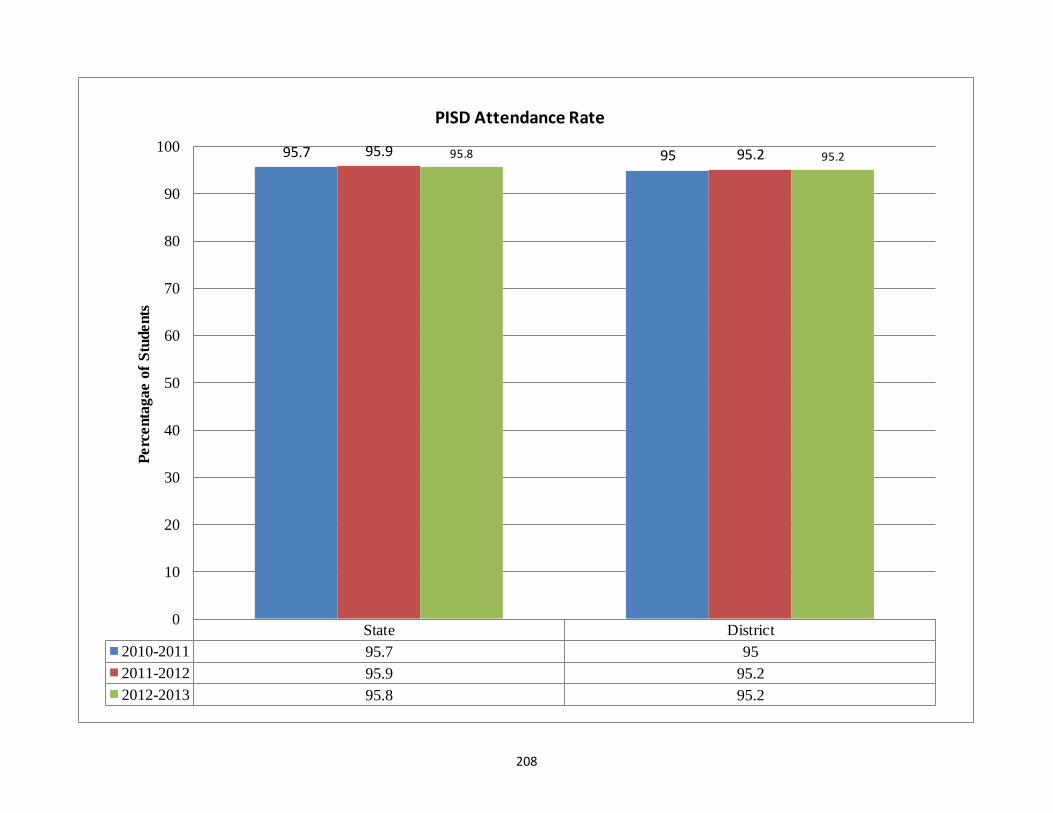
208
State District
2010-2011 95.7 95
2011-2012 95.9 95.2
2012-2013 95.8 95.2
95.7 9595.9 95.295.8 95.2
0
10
20
30
40
50
60
70
80
90
100P
erc
enta
gae o
f S
tudents
PISD Attendance Rate
209
Focus Area: Effective and Efficient Organization
The Effective and Efficient Organization Focus Area will be measured by the following measurements at the District Level:
o Drop Out Rate
o Completion Rate
o Student Retention Rates
o Maintenance Work Order Completion Time
o Technology Work Order Completion Time
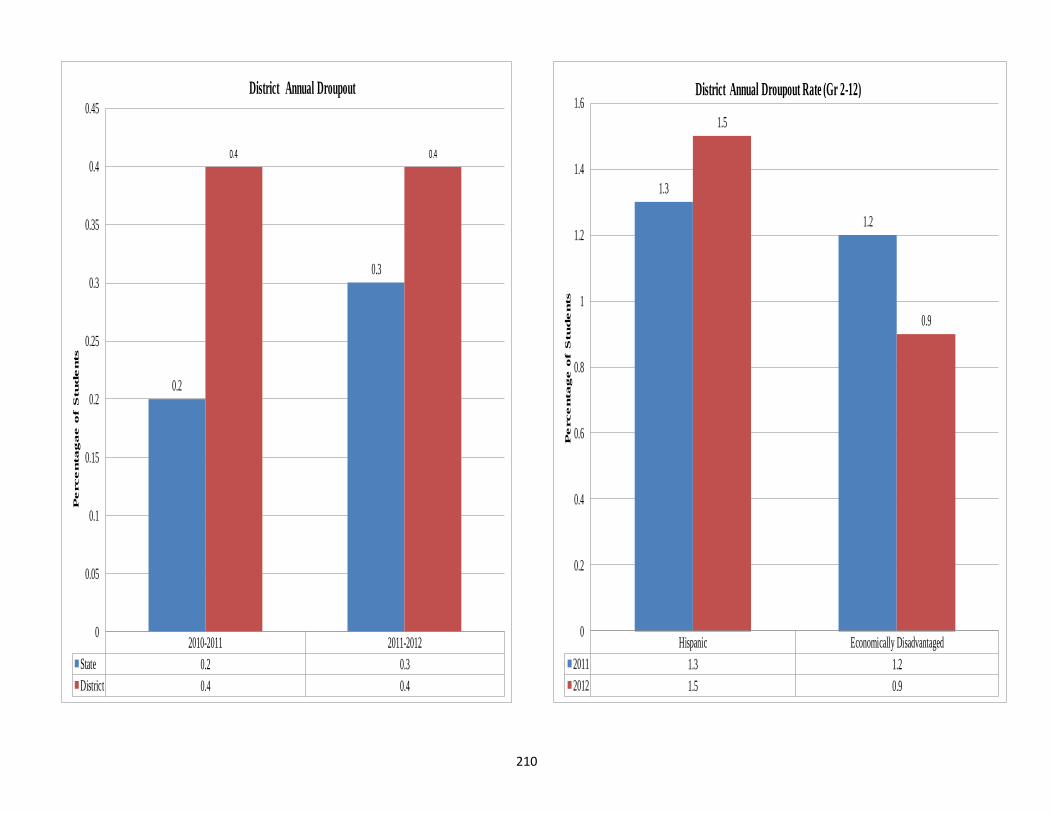
210
2010-2011 2011-2012
State 0.2 0.3
District 0.4 0.4
0.2
0.3
0.4 0.4
0
0.05
0.1
0.15
0.2
0.25
0.3
0.35
0.4
0.45
Percentagae of S
tudents
District Annual Droupout
Hispanic Economically Disadvantaged
2011 1.3 1.2
2012 1.5 0.9
1.3
1.2
1.5
0.9
0
0.2
0.4
0.6
0.8
1
1.2
1.4
1.6
Pe
rce
nta
ge
o
f S
tu
de
nts
District Annual Droupout Rate (Gr 2-12)
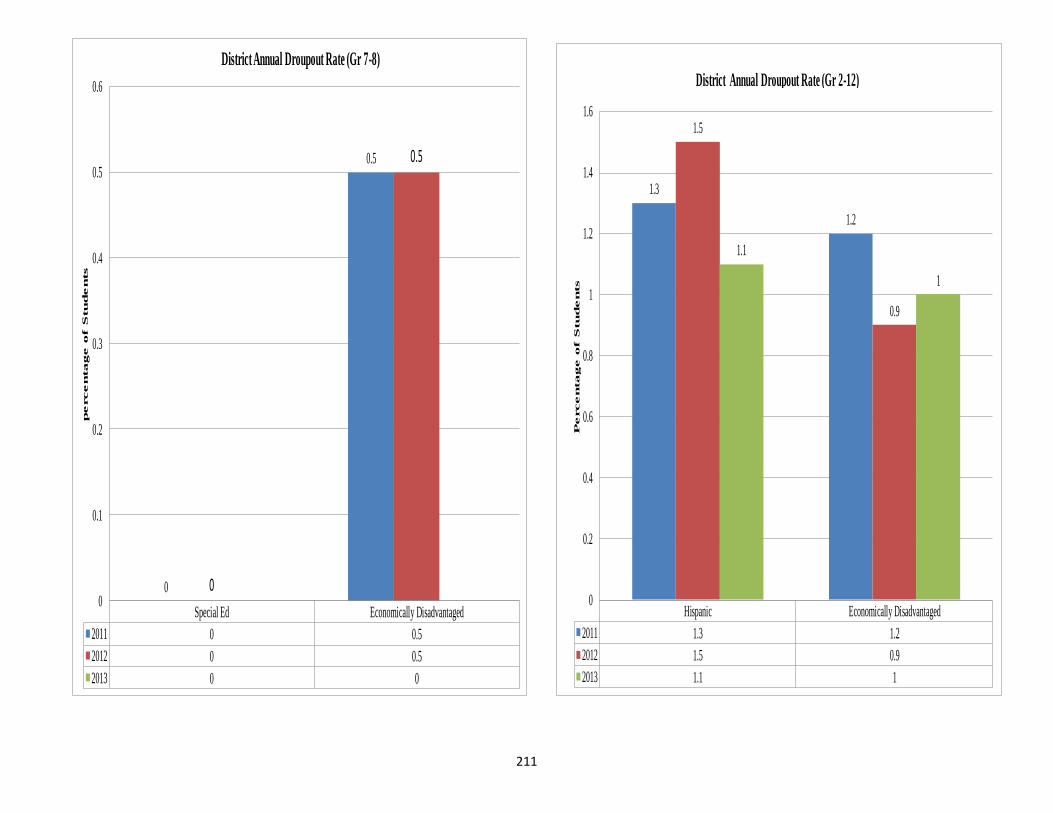
211
Special Ed Economically Disadvantaged
2011 0 0.5
2012 0 0.5
2013 0 0
0
0.5
0
0.5
0
0.1
0.2
0.3
0.4
0.5
0.6p
erce
nta
ge
o
f S
tu
de
nts
District Annual Droupout Rate (Gr 7-8)
Hispanic Economically Disadvantaged
2011 1.3 1.2
2012 1.5 0.9
2013 1.1 1
1.3
1.2
1.5
0.9
1.1
1
0
0.2
0.4
0.6
0.8
1
1.2
1.4
1.6
Percen
tage
of S
tu
den
ts
District Annual Droupout Rate (Gr 2-12)
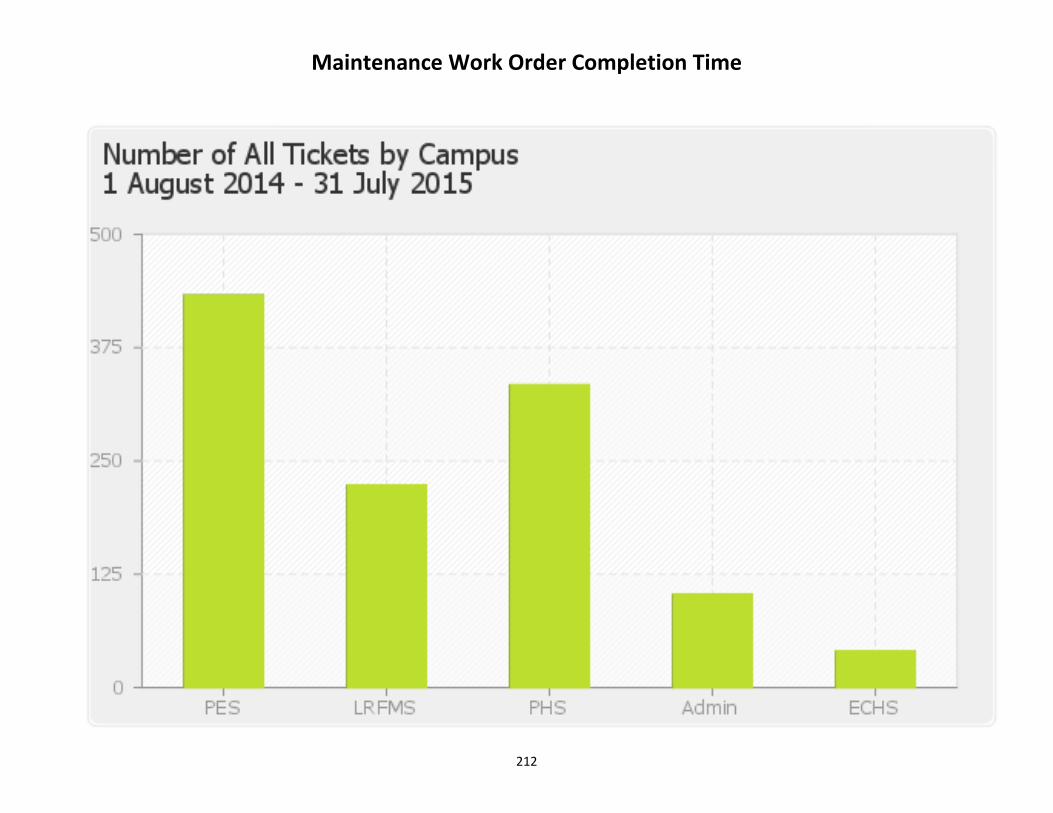
212
Maintenance Work Order Completion Time
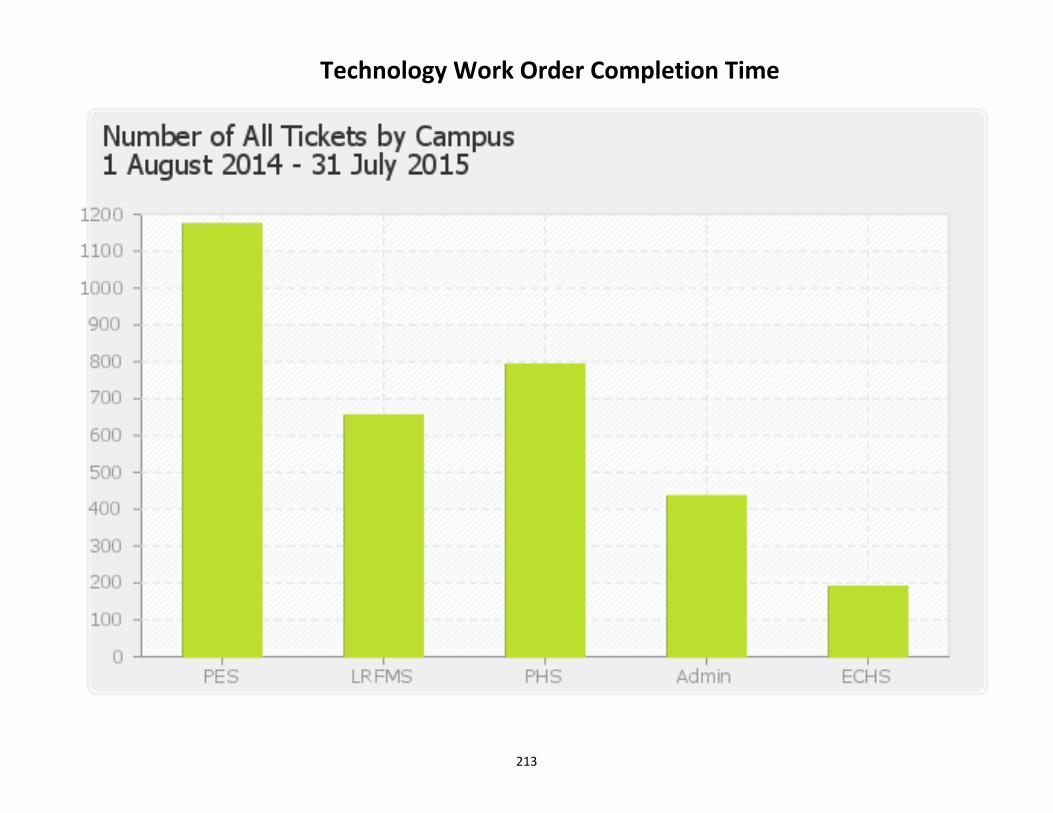
213
Technology Work Order Completion Time
214
Appendix
Appendix A: TAKS Scale Scores
Appendix B: TAKS Results
Appendix C: Performance-based Monitoring and Assessment System Data
Appendix D: Surveys
Student
Staff Satisfaction and Climate Survey
Parent
Appendix E: Special Education CIP – PBMAS
Bilingual CIP –PBMAS
Appendix F: Highly Qualified Teacher Continuous Improvement Plan
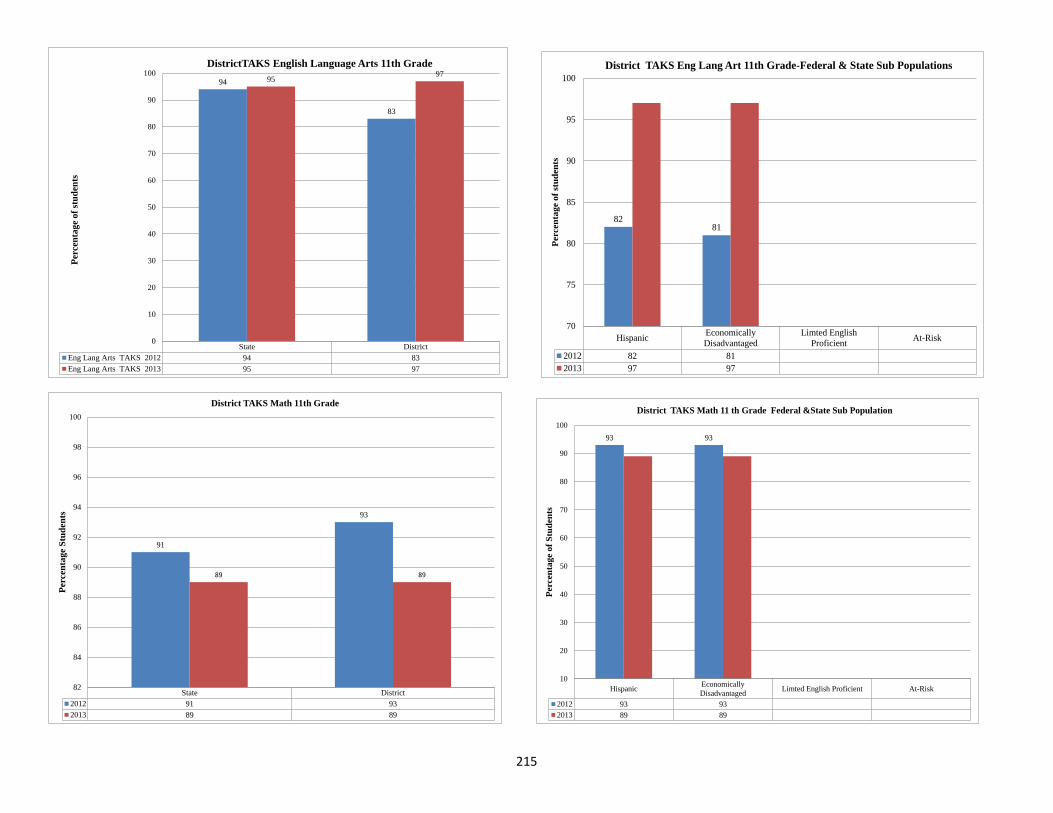
215
State District
Eng Lang Arts TAKS 2012 94 83
Eng Lang Arts TAKS 2013 95 97
94
83
9597
0
10
20
30
40
50
60
70
80
90
100P
erce
nta
ge
of
stu
den
tsDistrictTAKS English Language Arts 11th Grade
HispanicEconomically
Disadvantaged
Limted English
ProficientAt-Risk
2012 82 81
2013 97 97
8281
70
75
80
85
90
95
100
Perc
en
tag
e o
f st
ud
en
ts
District TAKS Eng Lang Art 11th Grade-Federal & State Sub Populations
State District
2012 91 93
2013 89 89
91
93
89 89
82
84
86
88
90
92
94
96
98
100
Perc
en
tag
e S
tud
en
ts
District TAKS Math 11th Grade
HispanicEconomically
DisadvantagedLimted English Proficient At-Risk
2012 93 93
2013 89 89
93 93
10
20
30
40
50
60
70
80
90
100
Perc
en
tag
e o
f S
tud
en
ts
District TAKS Math 11 th Grade Federal &State Sub Population
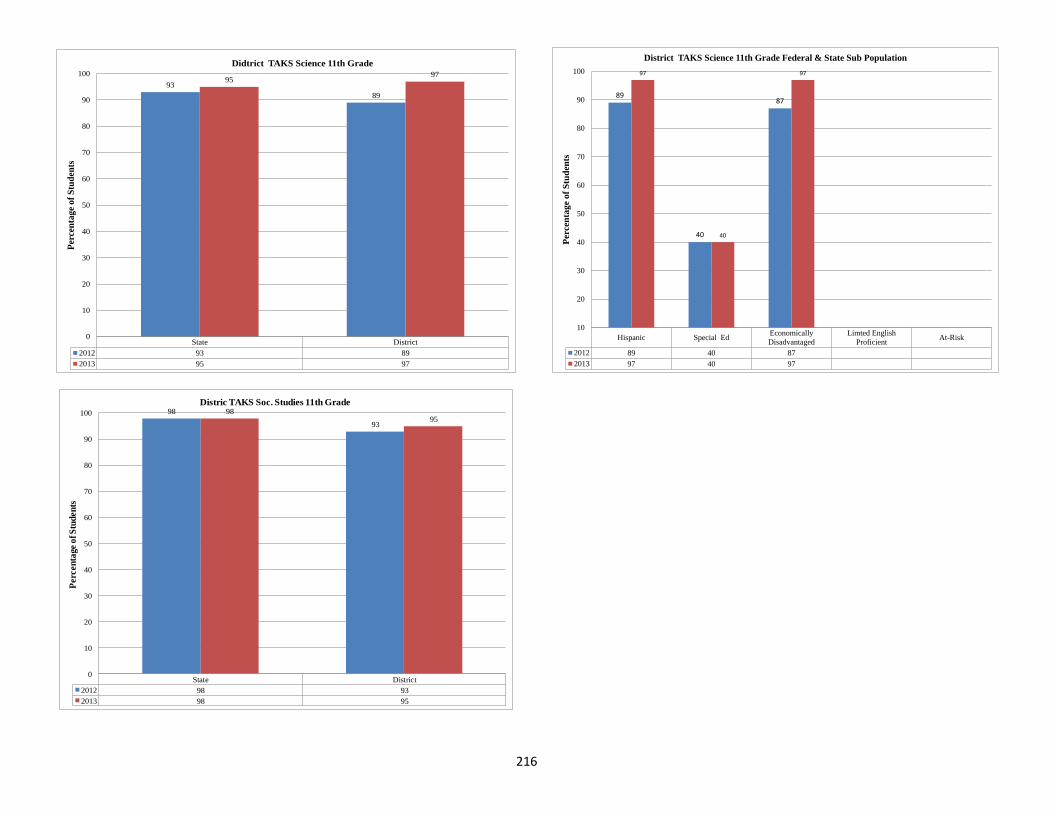
216
State District
2012 93 89
2013 95 97
93
89
9597
0
10
20
30
40
50
60
70
80
90
100P
erce
nta
ge
of
Stu
den
ts
Didtrict TAKS Science 11th Grade
Hispanic Special EdEconomically
Disadvantaged
Limted English
ProficientAt-Risk
2012 89 40 87
2013 97 40 97
89
40
87
97
40
97
10
20
30
40
50
60
70
80
90
100
Per
cen
tag
e o
f S
tud
ents
District TAKS Science 11th Grade Federal & State Sub Population
State District
2012 98 93
2013 98 95
98
93
9895
0
10
20
30
40
50
60
70
80
90
100
Perc
en
tage o
f S
tud
en
ts
Distric TAKS Soc. Studies 11th Grade
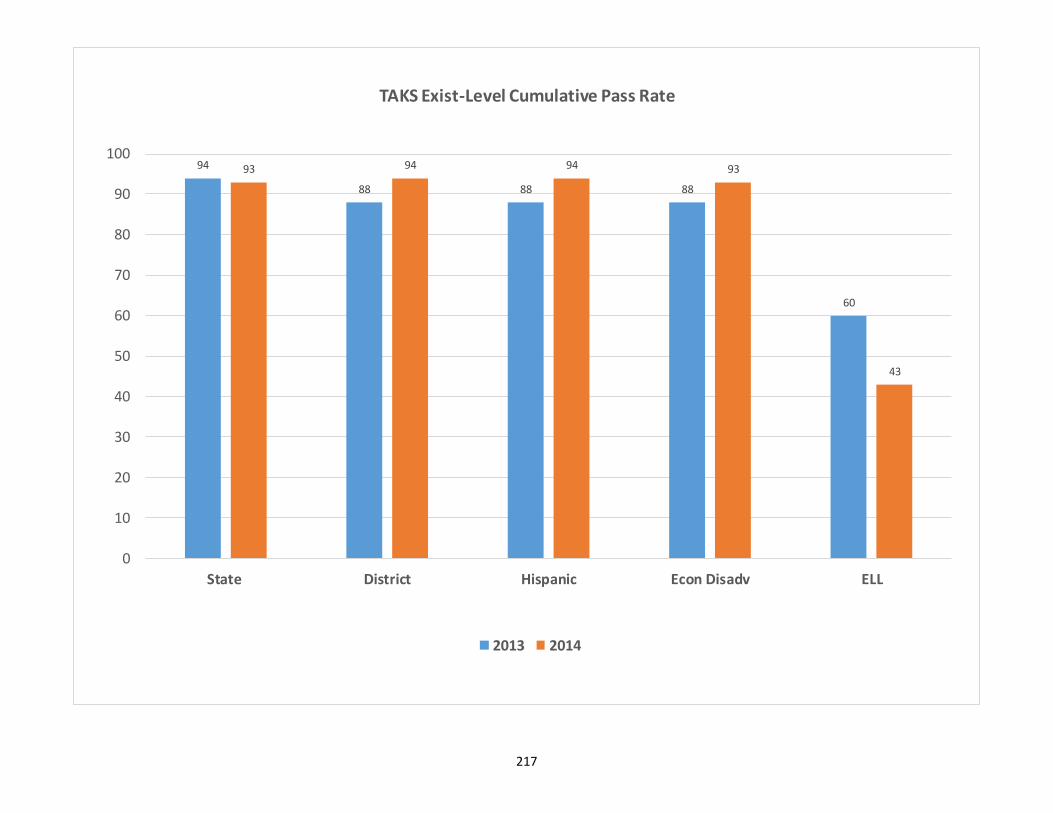
217
94
88 88 88
60
93 94 94 93
43
0
10
20
30
40
50
60
70
80
90
100
State District Hispanic Econ Disadv ELL
TAKS Exist-Level Cumulative Pass Rate
2013 2014
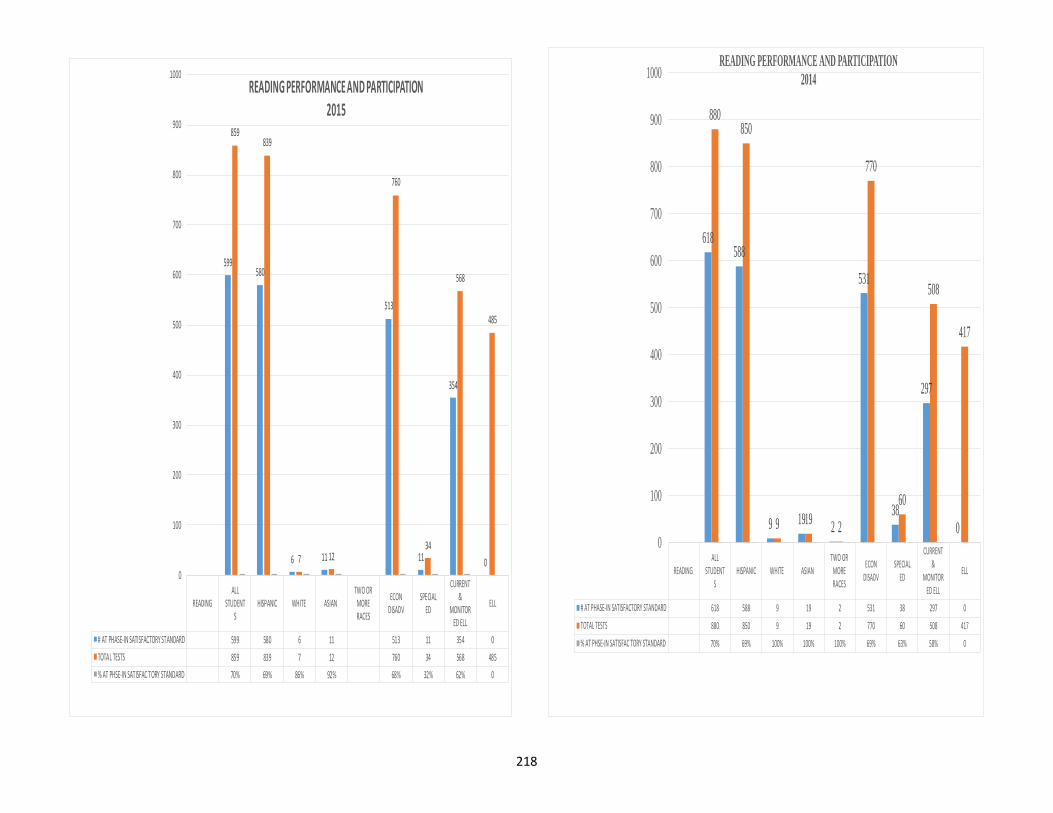
218
READINGALL
STUDENTS
HISPANIC WHITE ASIANTWO ORMORERACES
ECONDISADV
SPECIALED
CURRENT&
MONITORED ELL
ELL
# AT PHASE-IN SATISFACTORY STANDARD 599 580 6 11 513 11 354 0
TOTAL TESTS 859 839 7 12 760 34 568 485
% AT PHSE-IN SATISFAC TORY STANDARD 70% 69% 86% 92% 68% 32% 62% 0
599580
6 11
513
11
354
0
859839
7 12
760
34
568
485
0
100
200
300
400
500
600
700
800
900
1000READING PERFORMANCE AND PARTICIPATION
2015
READINGALL
STUDENTS
HISPANIC WHITE ASIANTWO OR
MORERACES
ECONDISADV
SPECIALED
CURRENT&
MONITORED ELL
ELL
# AT PHASE-IN SATISFACTORY STANDARD 618 588 9 19 2 531 38 297 0
TOTAL TESTS 880 850 9 19 2 770 60 508 417
% AT PHSE-IN SATISFAC TORY STANDARD 70% 69% 100% 100% 100% 69% 63% 58% 0
618588
9 192
531
38
297
0
880850
9 192
770
60
508
417
0
100
200
300
400
500
600
700
800
900
1000READING PERFORMANCE AND PARTICIPATION
2014
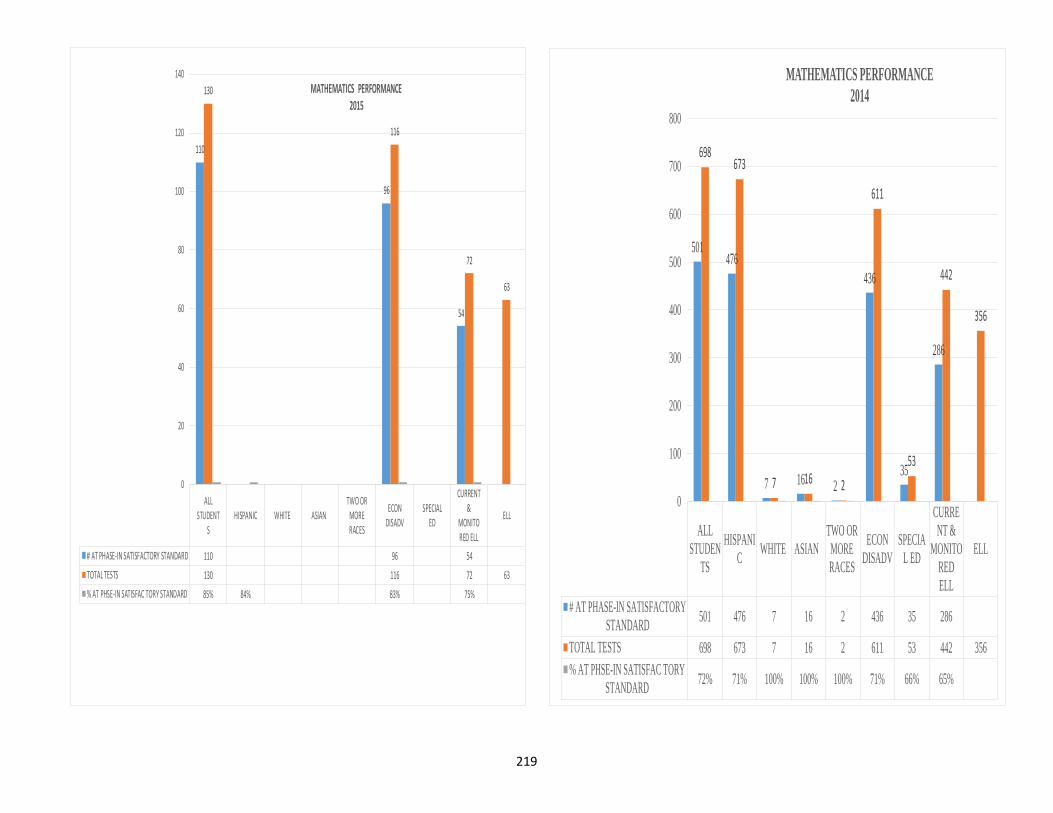
219
ALLSTUDENT
SHISPANIC WHITE ASIAN
TWO ORMORERACES
ECONDISADV
SPECIALED
CURRENT&
MONITORED ELL
ELL
# AT PHASE-IN SATISFACTORY STANDARD 110 96 54
TOTAL TESTS 130 116 72 63
% AT PHSE-IN SATISFAC TORY STANDARD 85% 84% 83% 75%
110
96
54
130
116
72
63
0
20
40
60
80
100
120
140
MATHEMATICS PERFORMANCE 2015
ALL
STUDEN
TS
HISPANI
CWHITE ASIAN
TWO OR
MORE
RACES
ECON
DISADV
SPECIA
L ED
CURRE
NT &
MONITO
RED
ELL
ELL
# AT PHASE-IN SATISFACTORY
STANDARD501 476 7 16 2 436 35 286
TOTAL TESTS 698 673 7 16 2 611 53 442 356
% AT PHSE-IN SATISFAC TORY
STANDARD72% 71% 100% 100% 100% 71% 66% 65%
501476
7 16 2
436
35
286
698673
7 16 2
611
53
442
356
0
100
200
300
400
500
600
700
800
MATHEMATICS PERFORMANCE
2014
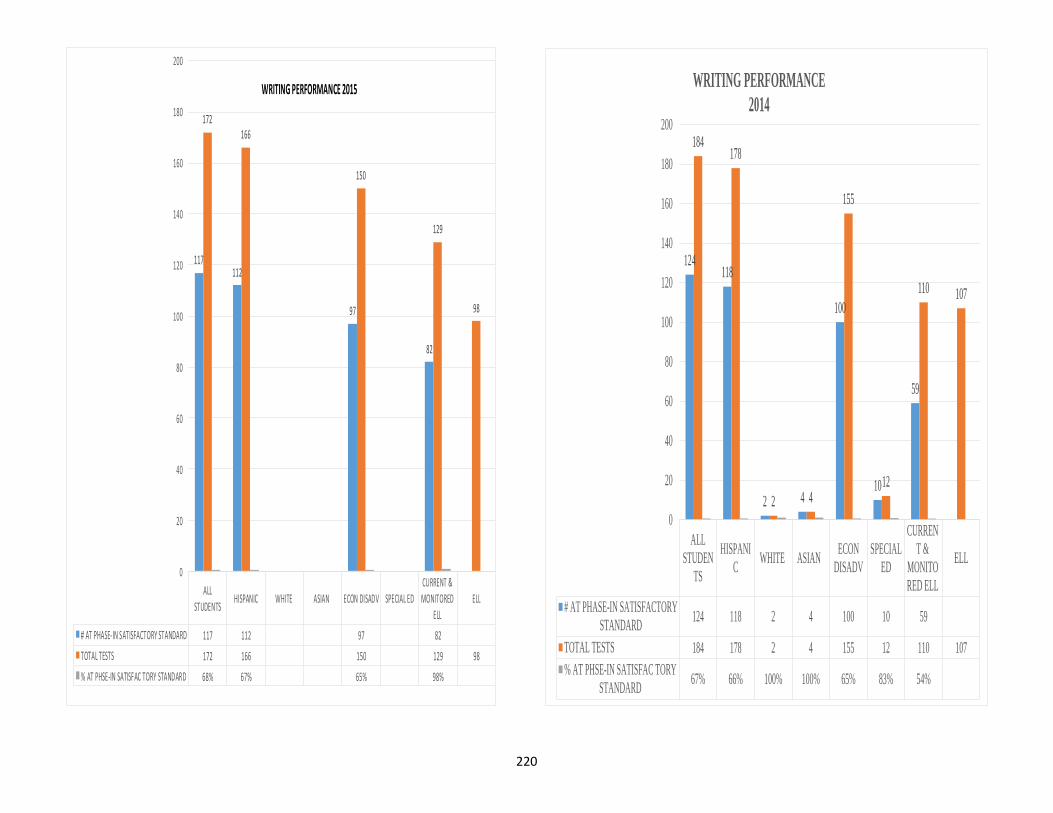
220
ALL
STUDENTSHISPANIC WHITE ASIAN ECON DISADV SPECIAL ED
CURRENT &
MONITORED
ELL
ELL
# AT PHASE-IN SATISFACTORY STANDARD 117 112 97 82
TOTAL TESTS 172 166 150 129 98
% AT PHSE-IN SATISFAC TORY STANDARD 68% 67% 65% 98%
117112
97
82
172166
150
129
98
0
20
40
60
80
100
120
140
160
180
200
WRITING PERFORMANCE 2015
ALL
STUDEN
TS
HISPANI
CWHITE ASIAN
ECON
DISADV
SPECIAL
ED
CURREN
T &
MONITO
RED ELL
ELL
# AT PHASE-IN SATISFACTORY
STANDARD124 118 2 4 100 10 59
TOTAL TESTS 184 178 2 4 155 12 110 107
% AT PHSE-IN SATISFAC TORY
STANDARD67% 66% 100% 100% 65% 83% 54%
124118
2 4
100
10
59
184178
2 4
155
12
110 107
0
20
40
60
80
100
120
140
160
180
200
WRITING PERFORMANCE
2014
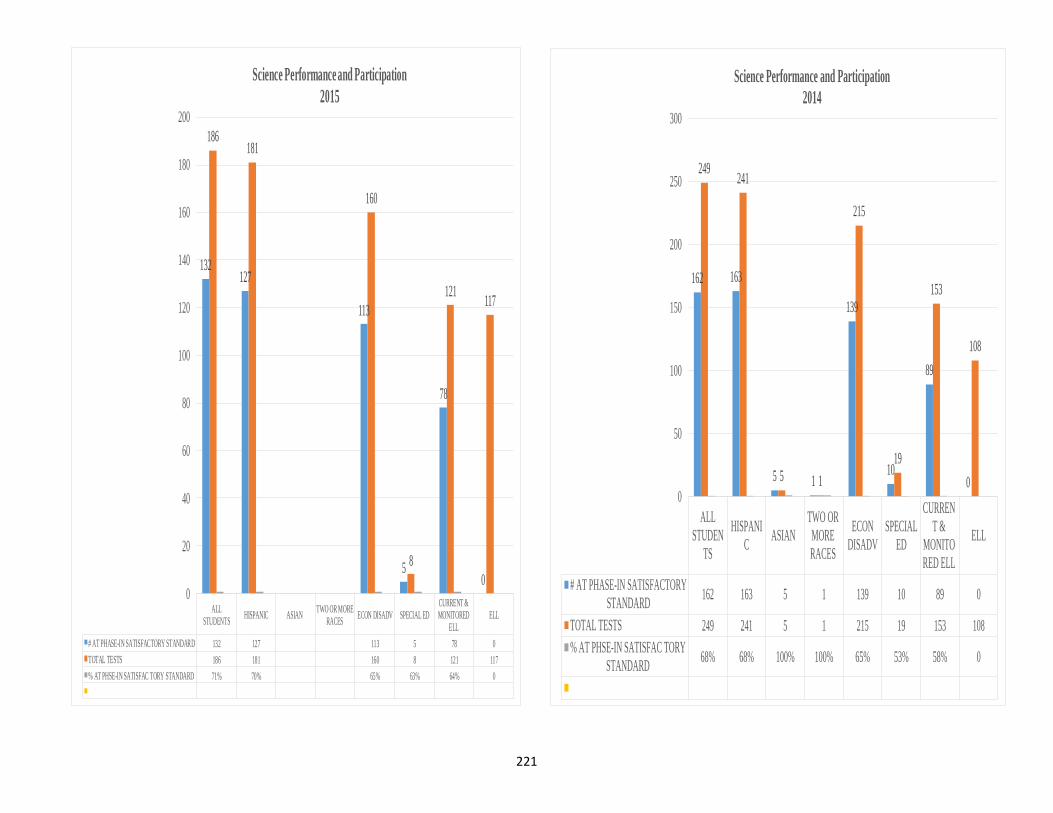
221
ALLSTUDENTS
HISPANIC ASIANTWO OR MORE
RACESECON DISADV SPECIAL ED
CURRENT &MONITORED
ELLELL
# AT PHASE-IN SATISFACTORY STANDARD 132 127 113 5 78 0
TOTAL TESTS 186 181 160 8 121 117
% AT PHSE-IN SATISFAC TORY STANDARD 71% 70% 65% 63% 64% 0
132127
113
5
78
0
186181
160
8
121117
0
20
40
60
80
100
120
140
160
180
200
Science Performance and Participation
2015
ALL
STUDEN
TS
HISPANI
CASIAN
TWO OR
MORE
RACES
ECON
DISADV
SPECIAL
ED
CURREN
T &
MONITO
RED ELL
ELL
# AT PHASE-IN SATISFACTORY
STANDARD162 163 5 1 139 10 89 0
TOTAL TESTS 249 241 5 1 215 19 153 108
% AT PHSE-IN SATISFAC TORY
STANDARD68% 68% 100% 100% 65% 53% 58% 0
162 163
5 1
139
10
89
0
249241
5 1
215
19
153
108
0
50
100
150
200
250
300
Science Performance and Participation
2014
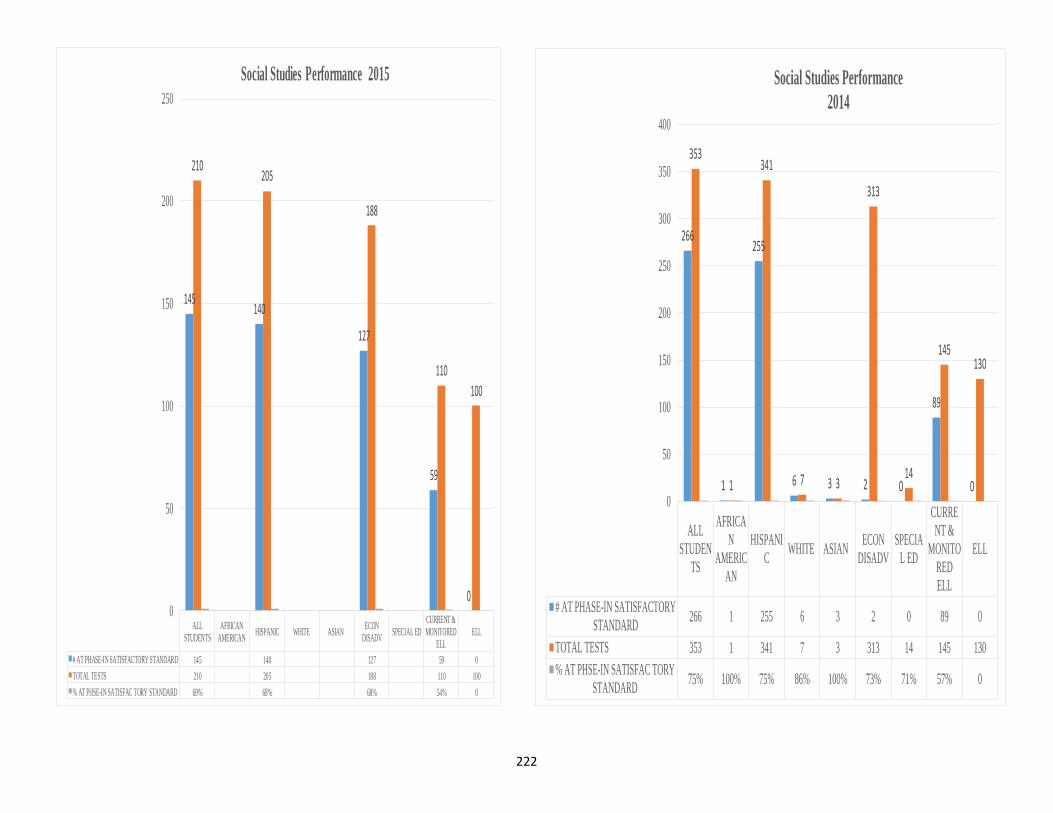
222
ALLSTUDENTS
AFRICANAMERICAN
HISPANIC WHITE ASIANECON
DISADVSPECIAL ED
CURRENT &MONITORED
ELLELL
# AT PHASE-IN SATISFACTORY STANDARD 145 140 127 59 0
TOTAL TESTS 210 205 188 110 100
% AT PHSE-IN SATISFAC TORY STANDARD 69% 68% 68% 54% 0
145140
127
59
0
210205
188
110
100
0
50
100
150
200
250
Social Studies Performance 2015
ALL
STUDEN
TS
AFRICA
N
AMERIC
AN
HISPANI
CWHITE ASIAN
ECON
DISADV
SPECIA
L ED
CURRE
NT &
MONITO
RED
ELL
ELL
# AT PHASE-IN SATISFACTORY
STANDARD266 1 255 6 3 2 0 89 0
TOTAL TESTS 353 1 341 7 3 313 14 145 130
% AT PHSE-IN SATISFAC TORY
STANDARD75% 100% 75% 86% 100% 73% 71% 57% 0
266
1
255
6 3 2 0
89
0
353
1
341
7 3
313
14
145130
0
50
100
150
200
250
300
350
400
Social Studies Performance
2014
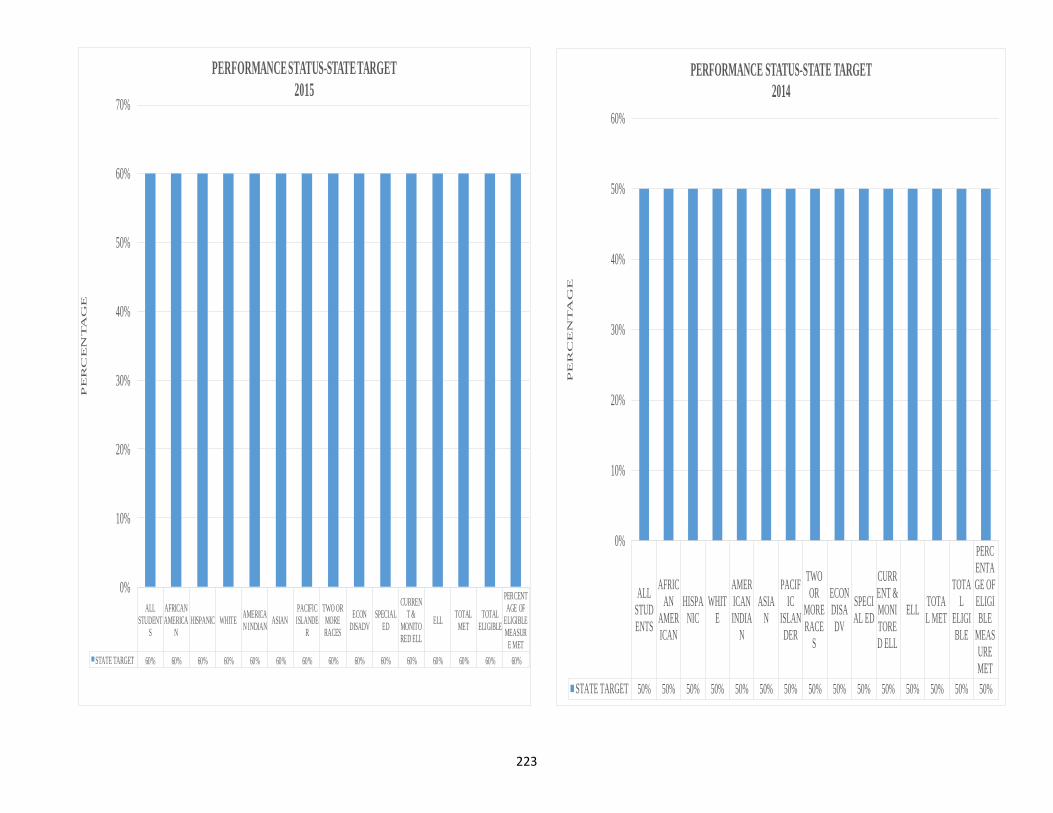
223
ALLSTUDENT
S
AFRICANAMERICA
NHISPANIC WHITE
AMERICAN INDIAN
ASIANPACIFICISLANDE
R
TWO ORMORERACES
ECONDISADV
SPECIALED
CURRENT &
MONITORED ELL
ELLTOTAL
METTOTAL
ELIGIBLE
PERCENTAGE OF
ELIGIBLEMEASUR
E MET
STATE TARGET 60% 60% 60% 60% 60% 60% 60% 60% 60% 60% 60% 60% 60% 60% 60%
0%
10%
20%
30%
40%
50%
60%
70%
PE
RC
EN
TA
GE
PERFORMANCE STATUS-STATE TARGET
2015
ALL
STUD
ENTS
AFRIC
AN
AMER
ICAN
HISPA
NIC
WHIT
E
AMER
ICAN
INDIA
N
ASIA
N
PACIF
IC
ISLAN
DER
TWO
OR
MORE
RACE
S
ECON
DISA
DV
SPECI
AL ED
CURR
ENT &
MONI
TORE
D ELL
ELLTOTA
L MET
TOTA
L
ELIGI
BLE
PERC
ENTA
GE OF
ELIGI
BLE
MEAS
URE
MET
STATE TARGET 50% 50% 50% 50% 50% 50% 50% 50% 50% 50% 50% 50% 50% 50% 50%
0%
10%
20%
30%
40%
50%
60%
PE
RC
EN
TA
GE
PERFORMANCE STATUS-STATE TARGET
2014
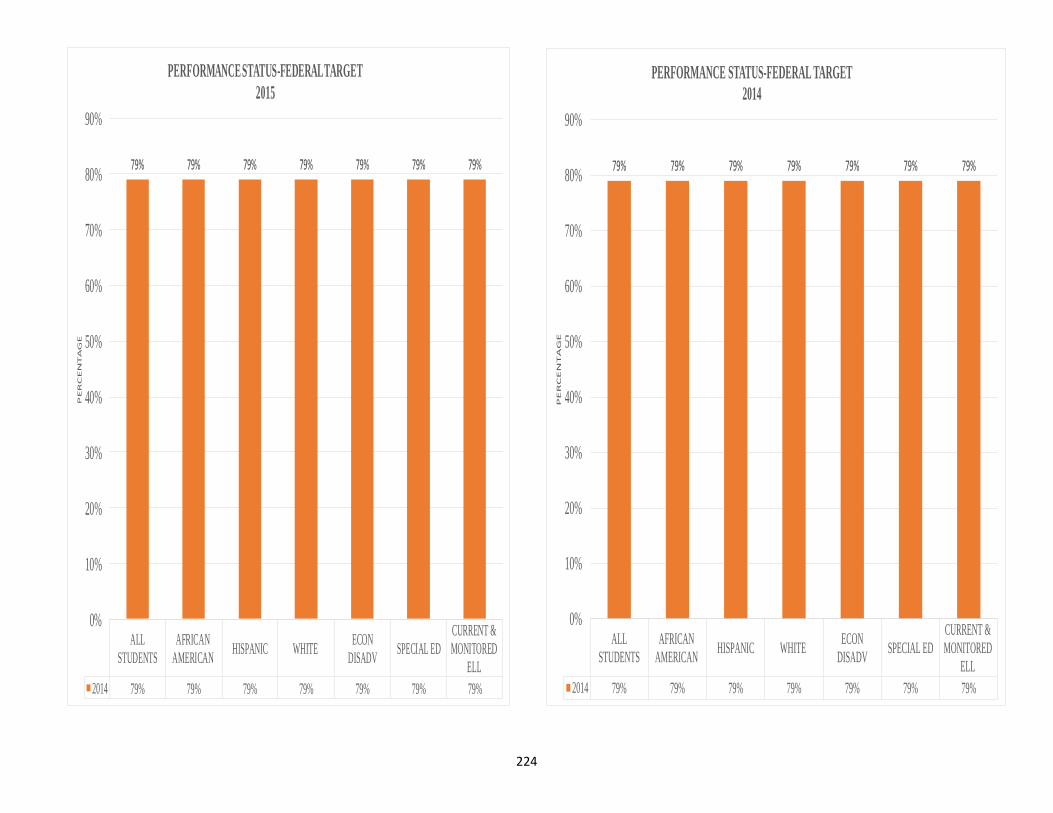
224
ALL
STUDENTS
AFRICAN
AMERICANHISPANIC WHITE
ECON
DISADVSPECIAL ED
CURRENT &
MONITORED
ELL
2014 79% 79% 79% 79% 79% 79% 79%
79% 79% 79% 79% 79% 79% 79%
0%
10%
20%
30%
40%
50%
60%
70%
80%
90%
PE
RC
EN
TA
GE
PERFORMANCE STATUS-FEDERAL TARGET
2015
ALL
STUDENTS
AFRICAN
AMERICANHISPANIC WHITE
ECON
DISADVSPECIAL ED
CURRENT &
MONITORED
ELL
2014 79% 79% 79% 79% 79% 79% 79%
79% 79% 79% 79% 79% 79% 79%
0%
10%
20%
30%
40%
50%
60%
70%
80%
90%
PE
RC
EN
TA
GE
PERFORMANCE STATUS-FEDERAL TARGET
2014
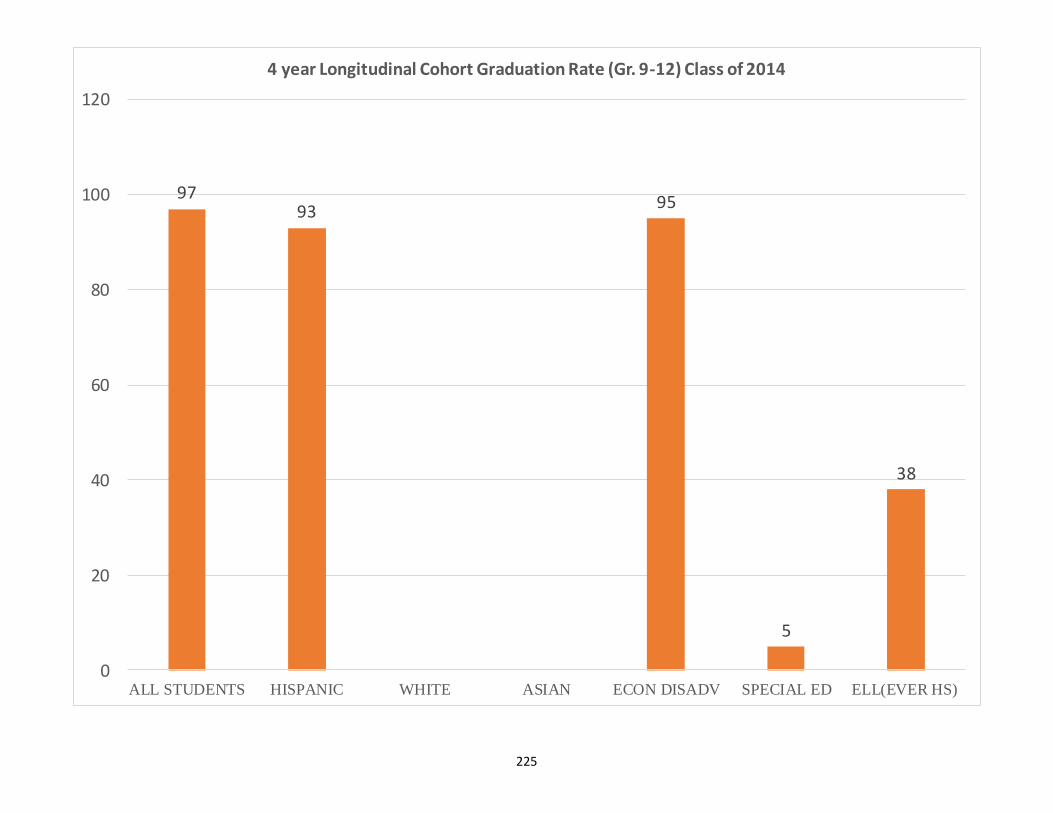
225
9793
95
5
38
0
20
40
60
80
100
120
ALL STUDENTS HISPANIC WHITE ASIAN ECON DISADV SPECIAL ED ELL(EVER HS)
4 year Longitudinal Cohort Graduation Rate (Gr. 9-12) Class of 2014
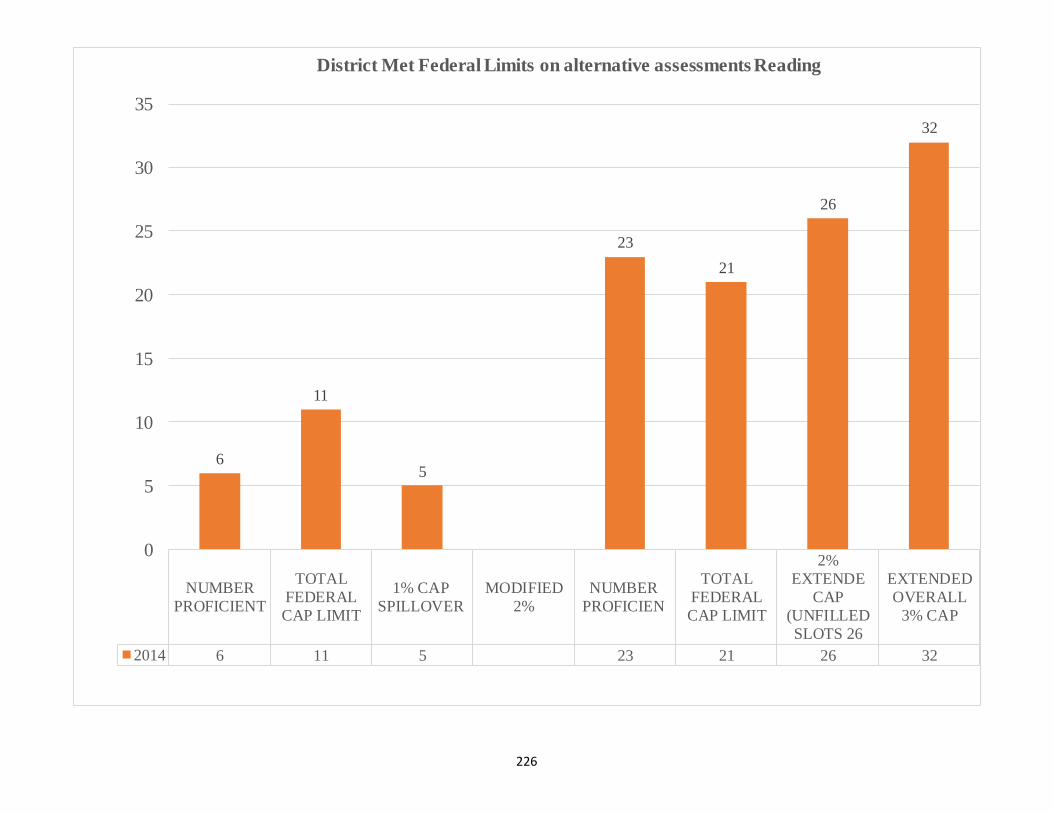
226
NUMBER
PROFICIENT
TOTAL
FEDERAL
CAP LIMIT
1% CAP
SPILLOVER
MODIFIED
2%
NUMBER
PROFICIEN
TOTAL
FEDERAL
CAP LIMIT
2%
EXTENDE
CAP
(UNFILLED
SLOTS 26
EXTENDED
OVERALL
3% CAP
2014 6 11 5 23 21 26 32
6
11
5
23
21
26
32
0
5
10
15
20
25
30
35
District Met Federal Limits on alternative assessments Reading
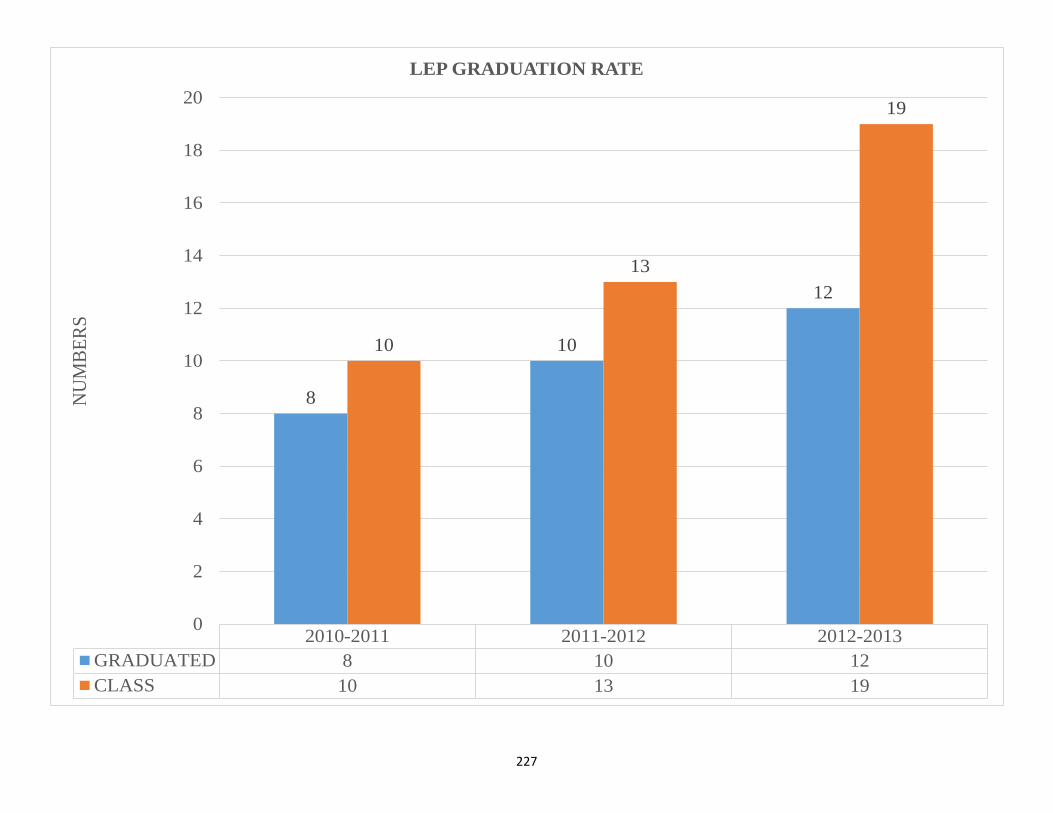
227
2010-2011 2011-2012 2012-2013
GRADUATED 8 10 12
CLASS 10 13 19
8
10
12
10
13
19
0
2
4
6
8
10
12
14
16
18
20N
UM
BE
RS
LEP GRADUATION RATE

228
NUMBER
PROFICIENT
TOTAL
FEDERAL
CAP LIMIT
1% CAP
SPILLOVER
MODIFIED
2%
NUMBER
PROFICIEN
TOTAL
FEDERAL
CAP LIMIT
2%
EXTENDE
CAP
(UNFILLED
SLOTS 26
EXTENDED
OVERALL
3% CAP
2015 6 11 5 23 21 26 32
6
11
5
23
21
26
32
0
5
10
15
20
25
30
35
District Met Federal Limits on alternative assessments Reading
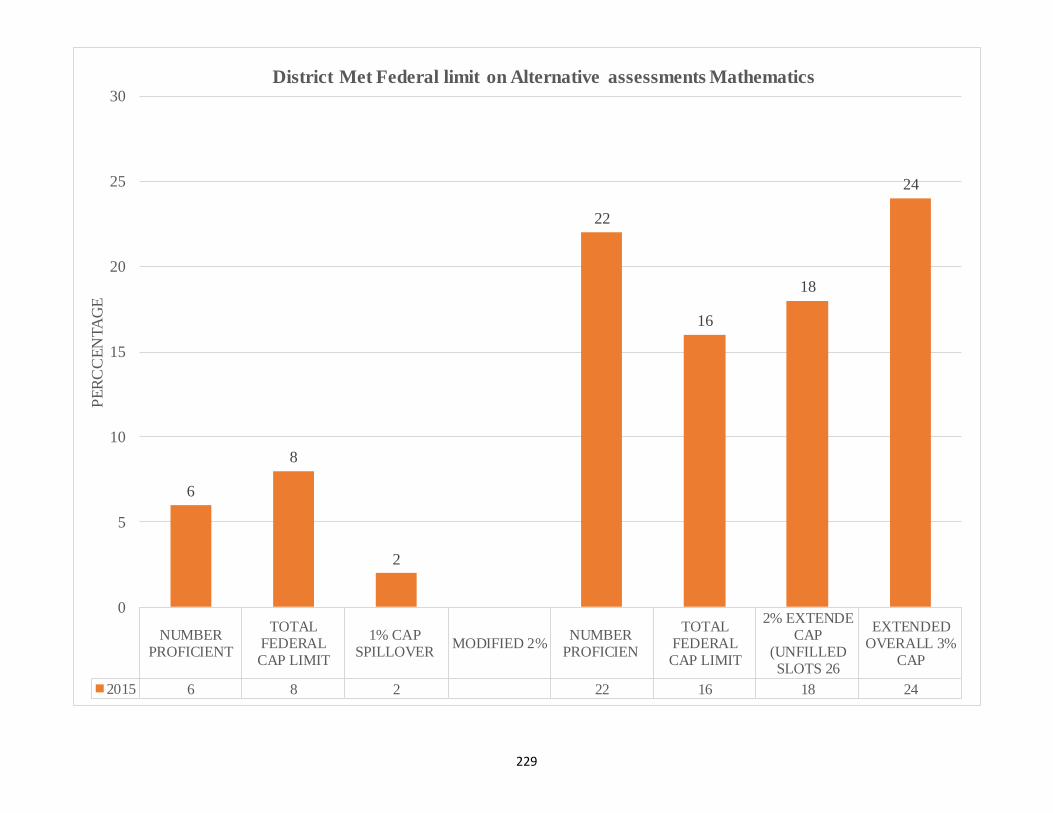
229
NUMBERPROFICIENT
TOTALFEDERALCAP LIMIT
1% CAPSPILLOVER
MODIFIED 2%NUMBER
PROFICIEN
TOTALFEDERALCAP LIMIT
2% EXTENDECAP
(UNFILLEDSLOTS 26
EXTENDEDOVERALL 3%
CAP
2015 6 8 2 22 16 18 24
6
8
2
22
16
18
24
0
5
10
15
20
25
30P
ER
CC
EN
TA
GE
District Met Federal limit on Alternative assessments Mathematics
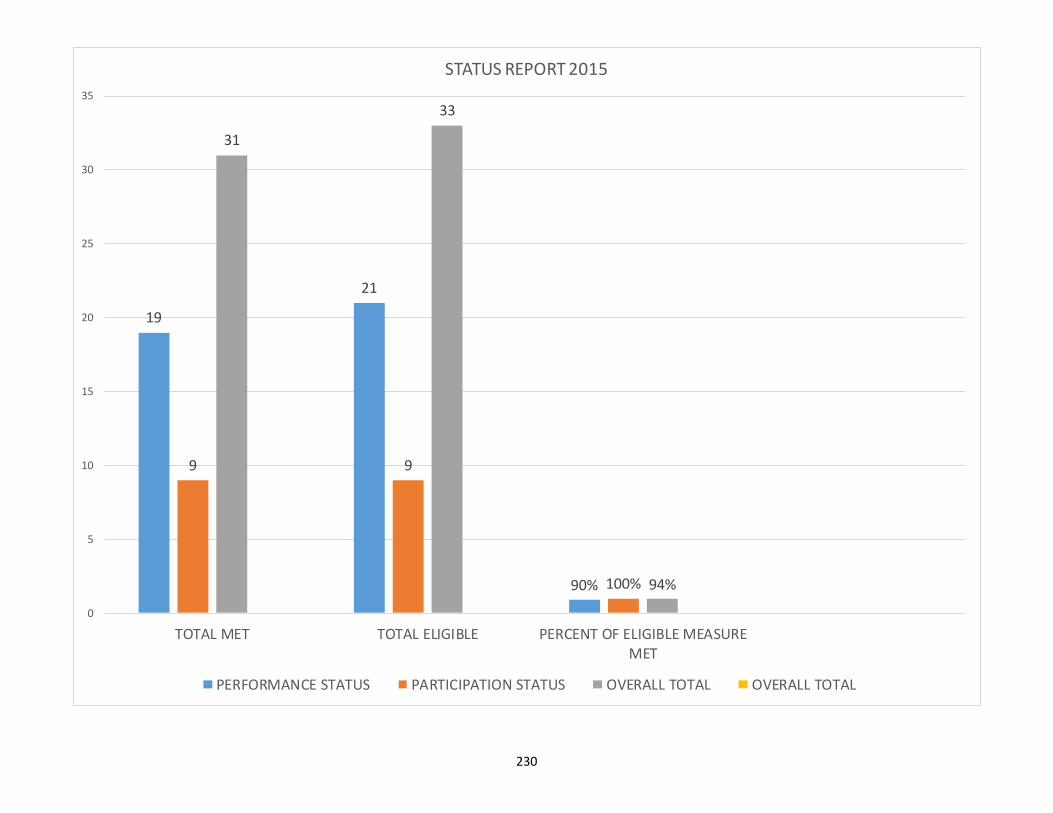
230
19
21
90%
9 9
100%
31
33
94%
0
5
10
15
20
25
30
35
TOTAL MET TOTAL ELIGIBLE PERCENT OF ELIGIBLE MEASUREMET
STATUS REPORT 2015
PERFORMANCE STATUS PARTICIPATION STATUS OVERALL TOTAL OVERALL TOTAL
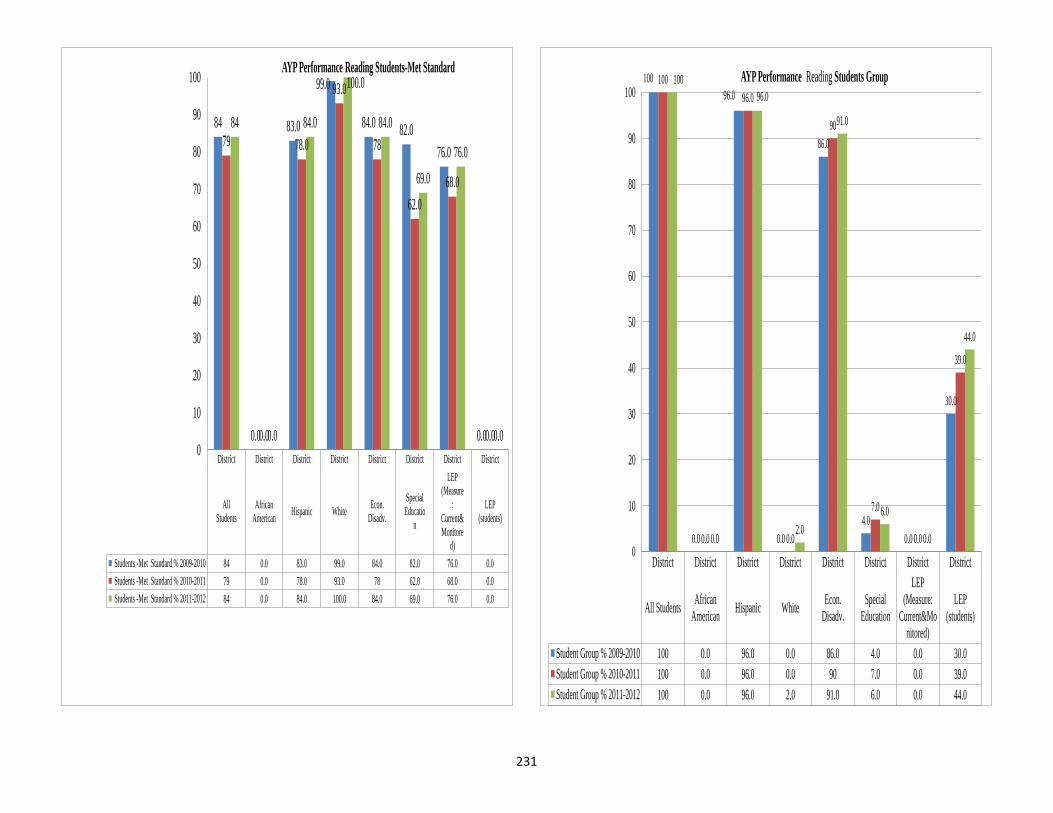
231
District District District District District District District District
All
Students
African
AmericanHispanic White
Econ.
Disadv.
Special
Educatio
n
LEP
(Measure
:
Current&
Monitore
d)
LEP
(students)
Students -Met Standard % 2009-2010 84 0.0 83.0 99.0 84.0 82.0 76.0 0.0
Students -Met Standard % 2010-2011 79 0.0 78.0 93.0 78 62.0 68.0 0.0
Students -Met Standard % 2011-2012 84 0.0 84.0 100.0 84.0 69.0 76.0 0.0
84
0.0
83.0
99.0
84.082.0
76.0
0.0
79
0.0
78.0
93.0
78
62.0
68.0
0.0
84
0.0
84.0
100.0
84.0
69.0
76.0
0.00
10
20
30
40
50
60
70
80
90
100AYP Performance Reading Students-Met Standard
District District District District District District District District
All StudentsAfrican
AmericanHispanic White
Econ.
Disadv.
Special
Education
LEP
(Measure:
Current&Mo
nitored)
LEP
(students)
Student Group % 2009-2010 100 0.0 96.0 0.0 86.0 4.0 0.0 30.0
Student Group % 2010-2011 100 0.0 96.0 0.0 90 7.0 0.0 39.0
Student Group % 2011-2012 100 0.0 96.0 2.0 91.0 6.0 0.0 44.0
100
0.0
96.0
0.0
86.0
4.0
0.0
30.0
100
0.0
96.0
0.0
90
7.0
0.0
39.0
100
0.0
96.0
2.0
91.0
6.0
0.0
44.0
0
10
20
30
40
50
60
70
80
90
100AYP Performance Reading Students Group

232
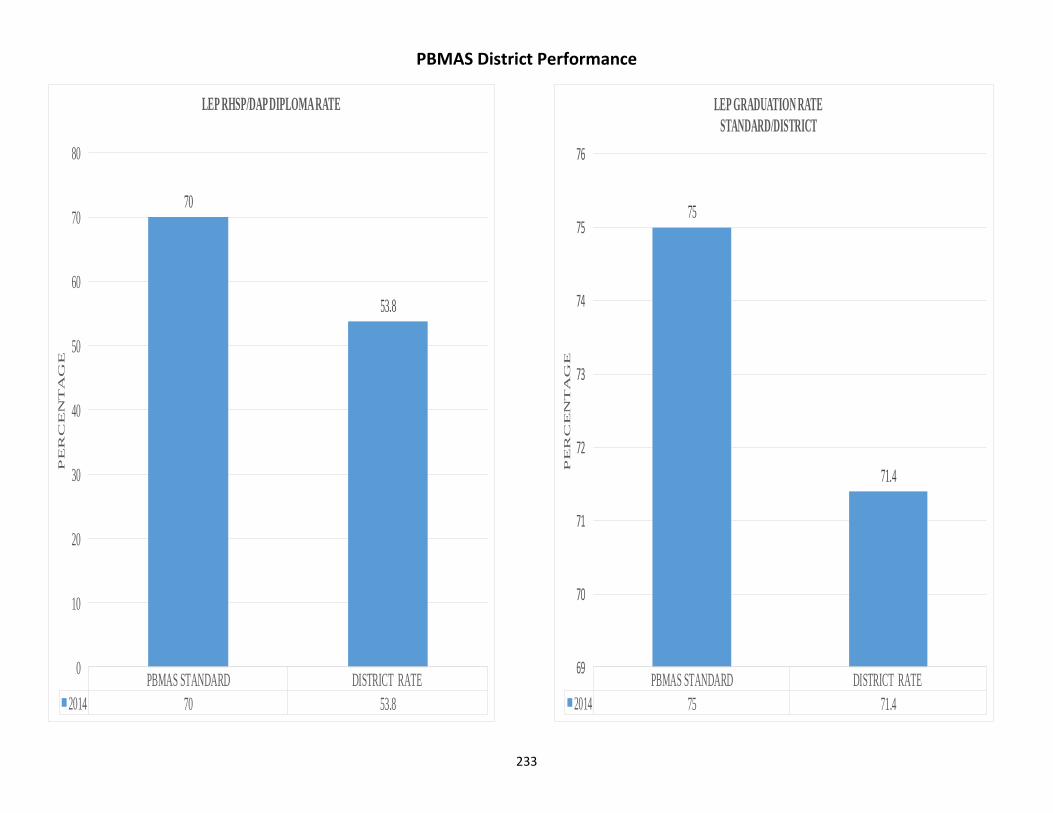
233
PBMAS District Performance
PBMAS STANDARD DISTRICT RATE
2014 70 53.8
70
53.8
0
10
20
30
40
50
60
70
80
PE
RC
EN
TA
GE
LEP RHSP/DAP DIPLOMA RATE
PBMAS STANDARD DISTRICT RATE
2014 75 71.4
75
71.4
69
70
71
72
73
74
75
76
PE
RC
EN
TA
GE
LEP GRADUATION RATE
STANDARD/DISTRICT
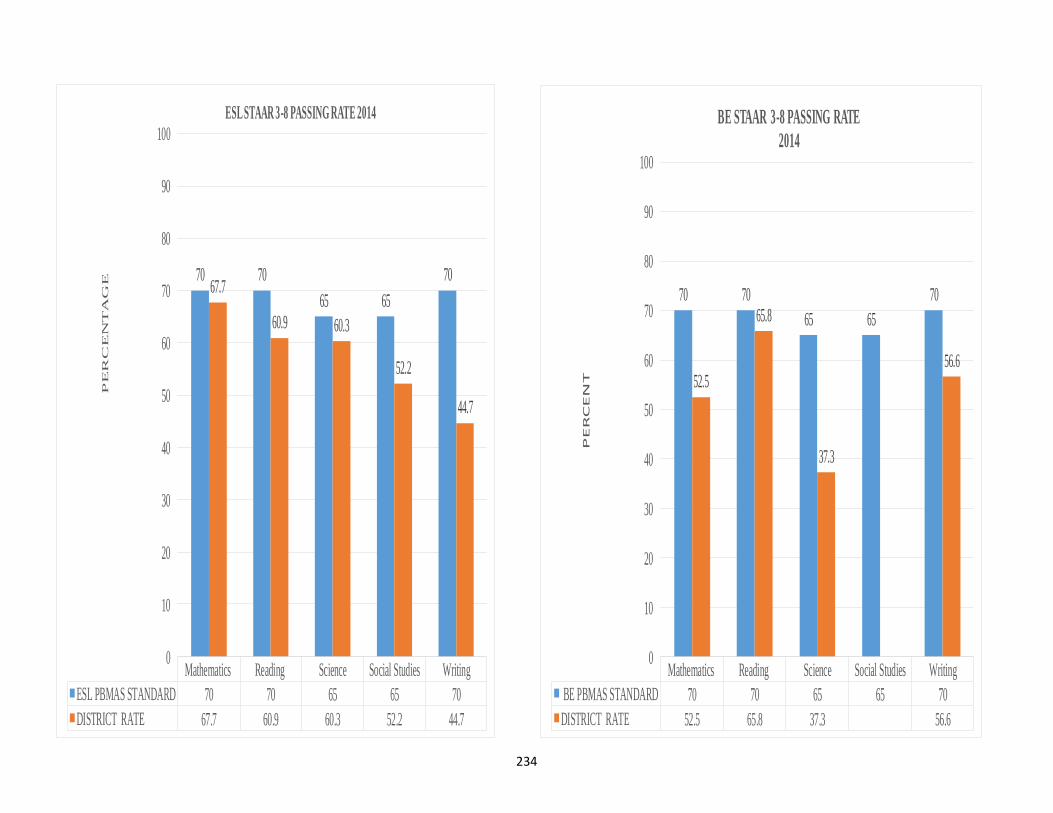
234
Mathematics Reading Science Social Studies Writing
ESL PBMAS STANDARD 70 70 65 65 70
DISTRICT RATE 67.7 60.9 60.3 52.2 44.7
70 70
65 65
7067.7
60.9 60.3
52.2
44.7
0
10
20
30
40
50
60
70
80
90
100
PE
RC
EN
TA
GE
ESL STAAR 3-8 PASSING RATE 2014
Mathematics Reading Science Social Studies Writing
BE PBMAS STANDARD 70 70 65 65 70
DISTRICT RATE 52.5 65.8 37.3 56.6
70 70
65 65
70
52.5
65.8
37.3
56.6
0
10
20
30
40
50
60
70
80
90
100
PE
RC
EN
T
BE STAAR 3-8 PASSING RATE
2014
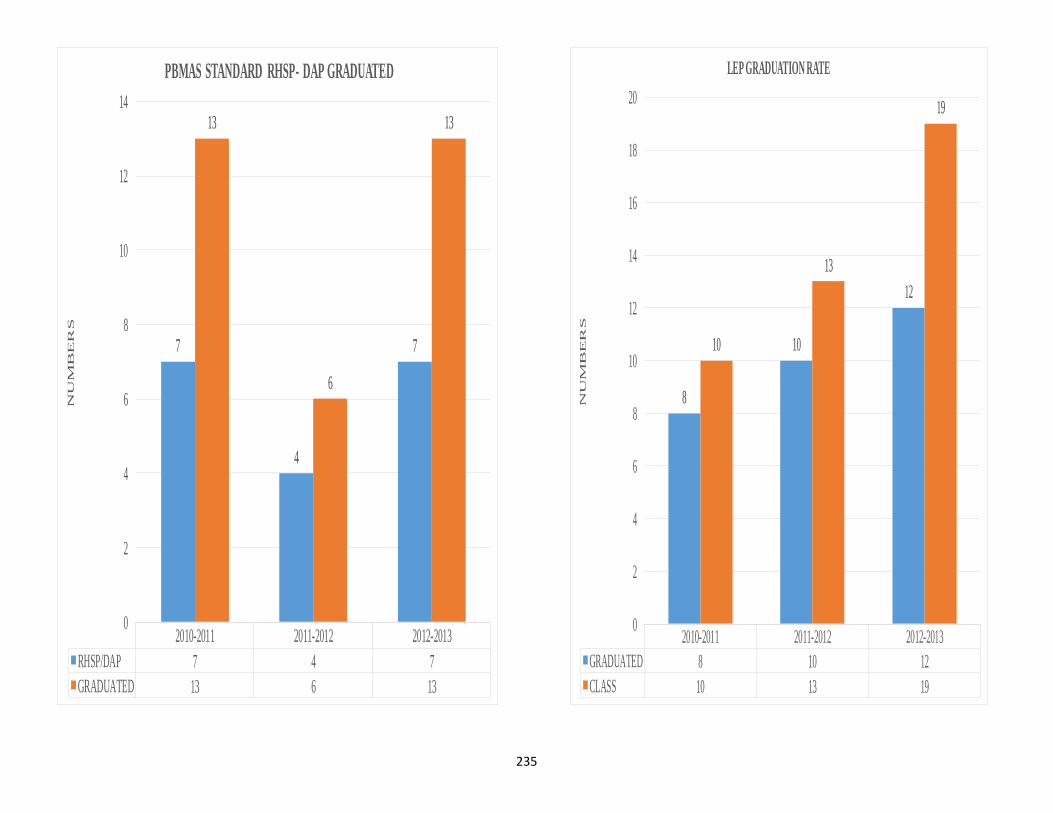
235
2010-2011 2011-2012 2012-2013
RHSP/DAP 7 4 7
GRADUATED 13 6 13
7
4
7
13
6
13
0
2
4
6
8
10
12
14
NU
MB
ER
S
PBMAS STANDARD RHSP- DAP GRADUATED
2010-2011 2011-2012 2012-2013
GRADUATED 8 10 12
CLASS 10 13 19
8
10
12
10
13
19
0
2
4
6
8
10
12
14
16
18
20
NU
MB
ER
S
LEP GRADUATION RATE
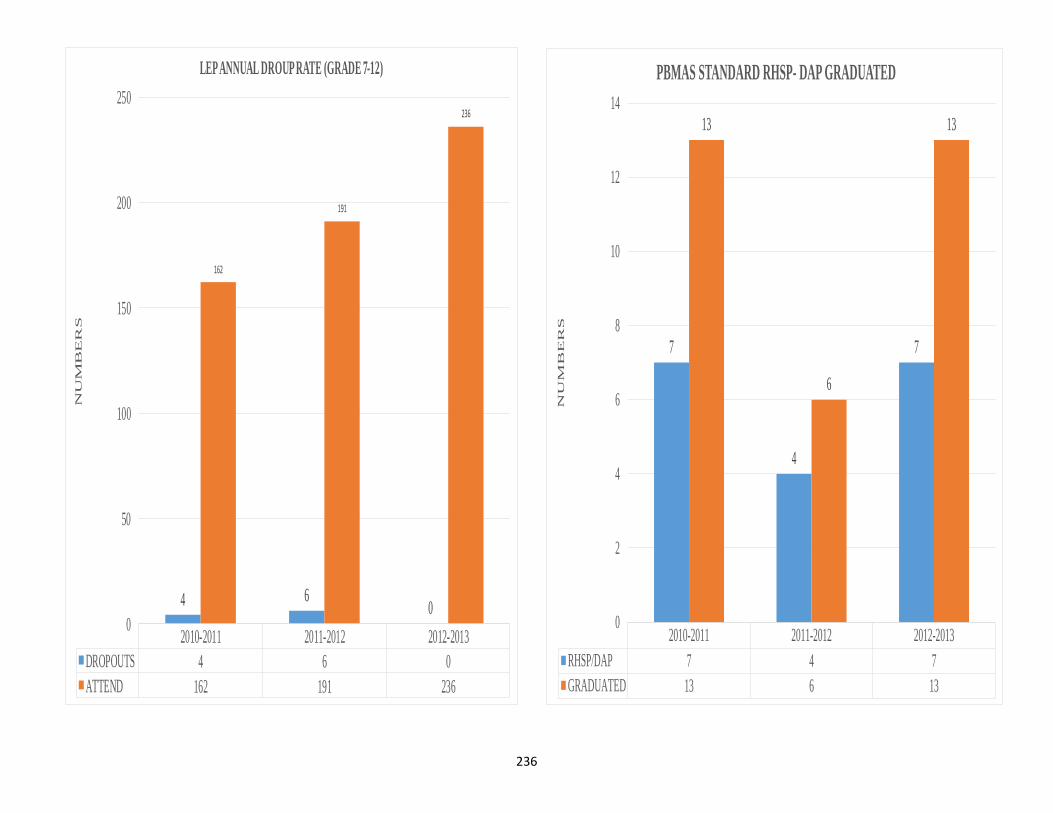
236
2010-2011 2011-2012 2012-2013
DROPOUTS 4 6 0
ATTEND 162 191 236
4 60
162
191
236
0
50
100
150
200
250
NU
MB
ER
SLEP ANNUAL DROUP RATE (GRADE 7-12)
2010-2011 2011-2012 2012-2013
RHSP/DAP 7 4 7
GRADUATED 13 6 13
7
4
7
13
6
13
0
2
4
6
8
10
12
14
NU
MB
ER
S
PBMAS STANDARD RHSP- DAP GRADUATED
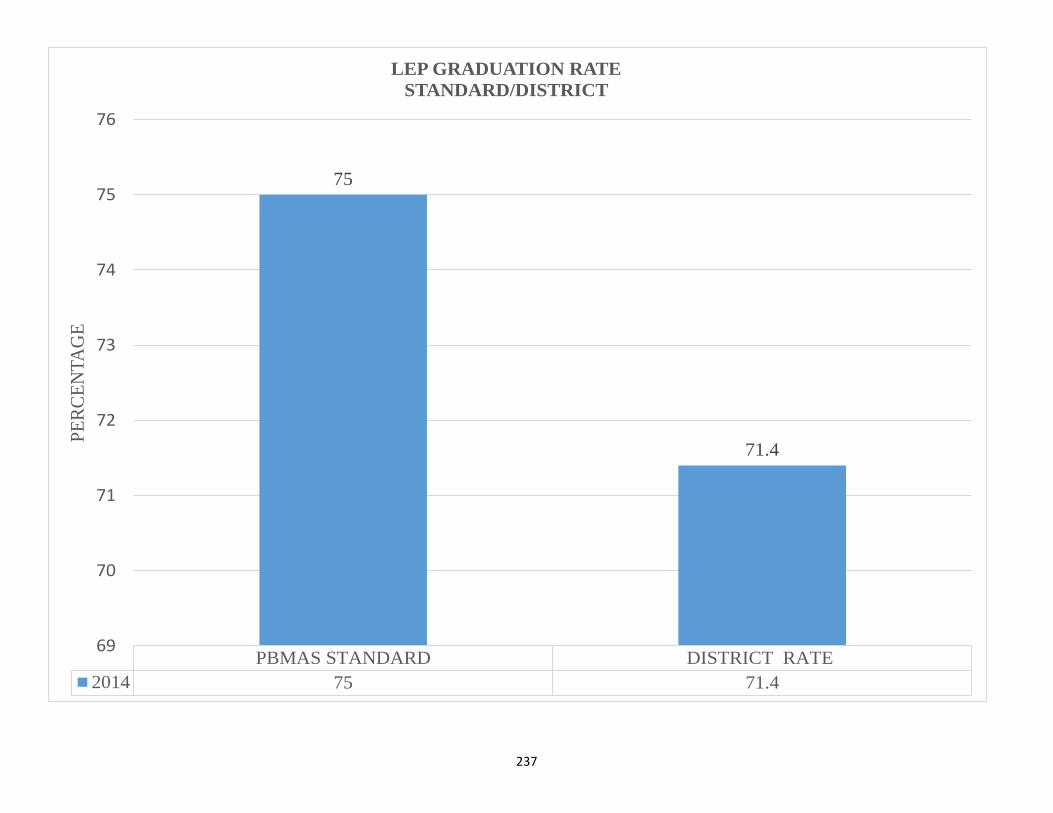
237
PBMAS STANDARD DISTRICT RATE
2014 75 71.4
75
71.4
69
70
71
72
73
74
75
76
PE
RC
EN
TA
GE
LEP GRADUATION RATE
STANDARD/DISTRICT
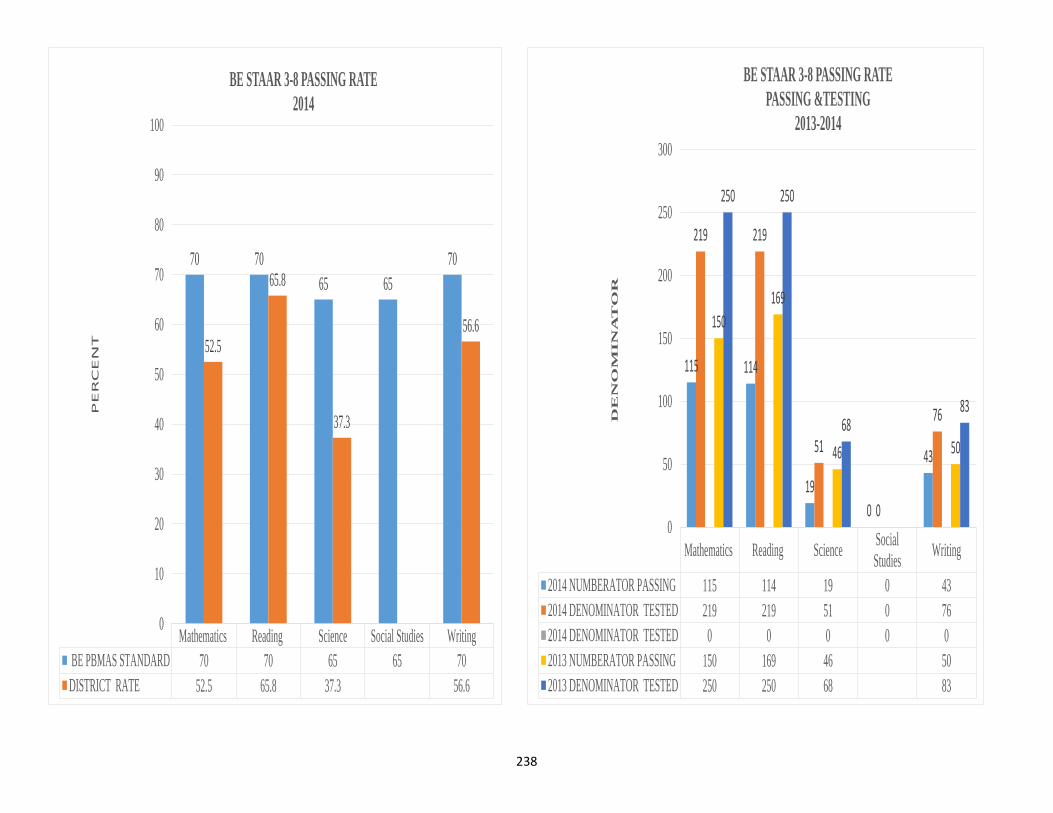
238
Mathematics Reading Science Social Studies Writing
BE PBMAS STANDARD 70 70 65 65 70
DISTRICT RATE 52.5 65.8 37.3 56.6
70 70
65 65
70
52.5
65.8
37.3
56.6
0
10
20
30
40
50
60
70
80
90
100
PE
RC
EN
T
BE STAAR 3-8 PASSING RATE
2014
Mathematics Reading ScienceSocial
StudiesWriting
2014 NUMBERATOR PASSING 115 114 19 0 43
2014 DENOMINATOR TESTED 219 219 51 0 76
2014 DENOMINATOR TESTED 0 0 0 0 0
2013 NUMBERATOR PASSING 150 169 46 50
2013 DENOMINATOR TESTED 250 250 68 83
115 114
19
0
43
219 219
51
0
76
150
169
46 50
250 250
6883
0
50
100
150
200
250
300
DE
NO
MIN
AT
OR
BE STAAR 3-8 PASSING RATE
PASSING &TESTING
2013-2014
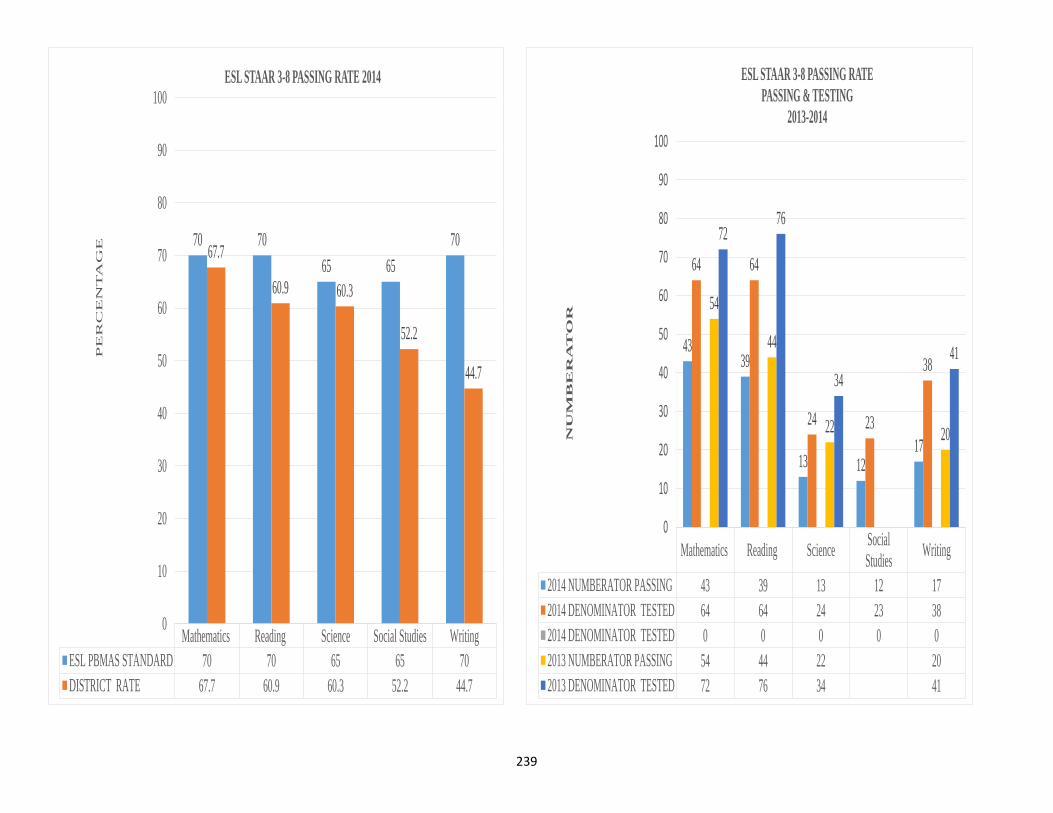
239
Mathematics Reading Science Social Studies Writing
ESL PBMAS STANDARD 70 70 65 65 70
DISTRICT RATE 67.7 60.9 60.3 52.2 44.7
70 70
65 65
7067.7
60.9 60.3
52.2
44.7
0
10
20
30
40
50
60
70
80
90
100P
ER
CE
NT
AG
E
ESL STAAR 3-8 PASSING RATE 2014
Mathematics Reading ScienceSocial
StudiesWriting
2014 NUMBERATOR PASSING 43 39 13 12 17
2014 DENOMINATOR TESTED 64 64 24 23 38
2014 DENOMINATOR TESTED 0 0 0 0 0
2013 NUMBERATOR PASSING 54 44 22 20
2013 DENOMINATOR TESTED 72 76 34 41
4339
13 1217
64 64
24 23
38
54
44
22 20
7276
34
41
0
10
20
30
40
50
60
70
80
90
100
NU
MB
ER
AT
OR
ESL STAAR 3-8 PASSING RATE
PASSING & TESTING
2013-2014
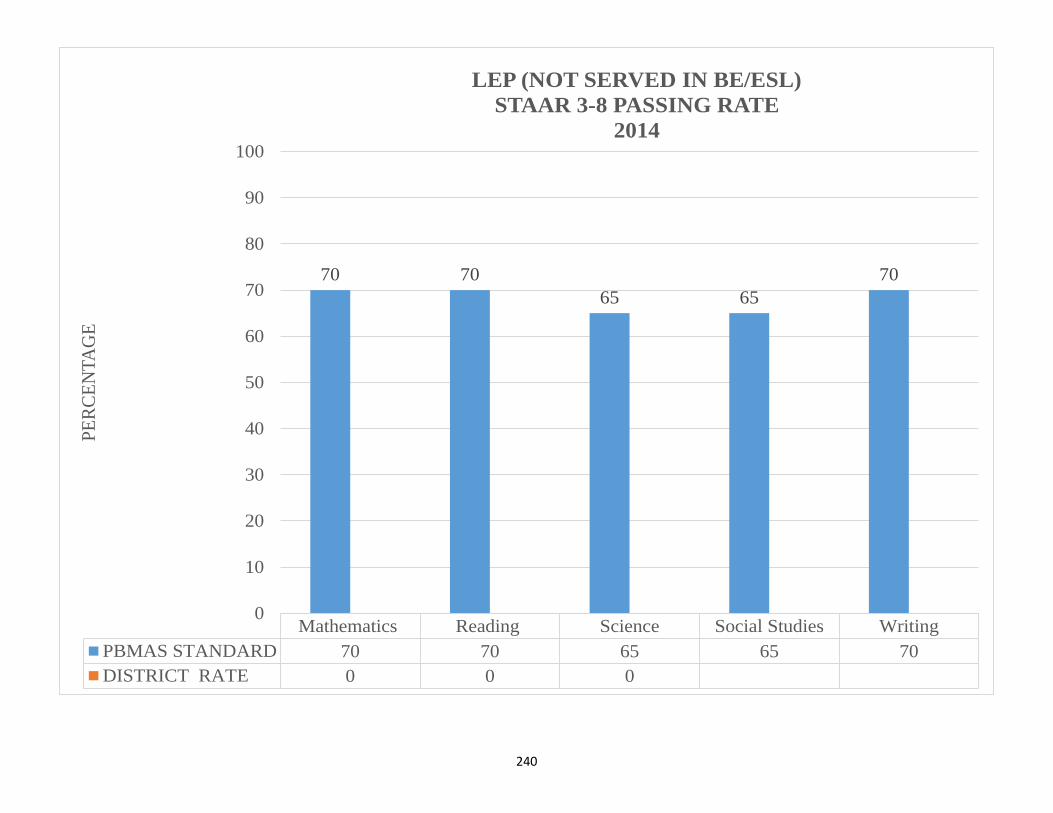
240
Mathematics Reading Science Social Studies Writing
PBMAS STANDARD 70 70 65 65 70
DISTRICT RATE 0 0 0
70 70
65 65
70
0
10
20
30
40
50
60
70
80
90
100
PE
RC
EN
TA
GE
LEP (NOT SERVED IN BE/ESL)
STAAR 3-8 PASSING RATE
2014
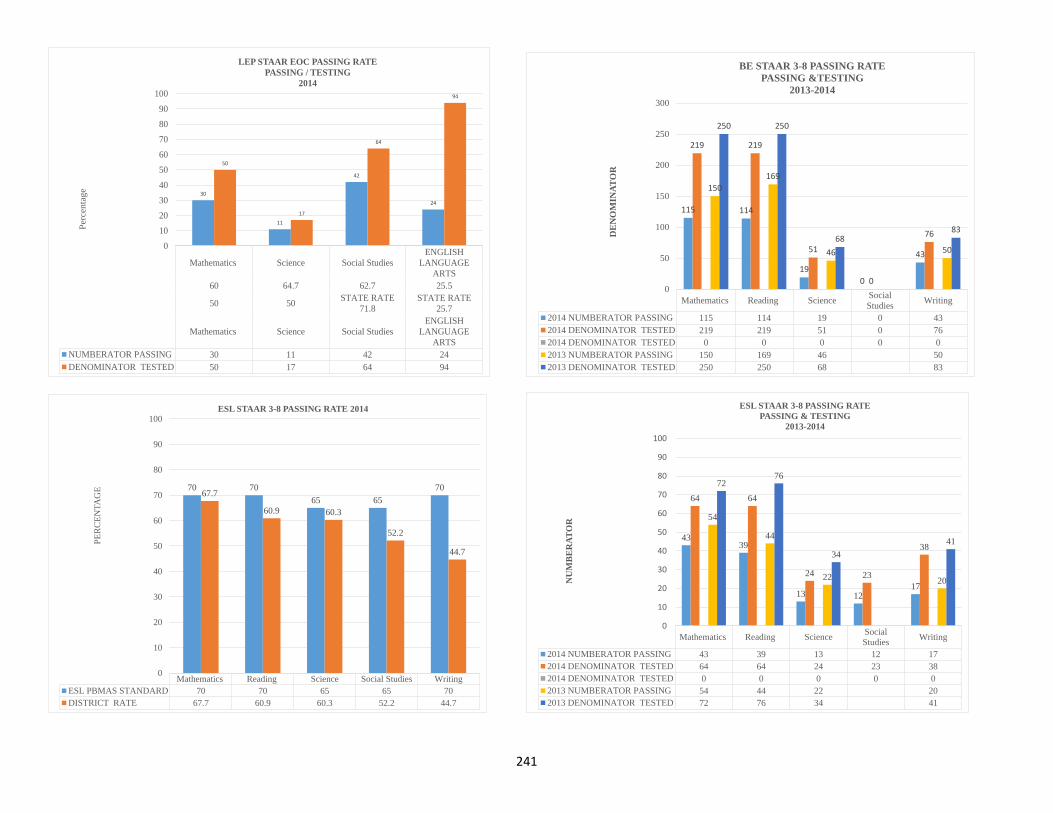
241
Mathematics Science Social Studies
ENGLISH
LANGUAGE
ARTS
60 64.7 62.7 25.5
50 50STATE RATE
71.8
STATE RATE
25.7
Mathematics Science Social Studies
ENGLISH
LANGUAGE
ARTS
NUMBERATOR PASSING 30 11 42 24
DENOMINATOR TESTED 50 17 64 94
30
11
42
24
50
17
64
94
0
10
20
30
40
50
60
70
80
90
100
Perc
en
tag
e
LEP STAAR EOC PASSING RATE
PASSING / TESTING
2014
Mathematics Reading ScienceSocial
StudiesWriting
2014 NUMBERATOR PASSING 115 114 19 0 43
2014 DENOMINATOR TESTED 219 219 51 0 76
2014 DENOMINATOR TESTED 0 0 0 0 0
2013 NUMBERATOR PASSING 150 169 46 50
2013 DENOMINATOR TESTED 250 250 68 83
115 114
19
0
43
219 219
51
0
76
150
169
46 50
250 250
6883
0
50
100
150
200
250
300
DE
NO
MIN
AT
OR
BE STAAR 3-8 PASSING RATE
PASSING &TESTING
2013-2014
Mathematics Reading Science Social Studies Writing
ESL PBMAS STANDARD 70 70 65 65 70
DISTRICT RATE 67.7 60.9 60.3 52.2 44.7
70 70
65 65
7067.7
60.9 60.3
52.2
44.7
0
10
20
30
40
50
60
70
80
90
100
PE
RC
EN
TA
GE
ESL STAAR 3-8 PASSING RATE 2014
Mathematics Reading ScienceSocial
StudiesWriting
2014 NUMBERATOR PASSING 43 39 13 12 17
2014 DENOMINATOR TESTED 64 64 24 23 38
2014 DENOMINATOR TESTED 0 0 0 0 0
2013 NUMBERATOR PASSING 54 44 22 20
2013 DENOMINATOR TESTED 72 76 34 41
4339
13 1217
64 64
24 23
38
54
44
22 20
7276
34
41
0
10
20
30
40
50
60
70
80
90
100
NU
MB
ER
AT
OR
ESL STAAR 3-8 PASSING RATE
PASSING & TESTING
2013-2014
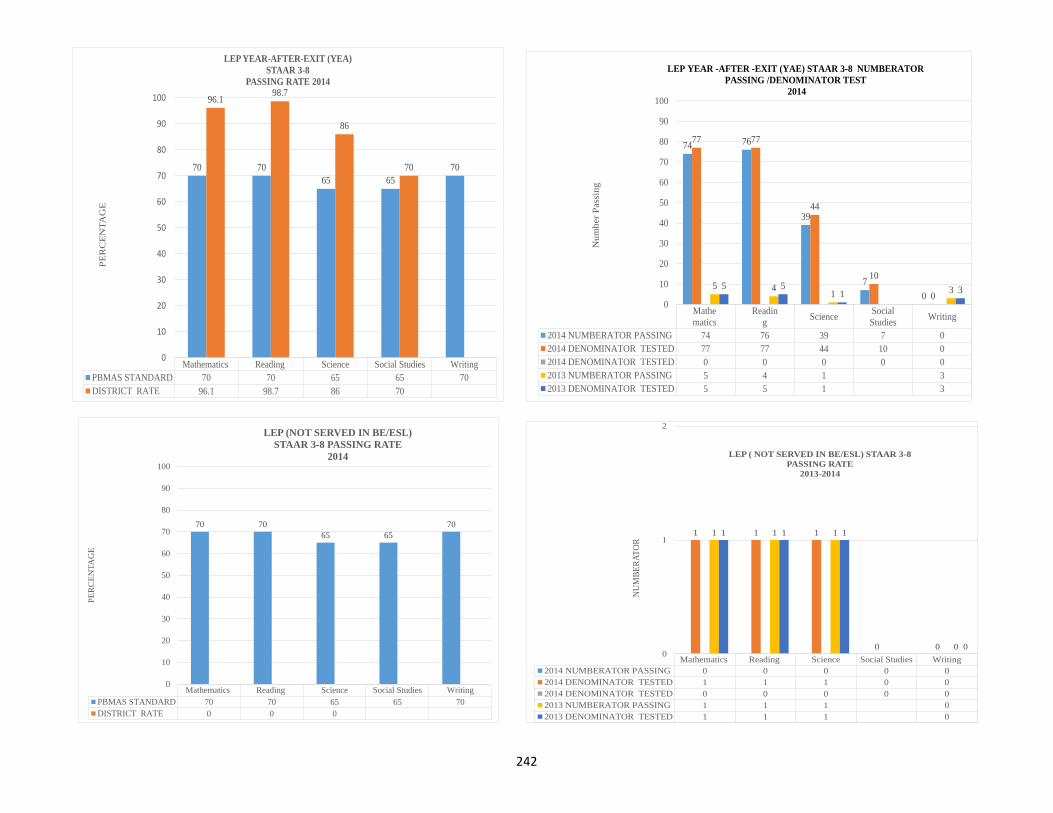
242
Mathematics Reading Science Social Studies Writing
PBMAS STANDARD 70 70 65 65 70
DISTRICT RATE 96.1 98.7 86 70
70 70
65 65
70
96.198.7
86
70
0
10
20
30
40
50
60
70
80
90
100P
ER
CE
NT
AG
E
LEP YEAR-AFTER-EXIT (YEA)
STAAR 3-8
PASSING RATE 2014
Mathe
matics
Readin
gScience
Social
StudiesWriting
2014 NUMBERATOR PASSING 74 76 39 7 0
2014 DENOMINATOR TESTED 77 77 44 10 0
2014 DENOMINATOR TESTED 0 0 0 0 0
2013 NUMBERATOR PASSING 5 4 1 3
2013 DENOMINATOR TESTED 5 5 1 3
74 76
39
7
0
77 77
44
10
05 4
1 35 51 3
0
10
20
30
40
50
60
70
80
90
100
Nu
mb
er
Pass
ing
LEP YEAR -AFTER -EXIT (YAE) STAAR 3-8 NUMBERATOR
PASSING /DENOMINATOR TEST
2014
Mathematics Reading Science Social Studies Writing
PBMAS STANDARD 70 70 65 65 70
DISTRICT RATE 0 0 0
70 70
65 65
70
0
10
20
30
40
50
60
70
80
90
100
PE
RC
EN
TA
GE
LEP (NOT SERVED IN BE/ESL)
STAAR 3-8 PASSING RATE
2014
Mathematics Reading Science Social Studies Writing
2014 NUMBERATOR PASSING 0 0 0 0 0
2014 DENOMINATOR TESTED 1 1 1 0 0
2014 DENOMINATOR TESTED 0 0 0 0 0
2013 NUMBERATOR PASSING 1 1 1 0
2013 DENOMINATOR TESTED 1 1 1 0
1 1 1
0 0
1 1 1
0
1 1 1
00
1
2
NU
MB
ER
AT
OR
LEP ( NOT SERVED IN BE/ESL) STAAR 3-8
PASSING RATE
2013-2014
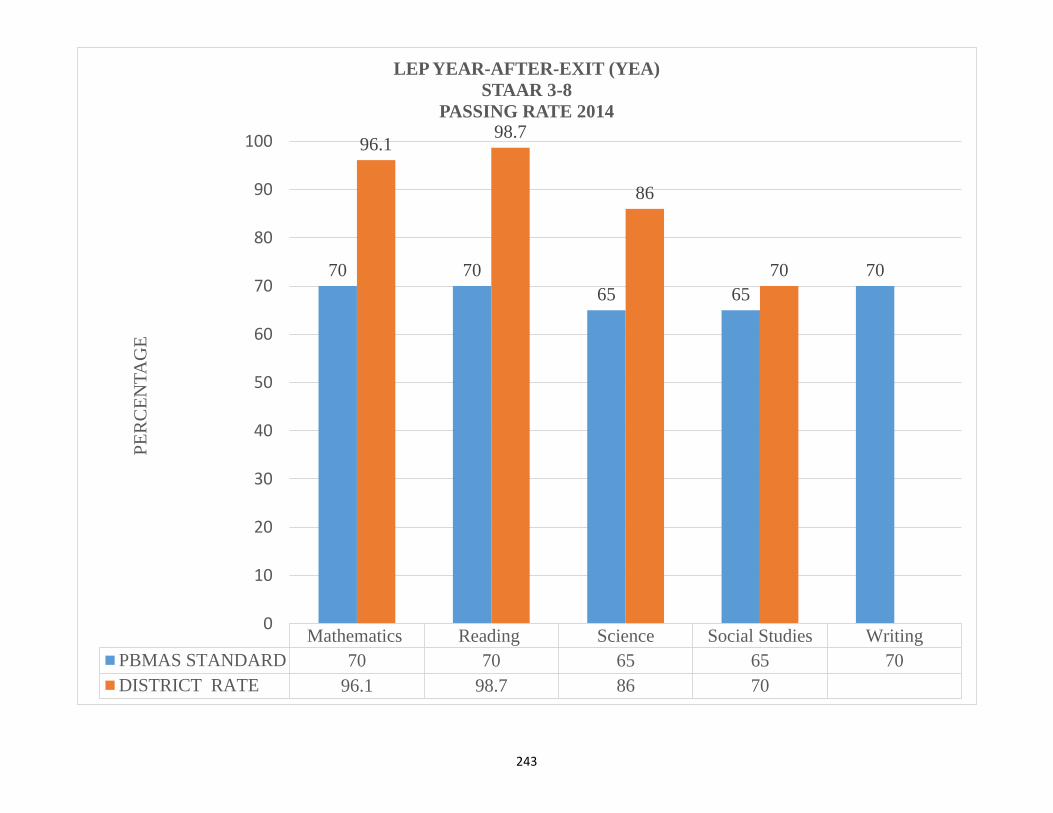
243
Mathematics Reading Science Social Studies Writing
PBMAS STANDARD 70 70 65 65 70
DISTRICT RATE 96.1 98.7 86 70
70 70
65 65
70
96.198.7
86
70
0
10
20
30
40
50
60
70
80
90
100P
ER
CE
NT
AG
E
LEP YEAR-AFTER-EXIT (YEA)
STAAR 3-8
PASSING RATE 2014
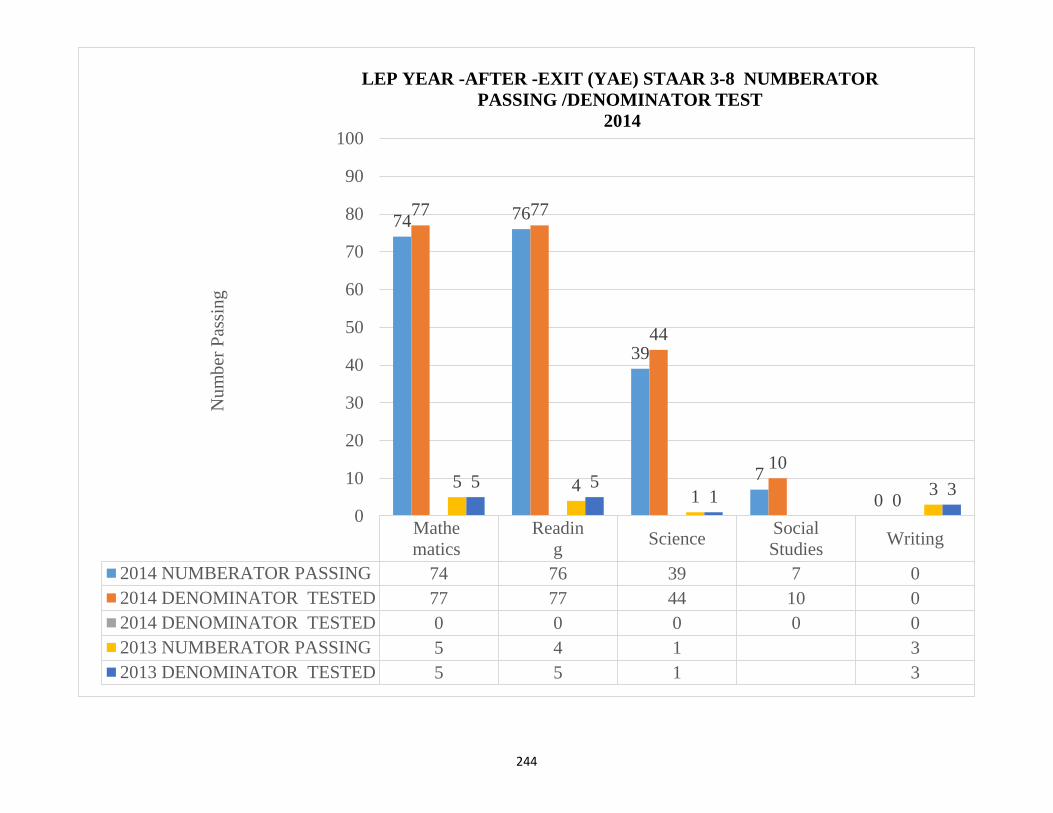
244
Mathe
matics
Readin
gScience
Social
StudiesWriting
2014 NUMBERATOR PASSING 74 76 39 7 0
2014 DENOMINATOR TESTED 77 77 44 10 0
2014 DENOMINATOR TESTED 0 0 0 0 0
2013 NUMBERATOR PASSING 5 4 1 3
2013 DENOMINATOR TESTED 5 5 1 3
74 76
39
7
0
77 77
44
10
05 4
1 35 51 3
0
10
20
30
40
50
60
70
80
90
100
Nu
mb
er P
assi
ng
LEP YEAR -AFTER -EXIT (YAE) STAAR 3-8 NUMBERATOR
PASSING /DENOMINATOR TEST
2014
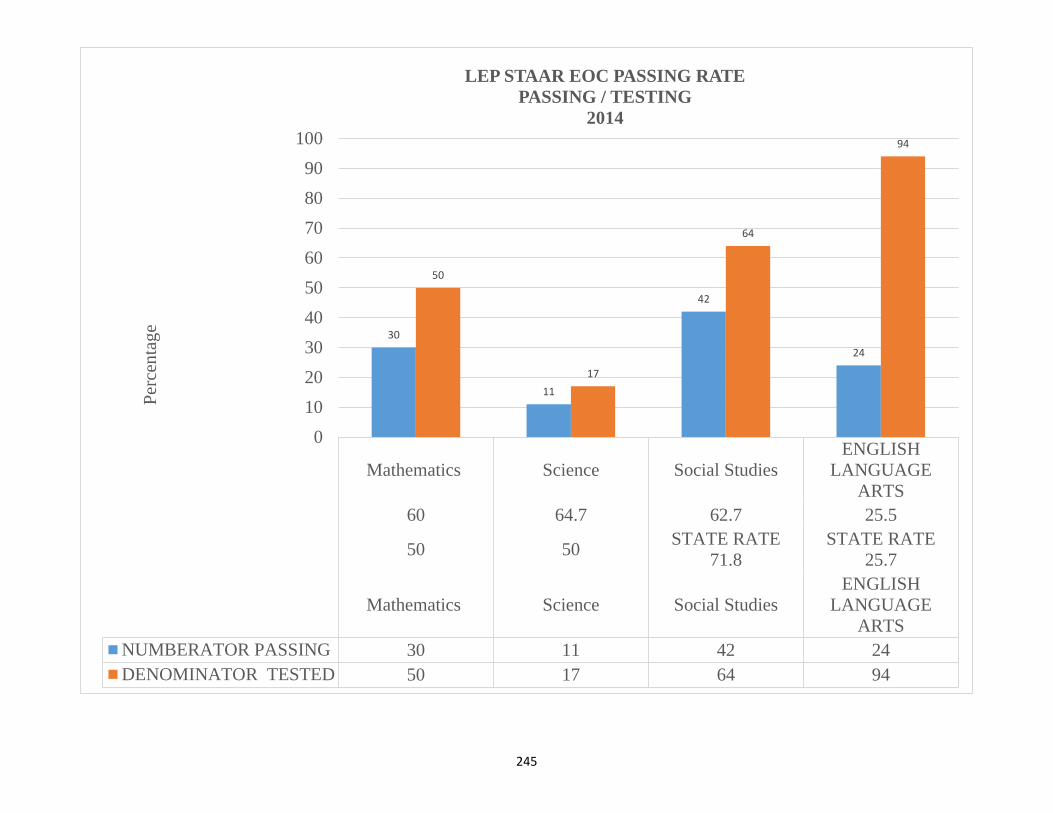
245
Mathematics Science Social Studies
ENGLISH
LANGUAGE
ARTS
60 64.7 62.7 25.5
50 50STATE RATE
71.8
STATE RATE
25.7
Mathematics Science Social Studies
ENGLISH
LANGUAGE
ARTS
NUMBERATOR PASSING 30 11 42 24
DENOMINATOR TESTED 50 17 64 94
30
11
42
24
50
17
64
94
0
10
20
30
40
50
60
70
80
90
100P
erce
nta
ge
LEP STAAR EOC PASSING RATE
PASSING / TESTING
2014

246
STAAR Percent at Postsecondary Readiness Standard
State DistricBilingual
EducationBE-TransEarly Exit
ESL ESL ContentLEP withServices
Total ELL
2014 41 31 8 8 5 5 6 6
41
31
8 85 5 6 6
0
10
20
30
40
50
60
70
80
90
100
Pe
rce
nta
ge o
f St
ud
en
ts
STAAR Percentage at Postsecondary Readliness Standard All Grades Two or more Subjects2014
State DistricBilingual
EducationBE-TransEarly Exit
ESL ESL ContentLEP withServices
Total ELL
2014 41 31 8 8 5 5 6 6
41
31
8 85 5 6 6
0
10
20
30
40
50
60
70
80
90
100
Pe
rce
nta
ge o
f St
ud
en
ts
STAAR Percentage at Postsecondary Readliness Standard All Grades Two or more Subjects2014
State DistricBilingual
EducationBE-TransEarly Exit
ESL ESL ContentLEP withServices
Total ELLLimtedEnglish
Proficient
2014 45 32 43 11 11 6 6 8 8
45
32
43
11 11
6 68 8
0
10
20
30
40
50
60
70
80
90
100
Perc
enta
ge S
tude
nt
STAAR Percent at Postsecondary Readiness Strandard All grade Reading 2014
State DistricBilingual
EducationBE-TransEarly Exit
ESL ESL ContentLEP withServices
Total ELL
2014 39 24 34 16 16 16 16 16
39
24
34
16 16 16 16 16
0
10
20
30
40
50
60
70
80
90
100
Perc
enta
ge o
f St
uden
ts
STAAR Percent at Postsecondary Readiness Standard All grade Mathematics 2014
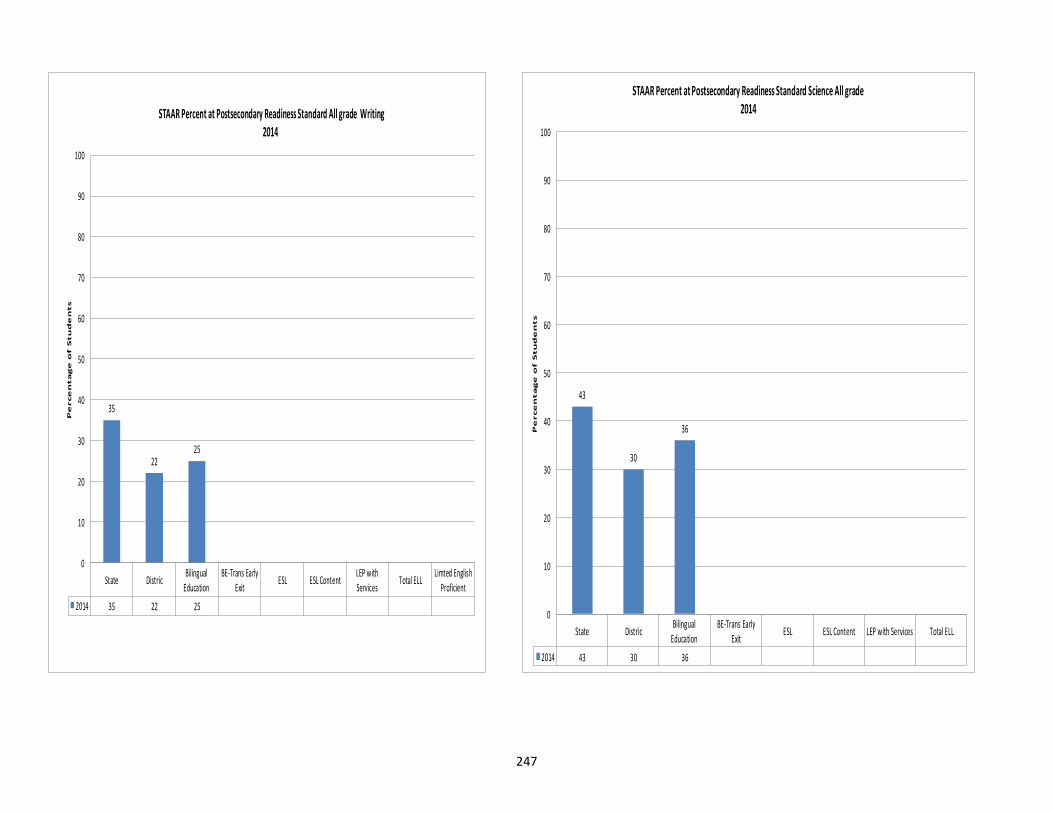
247
State DistricBilingual
Education
BE-Trans Early
ExitESL ESL Content
LEP with
ServicesTotal ELL
Limted English
Proficient
2014 35 22 25
35
2225
0
10
20
30
40
50
60
70
80
90
100
Pe
rce
nta
ge
of S
tu
de
nts
STAAR Percent at Postsecondary Readiness Standard All grade Writing 2014
State DistricBilingual
Education
BE-Trans Early
ExitESL ESL Content LEP with Services Total ELL
2014 43 30 36
43
30
36
0
10
20
30
40
50
60
70
80
90
100
Pe
rce
nta
ge
of S
tu
de
nts
STAAR Percent at Postsecondary Readiness Standard Science All grade 2014
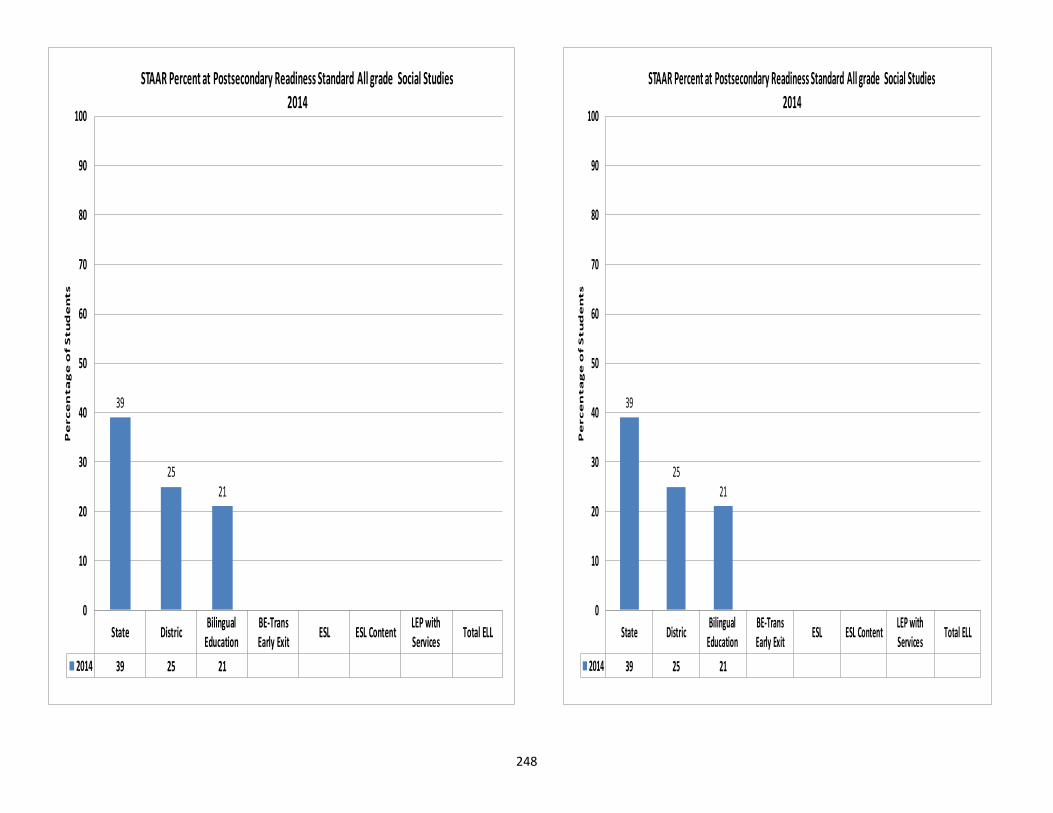
248
State DistricBilingual
EducationBE-TransEarly Exit
ESL ESL ContentLEP withServices
Total ELL
2014 39 25 21
39
2521
0
10
20
30
40
50
60
70
80
90
100
Pe
rce
nta
ge
of S
tu
de
nts
STAAR Percent at Postsecondary Readiness Standard All grade Social Studies
2014
State DistricBilingual
EducationBE-TransEarly Exit
ESL ESL ContentLEP withServices
Total ELL
2014 39 25 21
39
2521
0
10
20
30
40
50
60
70
80
90
100
Pe
rce
nta
ge
of S
tu
de
nts
STAAR Percent at Postsecondary Readiness Standard All grade Social Studies
2014
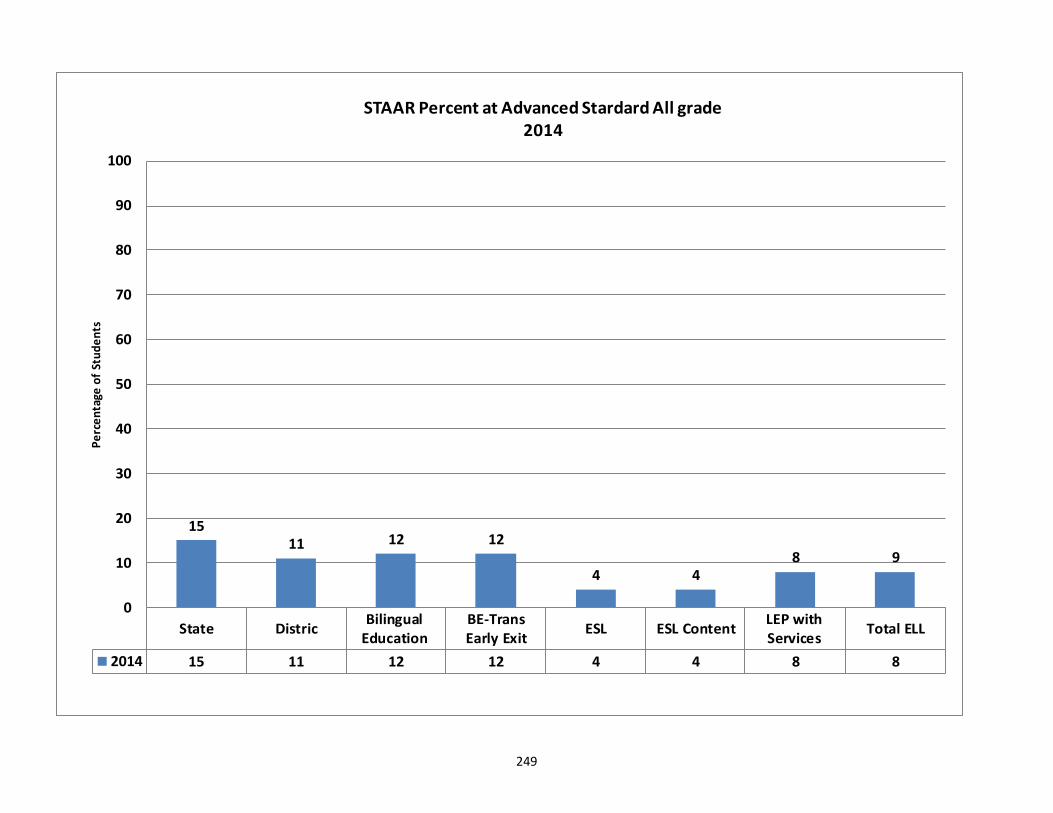
249
State DistricBilingual
EducationBE-TransEarly Exit
ESL ESL ContentLEP withServices
Total ELL
2014 15 11 12 12 4 4 8 8
1511 12 12
4 48 9
0
10
20
30
40
50
60
70
80
90
100
Pe
rce
nta
ge o
f St
ud
en
ts
STAAR Percent at Advanced Stardard All grade 2014
250
Texas English Language Proficiency Assessment System (TELPAS)
Reports of TELPAS student performance data provide information about the student’s second language development in the areas of listening,
speaking, reading, and writing. This information may be used in a variety of ways. For example, the results may be used for evaluating student
results for instructional decisions; evaluating programs, resources, and staffing patterns; and/or evaluating districts in federal accountability
measures.
The Texas English Language Proficiency Assessment System (TELPAS) fulfills federal requirements for assessing the English language proficiency
of English language learners (ELLs) in kindergarten through grade 12 in four language domains: listening, speaking, reading, and writing. TELPAS
assesses students in alignment with the Texas English Language Proficiency Standards (ELPS), which are part of the Texas Essential Knowledge and
Skills (TEKS). Student performance is reported in terms of four English language proficiency levels: beginning, intermediate, advanced, and
advanced high. TELPAS results are used to meet state and federal reporting and accountability requirements.
Comprehension score
The No Child Left Behind Act of 2001 requires states to generate comprehension scores from their English language proficiency assessments. The
TELPAS comprehension score ranges from 1 to 4. The score is determined from the listening and reading proficiency ratings. To derive the score,
the student’s listening and reading ratings are each converted to a number from 1 (Beginning) to 4 (Advanced High). The average of the two numbers
is the comprehension score.
Composite score and composite rating
The composite results indicate the student’s overall level of English language proficiency and are determined from the student’s listening, speaking,
reading, and writing proficiency ratings. The composite score ranges from 1 (ratings of Beginning in all language areas) to 4 (ratings of Advanced
High in all language areas). The student’s reading proficiency rating is given the greatest weight in determining composite results. Only students
rated in all four language areas receive composite results.
As required under the federal No Child Left Behind (NCLB) Act of 2001, Local Education Agencies (LEAs) that receive Title III funding for English
language acquisition programs are held accountable for their limited English proficient (LEP) students' achievement in learning the English language.
Each year, LEP students' English language proficiency in listening, speaking, reading and writing is assessed using the Texas English Language
Proficiency Assessment System (TELPAS). The achievement of a Title III-funded LEA's LEP student population then is measured against the state's
achievement standards known as the Annual Measurable Achievement Objectives (AMAOs). The AMAOs include indicators for measuring
Progress in learning the English language, Attainment of English language proficiency and LEP AYP -that is, the LEA's LEP student population's
adequate yearly progress in meeting the state's student academic achievement standards. Federal regulations also require that AMAO standards
increase annually unless substantive changes are made in the assessment used to evaluate achievement.
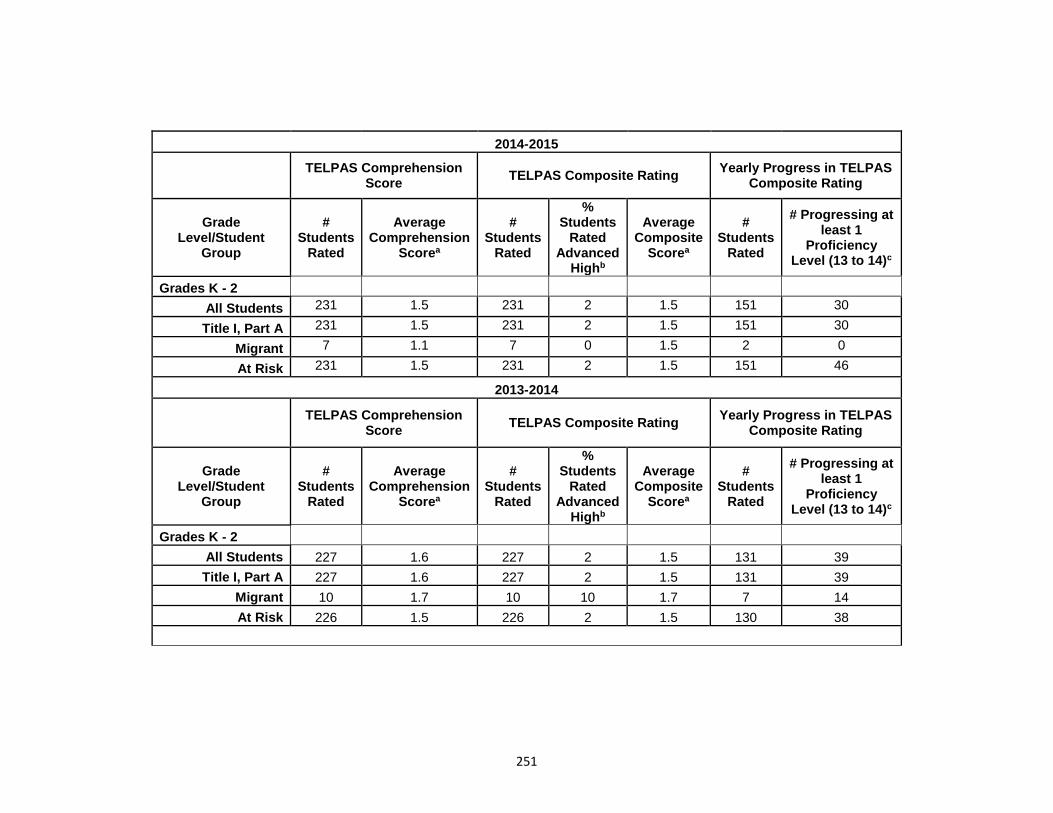
251
2014-2015
TELPAS Comprehension
Score TELPAS Composite Rating
Yearly Progress in TELPAS Composite Rating
Grade Level/Student
Group
# Students
Rated
Average Comprehension
Scorea
# Students
Rated
% Students
Rated Advanced
Highb
Average Composite
Scorea
# Students
Rated
# Progressing at least 1
Proficiency Level (13 to 14)c
Grades K - 2
All Students 231 1.5 231 2 1.5 151 30
Title I, Part A 231 1.5 231 2 1.5 151 30
Migrant 7 1.1 7 0 1.5 2 0
At Risk 231 1.5 231 2 1.5 151 46
2013-2014
TELPAS Comprehension
Score TELPAS Composite Rating
Yearly Progress in TELPAS Composite Rating
Grade Level/Student
Group
# Students
Rated
Average Comprehension
Scorea
# Students
Rated
% Students
Rated Advanced
Highb
Average Composite
Scorea
# Students
Rated
# Progressing at least 1
Proficiency Level (13 to 14)c
Grades K - 2
All Students 227 1.6 227 2 1.5 131 39
Title I, Part A 227 1.6 227 2 1.5 131 39
Migrant 10 1.7 10 10 1.7 7 14
At Risk 226 1.5 226 2 1.5 130 38
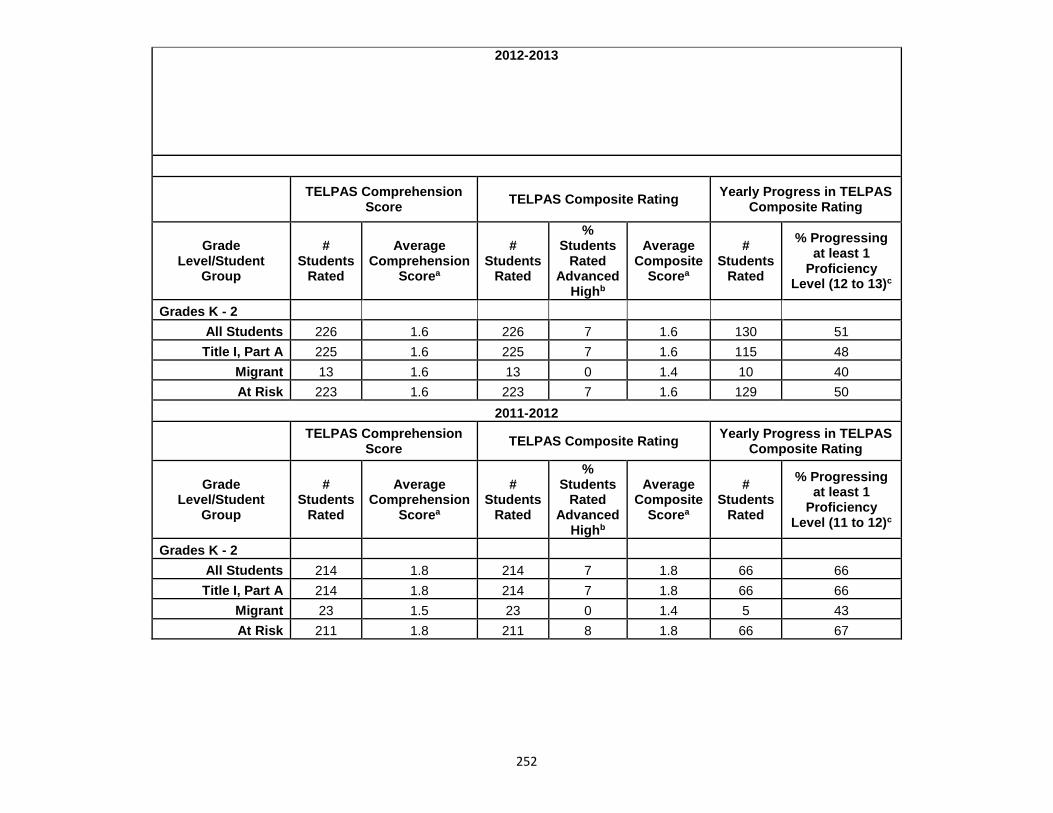
252
2012-2013
TELPAS Comprehension
Score TELPAS Composite Rating
Yearly Progress in TELPAS Composite Rating
Grade Level/Student
Group
# Students
Rated
Average Comprehension
Scorea
# Students
Rated
% Students
Rated Advanced
Highb
Average Composite
Scorea
# Students
Rated
% Progressing at least 1
Proficiency Level (12 to 13)c
Grades K - 2
All Students 226 1.6 226 7 1.6 130 51
Title I, Part A 225 1.6 225 7 1.6 115 48
Migrant 13 1.6 13 0 1.4 10 40
At Risk 223 1.6 223 7 1.6 129 50
2011-2012
TELPAS Comprehension
Score TELPAS Composite Rating
Yearly Progress in TELPAS Composite Rating
Grade Level/Student
Group
# Students
Rated
Average Comprehension
Scorea
# Students
Rated
% Students
Rated Advanced
Highb
Average Composite
Scorea
# Students
Rated
% Progressing at least 1
Proficiency Level (11 to 12)c
Grades K - 2
All Students 214 1.8 214 7 1.8 66 66
Title I, Part A 214 1.8 214 7 1.8 66 66
Migrant 23 1.5 23 0 1.4 5 43
At Risk 211 1.8 211 8 1.8 66 67
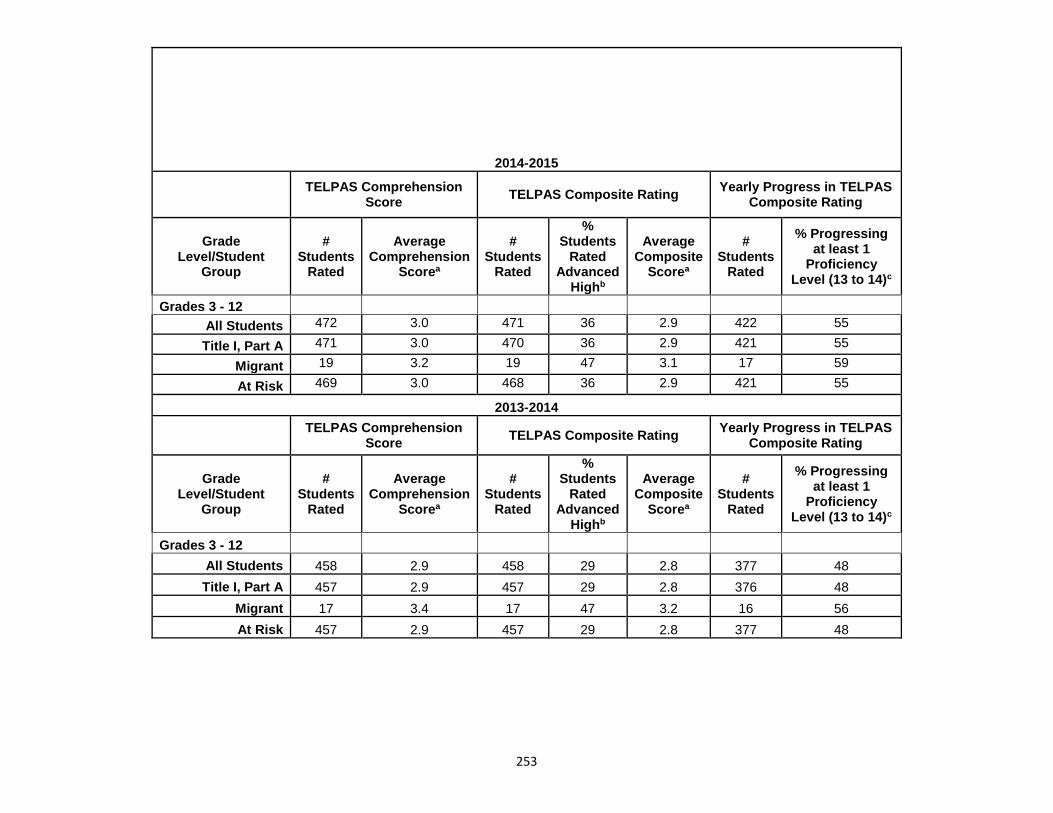
253
2014-2015
TELPAS Comprehension
Score TELPAS Composite Rating
Yearly Progress in TELPAS Composite Rating
Grade Level/Student
Group
# Students
Rated
Average Comprehension
Scorea
# Students
Rated
% Students
Rated Advanced
Highb
Average Composite
Scorea
# Students
Rated
% Progressing at least 1
Proficiency Level (13 to 14)c
Grades 3 - 12
All Students 472 3.0 471 36 2.9 422 55
Title I, Part A 471 3.0 470 36 2.9 421 55
Migrant 19 3.2 19 47 3.1 17 59
At Risk 469 3.0 468 36 2.9 421 55
2013-2014
TELPAS Comprehension
Score TELPAS Composite Rating
Yearly Progress in TELPAS Composite Rating
Grade Level/Student
Group
# Students
Rated
Average Comprehension
Scorea
# Students
Rated
% Students
Rated Advanced
Highb
Average Composite
Scorea
# Students
Rated
% Progressing at least 1
Proficiency Level (13 to 14)c
Grades 3 - 12
All Students 458 2.9 458 29 2.8 377 48
Title I, Part A 457 2.9 457 29 2.8 376 48
Migrant 17 3.4 17 47 3.2 16 56
At Risk 457 2.9 457 29 2.8 377 48
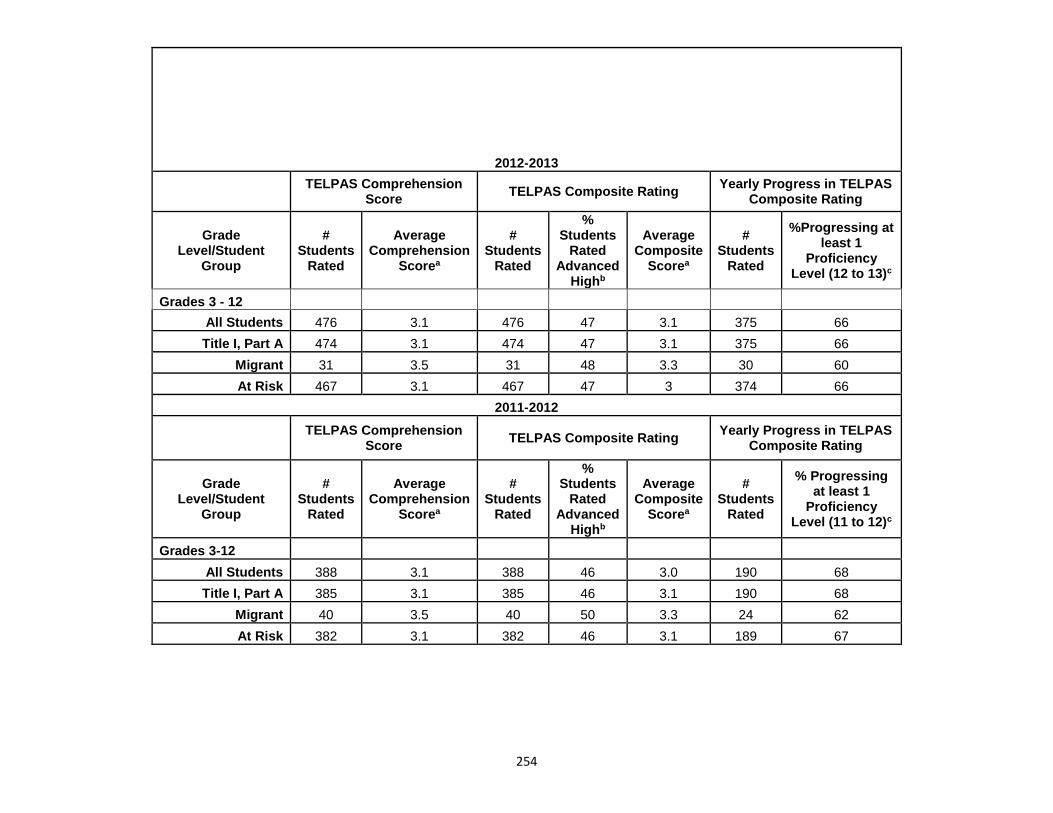
254
2012-2013
TELPAS Comprehension
Score TELPAS Composite Rating
Yearly Progress in TELPAS Composite Rating
Grade Level/Student
Group
# Students
Rated
Average Comprehension
Scorea
# Students
Rated
% Students
Rated Advanced
Highb
Average Composite
Scorea
# Students
Rated
%Progressing at least 1
Proficiency Level (12 to 13)c
Grades 3 - 12
All Students 476 3.1 476 47 3.1 375 66
Title I, Part A 474 3.1 474 47 3.1 375 66
Migrant 31 3.5 31 48 3.3 30 60
At Risk 467 3.1 467 47 3 374 66
2011-2012
TELPAS Comprehension
Score TELPAS Composite Rating
Yearly Progress in TELPAS Composite Rating
Grade Level/Student
Group
# Students
Rated
Average Comprehension
Scorea
# Students
Rated
% Students
Rated Advanced
Highb
Average Composite
Scorea
# Students
Rated
% Progressing at least 1
Proficiency Level (11 to 12)c
Grades 3-12
All Students 388 3.1 388 46 3.0 190 68
Title I, Part A 385 3.1 385 46 3.1 190 68
Migrant 40 3.5 40 50 3.3 24 62
At Risk 382 3.1 382 46 3.1 189 67
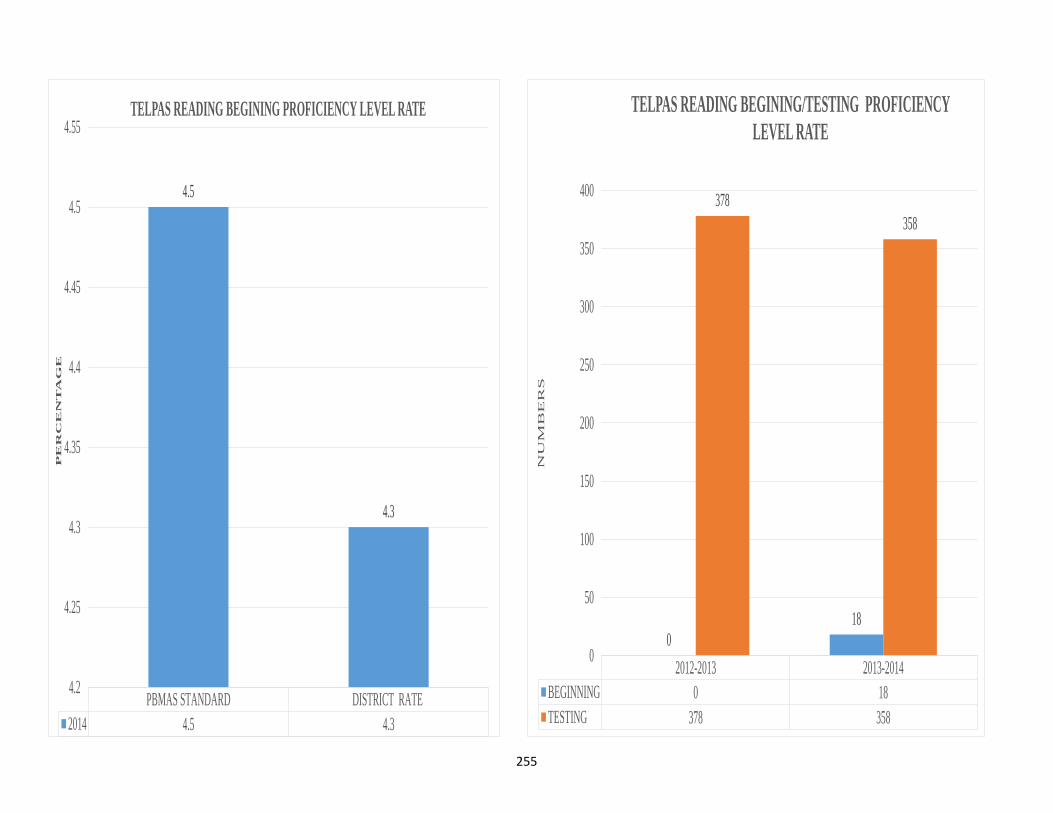
255
PBMAS STANDARD DISTRICT RATE
2014 4.5 4.3
4.5
4.3
4.2
4.25
4.3
4.35
4.4
4.45
4.5
4.55
PE
RC
EN
TA
GE
TELPAS READING BEGINING PROFICIENCY LEVEL RATE
2012-2013 2013-2014
BEGINNING 0 18
TESTING 378 358
018
378
358
0
50
100
150
200
250
300
350
400
NU
MB
ER
S
TELPAS READING BEGINING/TESTING PROFICIENCY
LEVEL RATE
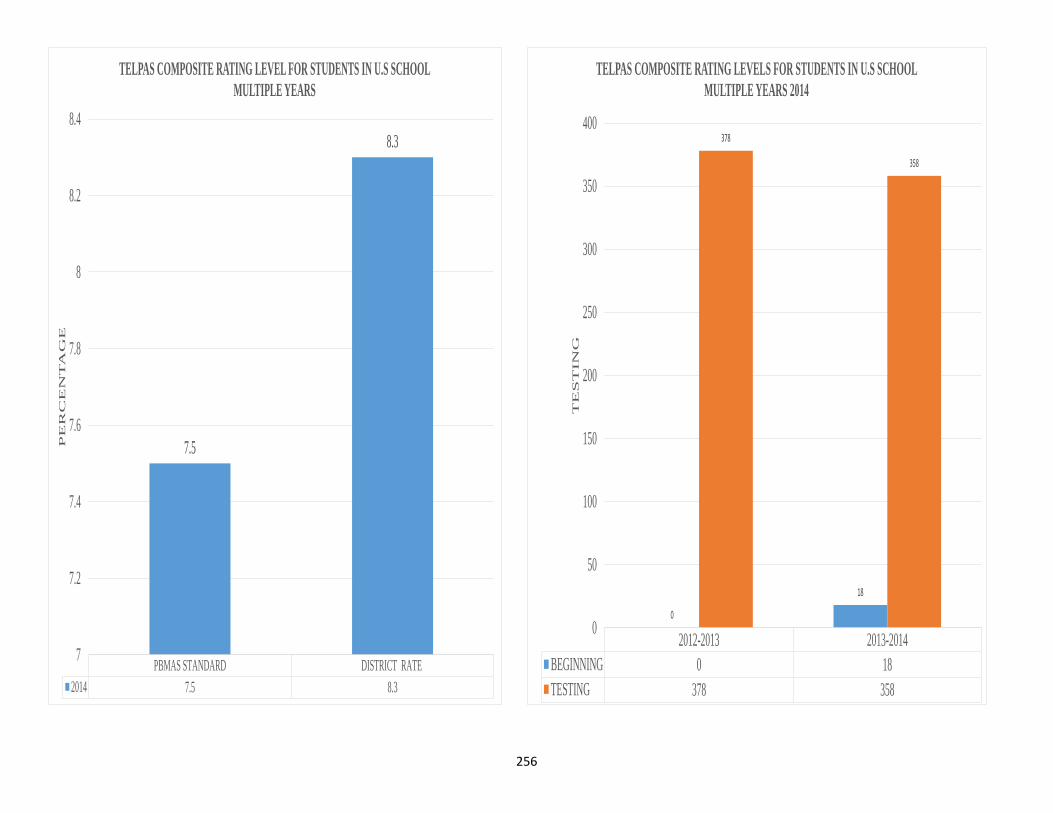
256
PBMAS STANDARD DISTRICT RATE
2014 7.5 8.3
7.5
8.3
7
7.2
7.4
7.6
7.8
8
8.2
8.4
PE
RC
EN
TA
GE
TELPAS COMPOSITE RATING LEVEL FOR STUDENTS IN U.S SCHOOL
MULTIPLE YEARS
2012-2013 2013-2014
BEGINNING 0 18
TESTING 378 358
0
18
378
358
0
50
100
150
200
250
300
350
400
TE
ST
IN
G
TELPAS COMPOSITE RATING LEVELS FOR STUDENTS IN U.S SCHOOL
MULTIPLE YEARS 2014
257
Focus Area: Parent and Community Engagement
The Parent and Community Engagement Focus Area will be measured by the following measurements at the Campus Level:
o Parent and Community Members Participation in School Functions
Open House
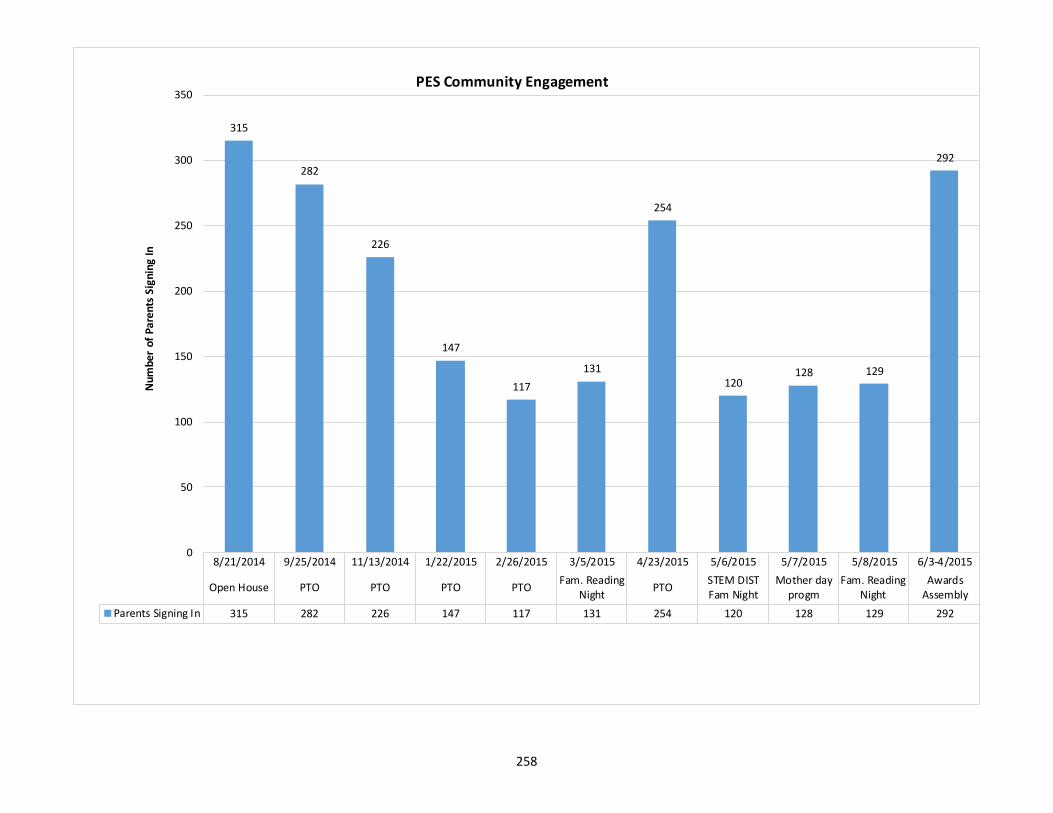
258
8/21/2014 9/25/2014 11/13/2014 1/22/2015 2/26/2015 3/5/2015 4/23/2015 5/6/2015 5/7/2015 5/8/2015 6/3-4/2015
Open House PTO PTO PTO PTOFam. Reading
NightPTO
STEM DISTFam Night
Mother dayprogm
Fam. ReadingNight
AwardsAssembly
Parents Signing In 315 282 226 147 117 131 254 120 128 129 292
315
282
226
147
117
131
254
120128 129
292
0
50
100
150
200
250
300
350
Num
ber
of P
aren
ts S
igni
ng In
PES Community Engagement
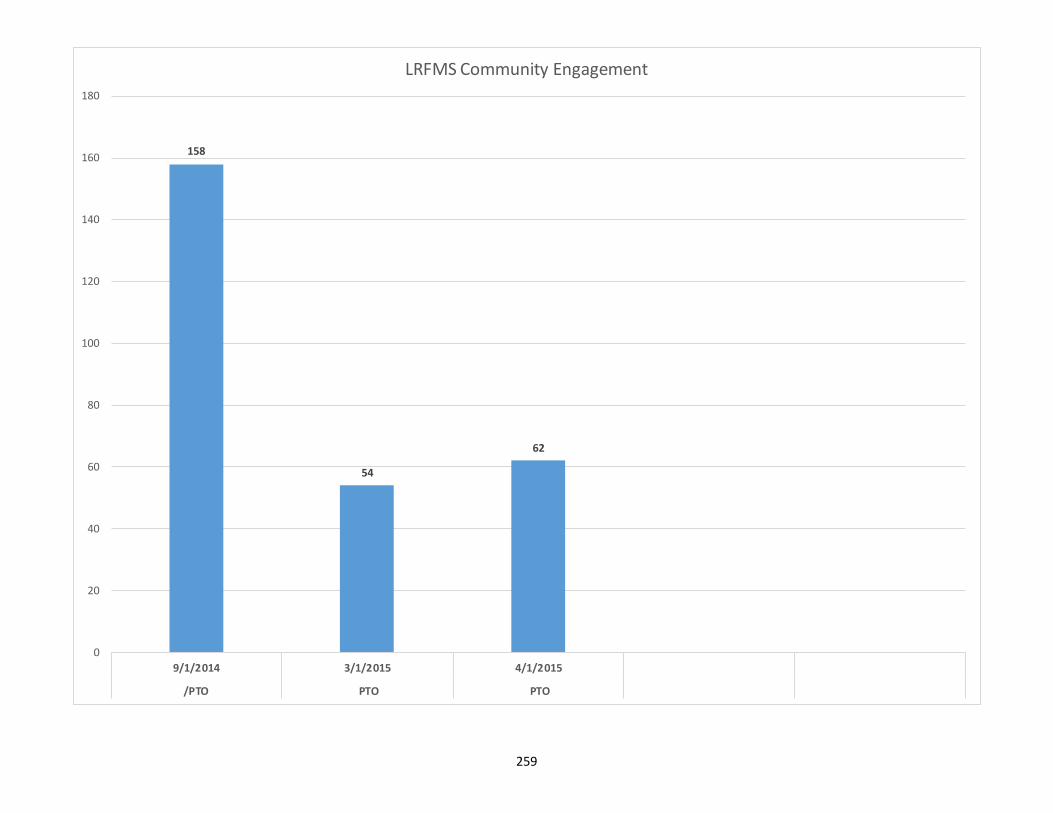
259
158
54
62
0
20
40
60
80
100
120
140
160
180
9/1/2014 3/1/2015 4/1/2015
/PTO PTO PTO
LRFMS Community Engagement
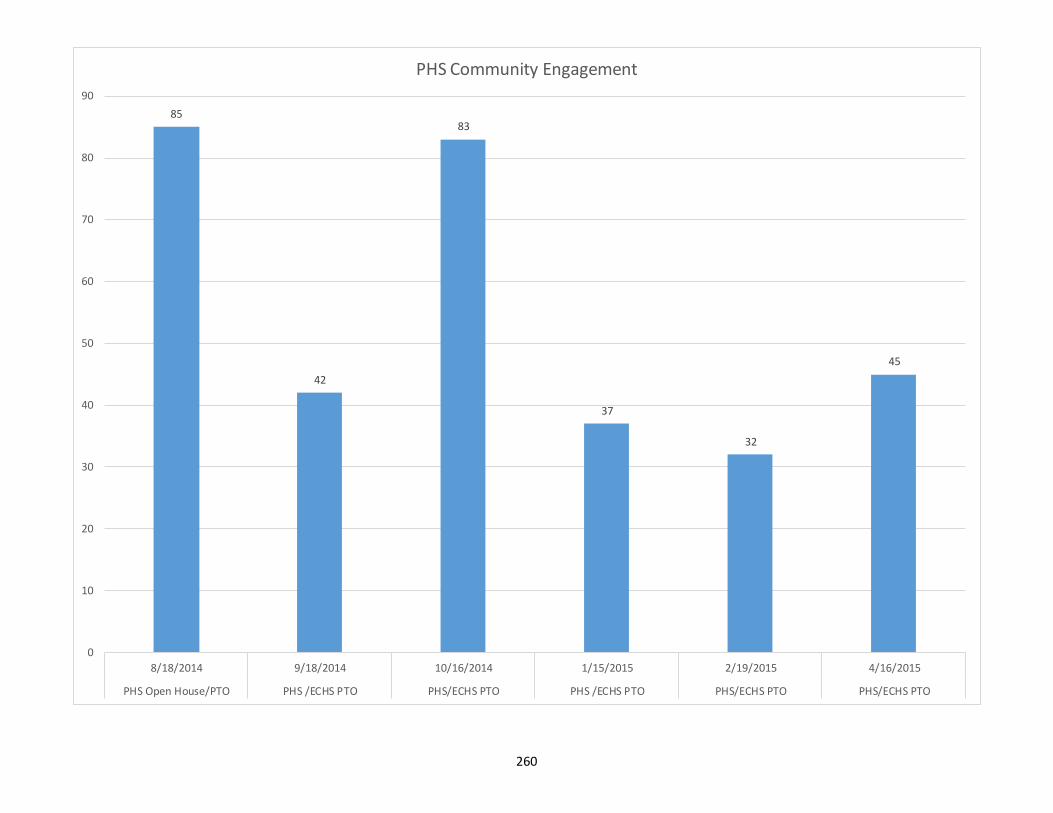
260
85
42
83
37
32
45
0
10
20
30
40
50
60
70
80
90
8/18/2014 9/18/2014 10/16/2014 1/15/2015 2/19/2015 4/16/2015
PHS Open House/PTO PHS /ECHS PTO PHS/ECHS PTO PHS /ECHS PTO PHS/ECHS PTO PHS/ECHS PTO
PHS Community Engagement