Preserving the Value of Firm Transmission Service … · Preserving the Value of Firm Transmission...
37
Preserving the Value of Firm Transmission Service on the Southern Intertie July 22, 2014 Kevin Wellenius Managing Director
Transcript of Preserving the Value of Firm Transmission Service … · Preserving the Value of Firm Transmission...

Preserving the Value of Firm Transmission Service on the Southern Intertie
July 22, 2014
Kevin WelleniusManaging Director

Overview
Transmission Between PNW and California is Highly Valuable But the allocation of that value between OATT transmission and CAISO transmission has shifted
significantly in the last five years
Allocation of value is highly dependent on how seams issues between the OATT and CAISO LMP frameworks are resolved at COB and NOB Outcomes do not reflect the core OATT principles of priority and certainty of Firm service
Options exist to restore the value of Firm transmission on Southern Intertie
2

The Value of Transmission Between PNW and California

COI and PDCI are Consistently Used to Move Power from Pacific Northwest to California
2003. . . . . . . . . . . .
2004. . . . . . . . . . . .
2005. . . . . . . . . . . .
2006. . . . . . . . . . . .
2007. . . . . . . . . . . .
2008. . . . . . . . . . . .
2009. . . . . . . . . . . .
2010. . . . . . . . . . . .
2011. . . . . . . . . . . .
2012J. . . . . . . . . . . .
2013. . . . . . . . . . . .
2014. . . .
-1,000
0
1,000
2,000
3,000
4,000
5,000
6,000
7,000
Ave
rage
Hou
rly F
low
s (A
C +
DC
), M
W
Source: BPA
4

Transmission is Used for Multiple Purposes
Multiple reasons for power to flow on COI and PDCI Non-commercial purposes (reliability, operational flexibility, environmental) Deliver under long-term offtake contracts (seasonal exchanges, renewable deals) Trade power between regions
Price spreads, after accounting for losses, are consistent with trading between Pacific Northwest and California in a large number of hours
5
Measuring Regional Price Spreads
When the “spread net of losses” is greater than zero in a specific direction, there is economic value in trade between regions
6
NP15 Price
Mid-C Price
CAISO losses
BPA losses (Network + Southern Intertie)
Spread Net of Losses
Pric
e, $
/MW
h
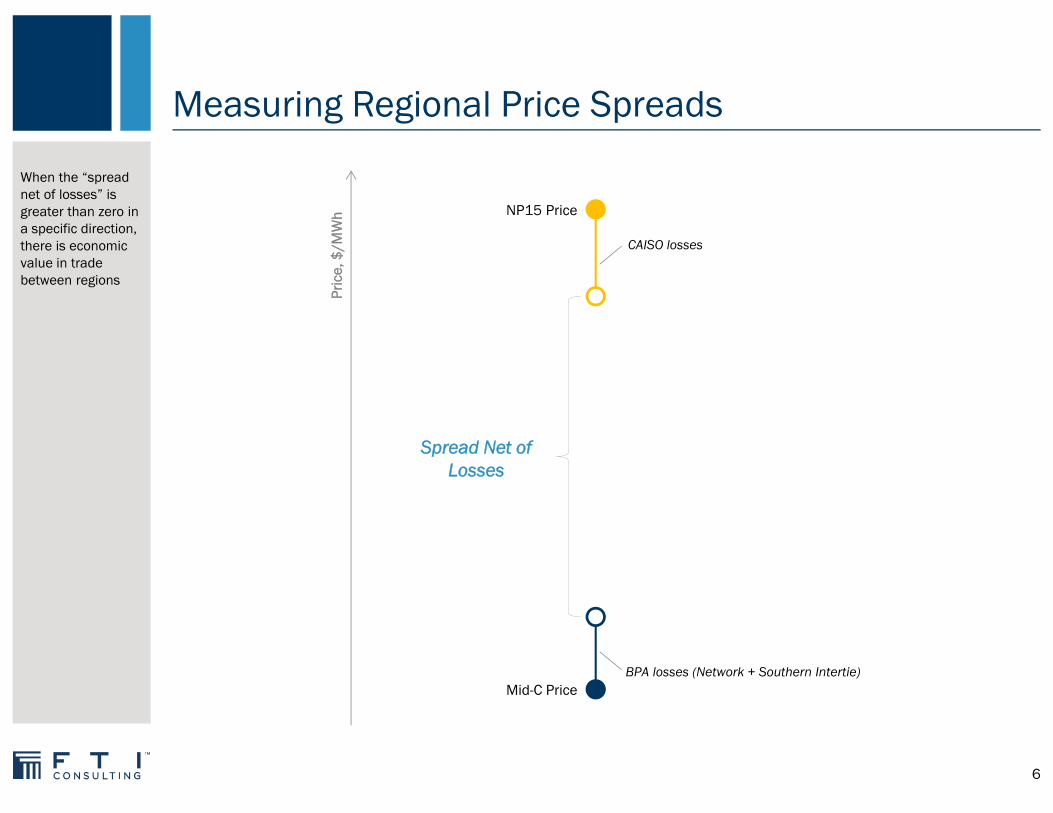
Economic Price Spreads are Observed in the Majority of Hours
7
2002 2003 2004 2005 2006 2007 2008 2009 2010 2011 2012 2013 2014Mid-C/SP 64% 58% 55% 45% 52% 45% 37% 34% 34% 68% 79% 80% 83%Mid-C/NP 76% 71% 67% 56% 59% 58% 53% 47% 51% 72% 84% 84% 87%
Hours with Positive Spread Net of Losses (% of total hours)

Allocation of Transmission Value on COI and PDCI
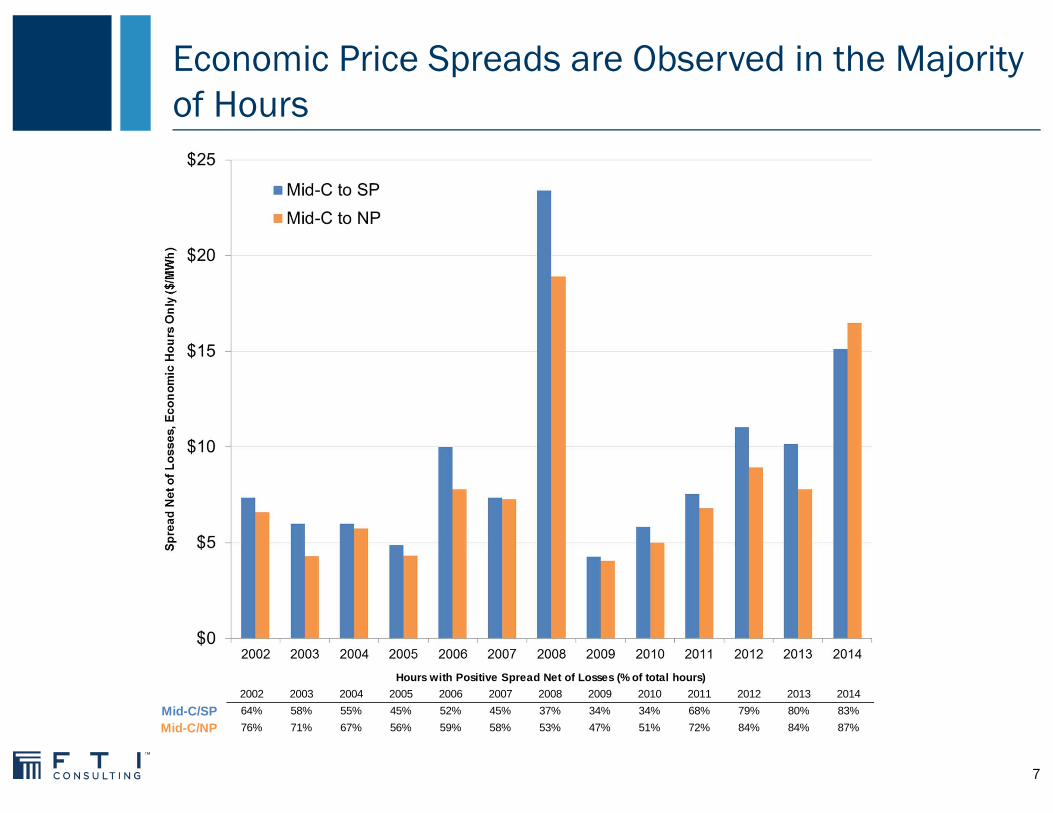
Scheduling on COI or PDCI Involves Multiple Segments and Transmission Providers
Both the COI and the Pacific DC Intertie are split into a northern segment and a southern segment Service on both segments is required for energy to flow Mid-points (COB and NOB) have no load or generation, cannot be source or sink on e-Tag
Each segment involves a different transmission provider, with different rules
BPA is the largest transmission provider for northern segments of COI (56.8% of total) and PDCI (100% of total) Service is provided under OATT framework
CAISO is the largest transmission provider for southern segments of COI (57% of total) and PDCI (50% of total) Service is provided under its LMP-based framework
9

Key Analytical Questions
How is the economic value of regional trading allocated between the northern and southern segments of the COI and PDCI?
Has this allocation changed over time?
What are the drivers of this allocation?
10
Limitation of Analysis
Reflects only the value of inter-regional trade
Reflects allocation of value based on CAISO day-ahead prices Data unavailable on terms of bilateral transactions using non-CAISO transmission providers Day Ahead prices generally form the basis for forward pricing, greater volume than real-time
11

Measuring Allocation of Regional Price Spreads
NP15 Price
Mid-C Price
CAISO losses
BPA losses (Network + Southern Intertie)
CAISO Congestion
CAISO Grid Mgmt. Charge
COB/Malin Price
Value to OATT transmission
Value to CAISO
Spread Net of Losses
12

$1.42
$0.56
Value to OATT transmission:$5.80 (75%)
Value to CAISO: $1.98 (25%)COB
Allocation of Mid-C/NP15 Price Spreads: 2006 vs. 2012
Despite very similar overall spreads between PNW and California, there was a major change in how that value was allocated.
NP15 Price: $53.42
Mid-C Price:
$40.85
$2.79
$2.00
$7.78
200659% of hours were economic
NP15 Price: $28.80
Mid-C Price:
$17.95
$1.06
$0.88
$8.91
201284% of hours were economic
$6.47
$0.37
Value to OATT transmission:$2.07 (23%)
Value to CAISO: $6.85 (77%)
COB
13
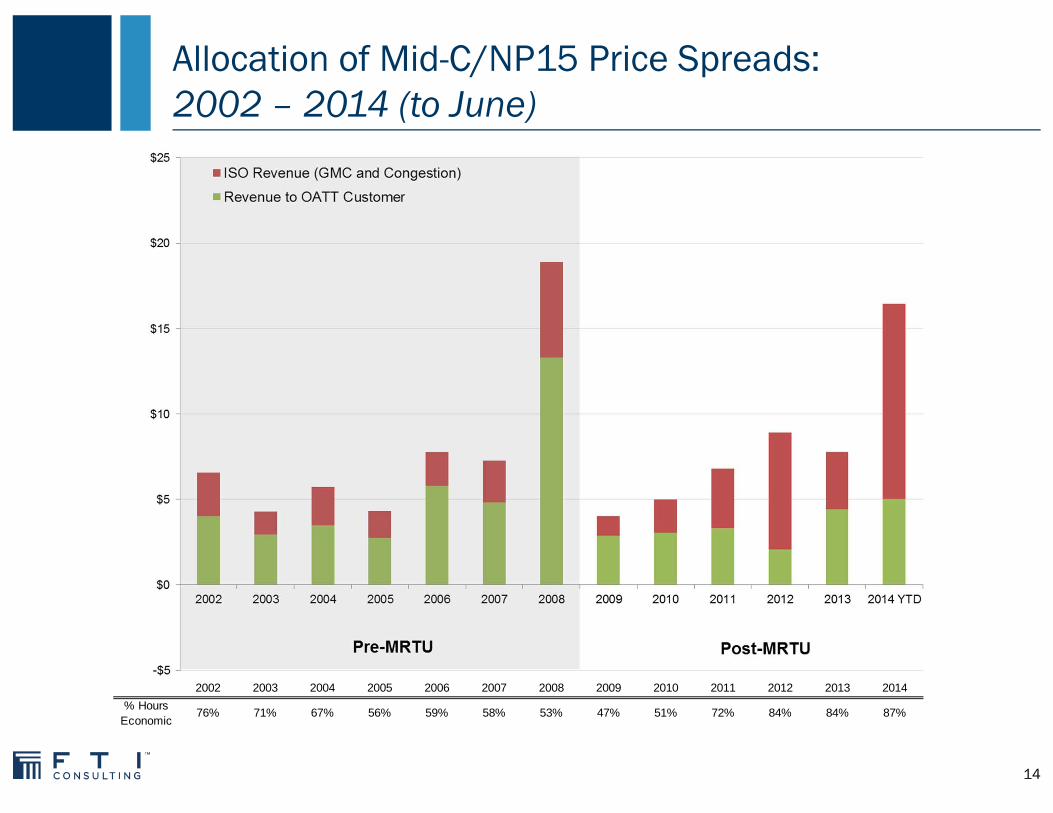
Allocation of Mid-C/NP15 Price Spreads: 2002 – 2014 (to June)
2002 2003 2004 2005 2006 2007 2008 2009 2010 2011 2012 2013 2014% Hours
Economic76% 71% 67% 56% 59% 58% 53% 47% 51% 72% 84% 84% 87%
14
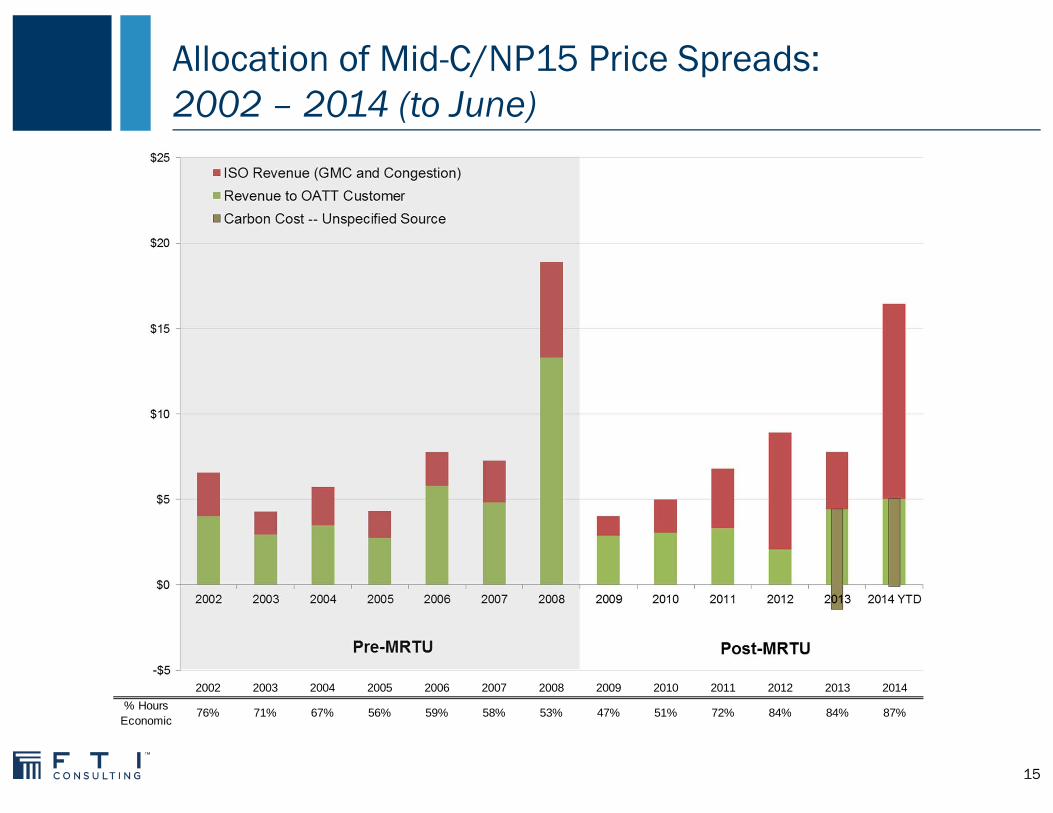
Allocation of Mid-C/NP15 Price Spreads: 2002 – 2014 (to June)
2002 2003 2004 2005 2006 2007 2008 2009 2010 2011 2012 2013 2014% Hours
Economic76% 71% 67% 56% 59% 58% 53% 47% 51% 72% 84% 84% 87%
15
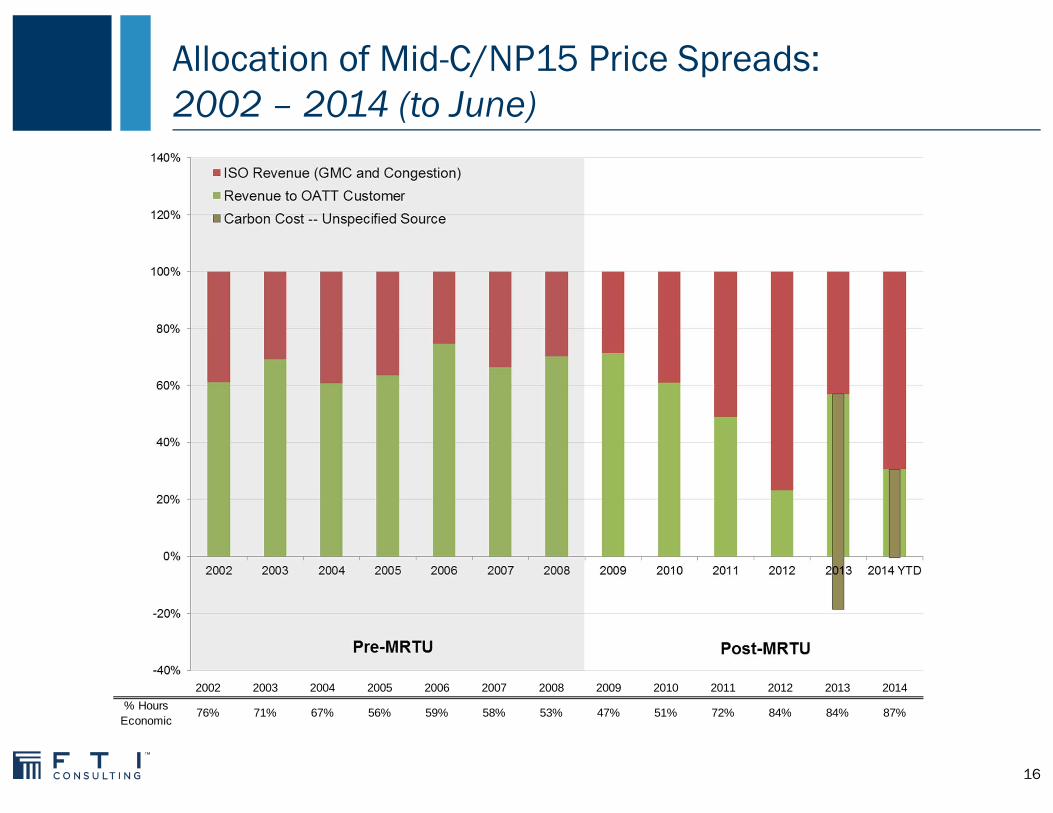
Allocation of Mid-C/NP15 Price Spreads: 2002 – 2014 (to June)
2002 2003 2004 2005 2006 2007 2008 2009 2010 2011 2012 2013 2014% Hours
Economic76% 71% 67% 56% 59% 58% 53% 47% 51% 72% 84% 84% 87%
16
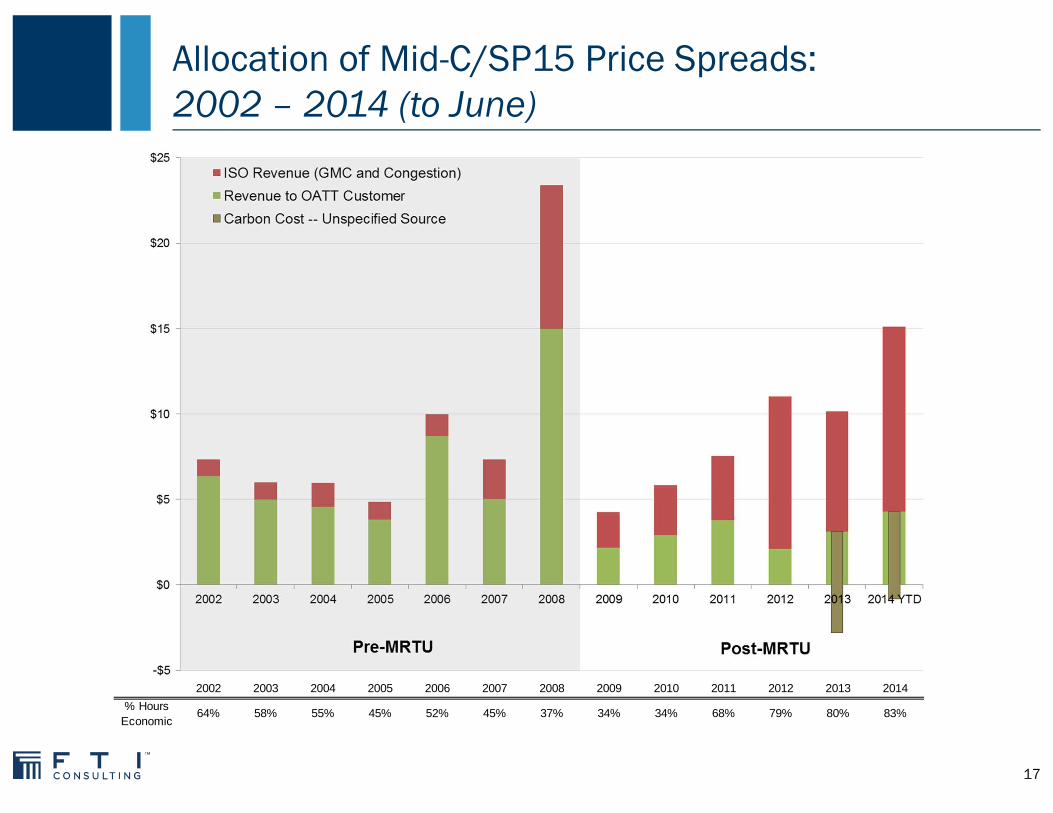
Allocation of Mid-C/SP15 Price Spreads: 2002 – 2014 (to June)
2002 2003 2004 2005 2006 2007 2008 2009 2010 2011 2012 2013 2014% Hours
Economic64% 58% 55% 45% 52% 45% 37% 34% 34% 68% 79% 80% 83%
17

Allocation of Mid-C/SP15 Price Spreads: 2002 – 2014 (to June)
2002 2003 2004 2005 2006 2007 2008 2009 2010 2011 2012 2013 2014% Hours
Economic64% 58% 55% 45% 52% 45% 37% 34% 34% 68% 79% 80% 83%
18
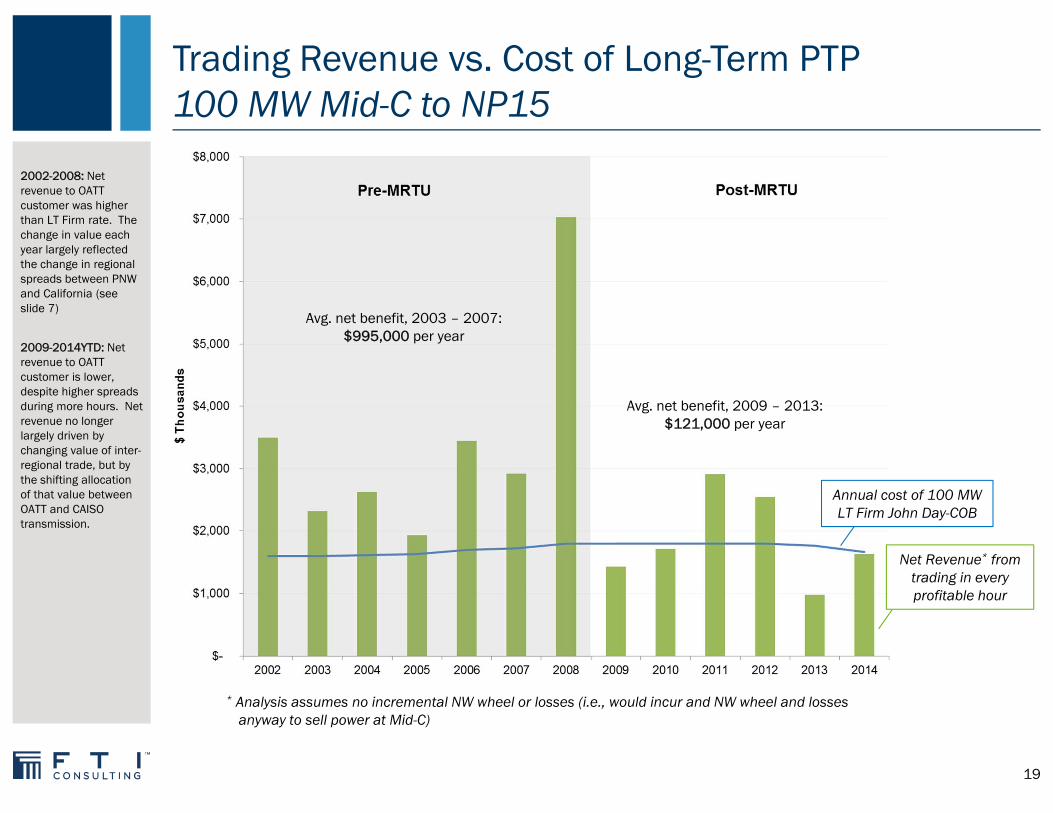
Trading Revenue vs. Cost of Long-Term PTP100 MW Mid-C to NP15
2002-2008: Net revenue to OATT customer was higher than LT Firm rate. The change in value each year largely reflected the change in regional spreads between PNW and California (see slide 7)
2009-2014YTD: Net revenue to OATT customer is lower, despite higher spreads during more hours. Net revenue no longer largely driven by changing value of inter-regional trade, but by the shifting allocation of that value between OATT and CAISO transmission.
Avg. net benefit, 2003 – 2007: $995,000 per year
Avg. net benefit, 2009 – 2013: $121,000 per year
Annual cost of 100 MW LT Firm John Day-COB
Net Revenue* from trading in every profitable hour
19
* Analysis assumes no incremental NW wheel or losses (i.e., would incur and NW wheel and losses anyway to sell power at Mid-C)

Trading Revenue vs. Cost of Long-Term PTP100 MW Mid-C to SP15
2002-2008: Net revenue to OATT customer was higher than LT Firm rate. The change in value each year largely reflected the change in regional spreads between PNW and California (see slide 7)
2009-2014YTD: Net revenue to OATT customer is lower, despite higher spreads during more hours. Net revenue no longer largely driven by changing value of inter-regional trade, but by the shifting allocation of that value between OATT and CAISO transmission.
Avg. net loss, 2009 – 2013: $236,000 per year
Avg. net benefit, 2003 – 2007: $1,182,000 per year
Annual cost of 100 MW LT Firm Big Eddy-NOB
20
* Analysis assumes no incremental NW wheel or losses (i.e., would incur and NW wheel and losses anyway to sell power at Mid-C)
Net Revenue* from trading in every profitable hour
Key Conclusions of Analysis
There is positive economic value to delivering energy from the PNW to California in the majority of hours Demonstrated by physical flows on COI and PDCI, which are almost exclusively North-to-South Transmission facilities between Mid-C and California loads continue to increase in value
There has been a large shift in allocation of value away from OATT transmission customer and to CAISO congestion charges Occurred after 2009 market re-design: CAISO as single buyer, rules to maximize liquidity Shift in value to CAISO exacerbated during periods of transmission de-rates Effect of carbon compliance costs since 2013
Main driver: CAISO prices at COB and NOB look increasingly like Mid-C prices Results in less value in moving energy from PNW to the CAISO border… … and more value in moving energy from CAISO border into CAISO load centers This shift does not reflect change in physical conditions, but resolution of seams issues
21

What Drives CAISO Clearing Prices at the Interties Closer to Mid-C Levels?

Prices at COB and NOB Reflect Seams Between Two Transmission Frameworks: OATT and LMP
OATT
Firm rights-holder has priority to flow ahead of Non-Firm rights-holders Use of Firm should not be affected by what a
Non-Firm customer does
Firm rights-holder can flow independently of other Firm rights-holders Aggregate scheduling rights on Firm
transmission should not exceed actual physical transmission capacity
CAISO Market
Anyone can flow; bids selected on price
Parties that flow pay full economic value of transmission as congestion
Congestion charges returned to long-term investor (CRRs, or directly to LSEs)
Long-term investors are indifferent about who gets to flow, because they always receive financial value
If a customer cannot rely on the priority and certainty of Firm rights, the value of those rights is directly undermined
23
Example 1: Firm Rights Retain Both Priority and Certainty
Scenario: 1,000 MW tie with bids only from Firm rights holders:
The bids are not mutually exclusive; all bids can be accepted Must still be economic relative to internal generation or suppliers on other interties Must still compete with other resources to flow over internal constraints
No need for CAISO to choose among bids based on price
Result: no congestion at the intertie.* The clearing price at the intertie will be the price “inside” California (ignoring losses)
* Some congestion may still arise due to sellers wishing to flow on CAISO’s share of the southern segments as opposed to on theshares of other transmission providers (e.g., SMUD, LADWP). Such outcomes appropriately reflect economic conditions that exist only on the southern segment of the COI or PDCI.
24

Example 2: De-Rate Undermines Certainty of Firm Rights
Scenario: As before, but tie is de-rated to 800 MW
Even though capacity is only 800 MW, there are still 1,000 MW of Firm rights
The bids from Firm rights-holders are mutually exclusive Not all of them can be accepted But BPA has not proactively determined who flows and who does not
CAISO chooses which bids to accept, based on lowest price
Result: congestion at CAISO intertie, price driven lower Notably, the energy price “inside” California is not lower The lower price at the interties simply increases congestion payments to CAISO CRR
holders and/or LSEs
25

Example 3:Priority of Firm Rights is Bypassed
Scenario: 1,000 MW tie, but any entity may submit bids to CAISO, regardless of whether they have a Firm reservation
Bids exceed the 1,000 MW that can actually be accepted
The bids are mutually exclusive Not all of them can be accepted But BPA has not proactively determined who flows and who does not
CAISO chooses which of the bids to accept, based on lowest price
Result: congestion at CAISO intertie, price driven lower Energy price “inside” California is not lower, still 1,000 MW of imports on the tie Lower price at the intertie increases congestion payments to CAISO CRR holders
and/or LSEs
26
Loss of Priority and Certainty of Firm rights drives CAISO intertie prices closer to Mid-C levels
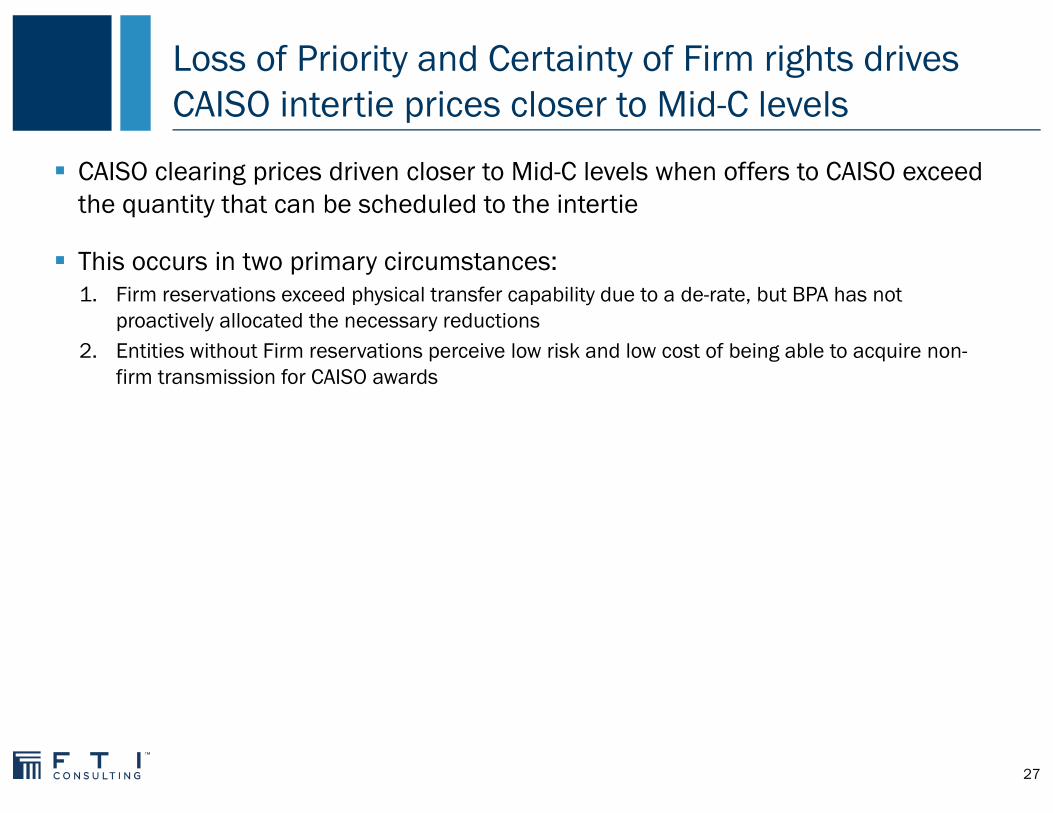
CAISO clearing prices driven closer to Mid-C levels when offers to CAISO exceed the quantity that can be scheduled to the intertie
This occurs in two primary circumstances:1. Firm reservations exceed physical transfer capability due to a de-rate, but BPA has not
proactively allocated the necessary reductions2. Entities without Firm reservations perceive low risk and low cost of being able to acquire non-
firm transmission for CAISO awards
27
Options for Restoring Certainty and Priority of Firm Service on Southern Intertie
Two Distinct Issues Undermine Certainty and Priority of Firm Service
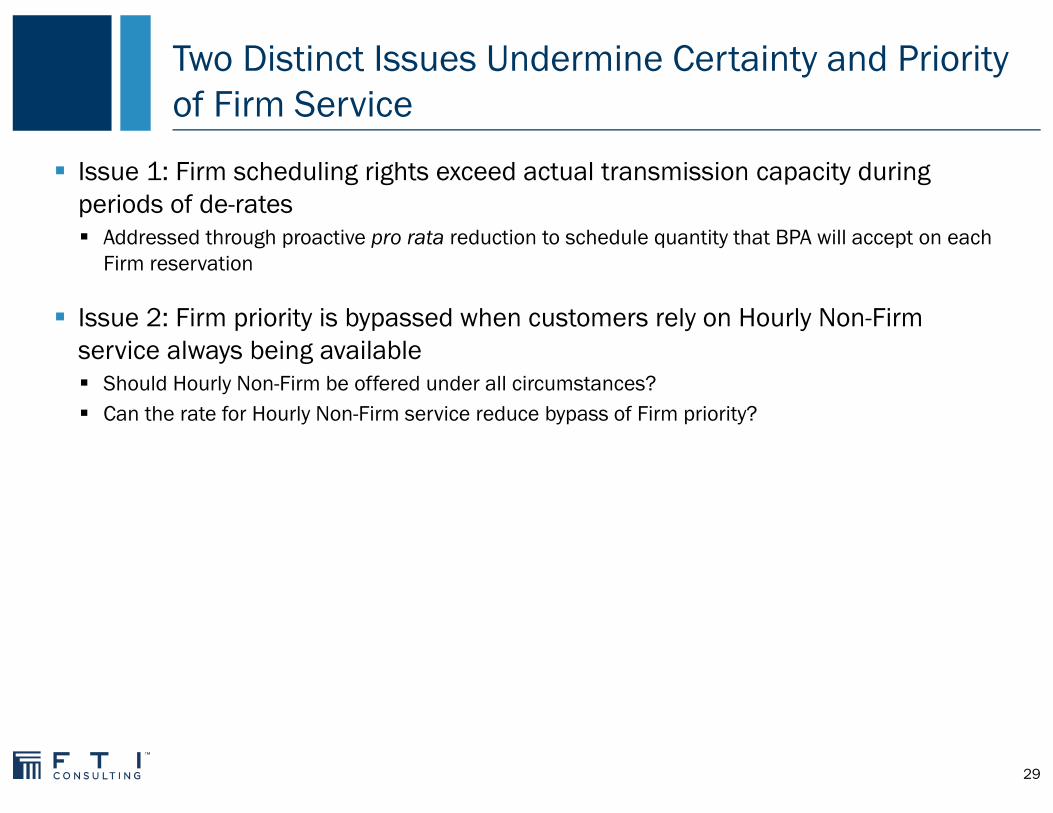
Issue 1: Firm scheduling rights exceed actual transmission capacity during periods of de-rates Addressed through proactive pro rata reduction to schedule quantity that BPA will accept on each
Firm reservation
Issue 2: Firm priority is bypassed when customers rely on Hourly Non-Firm service always being available Should Hourly Non-Firm be offered under all circumstances? Can the rate for Hourly Non-Firm service reduce bypass of Firm priority?
29
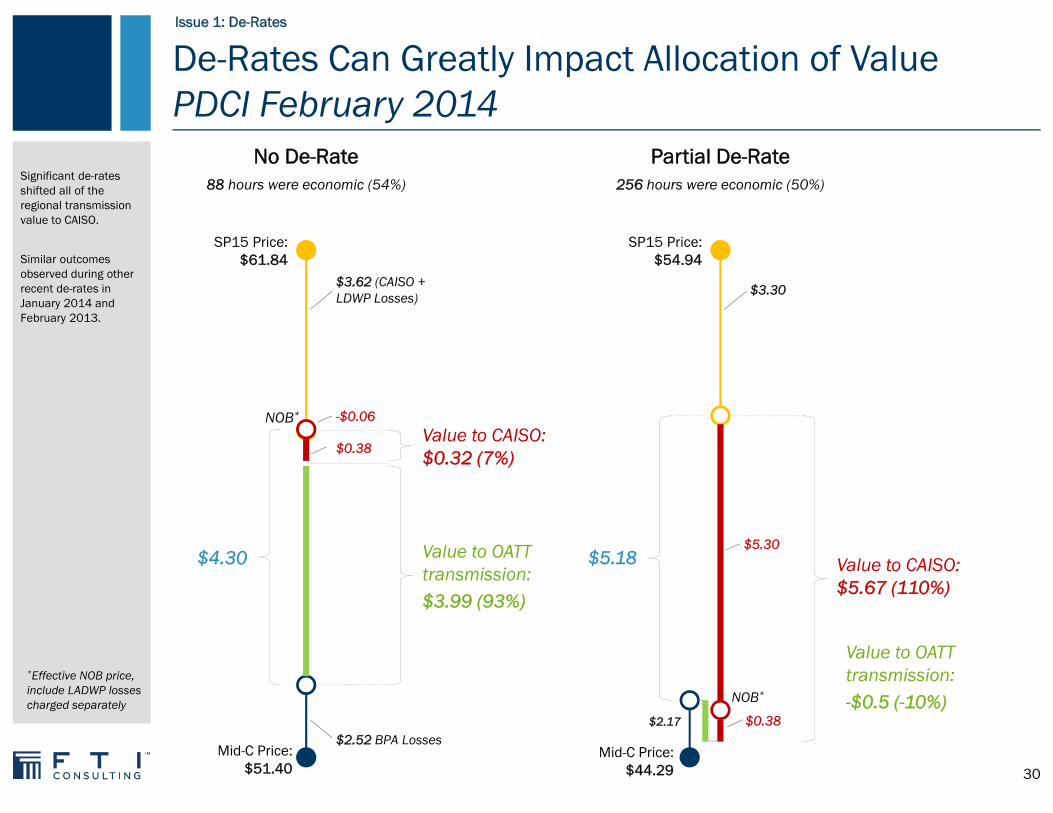
De-Rates Can Greatly Impact Allocation of Value PDCI February 2014
Significant de-rates shifted all of the regional transmission value to CAISO.
Similar outcomes observed during other recent de-rates in January 2014 and February 2013.
No De-Rate88 hours were economic (54%)
SP15 Price: $61.84
Mid-C Price:$51.40
$3.62 (CAISO + LDWP Losses)
$2.52 BPA Losses
$4.30
-$0.06
Value to OATT transmission:$3.99 (93%)
Value to CAISO: $0.32 (7%)
NOB*
$0.38
Partial De-Rate256 hours were economic (50%)
SP15 Price: $54.94
Mid-C Price:$44.29
$3.30
$2.17
$5.18$5.30
Value to CAISO: $5.67 (110%)
NOB*
$0.38
Value to OATT transmission:-$0.5 (-10%)
*Effective NOB price, include LADWP losses charged separately
Issue 1: De-Rates
30
High Possibility of De-Rates in Coming Years
De-rates result in a shift in value, as not all Firm rights can actually flow When CAISO receives more bids than can be accepted, usage is determined by bid price Leads to increased CAISO congestion as Firm rights-holder attempt to displace one another
Effect is seen during recent planned de-rates on PDCI 2013 and 2014 February de-rates on PDCI show increase in CAISO congestion charges, reduction
in value to OATT customer No change in overall spread; total value of limited transmission did not increase
Need to address this issue is urgent and growing: PDCI: 35% de-rate Oct. 2014 – Dec. 2015 COI: potential ongoing significant de-rates with loss of CDWR remedial action
If not resolved: Customers will be charged for rights they cannot use, and The rights they are able to use should be expected to have little/no value
Issue 1: De-Rates
31
Options for Managing De-Rates
Solution needs to ensure that the ability to schedule on Firm rights that have been awarded reflects the transfer capability on its system
BPA’s prior approach achieved this outcome: transmission de-rates resulted in proactive pro rata reductions to each customers’ Firm
scheduling rights i.e., BPA determined how the reduced transmission capacity would be allocated
Approach could be re-introduced through a business practice limiting schedules that will be accepted on each reservation to reflect any transmission de-rates Align scheduling rights with physical transfer capability during delivery interval Reduce mismatch with scheduling rights granted on southern segment Restore core principle that Firm transmission is only “sold once” Need to determine what rights/value, if any, there is to Firm rights that cannot be scheduled
Issue 1: De-Rates
32

Availability of Hourly Non-Firm Service Should not Displace Priority of Firm Service
Hourly Non-Firm service permits the use of transmission capacity that Firm rights-holders do not use If Firm priority is to mean anything, then a Firm customer’s failure to use its reservation should
not be the result of being displaced by someone with lower-priority service on the same path
Challenge is to distinguish between two reasons why a Firm customer would not schedule on its reservation: 1: Not competitive relative to internal generation or imports on other paths
– HNF provides an appropriate opportunity for other transmission customers to use transmission– Increases transmission utilization, lowers price paid by CAISO load
2: Displaced by a customer with lower-priority service on the same path– HNF does not achieve utilization of “unused” transmission, but merely shifts the use from the Firm customer
to the HNF customer– No change in total imports to California, only a change in who flows, and the price at the border
Lack of information necessary to distinguish (1) from (2)
Issue 2: Hourly Non-Firm
33

Is Hourly Non-Firm Service Necessary to Ensure Transmission Utilization?
Strong incentives for full utilization of Firm reservations in today’s environment Firm rights are fully subscribed; path can be fully scheduled even with no additional service
offered by BPA itself Strong incentives, and many options, for Firm rights-holders to fully utilize their rights
– Deliver surplus energy from their own systems– Procure energy for re-sale from developed wholesale markets
Firm rights-holder can also re-assign, sell or transfer their rights– BPA raised price cap on re-sales from tariff rate up to cost of expansion
Are there circumstances when BPA should not release Hourly Non-Firm to prevent displacement of Firm priority? Offer Hourly Non-Firm only when CAISO segment is not congested? Release via lottery once only to prevent “taking Hourly Non-Firm for granted”? Other possibilities? Worth further study, but have not yet identified an approach that is easy to implement and largely
ensures the right outcome
Issue 2: Hourly Non-Firm
34

Setting the Hourly Non-Firm Rate to Encourage Investment in Firm Transmission
Offering Hourly Non-Firm service at a higher fixed rate can reduce displacement of Firm rights-holders Supports expansion of transmission system by driving customers to request Long Term service Current rate is low compared to southern segment OATT providers or CAISO congestion charges Current rate is far below cost of expansion ($27.5/MWh*)
Determining an accurate variable rate approach is challenging Can be efficient solution, but requires significant structural changes (e.g., CAISO markets) Value of transmission changes from hour to hour, and between day-ahead and real-time
– But no reliable data on hour to hour or real-time value – Could use day-ahead prices as basis, but this will lead to both false positives (rate is below actual value) and
false negatives (rate is above actual value)
Risk of getting rate design wrong is not symmetric:– If the rate formula is “too high,” secondary transmission market offers economic alternative– But if the rate formula is “too low,” Firm priority will continue to be undermined with no ability to change the
rate until next rate period
Issue 2: Hourly Non-Firm
35
* Transmission Service Business Practice: Resale of Transmission Service, v. 10, Section C.3. Calculation presented May 26, 2011 BPA OATT Workshop.

Potential Solution: Offer Hourly Non-Firm Service at Cost of Expansion, with Discounting if Necessary
Hourly Non-Firm rate set at cost of expansion Permits Hourly Non-Firm to always be available Minimizes displacement of Firm customers
Discounting can provide “safety valve” in unlikely event that utilization concerns actually arise Discounting in the wrong hours, or to the wrong price, will re-create the current bypass problem Need clear metrics to identify conditions triggering discounting Discounted rate should attempt to reflect market value (e.g., value of day-ahead spread) Retain flexibility to modify discounting approach, or to suspend all discounting if necessary
Issue 2: Hourly Non-Firm
36

About
Kevin Wellenius
200 State Street, 9th Floor, Boston, MA 02109office: (207) [email protected]
Mr. Wellenius provides expert witness testimony and litigation support in various power-sector proceedings before FERC, state regulatory entities, and arbitration panels in the United States and abroad. He advises on a range of policy and market design initiatives regarding competitive wholesale electricity markets, with a particular focus on Western U.S. markets, including CAISO. Mr. Wellenius has also provided market assessments supporting a variety of generation projects, transactions, and financings in the United States and throughout Latin America.
Mr. Wellenius received his S.M. in Technology Policy from the Massachusetts Institute of Technology and his B. Eng. from Imperial College, London.
37
Managing Director,Economics