PRESENTER: DR. SIDDHARTH GAUTAM
82
PRESENTER: DR. SIDDHARTH GAUTAM
Transcript of PRESENTER: DR. SIDDHARTH GAUTAM

PRESENTER: DR. SIDDHARTH GAUTAM

CONTENTS
• Anatomy of Macula Lutea
• Embryology
• Blood supply
• Macular function tests

MACULA LUTEA
• MACULA LUTEA is a 5.5 mm circular area deeper red
than rest of the fundus at the posterior pole of retina,
lying inside the temporal vascular arcades, 2 disc
diameters temporal to the optic disc.
• Synonyms: 1.Area centralis
2.Yellow spot
3.Central retina
4.Posterior Pole
• Subserves central 15-20 degrees of visual field.
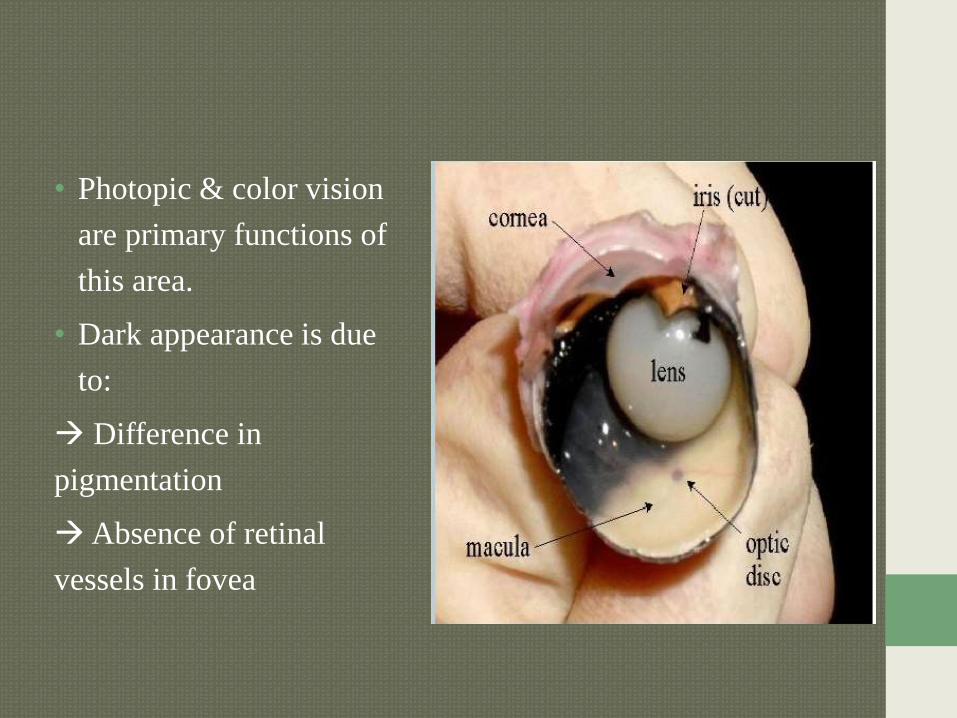
• Photopic & color vision
are primary functions of
this area.
• Dark appearance is due
to:
Difference in
pigmentation
Absence of retinal
vessels in fovea

EMBRYOLOGY
• Macula develops from the optic cup
Inner wall: Neurosensory retina
Outer wall: RPE
• Development of retina starts by 6 weeks, all adult layers
become recognizable by 5.5 months.
• Macular development is delayed till 8 months and
specialization continues till several months after birth.

• Macula lutea can be divisible into:
Foveola
Fovea
Perifoveal region
Parafoveal region


FOVEA CENTRALIS
• Specially differentiated central 1.5 mm of macula in
width & 0.25 mm in thickness.
• Most sensitive part of macula.
• Corresponds to 5 degree of visual field.
• NOTE: Outer plexiform layer in macula is oblique
,hence, CME appears stellate in macula & honeycomb
appears outside macula.

SPECIAL ANATOMIC
CONFIGURATION• Densest concentration of cones
• A one to one photoreceptor-
ganglion cell relationship
• Cones more elongated and
slender
• Absence of rods at the foveola
• RPE cells are taller,thinner &
deeply pigmented
• Presence of xanthophyll
pigment

• Xanthophyll carotenoid pigments:
Located in fovea, most probably in the outer plexiform
layer.
Leutin & Zeaxanthin are responsible for the characteristic
dark appearance of macula in normal angiograms.
• This special anatomy enable the fovea for:
Highest discriminative ability (VA)
Colour perception

FOVEOLA
• 0.35 mm wide depression or pit in the central floor of
fovea.
• SITUATION: 2 DD (3mm) away from the temporal edge
of optic disc & 1mm below the horizontal meridian.
• Thinnest part of retina.
• Devoid of ganglion cells.
• Has only cones & muller cells.
• Vision is most acute at this area.

UMBO
• Tiny depression in the centre of foveola.
• Corresponds to the ophthalmoscopically visible foveal
reflex.
FOVEAL REFLEX: intensely bright spot of light visible
ophthalmoscopically visible due to reflexion of light from
the wall of foveal depression.
Loss of FR may be an early sign of damage.

FOVEAL AVASCULAR ZONE
• Located inside the fovea but
outside the foveola.
• Extending about 0.4-0.6
mm in diameter, can be
known by FFA.
• It varies with age & disease
states.

• PARAFOVEAL AREA:
Portion of macula 0.5 mm in width surrounding the
macula.
Outermost limit,where the ganglion cell layer,inner
nuclear layer, and Henle layer are thickest (i.e. the retina
is thickest)
• PERIFOVEAL AREA:
• 1.5 mm wide ring zone surrounding the parafoveal area.

BLOOD SUPPLY
• Supplied by small twigs of superior and inferior temporal
branches of central retinal artery.
• Cilioretinal artery (branch from ciliary system)
occasionally is seen originating in a hook shape within
temporal margin of disc.
APPLIED: When present there is retention of central
vision in CRAO.
Outer 4 layers Choriocapillaries
Inner 6 layers Central Retinal Artery

MACULAR FUNCTION TESTS
• Used for :
Diagnosis & follow up of macular diseases.
For evaluating the potential macular function in eyes with
opaque media such as cataract and dense vitreous
haemorrhage.

CLINICAL ASSESSMENT
OF THE MACULA
• Symptoms:
1. Central vision impairment
2. Metamorphopsia
3. Micropsia
4. Macropsia

CLASSIFICATION
Macular function tests
With clear media
With opaque media

MFT WITH CLEAR MEDIA
1. Visual Acuity
2. Contrast Sensitivity
3. Slit lamp biomicroscopy
4. Photostress test
5. Colour Vision
6. Amsler grid
7. Two point discrimination
8. Microperimetry
9. FFA
10. OCT

MFT WITH OPAQUE MEDIA
1. Maddox rod test
2. Focal ERG
3. VEP
4. Laser interferometry
5. Potential visual acuity meter test
6. Entopic phenomena

VISUAL ACUITY
• Visual acuity is measured by the visual resolution of a
letter,symbol or a pattern under conditions of maximal
contrast.
• In patients with macular disease VA is frequently worse
when the patient looks through a pin-hole.

• There are numerous available options for determining the
visual acuity in a person.
• Most commonly used test is the measurement of the
central vision by the Snellens Test.
• It is based on the principal that two distant points can be
visible only when they subtend an angle of 1 minute at
the nodal point of the eye.


PERCEPTION OF
LIGHT(PL)• Although many sophisticated tests are available for
testing vision, perception of light (PL) must be present if
any potential useful vision is present.
• It is tested by shining light directly into the patients eyes.
Then the patient is asked whether he perceives any light
or not.
• Accordingly the vision is noted as PL + or PL - .

PROJECTION OF RAYS (PR)
• It is a crude but a very important and easy test to perform
for the functioning of the peripheral retina.
• It is tested in a semi-dark room with the opposite eye
covered.
• A thin beam of light is thrown on the patients eye from
four directions ( up, down, medial and lateral ) and the
patient is asked to point to the direction of the light.

• Results are symbolised as:
+
• PR + + If the patient correctly points to
+ light source in all directions.
+
• PR + + If the patient does not point to
- the light source in any one direction.

CONTRAST SENSITIVITY
• Contrast sensitivity is a measure of the minimum amount
of contrast needed to distinguish a test object.
• Indirectly assesses the quality of vision.
• Can detect early/subtle visual loss when VA is normal.


USES OF CONTRAST
SENSITIVITY• To detect retinal conditions like DR, ARMD and other
retinal, macular and optic nerve diseases.
• Optical conditions like refractive error, refractive surgery,
cataract and intraocular lens implantation and normal
aging of the eye.

CONTRAST SENSITIVITY
GRATINGSpatial frequency is the
number of dark light
cycles per visual angle.
In macular diseases, there
is a marked impairment
for the intermediate and
higher spatial
frequencies.

`

SLIT LAMP BIOMICROSCOPY
• With a strong convex lens
affords excellent
visualization of the
macula.

PHOTO-STRESS TEST
• This test can also be performed during routine eye
examination to differentiate between macular or optic
nerve pathology.
• Principle
Photostress testing is a gross test of dark adaptation in
which the visual pigments are bleached by light. This
causes a temporary state of retinal insensitivity perceived
as scotoma by the patient. The recovery of vision is
dependent on the ability of photoreceptors to re-
synthesize visual pigments.

TECHNIQUE
• BCVA is determined.
• An indirect ophthalmoscope is held about 3 cm away for
10 sec.
• The photostress recovery time (PSRT) is the time taken to
read any 3 letters of pre–test acuity line.
• Recovery time is 15 to 30 secs in normal eyes.
• More than 50 secs is an indication of macular disease but
not in optic neuropathy.

AMSLER GRID TEST
• Evaluates the 10 ̊ of visual field
centered on fixation.
• Used in screening and
monitoring macular diseases.
• Square 10*10 cm divided into
400 5*5 mm squares to be held
at 30 cm.

PROCEDURE
• Reading glasses are worn & 1 eye is covered.
• Patient is asked to see the central spot.
• Presence of abnormalities like blurred areas, holes,
distortions, or blank spots are noted.
• Patient with maculopathy reports that the lines are wavy
whereas patient with optic neuropathy remarks some
lines are missing or faint.


TWO POINT
DISCRIMINATION• This test gives an idea about the macular function.
• The patient is asked to look through an opaque disc
perforated with two pinholes behind which a light is held.
The holes are 2 inches apart and are held 2 feet away
from the eye.
• If the patient can perceive two lights, it indicates normal
macular function.

COLOUR VISION
• Colour vision is the function of three populations of
retinal cones.
• Blue ( tritan) 414-424 nm
• Green ( deuteran) 522-539nm
• Red (protan) 549-570nm
• Normal person possess all these three cones and called
trichromat.

• Acquired macular diseases tends to produce blue yellow
defects and optic nerve lesions red green defects.
• Deutran anomaly is the most common and those subjects
can not differentiate between red and green colours.

TESTS
1. Pseudo-isochromatic chart test
2. The Lantern Test
3. Farnsworth-Munsell 100 hue test
4. City university colour vision test
5. Nagel’s anomaloscope test
• Of these the pseudo-isochromatic chart test is most
widely and frequently used.

Ishihara Pseudo-isochromatic
colour vision test plates• This test consists of a series of plates designed to provide
a quick and accurate assessment of colour vision
deficiency of congenital origin. Most cases are
characterised by a red-green deficiency which may be of
two types; a protan type which may be absolute
(protanopia) or partial (protanomalia) and secondly a
deutan type which may be absolute (deuteranopia) or
partial (deuteranomalia).
• In protanopia the visible range of the spectrum is shorter
at the red end compared with that of a normal person, and
that part of the spectrum which appears to the normal
blue-green, to those with protanopia appears as grey.

• In deuteranopia the part of the spectrum which appears to
the normal as green appears as grey. In protanomalia and
deuteranomalia these parts of the spectrum appear as a
greyish indistinct colour.
• For those with red green deficiencies, blue and yellow
colours appear to be very clear compared to red and
green. This is made use of in the Ishihara test. An
absolute failure to appreciate blue and yellow is termed
tritanopia and if partial tritanomalia. The Ishihara plates
are not designed to detect these deficiencies.


• The plates are designed to be used in adequate daylight
conditions and the introduction of direct sunlight or the
use of electric light may produce some discrepancy in the
results because of an alteration in the appearance of the
colours.
• The plates should be held 75cm from the subject and
tilted so that the plane of the plate is at right angles to the
line of vision. Each plate should be identified within three
seconds. In practice for those patients unable to read
numerals those plates near the end of the book with
winding lines between two X’s should be used. The lines
should be traced with a brush in less than ten seconds.


MICROPERIMETRY
• The principle of microperimetry rests on the possibility to
see —in real time— the retina under examination (by
infrared light) and to project a defined light stimulus over
an individual, selected location.

• SLO Microperimetry was the first technique which
allowed to obtain a fundus-related sensitivity map.
• It uses a near infrared diode laser (675nm)beam that
rapidly scans the posterior pole.
• The reflected light is detected by a confocal photodiode
and the digitized image is stored in a computer.


LIMITATIONS OF SLO
MICROPERIMETRY• SLO fundus perimeter did not allow to perform fully
automatic examination.
• Moreover, automatic follow-up examination
to evaluate exactly the same retinal points tested during
baseline microperimetry was not available with this
instrument.

MP1 MICROPERIMETRY
• The limitations of SLO have been
overcome by MP1
microperimeter a recently
developed automatic fundus
perimeter
• MP1 microperimeter
automatically compensates for
eye movements during the
examination via a software
module that tracks the eye
movements.

FLUORESCEIN ANGIOGRAPHY
• Dark appearance of the fovea on FFA is caused by FAZ
and blockage of the choroidal background by xanthophyll
and dense RPE.
• FFA is a very useful tool in diagnosing macular disorders
e.g. diabetic maculopathy, CSR and can reveal the
functionality of the lesion e.g. ischemic maculopathy.


OPTICAL COHERENCE
TOMOGRAPHY• It is non invasive noncontact imaging that produce high
resolution cross sectional image.
• Useful in diagnosing macular disorders and to delineate
retinal layers and detect subtle anatomical changes.

MADDOX ROD TEST
• Maddox rod in combination with a bright light source is a
valuable dark room procedure for assessing macular
function.
PRINCIPLE
• It is a high power cylindrical lens used to form a line
image from a point source of light.
• Every astigmatic lens produces two focal lines
perpendicular to each other.
• The real focal line produced by a Maddox rod is formed
so close to the patient’s eye that patient cannot focus on it
; the second focal line is a virtual focal line passing
through the point light source which is perceived by the
patients.


TECHNIQUE
• Maddox rod can be used as a simple test of macular
function in-patient’s who do not have totally opaque
ocular media.
• Maddox rod is held in front of eye to be tested and light
source is held approx. 14 inches or 35cm away.

• a) If patient observes an unbroken red line, one may
assume macular integrity.
• b) If patients observes a discontinuity in red line, this
represents a large scotoma and should raise the possibility
of significant macular disease.

ELECTRORETINOGRAM
• The clinical electroretinogram is the recording of the
electrical potential waveform generated by the
preganglionic retina in response to a flash of light.

TECHNIQUE
• It is measured in dark adapted
eye with:
1. Active Electrode:
On the cornea-embedded in a
contact lens.
2. Reference Electrode:
on the forehead- serving as a
negative pole.
3. Ground Electrode:
On the ear lobule.

MEASUREMENT
• ERG is measured in two components:
1. Amplitude:
a wave: from baseline to peak of a wave
b wave: from a wave peak to b wave peak.
2. Time Sequence:
Latency: time interval between onset of stimulus and
beginning of a wave response. N- 2 sec
Implicit time: time from onset of light stimulus and
maximum response. N- less than 1/4th sec.

CLINICAL APPLICATION
• Diagnosis and prognosis of retinal disorders such as
retinitis pigmentosa, retinal ischaemia, Leber’s congenital
amaurosis etc
• Assessing retinal function when fundus examination is
not possible eg: dense cataract
• Assessing retinal function in babies when impaired vision
is suspected.

NORMAL ERG
• It consists of the following waves:
1- a wave: It is the negative wave
arising from the rods and cones.
2- b wave: It is a large positive
wave which is generated from the
Muller cells, but represents the
activity of the bipolar cells.
3- c wave: It is also a positive
wave representing the metabolic
activity of the pigment epithelium.

ABNORMAL ERG
RESPONSE1.Supernormal response: characterised by response
above the normal upper limit. It is seen in
- Subtotal circulatory disturbance
- Early siderosis bulbi
- Albinism
2. Sub-normal Response: b-wave response is subnormal.
This indicates that a large area of retina is not
functioning, such as in early cases of retinitis
pigmentosa, retinal detachment, vitamin A deficiency.

3. Extinguished response: this is seen when there is
complete failure of rods and cones eg complete retinal
detachment, advanced retinitis pigmentosa.
4. Negative response: this indicates a gross disturbance in
retinal circulation eg CRAO, CRVO, arteriosclerosis.

MAXWELL
OPHTHALMOSCOPE• It is a hand held foveal ERG.
• It employs a 3-4 degrees whit
flickering light focused on the
fovea with a 10 degrees
annulus of constant white
light to desensitize
surrounding retina.

VEP
• VEP is a measure of the electrical potential
generated in response to a visual stimulus.
• It represents integrity of entire visual pathway from retina
to occipital lobe so can not differentiate between macula
,ON and cortical pathology.
• Two types of stimulus either by flash of light or by
patterned stimuli .

• If the issue is the V/A then
the amplitude is measured.
• If the issue is the lesion in the
visual pathway then the
latency is measured.

CLINICAL APPLICATION
• Optic nerve disease
• Visual acuity measurement in infants, mentally retarded
and aphasic patients
• Malingering and hysterical blindness
• Assessment of visual potential in patients with opaque
media
• Amblyopia
• Glaucoma
• Refraction

LASER INTERFEROMETRY
• Utilizes coherent white light or helium-neon laser
generated interference stripes or fringes that are projected
onto the retina through the ocular media.
• Brightness is increased in patients with dense cataracts.
• The laser interferometer resolving power is converted to
standard visual acuity.

LIMITATIONS
• 1. Subjective.
• 2. Laser fringe vision>vision of letter acuity.
• 3. Over predicts visual potential in amblyopes.
POTENTIAL VISUAL
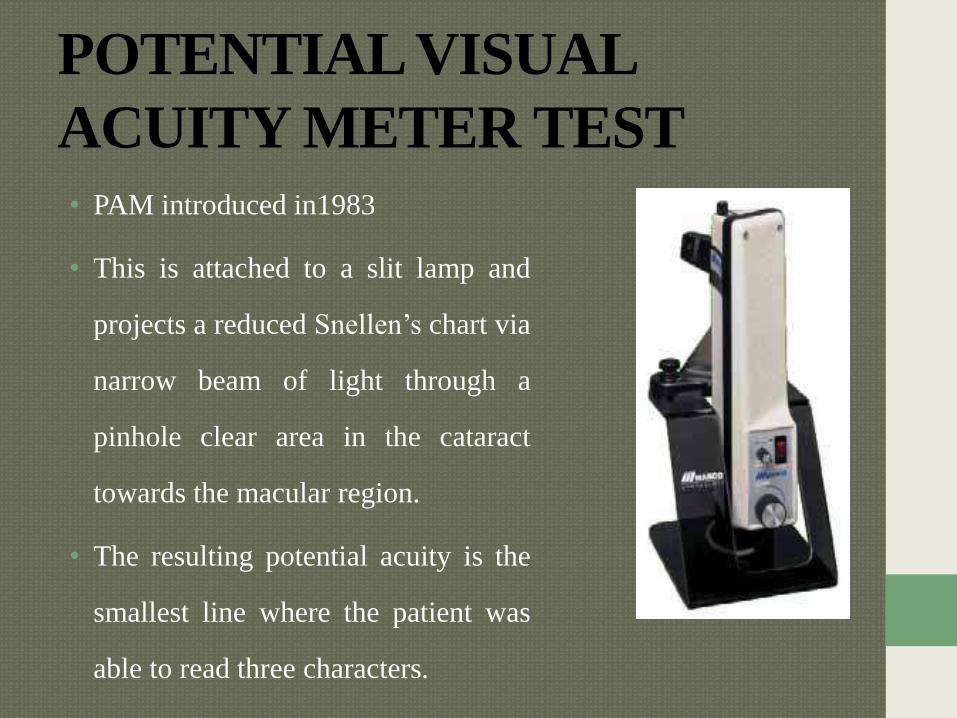
ACUITY METER TEST • PAM introduced in1983
• This is attached to a slit lamp and
projects a reduced Snellen’s chart via
narrow beam of light through a
pinhole clear area in the cataract
towards the macular region.
• The resulting potential acuity is the
smallest line where the patient was
able to read three characters.

LIMITATION
• Subjective
• Methods that require an alert and cooperative
patient and skilled compassionate examiner.
• But it is easier than laser interferometry.

ENTOPIC PHENOMENA
• It is referred to visual perceptions that have their origin in
the structure of an observer's eye.
• Three types are used for testing the macula in opaque
media:
• 1. PURKINJE VASCULAR E.P
• 2. Flying spot( blue field entoptic phenomenon)
• 3. Haidinger’s Brushes

PURKINJE VASCULAR E.P
• This test is based on the ability to appreciate the retinal vasculature and can even be performed with a pen torch at the bed side.
• First described by Goldmannwho used a vertical light source 7mm away from limbus. Goldmann et al reported that the appearance of Purkinje vessel shadows is shown to give post operative visual acuity of 6/12.

PRINCIPLE
• This is a subjective test to assess the function of retina.
• A rapidly oscillating point source of light when directed
over the closed lid stimulates perception of purkinje
vascular tree.
• Due to rapid movement of light source the shadow of
retinal vasculature falls on photoreceptors and can be
appreciated as receptors fail to adapt rapidly.

TECHNIQUE
• This test is useful in comparing two eyes of one patient.
• The involved eye with opaque media is compared with
assumed normal eye.
• The patient’s ability to detect shadow images of the
retinal vasculature provides a rough indication of attached
retina.

BLUE LIGHT ENTOPTOSCOPY
• Principle:
• This test is more specific for macular function and is
based on the ability of the patient to observe the flow of
white blood cells in the parafoveal capillaries which
appears as shadows.
• Blue light is absorbed by Red blood cells but not the
white blood cells.

TECHNIQUE
• 1) The patient is asked to view
an intense, homogenous blue
light background
• 2) If the patient sees shadows
macular function is probably
intact.
• This test has a limitation as it
requires special apparatus and
patients find the instructions
difficult to comprehend hence
rarely used.