Presented to MPC’s Management Team March 5, 2009.
23
MPC EMPLOYEE DEMOGRAPHICS Presented to MPC’s Management Team March 5, 2009
-
Upload
eric-robinson -
Category
Documents
-
view
213 -
download
0
Transcript of Presented to MPC’s Management Team March 5, 2009.

MPC EMPLOYEE DEMOGRAPHICS
Presented to MPC’s Management TeamMarch 5, 2009
BACKGROUND
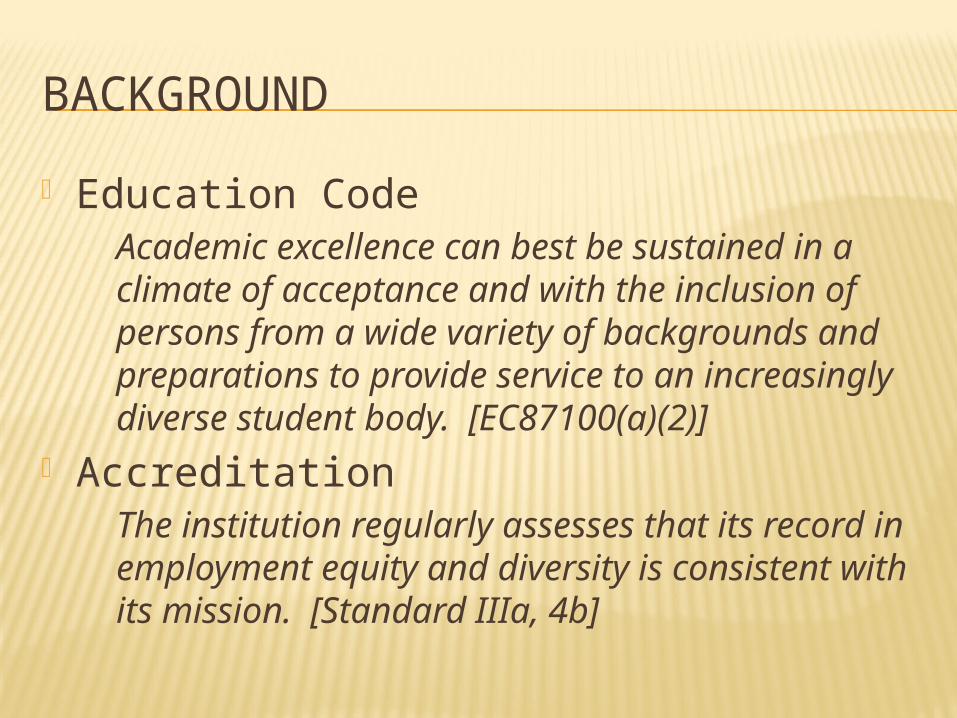
Education CodeAcademic excellence can best be sustained in a climate of acceptance and with the inclusion of persons from a wide variety of backgrounds and preparations to provide service to an increasingly diverse student body. [EC87100(a)(2)]
AccreditationThe institution regularly assesses that its record in employment equity and diversity is consistent with its mission. [Standard IIIa, 4b]
BACKGROUND, CONTINUED
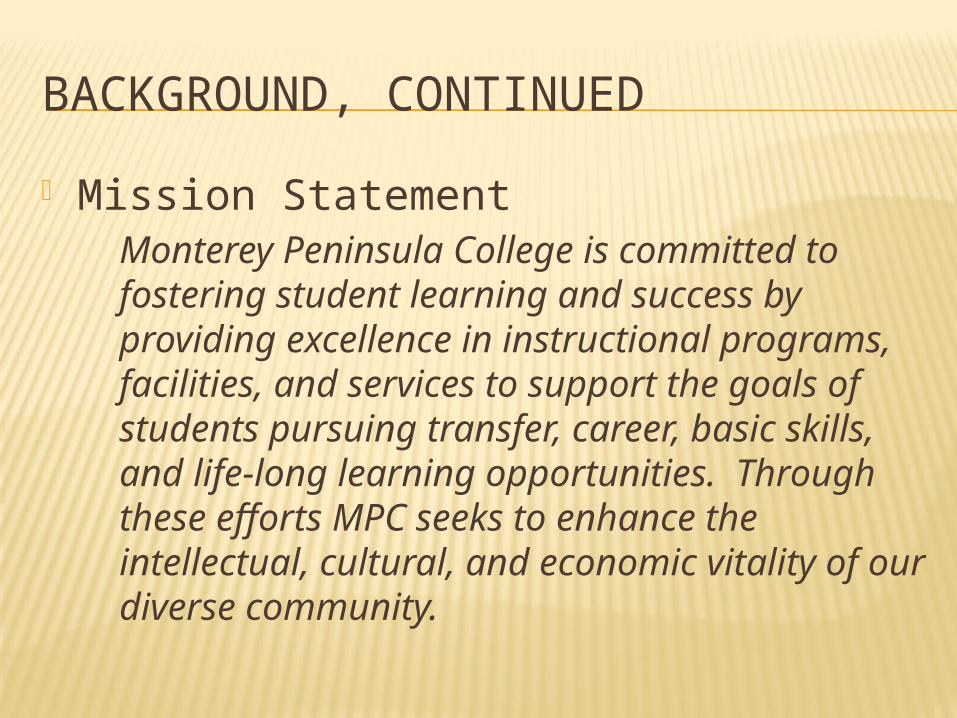
Mission StatementMonterey Peninsula College is committed to fostering student learning and success by providing excellence in instructional programs, facilities, and services to support the goals of students pursuing transfer, career, basic skills, and life-long learning opportunities. Through these efforts MPC seeks to enhance the intellectual, cultural, and economic vitality of our diverse community.

BACKGROUND, CONTINUED
Institutional Goals, 2007 – 20102. Foster a climate that promotes diversity
throughout the institution.Objectives:1. Actively seek and enhance diversity in all college programs, curricula, extra-curricula, outreach and community events, and in the college population, students, employees and Board of Trustees.2. Recruit and retain a diverse college-wide community.

HISTORY
Pre-Proposition 209 Affirmative Action Plan Goals and Timetables based on availability
data
Post-Proposition 209 Equal Employment Opportunity Plan No goals or timetables Availability data currently not available

WORKFORCE BY CATEGORY
. Total Male %M Female % F White %W
Nat. Am
% NA Asian % A
Filipino
% F Hispanic % H Black % B
Unknown
% U
Executive/ Administrative/ Managerial 22 10 45% 12 55% 14 64% 0 0% 2 9% 1 5% 2 9% 3 14% 0 0%
Faculty-Career Education 15 9 60% 6 40% 14 93% 0 0% 0 0% 0 0% 1 7% 0 0% 0 0%
Faculty-English 19 9 47% 10 53% 19 100% 0 0% 0 0% 0 0% 0 0% 0 0% 0 0%
Faculty-Health & PE 9 7 78% 2 22% 6 67% 0 0% 2 22% 0 0% 0 0% 1 11% 0 0%
Faculty-Humanities 17 9 53% 8 47% 13 76% 0 0% 0 0% 0 0% 4 24% 0 0% 0 0%
Faculty-Instructional & Support Services 25 9 36% 16 64% 14 56% 0 0% 4 16% 1 4% 4 16% 2 8% 0 0%
Faculty-Mathematics 10 4 40% 6 60% 8 80% 0 0% 2 20% 0 0% 0 0% 0 0% 0 0%
Faculty-Natural Sciences 13 9 69% 4 31% 10 69% 0 0% 2 15% 0 0% 1 8% 0 0% 0 0%
Faculty-Social Science 13 7 54% 5 42% 10 77% 1 8% 0 0% 0 0% 1 8% 1 8% 0 0%
Clerical/ Secretarial 53 9 17% 44 83% 30 57% 1 2% 4 8% 2 4% 9 17% 7 13% 0 0%
Professional Non-Faculty 18 4 22% 14 78% 10 56% 0 0% 3 17% 1 6% 4 22% 0 0% 0 0%
Service/ Maintenance 31 26 84% 5 16% 12 39% 0 0% 0 0% 0 0% 13 42% 6 19% 0 0%
Skilled Crafts 10 9 90% 1 10% 7 70% 0 0% 1 10% 0 0% 2 20% 0 0% 0 0%Technical/ Paraprofessional 79 28 35% 51 65% 51 65% 1 1% 11 14% 2 3% 7 9% 7 9% 0 0%
Adjunct- Fall 2008 280 121 43% 159 57% 250 89% 2 1% 13 5% 5 2% 5 2% 5 2% 0 0%
613 149 24% 343 56% 468 76% 5 1% 44 7% 12 2% 53 9% 32 5% 0 0%Disability: 15

DEMOGRAPHICS OF CURRENT WORKFORCE
White46776%
Nat. Am; 5; 1%
Asian; 44; 7%
Filipino; 12; 2%
Hispanic; 53; 9%
Black; 32; 5%
WhiteNat. AmAsianFilipinoHispanicBlackUnknown
Including FA’08 Adjunct

TOTAL WORKFORCE- GENDER
Male; 270; 44%
Female34356%
MaleFemale

EXEC./ MANAGERIAL DEMOGRAPHICS
TotalMale % M
Female % F
White %W
Nat Am
% NA
Asian % A
Filipino % F
Hispanic
% H
Black % B
Unknown
% U
Executive/ Administrative/ Managerial 22 10 45% 12 55% 14 64% 0 0% 2 9% 1 5% 2 9% 3 14% 0
0%
Fall 2008
White; 14; 64%
Asian; 2;
9%
Fil-ipino; 1;
5%
Hispanic; 2;
9%
Black; 3; 14%
WhiteNat. AmAsianFilipinoHispanicBlackUn-known
10, 45%12,
55%
MaleFemale

FULL TIME FACULTY- DEMOGRAPHICSTotal
Male %M
Female % F
White %W
Nat. Am % NA
Asian % A
Filipino % F
Hispanic
% H
Black
% B
Unknown % U
Faculty-Career Education 15 9 60% 6 40% 14 93% 0 0% 0 0% 0 0% 1 7% 0 0% 0 0%Faculty-English 19 9 47% 10 53% 19 100% 0 0% 0 0% 0 0% 0 0% 0 0% 0 0%
Faculty-Health & PE 9 7 78% 2 22% 6 67% 0 0% 2 22% 0 0% 0 0% 111% 0 0%
Faculty-Humanities 17 9 53% 8 47% 13 76% 0 0% 0 0% 0 0% 424% 0 0% 0 0%
Faculty-Instructional & Support Services 25 9 36% 16 64% 14 56% 0 0% 4 16% 1 4% 4
16% 2 8% 0 0%
Faculty-Mathematics 10 4 40% 6 60% 8 80% 0 0% 2 20% 0 0% 0 0% 0 0% 0 0%Faculty-Natural Sciences 13 9 69% 4 31% 10 69% 0 0% 2 15% 0 0% 1 8% 0 0% 0 0%Faculty-Social Science 13 7 54% 6 46% 10 77% 1 8% 0 0% 0 0% 1 8% 1 8% 0 0%
120 63 52% 57 48% 93 78% 1 1% 10 8% 1 1% 11 9% 4 3% 0 0%
White93
78%Nat.
Am; 1; 1%
Asian; 10; 8%
Filipino; 1; 1%
His-panic; 11; 9%
Black; 4; 3%
WhiteNat. AmAsianFilipinoHispanicBlackUnknown
63; 52%
58; 48%
MaleFemale

FALL 2008 ADJUNCTS- DEMOGRAPHICS
Total Male %MFemale % F White %W
Nat. Am
% NA Asian % A
Filipino
% F
Hispanic
% H
Black
% B
Unknown % U
Adjunct- Fall 2008 280 121 43% 159 57% 250 89% 2 1% 13 5% 5 2% 5 2% 5 2% 0 0%
White; 250; 89%
Nat. Am; 2;
1%
Asian; 13; 5%
Fil-ipino; 5; 2%
His-panic; 5; 2%
Black; 5; 2%
WhiteNat. AmAsianFilipinoHispanicBlackUnknown
121; 43%
159; 57%
MaleFe-male

CLASSIFIED WORKFORCE- DEMOGRAPHICS
Total
Male %M
Female % F
White %W
Nat. Am
% NA
Asian % A
Filipino
% F
Hispanic
% H
Black % B
Unknown % U
Clerical/ Secretarial 53 9 17% 44 83% 30 55% 1 2% 4 8% 2 4% 9 19% 7 13% 0 0%Professional Non-Faculty 18 4 22% 14 78% 10 56% 0 0% 3 17% 1 6% 4 22% 0 0% 0 0%Service/ Maintenance 31 26 84% 5 16% 12 41% 0 0% 0 0% 0 0% 13 41% 6 19% 0 0%Skilled Crafts 10 9 90% 1 11% 7 67% 0 0% 1 11% 0 0% 2 22% 0 0% 0 0%Technical/ Paraprofessional 79 28 35% 51 65% 51 66% 1 1% 11 13% 2 3% 7 8% 7 9% 0 0%
191 76 40% 115 60% 110 58% 2 1% 19 10% 5 3% 35 18% 20 10% 0 0%
White; 110; 58%
Nat. Am; 2;
1%
Asian; 19; 10%
Filipino; 5; 3%
His-panic;
35; 18%
Black; 20; 10%
WhiteNat. AmAsianFilipinoHispanicBlackUnknown
76, 40%
115,
60%
MaleFe-male

DEMOGRAPHICS OF CURRENT WORKFORCEPERMANENT VS. ALL
White21865%
Nat. Am;
3; 1%
Asian; 31; 9%
Fil-ipino; 7; 2%
His-panic;
48; 14%
Black; 27; 8%
White
46876%
Nat. Am; 5;
1%
Asian;
44; 7%
Fil-ipino; 12; 2%
His-pani
c; 53; 9%
Black; 32; 5%

DEMOGRAPHICS OF APPLICANT POOLS
Total Male %MFemale % F
White %W
Nat. Am % NA
Asian % A
Hispanic % H
Black % B
Unknown % U
Executive/ Administrative/ Managerial 47 28 60% 19 40% 36 77% 3 6% 2 4% 1 2% 1 2% 4 9%
Faculty-Career Education 61 24 39% 37 61% 43 70% 0 0% 3 5% 4 7% 5 8% 6 10%
Faculty-English 195 94 48% 101 52% 127 65% 0 0% 12 6% 16 8% 2 1% 38 19%
Faculty-Health & PE 25 25 100% 0 0% 20 80% 2 8% 2 8% 1 4% 0 0% 0 0%
Faculty-Humanities 0 0 0 0 0 0 0 0 0
Faculty-Instructional & Support Services 43 11 26% 31 72% 23 53% 1 2% 4 9% 4 9% 1 2% 10 23%
Faculty-Mathematics 25 20 80% 5 20% 18 72% 0 0% 4 16% 1 4% 0 0% 2 8%
Faculty-Natural Sciences 0 0 0 0 0 0 0 0 0
Faculty-Social Science 99 51 52% 48 48% 72 73% 0 0% 5 5% 5 5% 1 1% 16 16%
Clerical/ Secretarial 363 55 15% 300 83% 182 50% 3 1% 47 13% 57 16% 30 8% 44 12%
Professional Non-Faculty 67 13 19% 54 81% 35 52% 1 1% 13 19% 9 13% 4 6% 1 1%
Service/ Maintenance 152 121 80% 27 18% 52 34% 0 0% 20 13% 46 30% 24 16% 10 7%
Skilled Crafts 0 0 0 0 0 0 0 0 0
Technical/ Paraprofessional 136 67 49% 70 51% 71 52% 1 1% 15 11% 14 10% 2 1% 33 24%
Adjunct- Fall 2008 411 228 55% 183 45% 303 74% 5 1% 32 8% 34 8% 21 5% 16 4%
1624 737 45% 875 54% 982 60% 16 0.99% 159 10% 192 12% 91 6% 180 11%

DEMOGRAPHICS OF APPLICANT POOLS
White; 982; 61%
Nat. Am; 16; 1%
Asian; 159; 10%
Hispanic; 192; 12%
Black; 91; 6% Unknown; 180; 11% WhiteNat. AmAsianHis-panicBlack
737,
46%
875, 54%
MaleFemale

APPLICANT POOL- EXEC./ADMIN./MANG.
TotalMale %M
Female % F
White %W
Nat. Am
% NA
Asian
% A
Hispanic
% H
Black
% B
Unknown
% U
Exec./ Admin/ Managerial 47 28 60% 19 40% 36 77% 3 6% 2 4% 1 2% 1 2% 4 9%
White; 36; 77%
Nat. Am; 3; 6%
Asian; 2; 4%
Hispanic; 1; 2%
Black; 1; 2%
Un-known; 4; 9%
WhiteNat. AmAsianHispanicBlackUn-known 28;
60%
19; 40% Male
Female

APPLICANT POOL- FACULTYTotal
Male %M Female % F
White %W
Nat. Am % NA
Asian % A
Hispanic % H
Black % B
Unknown % U
Faculty-Career Education 61 24 39% 37 61% 43 70% 0 0% 3 5% 4 7% 5 8% 6 10%
Faculty-English 195 94 48% 101 52% 127 65% 0 0% 12 6% 16 8% 2 1% 38 19%
Faculty-Health & PE 25 25 100% 0 0% 20 80% 2 8% 2 8% 1 4% 0 0% 0 0%Faculty-Humanities 0 0 0 0 0 0 0 0 0
Faculty-Inst. & Spprt Serv. 43 11 26% 31 72% 23 53% 1 2% 4 9% 4 9% 1 2% 10 23%
Faculty-Mathematics 25 20 80% 5 20% 18 72% 0 0% 4 16% 1 4% 0 0% 2 8%
Faculty-Natural Sciences 0 0 0 0 0 0 0 0 0
Faculty-Social Science 99 51 52% 48 48% 72 73% 0 0% 5 5% 5 5% 1 1% 16 16%
448 225 50% 222 50% 303 68% 3 1% 30 7% 31 7% 9 2% 72 16%
White; 303; 68%
Nat. Am; 3;
1%
Asian; 30; 7%
His-panic; 31; 7%
Black; 9; 2%
Un-known;
72; 16%
WhiteNat. AmAsianHispanicBlackUnknown
225, 50%
222, 50%
MaleFemale

APPLICANT POOL- CLASSIFIED
Total Male %MFemale % F
White %W
Nat. Am
% NA
Asian % A
Hispanic % H
Black % B
Unknown % U
Clerical/ Secretarial 363 55 15% 300 83% 182 50% 3 1% 47 13% 57 16% 30 8% 44 12%Professional Non-Faculty 67 13 19% 54 81% 35 52% 1 1% 13 19% 9 13% 4 6% 1 1%Service/ Maintenance 152 121 80% 27 18% 52 34% 0 0% 20 13% 46 30% 24 16% 10 7%Skilled Crafts 0 0 0 0 0 0 0 0 0 Technical/ Paraprofessional 136 67 49% 70 51% 71 52% 1 1% 15 11% 14 10% 2 1% 33 24%
718 256 36% 451 63% 340 47% 5 1% 95 13% 126 18% 60 8% 88 12%
White; 340; 48%
Nat. Am; 5; 1%
Asian; 95; 13%
His-panic; 126; 18%
Black; 60; 8%
Unknown; 88; 12%
WhiteNat. AmAsianHispanicBlackUnknown
256,
36%451,
64%
Male

APPLICANT POOL- ADJUNCTS
Total
Male %M
Female % F
White %W
Nat. Am
% NA
Asian % A
Hispanic
% H
Black
% B
Unknown
% U
Adjunct- Fall 2008 411 228 55% 183 45% 303 74% 5 1% 32 8% 34 8% 21 5% 16 4%
White; 303; 74%
Nat. Am; 5;
1%
Asian; 32; 8%
His-panic; 34; 8%
Black; 21; 5%
Unknown; 16; 4%
WhiteNat. AmAsianHispanicBlackUnknown 228
, 55%
183, 45%
MaleFemale

PROGRESS- WORKFORCE
0.0%
10.0%
20.0%
30.0%
40.0%
50.0%
60.0%
70.0%69.2%
8.9% 9.5% 10.6%1.8%
10.0%
58.3%65.2%
14.1%
8.1% 11.4% 0.9%
4.5%
55.0%
Fall 2001Fall 2008
Type White Hispanic
Black Asian Nat. Am
Disability
Exec./Mang.
12 14 1 2 3 3 1 3 1 034 15
Classified 111 110 21 35 26 20 30 24 4 2
Faculty 111 94 8 11 3 4 5 11 1 1Does not include Adjunct Faculty

OBSERVATIONS
One of the keys to increasing diversity is to increase the diversity of the applicant pools.
While the overall diversity of the workforce is increasing, the demographics are shifting. The percentage of Hispanics has increased. The percentage of African-Americans has
decreased. The number of employees reporting
disabilities has decreased significantly, from 10% in 2001 to 4.5% in 2008.

WHAT MPC IS DOING. . .
Requirement for all positions:demonstrate an understanding of, sensitivity to and appreciation for the academic, ethnic, socio-economic, disability and gender diversity of community college students (required by EC87360 for administrators and faculty)
Broad recruitment Training for all hiring committees on the principles of
Equal Employment Opportunity Speakers and activities on diversity related topics Updating the EEO Plan Bilingual requirements for identified positions

FUTURE PLANS
Update hiring processes, with special emphasis on adjunct faculty
Implement new EEO Plan Continue exploring new recruitment
sources Working with the EEO Advisory
Committee, continue to investigate programs and speakers which may enhance understanding of diversity
Monitor the demographics on an annual basis