Presented to Earthworks Satellite Remote Sensing for Environmental Advocacy John F. Amos, SkyTruth...
50
Presented to Earthworks Satellite Remote Sensing for Environmental Advocacy John F. Amos, SkyTruth Washington, DC – March 26, 2004
-
Upload
delilah-james -
Category
Documents
-
view
216 -
download
0
Transcript of Presented to Earthworks Satellite Remote Sensing for Environmental Advocacy John F. Amos, SkyTruth...
Presented to
Earthworks
Satellite Remote Sensing for Environmental Advocacy
John F. Amos, SkyTruth
Washington, DC – March 26, 2004
• A 501(c)(3) nonprofit organization– exemption in March 2002
• Based in Shepherdstown, West Virginia
• A distributed network of remote sensing and GIS experts and partner organizations
• Providing remote sensing and GIS assistance and training to environmental advocates and government agencies
What Is SkyTruth?

Sand waves, Bahamas

Burning oil wells, Kuwait
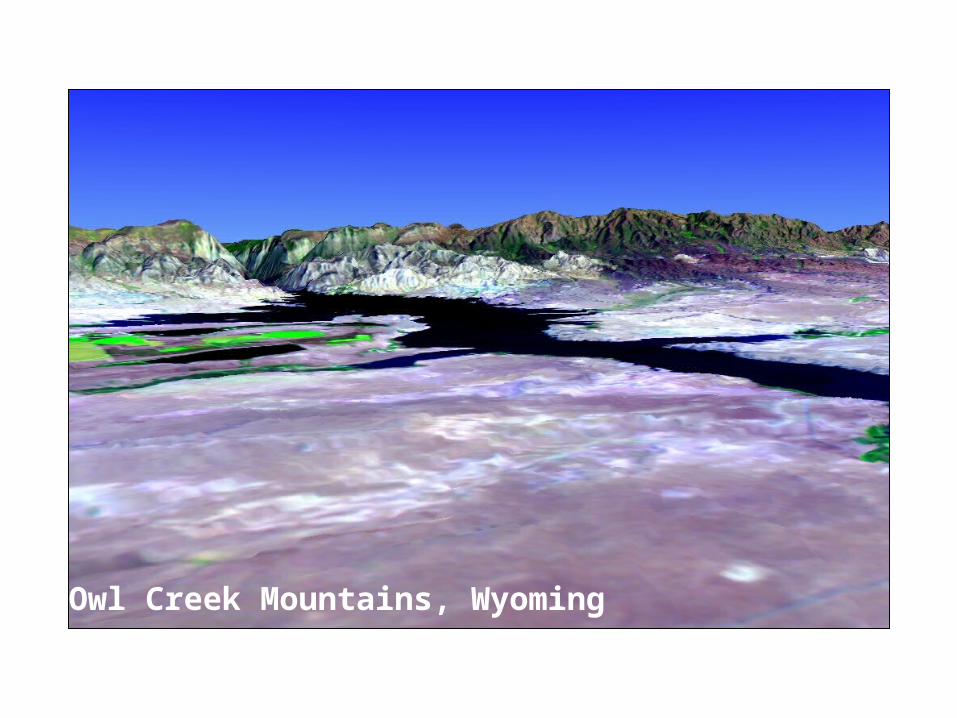
Owl Creek Mountains, Wyoming

What Is Remote Sensing?
• Collecting information from a distance, by measuring energy coming from the target
– Energy reflected off the target from a natural source (sunlight)
– Energy reflected off the target from an artificial source (examples: sonar, seismic, radar)
– Energy emitted by the target (example: infrared “heat”)
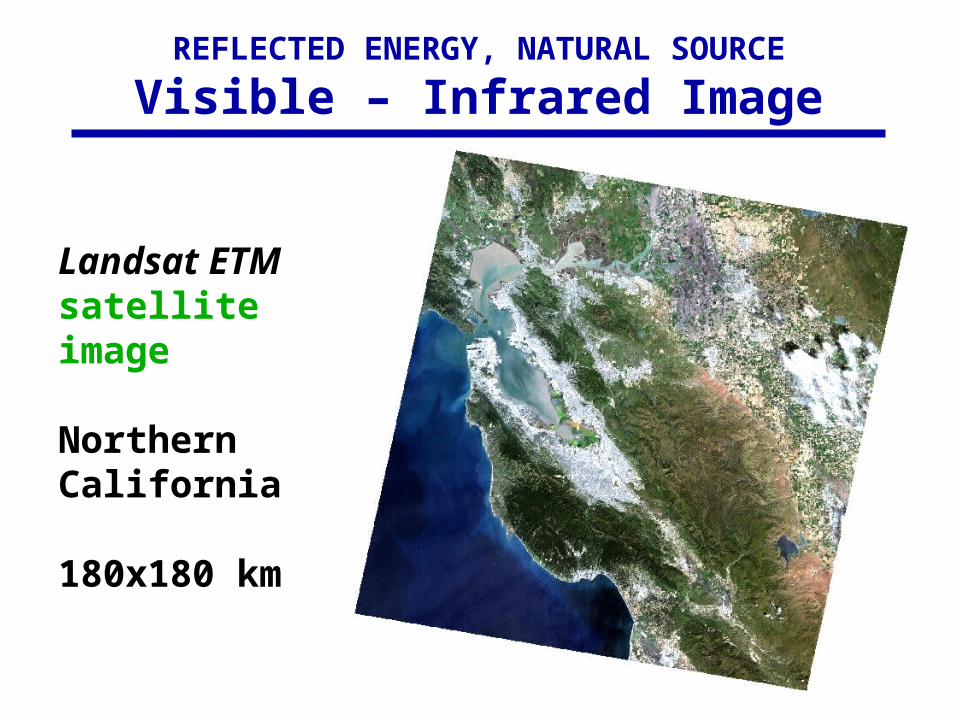
Landsat ETM satellite image
Northern California
180x180 km
REFLECTED ENERGY, NATURAL SOURCE
Visible – Infrared Image

Aster satellite image
US – Mexico border
REFLECTED ENERGY, NATURAL SOURCE
Visible – Infrared Image

Probe airborne scanner image
Santa Barbara, California
REFLECTED ENERGY, NATURAL SOURCE
Visible – Infrared Image

RADARSATradar satellite image
Natural oil slicks
Gulf of Mexico
REFLECTED ENERGY, ARTIFICIAL SOURCE
Radar Image
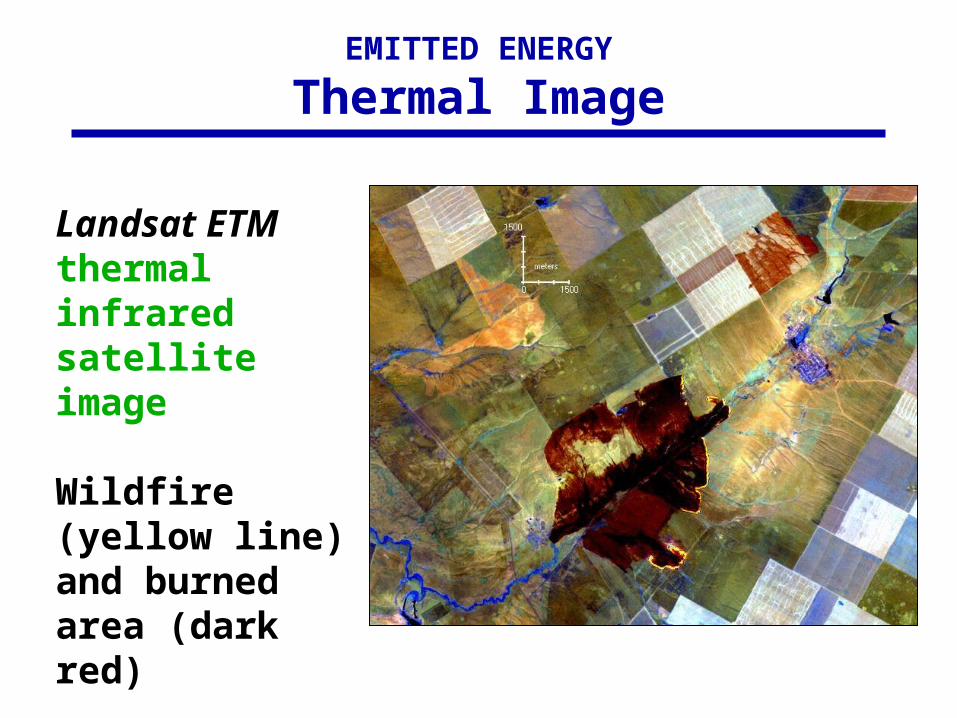
Landsat ETM thermal infrared satellite image
Wildfire (yellow line) and burned area (dark red)
Kazakhstan
EMITTED ENERGY
Thermal Image

Trends in Remote Sensing
Decreasing Data Cost
Landsat, 1990s: $4,400 Landsat, today: $ 600
Desktop Mapping
Improved GIS software Powerful desktop PCs Demonstrated applications Rapid Internet distribution
New Platforms/Sensors
High-resolution, Radar, Hyperspectral
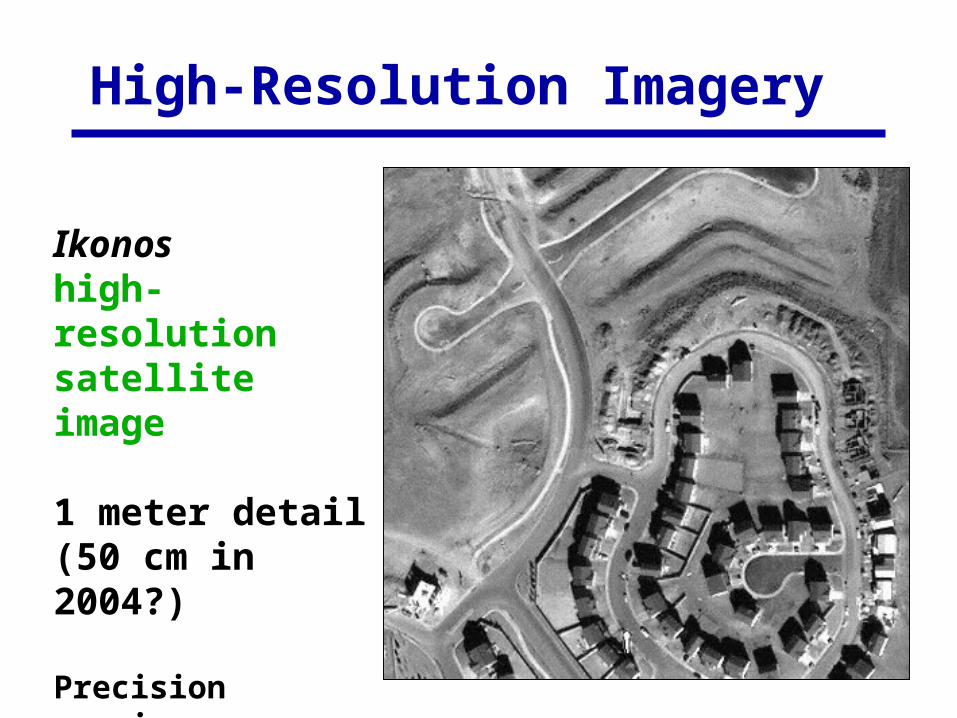
High-Resolution Imagery
Ikonos high-resolution satellite image
1 meter detail (50 cm in 2004?)
Precision mapping, monitoring

Tanker salvage operation, BrazilIkonos high-resolution satellite image

APPLICATION EXAMPLE
Gas Field Infrastructure – Jonah, WY
Upper Green River valley, Wyoming
Pinedale BLM jurisdiction, black
Jonah natural gas field, red
Landsat TM
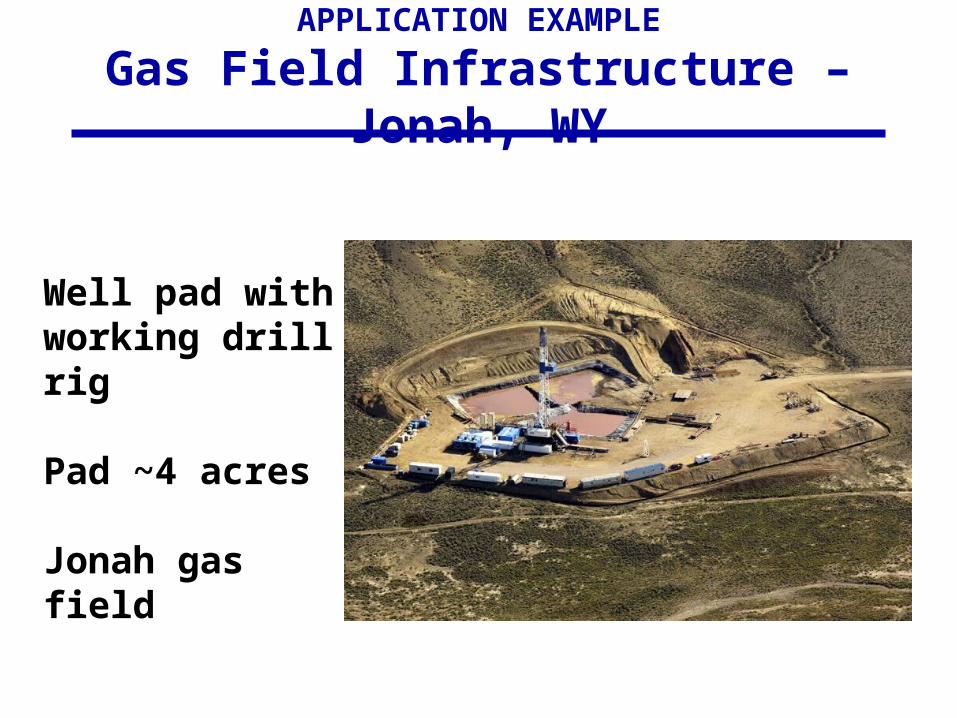
APPLICATION EXAMPLE
Gas Field Infrastructure – Jonah, WY
Well pad with working drill rig
Pad ~4 acres
Jonah gas field
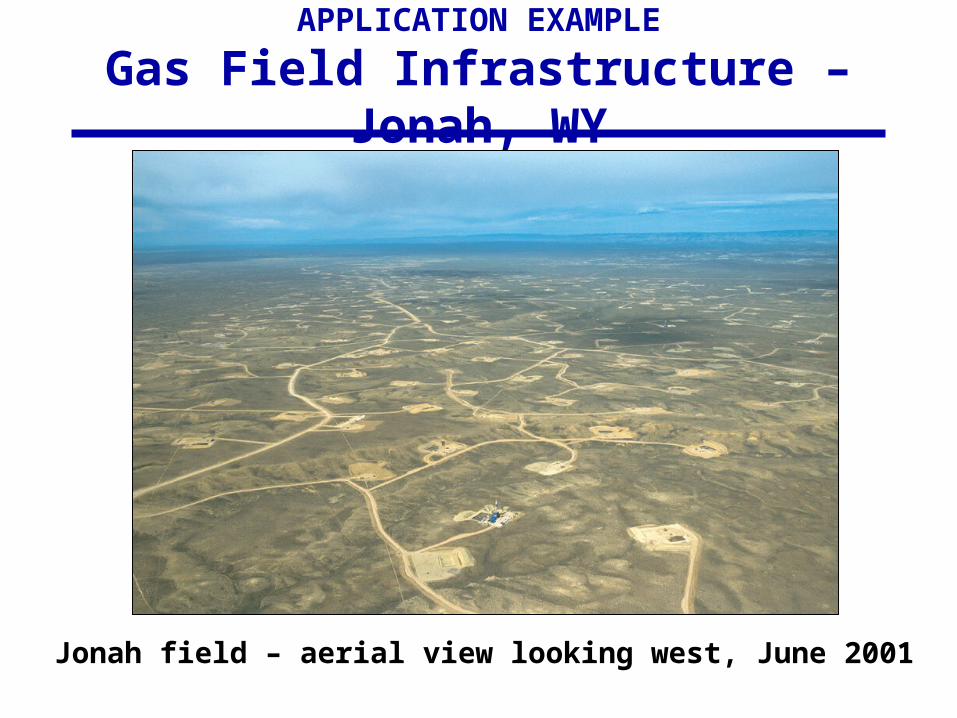
APPLICATION EXAMPLE
Gas Field Infrastructure – Jonah, WY
Jonah field – aerial view looking west, June 2001

APPLICATION EXAMPLE
Gas Field Infrastructure – Jonah, WY
1986
Landsat TM
7 miles
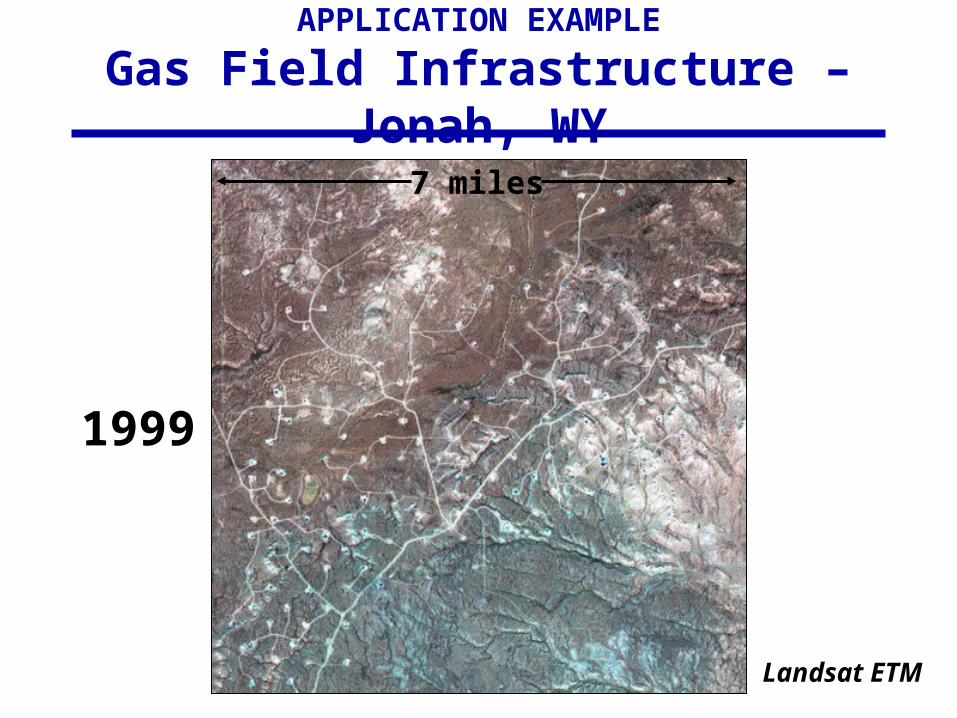
APPLICATION EXAMPLE
Gas Field Infrastructure – Jonah, WY
1999
7 miles
Landsat ETM

APPLICATION EXAMPLE
Gas Field Infrastructure – Jonah, WY
2001
7 miles
Landsat ETM
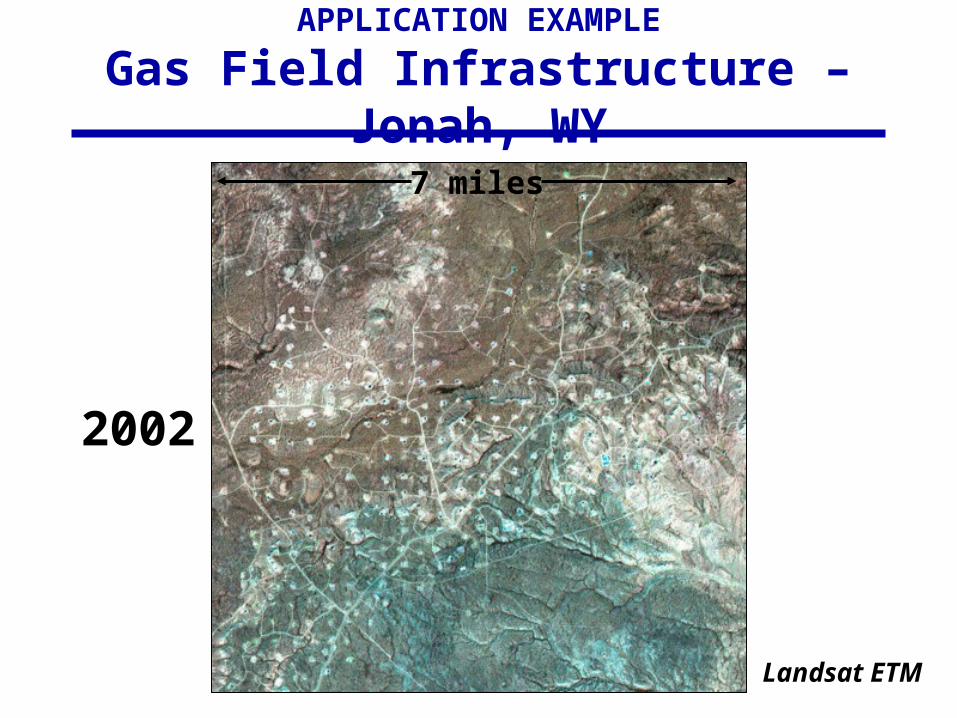
APPLICATION EXAMPLE
Gas Field Infrastructure – Jonah, WY
2002
7 miles
Landsat ETM
Products
• Poster-size maps, images, image collages
• Page-size information handouts
• Digital graphics
– Slide shows
– Web publishing
– Brochures and flyers
Products
• GIS Data Layers
– Map oriented, enhanced imagery
– Analyses derived from imagery
• Land use / land cover
• Change detection
• Pollution detection
• Forward-looking simulations

Brochure

APPLICATION EXAMPLE
Gas Field Infrastructure – Jonah, WY
Elk and Pronghorn migration corridor
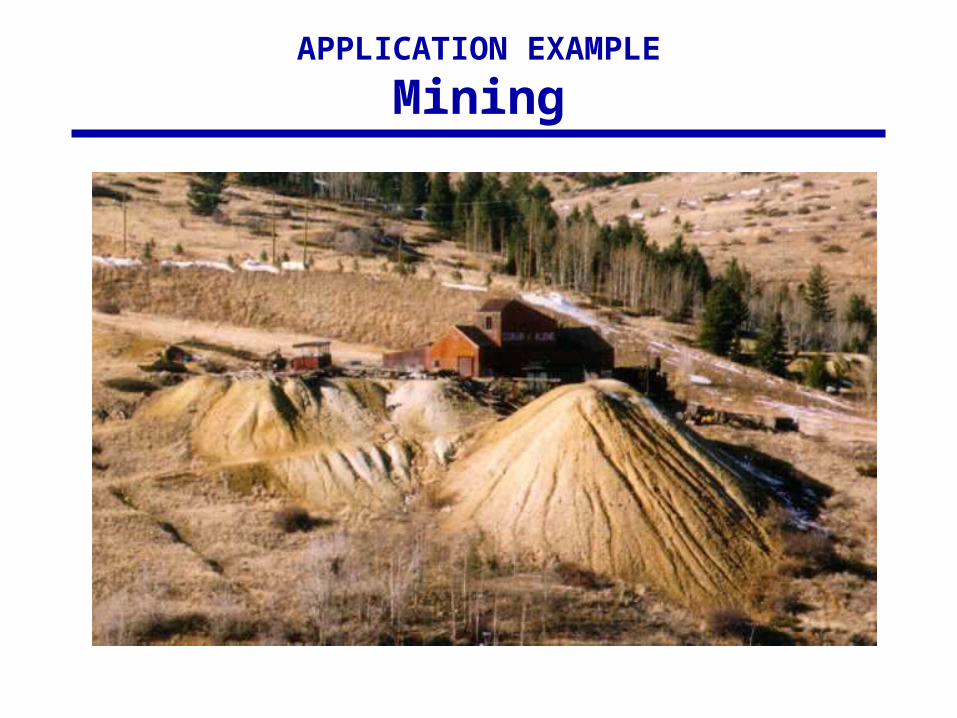
APPLICATION EXAMPLE
Mining

APPLICATION EXAMPLE
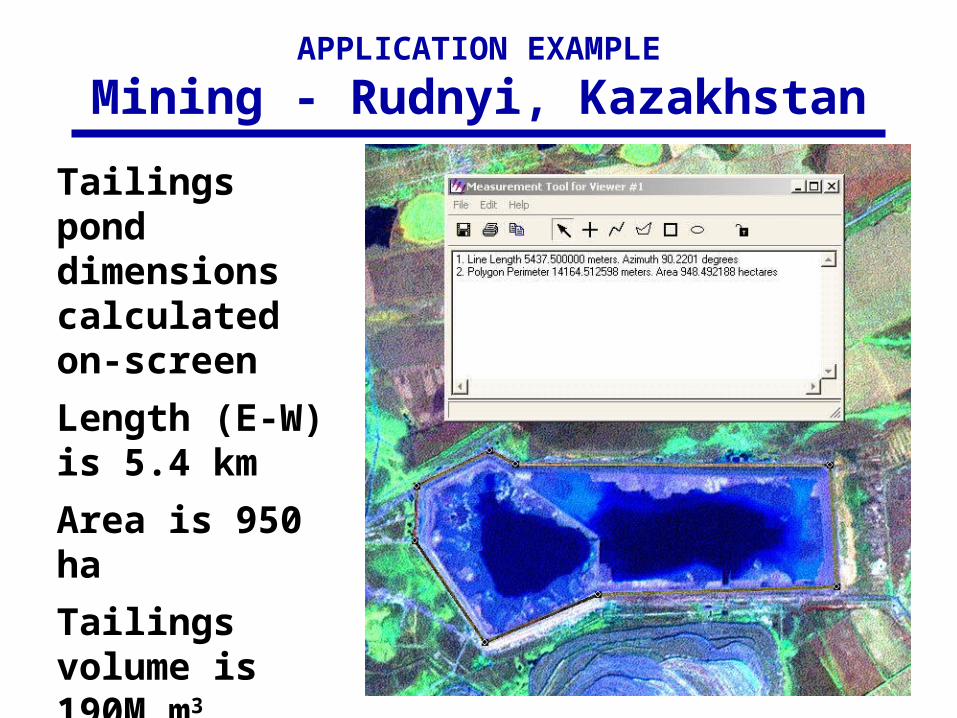
Mining - Rudnyi, Kazakhstan

APPLICATION EXAMPLE
Mining - Rudnyi, Kazakhstan
APPLICATION EXAMPLE
Mining - Rudnyi, Kazakhstan
Tailings pond dimensions calculated on-screen
Length (E-W) is 5.4 km
Area is 950 ha
Tailings volume is 190M m3
(assuming 20m thickness)
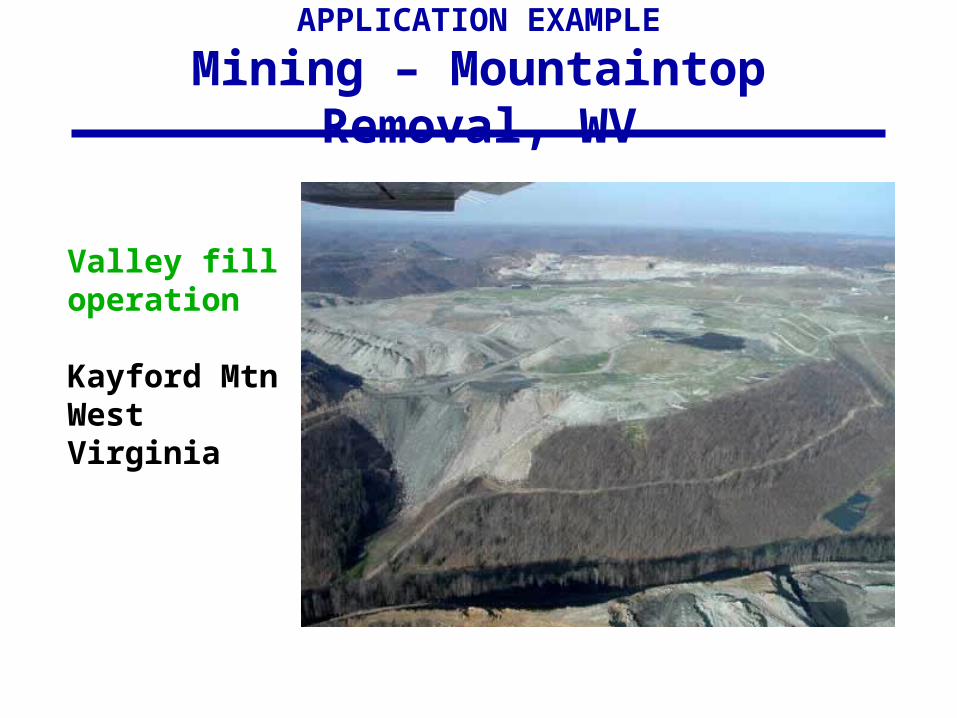
APPLICATION EXAMPLE
Mining – Mountaintop Removal, WV
Valley fill operation
Kayford MtnWest Virginia
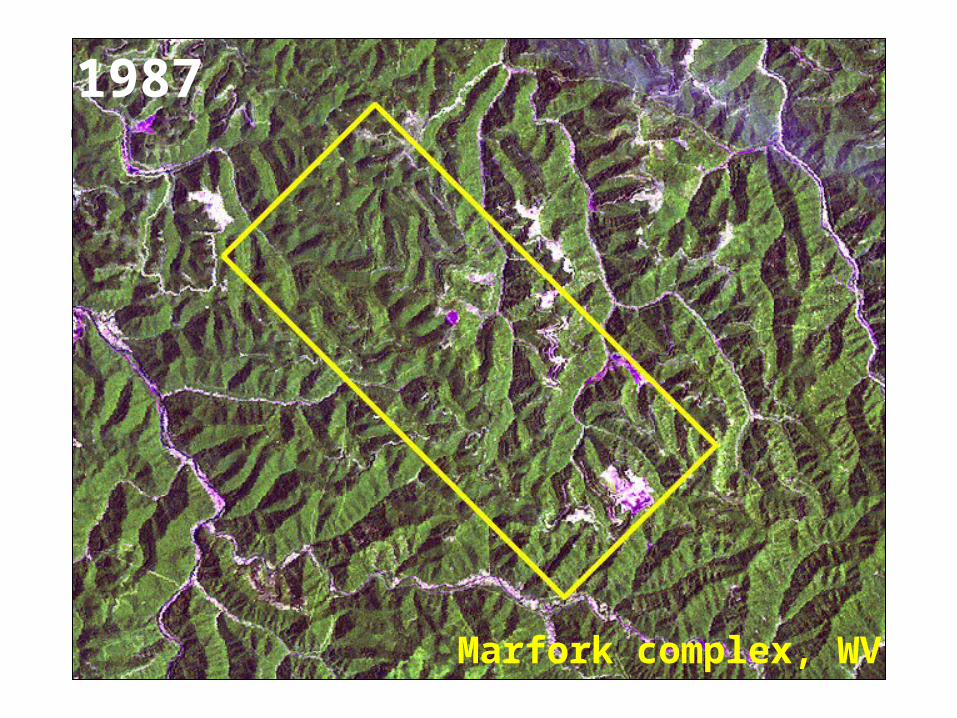
1987
Marfork complex, WV
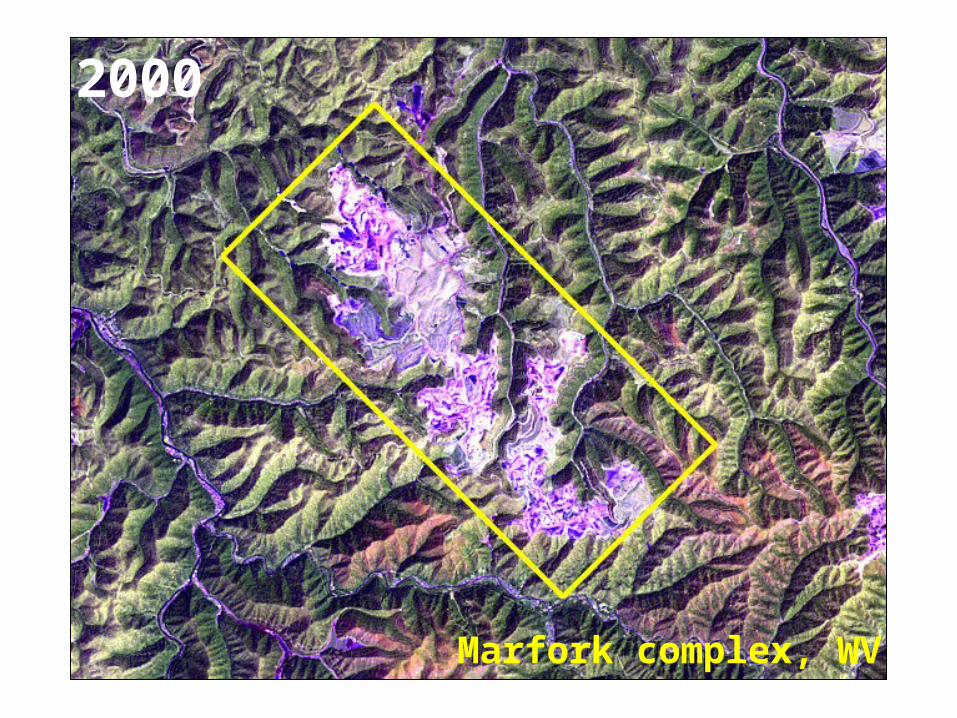
2000
Marfork complex, WV
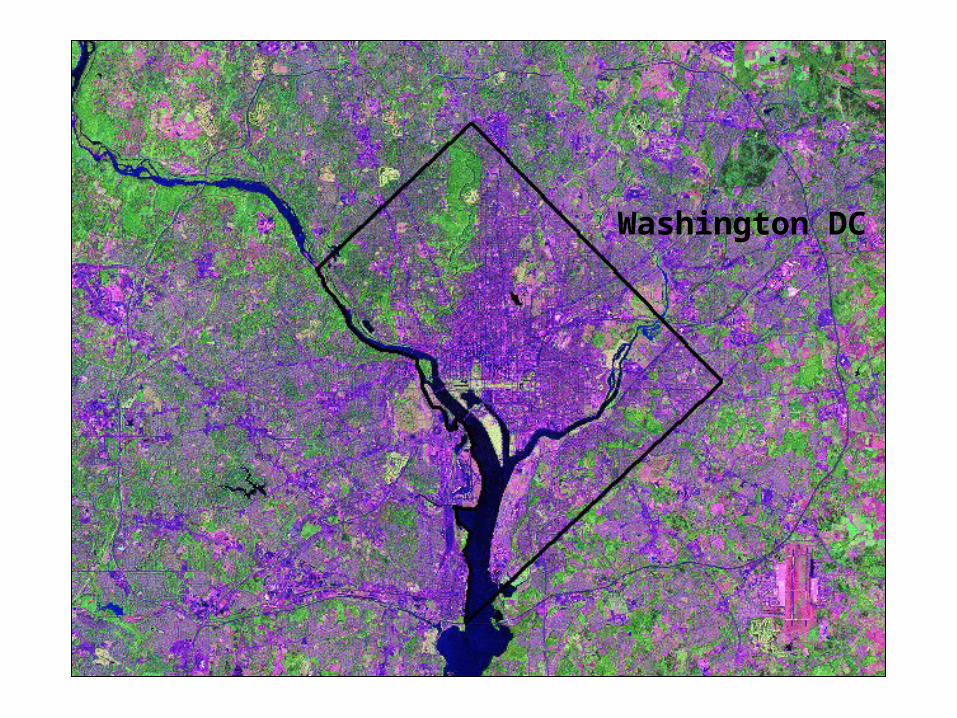
Washington DC

Marfork complex
Washington DC

1987 – View to west, future Marfork mining area.Image draped on topography data.

2000 – View to west, Marfork mine complex.Topography data modified to average elevation
calculated within mining area.
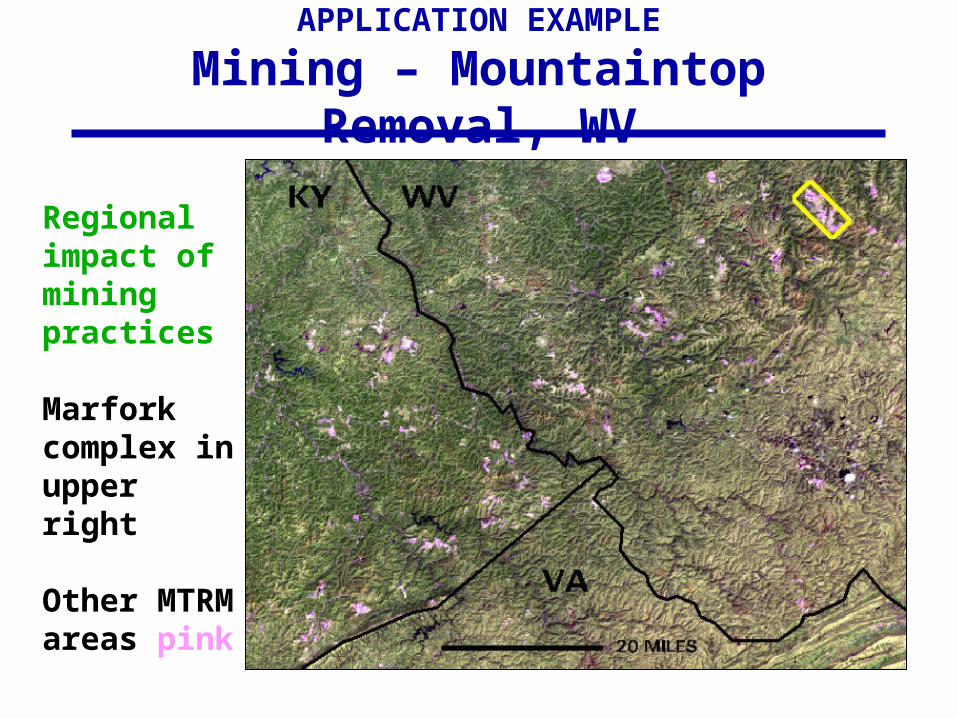
APPLICATION EXAMPLE
Mining – Mountaintop Removal, WV
Regional impact of mining practices
Marfork complex in upper right
Other MTRM areas pink
APPLICATION EXAMPLE
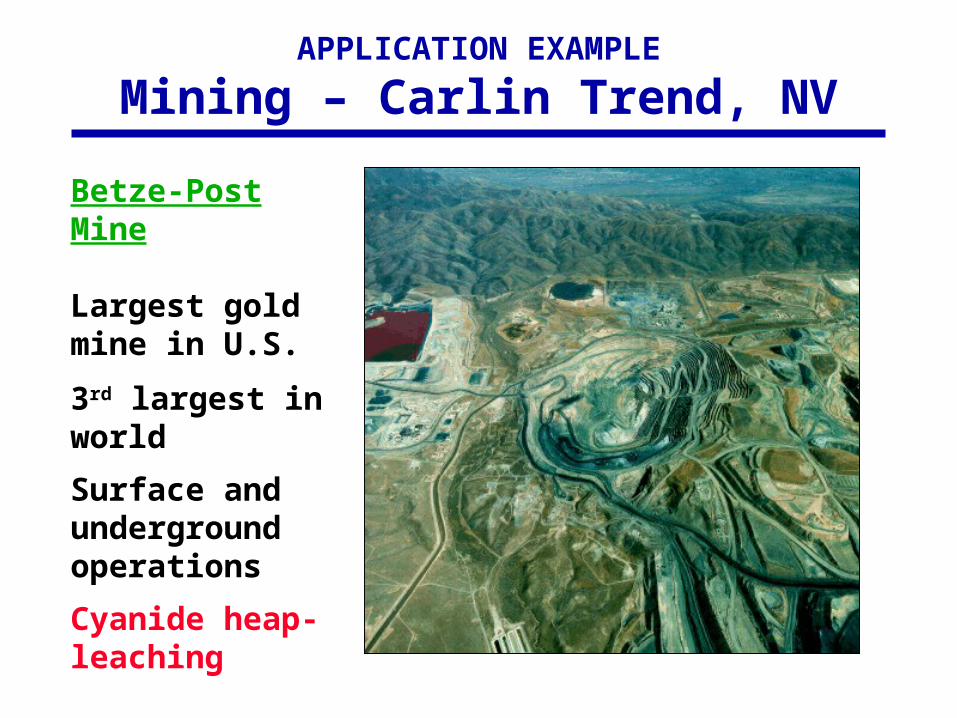
Mining – Carlin Trend, NV
Betze-Post Mine
Largest gold mine in U.S.
3rd largest in world
Surface and underground operations
Cyanide heap-leaching

Betze-Post gold mine
2 years after surface ore discovery (Post deposit)
Total surface area impact:3,226 acres
1984

Betze-Post gold mine
4 years after acquisition by Barrick and discovery of Betze deposit
Total surface area impact6,812 acres512 acres/yr
1991

Betze-Post gold mine
4 years after Barrick opens underground Meikle deposit
Total surface area impact14,036 acres803 acres/yr
2000

1984

2000

What if?
San Francisco

Hmmm…
20 years after gold is discovered in Mission District
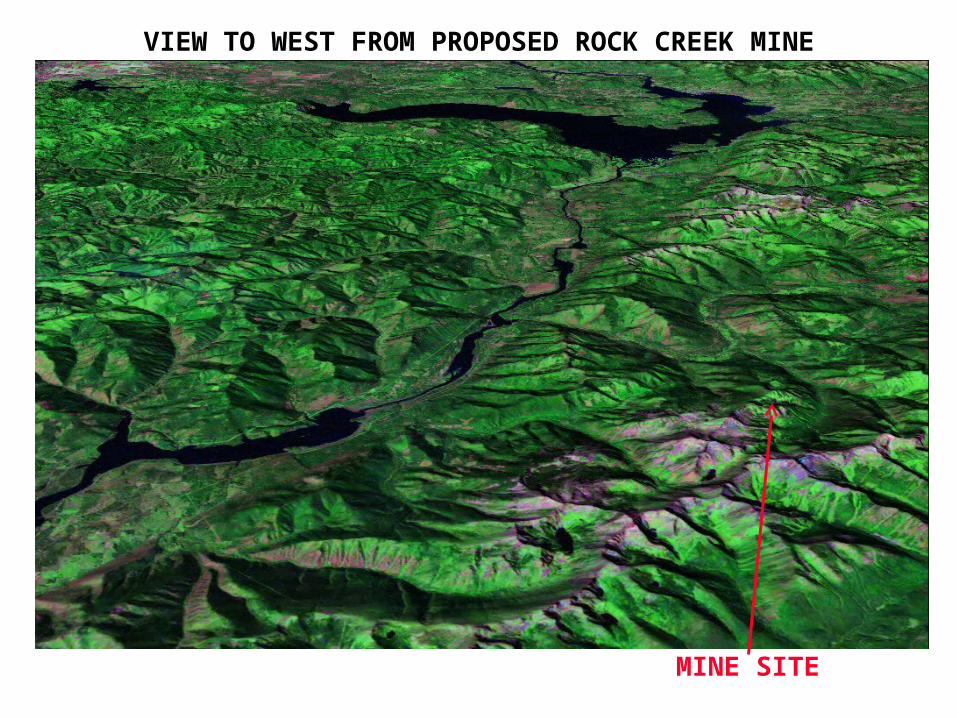
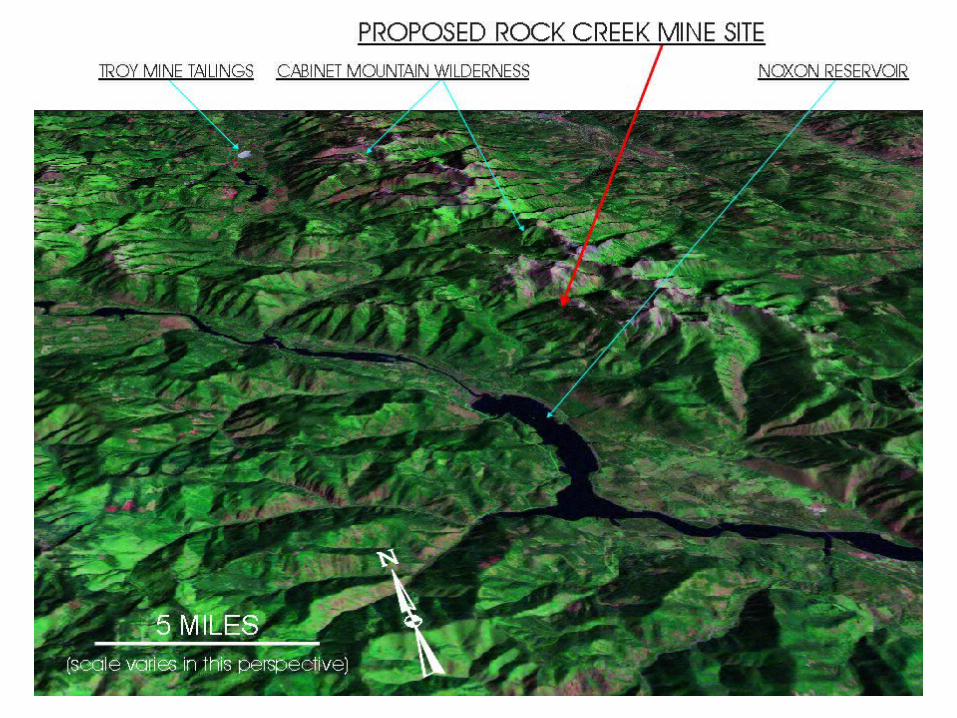
MINE SITE
VIEW TO WEST FROM PROPOSED ROCK CREEK MINE

WHAT IF…? CARLIN-SIZED MINING COMPLEX

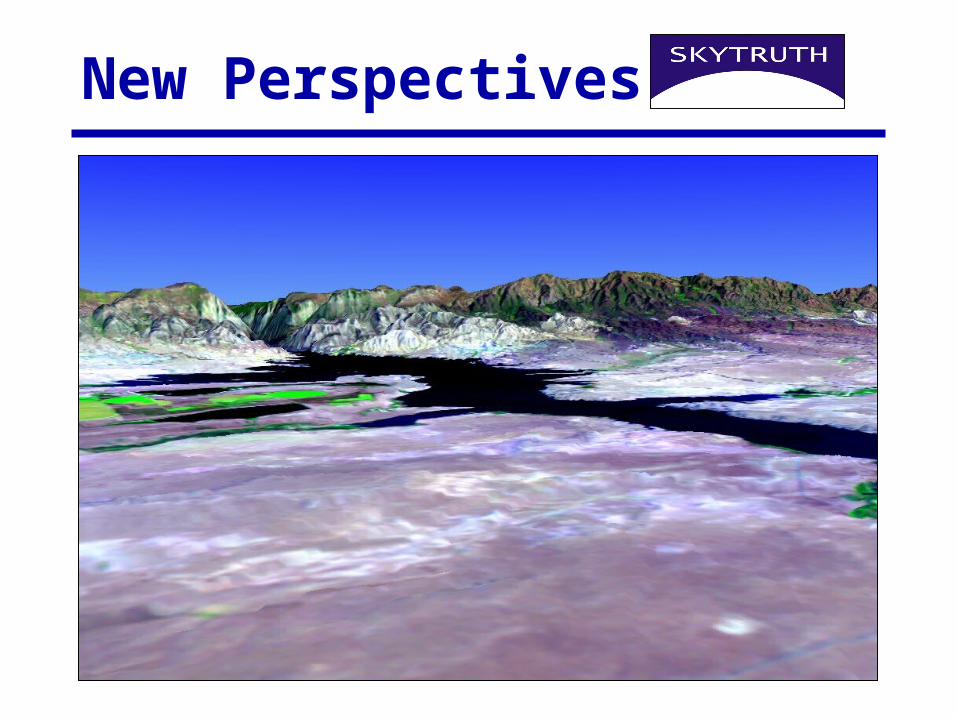
New Perspectives