Presented by Rita Serotkin, Nicole Cornett Arnold, Carrie Moran, Sharna Newton, & Ferris Wilkins...
22
EDUCATING THE 75%: THE IMPORTANCE, NEEDS AND DIFFICULTIES OF ADULT DEGREE PROGRAMS AND THEIR STUDENTS Presented by Rita Serotkin, Nicole Cornett Arnold, Carrie Moran, Sharna Newton, & Ferris Wilkins February 22, 2012 Durham, NC
-
Upload
jacqueline-foulk -
Category
Documents
-
view
214 -
download
0
Transcript of Presented by Rita Serotkin, Nicole Cornett Arnold, Carrie Moran, Sharna Newton, & Ferris Wilkins...

EDUCATING THE 75%: THE IMPORTANCE, NEEDS AND
DIFFICULTIES OF ADULT DEGREE PROGRAMS AND THEIR
STUDENTS
Presented by Rita Serotkin, Nicole Cornett Arnold, Carrie Moran, Sharna Newton, &
Ferris Wilkins
February 22, 2012Durham, NC
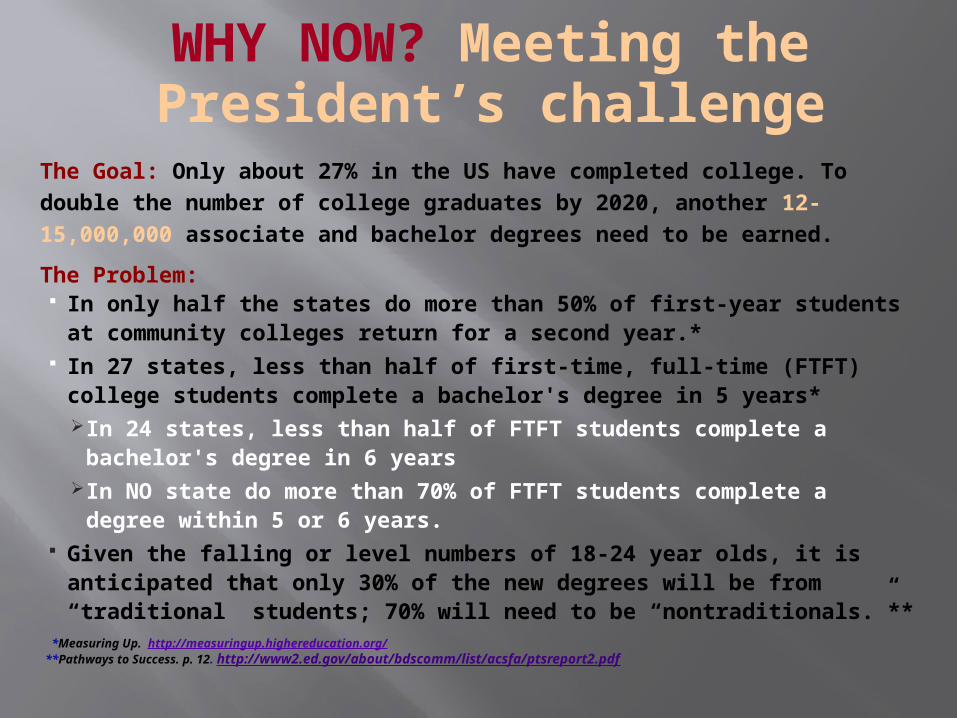
WHY NOW? Meeting the President’s challenge
The Goal: Only about 27% in the US have completed college. To double the
number of college graduates by 2020, another 12-15,000,000 associate and
bachelor degrees need to be earned.
The Problem: In only half the states do more than 50% of first-year students at
community colleges return for a second year.* In 27 states, less than half of first-time, full-time (FTFT) college students
complete a bachelor's degree in 5 years* In 24 states, less than half of FTFT students complete a bachelor's
degree in 6 years In NO state do more than 70% of FTFT students complete a degree
within 5 or 6 years. Given the falling or level numbers of 18-24 year olds, it is anticipated
that only 30% of the new degrees will be from “traditional” students; 70% will need to be “nontraditionals.”**
*Measuring Up. http://measuringup.highereducation.org/**Pathways to Success. p. 12. http://www2.ed.gov/about/bdscomm/list/acsfa/ptsreport2.pdf

SIX-YEAR GRADUATION RATES OF BACHELOR'S STUDENTS -
2009
“In only a few states do large majorities of first-time, full-time students graduate from four-year institutions within five or six years…[but]…in no state do more than 70% of students complete a degree within five or six years of enrollment.”Downloaded 2/19/2012 from NCHEMS Information Center website: http://www.higheredinfo.org/dbrowser/index.php?submeasure=27&year=2009&level=nation&mode=map&state=0
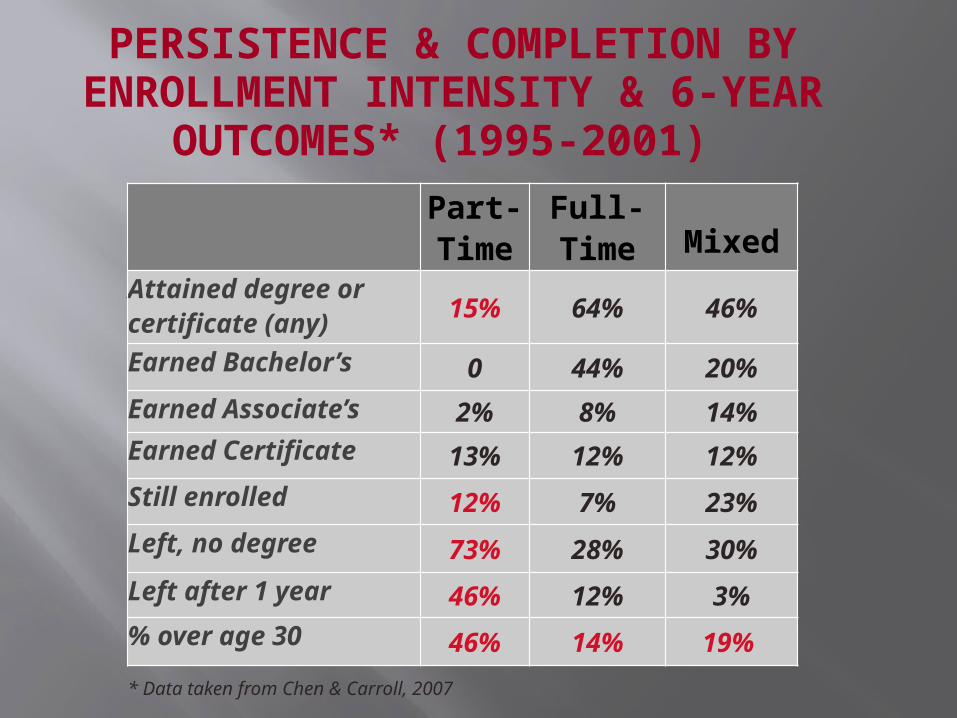
PERSISTENCE & COMPLETION BY ENROLLMENT INTENSITY & 6-YEAR
OUTCOMES* (1995-2001)
Part-Time
Full-Time Mixed
Attained degree or certificate (any) 15% 64% 46%
Earned Bachelor’s 0 44% 20%
Earned Associate’s 2% 8% 14%Earned Certificate 13% 12% 12%
Still enrolled 12% 7% 23%
Left, no degree 73% 28% 30%
Left after 1 year 46% 12% 3%% over age 30 46% 14% 19%
* Data taken from Chen & Carroll, 2007

PERSISTENCE & ACHIEVEMENT: NC compared to top states
NCTop States
in US% of population with less than a high school diploma 18% 16%
% of population with bachelor’s degree or higher 27% 35%
1st year community college student persistence to year 2 49% 63%
1st year 4-yr student persistence to year 2 80% 83%
1st-time, full-time students completing bachelor’s degree within 5 years of starting 57% 66%
1st –time full-time students completing bachelor’s degree within 6 years of starting 59% 68%
Data Downloaded from http://measuringup.highereducation.org Data Downloaded from: http://www.census.gov/compendia/statab/cats/education.html andDownloaded from: http://nces.ed.gov/programs/digest/d10/tables/dt10_011.asp D2/19/12

Students age 25+ increased from 28% to 41% between 1970 and 1998 and now make up 47% of all new and returning students on many campuses (Association for Nontraditional Students in Higher Education ).
6.8 million college students are age 25 or older and 3.74 million are first-generation students (NCES, 2007)
Students age 35+ in degree-granting institutions increased from ~823,000 to ~2.9 million between 1970 and 2001 — doubling from 9.6% of total students to 19.2% (NCES).
“Quite simply, states cannot reach the target of having 60 percent of the adult population earn some type of college degree…by 2025 without a major commitment to increasing college completion among these students.” (Spence, p. 13)
ADULT STUDENTS: An increasingly critical population
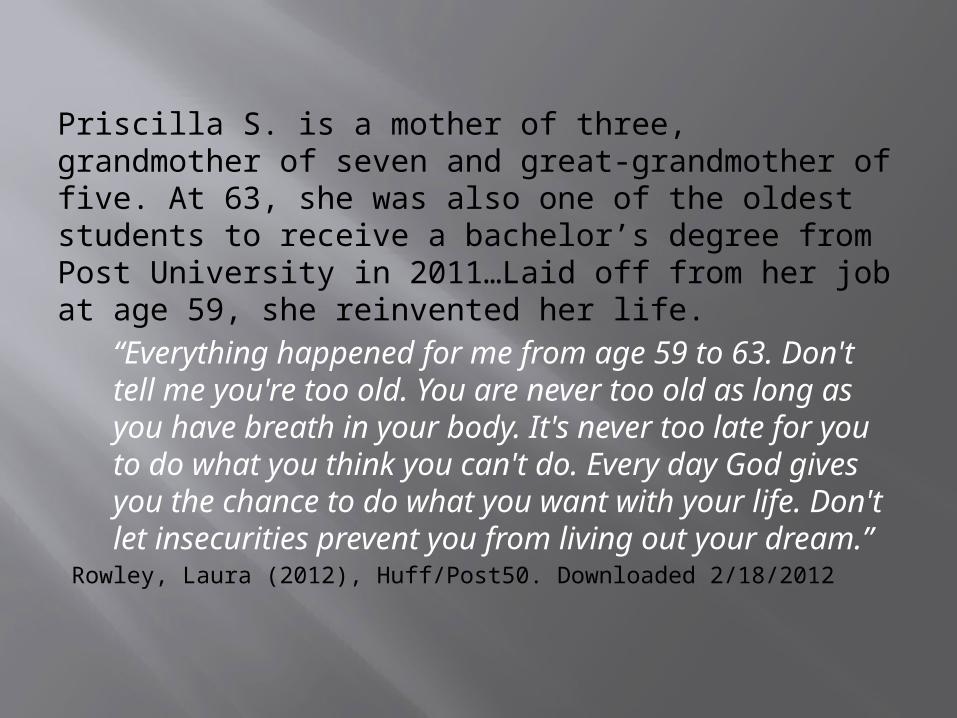
Priscilla S. is a mother of three, grandmother of seven and great-grandmother of five. At 63, she was also one of the oldest students to receive a bachelor’s degree from Post University in 2011…Laid off from her job at age 59, she reinvented her life.
“Everything happened for me from age 59 to 63. Don't tell me you're too old. You are never too old as long as you have breath in your body. It's never too late for you to do what you think you can't do. Every day God gives you the chance to do what you want with your life. Don't let insecurities prevent you from living out your dream.”
Rowley, Laura (2012), Huff/Post50. Downloaded 2/18/2012

WHO ARE THEY & HOW DO THEY DIFFER FROM TRADITIONAL-AGE
STUDENTS?* Demographic Adult Traditional
Have families 44% 2%
Low income 30% 2%
Single parents 20% 7%
Minority 14% 10%
First generation 52% 29%
Work >30 hrs/wk 54% 33%
Certificate or 2-year 56% 34%
BA enrollment 29% 55%
For-profit programs 11% 5%
Full-time study 39% 60%*Data taken from Horn & Carroll, 2005

NCES AT-RISK CHARACTERISTICS: Define most nontraditional & adult students!
Delayed enrollment in college Attend part-time and often “stop out” Are financially independent of parents Work full-time while enrolled Have dependents other than a spouse Are single parents Lack a standard high school diploma First-generation college students
Pathways to Success. p. 3. http://www2.ed.gov/about/bdscomm/list/acsfa/ptsreport2.pdf

BARRIERS TO ACCESS*Situational Institutional Dispositional
Financial/Cost/ Lack of aid
Academic program requirements
Lack of confidence/self-esteem
Lack of time Lack of articulation of transfer credits
Unfamiliarity with academic world
Family/work Responsibilities
Class schedules Anxiety/fear of failure
Family attitude/ support
Institutional complexity/ bureaucratic procedures
Worry over conflicting responsibilities
Medical/health Issues
Lack of interest/value of nontraditional students
Learning differences/ poor prior educational experiences
*Classification of barriers developed by Cross (1981).
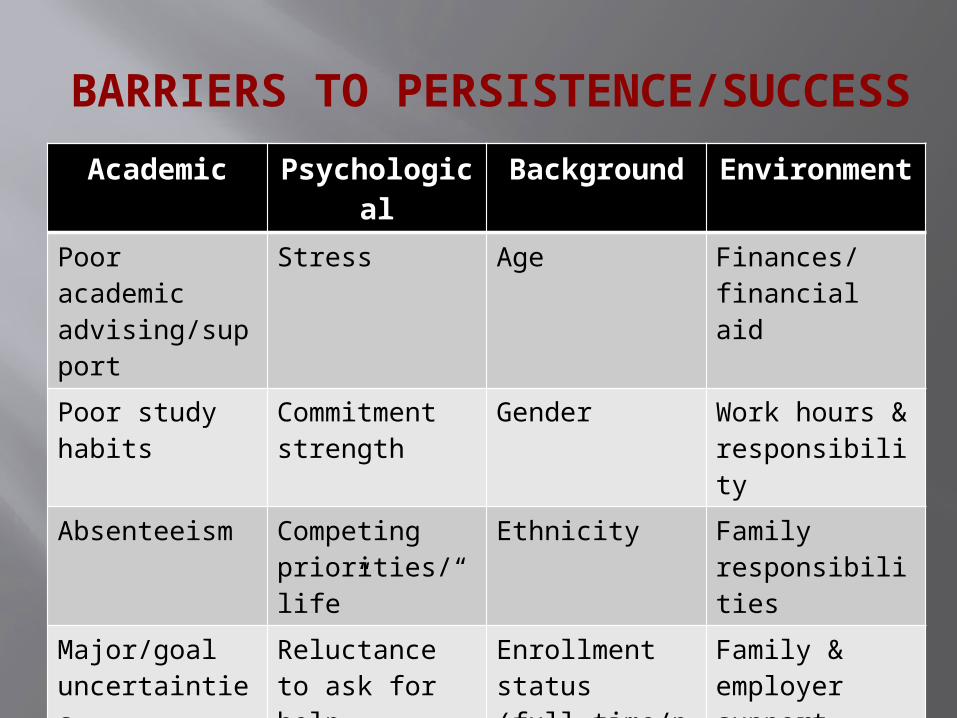
BARRIERS TO PERSISTENCE/SUCCESS
Academic Psychological Background Environment
Poor academic advising/support
Stress Age Finances/ financial aid
Poor study habits
Commitment strength
Gender Work hours & responsibility
Absenteeism Competing priorities/“life”
Ethnicity Family responsibilities
Major/goal uncertainties
Reluctance to ask for help
Enrollment status (full-time/part-time)
Family & employer support
Course availability
Time management
Socioeconomic status
Transportation
Poor GPA Health Issues Dependents Child Care

GUILFORD CENTER FOR CONTINUING
EDUCATION (CCE): A case apart
Experienced. Oldest program for adults in NC (since 1953).
Dedicated to adults. Support services, advisement, financial aid, & an SGA, all housed in one building
Flexible Scheduling. Day, evening, & weekend classes. More than 80% of CCE students work, yet 67% maintain a full-time load attending just 2 nights a week.
Generous transfer policy. 90% have transfer credit.
Financial Aid. 67% Pell eligible; 84% receive federal aid.
Unique. Focused on personal contact and connection.
Recognized. Enrollment increased from 275 in 2002 to 1,300 in 2011-2012. Graduation rates as high as 58%.

CCE STUDENT DEMOGRAPHICS
Female Male
67%33%
Transfer Readmits Unclassified New
57% 29% 10% 4%
Average Age 35 yrs Average # of Transfer Credits 49
Single Married Divorced/ Widowed First – Generation
49%36%14%
67%
Top 4 Transfer Colleges GTCC NC A&T UNCG Rockingham CC
35%6%5%5%
Employed Unemployed
72%28%
In State In-County (Guilford)
98% 72%
Caucasian People of Color
53%47%
Satisfied with Guilford & CCE Plan to graduate from Guilford Have declared a major
94% 97% 94%
.

CURRENT BEST PRACTICES FOR ADULT STUDENTS: Access
Publicity Online and media outreach Images of adult students Public information sessions
& open house events Recruitment through
employers, agencies, education & job fairs
Express Admissions Fridays
Calls always answered
Ease of Applying Online information &
application 5-minute application Transcripts requested No SAT/ACT Veterans liaison/
admissions counselor Day and evening
admission & financial aid appointments
Transfer evaluations

CURRENT BEST PRACTICES FOR ADULT STUDENT SUCCESS: Structural
Dedicated Facility for Adults Lounge Computers Canteen Day & evening hours of advisors, mentors, tutors Coordinated administrative functions and evening hours Adult student activities and family-friendly social events
Convenient Parking
Classes & Scheduling Small Class Size ▪ Year–round admission Flexible Class Schedules ▪ Year-round classes Full-time study leads to financial aid eligibility

CURRENT BEST PRACTICES FOR ADULT STUDENT SUCCESS: Programs
Summer Bridge programs
All-in-one Check-in Day
New Student Orientation
Adult Transitions class Gateways to Success
class
Learning Strategies class
Full summer schedule
Mentoring program
Student Success Workshops
Online and hybrid class pilot tests

CURRENT BEST PRACTICES FOR ADULT STUDENT SUCCESS: Resources
First registration with
program advisement/
explanation
GPS binder at registration
Adult Student Government
Association & activities
Assigned financial aid
advisors
Dedicated faculty
Faculty advisors
Learning Commons—
tutoring, support services
Support person
Office for Student SuccessOutreach to faculty and at-
risk students
Tracking/intervention
Referral to on/off campus
resources

CCE STUDENT PERSISTENCESpring to Fall Fall to Spring
2011-2012 75% 84%
2010-2011 74% 84%
2009-2010 74% 86%
2008-2009 74% 84%
2007-2008 71% 80%
2006-2007 71% 81%
2005-2006 76% 80%
2004-2005 75% 81%
2003-2004 74% 84%
2002-2003 75% 82%
2001-2002 71% 72%

Sharna Newton ‘08
Cheryl Brooks Poole ‘11
Carmisha Wright ‘12
MEET OUR STUDENTS

REFERENCES & RESOURCES
Advisory Committee on Student Financial Assistance (2012). Pathways to Success: Integrating learning with life and work to increase national college completion. Washington, DC: A Report to the U.S. Congress and Secretary of Education. Downloaded from: http://www2.ed.gov/about/bdscomm/list/acsfa/ptsreport2.pdf
Berkner, L, et. al. (2007). Persistence and attainment of 2003-2004 beginning postsecondary students: After three years. Washington, DC: National Center for Education Statistics.
Chen, X. & Carroll, C.D. (2007). Part-time undergraduates in
postsecondary education 2003-2004. Washington, DC: National Center for Education Statistics.
Complete College America (2011). Time is the enemy. Washington, DC: Complete College America Alliance of States. This and other reports available at: http://www.completecollege.org.
Cross, K. P. 1981 Adults as Learners: Increasing participation and facilitating learning. San Francisco: Jossey-Bass.
Day, J. C and Newburger, E. E. (2002). The Big Payoff: Educational Attainment and Synthetic Estimates of Work-Life Earnings. Washington, DC: U.S. Census Bureau. Downloaded at: http://www.census.gov/prod.2002pubs/p23-210.pdf
DeAngelo, L., et al. (2011). Completing College: Assessing graduation rates at four-year institutions. Los Angeles: Higher Education Research Institute, UCLA.
Horn, L., Cataldi, E.F., Carroll, C.D. (2005). Waiting to attend: Undergraduates who delay their postsecondary enrollment.
Washington, DC: National Center for Education Statistics.
Pusser, B., et. al. (2007). Returning to learning: Adults’ success in college is key to American’s future. Indianapolis: Lumina Foundation.
Measuring Up 2002: The state-by-state report card for higher education. San Jose, CA: National Center for Public Policy and Higher Education. Downloaded from: http://measuringup.highereducation.org/
References & Resources (cont’d)

References & Resources (cont’d)
Measuring Up 2008: The national report card on higher education. San Jose, CA: National Center for Public Policy and Higher Education. Downloaded from: http://measuringup.highereducation.org/
National Center for Educational Statistics. http://ies.ed.gov/
National Center for Higher Education Management Systems. Graduation Rates-2009. Downloaded from: http://www.higheredinfo.org/dbrowser/index.php?submeasure=27&year=2009&level=nation&mode=map&state=0
Spence, D., et al. (2010). No Time to Waste: Policy recommendations for increasing college completion. Atlanta: Southern Regional Education Board. Downloaded from: http://publications.sreb.org/2010/10E10_No_Time_to_Waste.pdf
US Census Bureau 2012 Statistical Abstract http://www.census.gov/compendia/statab/cats/education.html
http://www.higheredinfo.org/dbrowser/index.php?submeasure=27&year=2009&level=nation&mode=map&state=0