Presented by: Elliot F. Eisenberg, Ph.D. September 25, 2012 Williston, ND THE LOCAL AREA IMPACT OF...
33
Presented by: Elliot F. Eisenberg, Ph.D. September 25, 2012 Williston, ND THE LOCAL AREA IMPACT OF HOME BUILDING IN WILLIAMS, COUNTY NORTH DAKOTA
-
Upload
marvin-goodwin -
Category
Documents
-
view
214 -
download
0
Transcript of Presented by: Elliot F. Eisenberg, Ph.D. September 25, 2012 Williston, ND THE LOCAL AREA IMPACT OF...
Presented by: Elliot F. Eisenberg, Ph.D.
September 25, 2012Williston, ND
THE LOCAL AREA IMPACT OF HOME BUILDING IN WILLIAMS,
COUNTY NORTH DAKOTA
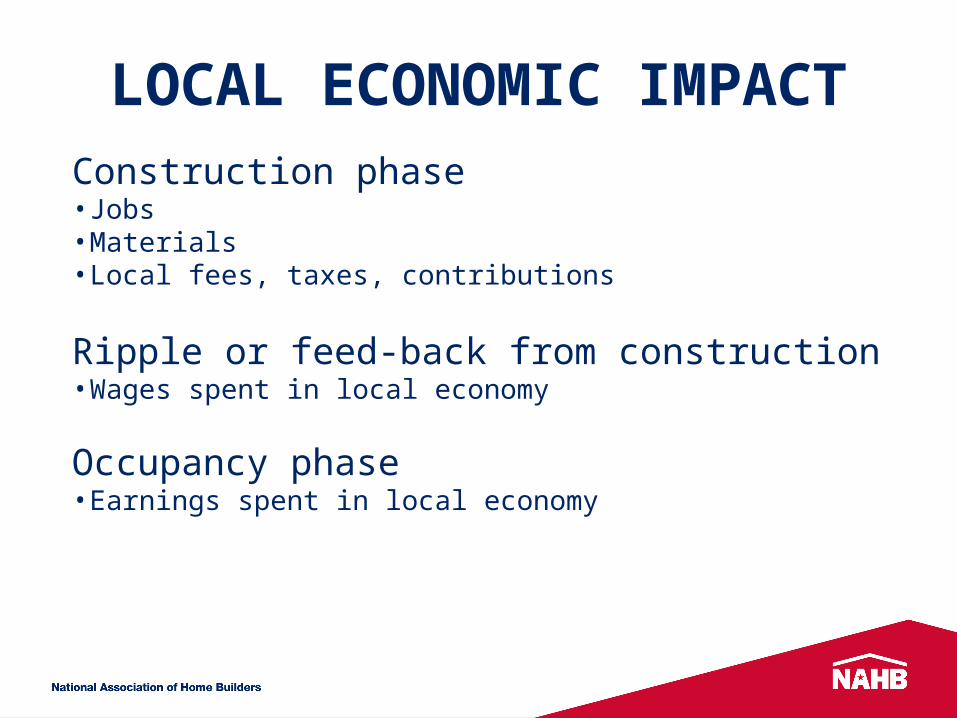
LOCAL ECONOMIC IMPACTConstruction phase
• Jobs• Materials• Local fees, taxes, contributions
Ripple or feed-back from construction• Wages spent in local economy
Occupancy phase• Earnings spent in local economy
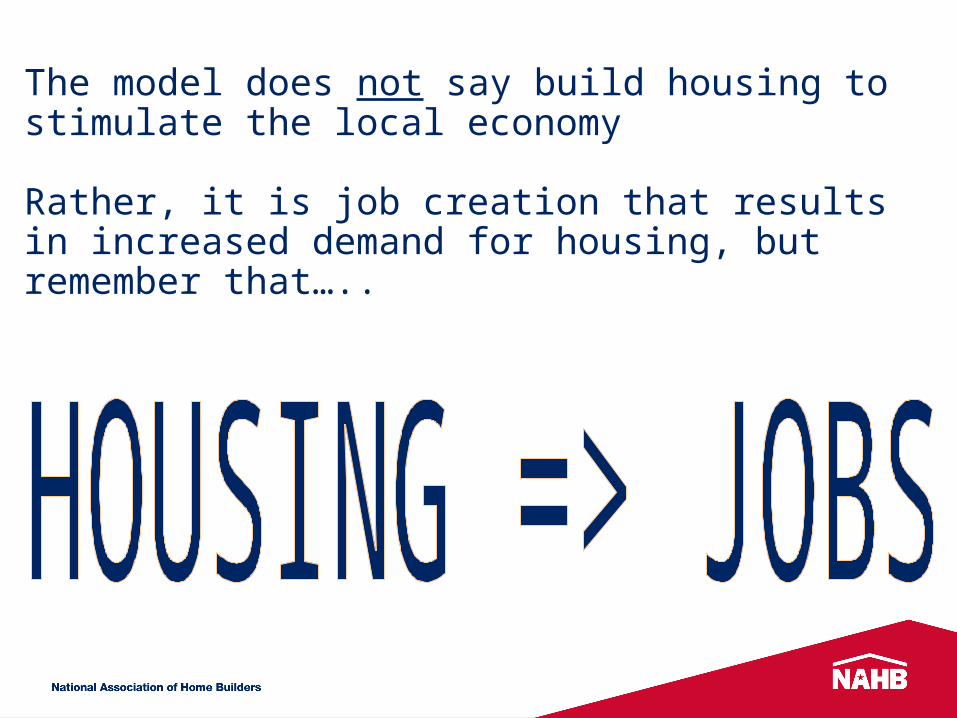
The model does not say build housing to stimulate the local economy
Rather, it is job creation that results in increased demand for housing, but remember that…..
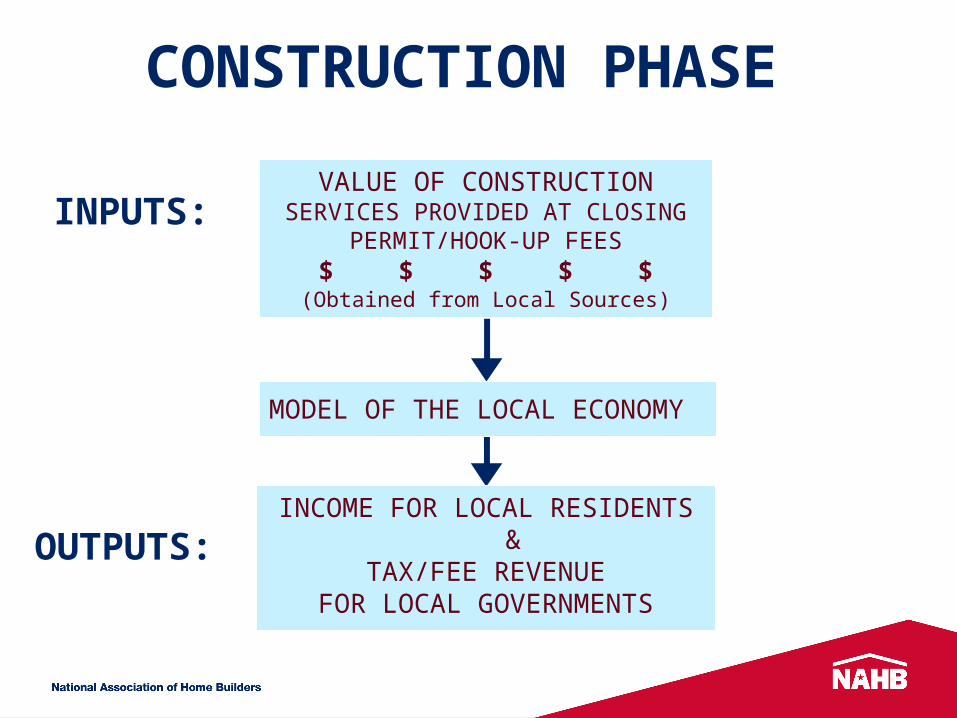
CONSTRUCTION PHASE
INPUTS:
OUTPUTS:
MODEL OF THE LOCAL
ECONOMY
INCOME FOR LOCAL RESIDENTS &
TAX/FEE REVENUEFOR LOCAL GOVERNMENTS
VALUE OF CONSTRUCTIONSERVICES PROVIDED AT CLOSING
PERMIT/HOOK-UP FEES$ $ $ $ $
(Obtained from Local Sources)
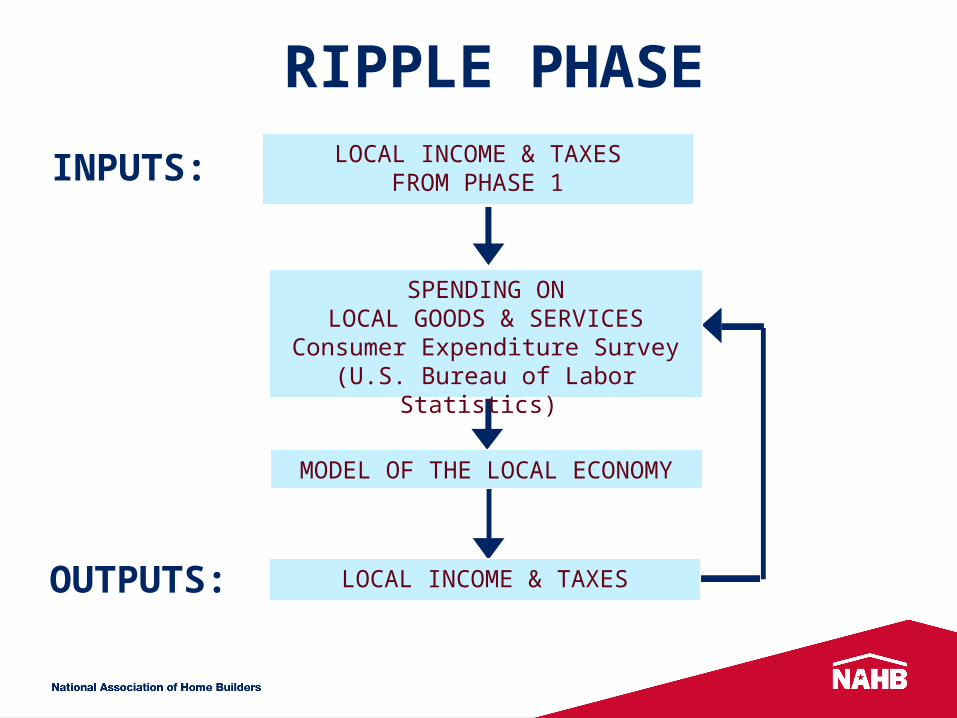
RIPPLE PHASE
INPUTS:
OUTPUTS: LOCAL INCOME & TAXES
MODEL OF THE LOCAL ECONOMY
LOCAL INCOME & TAXESFROM PHASE 1
SPENDING ONLOCAL GOODS & SERVICESConsumer Expenditure Survey
(U.S. Bureau of Labor Statistics)
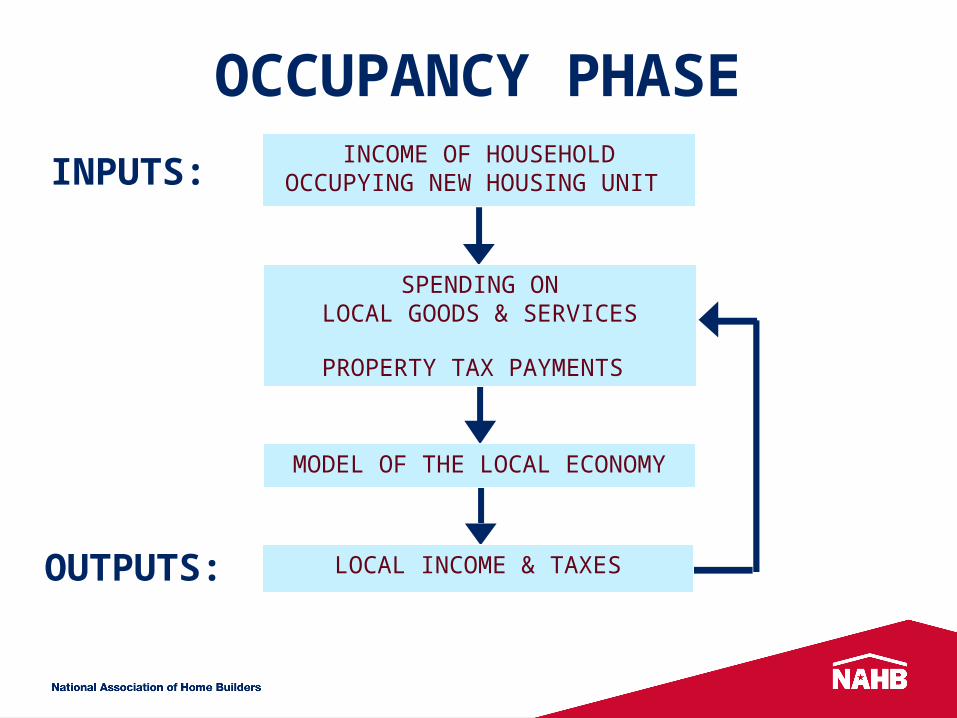
OCCUPANCY PHASE
INPUTS:
OUTPUTS:
MODEL OF THE LOCAL ECONOMY
LOCAL INCOME & TAXES
SPENDING ONLOCAL GOODS & SERVICES
PROPERTY TAX PAYMENTS
INCOME OF HOUSEHOLDOCCUPYING NEW HOUSING UNIT
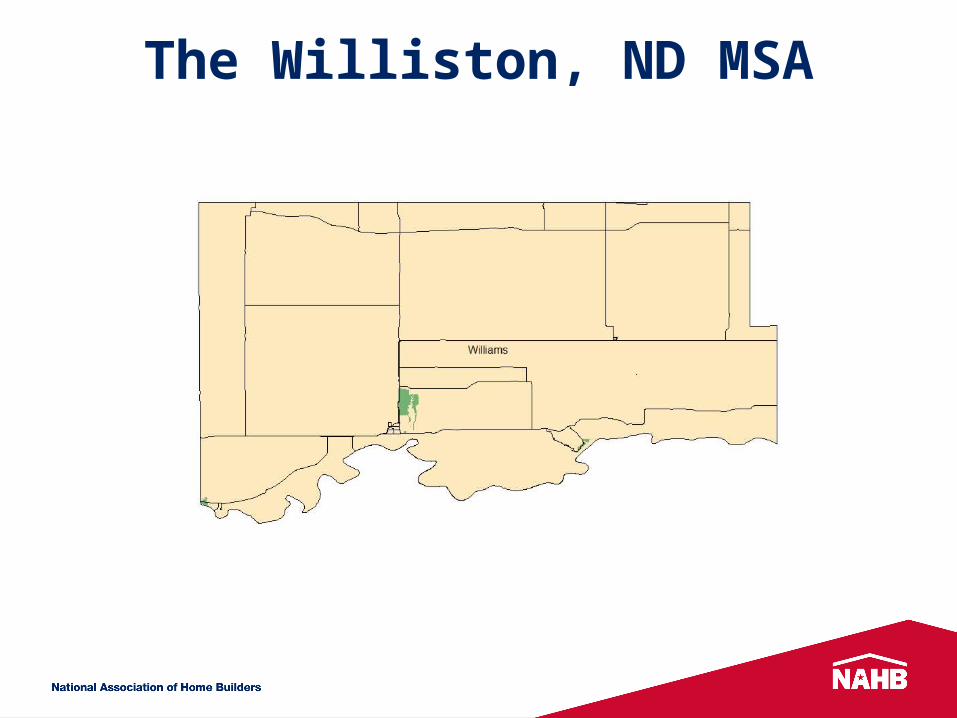
The Williston, ND MSA
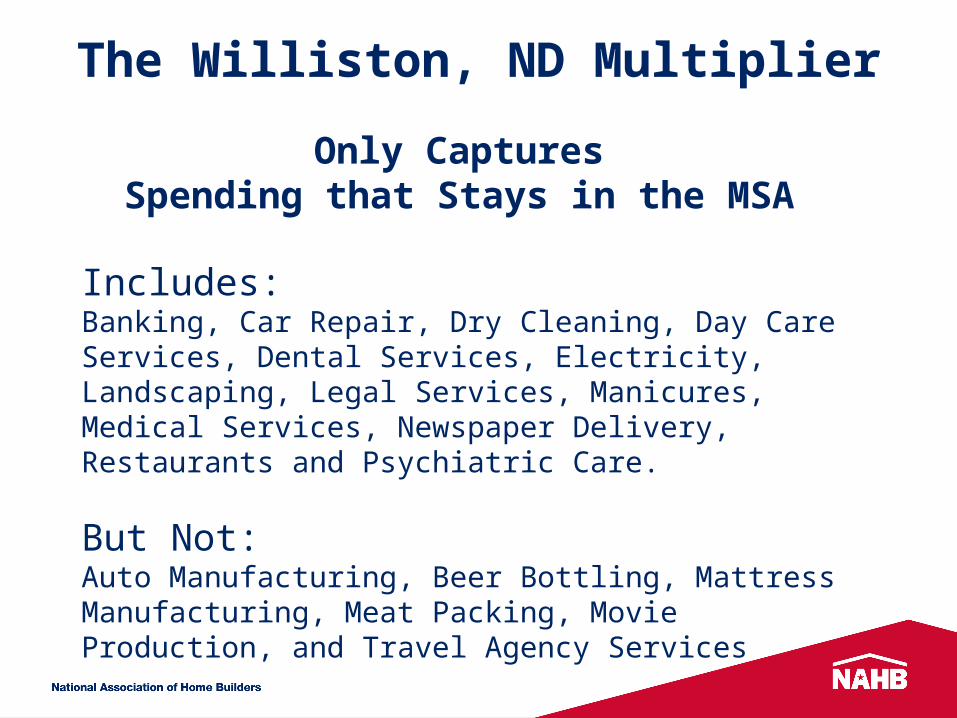
The Williston, ND Multiplier
Only CapturesSpending that Stays in the MSA
Includes:Banking, Car Repair, Dry Cleaning, Day Care Services, Dental Services, Electricity, Landscaping, Legal Services, Manicures, Medical Services, Newspaper Delivery, Restaurants and Psychiatric Care.
But Not:Auto Manufacturing, Beer Bottling, Mattress Manufacturing, Meat Packing, Movie Production, and Travel Agency Services
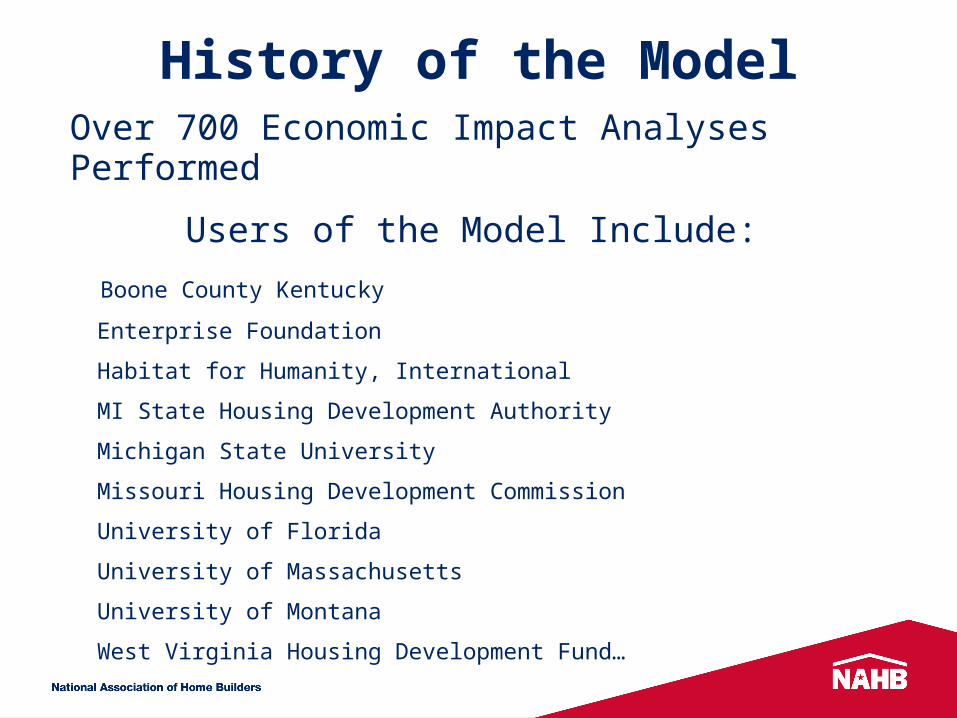
History of the ModelOver 700 Economic Impact Analyses Performed
Users of the Model Include:
Boone County Kentucky
Enterprise Foundation
Habitat for Humanity, International
MI State Housing Development Authority
Michigan State University
Missouri Housing Development Commission
University of Florida
University of Massachusetts
University of Montana
West Virginia Housing Development Fund…
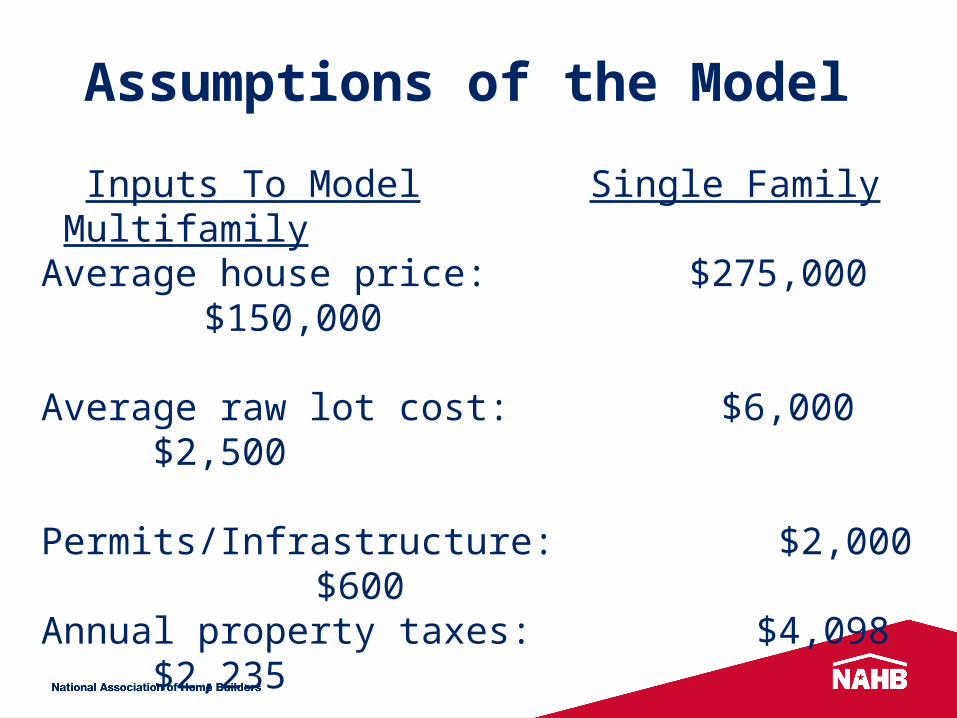
Assumptions of the Model
Inputs To Model Single Family MultifamilyAverage house price: $275,000 $150,000
Average raw lot cost: $6,000 $2,500
Permits/Infrastructure: $2,000 $600 Annual property taxes: $4,098 $2,235
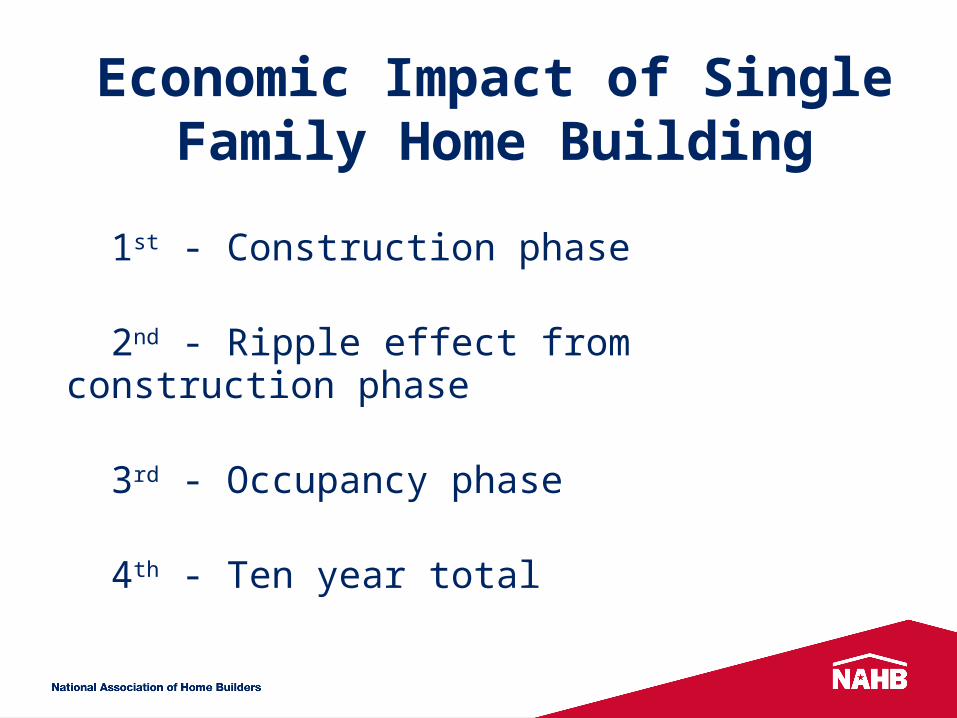
Economic Impact of Single Family Home Building
1st - Construction phase
2nd - Ripple effect from construction phase
3rd - Occupancy phase
4th - Ten year total
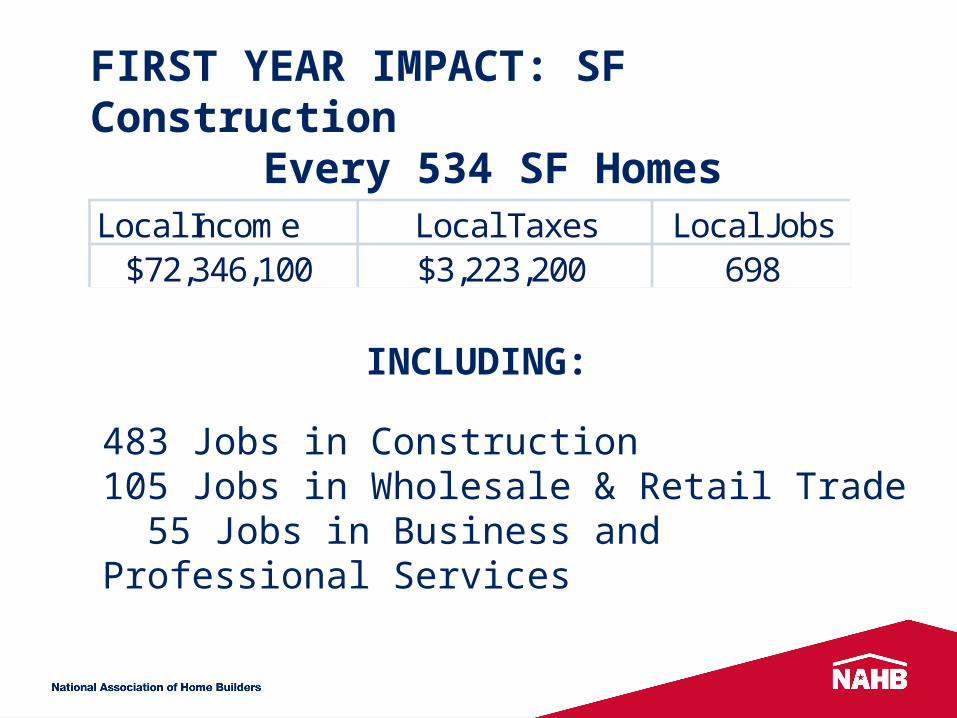
FIRST YEAR IMPACT: SF Construction
Every 534 SF Homes
INCLUDING:
483 Jobs in Construction105 Jobs in Wholesale & Retail Trade 55 Jobs in Business and Professional Services
Local Income Local Taxes Local Jobs$72,346,100 $3,223,200 698
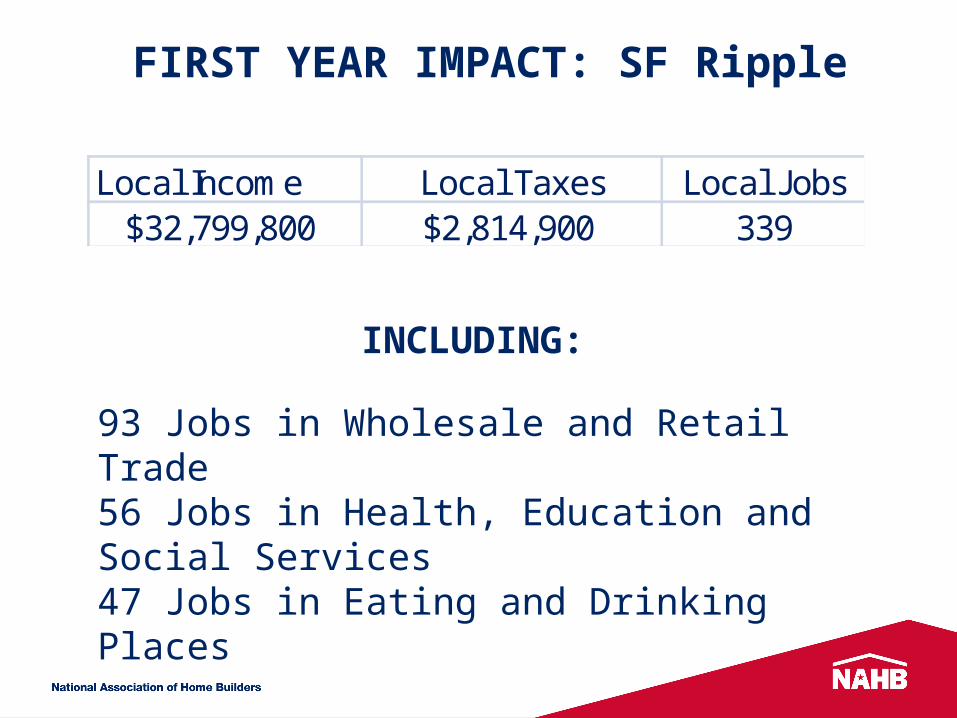
Local Income Local Taxes Local Jobs$32,799,800 $2,814,900 339
FIRST YEAR IMPACT: SF Ripple
INCLUDING:
93 Jobs in Wholesale and Retail Trade56 Jobs in Health, Education and Social Services47 Jobs in Eating and Drinking Places
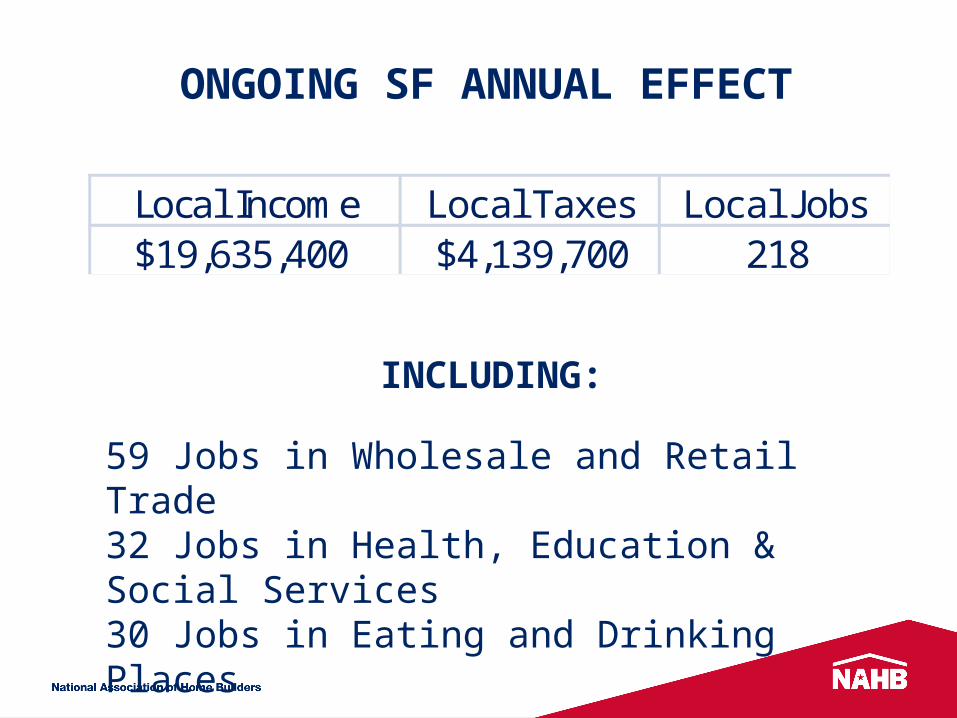
ONGOING SF ANNUAL EFFECT
Local Income Local Taxes Local Jobs$19,635,400 $4,139,700 218
INCLUDING:
59 Jobs in Wholesale and Retail Trade32 Jobs in Health, Education & Social Services 30 Jobs in Eating and Drinking Places

Total SF Impact: First Ten Years
Local Income Local Taxes
$291,682,000 $45,365,000
Along with 1,038 temporary jobs
And 218 permanent ones!
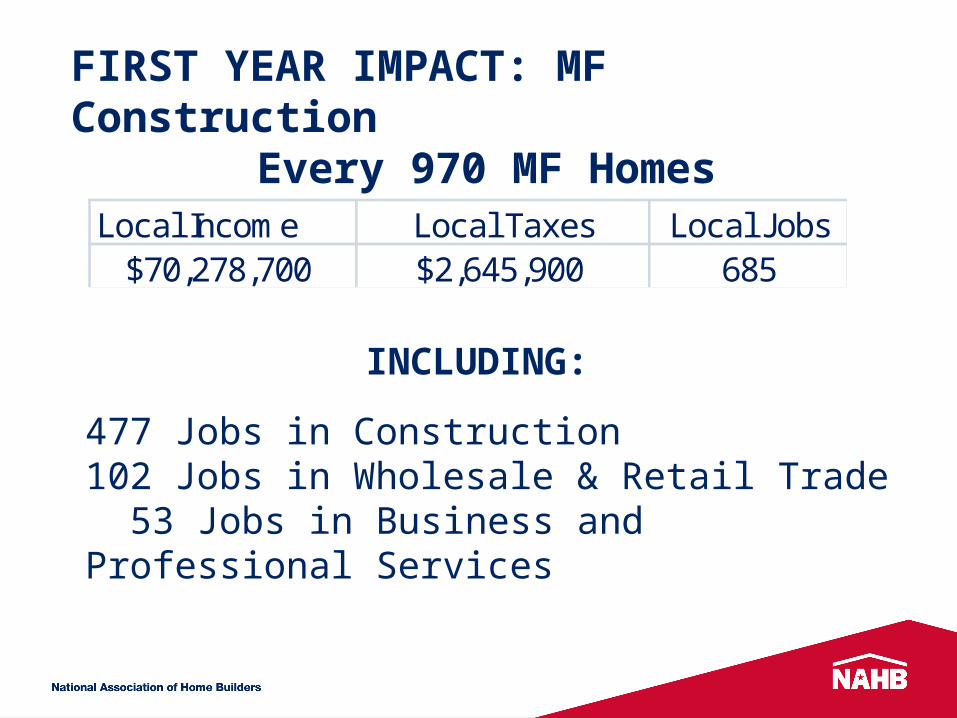
FIRST YEAR IMPACT: MF Construction
Every 970 MF Homes
INCLUDING:
477 Jobs in Construction102 Jobs in Wholesale & Retail Trade 53 Jobs in Business and Professional Services
Local Income Local Taxes Local Jobs$70,278,700 $2,645,900 685
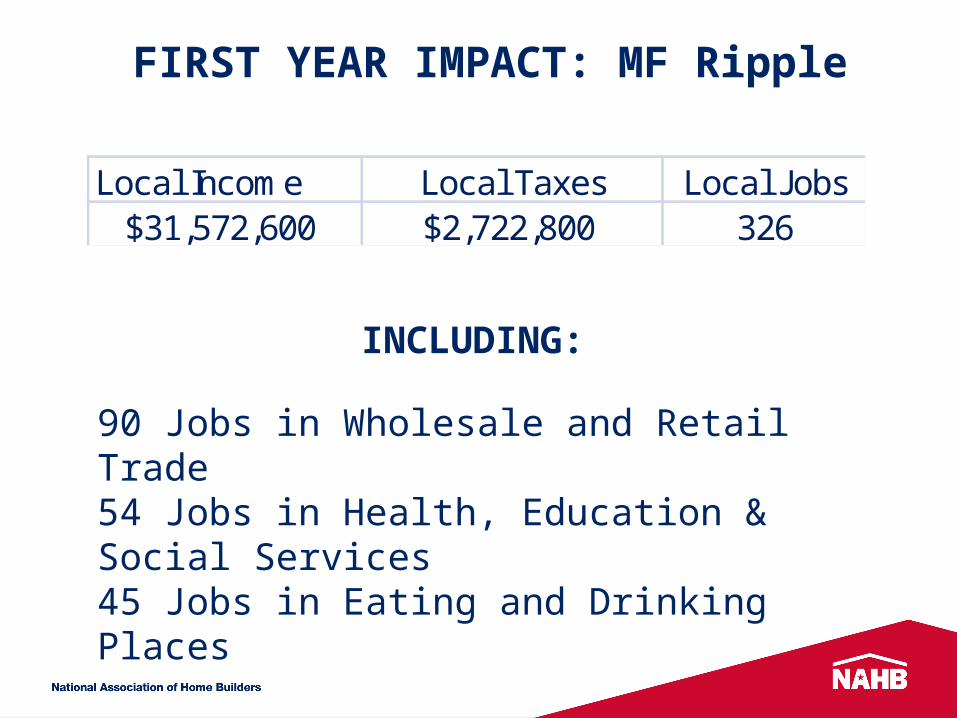
Local Income Local Taxes Local Jobs$31,572,600 $2,722,800 326
FIRST YEAR IMPACT: MF Ripple
INCLUDING:
90 Jobs in Wholesale and Retail Trade54 Jobs in Health, Education & Social Services45 Jobs in Eating and Drinking Places
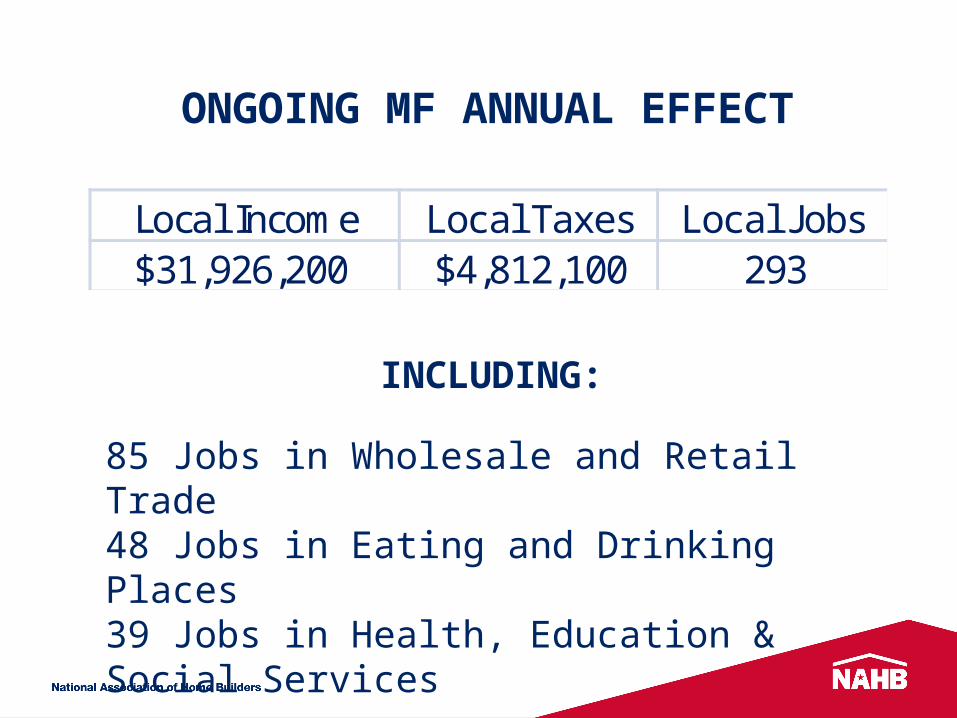
ONGOING MF ANNUAL EFFECT
Local Income Local Taxes Local Jobs$31,926,200 $4,812,100 293
INCLUDING:
85 Jobs in Wholesale and Retail Trade48 Jobs in Eating and Drinking Places39 Jobs in Health, Education & Social Services
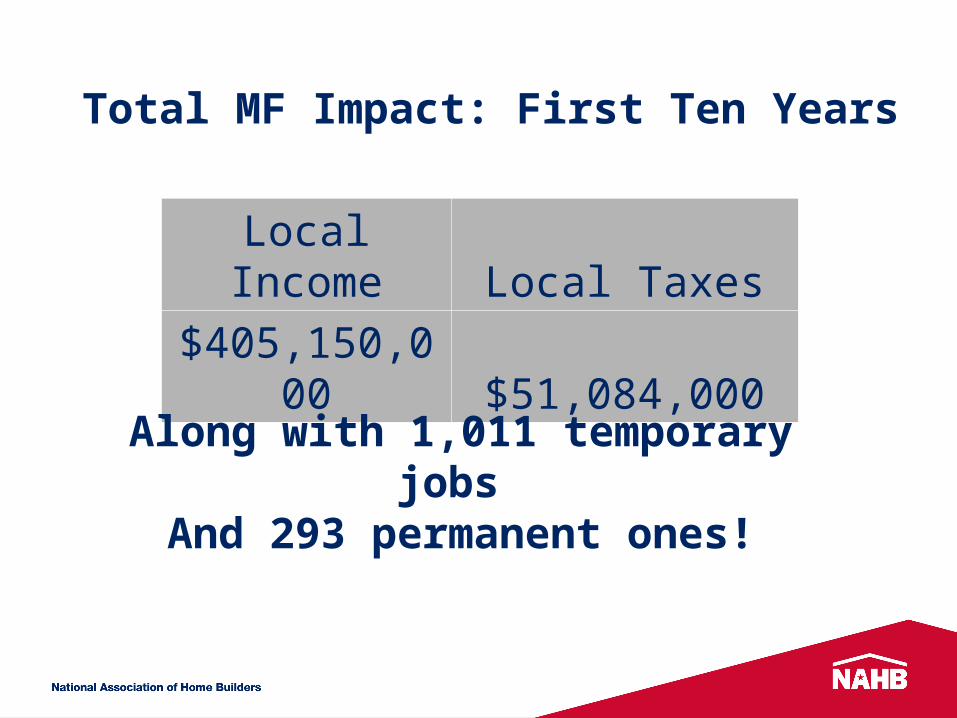
Total MF Impact: First Ten Years
Local Income Local Taxes
$405,150,000 $51,084,000
Along with 1,011 temporary jobs
And 293 permanent ones!
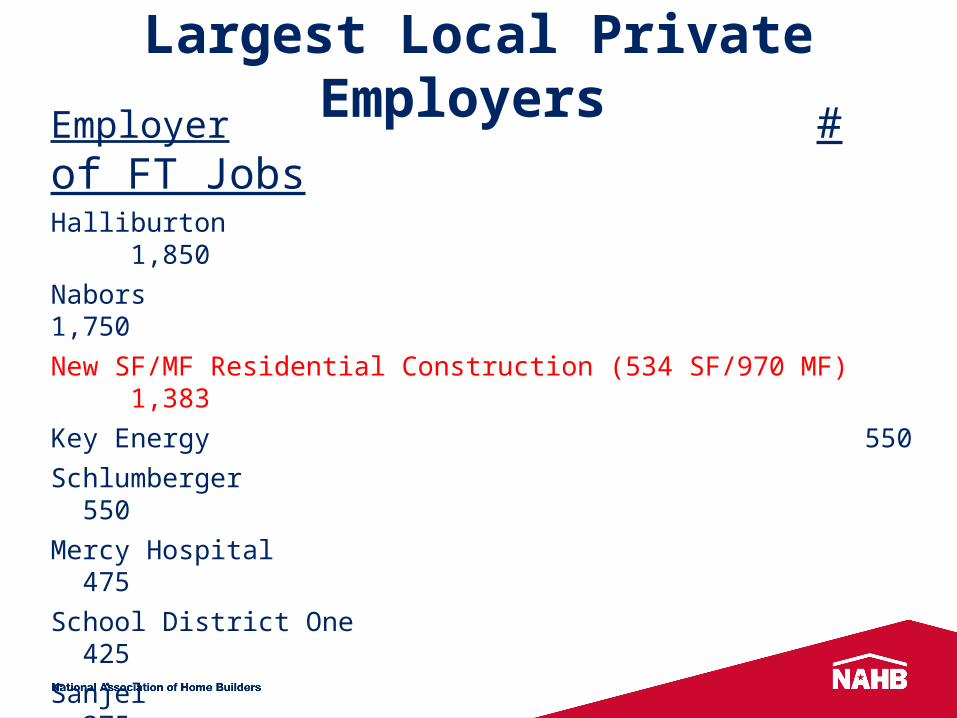
Largest Local Private Employers Employer # of FT Jobs
Halliburton 1,850
Nabors 1,750
New SF/MF Residential Construction (534 SF/970 MF) 1,383
Key Energy 550
Schlumberger 550
Mercy Hospital 475
School District One 425
Sanjel 375
Wal-Mart 350
Pioneer Drilling 260
Bethel Lutheran 250
City of Williston 180
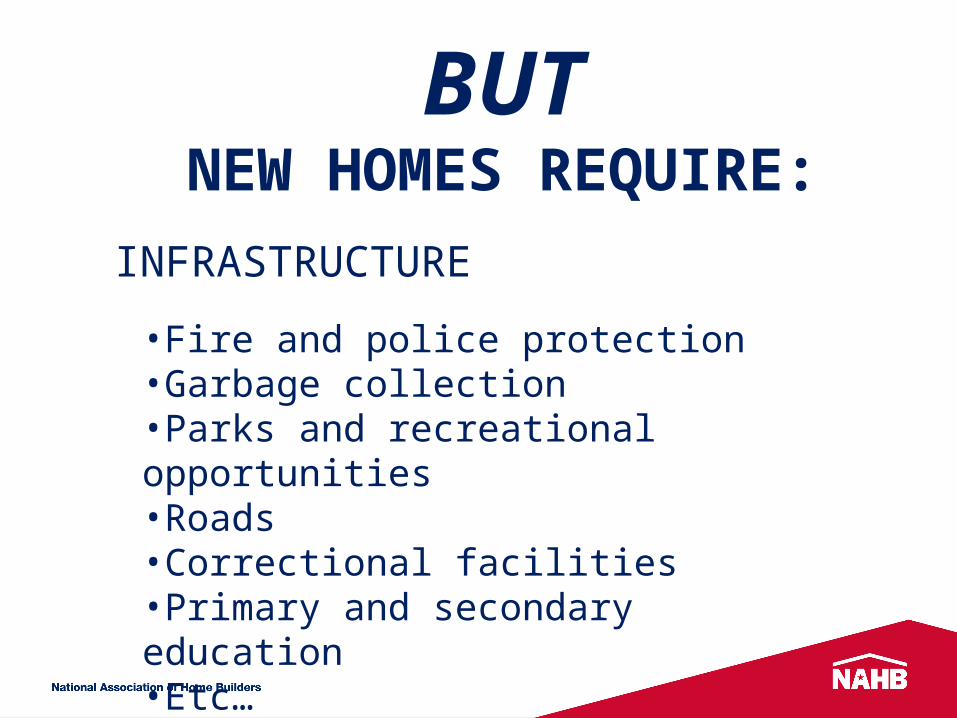
BUTNEW HOMES REQUIRE:
•Fire and police protection•Garbage collection•Parks and recreational opportunities•Roads•Correctional facilities•Primary and secondary education •Etc…
INFRASTRUCTURE
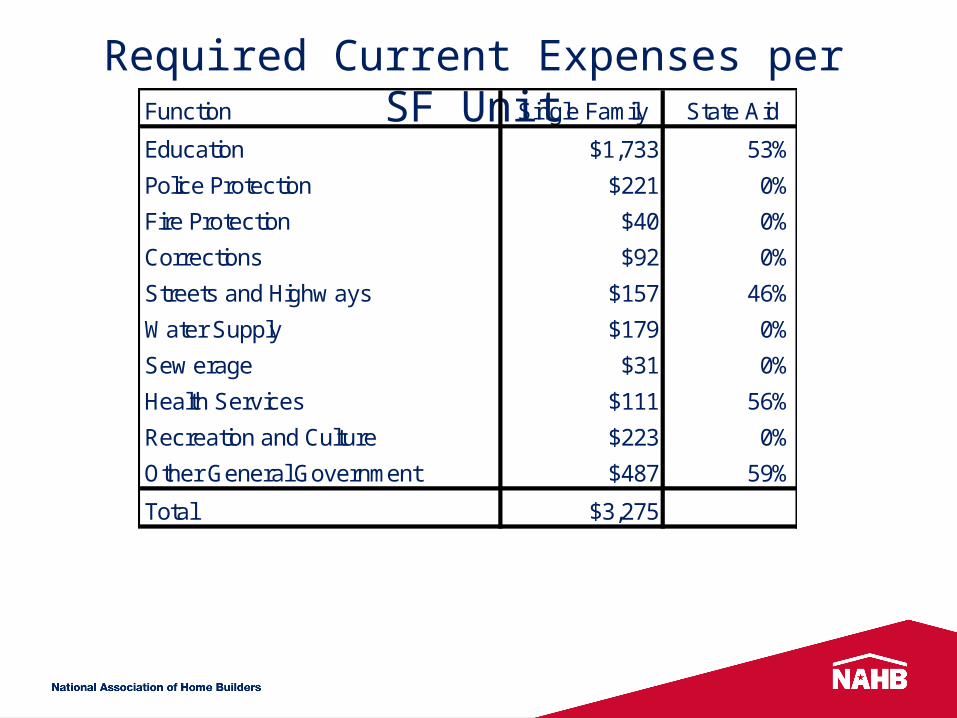
Required Current Expenses per SF UnitFunction Single Family State Aid
Education $1,733 53%
Police Protection $221 0%
Fire Protection $40 0%
Corrections $92 0%
Streets and Highw ays $157 46%
Water Supply $179 0%
Sew erage $31 0%
Health Services $111 56%
Recreation and Culture $223 0%
Other General Government $487 59%
Total $3,275
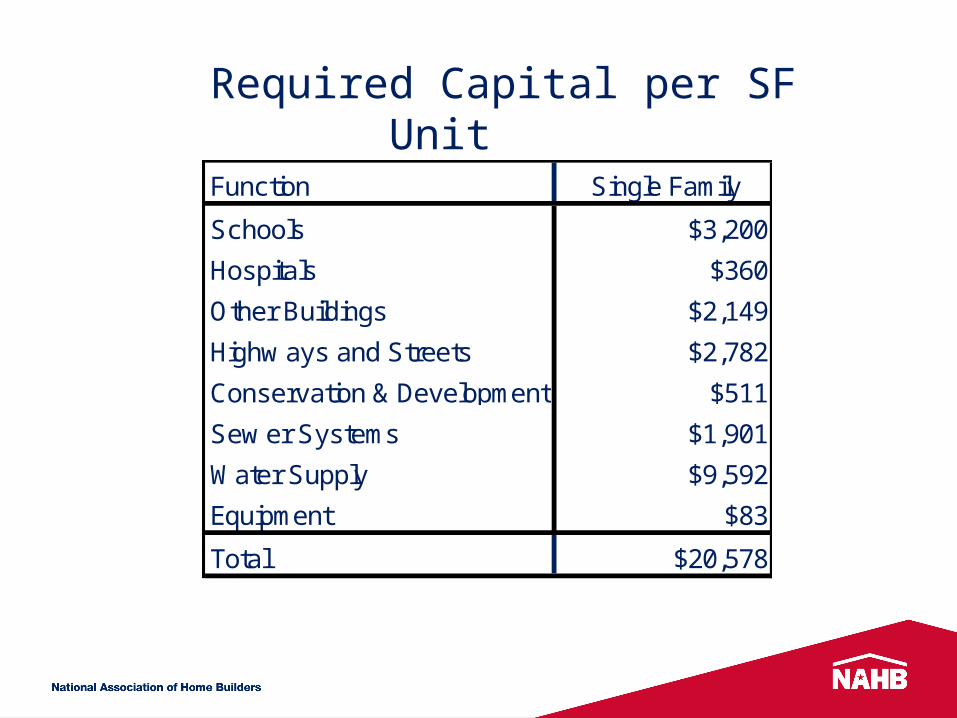
Required Capital per SF Unit
Function Single Family
Schools $3,200
Hospitals $360
Other Buildings $2,149
Highw ays and Streets $2,782
Conservation & Development $511
Sew er Systems $1,901
Water Supply $9,592
Equipment $83
Total $20,578

Required Current Expenses per MF UnitFunction Multifamily State Aid
Education $1,039 53%
Police Protection $168 0%
Fire Protection $30 0%
Corrections $70 0%
Streets and Highw ays $120 46%
Water Supply $94 0%
Sew erage $16 0%
Health Services $84 56%
Recreation and Culture $169 0%
Other General Government $369 59%
Total $2,159
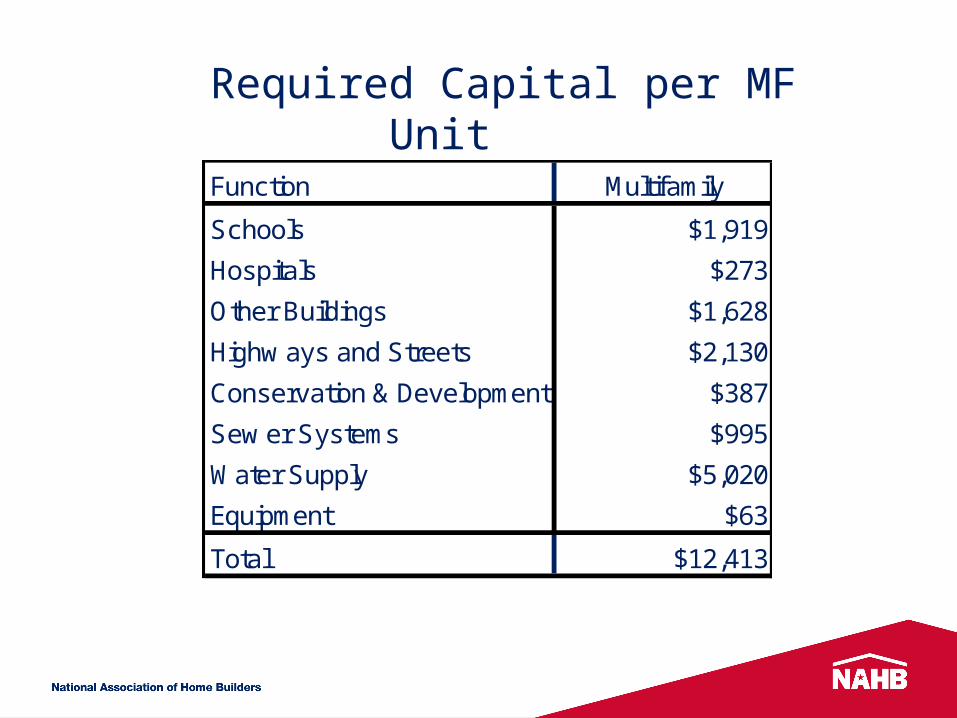
Required Capital per MF Unit
Function Multifamily
Schools $1,919
Hospitals $273
Other Buildings $1,628
Highw ays and Streets $2,130
Conservation & Development $387
Sew er Systems $995
Water Supply $5,020
Equipment $63
Total $12,413
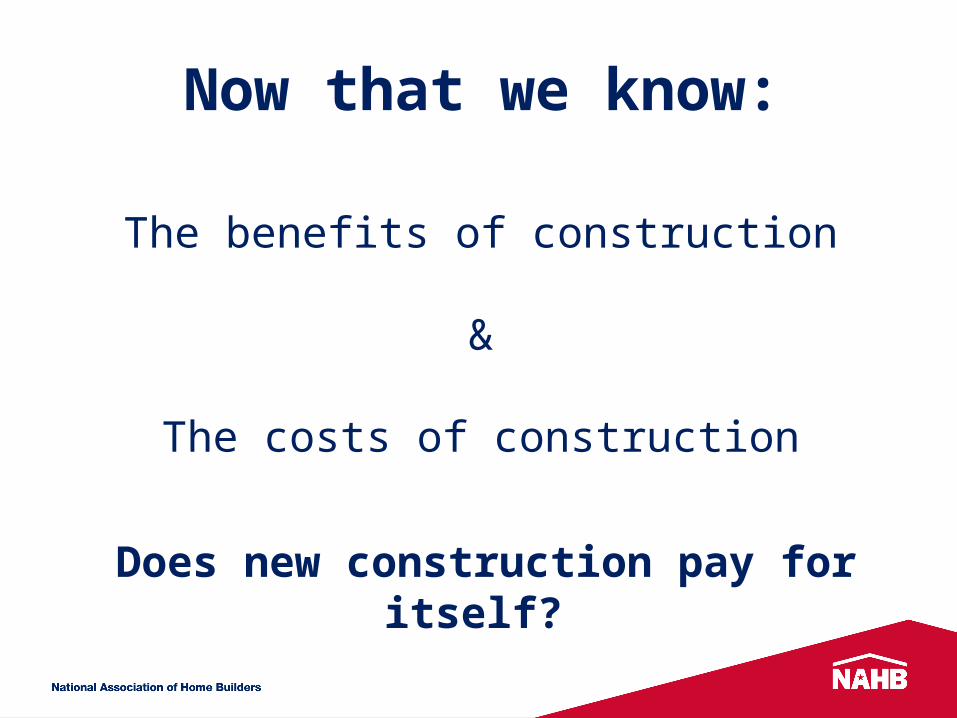
Does new construction pay for itself?
The benefits of construction
&
The costs of construction
Now that we know:
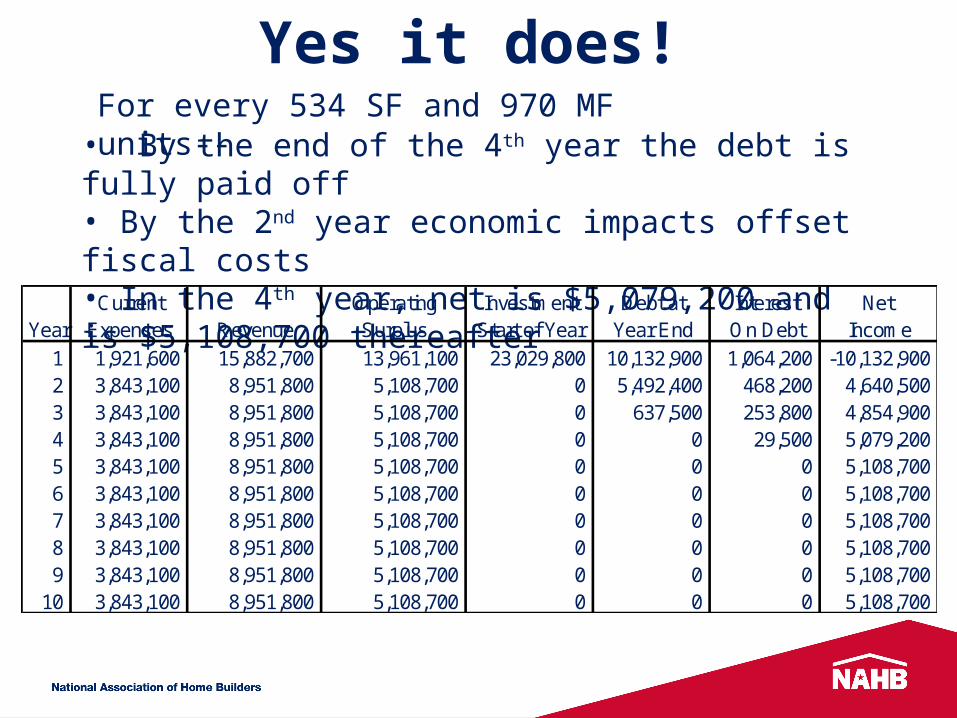
• By the end of the 4th year the debt is fully paid off• By the 2nd year economic impacts offset fiscal costs• In the 4th year, net is $5,079,200 and is $5,108,700 thereafter
Yes it does! For every 534 SF and 970 MF units--
Current Operating Investment Debt at Interest Net Year Expenses Revenue Surplus Start of Year Year End On Debt Income
1 1,921,600 15,882,700 13,961,100 23,029,800 10,132,900 1,064,200 -10,132,900 2 3,843,100 8,951,800 5,108,700 0 5,492,400 468,200 4,640,500 3 3,843,100 8,951,800 5,108,700 0 637,500 253,800 4,854,900 4 3,843,100 8,951,800 5,108,700 0 0 29,500 5,079,200 5 3,843,100 8,951,800 5,108,700 0 0 0 5,108,700 6 3,843,100 8,951,800 5,108,700 0 0 0 5,108,700 7 3,843,100 8,951,800 5,108,700 0 0 0 5,108,700 8 3,843,100 8,951,800 5,108,700 0 0 0 5,108,700 9 3,843,100 8,951,800 5,108,700 0 0 0 5,108,700
10 3,843,100 8,951,800 5,108,700 0 0 0 5,108,700
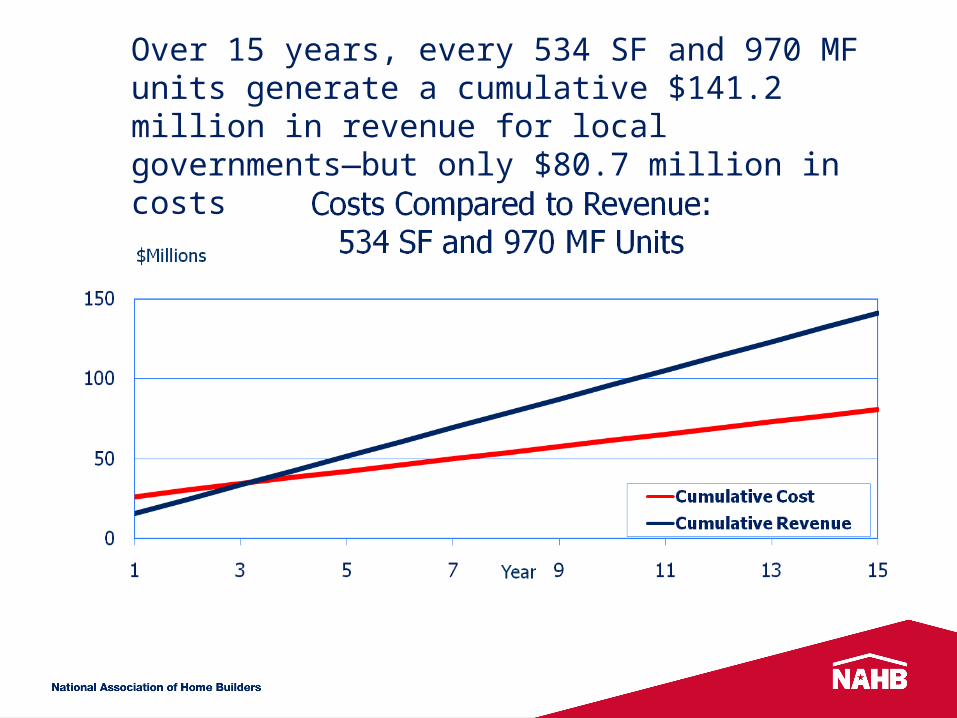
Over 15 years, every 534 SF and 970 MF units generate a cumulative $141.2 million in revenue for local governments—but only $80.7 million in costs
What does 4 years mean?• That is, should it be done faster, or is it O.K.?
• Big purchases take time to pay off.
• Car loans now last 5 years, and many lease!
• How fast did you pay off your student loans?
• How fast are your kids paying off theirs?
• Did you pay off your home in 4 years?
Almost done, just a bit more
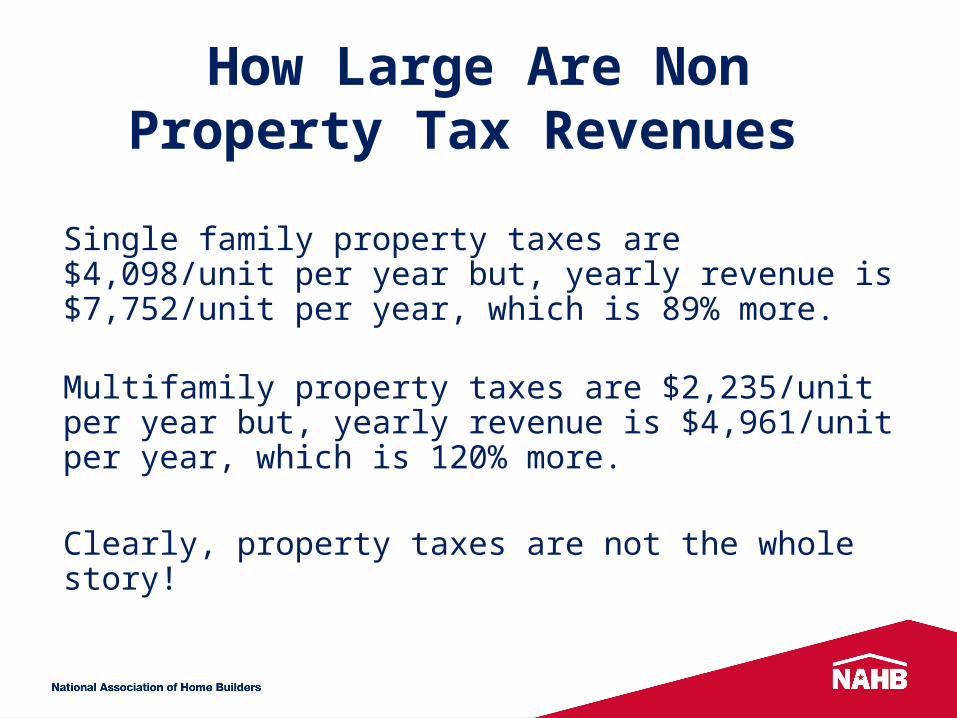
How Large Are Non Property Tax Revenues
Single family property taxes are $4,098/unit per year but, yearly revenue is $7,752/unit per year, which is 89% more.
Multifamily property taxes are $2,235/unit per year but, yearly revenue is $4,961/unit per year, which is 120% more.
Clearly, property taxes are not the whole story!
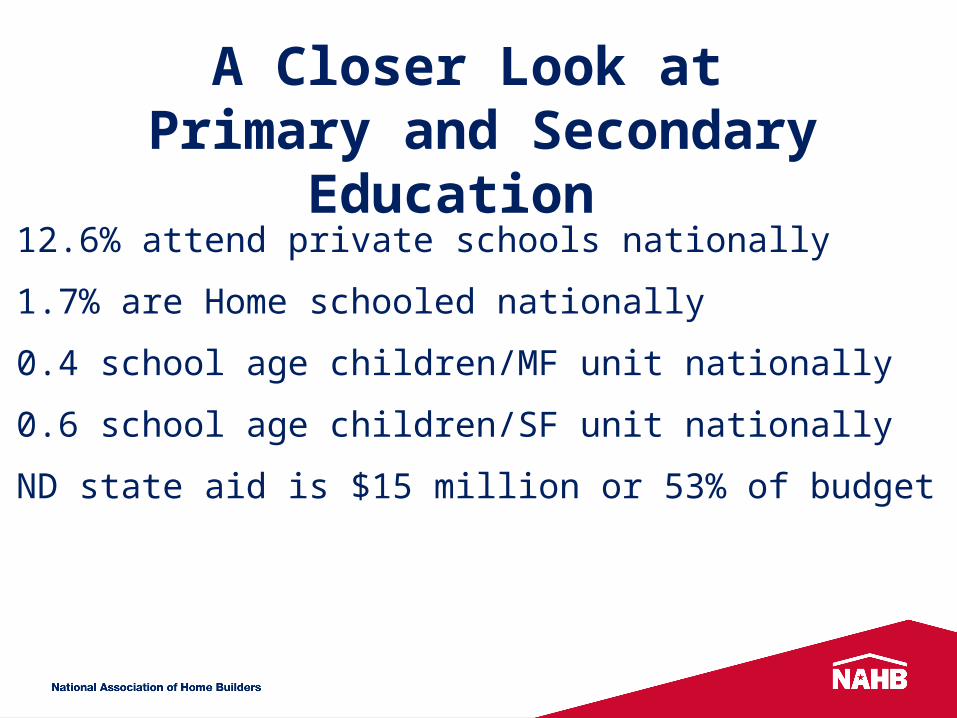
A Closer Look at Primary and Secondary
Education 12.6% attend private schools nationally
1.7% are Home schooled nationally
0.4 school age children/MF unit nationally
0.6 school age children/SF unit nationally
ND state aid is $15 million or 53% of budget
Elliot F. Eisenberg, Ph.D.
Cell: 202.306.2731
1201 15th Street NWWashington, DC 20005-2800
Thank you very much!
ANY QUESTIONS?