PRESENTATIONS SESSION 2 - OECD.org - OECD · PRESENTATIONS – SESSION 2 . 12-13 May 2016 Paris,...
40
OECD Conference on the Financial Management of Flood Risk Building financial resilience in a changing climate PRESENTATIONS – SESSION 2 12-13 May 2016 Paris, France
Transcript of PRESENTATIONS SESSION 2 - OECD.org - OECD · PRESENTATIONS – SESSION 2 . 12-13 May 2016 Paris,...

OECD Conference on the
Financial Management of Flood Risk Building financial resilience in a changing climate
PRESENTATIONS –
SESSION 2
12-13 May 2016
Paris, France

18/05/2016
1
Flood Risk Management in the Netherlands
12 May 2016
Inge Lardinois Dep. Director for Water Management
Ministry of Infrastructure and the Environment
Content
• About The Netherlands
• History
• Delta Act 2012
• New flood risk policy
• Cost-benefit analysis
• Delta Fund
• Public awareness
• Recent experiences
• Conclusions
2 Ministry of Infrastructure and the Environment

18/05/2016
2
The Netherlands
• 60% of the country is sensitive for floods:
- 26% below sea level
- 34% river floods
• In this area:
- 9 million people
- 70% of our GNP earned
3 Ministry of Infrastructure and the Environment
Dynamic delta
4 Ministry of Infrastructure and the Environment

18/05/2016
3
History
1000 First man-made dyke
1255 First Official regional water authority
('Hoogheemraadschap van Rijnland')
1400 Wind mills pump out the water
1798 Founding National Water Authority
(‘Rijkswaterstaat’)
5 Ministry of Infrastructure and the Environment
The 20th century
Large plans implemented as a response to
disaster:
• 1916 floods (North) ->building Afsluitdijk
• 1953 flood disaster (South-West)
• 1993/1995 high water levels (rivers, large
evacuations)

18/05/2016
4
Afsluitdijk (1933)
Maeslantkering (1997)
7 Ministry of Infrastructure and the Environment
Oosterscheldekering (1986)
2012 Delta Act
• Delta Programme
provides a common long term goal and related policy objectives
• Delta Fund
average annual budget of €1.2 billion until 2028
• Delta Commissioner coordinates and supervises, reports on progress (to Cabinet and Parliament) and advises on necessary steps to maintain coherence
8 Ministry of Infrastructure and the Environment

18/05/2016
5
Regional Water Authorities
• Oldest form of democratic
government in the Netherlands
• In 1950: about 2600 water authorities
• In 2016: 22 water authorities
• Water systems levy:
2.7 billion euros in 2016
(= 8% total tax)
9 Ministry of Infrastructure and the Environment
Administrative Agreement on Water (2011)
• Agreement with the regional water authorities on co-financing the Flood Protection Programme:
– 50% financing by the water authorities
• 10% project-related contribution
• The central government, provinces, municipalities, water authorities and drinking water companies have reached agreement on more
efficient water management:
– efficiency gains up to €750 million per year from 2020
10 Ministry of Infrastructure and the Environment

18/05/2016
6
New flood risk standards
Goals for 2050 1. Basic protection level for everyone 2. Prevent (as much as possible) large
groups of casualties and major economic damage
3. Prevent failure of vulnerable functions with national consequences
Risk-based approach: the new standards take into account: - the risk of flooding - the possible impact
Cost-benefit analysis
Cost-benefit analysis is used in two phases of the Delta Programme:
1. Political decision on flood protection standards:
- Equity
- Cost-benefit analysis
2. Preferred flood risk management strategy:
- Level of protection is fixed
- Cost-effectiveness analysis
12 Ministry of Infrastructure and the Environment

18/05/2016
7
Minimalization of total cost (Deltares, 2011)
13 Ministry of Infrastructure and the Environment
(Marginal benefits = marginal cost) Cost (euro)
Total cost
Levee height(cm)
Protection standard (1/year)
Investment cost
Expected damage cost
Budget Delta Fund 2016-2028
14 Ministry of Infrastructure and the Environment

18/05/2016
8
Relative contribution of measures in terms of costs (2016)
Investments
• Flood Protection Programme 307 million (35%)
• Programme Room for the River 228 million (26%)
• Other projects flood protection 117 million (13%)
• Study costs 9 million (1%)
• Incentive Programme for Spatial Adaptation 2,2 million (0,3%)
• Public awareness 0,6 million (0,1%)
Operation and Maintenance 206 million (24%)
TOTAL 870 million (100%)
• 15 Ministry of Infrastructure and the Environment
Public awareness
• Link Our Water
– www.onswater.nl
16 Ministry of Infrastructure and the Environment

18/05/2016
9
Recent experiences/innovations
• Adaptive approach (short term decisions linked to long-term goals)
• From ‘hard’ physical infrastructure to ‘soft’
infrastructure (‘Building with Nature’)
• Room for the River: two goals
1. water level decline
2. spatial quality
17 Ministry of Infrastructure and the Environment
Conclusions
• Prevention is and remains the key principle
• Financial-economic analysis is used for decision-making
• Recently more attention is given to spatial adaptation, emergency response and awareness raising
• Working together in Delta Programme (Dutch ‘poldermodel’) works
18 Ministry of Infrastructure and the Environment

1
Managing Flood Risk - Lessons and suggestions from Japan -
Kenzo Hiroki Vice President
College of Land, Infrastructure, Tourism and Transport (CLITT)
Why is Japan so keen on Flood Management?

2
Concentration of assets and population in flood plain
Assets
Flood (alluvial) plain Other areas
2
Population
Area
(7.5 trillion USD)
(65 million people)
(37,000 ㎢)
Cover Rates of Assets/Population in Flood Areas
Japan
Assets Population
Assets Population
Assets Population
U.K.
USA
Flood Area Other Area

3
If Typhoon Kathleen (1947) hit again and break dikes of
Tone River, 2.3million people can be under flood water
Dike break
Image of inundation of loop route No.7 (Katsushika City)
Flood water depth 5.0m< H
2.0m< H <5.0m
1.0m< H <2.0m
0.5m< H <1.0m
H <0.5m
Collapsed place
Tokyo
Saitama
Pref.
Ibaraki
Pref.
Inundation area
(km2) 530
Population at
inundation area
(persons)
2,300,000
4
Normal
・Underground shopping areas and buildings’ underground can be inundated by flood water through subway tunnels ・The inundation will be more rapid and deep
Inundated area in case of the right dike of Arakawa River broken
・No pump operation ・Conditions of Water-stop Board is 1m high from gateway floor ・No in & out flow from ventilation shaft
Spread of flooding through subway tunnels
浸水深
1mm 以上~ 0.5m 未満
0.5m 以上~ 1.0m 未満
1.0m 以上~ 2.0m 未満
2.0m 以上~ 5.0m 未満
河川
新幹線
JR
5.0m 以上~
depth of inundation
1mm or more – less than 0.5m 0.5m or more – less than 1.0m 1.0m or more – less than 2.0m 2.0m or more – less than 5.0m 5.0m or more
地下鉄凡例
■ 満管(駅又はトンネルの上端に達した時点)
■ 浸水(水深 2mを超過した時点)
■ 浸水(水深 5cmを超過した時点)
□ 浸水なし
防水ゲート
地下鉄の浸水状況 Inundation of subways Full (water reaches the ceilings) Inundation (water is higher than 2m) Inundation(water is higher than 5cm) No inundation

4
Why is Japan so keen on Flood Management?
Because it is, through history, a matter of state survival
What we have achieved; and What we have not in national efforts of flood risk reduction

5
Annual investment for flood protection Gross National Product (GWP)
Annual investment for flood protection (Million USD)
GDP (10 billion USD)
Investment in flood prevention - Hand in hand with GDP-
National Infrastructure Stock
Road:32.3 %
Port:3.9 % Airport:0.5 %
Railway:2.1% Public Housing:6.0%
Sewage: 10.4% Garbage disposal:1.9% Water Supply:5.7%
Schools & Research Facilities:9.2%
Sports facilities:2.2%
Urban Parks:1.3%
Total Value: 8 Trillion USD
Flood Prevention : 8.3 % (700 billion USD)
Geological & Coastal Disaster Prevention:2.5%
Irrigation & Fishery:11% Others::1%

6
Steady investment led to decrease in disaster loss
Rate of flood economic loss by per-capita income (%)
Investment in flood prevention (billion USD)
40
30
20
10
0 1900 1920 1940 1960 1980 2000
Year
20
15
10
5
0
Investment in flood prevention and flood economic loss in past 100 years
Investment in flood prevention Rate of flood economic loss
Prevention pays off Every one dollar spent for flood prevention creates
8 dollars of loss reduction
Investment of 0.7 Billion USD
Loss Reduction of 5.5 Billion USD
Case of the Shonai River, Nagoya City

7
What we have not achieved
Death Toll
10,000
1,000
100
10
1
Economic Loss
Million USD
Year
Annual Human and Economic Loss by Flooding in Japan
Human loss has been drastically reduced while economic loss still remains high

8
Catch me if you can -Flood risk increases though flood area decreases -
Total Flood Area
Total Asset Loss
Flood Risk Density (Per-area Flood Loss)
1975 1980 1985 1990 1995 2000 Year
15 Source: report of Japan Meteorological Agency
Increasing extreme hydrological events Increases in Extreme Precipitation (of more than 50mm/hour) in Japan (1976 - 2008)
Frequency of heavy rain has increased
by 50-100% in recent 20 years

9
Paradigm Shift in Flood Disaster Risk Reduction
- to achieve what we have not -
Concept of Disaster Risk Reduction
Probability of Disaster
Damage/Loss 100%
1/100 1/50 1/30 1/10 1/5
50% Disaster
Risk

10
Concept of Disaster Risk Reduction
Probability of Disaster
Damage/Loss 100%
1/100 1/50 1/30 1/10 1/5
50% Prevention (Dykes, Reservoirs, Diversions, etc.)
Preparedness/ Resilience (Flood Defense Brigades, Evacuation, Water proof buildings, Change of Crops…)
Disaster Risk
Paradigm shift in Flood DRR
Probability of Disaster
Damage/Loss 100%
1/100 1/50 1/30 1/10 1/5
50% Effective Prevention (New Technology/Policy Tools, CC Adaptive Standard, Integrated Operation of Structures, Strengthening Structures…)
Accelerating Preparedness/ Resilience Actions (Awareness Raising, Flood-resilient Urban Planning, Water proof buildings…)
Promoting Transfer & Self-Help (Insurance , hazard maps, …)

11
Turning paradigm shift
into reality
Section completed in 2002 (partially put into use)
L=3.3km
Section completed in 2006
L=3km
Tonegawa
River
Tunnel in Construction
Section No. 4
Former
Showa Town
Connecting lowland rivers by vertical shafts (70m in depth) and underground tunnel (Φ11m×6 km) Divert and store flood water for later discharge
Metropolitan Underground Flood Diversion Scheme
21
Shaft No.5 Shaft No.4 Shaft No.3
Shaft No.2
Shaft No.1 Tunnel in Construction
Section No. 3
Tunnel in Construction
Section No. 2
Tunnel in Construction
Section No. 1

12
Super Levee by PPP Super embankments have mounding in more extensive urban areas than existing embankments. The advantages of
super embankments are:
1) no collapse at floods,
2) no collapse against inundation, and
3) earthquake-resistant. River bank land development is strictly restricted pursuant to the River Law. However, the whole slopes at the back of
super embankments are designated as the special areas, for which land development is deregulated.
High standard embankments
Scheme of city development along the super embankment
Embankment height Designated special area: 30h (About 30 times the embankment height)
River bank area
22
Ara River Retarding Basin #1
●location:Saitama City & Toda City, Saitama Pref. (28.8 – 37.2km from estuary of Arakawa river) ●Operation started : Year 2003 ●Area of Reservoir : 580 ha ●Total Capacity for Flood Control : 39 mil. m3 ●Valid Capacity : 10.6 mil. m3
●Control volume : 850m3/sec
Developing retarding basins for flood management and ecosystem conservation
23 Photo by Arakawa Upstream River Office
13
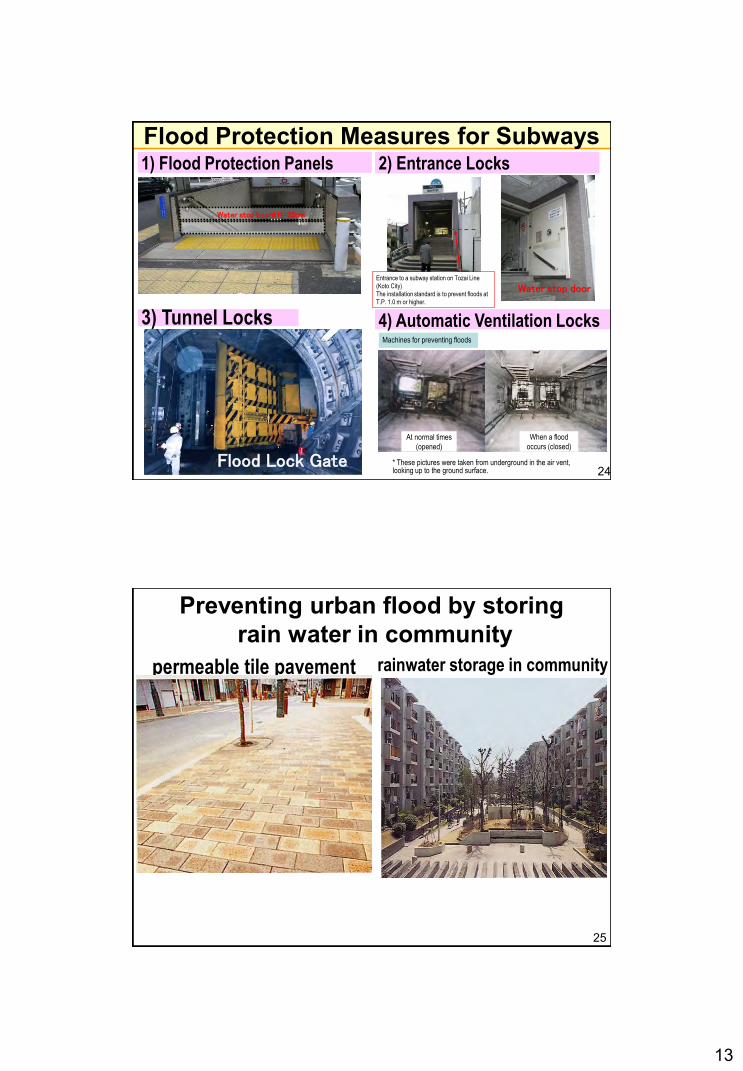
Water stop board H=35cm
1) Flood Protection Panels 2) Entrance Locks
3) Tunnel Locks Machines for preventing floods
At normal times
(opened)
When a flood
occurs (closed)
* These pictures were taken from underground in the air vent, looking up to the ground surface.
Entrance to a subway station on Tozai Line
(Koto City)
The installation standard is to prevent floods at
T.P. 1.0 m or higher.
4) Automatic Ventilation Locks
Flood Protection Measures for Subways
24
Water stop door
Flood Lock Gate
permeable tile pavement
Preventing urban flood by storing rain water in community
25
rainwater storage in community

14
Provision of flood warning/information by mobile phone
Information provided on the internet Information provided to mobile phones
Contents
•Precipitaion by hyeto meter
•Precipitaion by rader rain
gages
•Water level etc.
26
The assumed flood water depth is
indicated using a tape.
QRコード
27
Hazard Map on Street

15
Integrated Flood Management through River Basin Management Plan
28
Conservation of natural land
Disaster-prevention reservoirs
Embankment control
Facilities for rainwater
storage and infiltration
Rainwater storage and infiltration
facilities for each house
Maintenance of urbanization control areas
Permeable pavement
Seepage pits
River improvement
Multipurpose retarding basin
Rainwater tanks
Rainwater storage in parks
Underground river
Facilities for rainwater
storage and infiltration Construction of
drainage pump station
Water-proof buildings
River measures
River basin measures
Damage alleviation measures
Establishment of evacuation
warning systems
Construction of dams
Lessons learned Disaster management (prevention & preparedness)
requires decades of unfailing commitment and implementation. Country needs to keep solid legal, administrative and financial foundation for years to achieve this.
Disaster prevention pays off. The challenge is, however, to convince this to the people including leaders in “normal days” when disasters are not visible and imminent. Keeping institutional memories, inter alia, is the key for success.
“Good preparedness” in society is easy to say but extremely difficult to maintain as human being forgets. Do not fall into the trap that “preparedness” is a (cheap) panacea to ensure disaster safety. It also has limitation of effectiveness as prevention does.
,

16
Lessons learned (continued) Best mix of prevention, preparedness and transfer for
disaster management depends on diverse geographical, social, and financial situation of countries and communities. Step-by-step improvement learning from past disasters is shortest cut towards better disaster management.
Transfer such as insurance is a good way for individuals and organizations to avoid “financial catastrophe” after disasters. However, transfer, per se, does not reduce disaster risks, particularly from national perspectives.. Examine geographical, social, and financial situation of country/community before deciding the best mix. Geographical situation is particularly important to decide best mix for flood management.
,
Check list for a government when investing in disaster management
- Beware that disaster management requires years of unfailing commitment and implementation -
Legal foundation ( i.e. a system of laws for disaster management ) that enables long-term planning, financing and implementation
Budgetary system resilient enough to allow for stand-by budget line for “ rainy days”
In-house group of financial, legal and technical officials with good governance that can turn money into actual safety against disasters.
Public consensus that disaster investment pays off Leaders’ awareness that good disaster
management is prerequisite for political survival

17
Thank you
1
Productivity Commission
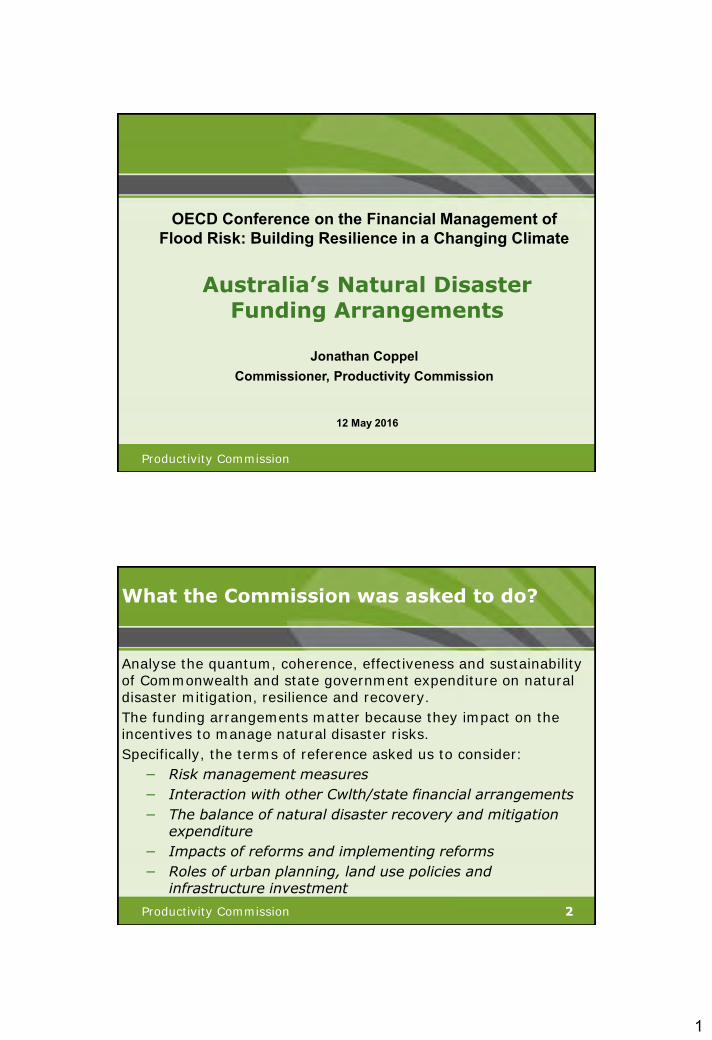
OECD Conference on the Financial Management of Flood Risk: Building Resilience in a Changing Climate
12 May 2016
Australia’s Natural Disaster Funding Arrangements
Jonathan Coppel
Commissioner, Productivity Commission
Productivity Commission 2
What the Commission was asked to do?
Analyse the quantum, coherence, effectiveness and sustainability of Commonwealth and state government expenditure on natural disaster mitigation, resilience and recovery.
The funding arrangements matter because they impact on the incentives to manage natural disaster risks.
Specifically, the terms of reference asked us to consider:
− Risk management measures
− Interaction with other Cwlth/state financial arrangements
− The balance of natural disaster recovery and mitigation expenditure
− Impacts of reforms and implementing reforms
− Roles of urban planning, land use policies and infrastructure investment

2
Productivity Commission 3
Flood risk in Australia
• Most significant natural disaster by insurance loss, averaging about A$480 million per year since 1970, but bushfires have a larger human toll.
• Cyclone, flood, storm and hail account for:
− 84% of insurance losses
− 63% excluding hail
• Some states are more vulnerable to flood than others:
− 100% of losses in QLD and NT
− 95% of losses in WA
− 80% of losses in NSW and 65 in Victoria
• 10% of natural disasters account for 80% of losses
Productivity Commission 4
The major national natural disaster funding arrangements Expenditure for 2009-10 to 2012-13

3
Productivity Commission 5
Problems identified by the Commission
1. Overinvestment in relief and recovery
2. Underinvestment in mitigation
3. Underuse of insurance by state, territory and local governments
4. Inefficient reconstruction expenditure
5. Inequitable arrangements
Productivity Commission 6
Role of government in managing natural disaster risk
Impediments to natural disaster risk management
Imperfect informationMarket failure
Government failure
Government assets Shared assets Private assets
Understanding and managing natural disaster risks to its
assets
Supporting understanding and
management of shared risks
Policy setter:Information provision
Regulation
Ass
ets
at r
isk
gove
rnm
en
tR
ole
of

4
Productivity Commission 7
Managing government assets
• Principle that asset ownership should align with responsibility for managing and funding risk also applies to governments
• Across levels of government, the principle of subsiduarity applies
• Report recommended:
− Treat natural disaster risks transparently in budgets
Some base level of provisioning is needed
− Reduce Aust. Govt. post-disaster support to states
− Increase Aust. Govt. support for mitigation
− Move away from reimbursement model for cost sharing
− Establish accountability frameworks that give states more autonomy for natural disaster risk management
Compile asset registers and develop long-term asset management plans
Productivity Commission 8
Managing shared assets
• Major disasters can overwhelm a community. Some degree of risk sharing with government can protect vulnerable populations and maintain social cohesion
• Disaster relief payments, volunteer effort and the existing social safety net each have a role to play
• These arrangements are inconsistently applied, inefficient in their administration, prone to overlaps and duplication and very costly
• Report recommended: − legislate eligibility criteria and remove Ministerial discretion for
special payments − Review level of special assistance to better reflect needs − Cease reimbursement for activities covered by other payments − Cease direct financial assistance to businesses and primary
producers, but if post-disaster assistance is provided it should be through untied grants

5
Productivity Commission 9
Managing private assets
• Government policy can influence the exposure and vulnerability of the community to flood risks
• Report recommended: − Governments should make natural hazard information publicly
available − Gaps relate to data consistency, accessibility and
communication of hazards IP, liability, privacy act as obstacles to better information Develop flexible guidelines for hazard mapping, modelling and
metadata
− Integrate natural disaster risk management into regulation of the built environment
− Explore opportunities for government–insurer partnerships to share information
Productivity Commission 10
Lessons for natural disaster risk management
• More transparent budget treatment of natural disaster risks
• Greater and neutral incentives to invest in mitigation
• Accountability frameworks to reduce prescription and give states more autonomy on how they undertake recovery and mitigation
• Limit ministerial discretion over eligibility criteria
• Invest in information guidelines, provision and access and communication of risks
• Insurance is an essential risk management option

6
Productivity Commission 11
THANK YOU
http://www.pc.gov.au/inquiries/completed/disaster-funding/report

09-May-2016
1
No content below the line No content below the line
Flood Risk And Sovereign Ratings Paris, May. 12, 2016
Moritz Kraemer Global Chief Ratings Officer Sovereign Ratings [email protected]
Copyright © 2016 by S&P Global.
All rights reserved.
Sources for all data: S&P Global Ratings
No content below the line No content below the line
Rating Impact Per Peril
Private & Confidential 2
0.64
0.53
0.36
0.06 0.0
0.2
0.4
0.6
0.8
1.0
Earthquake Tropical storm Flood Winter Storm
Average Standard deviation
(1-in-250-years disaster, in notches downgrade)

09-May-2016
2
No content below the line No content below the line
Hypothetical Sovereign Rating Impact
Private & Confidential 3
(1-in-250-years disaster, in notches downgrade)
0 0.5 1 1.5 2 2.5
Dom. Rep. TCChile EQ
Bangladesh TCJapan EQ
Costa Rica EQVietnam TC
Peru EQThailand FLTaiwan EQTurkey EQ
Ecuador EQPanama EQ
Philippines EQDom. Rep. EQ
Italy EQMexico EQHungary FL
Israel EQColombia EQ
New Zealand EQIndonesia EQ
Taiwan TCPortugal EQ
Flood
Tropical Cyclone
Earthquake
No content below the line No content below the line
Rating impact of floods, contribution by assessment
Private & Confidential 4
0.0 0.2 0.4 0.6 0.8 1.0 1.2 1.4 1.6
Thailand
Hungary
Brazil
Czech Republic
Sri Lanka
Austria
Poland
France
Germany
Economic
External
Fiscal
Debt

09-May-2016
3
No content below the line No content below the line
Average NatCat Impact By Income Group
Private & Confidential 5
0.7
1.7
4.4
0.2 0.7
1.1 0.7
2.7
5.4
Advanced Sovereigns Emerging and DevelopingSovereigns
Low Income DevelopingSovereigns
Damage (% of value) Net rating impact (notches) % fall in USD GDP pc
No content below the line No content below the line
4.8
4.3
4.5
3.9
2.5
2.8
2.2
1.5
1.8
1.4
1.2
0.5
0.5
0.4
0.4
0.3
0.3
0.2
0.2
0.5
0.1
0.5
0.9
0.3
0.2
0.8
0.4
0.2
0.2
0.2
0.3
0.2
0.0 1.0 2.0 3.0 4.0 5.0
Barbados
Bahamas
Fiji
Jamaica
Dom Rep
Aruba
Bangladesh
Bermuda
Vietnam
Guatemala
Honduras
Taiwan
Trinidad and Tobago
Philippines
Colombia
Mexico
Thailand
IndonesiaPotential Downgrade, status-quo climate
Added potential downgrades due to climate change
Downgrade Risk And Climate Change (in notches)

09-May-2016
4
No content below the line No content below the line
Private & Confidential 7
No content below the line No content below the line
Insurance Can Limit Sovereign Rating Impact
Private & Confidential 8
(Downgrade in notches in 5% Damage-to-Value Scenario)
2.4
1.1
0
1
2
No insurance 50% insurance

09-May-2016
5
No content below the line No content below the line
5%
10% 10%
16% 16% 19%
22% 23% 24% 24%
28%
44%
61% 63%
65% 68%
74% Fi
ji
Hu
nga
ry
Ven
ezu
ela
Ban
glad
esh
Aru
ba
Vie
tnam
Ho
nd
ura
s
Bar
bad
os
Bah
amas
Gu
ate
mal
a
Jam
aica
Do
m R
ep
Ph
ilip
pin
es
Taiw
an
Trin
& T
ob
Ber
mu
da
Thai
lan
d
Added insurance coverage required to avoid climate change downgrades: too high for many
No content below the line No content below the line
For more S&P climate change analysis please visit https://www.spratings.com/climatechange

09-May-2016
6
No content below the line No content below the line
Copyright © 2016 by Standard & Poor’s Financial Services LLC. All rights reserved.
No content (including ratings, credit-related analyses and data, valuations, model, software or other application or output therefrom) or any part thereof (Content) may be modified, reverse
engineered, reproduced or distributed in any form by any means, or stored in a database or retrieval system, without the prior written permission of Standard & Poor’s Financial Services LLC or
its affiliates (collectively, S&P). The Content shall not be used for any unlawful or unauthorized purposes. S&P and any third-party providers, as well as their directors, officers, shareholders,
employees or agents (collectively S&P Parties) do not guarantee the accuracy, completeness, timeliness or availability of the Content. S&P Parties are not responsible for any errors or
omissions (negligent or otherwise), regardless of the cause, for the results obtained from the use of the Content, or for the security or maintenance of any data input by the user. The Content is
provided on an “as is” basis. S&P PARTIES DISCLAIM ANY AND ALL EXPRESS OR IMPLIED WARRANTIES, INCLUDING, BUT NOT LIMITED TO, ANY WARRANTIES OF
MERCHANTABILITY OR FITNESS FOR A PARTICULAR PURPOSE OR USE, FREEDOM FROM BUGS, SOFTWARE ERRORS OR DEFECTS, THAT THE CONTENT’S FUNCTIONING WILL
BE UNINTERRUPTED OR THAT THE CONTENT WILL OPERATE WITH ANY SOFTWARE OR HARDWARE CONFIGURATION. In no event shall S&P Parties be liable to any party for any
direct, indirect, incidental, exemplary, compensatory, punitive, special or consequential damages, costs, expenses, legal fees, or losses (including, without limitation, lost income or lost profits
and opportunity costs or losses caused by negligence) in connection with any use of the Content even if advised of the possibility of such damages.
Credit-related and other analyses, including ratings, and statements in the Content are statements of opinion as of the date they are expressed and not statements of fact. S&P’s opinions,
analyses and rating acknowledgment decisions (described below) are not recommendations to purchase, hold, or sell any securities or to make any investment decisions, and do not address the
suitability of any security. S&P assumes no obligation to update the Content following publication in any form or format. The Content should not be relied on and is not a substitute for the skill,
judgment and experience of the user, its management, employees, advisors and/or clients when making investment and other business decisions. S&P does not act as a fiduciary or an
investment advisor except where registered as such. While S&P has obtained information from sources it believes to be reliable, S&P does not perform an audit and undertakes no duty of due
diligence or independent verification of any information it receives.
To the extent that regulatory authorities allow a rating agency to acknowledge in one jurisdiction a rating issued in another jurisdiction for certain regulatory purposes, S&P reserves the right to
assign, withdraw or suspend such acknowledgement at any time and in its sole discretion. S&P Parties disclaim any duty whatsoever arising out of the assignment, withdrawal or suspension of
an acknowledgment as well as any liability for any damage alleged to have been suffered on account thereof.
S&P keeps certain activities of its business units separate from each other in order to preserve the independence and objectivity of their respective activities. As a result, certain business units of
S&P may have information that is not available to other S&P business units. S&P has established policies and procedures to maintain the confidentiality of certain non-public information received
in connection with each analytical process.
S&P may receive compensation for its ratings and certain analyses, normally from issuers or underwriters of securities or from obligors. S&P reserves the right to disseminate its opinions and
analyses. S&P's public ratings and analyses are made available on its Web sites, www.standardandpoors.com (free of charge), and www.ratingsdirect.com and www.globalcreditportal.com
(subscription), and may be distributed through other means, including via S&P publications and third-party redistributors. Additional information about our ratings fees is available at
www.standardandpoors.com/usratingsfees.
Australia
Standard & Poor's (Australia) Pty. Ltd. holds Australian financial services license number 337565 under the Corporations Act 2001. Standard & Poor’s credit ratings and related research are not
intended for and must not be distributed to any person in Australia other than a wholesale client (as defined in Chapter 7 of the Corporations Act).
STANDARD & POOR’S, S&P and RATINGSDIRECT are registered trademarks of Standard & Poor’s Financial Services LLC.
11 Private & Confidential