Presentation2
20
Application of Poisson Application of Poisson kriging to the mapping kriging to the mapping of Prostate Incidence in of Prostate Incidence in Iowa State Iowa State Zunqiu Chen Zunqiu Chen The department of Geography The department of Geography Dec, 04, 2006 Dec, 04, 2006
-
Upload
chen-zunqiu -
Category
Documents
-
view
26 -
download
0
Transcript of Presentation2
Application of Poisson kriging to Application of Poisson kriging to the mapping of Prostate the mapping of Prostate Incidence in Iowa StateIncidence in Iowa State
Zunqiu ChenZunqiu Chen
The department of GeographyThe department of Geography
Dec, 04, 2006Dec, 04, 2006

Disease mapping in public healthDisease mapping in public health Disease mapping, as an exploratory Disease mapping, as an exploratory
analysis ,has been used to show the analysis ,has been used to show the geographic distribution of disease (such as geographic distribution of disease (such as disease incidence rate, mortality rate, etc.) disease incidence rate, mortality rate, etc.) for the purpose public health surveillancefor the purpose public health surveillance
Disease map: Disease map: • point map-for dot, i.e., case-eventpoint map-for dot, i.e., case-event• choropleth map-regional data, county, choropleth map-regional data, county,
census tract datacensus tract data• isopleth map-geostatistical data (point isopleth map-geostatistical data (point
measurements)measurements)

Area based disease mappingArea based disease mapping Most popular Disease mapping Most popular Disease mapping
methods, in past, produce: area based methods, in past, produce: area based maps – Choropleth map which is the maps – Choropleth map which is the domination in disease mapping area.domination in disease mapping area.
Sui (2006) cited from Martin’s Master thesis Sui (2006) cited from Martin’s Master thesis (2005) that (2005) that three-fifthsthree-fifths of the maps of the maps published in leading health journals published in leading health journals between 2000 and 2004 were choropleth between 2000 and 2004 were choropleth maps.maps.
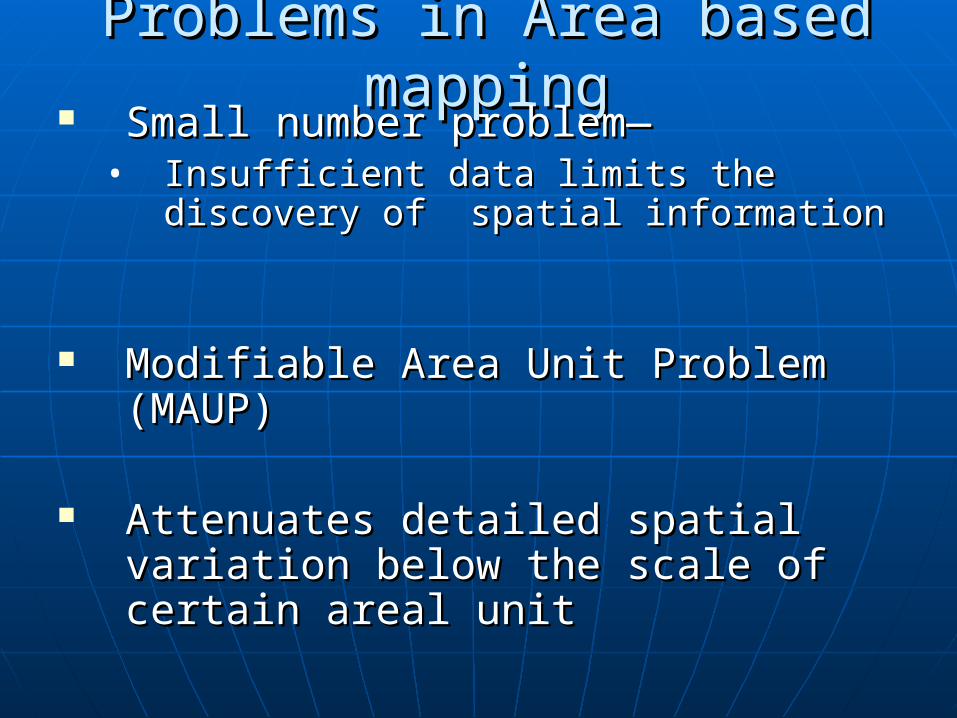
Problems in Area based mappingProblems in Area based mapping Small number problem—Small number problem—
• Insufficient data limits the discovery of Insufficient data limits the discovery of spatial information spatial information
Modifiable Area Unit Problem Modifiable Area Unit Problem (MAUP)(MAUP)
Attenuates detailed spatial Attenuates detailed spatial variation below the scale of certain variation below the scale of certain areal unitareal unit
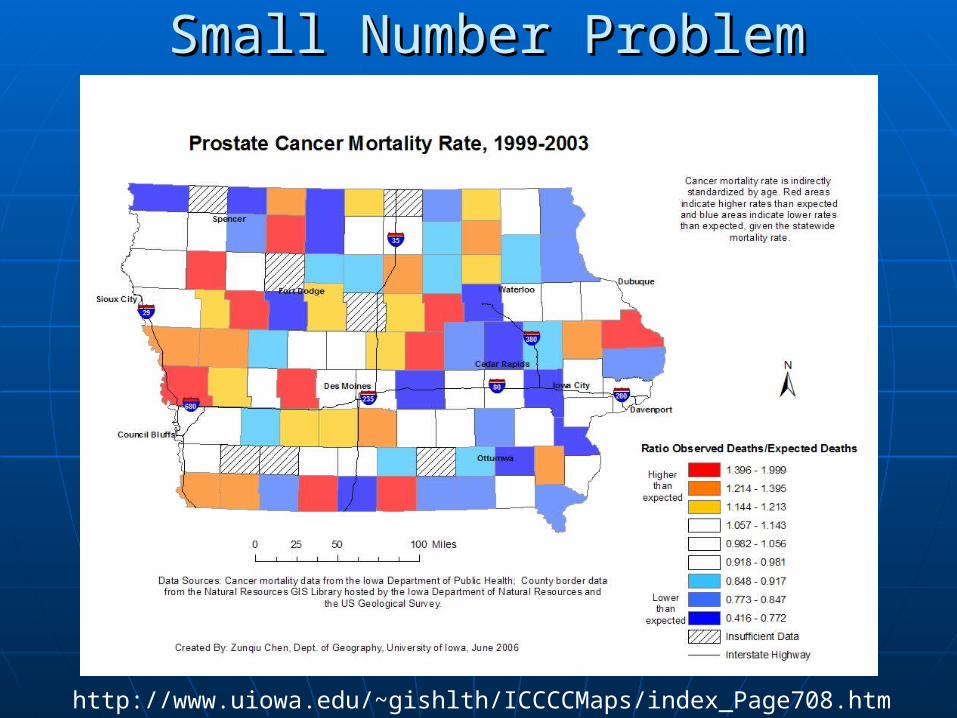
http://www.uiowa.edu/~gishlth/ICCCCMaps/index_Page708.htm
Small Number ProblemSmall Number Problem
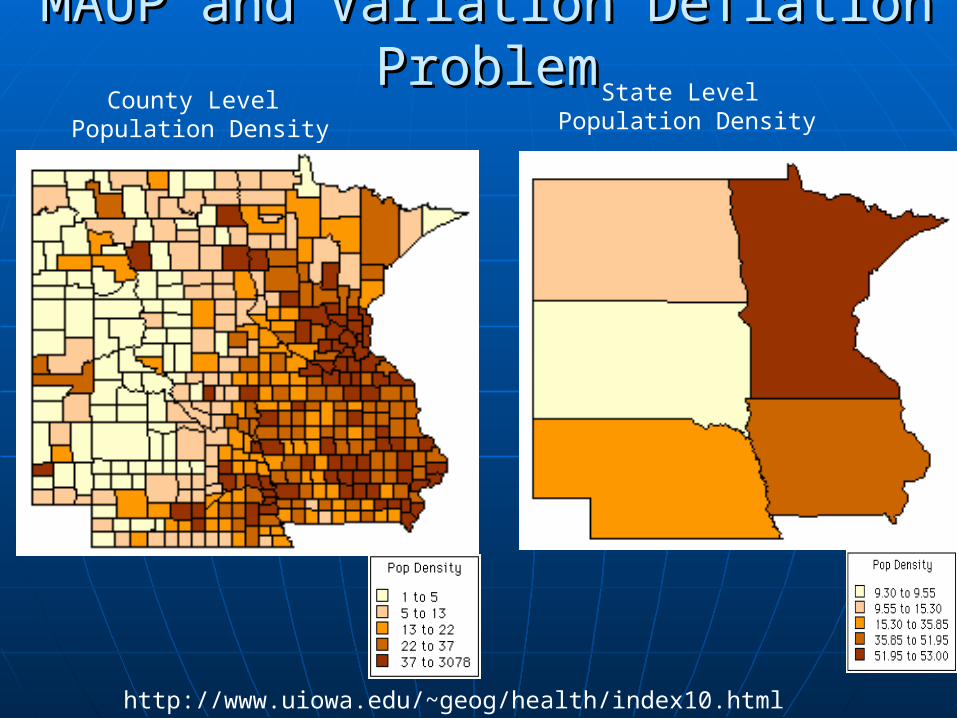
MAUP and Variation Deflation ProblemMAUP and Variation Deflation ProblemCounty Level
Population Density
State Level Population Density
http://www.uiowa.edu/~geog/health/index10.html
Alternatives to area based mapping: Alternatives to area based mapping: isopleth mapsisopleth maps
Isopleth MapsIsopleth Maps• Provide more detailed spatially continuous phenomena Provide more detailed spatially continuous phenomena
at a limited number of sampling locationsat a limited number of sampling locations
Kriging, as a geostatistic tool, has been used to Kriging, as a geostatistic tool, has been used to describe and interpolate spatial pattern in data.describe and interpolate spatial pattern in data.
However, the traditional kriging methods can not However, the traditional kriging methods can not be used for the analysis of disease rate. be used for the analysis of disease rate.
Poisson KrigingPoisson Kriging (Gooverts 2005) will be studied (Gooverts 2005) will be studied and applied to interpolate and applied to interpolate Prostate Cancer Prostate Cancer incidence rate.incidence rate.

Study area and DatasetStudy area and Dataset
The study area is Iowa State.7422 Prostate incidence data (year 1998 to 2003) from the Iowa The study area is Iowa State.7422 Prostate incidence data (year 1998 to 2003) from the Iowa Cancer Registry, including the variables for each case: ZIP code, County code. We then Cancer Registry, including the variables for each case: ZIP code, County code. We then aggregated the Prostate incidence data by ZIP code and County code respectively. aggregated the Prostate incidence data by ZIP code and County code respectively.
The population data for each ZIP code and County Code were obtained from US Census 2000 The population data for each ZIP code and County Code were obtained from US Census 2000 data. There are 949 ZIP codes and 99 County codes.data. There are 949 ZIP codes and 99 County codes.
StatisticsPopulation
Per ZipCodeMean 7.024Std.
Deviation 16.145Minimum 0Maximum 333
Count 949

Poisson KrigingPoisson Kriging
where z(ui) is the rate observed at location ui. The kriging weights are found by solving the following system of (K+1) linear equations:
The disease risk at a given location uα, is estimated as a linear combination of K neighboring data:
where δij = 1 if ui = uj and 0 otherwise, n(ui) is the population size at ui, and m* is the population-weighted mean of the set of N rates computed as:
(Equation 2)
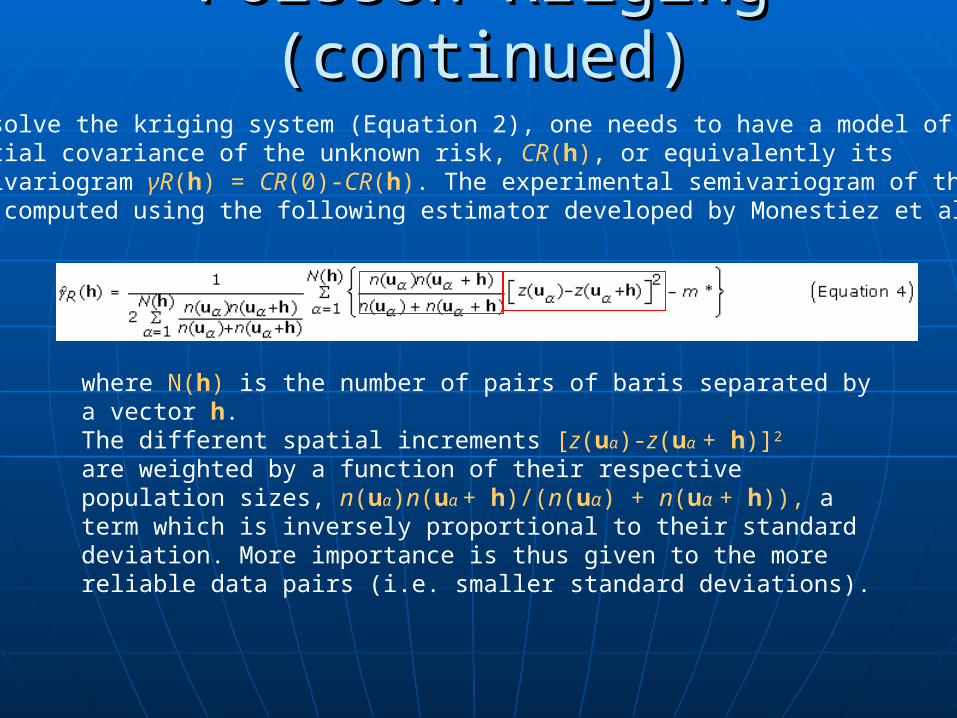
Poisson Kriging (continued)Poisson Kriging (continued)To solve the kriging system (Equation 2), one needs to have a model of the spatial covariance of the unknown risk, CR(h), or equivalently its semivariogram γR(h) = CR(0)-CR(h). The experimental semivariogram of the risk is computed using the following estimator developed by Monestiez et al.:
where N(h) is the number of pairs of baris separated by a vector h. The different spatial increments [z(uα)-z(uα + h)]2 are weighted by a function of their respective population sizes, n(uα)n(uα + h)/(n(uα) + n(uα + h)), a term which is inversely proportional to their standard deviation. More importance is thus given to the more reliable data pairs (i.e. smaller standard deviations).

A probabilistic model of the uncertainty about the incidence riskat a given location uα , denoted r(uα ), is provided by the random variable R(uα).
where G(.) is the cumulative distribution function of the standard normal random variable. The notation "|(K)" expresses conditioning to the local information, say, K neighboring observed rates.
The ccdf (Equation (5)) allows the computation and mapping of the probability that the local incidence rate exceeds any particular threshold. In this study, this function is used to assess whether the local incidence rate at uα is significantly different from the regional rate m* (Equation 3). The p-value for the test is calculated as:
Poisson Kriging Poisson Kriging (continued)(continued)
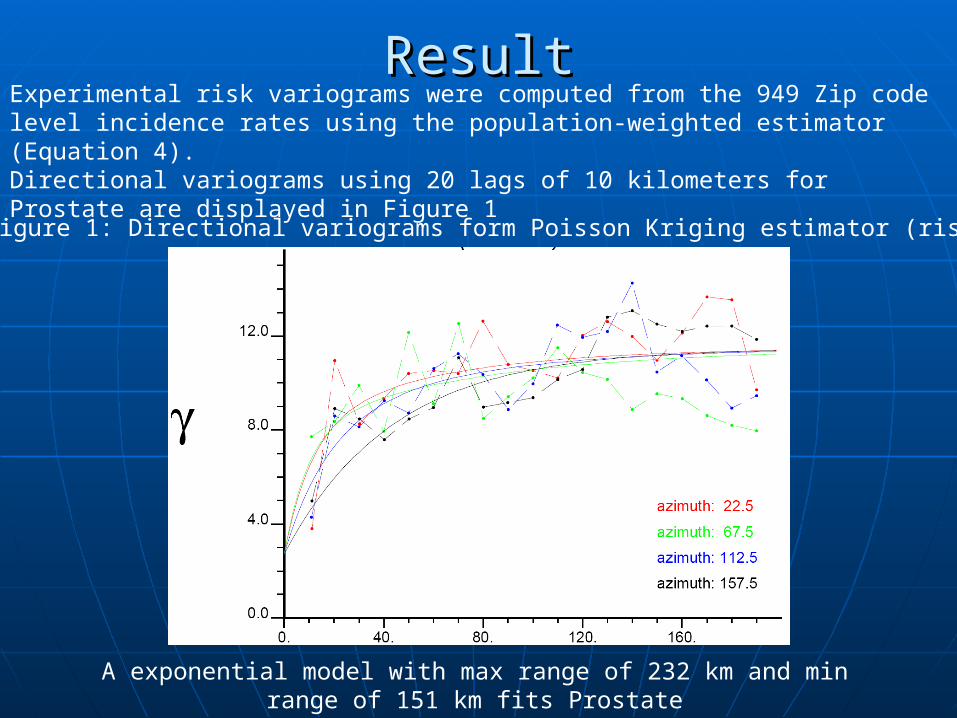
Experimental risk variograms were computed from the 949 Zip code level incidence rates using the population-weighted estimator (Equation 4). Directional variograms using 20 lags of 10 kilometers for Prostate are displayed in Figure 1
A exponential model with max range of 232 km and min range of 151 km fits Prostate
ResultResult
Figure 1: Directional variograms form Poisson Kriging estimator (risk)

The incidence risk of Prostate diseases is, then, mapped as Figure 2 shows:
Figure 2: Map of Prostate incidence risk in Iowa State 1998-2003 estimated by Poisson Kriging
Result (countinued)Result (countinued)
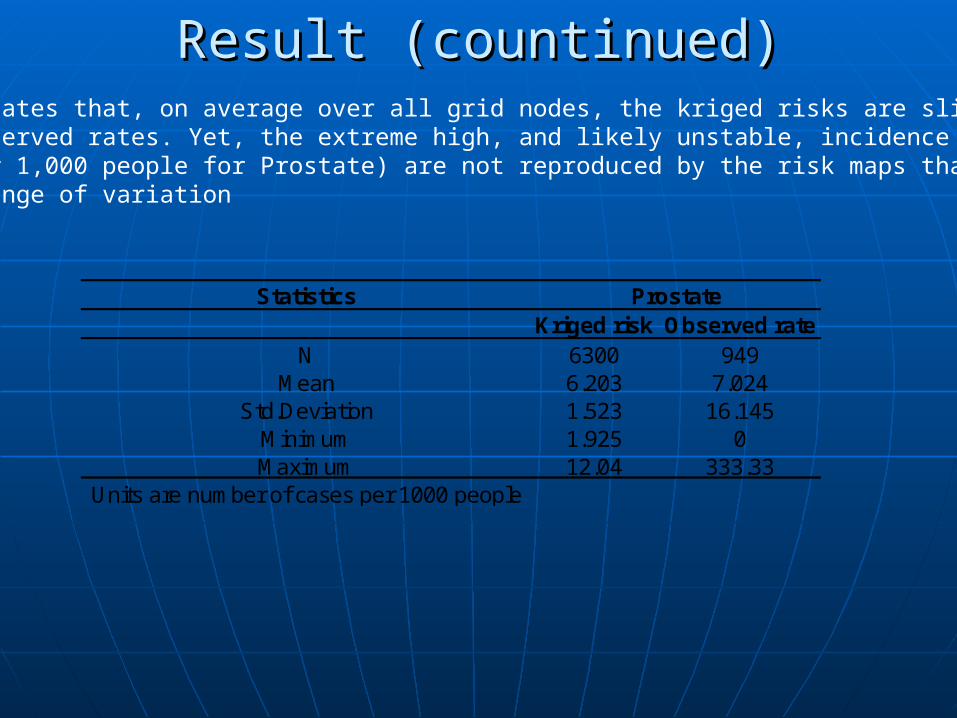
Result (countinued)Result (countinued)Table 1 indicates that, on average over all grid nodes, the kriged risks are slightly smaller than the observed rates. Yet, the extreme high, and likely unstable, incidence rates (i.e. 333 per 1,000 people for Prostate) are not reproduced by the risk maps that display a smaller range of variation
StatisticsKriged risk Observed rate
N 6300 949Mean 6.203 7.024
Std.Deviation 1.523 16.145Minimum 1.925 0Maximum 12.04 333.33
Units are number of cases per 1000 people
Prostate

Comparison: Prostate Cancer Comparison: Prostate Cancer Incidence Rate based on county levelIncidence Rate based on county level

Comparison: Prostate Cancer Incidence Rate Comparison: Prostate Cancer Incidence Rate
(smoothed Map based on filter method)(smoothed Map based on filter method)

The kriging variance maps of Prostate cancer is shown in figure 3:
Figure 3: Maps of Poisson Kriging variance for Prostate incidence risk in Iowa State, 1998-2003
Result (countinued)Result (countinued)
Figure 4: Maps of Population Density, Zip Code Level in Iowa State

Maps of the p-values for the test of uniformity of local incidence rates for ProstateCancer, 1998-2003, Iowa State
Figure 4: Maps of the p-values for the test of uniformity of local incidenceRates for Prostate in Iowa state
Result (countinued)Result (countinued)

Contributions of this studyContributions of this study Poisson Kriging offer a much reliable and better Poisson Kriging offer a much reliable and better
way to disease mapping with the consideration of way to disease mapping with the consideration of spatial patterns, data configuration (i.e. clustering spatial patterns, data configuration (i.e. clustering of observations), and the reliability of rate recorded of observations), and the reliability of rate recorded in sparsely populated areas.in sparsely populated areas.
The result of error variance from the disease map The result of error variance from the disease map also shows where has low population density which also shows where has low population density which provides useful information to the public health provides useful information to the public health surveillance of unstable disease risk value. surveillance of unstable disease risk value.
The likelihoods of having much smaller or larger The likelihoods of having much smaller or larger incidence rate for each location compared to the incidence rate for each location compared to the regional rate can be evaluatedregional rate can be evaluated

Future workFuture work More strict statistical methods can be used to More strict statistical methods can be used to
inspect how well the prediction of Poisson Kriging inspect how well the prediction of Poisson Kriging can perform such as Cross-validationcan perform such as Cross-validation
How significant of the disease incidence is caused How significant of the disease incidence is caused by chance should be further statistically identifiedby chance should be further statistically identified
Environmental or socio-demographic covariates Environmental or socio-demographic covariates can be involved into the study. So, the feature of can be involved into the study. So, the feature of cokriging is going to be applied to improve risk cokriging is going to be applied to improve risk estimation if possible in further work.estimation if possible in further work.
To solve the issues above definitely will provide To solve the issues above definitely will provide more reliable and meaningful disease maps for more reliable and meaningful disease maps for public health surveillancepublic health surveillance