Presentation to the Santee Cooper Evaluation and ...
77
Central Electric Power Cooperative, Inc. Presentation to the Santee Cooper Evaluation and Recommendation Committee September 26, 2018
Transcript of Presentation to the Santee Cooper Evaluation and ...

Central Electric Power Cooperative, Inc.
Presentation to the Santee Cooper Evaluation and Recommendation Committee
September 26, 2018
Agenda
2
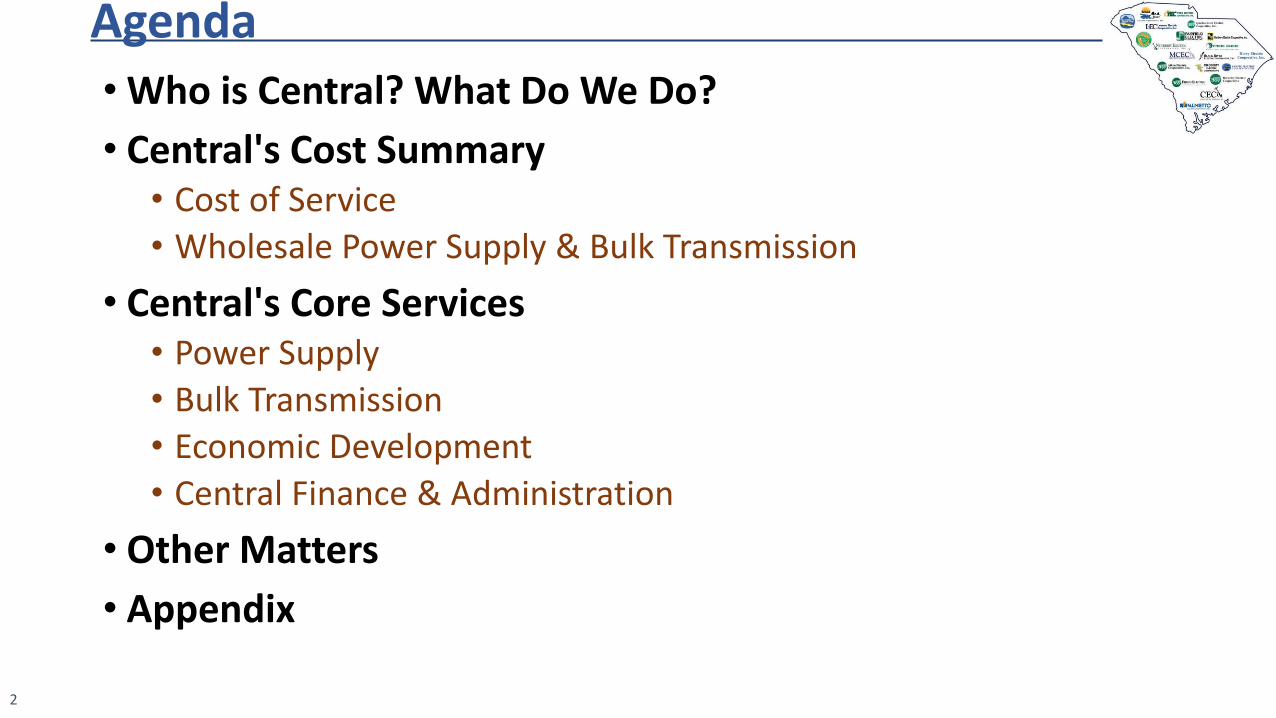
• Who is Central? What Do We Do?
• Central's Cost Summary• Cost of Service
• Wholesale Power Supply & Bulk Transmission
• Central's Core Services• Power Supply
• Bulk Transmission
• Economic Development
• Central Finance & Administration
• Other Matters
• Appendix

Agenda
3
• Who is Central? What Do We Do?
• Central's Cost Summary• Cost of Service
• Wholesale Power Supply & Bulk Transmission
• Central's Core Services• Power Supply
• Bulk Transmission
• Economic Development
• Central Finance & Administration
• Other Matters
• Appendix

Central Basics
4
A “generation and transmission” (G&T) electric cooperative• Business model is not-for-profit, cost-of-service• Member-owned private company owned by distribution cooperatives• Overseen by representatives of its membership• Board comprised of two representatives from each of the 20
distribution cooperativesPurpose:
• Wholesale power and transmission aggregation • Pool resources to meet those needs reliably and more cost-effectively
Function: • Power supply and transmission aggregator• The nature of these services lends itself to aggregation• Produces benefits for cooperative consumers
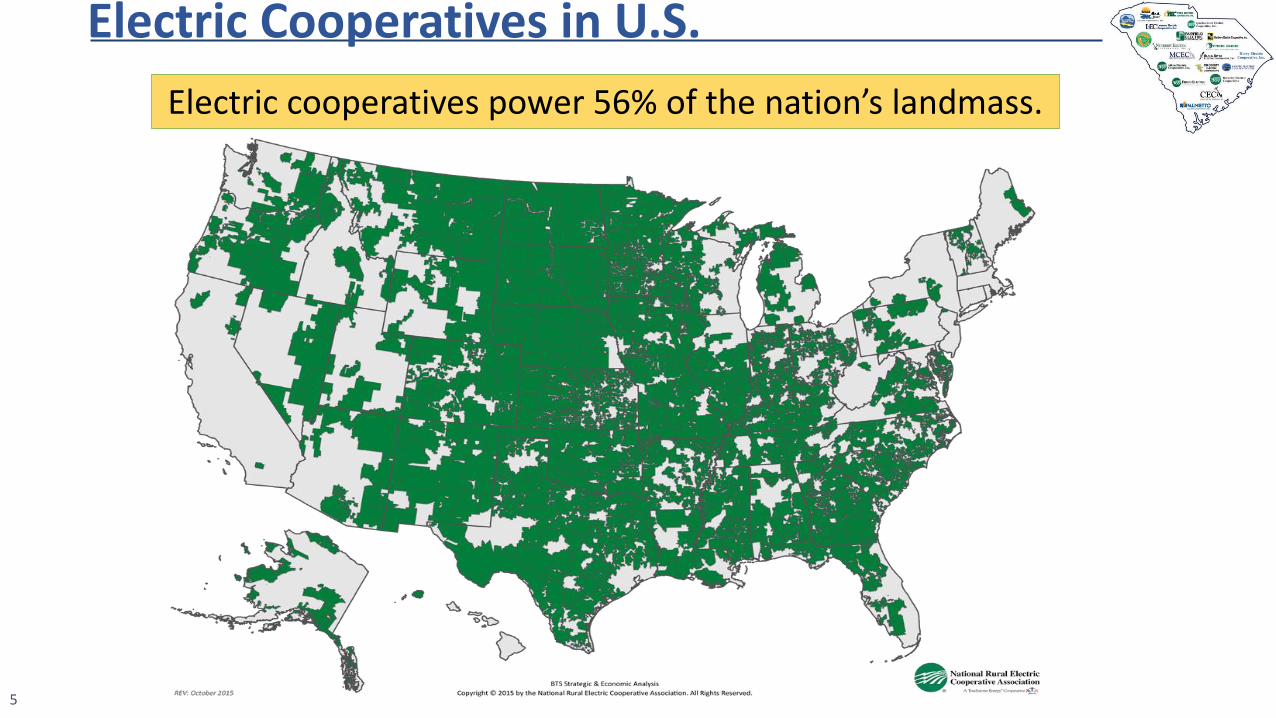
Electric Cooperatives in U.S.
5
Electric cooperatives power 56% of the nation’s landmass.

Co-op Generation and Transmission Providers
6
Where you see distribution co-ops, you see G&T co-ops
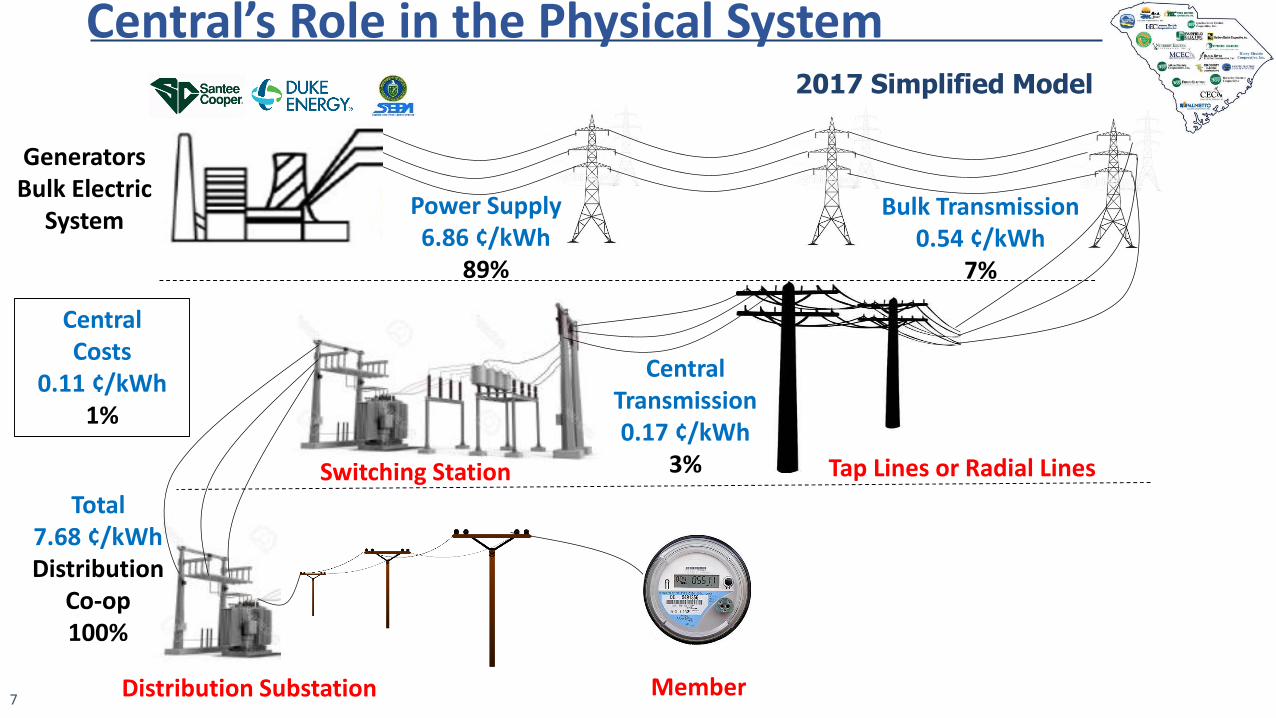
Central’s Role in the Physical System2017 Simplified Model
7
GeneratorsBulk Electric
System
Tap Lines or Radial LinesSwitching Station
Distribution Substation Member
CentralTransmission0.17 ¢/kWh
3%
Total7.68 ¢/kWh Distribution
Co-op100%
Power Supply6.86 ¢/kWh
89%
Bulk Transmission0.54 ¢/kWh
7%
CentralCosts
0.11 ¢/kWh1%

Make up of Central’s Cost
8
• Power Supply 6.86 ¢/kWh• Duke, Santee Cooper, SEPA
• Bulk Transmission 0.54 ¢/kWh• Duke, Santee Cooper, SEPA, SCE&G
• Central Transmission 0.17 ¢/kWh
• Central Costs 0.11 ¢/kWh
0 1 2 3 4 5 6 7 8 9
7.68 ₵/kWh

Making Sense of Energy and Demand
9
ENERGY – Amount of electricity used in a period of time in kilowatt-hours.
PEAK DEMAND – Maximum energy used at a point in time in kilowatts.
24 Hour Load Shapes
Residential Industrial

Load Factor
Load factor – a measure of how efficiently you use power.
• High load factor • An industry with motors and machines running constantly
• Low load factor • A home or group of homes that use power more variably
• Utilities with lots of industries usually have high load factors.
• Utilities with lots of homes and small businesses have lower load factor.
10

Comparing InvoicesIllustration
11
Key PointsEnergy consumption and charges vary.“Rate” changes with energy consumption, but similar demand.
Essential ConceptEnergy rates are often used to compare electric charges, however an accurate comparison must consider load factor when discussing wholesale rates.
Load Factor is the relationship between peak demand and energy that measures the effectiveness of usage.
Rate (₵/kWh) Load Factor
Typical 2017 Co-op Bill from Central 7.68 59%
Low Load Factor Co-op Bill 8.25 52%
High Load Factor Co-op Bill 6.82 77%
See Slide No. 65 in Appendix for detailed calculations

Agenda
12
• Who is Central? What Do We Do?
• Central's Cost Summary• Cost of Service
• Wholesale Power Supply & Bulk Transmission
• Central's Core Services• Power Supply
• Bulk Transmission
• Economic Development
• Central Finance & Administration
• Other Matters
• Appendix

96%
4%
2017 Cost of Service$1,306 Million
Central Costs$55 Million
Central “Cost of Service” to Electric Co-ops
13
Wholesale Power Supply & Bulk Transmission
$1,251 Million
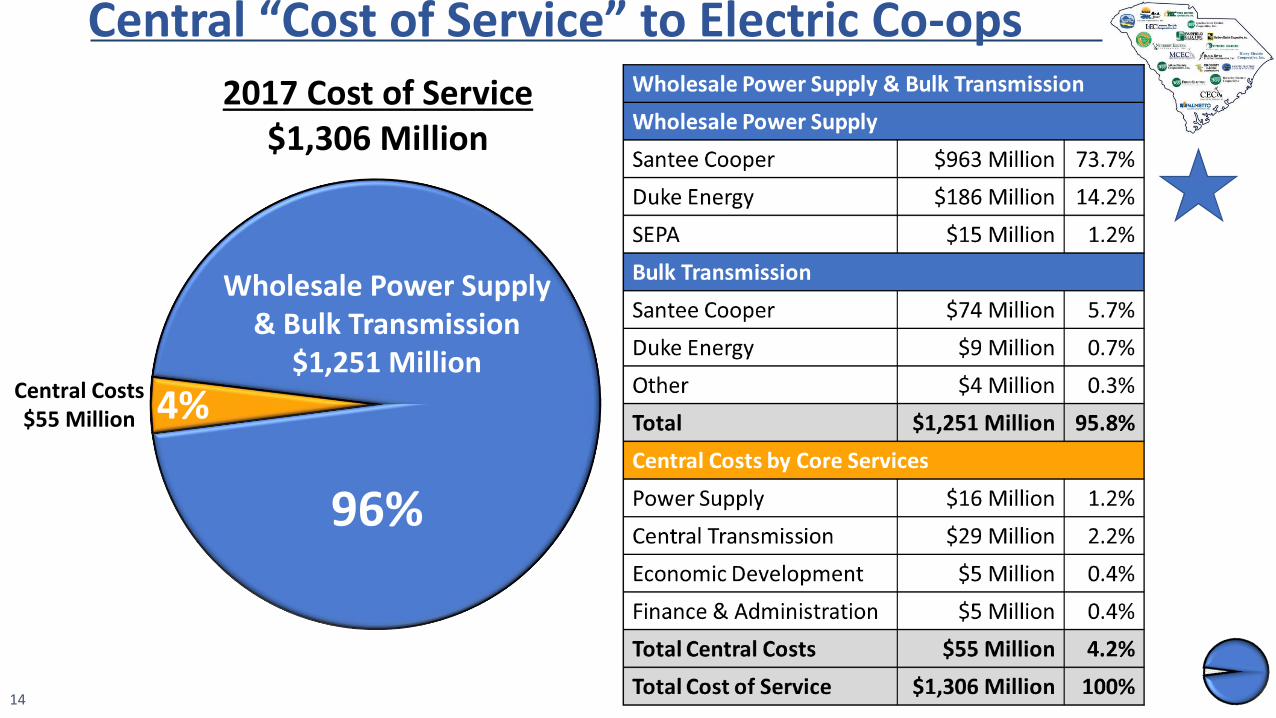
96%
4%
2017 Cost of Service$1,306 Million
Central Costs$55 Million
Central “Cost of Service” to Electric Co-ops
14
Wholesale Power Supply & Bulk Transmission
$1,251 Million

Central Power Supply Mix
15
Source of wholesale power – mainly long-term contracts• Board direction – leverage companies with expertise in developing
and operating generation assets
• Common business model – numerous co-ops and municipal entities
Power Suppliers• Santee Cooper
• All power requirements for co-op deliveries in Santee Cooper territory
• Duke Energy Carolinas (Duke)• All power requirements for co-op deliveries in Duke territory
• Southeastern Power Administration (SEPA)• Hydro generation entitlements assigned to co-ops
See Slide No. 66 in Appendix for contract summaries

Energy Supply by Generation Source
16
39%
23%
16%
2% 20%
2017 Central Weighted Avg Mix
42%
25%
10%
2% 21%
2017 Santee Cooper
28%
12%48%
1%11%
2017 Duke

$37.67
$30.86
$9.55
$31.78$29.69$27.46
$6.94
$16.91
$29.32
Coal Natural Gas Nuclear Weighted Average
2017 Fuel Cost $/MWh
Santee Cooper Duke Central
Fuel Cost of Power Suppliers and Central's Mix
17
Coal NuclearNatural Gas Weighted Average

Power Supply Costs
18
$66.61
$59.10$63.72 $65.34
2017 Purchased Power $/MWh
Santee Cooper Duke SEPA Central
Adjusted for Adjust to Actuals and excludes Bulk Transmission Costs

96%
4%
2017 Cost of Service$1,306 Million
Central Costs$55 Million
Central “Cost of Service” to Electric Co-ops
19
Wholesale Power Supply & Bulk Transmission
$1,251 Million

Contract Summary - Transmission
20
• Central serves as aggregator for all 20 co-ops
• Central has multiple transmission agreements• Santee Cooper – Coordination Agreement (which also governs
power supply terms)
• Duke and SCE&G – Network Integrated Transmission System Agreement (NITSA)
• Southeastern Power Administration (SEPA)

Transmission Provider Reliability and Costs
21
Transmission ProviderReliability
Percentage
Santee Cooper 99.9977%
Duke 99.9973%
Transmission Provider Cost ($ Millions)
Santee Cooper $74
Duke $9
SCE&G $1
SEPA $3
Reliability percentages relate to Central’s delivery points from Santee Cooper and Duke

Agenda
22
• Who is Central? What Do We Do?
• Central's Cost Summary• Cost of Service
• Wholesale Power Supply & Bulk Transmission
• Central's Core Services• Power Supply
• Bulk Transmission
• Economic Development
• Central Finance & Administration
• Other Matters
• Appendix

96%
4%
2017 Cost of Service$1,306 Million
Central Costs$55 Million
Central “Cost of Service” to Electric Co-ops
23
Wholesale Power Supply & Bulk Transmission
$1,251 Million

Central “Cost of Service” to Electric Co-ops
24
Central Costs by Core Services $55 million
Power Supply $16 million 1.2%
Central Transmission $29 million 2.2%
Economic Development $5 million 0.4%
Finance & Administration $5 million 0.4%
Central Costs by Category $55 million
Payroll & Benefits $9 million 0.7%
Transmission Investment $29 million 2.2%
Department O&M $8 million 0.6%
Economic Development $5 million 0.4%
Net Margins $3 million 0.2%
Governance $1 million 0.1%
Power Supply$1,166 MillionPower Supply
$1,166 MillionPower Supply$1,166 Million
96%
4%
2017 Cost of Service$1,306 Million
Central Costs$55 Million
Wholesale Power Supply & Bulk Transmission
$1,251 Million

Power Supply

Power Supply
26
• Negotiate wholesale power supply agreements
• Manage existing agreements
• Ensure commercial terms are met
• Pursue amendments as the wholesale market evolves over the life of these long-term agreements
• Conduct annual cost-of-service audits for wholesale power supply and transmission agreements
• Validate proper accounting treatment of charges
• Develop and manage community solar projects on behalf of the cooperatives

Distribution Cooperative Service Programs
27
• Energy use audits for commercial & industrial (C&I) and agriculture consumers
• C&I Lighting
• Demand Management• Water Heater and HVAC Load Control
• Smart Thermostats
• "Beat the Peak"
• Electric Vehicle Charging Station – Residential (Pilot Program)
• Program Research and Development

Contract Negotiation – Duke PPADuke Energy Carolinas Power Purchase Agreement
(2013 – 2030)
• Signing the PPA with Duke enabled the following benefits• Diversified power suppliers to mitigate risk
• Fuel diversification from generation resources
• Reduction of load on Santee Cooper system• Elimination of need for construction of Pee Dee coal station
• Lowered Santee Cooper’s future debt service requirements
• Savings$1.8 billion Distribution Cooperatives
$0.8 billion Santee Cooper Direct-Served Customers
$2.6 billion Total Santee Cooper System
28

Contract Negotiation – 2013 AmendmentSantee Cooper Coordination Agreement
(2013 – 2058)
• Central power supply savings passed directly to co-ops$0.8 billion Debt Restructuring
$0.5 billion Contract Modifications
$1.3 billion Total Savings
29

Power Supply – (Continued)
30
• Contract Management$90 million Duke Contract Amendment
• Annual Cost of Service Audits$42 million Santee Cooper Agreement
$ 8 million Duke Agreement

Power Supply - (Continued)
31
•Community Solar• 31 projects in 18 counties across South Carolina
• 21 projects are completed
• 10 projects are in planning/construction stages
• Installed capacity will be ~5 MWac
• 8 million kWh lifetime generation to date as of 9/1/18 (power 600 homes)

Central Transmission

Central Transmission
33
• Design and construct radial transmission lines to deliver power to co-op substations• Right of way survey and acquisition
• Transmission design and construction
• Costs are comprised of depreciation, interest, and property taxes on transmission investment
• Negotiate and manage transmission service agreements with transmission providers

Central Transmission Ownership
34
• Central owns 799 miles of transmission lines• In the 1950s-1970s, Central financed 2,042 (40%)miles of
Santee Cooper’s system
• Central contracts for operations and maintenance of its transmission lines to Santee Cooper and New Horizon
• 454 Delivery Points (substations)• Santee Cooper 332
• Duke 113
• SCE&G 9
• 307 Industrial Meters
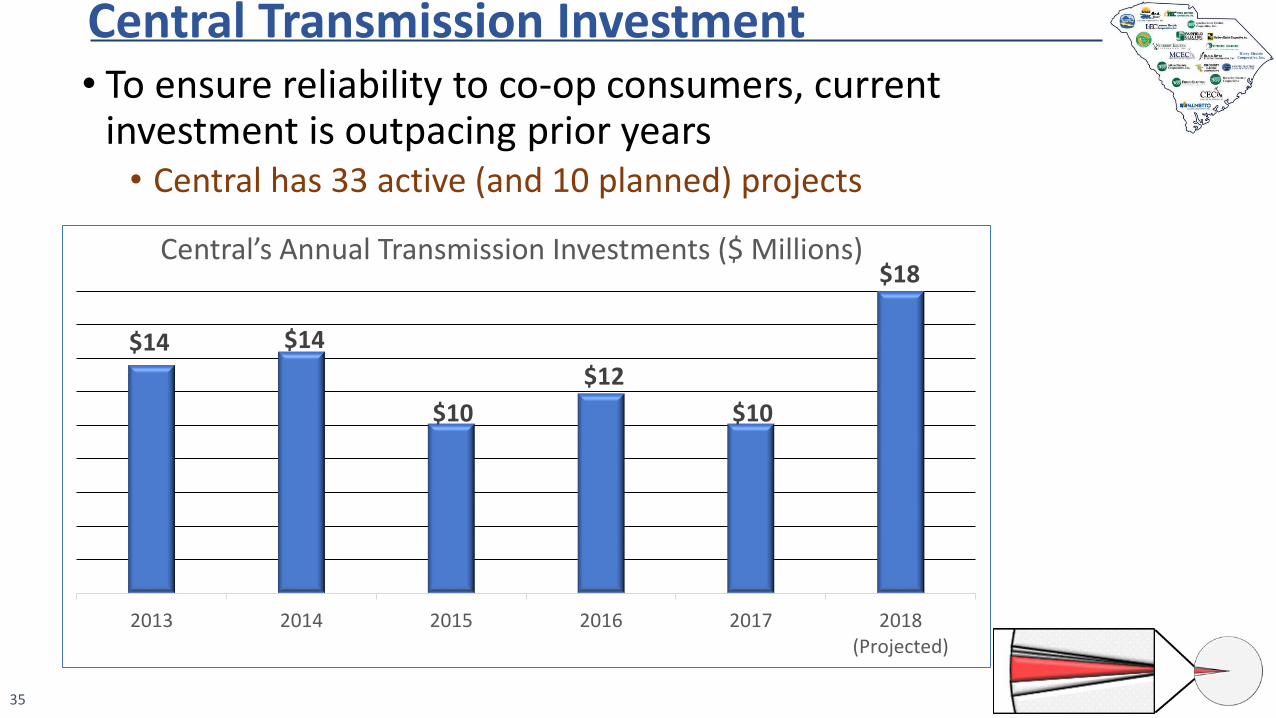
Central Transmission Investment
35
• To ensure reliability to co-op consumers, current investment is outpacing prior years • Central has 33 active (and 10 planned) projects
$14 $14
$10
$12
$10
$18
2013 2014 2015 2016 2017 2018(Projected)
Central’s Annual Transmission Investments ($ Millions)
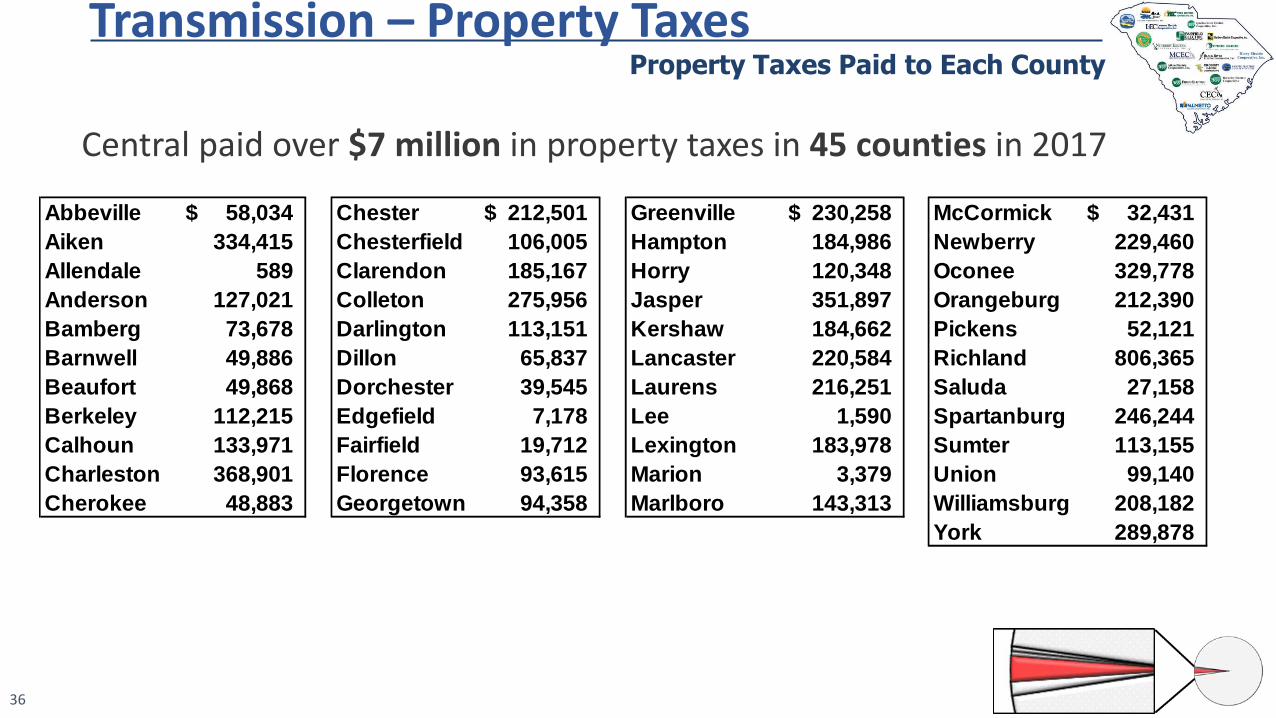
Abbeville 58,034$ Chester 212,501$ Greenville 230,258$ McCormick 32,431$
Aiken 334,415 Chesterfield 106,005 Hampton 184,986 Newberry 229,460
Allendale 589 Clarendon 185,167 Horry 120,348 Oconee 329,778
Anderson 127,021 Colleton 275,956 Jasper 351,897 Orangeburg 212,390
Bamberg 73,678 Darlington 113,151 Kershaw 184,662 Pickens 52,121
Barnwell 49,886 Dillon 65,837 Lancaster 220,584 Richland 806,365
Beaufort 49,868 Dorchester 39,545 Laurens 216,251 Saluda 27,158
Berkeley 112,215 Edgefield 7,178 Lee 1,590 Spartanburg 246,244
Calhoun 133,971 Fairfield 19,712 Lexington 183,978 Sumter 113,155
Charleston 368,901 Florence 93,615 Marion 3,379 Union 99,140
Cherokee 48,883 Georgetown 94,358 Marlboro 143,313 Williamsburg 208,182
York 289,878
Transmission – Property TaxesProperty Taxes Paid to Each County
Central paid over $7 million in property taxes in 45 counties in 2017
36

Economic Development

Electric Co-ops Commitment to Economic Development
• 2014 - Electric co-ops redesigned their economic development strategy• Three areas of focus to deliver results
• Incentives for critical project requirements with targeted return on investment
• Development of infrastructure for market-ready sites
• Assist communities in articulating their workforce assets
• 2017 - Electric co-op decision to take sole control of SC Power Team• Historically a joint venture with Santee Cooper
• Focus efforts on service areas of co-ops
• SC Power Team recently named one of the Top Utilities in Economic Development by Site Selection magazine
38

Economic Development – Co-op Driven
39
• 2014 – 2017 co-ops exceeded strategic goals• 25,688 jobs announced
• Capital investment of $5 billion
• Electric co-op load growth lowers the average costs for all co-op and Santee Cooper consumers
• Co-op incentives to projects were critical factors of success

Economic Development – Co-op Driven
40
• Central works with its power suppliers on economic development for co-op areas• Coordination with Duke on opportunities where co-ops can
serve customers directly
• Co-op commitment of $30 million to site infrastructure improvements
• Santee Cooper responds to co-op led efforts with loans, grants and other services
• Central pays its share of these Santee Cooper loans and grants• 100% for territories not served by Santee Cooper
• Pro rata share for territories served by Santee Cooper

Economic Development – Examples of Success
41
Year Announced 2015;2017 2017 2015 2017 2014
Served By
Edisto Electric Co-opFinancial support -Berkeley Electric
Co-op
Newberry Electric Co-op
Broad River Electric Co-op
Pee Dee Electric Co-op
York Electric Co-op
Co-op Funding $1.725 million $3.750 million $260,000 $200,000 $700,000
# of Announced Jobs
3,900 950 1,000 705 6,400
Total Capital Investment
$1.2 BillionInitial investment
& expansion$380 Million $194 Million $79 Million $284 Million

Finance and Administration

Finance and Administration
43
• Provide Board and Central staff financial information to make quality decisions
• Ensure Central is operated in an efficient and effective manner (includes Finance, Accounting, HR, IT, Risk Management, and Strategic Planning)
• Provide long-term financing to fund transmission projects
• Manage debt to minimize costs to distribution co-ops
• Ensure adequate working capital

Central’s Financial Model – 4 Principles
44
All 4 principles work together to minimize Central impact on co-op rates
1. Minimize Central’s equity levels In 2017, Central’s equity was 12% of total assets. Net margins were 0.2% ($3.2 million) of total revenue requirements.
2. Keep long-term financing costs low Central’s weighted average interest rate on long-term debt is 2.62%
3. Minimize the need for working capital Central pays its power suppliers after the distribution co-ops pay Central
4. Collect all revenue requirements without built-in cushion Rate autonomy and intra-year rate adjustments allow Central to collect only the amount it needs to recover costs and margins

Central takes advantage of low cost financing available under the USDA Rural Utilities Service (“RUS”) program. This program is available to all electric cooperatives and provides access to low cost financing – interest rates are set at U.S. Treasury rates plus ⅛ %. Central’s weighted average rate on RUS debt was 2.71% in 2017.
Rural Utilities Service (RUS) Requirements
45
Central must comply with RUS requirements, including:
• Following RUS’ competitive bid process in awarding construction contracts• Using RUS approved design and construction standards and materials
RUS must be notified prior to:
• Changes to Central’s overall rate structure• Changes to or termination of any Central/Member wholesale power contract• Material changes to existing power supply contracts
See Appendix – Page 68 for more information

Central Governance - Board and Committee Structure
46
The Board
40 Trustees
Executive
8 Trustees
Finance, Audit, & Risk
10 Trustees
Engineering & Planning
10 Trustees
Power Committee
10 Trustees
Member & Energy Services
10 Trustees
Committees
The Board meets a minimum of six times per year - every other month beginning in
January
The Executive Committee meets a minimum of six times per year - every other month
beginning in February
SC Power Team Board
11 Trustees

Central Governance - Board Per Diems
47
• Central
• Pays board per diem, per day of meeting attendance.
• Sets per diem by full board vote, based upon national survey of G&Ts.
• Reimburses for travel expenses; provides travel and accidental death & dismemberment insurance while on Central business.
• Provides no other benefits to the board.
• The reasons we pay:
• Board membership creates a fiduciary duty to Central. Per diem is a formal acknowledgement of that responsibility.
• Trustees accept the risk and responsibility of being a board member.
• Payable to either the board member or the distribution co-op

Central Governance - Board Per Diems
2016Average per
diem per person
Central $15,102Georgia Transmission $ 8,971
ODEC (VA, MD, DE) $15,200
East Kentucky $27,107
North Carolina EMC $ 0
Cooperative Energy (MS) $ 24,272
Oglethorpe (GA) $23,268
48
Central 2016
Total Board Expenses $789,655
Per diem $709
Average # of meetings per person 21
Source Peer Group: 2016 IRS Form 990 on Guidestar.org or2017 SEC 10K for Oglethorpe

$4,430 $5,071 $5,147 $5,533 $5,836
$1,913$2,063 $2,071
$2,298$2,682
46 4748 48 50
0
10
20
30
40
50
$0
$2,000
$4,000
$6,000
$8,000
$10,000
$12,000
2013 2014 2015 2016 2017
Payroll Benefits Headcount
$7,134 $7,218$7,831
$8,518
Central Employee Costs ($’s in Thousands)
49
$6,343
See Appendix – Employee Benefits Detail is available on Pages 69-74

Executive CompensationExecutive Compensation - CEO
50
Board policy sets the evaluation and compensation of Central’s CEO
• Performance evaluated annually through process of• Survey completed by each board member, administered by an independent
third-party• In-depth performance review by Executive Committee of the Board
• Executive Committee sets compensation based on multiple factors, including comparative salary information from peer group G&Ts
• Board approves any written employment contracts with the CEO

Executive CompensationExecutive Compensation - CEO
51
2016 W-2 Wages 1 Other Compensation2 Total Compensation 3
Central $496,200 $163,279 $659,479Georgia Transmission $460,320 $96,596 $556,916
ODEC (VA, MD, DE) $668,117 $241,159 $909,279
East Kentucky $818,359 $649,729 $1,472,165
North Carolina EMC $887,323 $229,381 $1,116,704
Cooperative Energy (MS) $834,912 $102,411 $937,323
Oglethorpe (GA) $683,550 $265,780 $949,330
Source Peer Group: 2016 IRS Form 990 on Guidestar.orgOglethorpe: 2017 Annual 10k Report, Summary Compensation Table
1 IRS Form 990 Part VII, Column D (W-2 Box 5 compensation and includes salary & taxable benefits)2 IRS Form 990 Part VII, Column F (includes: actuarial increase in pension plan benefit, 401k co-op contributions, health insurance benefits)3 IRS Form 990 Schedule J Part II Column F

Executive CompensationSenior Staff Average
52
20164 W-2 Wages 1 Other Compensation 2 Total Compensation 3
Central $266,351 $156,744 $423,096Georgia Transmission $242,884 $86,012 $328,896
ODEC (VA, MD, DE) $264,702 $201,789 $466,491
East Kentucky $318,592 $105,571 $424,159
North Carolina EMC $321,089 $98,114 $419,202
Cooperative Energy (MS) $335,170 $91,855 $427,024
1 IRS Form 990 Part VII, Column D (W-2 Box 5 compensation and includes salary & taxable benefits)2 IRS Form 990 Part VII, Column F (includes: actuarial increase in pension plan benefit, 401k co-op contributions, health insurance benefits)
3 IRS Form 990 Schedule J Part II Column F4 Averages of non-CEO Officers and Key Employees
Source Peer Group: 2016 IRS Form 990 on Guidestar.org
“Senior Staff” – Non-CEO Officers and “Key Employees” (as defined by RUS 990)

Agenda
53
• Who is Central? What Do We Do?
• Central's Cost Summary• Cost of Service
• Wholesale Power Supply & Bulk Transmission
• Central's Core Services• Power Supply
• Bulk Transmission
• Economic Development
• Central Finance & Administration
• Other Matters
• Appendix
Legal and Contractual
Matters

Central Organization
January 15, 1948 - Central Electric Power Cooperative, Inc. was formed
Created under SC Code Section 33-49-220 which allows “two or more cooperatives” to form a cooperative
Seven local distribution cooperatives formed Central for the purpose of providing generation and transmission services
Central currently has 20 cooperative members
55
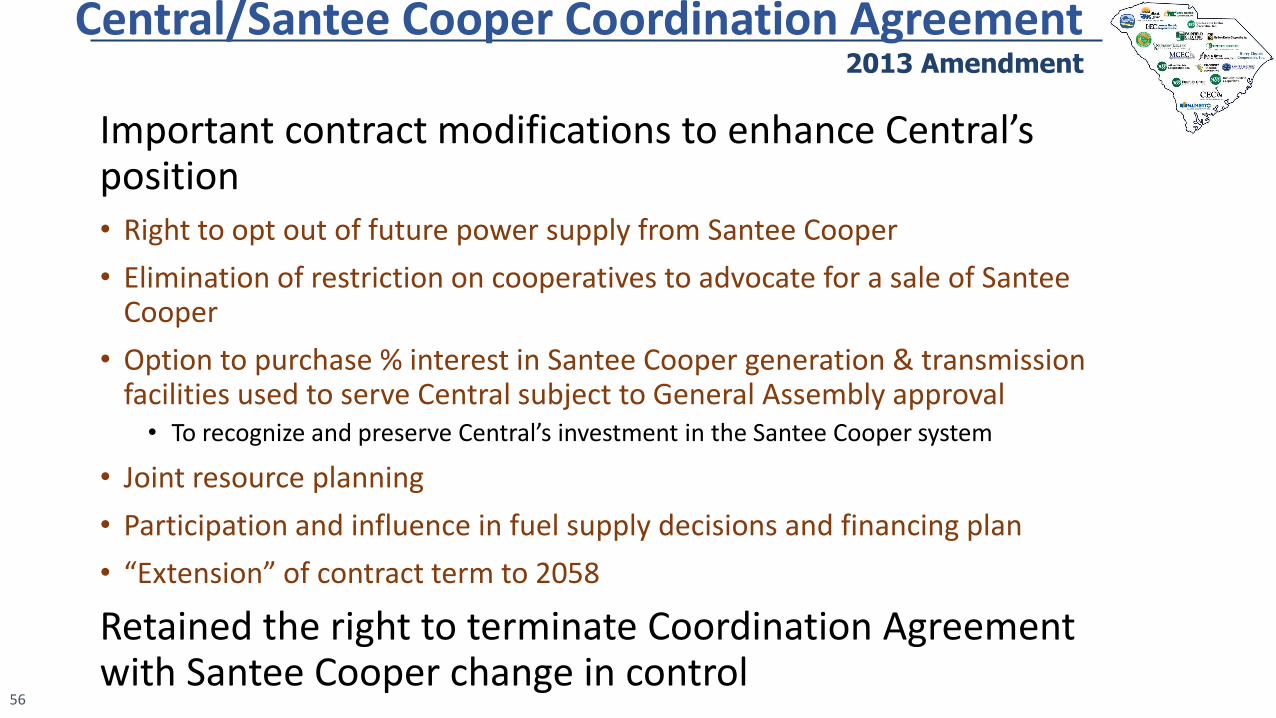
Central/Santee Cooper Coordination Agreement2013 Amendment
Important contract modifications to enhance Central’s position• Right to opt out of future power supply from Santee Cooper
• Elimination of restriction on cooperatives to advocate for a sale of Santee Cooper
• Option to purchase % interest in Santee Cooper generation & transmission facilities used to serve Central subject to General Assembly approval• To recognize and preserve Central’s investment in the Santee Cooper system
• Joint resource planning
• Participation and influence in fuel supply decisions and financing plan
• “Extension” of contract term to 2058
Retained the right to terminate Coordination Agreement with Santee Cooper change in control
56

Litigation

Santee Cooper V.C. Summer Litigation
58
Cook, several other named plaintiffs, and all others similarly situatedvs
Santee Cooper, its directors, Central, Palmetto Electric Cooperative, and SCANA
• Central was named as a defendant in the Cook case in September 2017• Cross-claim against Santee Cooper asserted in February 2018
• Central’s cross-claims against Santee Cooper are a subset of this larger class action case
• The claims of the plaintiffs are similar to those of Central. The plaintiffs class ( if certified ) will include all of the retail customers of Santee Cooper and all of the members of the Cooperatives.

Central’s Claims
59
1. Inclusion in rates of cost of failed nuclear project is not allowed under the statutory authority granted to Santee Cooper by the General Assembly
• Santee Cooper has the power to build, acquire, construct, and maintain power houses and any and all structures, …, including power transmission lines, poles, telephone lines, substations, transformers, and generally all things used or useful in the manufacture, distribution, purchase, and sale of power generated by water, steam, or otherwise. (§ 58-31-30(A)(7))
• Santee Cooper can only charge for the “use of their facilities” or for “services rendered.” (§ 58-31-30(A)(13))

Central’s Claims
60
2. Inclusion of the cost of the failed project in rates violates the statutory requirement that rates be just and reasonable (§ 58-31-55(A)(3)(a))
3. Santee Cooper has breached its contract with Central by recovering costs that are not reasonable and not related to providing services, and exhibited bad faith in failing to make material disclosures to Central
4. Constructive trust for Toshiba/Citibank funds

Petition to Supreme Court
61
• Santee Cooper filed a petition asking the Supreme Court to take the case in its original jurisdiction and stop all other related litigation
• Central opposed this petition
• Plaintiffs filed their opposition to Santee Cooper’s petition on August 27, 2018

Current Status of Litigation
62
• Motion of Santee Cooper to dismiss the claims of its ratepayers, the cooperative customers, and Central was heard by Judge John Hayes on September 20, 2018
• Petition to the Supreme Court by Santee Cooper to have the Court take original jurisdiction of all the Santee Cooper cases is pending
• Full discovery has not commenced

Final Summary
Central is committed to transparency of its operations and governance
Central and the electric cooperatives encourage this Committee to complete an evaluation of Santee Cooper
• Central has directly heard several viable offers from third parties
• Central’s interest is the solution that provides the optimal value for cooperative consumers
63

Appendix

Comparing Invoices – Calculation SupportIllustration
65
Typical Member BillUnits x Rate = Cost
Peak Demand (kW) 158,400 x $16.60 = $2,630,135
Energy (kWh) 70,049,848 x $0.0393 = $2,752,503
Total = $5,382,638
Average $5,382,638 ÷ 70,049,848 = $0.0768
Low Load Factor Member BillUnits x Rate = Cost
Peak Demand (kW) 158,400 x $16.60 = $2,630,135
Energy (kWh) 60,872,483 x $0.0393 = $2,392,419
Total = $5,022,554
Average $5,022,554 ÷ 60,872,483 = $0.0825
High Load Factor Member BillUnits x Rate = Cost
Peak Demand (kW) 158,400 x $16.60 = $2,630,135
Energy (kWh) 91,112,363 x $0.0393 = $3,580,270
Total = $6,210,405
Average $6,210,405 ÷ 91,112,363 = $0.0682
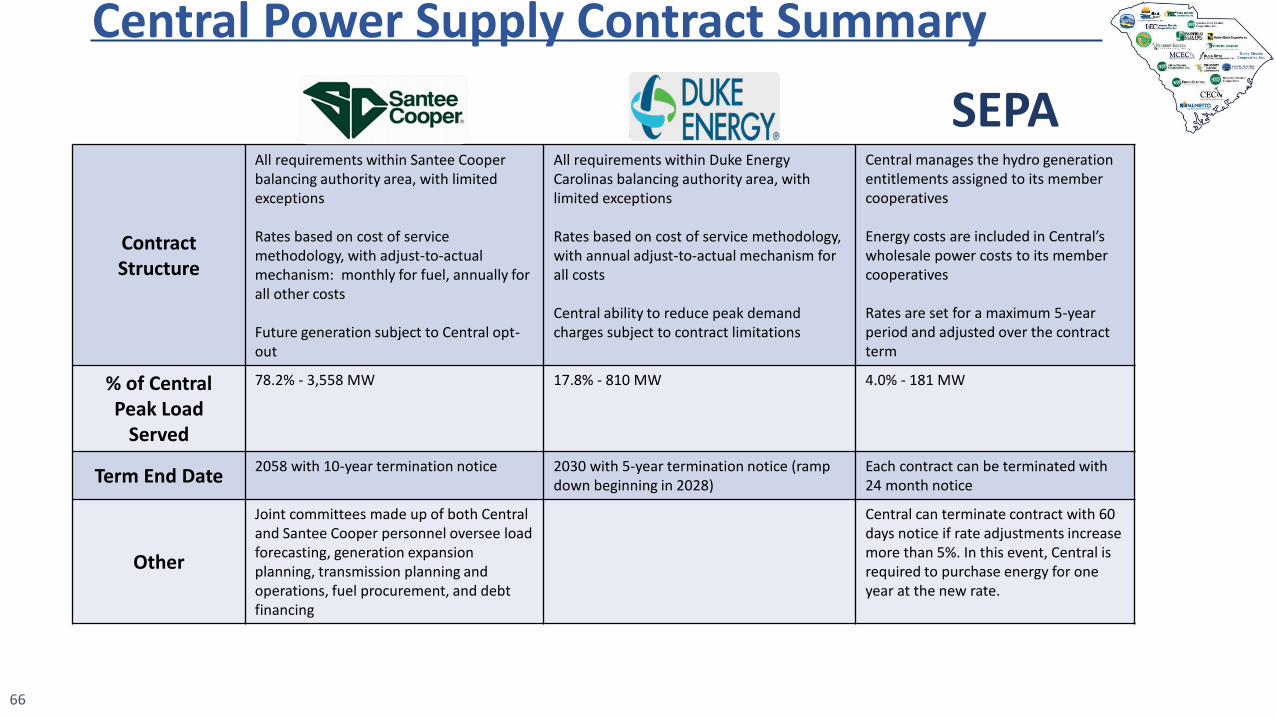
Central Power Supply Contract Summary
66
Contract Structure
All requirements within Santee Cooper balancing authority area, with limited exceptions
Rates based on cost of service methodology, with adjust-to-actual mechanism: monthly for fuel, annually for all other costs
Future generation subject to Central opt-out
All requirements within Duke Energy Carolinas balancing authority area, with limited exceptions
Rates based on cost of service methodology, with annual adjust-to-actual mechanism for all costs
Central ability to reduce peak demand charges subject to contract limitations
Central manages the hydro generation entitlements assigned to its member cooperatives
Energy costs are included in Central’s wholesale power costs to its member cooperatives
Rates are set for a maximum 5-year period and adjusted over the contract term
% of Central Peak Load
Served
78.2% - 3,558 MW 17.8% - 810 MW 4.0% - 181 MW
Term End Date2058 with 10-year termination notice 2030 with 5-year termination notice (ramp
down beginning in 2028)Each contract can be terminated with 24 month notice
Other
Joint committees made up of both Central and Santee Cooper personnel oversee load forecasting, generation expansion planning, transmission planning and operations, fuel procurement, and debt financing
Central can terminate contract with 60 days notice if rate adjustments increase more than 5%. In this event, Central is required to purchase energy for one year at the new rate.
SEPA

1934 1938 1948 19501950s-1970s
1980 1988 2009 2013 2013
History of Central’s Power Supply Contracts1934 – 2013
67
Santee Cooper
created to construct lakes &
hydro plant at Pinopolis
First electric cooperative formed in
SC(Aiken)
Central formed by seven co-ops (Aiken, Black River, Lynches River, Mid-Carolina, Salkehatchie & Tri-
County)
Original agreement
between Central & Santee Cooper
executed(thru 1985)
Updated agreement
(“CA”) between Central &
Santee Cooper (thru 2023)
Amended power purchase
agreement (“CA”) between
Central & Santee Cooper
(thru 2023)
Central finances generation and
transmission assets on behalf of Santee
Cooper system and leases those facilities
to Santee Cooper
Central and Duke power
purchase agreement
effective January 1, 2013
(thru 2030)
Amended power purchase
agreement (“CA”) between Central &
Santee Cooper(thru 2058)
Central and Santee Cooper
Agreement to extend CA (thru 2030)

Central takes advantage of low cost financing available under the USDA Rural Utilities Service (“RUS”) program. This program is available to all electric cooperatives and provides access to low cost financing – interest rates are set at US Treasury rates plus ⅛ %. Central’s weighted average rate on RUS debt was 2.71% in 2017.
The terms and conditions of borrowing under the this program translates into RUS becoming a de facto regulator.
Central must comply with the following in order to continue to borrow: RUS must approve Central’s:
Load Forecast Construction Work Plan Financial Forecast
Projects must receive RUS environmental clearance prior to inclusion in a loan application Central must:
Follow RUS’ competitive bid process in awarding construction contracts Use RUS approved design and construction standards and materials
RUS must be notified prior to: Asset additions or dispositions greater than certain thresholds Changes to Central’s overall rate structure Changes to or termination of any Member wholesale power contract Material changes to existing power supply contracts and certain changes to transmission contracts New power supply or transmission contracts that exceed specified thresholds Short-term indebtedness exceeding certain levels
This notification includes a timeframe for RUS to raise objections to any of the above. If RUS objects, Central may not proceedwith the transaction.
Central Financial Model – RUS Requirements
68

Central BenefitsBenefits - Retirement Plans
NRECA Retirement & Security Plan
Eligibility: All full time employees after 1-year waiting period
Benefit: Age 62 PlanQuasi-retirement option availableAnnual COLA adjustment1.8% of average of highest salaries over 5 year period times # of years of service
2017 Cost: $1,399,339
69

Central BenefitsBenefits - Supplemental Retirement Plans
70
Pension Restoration Plan (closed to new participants in 2014) (2 Participants)
Provides retiree benefits mirroring RS Plan for amounts above IRS limitations. Payments are made to NRECA as part of RS Plan monthly billing. At vesting date (age 62), Central pays the participant a lump sum (calculated by NRECA actuary) which is considered regular wages with federal and state withholding and reported on participant’s W-2 and Central’s 990. Central withholds payment on its monthly RS Plan billing until the lump sum is recouped.
2017 Cost: Included in RS Plan
Executive Benefit Restoration Plan (replaced PRP in 2014) (2 Current Participants)
Provides retiree benefits mirroring RS Plan for amounts above IRS limitations. A Homestead account has been established for each participant, owned by Central. Annual NRECA actuarial calculations create the accounting entries/footnote disclosures and provide the amount to be deposited into each participant’s account. At vesting date (age 62), Central pays the participant a lump sum (calculated by NRECA actuary) from the participant’s Homestead account. The lump sum is considered regular wages with federal and state withholding and reported on the participant’s W-2 and Central’s 990.
2017 Cost: $324,584 expense as calculated by NRECA actuary

Central BenefitsBenefits - Retirement Plans
401(k)Plan
Eligibility: All full time employees after 1-month waiting period
Benefit: 3% contribution (creates Safe Harbor Plan, eliminating some discrimination testing)100% match on employee contributions up to 2.3%
2017 Central Contributions: $293,858
71
Postretirement Health Insurance
Eligibility: All employees hired prior to 2009
Benefit: Retiree health insurance coverage until Medicare eligibility (age 65) followed byMedicare Supplemental Insurance(Note: For retirees prior to 2010, Central pays 50% of spouse coverage also)
Central has established an irrevocable trust to hold assets to pay these benefits. At 12/31/17, the balance of the trust was $5 million compared to an estimated liability of $3.8 million.
2017 Cost: Negative $116,900 based on the actuarial calculation of plan liabilities

Central BenefitsBenefits - Deferred Compensation Plan
457(b) Deferred Compensation Plan for Employee
Eligibility: Senior Staff
Benefit: Employee can defer compensation up to IRS limitations ($18,500)
Benefit Cost: No cost to Central other than Administration fees
72
457(b) Deferred Compensation Plan for Directors
Eligibility: Central’s Board of Directors
Benefit: Director can defer the payment of per diems up to IRS limitations($18,500)
Benefit Cost: No cost to Central other than Administration fees

Central BenefitsBenefits -Insurance Plans
Health Insurance (NRECA Group Insurance Plan)
Eligibility: All Full Time Employees
Medical, Dental, Vision Insurance (NRECA Group Insurance Plan)
Benefit: Central pays 100% of employee coverage and 50% of all additional coverage
2017 Cost: $629,088
73
Life Insurance (NRECA Group Insurance Plan)
Eligibility: All Full Time Employees
Benefit: Life insurance for employee: up to 3 times salary (Employee can purchase additional coverage, including spouse, paying all the additionalpremiums)
2017 Cost: $46,564
Spousal Life Insurance (NRECA Group Insurance Plan)
Eligibility: All Full Time Employees
Benefit: $10,000 life insurance on spouse
2017 Cost: Included in Life Insurance above

Central BenefitsBenefits - Disability Insurance
74
Long-term Disability Insurance (NRECA Group Insurance Plan)
Eligibility: All Full Time Employees
Benefit: 67% of salary upon total disability after 13-week waiting period
2017 Cost: $34,574
Short-term Disability Insurance (AFLAC)
Employees can purchase coverage via payroll deduction
Benefit Cost: No cost to Central

Credit RatingS&P affirmed Central’s A+ rating & maintained a Negative outlook
75
Strengths: Narrow scope of business model as a pass-thru paper
G&T Diversity of Member territory creates revenue stream
security and political support Timing of payment stream (collect from Members
prior to paying power suppliers) reduces liquidity risk Intra-year rate adjustments to ensure revenue
requirements are collected from Members
Weaknesses: Costs of failed nuclear project and resulting litigation
and potential legislative actions Fixed cost coverage ratio is 1.0x Margins are narrow Liquidity is adequate High off balance sheet fixed capacity payments from
power supply contracts South Carolina’s average income levels are 12%
below the national
Upside scenario: Courts rule that Santee Cooper is entitled to cost
recovery on the failed nuclear project and Central does not pursue efforts to undercut the CA
Downside scenario: Courts rule that Santee Cooper cannot recover costs
of nuclear project Litigation & political pressures leading to the
elimination of rate-setting autonomy
Source: S&P Global Ratings August 21, 2018

S&P Credit Rating
76
AA- A
Credit Ratings & Comparative Metrics
A-
Total Assets$ in millions
Operating Revenues$ in million
Peak DemandIn MWs
# of Meters Served DSC Ratio MFI Ratio
Average Cost of Debt
Central $393 $1,306 3,853 775,000 1.10 1.73 2.61%
Georgia Transmission $2,651 $293 8,705 1,887,705 1.22 1.22 3.57%
Old Dominion (VA) $2,209 $753 2,911 580,000 1.32 2.13 4.89%
East Kentucky $3,825 $862 2,871 588,636 1.26 1.19 3.94%
North Carolina EMC $2,073 $993 3,820 999,205 1.22 1.38 4.59%
Cooperative Energy (MS) $1,661 $779 1,575 427,147 1.61 1.46 3.91%
A+
Source: G&T Accounting & Finance Association Annual Directory June 2018 Reporting #s are for year-end 2017

Cooperative Financial Terms & Acronyms
77
Margins
Patronage Capital
RUS
NRUCFC
CoBank
CEE-US
DSC Ratio
TIER Ratio
MFI Ratio
Capitalization Ratio


![ARMED SERVICES BOARD OF CONTRACT APPEALS ASBCA No. … South Carolina... · 2017. 3. 6. · [Santee Cooper] by landowners in the Santee River flood plain. (R4, tab C-2, ex. 10 at](https://static.fdocuments.in/doc/165x107/6010332d99d29661eb24b78c/armed-services-board-of-contract-appeals-asbca-no-south-carolina-2017-3.jpg)