Legislative Appropriations Request for Fiscal Years 2022 ...

PRESENTATION TO THE LEGISLATIVE FISCAL COMMITTEE ON THE REGENTS’ PERFORMANCE-BASED FUNDING MODEL
October 20, 2014
Attachment H

Task Force Members
David Miles, Chair Katie Mulholland, Board of Regents President Pro Tem; Len Hadley, retired CEO of the Maytag Corporation; Cara Heiden, retired co-president of Wells Fargo Home
Mortgage; and Mark Oman, retired Senior Executive Vice President of
Wells Fargo and Company and Vice Chair of the Board of Trustees of the UNI Foundation
2

Why Performance-based Funding?
Source: Lumina Foundation
Historic/Base-Plus
(pre 1960’s)
Historic/Base-Plus
(pre 1960’s)
Allocation based on prior
levels of funding
Adjusted +/-based on
available funds
Challenge: Equity in
institutional funding
NOT a finance policy
Enrollment (1960s –
70s)
Enrollment (1960s –
70s)
# of students enrolled at census date
Recent shift to course
completion
Challenge: seldom “fully
funded” by state
Performance-Based
(2000’s)
Performance-Based
(2000’s)
Funding of institutions for
achieving outcomes
Bonus or portion of
general allocation
Challenge: Sustainability,
funding
4
There have been three
basic approaches to funding
Public Higher Education

Historical State Funding for Higher Education
Source: Lumina Foundation
5
Iowa’s approach is essentially
unchanged since the mid-1940’s

Headcount Enrollment Fall 1981 to Fall 2013
Source: Lumina Foundation
Resident Non-Res Resident Non-Res Resident Non-Res Resident Non-ResFall 1981 14,258 4,398 2,171 1,188 2,813 1,637 19,242 7,223Fall 2013 12,012 9,962 1,238 1,146 2,789 2,930 16,039 14,038Change -2,246 5,564 -933 -42 -24 1,293 -3,203 6,815
Resident Non-Res Resident Non-Res Resident Non-Res Resident Non-ResFall 1981 15,622 4,697 984 719 1,003 1,177 17,609 6,593Fall 2013 18,009 9,650 1,178 1,444 663 2,011 19,850 13,105Change 2,387 4,953 194 725 -340 834 2,241 6,512
Resident Non-Res Resident Non-Res Resident Non-Res Resident Non-ResFall 1981 9,429 308 821 51 330 15 10,580 374Fall 2013 9,411 969 1,015 268 416 80 10,842 1,317Change -18 661 194 217 86 65 262 943
Undergraduate Graduate-Masters Doctoral/Professional TotalSUI Headcount Enrollment
Undergraduate Graduate-Masters Doctoral/Professional TotalISU Headcount Enrollment
Undergraduate Graduate-Masters Doctoral/Professional TotalUNI Headcount Enrollment
7
But enrollment patterns on
our campuses have changed.

Appropriations by University
Source: Lumina Foundation
$0
$2,000
$4,000
$6,000
$8,000
$10,000
$12,000
$14,000
$16,000
1981
1983
1985
1987
1989
1991
1993
1995
1997
1999
2001
2003
2005
2007
2009
2011
2013
State Appropriations per Iowa Resident by Institution
UNI
ISU
SUI
9

National Landscape on Performance-based Funding
PBF In PlaceTransitioning to PBFFormal Discussions of PBFNo Formal Activity Found
Updated from Friedel, Thornton, D'Amico & Katsinas, 2013.
7
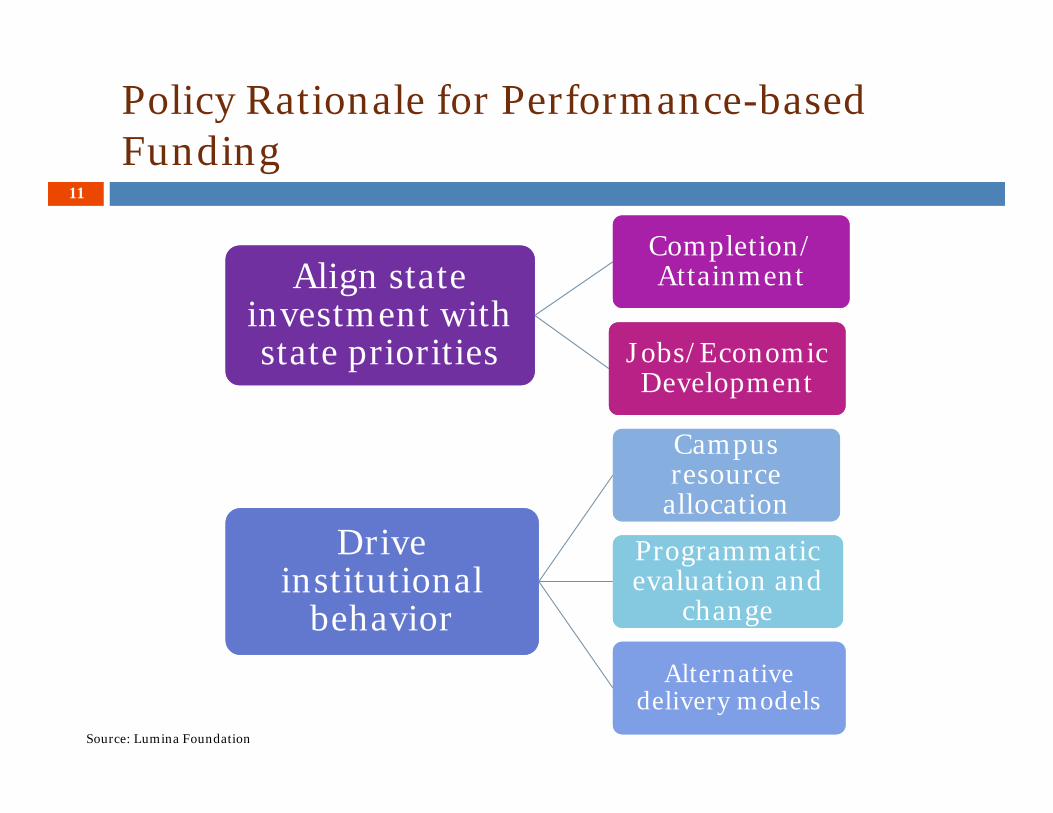
Policy Rationale for Performance-basedFunding
Source: Lumina Foundation
Align state investment with state priorities
Align state investment with state priorities
Completion/ Attainment
Completion/ Attainment
Jobs/Economic Development
Jobs/Economic Development
Drive institutional
behavior
Drive institutional
behavior
Campus resource
allocation
Campus resource
allocation
Programmatic evaluation and
change
Programmatic evaluation and
change
Alternative delivery models
Alternative delivery models
11
Source: Lumina Foundation

PREMISES
Metrics used must be: Equitable and recognize the unique missions of the
public universities Fact-based. They must be carefully defined, transparent,
measurable and auditable for consistency in approach Linked to the Board of Regents Strategic Plan Reliable and predictable for current and future
calculation Focused on a combination of enrollment and outcomes
9

PREMISES
Choosing the right metrics will: Connect state appropriations directly to educating Iowa
students Demonstrate accountability to the Governor, legislators
and the citizens of Iowa Reward the public universities for Regent-directed
achievements Make the annual appropriation process a more effective
tool for the Regents
10

RECOMMENDATIONS
1. Acknowledge that the Regent’s “base-plus” funding model has failed to keep pace with changing higher education realities and priorities, and needs to be replaced with a more flexible system linking appropriation requests to the priorities of today and tomorrow.
2. Premise future funding requests on the principle that the highest priority for state appropriations is to defray a portion of the costs of higher education so that Iowa students have affordable access to a quality higher education.
11
RECOMMENDATIONS
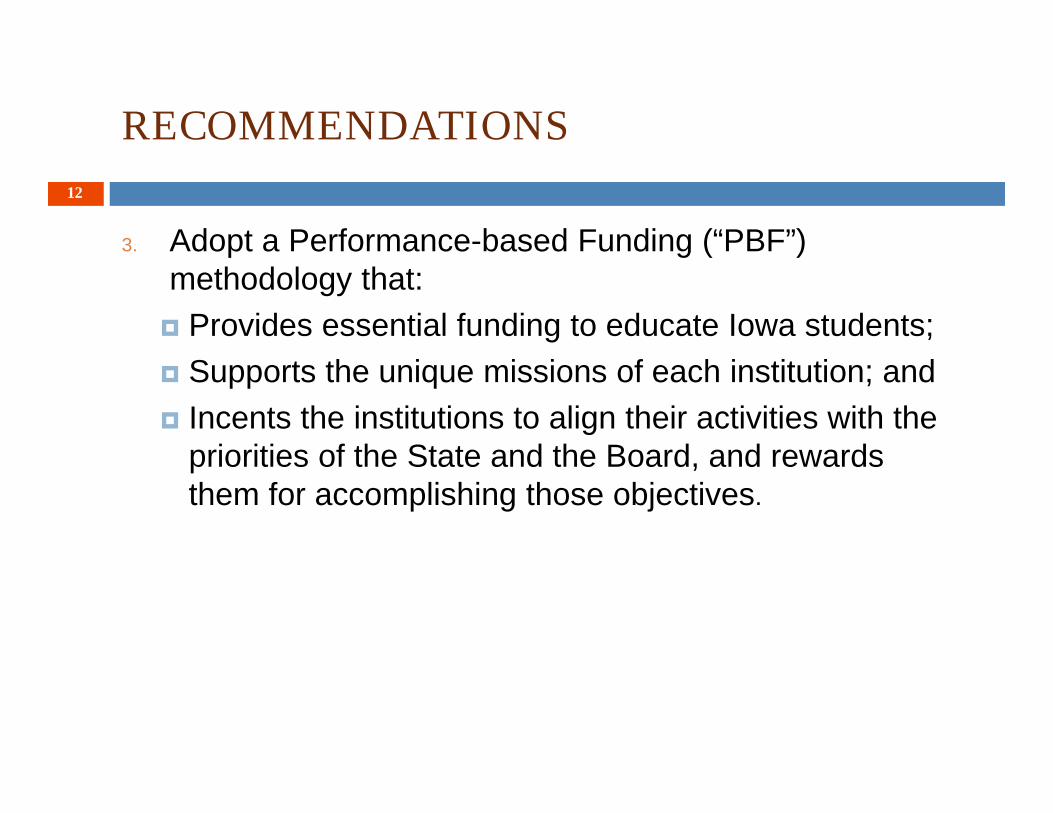
3. Adopt a Performance-based Funding (“PBF”) methodology that: Provides essential funding to educate Iowa students; Supports the unique missions of each institution; and Incents the institutions to align their activities with the
priorities of the State and the Board, and rewards them for accomplishing those objectives.
12

RECOMMENDATIONS
4. Adopt the following metrics to determine the annual GEF appropriations request to the Governor and the Legislature:
60% ENROLLMENT15% PROGRESS AND ATTAINMENT
5% Student Credit Hours 10% Degrees Awarded
10% ACCESS5% JOB PLACEMENT/CONTINUATION OF ADVANCED EDUCATION
IN IOWA10% REGENT OR UNIVERSITY SELECTED
5% Sponsored Research 5% Regent Customized Metrics
100%Metrics based on Iowa residents, except for Job Placement or Continuation of Higher Education in Iowa – that will include all students
13
RECOMMENDATIONS
5. Implementation should move forward carefully –continuing to provide essential support to all three universities. We recommend the following transition measures: The recommendations of the Performance-Based Funding Task
Force should be implemented beginning in Fiscal Year 2016. Between now and October, the Board should work with Board office
staff and the institutions to work through the implementation details of this model to ensure that the metrics are correct and will lead to the intended outcomes.
Beginning now allows the institutions a full-year to prepare for any changes in funding brought about by the Board’s new funding methodology.
Each institution should be given the opportunity to present to the Board a plan for responding to the revised funding model.
14

RECOMMENDATIONS
5. (cont’d) Implementation of these recommendations should be paid
for through restoration of State funding to Iowa’s public universities. The proposed PBF model creates a direct and transparent link
between dollars invested by the State and achievement of the State’s priorities. The improved educational outcomes generated by this new funding model merit additional State investment.
Despite considerable progress, State GEF funding in Fiscal Year 2013 remained $98 million below Fiscal Year 2008 levels, meaning that all three institutions are already managing through significant funding reductions.
By funding the transition to PBF, the State can minimize any short-term disruptions caused by reallocations among the institutions, while sending a strong message of support to the Board of Regents for taking this much needed step.
15

Task Force Recommendations
Transition to the new funding model over time – the Task Force suggests 2-4 years – keeping in mind the following: Nothing in this report should be taken as a criticism of our outstanding
universities, each of which is investing the State’s resources to provide a superior-quality education to their students, generate world-class research, and serve Iowans.
The model is intended to enhance the institutions over the wide arc of time, not to address near-term funding issues.
To the extent that the State provides less than full funding to implement PBF, any reallocations of funding from any university be capped at 1%-2% of the institution’s 2013 general education revenues per year.
Incremental funds will not accrue to a university whose funds are negatively reallocated until the percentages per university in the model are reached.
Concurrent with the implementation of PBF, we recommend that the Board actively explore the potential for differential resident-tuition among the institutions.
16

RECOMMENDATIONS
6. This move to PBF should be considered a first step. The Board should remain actively engaged to:
Revise the model based on experience; Respond to any unintended consequences; and Move a growing proportion of funding toward the achievement of
desired outcomes.
17

Thank You
18

Historical State Funding by Public University
Source: Lumina Foundation
6

Enrollment by University - 1981 to 2013
Source: Lumina Foundation
8

Task Force Process Summary
Step 1: Establish a framework Goals & Priorities Timeline for development & implementation Funding amounts
Step 2: Gather Data and Expert TestimonyStep 3: Review Concepts and Choose Initial MetricsStep 4: Model various formula optionsStep 5: Implementation/phase-in optionsStep 6: Finalize recommendationsStep 7: Communicate to the Board of Regents
Six Public Meetings October 2013 thru May 2014
12

Suggested METRICS Definitions
ENROLLMENT Resident Full-time Equivalent (FTE) Students Time period: 3 year rolling average
PROGRESS and ATTAINMENT Progress measured as achieving student credit hour thresholds
of 24-48-72 Attainment measured as number of degrees awarded at the
Bachelor’s, Master’s and Doctoral/Professional level Time period: most current year
22

Suggested METRICS Definitions
BOARD OF REGENTS SELECTED 5% on Sponsored Research 5% on metrics determined by the Board of Regents that respond
to newly identified needs, or distinguish between public university missions, or challenge the institutions
Time period: undetermined
23

Suggested METRICS Definitions
ACCESS Low Income Students – measured by Pell Grant Recipients and
Subsidized Stafford Loans Minority students as self-identified Transfer students from Iowa Community Colleges Veterans Count is duplicated; i.e. student may be identified in more than
one category Time period: 3 year rolling average
24

Suggested METRICS Definitions
JOB PLACEMENT/CONTINUATION OF ADVANCED EDUCATION IN IOWA Graduates who find employment or continue on to advanced
degrees in the state of Iowa Suggested measurement is matching Social Security Numbers
with Iowa Workforce Development data Time period: 1-5 years after graduation
Note: this data is not yet available
25