Presentation To: State of Wisconsin Non-U.S. Equity May...
54
State of Wisconsin T. Rowe Price 100 East Pratt Street Baltimore, Maryland 21202 Kurt A. Umbarger, CFA 410-345-4259 [email protected] Ryan Wagner 410-345-2232 [email protected] Presentation To: Non-U.S. Equity May 11, 2004
Transcript of Presentation To: State of Wisconsin Non-U.S. Equity May...

State of Wisconsin
T. Rowe Price100 East Pratt Street Baltimore, Maryland 21202
Kurt A. Umbarger, [email protected]
Ryan [email protected]
Presentation To: Non-U.S. EquityMay 11, 2004

I. Organization and Performance Overview
II. Overview
III. Performance Review
IV. Current Portfolio Structure
V. Exhibits• Fee Schedule
• Performance Statistics Glossary
• Portfolio Specialists
• Biographical Backgrounds
Table of Contents

Organization and Performance Overview
1

2
Client Objective
Objective• Capture the returns of non-U.S. equity markets in a broadly diversified manner
• Achieve superior performance relative to recognized international indices and manager
peer group
Mandate• Non-U.S. equity portfolio: International Stock Fund
Benchmarks• MSCI EAFE Index
• Morningstar Foreign Large Growth Universe
State of WisconsinAs of March 31, 2004
33
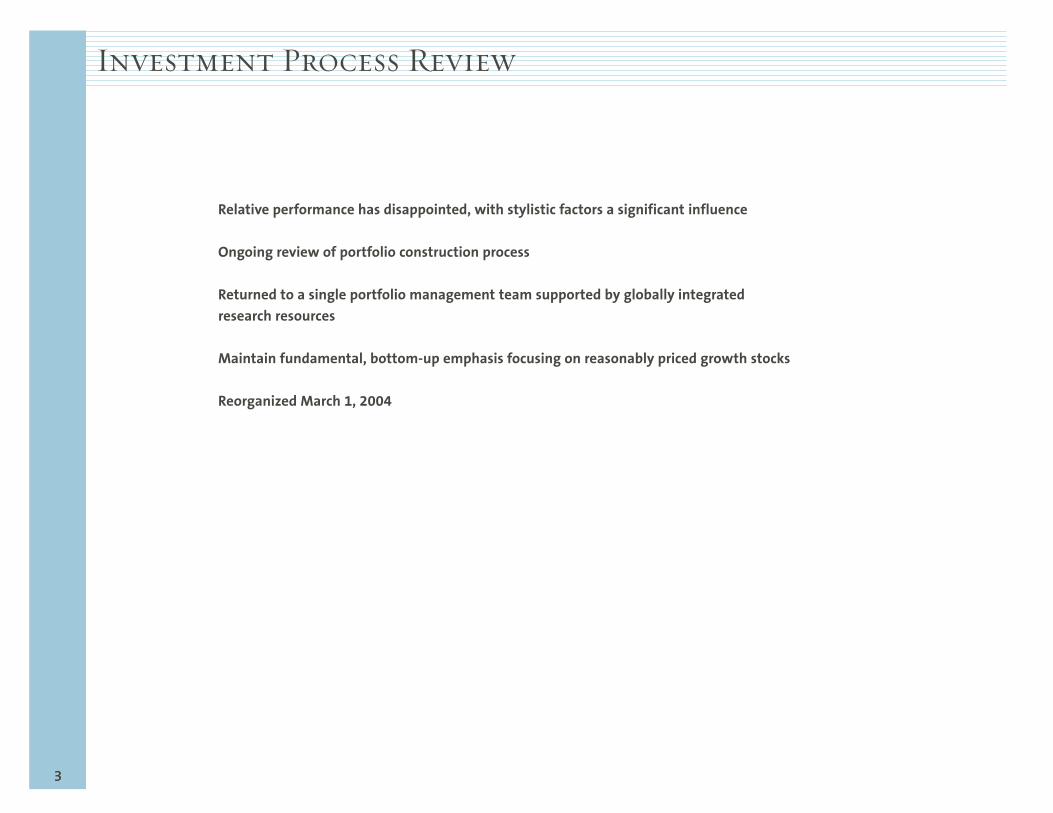
Investment Process Review
Relative performance has disappointed, with stylistic factors a significant influence
Ongoing review of portfolio construction process
Returned to a single portfolio management team supported by globally integrated research resources
Maintain fundamental, bottom-up emphasis focusing on reasonably priced growth stocks
Reorganized March 1, 2004

4
Evolution of Investment Team Structure
T. Rowe Price International Steering Committee
John Ford
David Warren
Mark Bickford-Smith
James Seddon
Organizational Oversight
Regional Research Resources
Pre-1999Single-Team Structure
1999-2003Two-Team Structure
Post-2003Single-Team Structure
Regional & Sectoral Research Resources Regional & Sectoral Research Resources
Mark Bickford-Smith John Ford
James Seddon
David Warren/Frances Dydasco
Mark Bickford-Smith
James Seddon
David Warren
John Ford John Ford Mark Bickford-Smith
Risk Controls Risk Controls Risk Controls
Regional TeamRegional Team Sectoral TeamRegional Team
David Warren, CEO and President
Head of T. Rowe Price International

5
Total Return Performance
Three One Three Five Seven TenMonths Year Years Years Years Years
International Stock Fund (Net of Fees) 14.74% 31.28% -5.74% -1.34% 1.57% 3.64%
MSCI EAFE Index1 17.11 39.17 -2.57 0.26 3.17 4.78
MSCI EAFE Growth Index1 15.70 32.49 -5.51 -3.72 0.52 2.32
Morningstar Foreign Large Growth Universe 14.95 33.15 -6.69 -0.87 N/A 2.49
Morningstar Percentile 55% 55% 35% 56% N/A 43%
1 Shown with gross dividends reinvested.
Annualized
International Stock FundPeriods Ending December 31, 2003

6
Total Return Performance
Annualized
International Stock FundPeriods Ending December 31, 2003
SinceThree One Three Four Inception
Months Year Years Years 5/31/99
International Stock Fund Regional Portfolio(Gross of Fees) 14.78% 32.51% -4.23% -6.72% 0.08%
International Stock Fund Sector Portfolio(Gross of Fees) 15.25 32.59 -5.63 -9.00 -1.59
MSCI EAFE Index1 17.11 39.17 -2.57 -5.55 0.24
MSCI EAFE Growth Index1 15.70 32.49 -5.51 -10.63 -3.04
Morningstar Foreign Large Growth Universe 14.95 33.15 -6.69 N/A N/A
1 Shown with gross dividends reinvested.
7
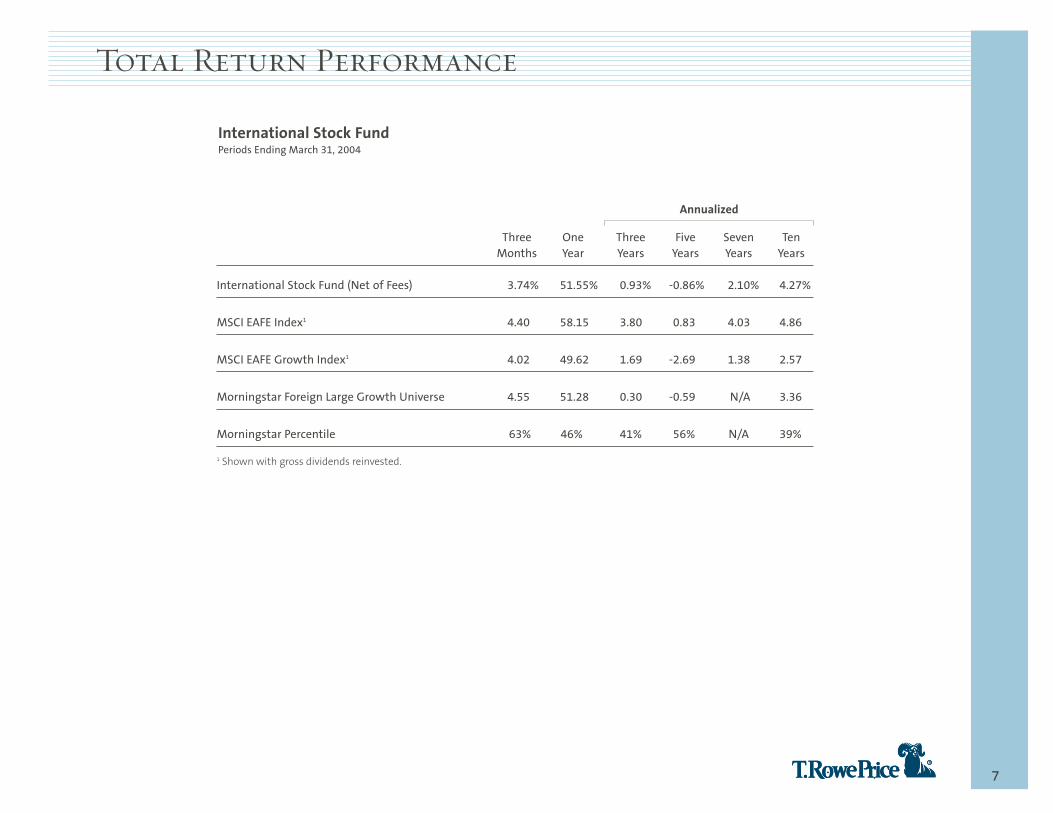
Total Return Performance
Three One Three Five Seven TenMonths Year Years Years Years Years
International Stock Fund (Net of Fees) 3.74% 51.55% 0.93% -0.86% 2.10% 4.27%
MSCI EAFE Index1 4.40 58.15 3.80 0.83 4.03 4.86
MSCI EAFE Growth Index1 4.02 49.62 1.69 -2.69 1.38 2.57
Morningstar Foreign Large Growth Universe 4.55 51.28 0.30 -0.59 N/A 3.36
Morningstar Percentile 63% 46% 41% 56% N/A 39%
1 Shown with gross dividends reinvested.
Annualized
International Stock FundPeriods Ending March 31, 2004

8
Growth/Value Performance
MSCI EAFE Growth Index MSCI EAFE Value Index
40
60
80
100
120
140
160
180
3/0412/036/0312/026/0212/016/0112/006/0012/996/9912/98
Index Level
27.76% Non-U.S. Equity Value
-13.94% Non-U.S. Equity Growth
December 31, 1998 through March 31, 2004
Source: Factset. Indices shown with no dividends. Returns in U.S. dollars unless otherwise noted.
Note: MSCI EAFE Growth and Value Indices are used as representative indices.
Growth continues to underperform value.

99
-15%
-10%
-5%
0%
5%
10%
15%
Jun-92 Jun-93 Jun-94 Jun-95 Jun-96 Jun-97 Jun-98 Jun-99 Jun-00 Jun-01 Jun-02 Jun-03
S&P/Citigroup PMI EPAC Style Indices Value Minus GrowthRolling Three-Year ReturnsBased on Quarterly Performance
ValueOutperforms
Growth Outperforms
Style differences expected to moderate; becoming a stock picker’s environment.
1 Performance of Institutional Foreign Equity Fund relative to MSCI EAFE Index. For the period 6/30/00 through 3/31/04.For the period 6/30/92 through 3/31/04, the annualized return for Institutional Foreign Equity Fund is 6.11% and forthe MSCI EAFE Index, it is 6.79%.
Source: T. Rowe Price International, Inc.
Value minus Growth
2 Years (outperformed)810 bps per annum1
2 Years (underperformed)460 bps per annum1
4 Years (outperformed)330 bps per annum1
1.5 Years (outperformed)440 bps per annum1
3+ Years (underperformed)308 bps per annum1
1992 1993 1994 1995 1996 1997 1998 1999 2000 2001 2002 2003
Growth vs. Value & Our Relative Performance

10
0.8
1.0
1.2
1.4
1.6
3/043/033/023/013/003/993/983/973/963/953/943/933/923/913/90
Forward 12 Months PE
Rolling 12 Months
International Growth1 vs. Value Relative Price-to-Forward 12-Month EarningsJune 30, 1989 through March 31, 2004
Forw
ard
12-M
onth
P/E
1 Based on S&P/Citigroup PMI World ex-U.S. Growth and Value Indices.
Source: S&P/Citigroup.
Non-U.S. Valuations

Overview
11

1212
T. Rowe Price International Assets Under Management
Emerging MarketsEquity Assets$2.0B
Developed MarketsEquity Assets
$18.8B
Fixed Income Assets$1.9B
Total T. Rowe Price International Assets: $22.7 BillionAs of December 31, 2003
Total T. Rowe Price Assets: $190.0 Billion1
As of December 31, 2003
Non-U.S. Equity Assets$21.5B2
U.S. Equity Assets$112.5B
U.S. Fixed Income Assets$48.3B
Non-U.S. Fixed Income Assets$5.6B
1 The combined assets of the T. Rowe Price group of companies. The T. Rowe Price group of companies includes T. Rowe Price Associates, Inc., T. Rowe Price International, Inc., T. Rowe Price Global Investment Services Limited, T. Rowe Price Global Asset Management Limited, and T. Rowe Price Stable Asset Management, Inc.
2 Includes both non-U.S. and global assets.

13
Organization
More than 20 years of experience managing international portfolios
48 investment professionals in seven offices worldwide
Offices in London, Hong Kong, Tokyo, Singapore, Buenos Aires, Paris, and Baltimore
Over $22 billion in assets under management
T. Rowe Price International, Inc.As of December 31, 2003

1414
Investment Approach
Portfolio management team with regional responsibilities
Emphasis on companies with superior growth prospects trading at reasonable valuations
Full range of international equity markets, developed and emerging markets, large- to
medium-sized companies
Country and sector weightings developed through consideration of:
• Attractiveness of individual buying opportunities
• Macroeconomic environment
Stock selection is the point of decision-making

15
Non-U.S. Equity Portfolio Management Team
The team averages 20 years of investment experience and 15 yearswith T. Rowe Price International.
Mark Bickford-Smith, Lead Portfolio Manager (London)• Responsibility: Emerging Markets/
Developed Pacific ex-Japan Equities;• 19 years of investment experience;• 8 years with T. Rowe Price International.
MA, Cambridge University
David Warren, Chief Executive Officer and President (London)• Responsibility: Japanese Equities;• 24 years of investment experience;• 20 years with T. Rowe Price International.
Honours Degree, Oxford University
James Seddon (London)• Responsibility: European Equities;• 17 years of investment experience;• 16 years with T. Rowe Price International.
Honours Degree, Oxford University
As of March 31, 2004

1616
Regional Equity Research Resources
As of March 31, 2004
LatinAmerica
David WarrenJapan Generalist
Campbell GunnJapan Generalist
Miki TakeyamaJapan Small-Cap
Mark Bickford-SmithAsia ex-Japan Generalist
Frances DydascoSouth Asia ex-JapanMark EdwardsNorth Asia ex-Japan
May FooSouth Asia ex-Japan
James SeddonEurope Generalist
Chris AldersonEastern Europe/Middle East/AfricaRobert Revel-Chion, CFAEurope GeneralistJustin ThomsonEurope Small-Cap
Philip RodrigsEurope Small-CapLeigh Robertson, CFAEmerging Europe/Middle East/AfricaUlle AdamsonEmerging Europe/Middle East/Africa
Mark Bickford-SmithLatin America Generalist
Gonzalo PángaroLatin America Generalist
José Costa BuckLatin America GeneralistVerena WachnitzLatin America Generalist
Japan
Pacificex-Japan
Europe
Core Growth Non-U.S. EquityPortfolio Management Team
Regional SpecialistPortfolio Management Team Regional Analysts

17
Regional Equity Research Resources
As of March 31, 2004
17 regional equity research professionals worldwide
Fundamental approach to research — pursue unconventional sources of information
Regional research — essential to analyze local market influences such as:• Politics
• Economics
• Investor Behavior
• Regulations

18
Sector Equity Research Analysts1
42 Equity Research Analysts and 13 Associate Equity Research Analysts worldwide.
As of March 31, 2004
Bill Stromberg, CFA; Director of Global Equity Research, T. Rowe Price AssociatesCharles G. Pepin; Associate Director of U.S. Equity Research, T. Rowe Price AssociatesJill Hauser; Associate Director of U.S. Equity Research, T. Rowe Price Associates
Gonzalo Pángaro, CFA; Director of Non-U.S. Equity Research, T. Rowe Price International
Kennard W. AllenSmall-Cap SoftwareDonald J. Easley, CFAHardware, Storage & EMS
Anh LuAsia & Japan GeneralistJeff Rottinghaus, CPA Semiconductors & Equipment,
Large-Cap Software
Wenhua Zhang, CFA, CPA Small-/Mid-Cap GeneralistChristy WuAsia Generalist
Laurie M. BertnerServices, Distribution & Medical
ProductsKris H. Jenner, MD, D. Phil2
Pharmaceuticals & Biotech
Jay S. Markowitz, MDBiotechCharles G. PepinManaged Care
John C. A. ShermanNon-U.S. Pharmaceuticals
P. Robert Bartolo, CPATelecom ServicesKara M. Cheseby, CFAPrinting, Publishing, Newspapers &
Education
David J. EiswertTelecom EquipmentHenry M. EllenbogenAdvertising & Diversified Media
Radio/TV, Cable
Robert N. Gensler2
Telecom Global CoordinatorPascal HautcoeurNon-U.S. Media
Dale West, CFANon-U.S. TelecomErnest C. YeungNon-U.S. Telecom
Jeff Arricale, CPAMultiline & Life Insurance, Asset
Managers, Investment BanksKyle Cerminara, CFATrust Banks, GSE’s, Consumer Finance
Michael W. HoltonLarge Banks & Diversified FinanceDavid M. Lee, CFA2
Real Estate
J. David Wagner, CFASmall-/Mid-Cap Diversified, P&C
Insurance, Thrifts & MortgageInsurance
Federico Santilli, CFAEuropean Banks
R. Scott BergProcessors & Outsourcing
Brace C. Brooks, CFAGeneralist & Payroll Processors
Pascal HautcoeurNon-U.S. Business Services
Philip W. Ruedi, CFAStaffing, IT Consulting,
and Logistics
Frank AlonsoLeisure, Soft Goods, RestaurantsChristopher A. BerrierLeisure
Arthur B. Cecil, III, CFAFood/Beverage/Personal CareFrédéric DenjoyNon-U.S. Consumer & Retail
Joseph Fath, CPAGaming & Lodging, Real EstatePhilip W. Ruedi, CFASupermarkets & Drug Stores
R. Candler YoungRetail-Discount Goods &
Hard Goods
Timothy F. BeiAerospace/DefenseChristopher A. BerrierHousingJoseph Fath, CPAAirlines
David R. Giroux, CFABuilding Materials/Products, Electrical
Equipment, IndustrialManufacturing/Automotive
Lewis M. JohnsonGlobal Metals & Mining, Agriculture,
ChemicalsDavid M. Lee, CFA2
Railroads
Heather K. McPherson, CPAUtilities-Electric & Power Generation,
PaperCharles M. Ober, CFA2
Global Energy MajorsCurt J. OrgantSmall-/Mid-Cap Generalist
Timothy E. ParkerEnergy Service & Producers,
Exploration & ProductionRichard E. Presley, CFAEuropean GeneralistPhilip W. Ruedi, CFAEnvironmental Services
FinancialServices
Technology
HealthCare
Media/Telecom
Industrial
BusinessServices
Consumer/Retail
1 Includes affiliates of T. Rowe Price Associates, Inc. 2 Also has portfolio management responsibilities.
1 Includes affiliates of T. Rowe Price Associates, Inc.2 Also has portfolio management responsibilities.
Analysts boxed in blue are T. Rowe Price International resources.

19
Sector Equity Research Analysts
As of December 31, 2003
1 Includes Equity research professionals, including portfolio managers/analysts with research responsibilities, for T. Rowe PriceAssociates, Inc., and affiliates.
59 sector research professionals worldwide1
Fundamental approach to research — pursue unconventional sources of information
Sector research — essential to analyze companies that increasingly face competitors fromacross the globe
Rigorous evaluation of company ratings and associated impact on portfolio performance
20
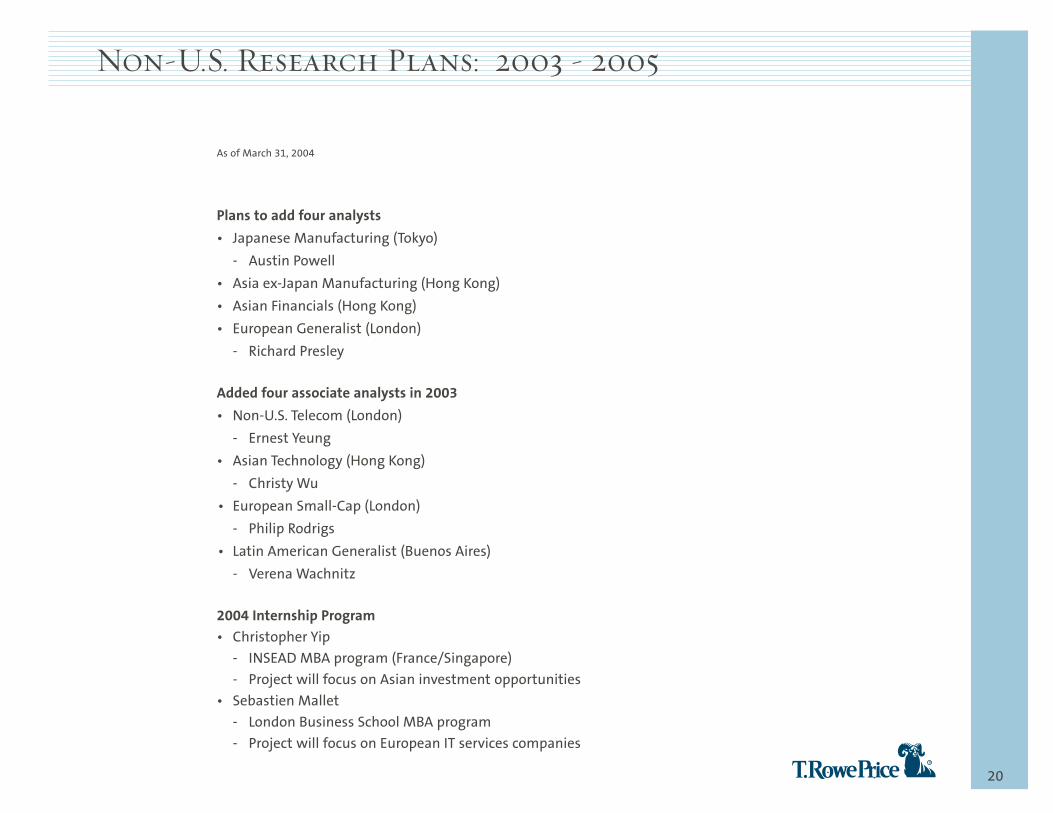
As of March 31, 2004
Plans to add four analysts
• Japanese Manufacturing (Tokyo)
- Austin Powell
• Asia ex-Japan Manufacturing (Hong Kong)
• Asian Financials (Hong Kong)
• European Generalist (London)
- Richard Presley
Added four associate analysts in 2003
• Non-U.S. Telecom (London)
- Ernest Yeung
• Asian Technology (Hong Kong)
- Christy Wu
• European Small-Cap (London)
- Philip Rodrigs
• Latin American Generalist (Buenos Aires)
- Verena Wachnitz
2004 Internship Program• Christopher Yip
- INSEAD MBA program (France/Singapore)
- Project will focus on Asian investment opportunities
• Sebastien Mallet
- London Business School MBA program
- Project will focus on European IT services companies
Non-U.S. Research Plans: 2003 - 2005

Growth stocks are often mispriced as the market fails to properly assessa company’s ability to create value over an extended period of time.
Growth stocks exhibit:• Sustainable and superior cash flow growth relative to the overall market
• An ability to reinvest future cash flows at rates of return above cost of capital
• Rates of return on capital greater than weighted average cost of capital
• A stock price valuation that underestimates the company’s long-term growth prospects
Attractive business model
CompetitiveAdvantage
Above-average, durable revenue and earnings growth
Significant free cash flow generation over time
Seasoned, shareholder-oriented management
+
2121
Growth Stock Characteristics

David Warren - JapanJames Seddon - EuropeMark Bickford-Smith - Asia/Emerging Mkts.
• Highly collaborative team approach
• Deep understanding of local markets and opportunities
• Supported by globally-integrated research resources
Technology Health CareMedia/Telecom Financial ServicesBusiness Services Consumer/RetailIndustrial
Worldwide portfolio managers and analysts
Sector Research Resources
Approximately 2,000 stocksmarket cap (free float) >$1 Billion
Sustainable Growth• Quality of management• Point in company/product lifecycle• Cash flow characteristics• Strength of franchiseReasonable Valuation• Discounted Cash Flow Analysis• P/E, P/BV, P/S, P/CF, EV/EBITDA• Relative to:
- region- country- sector- company
Europe Latin AmericaJapan North AmericaPacific ex-Japan
Worldwide portfolio managers and analysts
Broadly diversified portfolio of 150 to 225 stocks
Non-U.S. Equity Universe
Rigorous Fundamental Research
Risk Controls and MonitoringMark Bickford-Smith
Regional Research Resources
Portfolio Construction
22
Investment Process
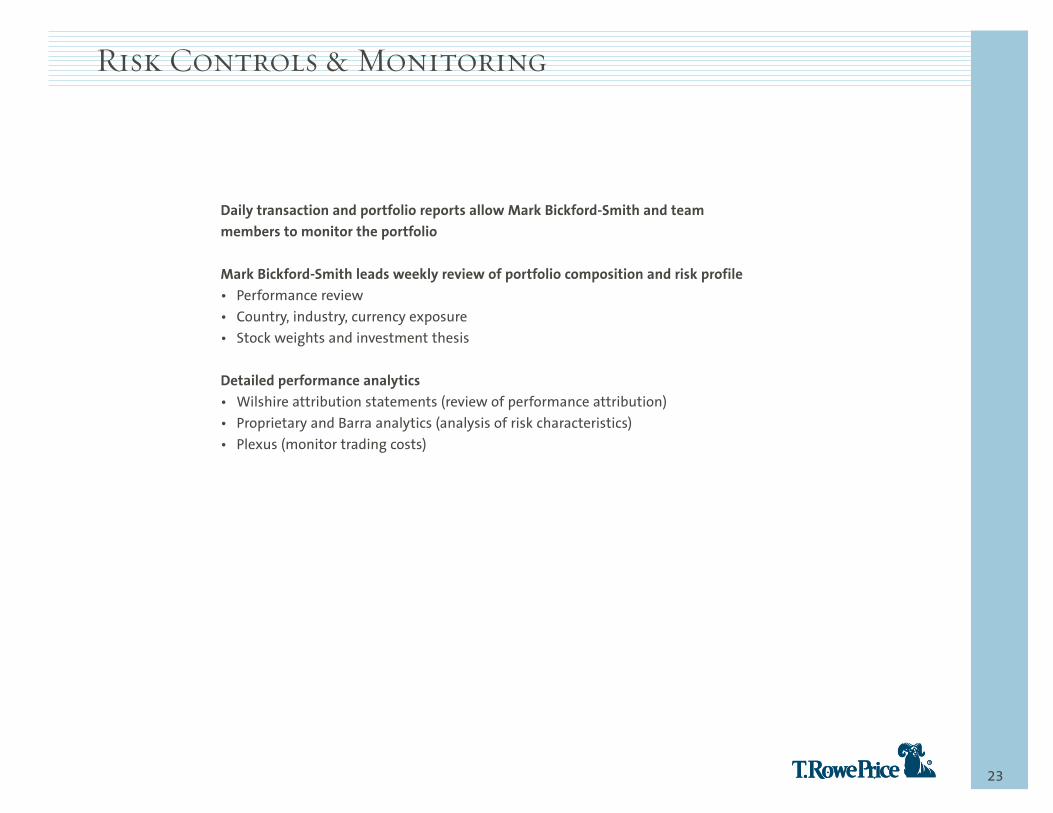
23
Daily transaction and portfolio reports allow Mark Bickford-Smith and team members to monitor the portfolio
Mark Bickford-Smith leads weekly review of portfolio composition and risk profile• Performance review
• Country, industry, currency exposure
• Stock weights and investment thesis
Detailed performance analytics• Wilshire attribution statements (review of performance attribution)
• Proprietary and Barra analytics (analysis of risk characteristics)
• Plexus (monitor trading costs)
Risk Controls & Monitoring

Performance Review
24

2525
December 31, 2002 through March 31, 2004
Source: Factset. Indices shown with no dividends. Returns in U.S. dollars unless otherwise noted.
Past performance is not a guarantee of future results.
71.47% Emerging Markets
48.24% Non-U.S. Dev. & Emg.
30.86% U.S.
45.30% Non-U.S. Developed
80
90
100
110
120
130
140
150
160
170
180
3/0412/039/036/033/0312/02
Index Level
MSCI EAFE Local IndexMSCI All Country World ex-U.S. IndexMSCI EAFE Index
S&P 500 Index
MSCI Emerging Markets Index
25.76% Non-U.S. Developed (Local Currency)
Global Market Performance

26
December 31, 2002 through March 31, 2004
86.02% Latin America
56.26% Pacific ex-Japan56.82% Japan
40.45% Europe
80
90
100
110
120
130
140
150
160
170
180
190
200
3/0412/039/036/033/0312/02
Index Level
MSCI Europe Index
MSCI Pacific ex-Japan Index
MSCI Japan Index
MSCI Latin America Index
Source: Factset. Indices shown with no dividends. Returns in U.S. dollars unless otherwise noted.
Past performance is not a guarantee of future results.
Regional Market Performance

2727
December 31, 2002 through March 31, 2004
Source: Factset, returns based on MSCI indices. Indices shown with no dividends. Returns in U.S. dollars unless otherwise noted.
Past performance is not a guarantee of future results.
67.63% Information Technology
61.43% Industrials & Bus. Servs.
54.57% Financials
50.26% Materials
80
90
100
110
120
130
140
150
160
170
3/0412/039/036/033/0312/02
Index Level
FinancialsConsumer StaplesEnergy
Health Care
Utilities
40.33% Telecommunication Services
Industrials & Bus. Servs.MaterialsConsumer DiscretionaryInformation TechnologyTelecommunication Services
46.43% Consumer Discretionary41.17% Utilities
27.32% Energy28.12% Health Care29.57% Consumer Staples
Sector Performance

28
Growth/Value Performance
52.49% Non-U.S. Equity Value
37.82% Non-U.S. Equity Growth
80
90
100
110
120
130
140
150
160
170
3/0412/039/036/033/0312/02
Index Level
MSCI EAFE Value Index MSCI EAFE Growth Index
December 31, 2002 through March 31, 2004
Source: Factset. Indices shown with no dividends. Returns in U.S. dollars unless otherwise noted.
Note: MSCI EAFE Growth and Value Indices are used as representative indices.
Past performance is not a guarantee of future results.

2929
International Stock Fund vs. MSCI EAFE IndexOne Year Ending March 31, 2004
Total Netherlands Switzerland South Korea Mexico Turkey Germany Sweden France United
Kingdom Japan
Over (Under) Weight -- -0.3 -0.2 2.4 1.6 0.2 -4.3 0.7 4.8 -1.4 -2.4
Portfolio Weight (Ending) 100.0 4.4 6.9 2.4 1.6 0.2 2.4 3.0 14.3 23.6 21.2
Index Weight (Ending) 100.0 4.8 7.1 0.0 0.0 0.0 6.7 2.3 9.5 25.0 23.6
Portfolio Performance 54.2 72.5 60.3 88.0 77.7 125.6 88.2 54.7 53.2 40.7 53.9
Index Performance 58.0 47.4 49.1 95.4 69.1 99.5 80.0 85.9 58.6 47.1 69.8
-6
-5
-4
-3
-2
-1
0
1
2
Val
ue A
dded
- Pe
rcen
t
Total Value Added
Value Added fromCountry Weight
Value Added fromStock Selection
Attribution Analysis — Major Impacts
Total Utilities Energy Consumer
Staples Industrials &
Bus. Servs. Information Technology Financials Materials
Telecom Services Health Care
Consumer Discretionary
Over (Under) Weight -- -3.2 -0.9 0.4 -0.7 2.3 -2.5 -2.8 2.1 0.6 4.7
Portfolio Weight (Ending) 100.0 1.5 7.0 8.9 8.6 9.7 24.2 3.9 9.5 9.1 17.7
Index Weight (Ending) 100.0 4.8 7.8 8.5 9.3 7.4 26.7 6.6 7.4 8.5 13.0
Portfolio Performance 54.2 64.6 45.7 39.0 69.8 74.2 72.9 55.6 42.7 33.4 51.9
Index Performance 58.0 44.7 38.8 40.2 71.6 81.7 72.6 64.5 45.1 37.5 64.3
-6
-5
-4
-3
-2
-1
0
1
2
Val
ue A
dded
- Pe
rcen
t
Total Value Added
Value Added fromSector Weight
Value Added fromStock Selection
By Country
By Sector
Note: Performance calculated by Wilshire Atlas may not match TRPI’s reported portfolio performance because Wilshire usesdifferent pricing and exchange rate sources, includes only common stocks, and does not capture fees, commissions, or intra-daytrading. Returns in U.S. dollars.

30
Total Return Performance
Calendar Years
1994 1995 1996 1997 1998 1999 2000 2001 2002 2003
International Stock Fund (Net of Fees) -0.76% 11.39% 15.99% 2.70% 16.14% 34.60% -17.09% -22.02% -18.18% 31.28%
MSCI EAFE Index1 8.06 11.55 6.36 2.06 20.33 27.30 -13.96 -21.21 -15.66 39.17
Value Added -8.82 -0.16 9.63 0.64 -4.19 7.30 -3.13 -0.81 -2.52 -7.89
1994 1995 1996 1997 1998 1999 2000 2001 2002 2003
International Stock Fund(Net of Fees) -0.76% 11.39% 15.99% 2.70% 16.14% 34.60% -17.09% -22.02% -18.18% 31.28%
MSCI EAFE Growth Index1 4.75 11.65 3.70 2.33 22.47 29.71 -24.40 -24.41 -15.76 32.49
Value Added -5.51 -0.26 12.29 0.37 -6.33 4.89 7.31 2.39 -2.42 -1.21
1 Shown with gross dividends reinvested.
31
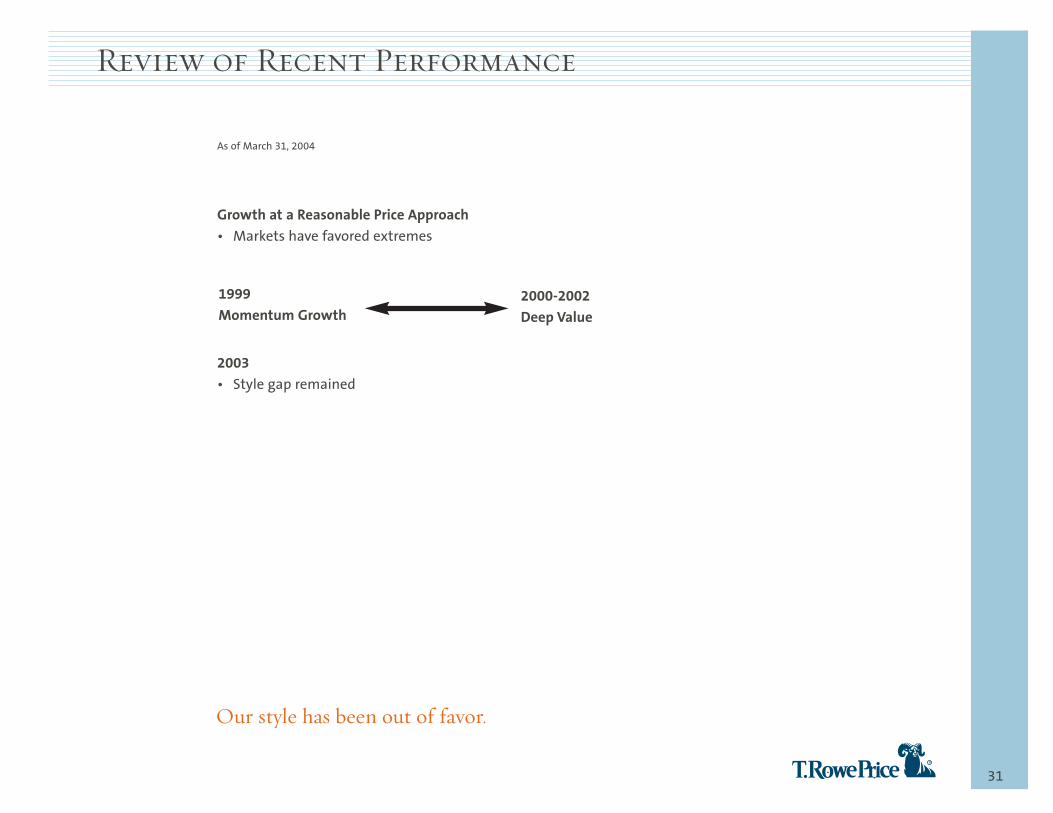
As of March 31, 2004
Our style has been out of favor.
Growth at a Reasonable Price Approach• Markets have favored extremes
2003• Style gap remained
1999Momentum Growth
2000-2002Deep Value
Review of Recent Performance

32
Source: Based on Barra analysis of MSCI EAFE, which determines growth/value based on a combination of forecastprice-to-earnings, reported price-to-earnings, reported price-to-book value, and dividend yield.
-50%
-10%
30%
70%
110%
150%
-50%
-10%
30%
70%
110%
150%
-50%
-10%
30%
70%
110%
150%
-50%
-10%
30%
70%
110%
150%
-50%
-10%
30%
70%
110%
150%
-50%
-10%
30%
70%
110%
150%
Value Growth
Calendar Year 2002
Calendar Year 2001
Calendar Year 2000
Calendar Year 1999
Cumulative12/31/1998 through 3/31/2004
T. Rowe Price International Style
Perf
orm
ance
(%)
Reasonably priced growth has underperformed.
Calendar Year 2003
32
Market Performance by Quintiles of Growth/Value

3333
Zephyr StyleADVISOR: T. Rowe Price Associates, Inc.
36-Month Moving Windows, Computed Monthly
TRP International Stock FundCitigroup International Style Basis
April 1999 through March 2004
S&P/Citigroup PMI Value World x US S&P/Citigroup PMI Growth World x US
S&P/Citigroup EMI Value World x US S&P/Citigroup EMI Growth World x US
Zephyr S
ize C
oord
inate
-1
0
1
Zephyr Style Coordinate
-1 0 1
- Zephyr StyleADVISOR performs aconstrained quadratic optimization tdetermine the portfolio's (style, sizcoordinate relative to the indices show
- This rolling window analysis displays thesmaller data points to represent the oldesttime period and larger data points torepresent the most recent time perio
SmallGrowth
SmallValue
LargeGrowth
LargeValue
Style Consistency
Zephyr StyleADVISOR: T. Rowe Price Associates, Inc.
1 Style Basis Indices are: Citigroup Primary Market Index (PMI) and Extended Market Index (EMI) Growth and Value Indices.
T. Rowe Price, Inc., and Zephyr Associates, Inc., are not affiliated companies.
1
Overall portfolio emphasizes growth.

34
Non-U.S. Equity StrategyFive Years Ending December 31, 2003
Rolling Five Year Analysis
htworG
Value
htworG
Value
0%
20%
40%
60%
80%
100%
12/03 12/02 12/01 12/00 12/99 12/98
Japan Value
Pac Basin ex-Japan Value
U.K. Value
Europe ex-U.K. Value
North America Value
Japan Growth
Pac Basin ex-Japan Growth
U.K. Growth
Europe ex-U.K. Growth
North America Growth
Emerging Markets
Cash
Rolling Five-Year Analysis
Composition of Style

35
Growth versus Value• Valuations have contracted to where growth and value stocks are similarly valued
• Style to remain a factor, but less dominant than the past four years
Europe versus Japan• Europe’s economic prospects are mixed, but as a whole, better than Japan
• Company-by-company comparisons tend to favor European opportunities
Sector Positioning• Long-term prospects for growth-oriented industries such as business services, semiconductors,
wireless telecoms, and pharmaceuticals remain intact
• Valuation trade-off between sectors is less distinct today, should favor companies that can
generate sustainable and superior earnings growth
Developed versus Emerging• Emerging market economies, particularly in Asia and Russia, have undergone significant reforms
• Valuations in most emerging market sectors remain attractive relative to developed
market peers
As of March 31, 2004
Positioned for the Next Cycle

Current Portfolio Structure
36

3737
Historical Regional Composition
0
10
20
30
40
50
60
70
80
90
100 CashAmericas
Europe, Middle East, and Africa
Pacific ex-Japan
Japan
3/04200320022001200019991998199719961995199419931992199119901989
Percent
Japan weightingas % of EAFE
International Stock FundAs of March 31, 2004
38
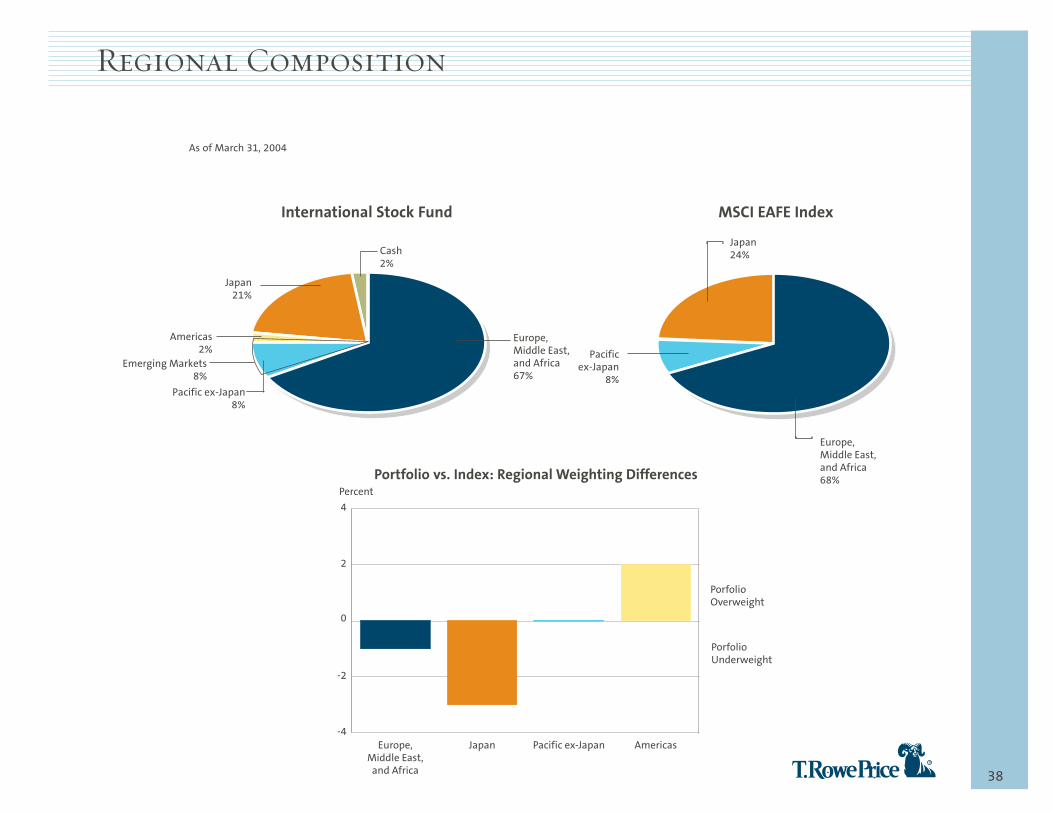
Regional Composition
As of March 31, 2004
International Stock Fund MSCI EAFE Index
Europe,Middle East,and Africa68%
Pacificex-Japan
8%
Japan24%
-4
-2
0
2
4
AmericasPacific ex-JapanJapanEurope,Middle East,
and Africa
Percent
PorfolioUnderweight
PorfolioOverweight
Portfolio vs. Index: Regional Weighting Differences
Europe,Middle East,and Africa67%
Pacific ex-Japan8%
Japan21%
Cash2%
Americas2%
Emerging Markets8%

As of March 31, 2004
International MSCI EAFE Over/Under-WeightingStock Fund Index vs. Index
Europe, Middle East, and Africa 66.6% 68.6% -2.0Austria 0.0 0.3 -0.3Belgium 0.5 1.0 -0.5France 13.6 9.2 4.4Germany 2.3 6.7 -4.4Greece 0.0 0.4 -0.4Ireland 0.0 0.7 -0.7Israel 0.2 0.0 0.2Italy 4.5 3.7 0.8Kazakhstan 0.2 0.0 0.2Luxembourg 0.0 0.0 0.0Netherlands 4.9 5.1 -0.2Portugal 0.0 0.4 -0.4Russia 1.1 0.0 1.1Scandinavia 5.4 5.4 0.0South Africa 0.0 0.0 0.0Spain 4.0 3.6 0.4Switzerland 6.7 7.1 -0.4Turkey 0.2 0.0 0.2United Kingdom 23.0 25.0 -2.0Asia 28.9 31.4 -2.5Australia 2.0 5.1 -3.1China 0.3 0.0 0.3Hong Kong 0.9 1.7 -0.8India 0.8 0.0 0.8Japan 20.6 23.6 -3.0Malaysia 0.2 0.0 0.2New Zealand 0.0 0.2 -0.2Singapore 0.9 0.8 0.1South Korea 2.3 0.0 2.3Taiwan 0.7 0.0 0.7Thailand 0.2 0.0 0.2Total Pacific ex-Japan 8.3 7.8 0.5Americas 2.4 0.0 2.4Brazil 0.6 0.0 0.6Mexico 1.6 0.0 1.6Canada 0.2 0.0 0.2Cash 2.1 0.0 2.1
100.0% 100.0% 0.0
3939
Geographical Diversification

40
Sector Diversification
International Stock Fund vs. MSCI EAFE IndexAs of March 31, 2004
-10 0 10 20 30
Financials
Utilities
Materials
Industrials andBusiness Services
Energy
ConsumerStaples
Health Care
TelecommunicationServices
InformationTechnology
ConsumerDiscretionary
MSCI EAFE IndexOver/Under Weighting
International Stock Fund
The securities mentioned in the above commentary represented 30.2% of the fund’s portfolio as of 3/31/04.
Telecom Services: Overweight wireless telecommunications such as KDDI, SK Telecom,and Vodafone; underweight in diversified telecommunications.
Energy: Underweight BP Amoco; overweight Total Fina Elf, Petrobras, and ENI.
Health Care: Overweight pharmaceuticals such as GlaxoSmithKline, Novo Nordisk, and Sanofi.
Consumer Discretionary: Overweight media such as WPP Group and TF1; overweightcatering such as Compass Group and Sodexho.
Consumer Staples: Overweight food manufacturer Nestle, and retailers 7-Eleven Japanand Wal-Mart de Mexico. No tobacco stocks.
Utilities: Underweight utilities, especially electric utilities.
Industrials and Business Services: Underweight machinery, road and rail, and construction andengineering; overweight commercial services and supplies, such as Adecco, Secom, andSecuritas. No airlines.
Materials: Underweight most industry groups, especially chemicals and construction materials.
Information Technology: Overweight semiconductor equipment and products such asSamsung Electronics, TSMC, and ASML.
Financials: Underweight insurance and banks. Overweight capital markets such as Nomura,UBS, and Credit Suisse.

41
Ten Largest Holdings
Market% of Capitalization
Portfolio (Millions) Case for Inclusion
GlaxoSmithKline (U.K.) 3.0% $116,983 GlaxoSmithKline is a U.K.-based pharmaceutical company principally involved in the research anddevelopment,manufacturing, and marketing of pharmaceutical and consumer health-related products. Patentexpiry issues and the lack of a short-term pipeline have weighed on the stock for some time, but the company’searly-stage products should sustain long-term growth. In addition, the company boasts strong management andmarketing and offers growth at an attractive relative valuation.
Royal Bank of Scotland (U.K.) 2.6 90,089 Royal Bank of Scotland (RBS) is one of Europe’s leading financial services groups. RBS is reaping the benefits ofrestructuring and cost cutting after its acquisition of NatWest. Integration of the businesses is ahead ofschedule, and cost savings are better than expected. The company’s enduring strengths include its diverse, multi-channel, multi-brand strategy, a wide range of strategic options for future development, and good cash flow.
Vodafone (U.K.) 2.5 161,614 Vodafone Group is the world’s largest wireless service provider, with interests in mobile networks throughoutEurope, the U.S., and the Far East. We believe it has superior earnings growth and remains undervalued evenafter the recent price performance. It is better positioned than other telecoms to expand margins through costsaving measures and to fund innovative product development.
Total (France) 2.5 119,010 Total is an integrated oil and gas company with operations in more than 120 countries. Worldwide operationsare conducted through three segments: upstream (exploration, development, and production activities),downstream (crude oil and petroleum product sales) and chemicals (petrochemicals and plastics). It has a steadyrecord of reinvestment, boasts access to regions that the other majors do not, and maintains a connection toWest Africa and its potential growth opportunities. The upstream business is the focus of reinvestment, and wecontinue to hold a large position because of its growth potential relative to its peers.
Nestle (Switzerland) 2.0 102,850 Nestle is the world’s largest food manufacturer, with products available in nearly every country. Nestle’srestructuring efforts remain on track following its exit from non-core businesses. Over the last year, Nestle hasbeen negatively impacted by a number of factors, including currency changes. However, we expect that costcutting will continue to help improve the company's margins and that revenue performance in a number ofmarkets will improve. In addition, Nestle trades at a discount to its peers.
Shell T&T/Royal Dutch (U.K.) 1.7 162,240 The Shell T&T/Royal Dutch group is the world’s third largest oil company. The group has been refocusing itsupstream exploration and development strategies. We believe that the group will also continue to benefit fromcost reductions in its refining and manufacturing activities, as well as from synergies following itsrecent acquisitions.
UBS (Switzerland) 1.7 87,643 One of the largest investment managers in the world, UBS provides financial services such as mutual funds,asset management, corporate finance, and estate planning. UBS Investment Bank provides securitiesunderwriting, mergers acquisitions advice, fixed-income products, and foreign exchange. The company alsoprovides traditional banking services in its home country of Switzerland. We believe the company will benefitfrom stronger financial markets and increasing merger and acquisition activity.
BNP Paribas (France) 1.6 55,211 Based in France, BNP Paribas is a global bank with activities in 85 countries. The bank has been reallocatingassets to more profitable areas, including domestic retail operations. BNP maintains a strong retail franchisewithin France, and we see growth opportunities in the company's U.S. operations. We believe the company’svaluation is too heavily discounted given its strong management and the promise of a European recovery.
Compass (U.K.) 1.5 14,371 Compass Group is the world’s largest foodservice company. Since its inception, the company has remainedfocused on its core business through strategic acquisitions and the disposal of non-core businesses. Compassremains well positioned due to its premium revenue growth relative to peers, high business retention rate, andcontinued profit margin expansion.
Adecco (Switzerland) 1.5 10,293 Adecco is the global leader of temporary and permanent staffing services and operates over 5,800 officesglobally. The company maintains the number one or two position in 12 of the world’s 13 largest staffingmarkets. We expect that demand for staffing services should increase due to continued improvement in theglobal economic environment, as well as a result of deregulation in a number of countries. On-going cost cuttingmeasures, especially in its U.S. operations, should also help increase the company's profit margins.
Total 20.6%
International Stock FundAs of March 31, 2004

42
Portfolio Characteristics
As of March 31, 2004
International MSCI EAFEStock Fund Index
Number of Holdings 182 1,004
Number of Markets 29 21
Investment Weighted Median Market Capitalization (Billions) $30.0 $26.1
Price/Earnings Ratio (Forward 12 Months)1 16.1X 15.9X
Earnings Growth (Forward 12 Months)1 11.5% 11.1%
Price/Book Ratio (Last 12 Months) 2.5X 2.2X
Return on Equity (Forward 12 Months) 15.6% 13.9%
Turnover 2003 25.1% N/A
Turnover2 30.9% N/A
1 Forward 12 months fiscal year-end earnings estimates.2 Year-to-date annualized as of 3/31/04.

Risk/Return CharacteristicsFive Years Ending March 31, 2004
Five Years
International MSCI EAFEStock Fund Index
Annualized Total Return 0.01% 0.83%
Annualized Standard Deviation 18.41% 16.26%
Historical Tracking Error 4.36% 0.00%
Beta 1.10 1.00
R-Squared 0.95 1.00
Alpha -0.33% 0.00%
Sharpe Ratio -0.18 -0.15
Information Ratio -0.10 0.00
Five Years
International MSCI EAFE Stock Fund Growth Index
Annualized Total Return 0.01% -2.69%
Annualized Standard Deviation 18.41% 17.15%
Historical Tracking Error 4.41% 0.00%
Beta 1.04 1.00
R-Squared 0.95 1.00
Alpha 3.19% 0.00%
Sharpe Ratio -0.18 -0.35
Information Ratio 0.69 0.00
Statistics based on monthly gross returns.
Funds that invest overseas generally carry more risk than funds that invest strictly in U.S.assets. The fund’s share price will fluctuate with changes in market, political, economic,and foreign currency exchange conditions.
4343
Total Return Performance

44
Total Return Performance
Risk/Return CharacteristicsFive Years Ending March 31, 2004
10 15 20 25-10
-5
0
5
10
�
�MSCI EAFE Index
International Stock Fund
MSCI EAFE Growth Index
Historical Return(% per Year)
Standard Deviation (% per Year)
Statistics based on monthly gross returns.

Trade-Weighted Value of the U.S. Dollar vs. Major CurrenciesJanuary 1, 1980 through March 31, 2004
60
90
120
150
3/043/023/003/983/963/943/923/903/883/863/843/823/80
Percent March 1972 = 100
Source: Federal Reserve Board, Haver Analytics.
T. Rowe Price International OutlookWe believe:• Dollar stability quite possible in the short term, but renewed weakness likely later in 2004.
The euro to be less favored in 2004 compared with 2003, but the yen likely to be the
strongest of the major currencies. Asian currencies to track the strong yen.
4545
Currency Outlook

46
Currency Overview
Not currently hedged
T. Rowe Price International analysis seeks to:• Identify long-term trends
• Watch for medium-term trends around the long-term move
Currency views incorporated into:• Country weightings
• Industry exposure
• Stock selection
Modest hedging occasionally used to:• Provide limited protection against a medium-term uptrend in the dollar
• Neutralize currency underweightings relative to the benchmark

47
Europe• Broad economy is following U.S. with customary time lag and with less fiscal and
monetary impetus
• Peripheral economies to continue to outperform core
• Interest rates will move higher in the U.K., but remain stable in the euro zone for some time
Japan• Economy now expanding rapidly led by growth in external demand but with increasing
signs that the domestic consumer is regaining confidence
• Corporate profits advancing strongly as a result of top-line improvement and restructuring
• Increasing confidence that this time the recovery is for real with the banking sector now on
the mend
Asia• Growth to remain robust throughout Asia with a sharp recovery expected for the SARS-
affected economies in 2004
• Intraregional growth to become more important than the direct impact of the path of the
U.S. economy
• Growth in China will moderate, as it needs to, but China will remain a positive influence on
the rest of the region
Latin America• Recovery in Mexico to gradually gain in strength
• Brazil to see sharp recovery in growth, though mostly in the second half of 2004. Concerns
growing as to whether Lula can stay the course, but we think he will stick to orthodox
policies despite pressure from within his own party
As of March 31, 2004
Global Economic Outlook

ExhibitsFee Schedule
Performance Statistics Glossary
Portfolio Specialists
Biographical Backgrounds
48

49
Fee Schedule
International Stock Fund1
Fiscal 2003
1 International Stock Fund expense ratio includes the Fund’s management fee and operating expenses including custody andshareholder servicing costs.
2 Compares to 1.91% average expense ratio of international funds in Morningstar universe as of 3/31/04.
Shareholder Transaction Expenses—
Sales Load “Charge” on Purchases None
Sales Load “Charge” on Reinvested Dividends None
Redemption Fees None
Exchange Fees None
Annual Fund Expenses—
Ratio of Total Expenses to Average Net Assets 0.92%
Distribution Fees (12b-1) None
Total Fund Expenses 0.92%2

50
Performance Statistics Glossary
Alpha – A measure of a strategy’s risk-adjusted performance. Alpha represents the differencebetween a strategy’s actual returns and its expected performance, given its level of risk asmeasured by beta. The difference is expressed as an annualized percentage.
Beta – A measure of the market risk of a strategy showing how responsive the strategy is to agiven market index, such as the S&P 500 Index (an index for equity strategies) or the LehmanBrothers Government/Corporate Bond Index (an index for fixed income strategies). Bydefinition, the beta of the benchmark index is 1.00. A strategy with a 1.10 beta is expected toperform 10% better than the index in up markets and 10% worse in down markets. Usually,higher betas represent riskier investments.
Information Ratio – A measure of the significance or quality of alpha. It is defined as the ratioof alpha to the standard deviation of alpha. A larger number is better – either a very strongalpha score or a consistent alpha with low standard deviation.
R-Squared – Measures the percentage of a strategy’s movement that is explained bymovements in the benchmark index. R-Squared helps indicate the accuracy of a strategy’salpha and beta.
Sharpe Ratio – A risk-adjusted measure, which is calculated using standard deviation andexcess return to determine reward per unit of risk. The higher the sharpe ratio, the better thestrategy’s historical risk-adjusted performance.
Standard Deviation – Indicates the volatility of a strategy’s total returns as measured againstits mean performance. Unlike alpha, beta, and R-Squared, which are compared with abenchmark index, standard deviation is strategy specific. In general, the higher the standarddeviation, the greater the volatility or risk.
Historical Tracking Error – Standard deviation of the strategy’s excess return over the market benchmark.

51
Portfolio Specialists
U.S. EquitiesPeter Young, CFA
Phone: 410-345-2839
E-mail: [email protected]
U.S. EquitiesRon Taylor
Phone: 410-345-3433
E-mail: [email protected]
Global/U.S. Fixed IncomeAran Gordon
Phone: 410-345-6767
E-mail: [email protected]
Non-U.S. Equities, Emerging MarketsTodd Henry, CFA
Phone: 410-345-5718
E-mail: [email protected]
Non-U.S. EquitiesKurt Umbarger, CFA
Phone: 410-345-4259
E-mail: [email protected]
Portfolio Specialists work closely with portfolio managers andanalysts and can provide detailed commentary on the investmentstrategies they follow.

52
Kurt A. Umbarger, CFA Kurt Umbarger is a Vice President of T. Rowe Price International. He is a Portfolio Specialist in
the Institutional Sales and Client Service division of T. Rowe Price International. Prior to his
current position, Kurt was a Marketing Client Service Representative in the T. Rowe Price
International Group. Kurt has been with the firm since 1992. Kurt earned a B.S. in Finance
from Towson University and an M.S.F. in Finance from Loyola College. He has also earned the
Chartered Financial Analyst accreditation and holds a Series 6, 7, 63, and 65 with the NASD.
R. Ryan WagnerRyan Wagner joined T. Rowe Price in 1997 and currently serves as a Relationship Manager
within Retirement Plan Services, Inc. In this role, he focuses on serving institutional
Investment-Only clients within the public and private sectors of the defined contribution
marketplace. Ryan earned a B.A. (Economics) and an M.B.A (Finance) from the University of
Maryland. He has achieved the Series 6 & 63 NASD accreditations and is currently a Level III
candidate in the Chartered Financial Analyst (CFA) Program.
Biographical Backgrounds