Introductions Search Engine Development COMP 475 Spring 2009 Dr. Frank McCown.
Upload
bertina-oliverCategory
view
213download
0
Presentation To House Human Services Committee
March 10, 2009
Jane Burstain, Ph.D., Senior Policy Analyst F. Scott McCown, Executive Director
Unless otherwise noted, all data in this presentation is from DFPS databooks

Overview Of Presentation
• What have you gotten for your money?
• What challenges remain?
• What opportunities exist?

Investigations Have Improved
Percentage Of Completed Investigations Designated "Unable To Complete"
22.71%
19.67%
21.87%
17.45%
14.39%
0%
5%
10%
15%
20%
25%
2004 2005 2006 2007 2008
Fiscal Year
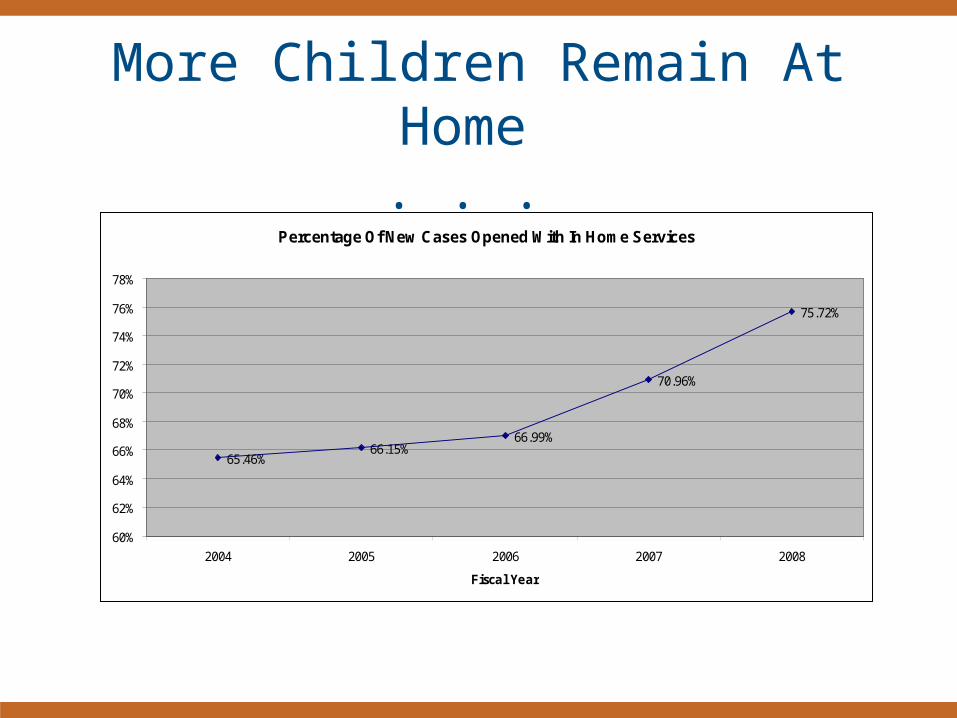
More Children Remain At Home . . .
Percentage Of New Cases Opened With In Home Services
65.46%66.15%
66.99%
70.96%
75.72%
60%
62%
64%
66%
68%
70%
72%
74%
76%
78%
2004 2005 2006 2007 2008
Fiscal Year

. . . Safely
Number Of Removals From In-Home Cases
3928
50165331
29312698
0
1000
2000
3000
4000
5000
6000
2004 2005 2006 2007 2008
Fis
cal
Yea
r
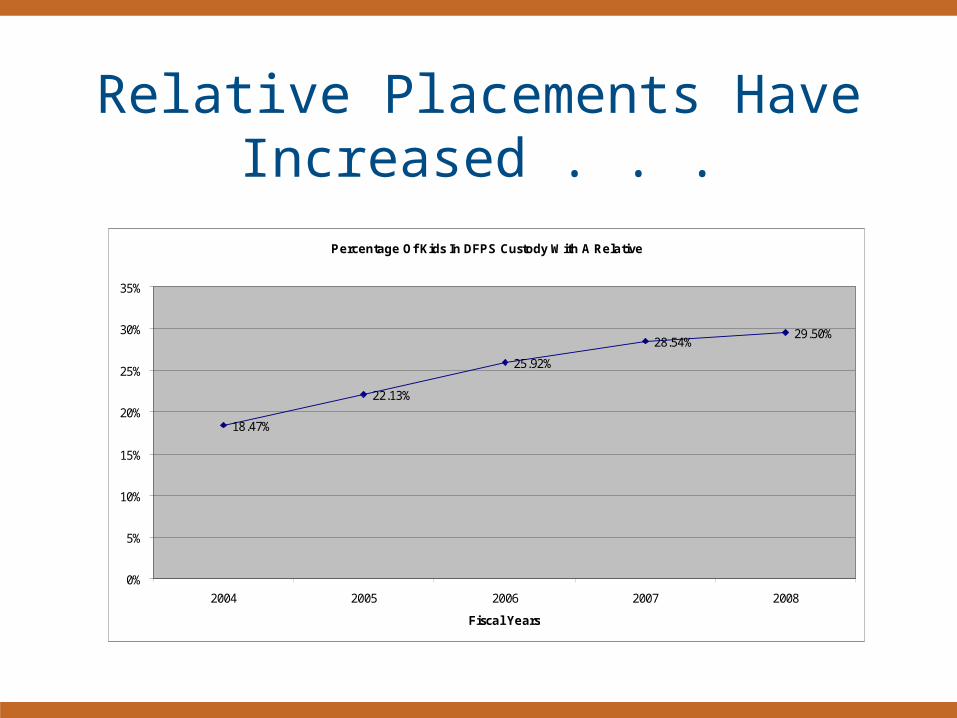
Relative Placements Have Increased . . .
Percentage Of Kids In DFPS Custody With A Relative
18.47%
22.13%
25.92%
28.54%29.50%
0%
5%
10%
15%
20%
25%
30%
35%
2004 2005 2006 2007 2008
Fiscal Years
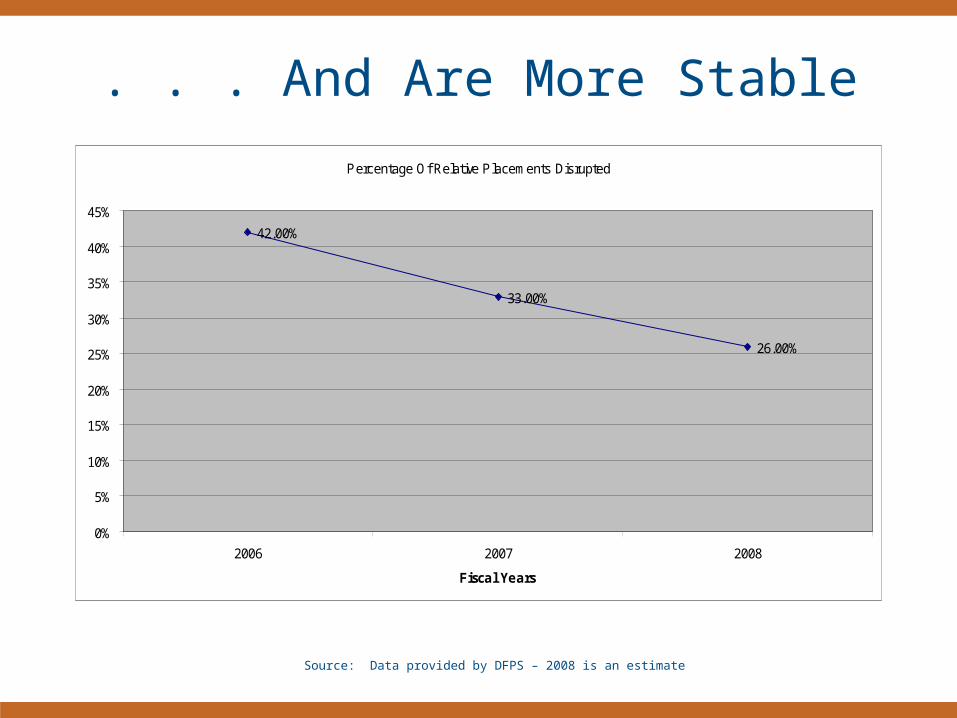
. . . And Are More Stable
Percentage Of Relative Placements Disrupted
42.00%
33.00%
26.00%
0%
5%
10%
15%
20%
25%
30%
35%
40%
45%
2006 2007 2008
Fiscal Years
Source: Data provided by DFPS – 2008 is an estimate

Foster Care Has Decreased
Percentage Of Kids In DFPS Custody In Foster Care
68.63%
64.57%
62.18%
58.69%57.94%
52%
54%
56%
58%
60%
62%
64%
66%
68%
70%
2004 2005 2006 2007 2008
Fiscal Year
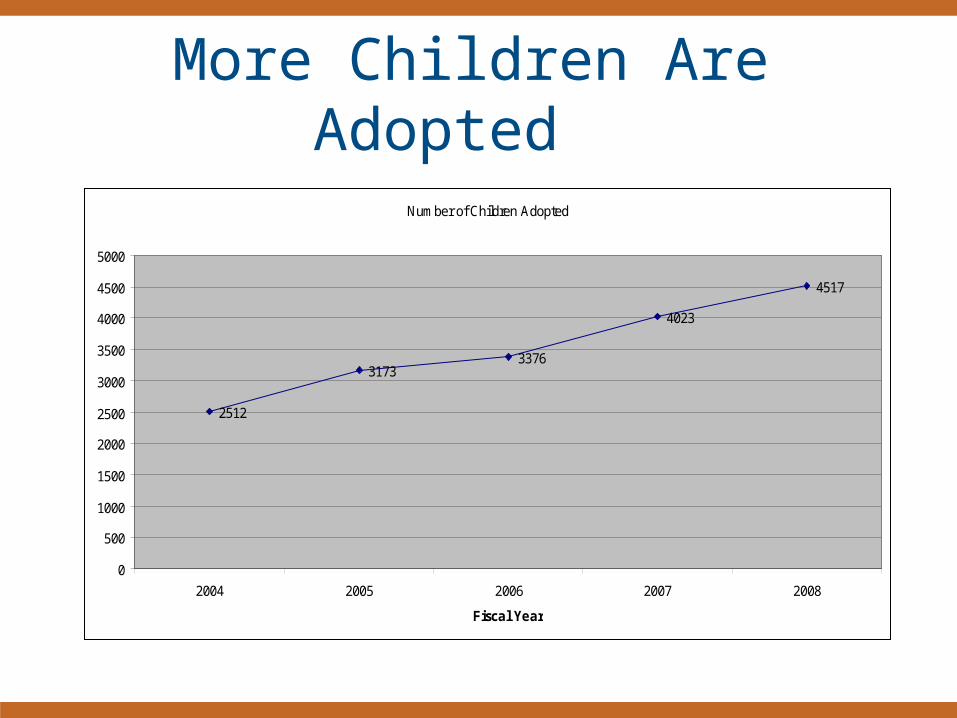
More Children Are Adopted
Number of Children Adopted
2512
31733376
4023
4517
0
500
1000
1500
2000
2500
3000
3500
4000
4500
5000
2004 2005 2006 2007 2008
Fiscal Year

Caseworker Attitudes Have Improved
• Surveys of caseworkers indicate that they are more satisfied with their job, their workloads and available resources in 2008 compared to 2005
• DFPS scores on the Survey of Excellence improved in every dimension in 2008 compared to 2006
Annual reports of caseworker surveys authored by Dr. Maria Scannapieco and Dr. Kelli Connell-Carrick

But Challenges Remain –Service System For Families Stretched
Monthly Average Number of Families Receiving In Home Services
7886
10242
11384
12408 12759
0
2000
4000
6000
8000
10000
12000
14000
2004 2005 2006 2007 2008
Fiscal Year

But Challenges Remain –Service System For Families Stretched
• FBSS caseloads have not declined
• FBSS voluntary turnover increasing
• Not able to meet federal standards for visiting children or parents

But Challenges Remain –Children In PMC Without TPR
Improving But Still HighProportion Of Children In PMC Without Full TPR
36.71%35.58% 35.14%
32.63%30.56%
0%
5%
10%
15%
20%
25%
30%
35%
40%
2004 2005 2006 2007 2008
Fiscal year

But Challenges Remain –Young Children In PMC Without TPR
Children In PMC Without Full TPR In Jan 2009
172
401
607
840
2197
0
500
1000
1500
2000
2500
0-2 3-5 6-9 10-13 14-17
Age Groups
Source: DFPS data

But Challenges Remain – More Children Aging Out
Number of Emancipating Youth
950
10841189
1366 14111468
600
800
1000
1200
1400
1600
2003 2004 2005 2006 2007 2008
Fiscal Year
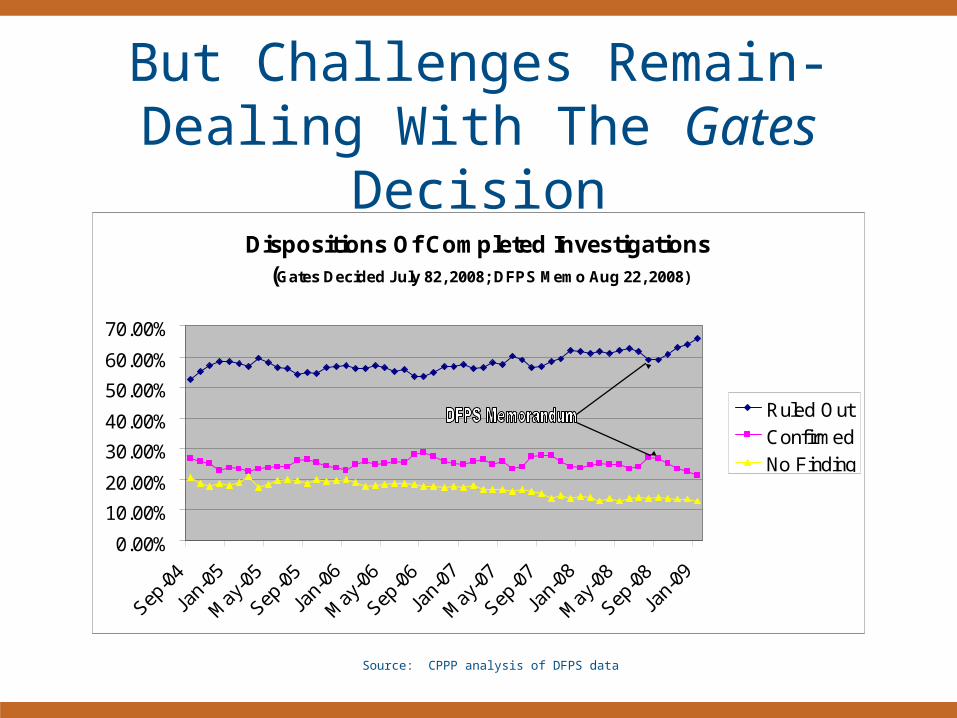
But Challenges Remain- Dealing With The Gates Decision
Dispositions Of Completed Investigations(Gates Decided July 82, 2008; DFPS Memo Aug 22, 2008)
0.00%
10.00%
20.00%
30.00%
40.00%
50.00%
60.00%
70.00%
Sep-0
4
Jan-
05
May
-05
Sep-0
5
Jan-
06
May
-06
Sep-0
6
Jan-
07
May
-07
Sep-0
7
Jan-
08
May
-08
Sep-0
8
Jan-
09
Ruled Out
Confirmed
No Finding
Source: CPPP analysis of DFPS data

But Challenges Remain- Dealing With The Gates Decision
Percentage Of Cases Opened For Services That Involved Removals(July 28, 2008 Gates Decided; August 22, 2008 DFPS Memo Re: Gates)
0%
5%
10%
15%
20%
25%
30%
35%
40%
45%
Sep-0
4
Nov-04
Jan-
05
Mar
-05
May
-05
Jul-0
5
Sep-0
5
Nov-05
Jan-
06
Mar
-06
May
-06
Jul-0
6
Sep-0
6
Nov-06
Jan-
07
Mar
-07
May
-07
Jul-0
7
Sep-0
7
Nov-07
Jan-
08
Mar
-08
May
-08
Jul-0
8
Sep-0
8
Nov-08
Jan-
09
Source: CPPP analysis of DFPS data

But Challenges Remain – Turnover Better But Still High
Overall Turnover
2% 3% 5% 4% 4%
4% 5%
11%7% 5%
21%
31%
30%
33%
29%
0%
5%
10%
15%
20%
25%
30%
35%
40%
45%
50%
2004 2005 2006 2007 2008
Fiscal Years
Tu
rno
ver
Rat
e Left
Promotion
Fired
Death/Retire
Source: Data provided by DFPS – 2008 is an estimate

But Challenges Remain – Other
• Financial support for relative caregivers
• Foster care rate increases

Opportunities • Legislative
– Continue to look for permanent alternatives for children in PMC without TPR – HB 884 (Naishtat)
– Ease transition for children who age out – HB 704 and 705 (Rose)– Job opportunities at state agencies for children who age out – HB
1043 (Orr)• Information
– Study how children end up in PMC without TPR– Study impact of Gates – Collect data to support an informed implementation of a relative
PMC subsidy• Financial
– $53 million in freed general revenue from CPS federal stimulus funds
– Fostering Connections To Success And Increasing Adoptions Act• Provisions to help children who age out

Resources
• CPPP written testimony on CPS budget: http://cppp.org/files/4/20102011CPSbudget.pdf
• CPPP policy page on Fostering Connections Act: http://cppp.org/files/4/newfostercare.pdf
• CPPP policy page on CPS workforce issues: http://cppp.org/files/4/364%20DFPS%20workforce.pdf
• CPPP policy page on CPS funding: http://cppp.org/files/4/Jan%2009%20update.pdf

Use of This Presentation
The Center for Public Policy Priorities encourages you to reproduce and distribute these slides, which were developed for use in making public presentations.
If you reproduce these slides, please give appropriate credit to CPPP.
The data presented here may become outdated.
For the most recent information or to sign up for our free E-Mail Updates, visit www.cppp.org.
© CPPP
Center for Public Policy Priorities900 Lydia StreetAustin, TX 78702
P 512/320-0222 F 512/320-0227